examining the relationship between moss communities and ... · examining the relationship between...
TRANSCRIPT

Examining the Relationship between Moss Communities and the
Cartographic Depth-to-Water Index
Prepared by: Monique Goguen
November 2013
1
Plume moss (Ptilium crista-castrensis)
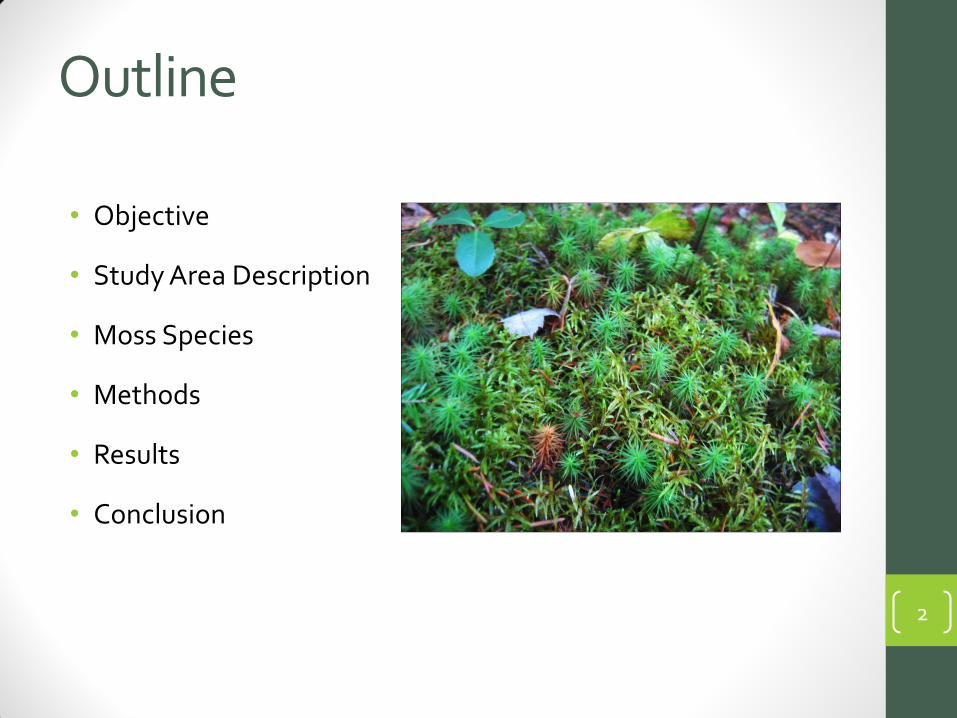
Outline
• Objective
• Study Area Description
• Moss Species
• Methods
• Results
• Conclusion
2

Objective • The main objective of this project is to examine the
relationship between moss communities and LiDAR-derived cartographic depth-to-water (DTW) index.
• Study aims to determine whether the DTW mapping process could be useful as a tool for predicting the spatial distribution of moss species on a landscape level.
3

Study Area • Regent Bog, a wetland
complex in Fredericton, New Brunswick.
4
• Study area approx. 20 hectares in size.

Bryophyte Ecology • Bryophytes are small non-vascular plants.
• Geospatial distribution influenced by microclimate and suitable substrate, including soil moisture regime.
5
Sphagnum moss (Sphagnum sp.)
Schreber’s moss (Pleurozium schreberi)
Haircap moss (Polytrichum commune)
Wavy Dicranum (Dicranum polysetum)
Plume moss (Ptilium crista-castrensis)
Step moss (Hylocomium splendens)
Bazzania (Bazzania trilobata)
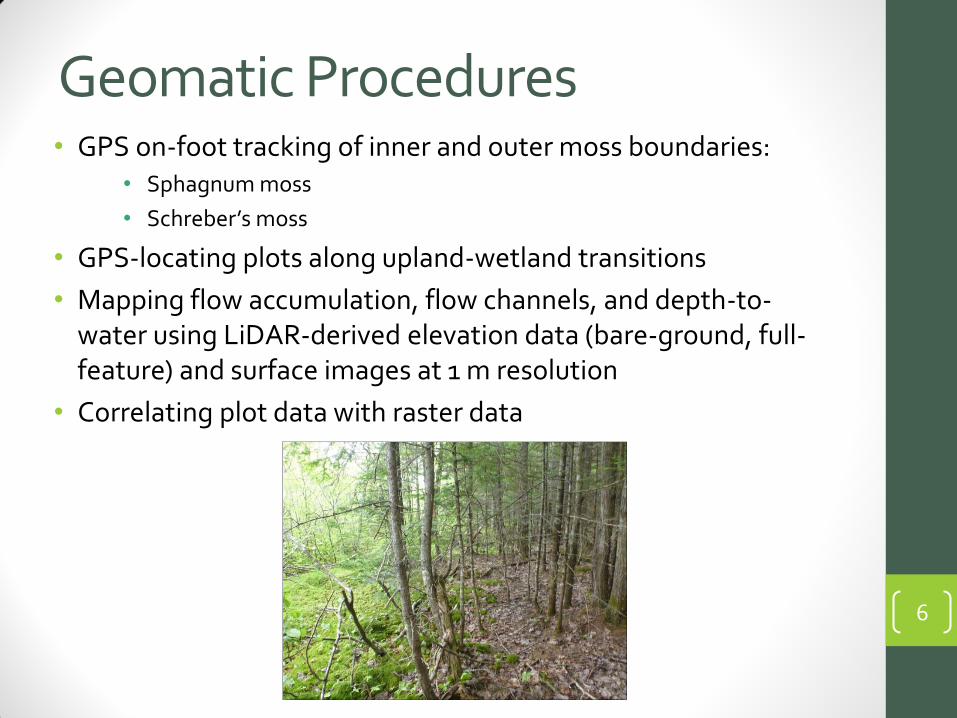
Geomatic Procedures • GPS on-foot tracking of inner and outer moss boundaries:
• Sphagnum moss
• Schreber’s moss
• GPS-locating plots along upland-wetland transitions
• Mapping flow accumulation, flow channels, and depth-to-water using LiDAR-derived elevation data (bare-ground, full-feature) and surface images at 1 m resolution
• Correlating plot data with raster data
6
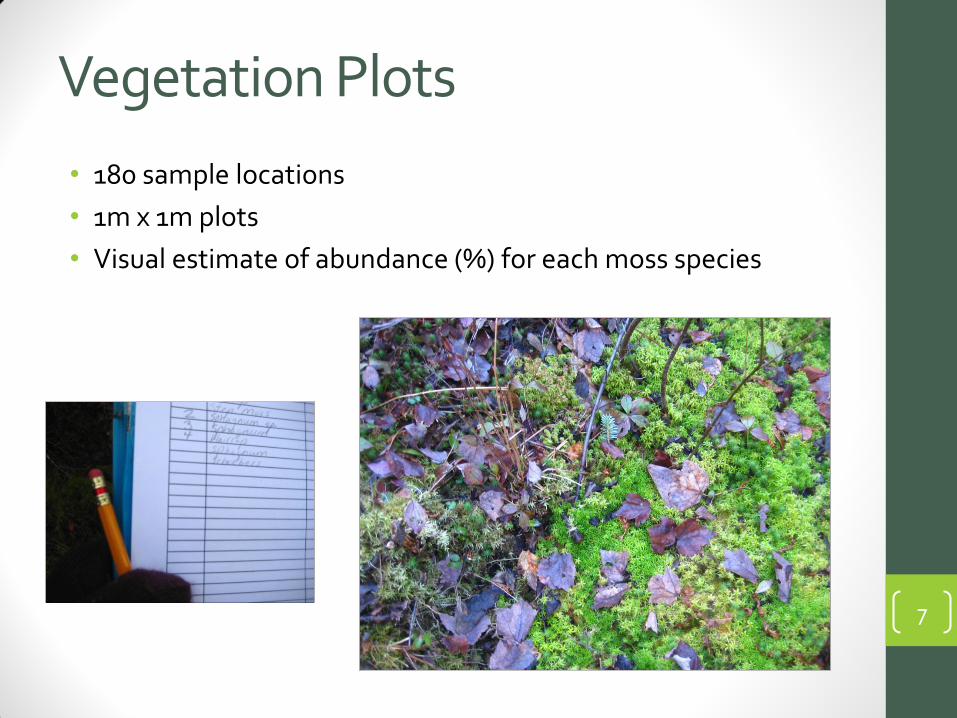
Vegetation Plots
• 180 sample locations
• 1m x 1m plots
• Visual estimate of abundance (%) for each moss species
7

GPS Plot Locations on GeoNB Imagery
8

Wet Areas Mapping • Data derived from the bare ground digital elevation model of
digitally processed LiDAR data at 1 metre resolution:
• Predicted Stream Channel Lines (D8 Algorithm for flow accumulation – 0.5 to 4 hectare flow initiation threshold)
• Channels may not be wet during every season, but they are predicted to have a high potential for being wet during a heavy rain event or wet season.
• Cartographic Depth-to-Water
• Informs about the depth to water index (elevation rise) between the bare ground surface and the cartographically referenced water table surface below.
9
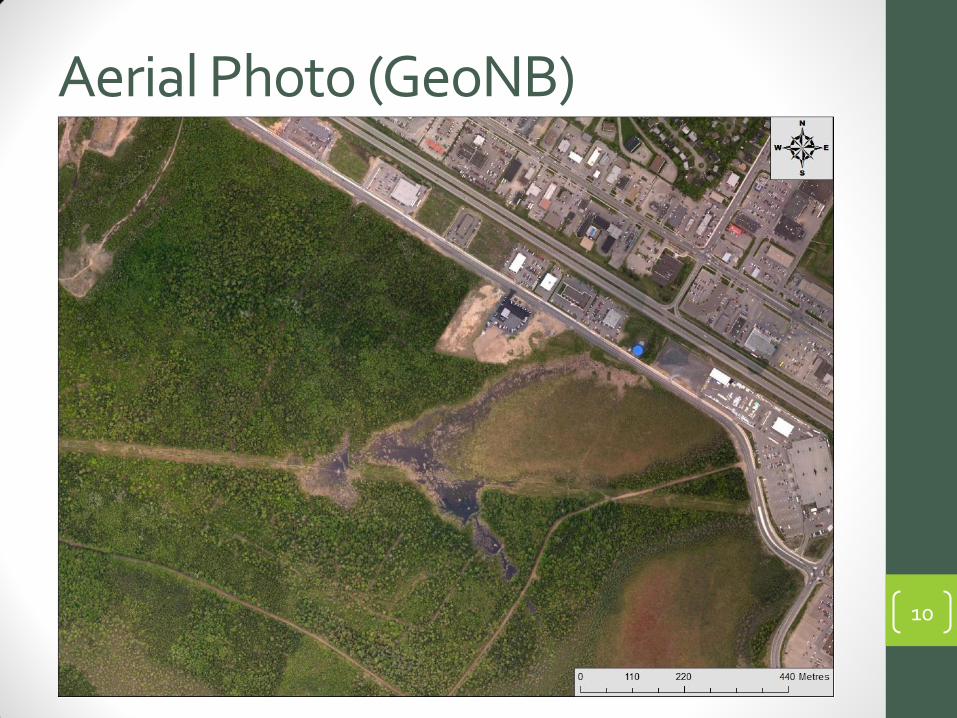
Aerial Photo (GeoNB)
10

Bare Earth LiDAR (Hillshade)
11
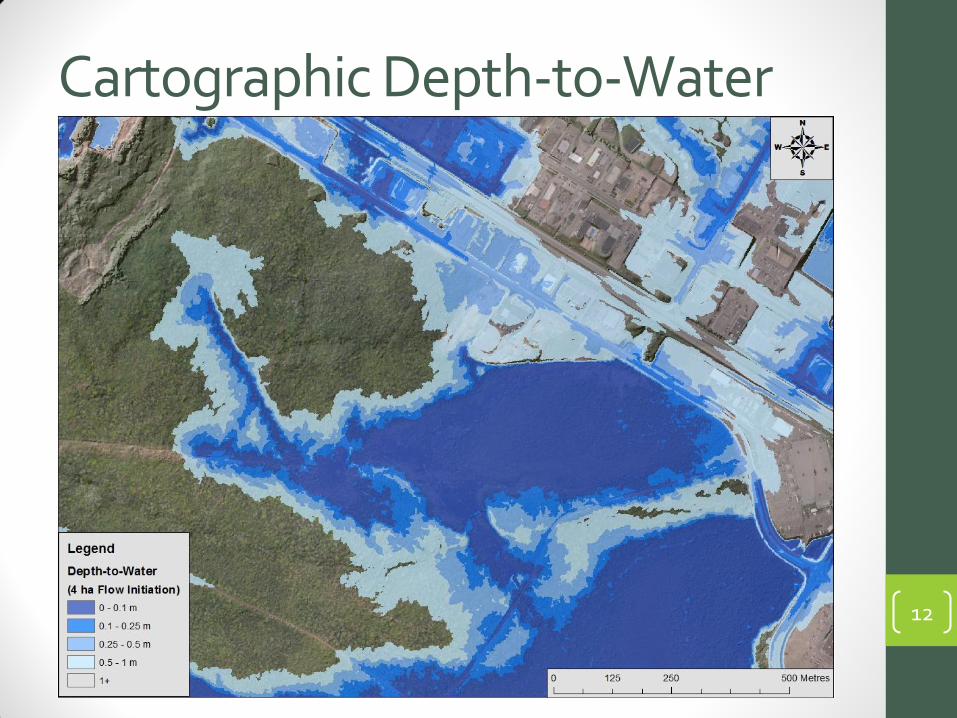
Cartographic Depth-to-Water
12
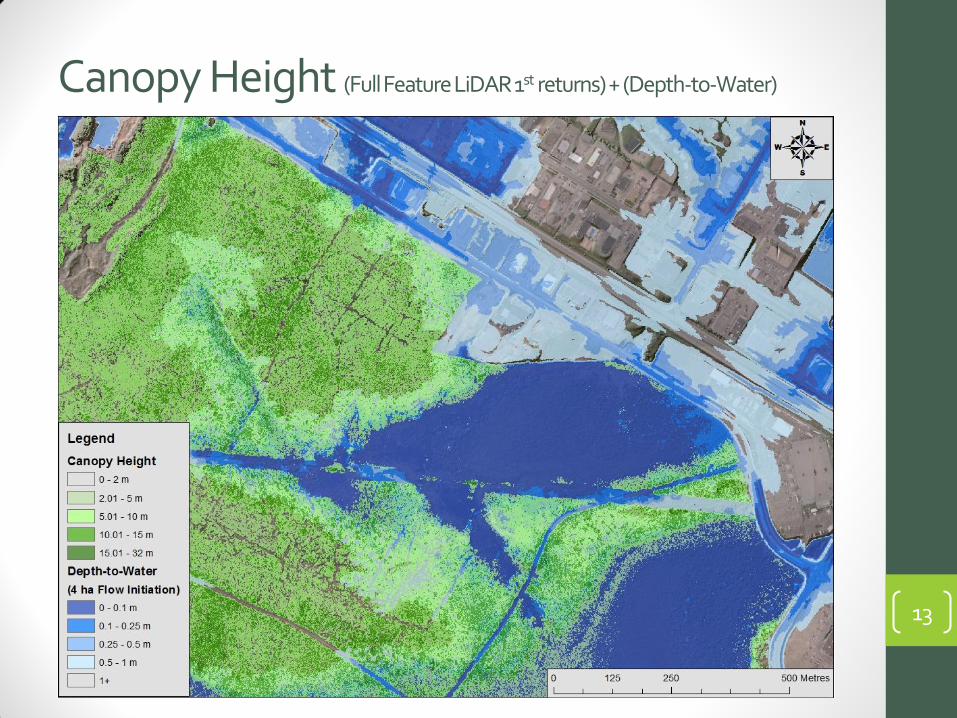
Canopy Height (Full Feature LiDAR 1st returns) + (Depth-to-Water)
13

Stream Flow-Initiation Area
14
4 ha
1 ha
2 ha
0.5 ha

GPS Tracked Moss Boundaries
15

DTW Map with GPS Lines
16

DTW Map with GPS Lines
17

DTW Map with GPS Lines
18

DTW Map with GPS Lines
19
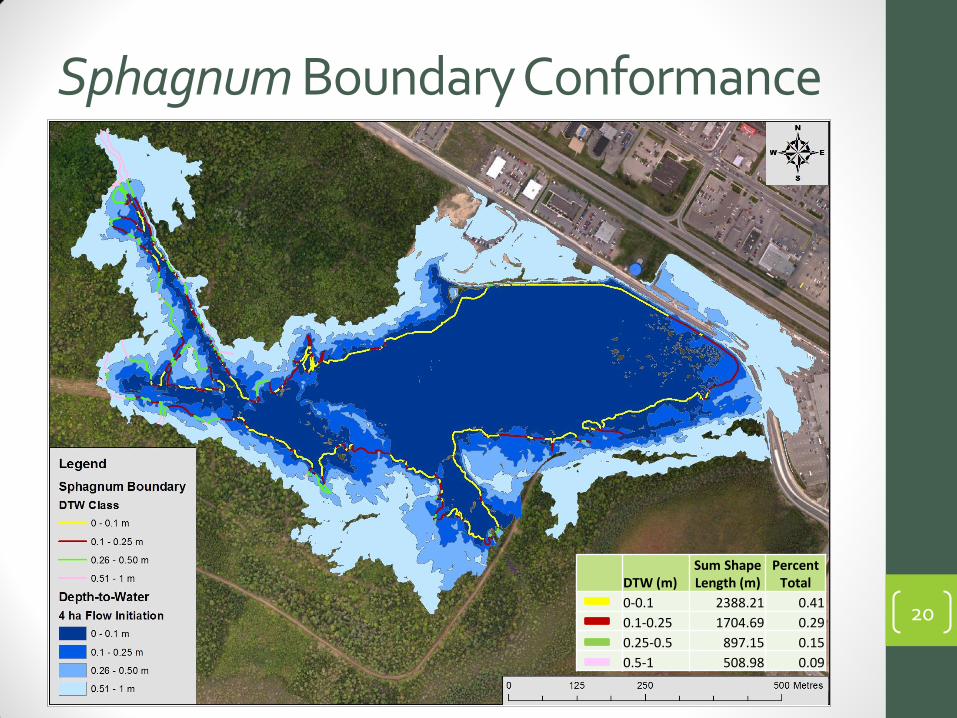
Sphagnum Boundary Conformance
20
DTW (m) Sum Shape Length (m)
Percent Total
0-0.1 2388.21 0.41
0.1-0.25 1704.69 0.29
0.25-0.5 897.15 0.15
0.5-1 508.98 0.09

Relative Abundance of Sphagnum
21

Abundance vs. DTW: Sphagnum
22
R² = 0.9586
R² = 0.9807
R² = 0.9294
R² = 0.9521
0
10
20
30
40
-1.5 -1.0 -0.5 0.0 0.5 1.0
Avg
. Ab
un
dan
ce (%
)
log10 of DTW
0.5 ha
1 ha
2 ha
4 ha
Dry Wet
Stream Flow-Initiation Area
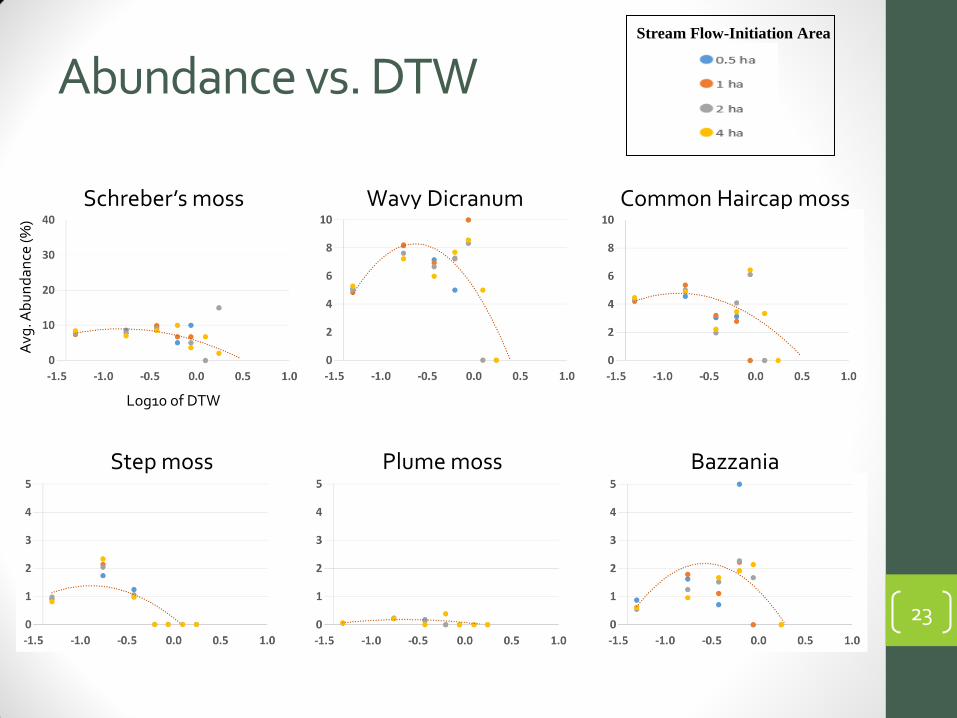
Abundance vs. DTW
23
Schreber’s moss Wavy Dicranum
Stream Flow-Initiation Area
0.5 ha
1 ha
2 ha
4 ha
Bazzania Plume moss Step moss
Common Haircap moss
Log10 of DTW
Avg
. Ab
un
dan
ce (%
)
Summary
• DTW mapping useful as a tool for predicting the spatial distribution of moss species in a wetland ecosystem.
• The GPS tracked moss boundaries aligned well with the DTW map (the 4 ha flow initiation worked best).
24
• However, these borders straddle DTW classes depending on actual soil moisture conditions.
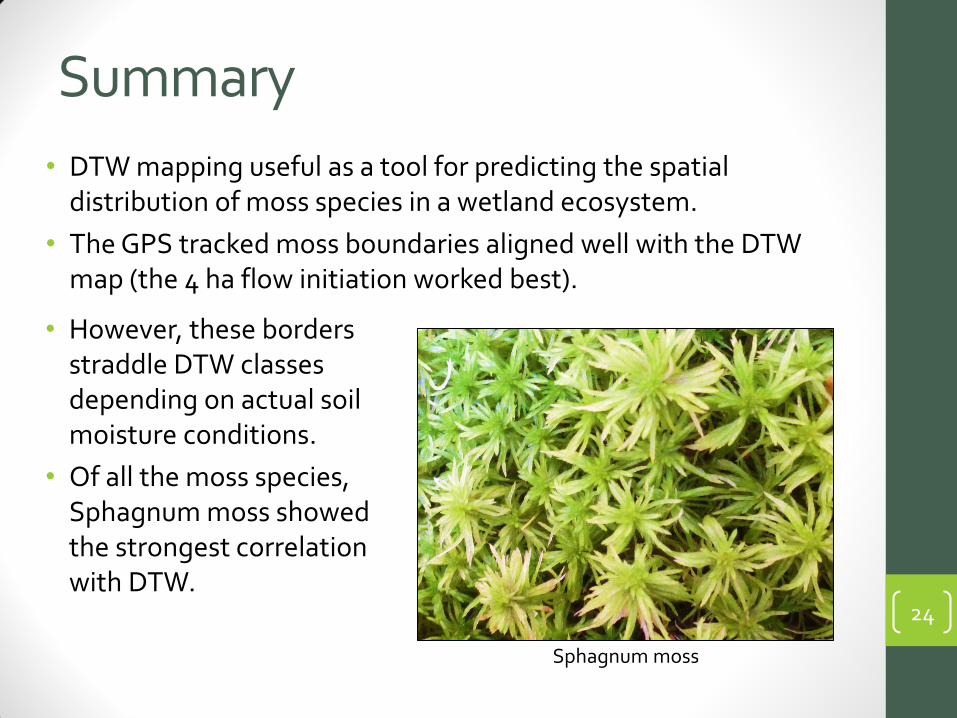
• Of all the moss species, Sphagnum moss showed the strongest correlation with DTW.
Sphagnum moss

Acknowledgements
• Dr. Paul A. Arp, University of New Brunswick
• Jae Ogilvie, University of New Brunswick
25

26
Questions or Comments?