examine security measures protecting
TRANSCRIPT
An examination of security measures for
the protection of petrol stations:
An analysis of case studies in Gauteng
By
Olaotse John Kole
Submitted in fulfilment of the requirements
for the
MAGISTER TECHNOLOGIAE
Security Management
UNIVERSITY OF SOUTH AFRICA
Supervisor: Prof. A. deV. Minnaar
March 2010
i
COPYRIGHT
© Copyright resides in the University of South Africa and Mr OJ Kole. In terms of the
Copyright Act 98 of 1978, no part of this material may be reproduced, stored in any retrieval
system, be transmitted in any form or be published, redistributed or screened by any means
(electronic, mechanical, photocopying, recording or otherwise) without prior written
permission from the University of South Africa and R Moodley. However, permission to use
in these ways any material in this work that is derived from other sources must be obtained
from the original source.
© UNISA 2009
ii
DECLARATION FORM
Student number: 36907863
I, OLAOTSE JOHN KOLE,
declare that this dissertation:
AN EXAMINATION OF SECURITY MEASURES FOR THE PROTECTION OF
PETROL STATIONS: AN ANALYSIS OF CASE STUDIES FROM GAUTENG,
is my own work and that all the sources that I have quoted have been indicated and
acknowledged by means of complete references.
___________________________ ___________________
SIGNATURE DATE
(OJ KOLE)
iii
TABLE OF CONTENTS
COPYRIGHT…………………………………………………………………….………… i
DECLARATION BY STUDENT..……………………………….……………………….. ii
ACKNOWLEDGEMENTS…………………………………………………………........... xvi
EXECUTIVE SUMMARY………………………………………………........................... xvii
CHAPTER 1: MOTIVATION FOR THE RESEARCH AND THE RES EARCH
METHODOLOGY
1.1 INTRODUCTION……………………………………………………………......... 1
1.2 PROBLEM STATEMENT………………………………………………………… 1
1.2.1 The crime facing petrol stations……………………………………………. 2
1.2.2 Vulnerable assets at petrol stations ………………………………………... 2
1.3 PURPOSE OF THE RESEARCH ………………………………………………… 3
1.4 RESEARCH QUESTIONS ………………………………………………………... 4
1.5 VALUE OF THE RESEARCH …………………………………………………… 4
1.6 INDUSTRY SPECIFIC TERMINOLOGY AND DEFINITIONS………………... 5
1.7 RESEARCH METHODOLOGY…………………………………………………... 6
1.7.1 Research design…………………………………………………………….. 6
1.7.2 Problems encountered during the research……………………………......... 7
Negative attitude towards completing the questionnaires………………………….. 7
Geographic difficulties ………….………………………………………………….9
Uncompleted questionnaires…………….…………………………………………. 9
1.7.2 Data collection methods and fieldwork practice …………………………... 9
1.7.3 Coding of information..…………………………………………………….. 11
1.7.4 Validity of research design: External validity……………………………… 11
1.8 CONCLUSION …………………………………………………………………… 11
CHAPTER 2: LITERATURE REVIEW
2.1 INTRODUCTION ………………………………………………………………… 13
2.1.1 Petrol stations in South Africa and other parts of the world……………….. 13
2.2 THE ROGERS SECURITY RISK MANAGEMENT MODEL…………………... 14
Step 1: Factors causing crime ……………………………………………………... 15
Step 2: Security policy and mandate ………………………………………………. 16
Step 3: Orientation phase ………………………………………………………….. 16
Step 4: Risk analysis exercise ……………………………………………………... 17
iv
Step 5: Security survey ……………………………………………………………. 17
Step 6: Security risk control measures …………………………………………….. 17
Step 7: Return-on-investment exercise…………………………………………….. 17
Step 8: Security risk management report…………………………………………... 18
Step 9: Implementation and evaluation of approved security measures …………... 18
2.3 ADAPTED (OLCKERS) SECURITY RISK MANAGEMENT MODEL FOR
THE RESIDENTIAL SECURITY ENVIRONMENT ……………………………. 19
2.4 RECOMMENDED (KOLE) SECURITY RISK MANAGEMENT MODEL FOR
PETROL STATIONS……………………………………………………………… 20
2.4.1 Service level agreements (SLAs) ………………………………………… 20
2.5 OBSERVATION SKILLS ………………………………………………………… 23
2.5.1 Reporting about persons …………………………………………………… 23
2.5.2 Reporting about vehicles …………………………………………………... 24
2.6 CONTINGENCY PLAN ………………………………………………………….. 25
2.6.1 Suspicious looking objects ………………………………………………… 25
2.6.2 Suspicious looking persons ………………………………………………... 25
2.6.3 Robbery/armed robbery/hostage situation ………………………………… 25
2.6.4 Fire emergencies …………………………………………………………... 26
2.7 CRIME AT PETROL STATIONS………………………………………………… 27
2.7.1 Crime statistics …………………………………………………………….. 27
2.7.2 Organised crime……………………………………………………………. 28
2.7.3 Effectiveness of police in dealing with crime at petrol stations……………. 29
2.7.4 Financial impact of crime at petrol stations………………………………... 30
2.7.5 Public and private partnership in fighting crime …………………………... 30
2.7.6 Garage cards at petrol stations ………………………………….…............. 31
2.7.7 Fleet cards ……………………………………………………….………… 32
2.7.8 Card fraud ……………………………………………………….…………. 33
2.7.9 Role of staff in preventing crime at petrol stations ……………….……….. 33
2.7.10 Forecourt crime ……………………………………………………………. 34
2.8 PROVISION OF BETTER SECURITY AND SAFETY AT PETROL STATIONS
2.8.1 Security measures at the three risk categories risks for petrol stations…….. 35
2.8.2 Loss or crime prevention ………………………………………………… .. 40
2.8.3 Protection of petrol stations ………………………………………….…….. 40
2.8.4 Why prefer private security over public police? …………………………... 41

v
2.8.5 Public police (law enforcement) ……………………………………........... 42
2.8.6 Personnel policies for internal security ……………………………………. 42
2.8.7 Loss control programme …………………………………………………… 43
2.8.8 Adding an extra “Eye/I” to CCTV at petrol stations……………………….. 43
2.8.9 Suspicious behaviour ………………………………………………………. 43
2.8.10 Crime Prevention Through Environmental Design………………………… 44
2.8.11 Loss control and insurance…………………………………..……………... 44
2.11 TYPE OF SENSITIVE INFORMATION MOST SOUGHT AFTER AND
USED BY CRIMINALS IN ATTACKS ON PETROL STATIONS……………… 45
2.12 CONCLUSION ………………………………………………………..................... 46
CHAPTER 3: DATA ANALYSIS, STATISTICAL REPORT AND R ESEARCH
FINDINGS
3.1 INTRODUCTION ………………………………………………………………… 48
3.2 QUESTIONNAIRE FOR EMPLOYERS………………………………………….. 48
3.2.1 Data presentation: Employers ……………………………………………... 48
3.2.1.1 Gender…………………………………………………………… 48
3.2.1.2 Ages of employers ……………………………………………… 49
3.2.1.3 Race of employers ……………………………………………… 49
3.2.1.4 Marital status …………………………………………………… 49
3.2.1.5 Dependents of employers ............................................................. 50
3.2.1.6 Highest educational qualifications ……………………………… 51
3.2.1.7 Category of petrol station ………………………………………. 51
3.2.1.8 Daily turnover of petrol station …………………………………. 52
3.2.1.9 Petrol station’s busiest time …………………………………….. 52
3.2.1.10 Petrol station as a safe place at which to work………………….. 53
3.2.1.11 Respondents feelings about their safety at petrol stations ……… 53
3.2.1.12 The main crime problems at petrol stations …………………….. 54
3.2.1.13 Main crime problems currently being experienced …………….. 55
3.2.1.14 Management participating in community police forum ………... 56
3.2.1.15 Participation in local projects …………………………………... 56
3.2.1.16 Security measures at petrol stations …………………………...... 57
3.2.1.17 Specific security measures available at petrol stations …………. 57
3.2.1.18 CCTV surveillance system ……………………………………... 58
vi
3.2.1.19 Installed cameras at petrol stations ………………………....…... 59
3.2.1.20 Camera recording ……………………………………………….. 59
3.2.1.21 Storage of images……………………………………………….. 60
3.2.1.22 Alarm system …………………………………………………… 60
3.2.1.23 Frequency test of alarm system ………………………………… 61
3.2.1.24 Are you updated on security measures at petrol stations ……….. 61
3.2.1.25 Effectiveness of security measures ……………………………... 62
3.2.1.26 Ineffectiveness of security measures …………………………… 62
3.2.1.27 Criminal incidents at petrol stations ……………………………. 63
3.2.1.28 Security policies and procedures ……………………………….. 63
3.2.1.29 Familiarity with security policies and procedures ……………… 64
3.2.1.30 Posters/manual etc.………………………………………............ 64
3.2.1.31 Emergency procedures ………………………………………….. 65
3.2.1.32 Testing of an emergency plan …………………………………... 65
3.2.1.33 Frequent testing of the system…………………………………... 66
3.2.1.34 Security awareness programme ………………………………… 66
3.2.1.35 Vulnerable assets ………………………...................................... 67
3.2.1.36 Crime or fear of crime ………………………………………….. 67
3.2.1.37 Handling crime at petrol station ………………………………... 68
3.2.1.38 Witnessing crime at petrol station ……………………………… 68
3.2.1.39 Types of crime ………………………………………………….. 69
3.2.1.40 Frequency of crime occurrence …………………………............ 70
3.2.1.41 Reporting crime ………………………………………………… 72
3.2.1.42 People to whom crime was reported ……………………………. 72
3.2.1.43 Action taken …………………………………………………….. 73
3.2.1.44 Specific action …………………………………………….......... 73
3.2.1.45 Actions by specific person ……………………………………… 74
3.2.1.46 Police’s response ……………………………………………….. 74
3.2.1.47 Poor response …………………………………………………… 75
3.2.1.48 Victim of crime …………………………………………………. 75
3.2.1.49 Specific crimes ………………………………………………….. 76
3.2.1.50 Perpetrator/s …………………………………………………….. 76
3.2.1.51 Occurrence of crime ……………………………………………. 77
3.2.1.52 Stealing from petrol station …………………………………….. 77
vii
3.2.1.53 Outside people ………………………………………………….. 78
3.2.1.54 Giving information ……………………………………………... 78
3.2.1.55 Paying for information ………………………………………….. 79
3.2.1.56 Firearm ………………………………………………………….. 79
3.2.1.57 Gun safes ……………………………………………………….. 80
3.2.1.58 Perpetrators ……………………………………………………... 80
3.2.1.59 Race of perpetrators ………………………………………...…... 81
3.2.1.60 Gender of perpetrators ………………………………………….. 81
3.2.1.61 Weapons …………………………………………………........... 82
3.2.1.62 Specific types of weapons ……………………………………… 82
3.2.1.63 Violent approach………………………………………………… 83
3.2.1.64 Time spent committing an offence……………………………… 83
3.2.1.65 Approaching the petrol station for committing an offence……… 84
3.2.1.66 Items perpetrators left with……………………………………… 84
3.2.1.67 Perpetrators familiar to petrol station…………………………… 85
3.2.1.68 Training of perpetrators…………………………………………. 85
3.2.1.69 Weapons of perpetrators………………………………………… 86
3.3 QUESTIONNAIRE FOR EMPLOYEES………………………………………….. 86
3.3.1 Data presentation: Employees……………………………………………....... 86
3.3.1.1 Gender……….…………………………………………………... 86
3.3.1.2 Age of employees ………………………………………............. 87
3.3.1.3 Race …………………………………………………………….. 87
3.3.1.4 Marital status …………………………………………………… 88
3.3.1.5 Dependents ……………………………………………………... 88
3.3.1.6 Highest educational qualifications ……………………………… 89
3.3.1.7 Employees’ positions …………………………………………… 89
3.3.1.8 Monthly income ………………………………………………… 90
3.3.1.9 Experience………………………………………………………. 90
3.3.1.10 Busiest time……………………………………………………... 91
3.3.1.11 Petrol station as a safe place ……………………………………. 92
3.3.1.12 Feeling of safety ………………….…………………………….. 93
3.3.1.13 Main crime problems ……………………………………............ 93
3.3.1.14 Crime reduction …………………………………………............ 95
3.3.1.15 Local projects ………………………………………………........ 95
viii
3.3.1.16 Security measures at petrol stations …………………………….. 96
3.3.1.17 Specific security measures ………………………………............ 96
3.3.1.18 CCTV at the forecourt ……………………………...................... 98
3.3.1.19 Installed cameras ……………………………………………….. 98
3.3.1.20 Recording for 24/7 ……………………………………………… 99
3.3.1.21 Testing of alarm system ………………………………………… 100
3.3.1.22 Frequency of tests ………………………………………………. 100
3.3.1.23 Information about security measures ………………………........ 101
3.3.1.24 Effectiveness of security measures ……………………………... 101
3.3.1.25 Ineffectiveness of security measures ………………………........ 102
3.3.1.26 Records of crime ………………………………………………... 102
3.3.1.27 Security policies and procedures ……………………………….. 103
3.3.1.28 Respondents’ familiarity to policies and procedures …………… 103
3.3.1.29 Posters/manual ………………………………………….............. 104
3.3.1.30 Emergency plan ………………………………………….……... 104
3.3.1.31 Testing of emergency plan ……………………………………… 105
3.3.1.32 Frequency of test ………………………………………………... 105
3.3.1.33 Security awareness programme ……………………………........... 106
3.3.1.34 Vulnerable assets ……………………………………………….. 106
3.3.1.35 Crime or fear of crime ………………………………………….. 107
3.3.1.36 Frequency of staying away from work …………………………. 107
3.3.1.37 Handling of crime ………………………………………………. 108
3.3.1.38 Witnessing crime at the petrol station …………………….......... 108
3.3.1.39 Crime occurring at petrol station ……………………………….. 109
3.3.1.40 Frequent occurrence of crime …………………………………... 110
3.3.1.41 Reporting of crime ……………………………………………… 111
3.3.1.42 Reporting of crime by employees…………………...................... 112
3.3.1.43 Action taken after crime was reported ………………………….. 112
3.3.1.44 Police’s response ……………………………………………….. 113
3.3.1.45 Victim of crime …………………………………………………. 113
3.3.1.46 Perpetrators ……………………………………………………... 114
3.3.1.47 Frequency of occurrence of crime ……………………………… 114
3.3.1.48 Stealing from the petrol station …………………………………. 115
3.3.1.49 Outside people ………………………………………………….. 115
ix
3.3.1.50 Giving information ……………………………………………... 116
3.3.1.51 Offering to pay for information requested ……………………… 116
3.3.1.52 Outside people paying for information …………………............. 116
3.3.1.53 Firearm ………………………………………………………….. 117
3.3.1.54 Gun safes ……………………………………………………….. 118
3.3.1.55 Perpetrators ……………………………………………............... 118
3.3.1.56 Race/s of perpetrators …………………………………………... 119
3.3.1.57 Gender of perpetrators…………………………………………... 119
3.3.1.58 Weapons of perpetrators ………………………………………... 120
3.3.1.59 Types of weapons of perpetrators …………………………......... 120
3.3.1.60 Time spent by perpetrators ……………………………………... 121
3.3.1.61 Perpetrators approaching petrol station ………………………… 121
3.3.1.62 Perpetrators’ familiarity to petrol station ………………….……. 122
3.3.1.63 Training of perpetrators ………………………………………… 122
3.3.1.64 Perpetrators trained better than law enforcement agencies……. ..123
3.3.1.65 Perpetrators better trained than reaction officers ……………….. 124
3.3.1.66 Trauma counselling programme ………………………………... 124
3.3.1.67 Barriers around petrol stations ………………………………….. 125
3.3.1.68 Easy escape routes ………………………………….................... 125
3.4 STATISTICAL COMPARISON OF EMPLOYEES’ AND MANAGERS’
QUESTIONNAIRES………………………………………………………………. 126
3.4.1 Open-ended questions …………………………………………………….. 126
3.4.1.1 Actions taken after crime was reported …………………............ 127
3.4.1.2 By whom action was taken after crime was reported? …………. 128
3.4.1.3 Reasons why police were not prompt…………………………… 128
3.4.1.4 What crime have you been a victim at petrol station? ….............. 129
3.4.1.5 Information requested by outside people ……………………….. 130
3.4.1.6 Crimes witnessed ……………………………………………….. 130
3.4.1.7 If perpetrators were violent in their approach what did
they do?.......................................................................................... 131
3.4.1.9 Do you think employees adhere to security practices?.…………. 132
3.4.1.10 Specific barriers around the petrol stations …………………….. 133
3.4.1.11 Easy escape routes near the petrol station …………………........ 133
3.5 CONCLUSION ……………………………………………………………………. 134
x
CHAPTER 4: INTERPRETATION AND DISCUSSION OF RESEAR CH
FINDINGS, RECOMMENDATIONS AND CONCLUSION
4.1 INTRODUCTION…………………………………………………………………. 135
4.2 INTERPRETATION OF RESEARCH FINDINGS……………………………….. 135
4.2.1 Employers biographical details…………………………………………….. 135
4.2.2 Profile of the petrol station ………………………………………………… 137
4.2.3 Security measures ………………………………………………………….. 141
4.2.4 The criminal incidents at petrol stations …………………………………... 146
4.2.5 Perpetrators profile …………………………………………….................... 152
4.3 STATISTICAL REPORT OF THE EMPLOYEES QUESTIONNAIRES ….......... 157
4.3.1 Biographical details ………………………………………………………... 157
4.3.2 Profile of the petrol station ………………………………………................ 160
4.3.3 Security measures ……………………………………………...…………... 162
4.3.4 The criminal incidents at petrol stations …………………………………... 166
4.3.5 Perpetrators profile ………………………………………………..……….. 174
4.4 COMPARISON OF EMPLOYERS AND EMPLOYEES QUESTIONNAIRES…. 179
4.5 RECOMMENDATIONS …………………………………………………….......... 181
4.5.1 General recommendations …………………………………………………. 181
4.5.2 Recommendations to oil companies ……………………………………….. 183
4.5.3 Recommendations to petrol station owners/franchisees/operators ………... 184
4.5.4 Recommendation to employees …………………………………................ 189
4.5.5 Government (legislation and law enforcement agencies) ……...….............. 190
4.6 CONCLUSION ………………………………………………………..…............... 191
LIST OF REFERENCES…………………………………………………………............ 194
1. BOOKS, PUBLICATIONS AND JOURNALS ………………….....…………….. 194
2. INTERNET WEBSITES ………………………………………………………….. 196
3. LIST OF INTERVIEWS………………………………………………………........198
ANNEXURES…………………………………………………………………….……….. 199
Annexure A: Questionnaire for employees……………………………………….............. 199
Annexure B: Questionnaire for employers……………………………………………….. 210
Annexure C: Consent form……………………………………………………………….. 221
Annexure D: Cover letter …………………………………………………………………222
xi
Annexure E: Spearman correlation coefficient between franchisee and employees ratings on
‘main problems being experienced’………………………………………... 224
Annexure F: Spearman correlation coefficient between franchise and employees ratings on
‘security measures in place’………………………………………………... 225
Annexure G: Spearman correlation coefficient between franchise and employees ratings on
‘most vulnerable assets’……………………………………………………. 226
LIST OF TABLES
Table 3.1: Employers’ gender…………………………………………………………. 48
Table 3.2: Employers’ ages …………………………………………………………… 49
Table 3.3: Race of employers………………………………………………………….. 49
Table 3.4: Marital status of employers………………………………………………… 50
Table 3.5: Dependents of employers………………………………………………....... 50
Table 3.6: Highest educational qualifications of employers…………………………... 51
Table 3.7: Petrol station category……………………………………………………… 51
Table 3.8: Petrol station’s daily turnover ……………………………………………... 52
Table 3.9: The busiest time at petrol station …………………………………………... 52
Table 3.10: Petrol stations as a safe place at which to work …………………………… 53
Table 3.11: Respondents rating of how safe they feel at petrol stations…………........... 53
Table 3.12: Respondents indications of the main crime problems at their petrol
Stations……………………………………………………………………... 54
Table 3.13: Respondents identifying the main current problems ………………………. 55
Table 3.14: Management’s participation in community police forum ……………......... 56
Table 3.15: Petrol station management participating in local projects ……………........ 56
Table 3.16: Availability of security measures at petrol stations ……………………….. 57
Table 3.17: Specific security measures at petrol stations ………………………………. 57
Table 3.18: CCTV surveillance system coverage at the forecourt ………………........... 58
Table 3.19: Number of cameras installed at petrol stations ………………………......... 59
Table 3.20: Camera recording done 24/7 ………………………………………………. 59
Table 3.21: The period that images are kept in the system ……………………….......... 60
Table3.22: Regular testing of an alarm system………………………………………… 60
Table 3.23: The frequent testing of an alarm system ……………………………........... 61
Table 3.24: Information regarding any security measures at petrol stations …………… 61
Table 3.25: Effectiveness of security measures that protect petrol stations…………….. 62
xii
Table 3.26: Reason for ineffectiveness of security measure …………………………… 62
Table 3.27: Records of criminal incidents kept by the petrol station …………………... 63
Table 3.28: Availability of security policies and procedures at petrol stations ………… 63
Table 3.29: Extent to which respondents are familiar with security policies and
procedures …………………………………………………………………. 64
Table 3.30: Availability of posters/manuals/signs etc.at petrol stations ……………….. 64
Table 3.31: Emergency procedures followed at petrol stations ……………………....... 65
Table 3.32: Whether or not the emergency plan is tested ………………………….…... 65
Table 3.33: The regular testing of the emergency plan…………………………………. 66
Table 3.34: Availability of security awareness programme ……………………………. 66
Table 3.35: Vulnerable assets at petrol station ……………………………………...….. 67
Table 3.36: Staying away from petrol station by employers as a result of crime or fear
of crime ……………………………………………………………………. 67
Table 3.37: Ways in which crime gets handled at petrol stations ……………………… 68
Table 3.38: Employers witnessing crime taking place at petrol station ………………... 68
Table 3.39: Types of crime witnessed at petrol stations ……………………………….. 69
Table 3.40: Frequency of occurrence of each crime at petrol station ………………….. 70
Table 3.41: Establishing whether crime is reported by respondents ……………….…... 72
Table 3.42: People to whom crime was reported at petrol stations …………………….. 72
Table 3.43: Action taken after crime was reported …………………………………….. 73
Table 3.44: Specific action that was taken after the crime was reported ………………. 73
Table 3.45: Specific person who acted after crime was reported to them ……………… 74
Table 3.46: Police’s response after the crime was reported ……………………………. 74
Table 3.47: Reasons for poor response by police ………………………………………. 75
Table 3.48: Respondents as victims of crime …………………………………………... 75
Table 3.49: Respondents as victims of specific crimes ………………………………… 76
Table 3.50: Specific perpetrators who committed an offence against respondents …..... 76
Table 3.51: Occurrence of crime within the specific period …………………………… 77
Table 3.52: Specific items stolen from petrol station …………………………………... 77
Table 3.53: Respondents approached by outside people ……………………………….. 78
Table 3.54: Respondents giving information to outsiders ……………………………… 78
Table 3.55: Outside people offering to pay respondents for information………………. 79
Table 3.56: Respondents bringing firearms at petrol stations ………………………….. 79
Table 3.57: Presence of gun safes ……………………………………………………… 80
xiii
Table 3.58: Number of perpetrators involved in a crime committed at petrol stations…. 80
Table 3.59: Specific race of perpetrators ……………………………………………….. 81
Table 3.60: Specific gender of perpetrators ……………………………………………. 81
Table 3.61: Specific weapons perpetrators had ………………………………………… 82
Table 3.62: Types of weapons used by perpetrators …………………………………… 82
Table 3.63: Violent approach of perpetrators …………………………………………... 83
Table 3.64: Specific time spent by perpetrators when committing an offence ………… 83
Table 3.65: Perpetrators approaching petrol station when committing an offence …….. 84
Table 3.66: Specific items perpetrators left with after committing an offence ……..….. 84
Table 3.67: Perpetrators’ familiarity with petrol stations they attacked…………........... 85
Table 3.68: Perpetrators appear to be well trained ……………………………………... 85
Table 3.69: Perpetrators appeared better armed than police or armed reaction officer… 86
Table 3.70: Gender of employees ………………………………………………………. 86
Table 3.71: Age of employees ………………………………………………………….. 87
Table 3.72: Race of participants ………………………………………………………... 87
Table 3.73: Marital status of employees ………………………………………………... 88
Table 3.74: Dependents of employees ………………………………………………….. 88
Table 3.75: Employees’ highest educational qualifications ……………………………. 89
Table 3.76: Current positions of employees ……………………………………………. 89
Table 3.77: Employees’ monthly income ………………………………………………. 90
Table 3.78: Years of experience of employees ………………………………………… 90
Table 3.79: Petrol stations’ busiest time ………………………………………………... 91
Table 3.80: Petrol stations as a safe place at which to work …………………………… 92
Table 3.81: Employees feeling of safety at petrol station ……………………………… 93
Table 3.82: The main crime problems at petrol stations ……………………………...... 93
Table 3.83: Crime at petrol station can be reduced …………………………………….. 95
Table 3.84: Participation of petrol stations in local projects …………………………… 95
Table 3.85: Availability of security measures at petrol stations ……………………….. 96
Table 3.86: Specific security measures at petrol stations ………………………………. 96
Table 3.87: CCTV system coverage at the forecourt …………………………………... 98
Table 3.88: Specific number of cameras at petrol stations ……………………………... 98
Table 3.89: Recording done 24/7…..…………………………………………………… 99
Table 3.90: Regular testing of alarm system …………………………………..……….. 100
Table 3.91: Frequency of tests at petrol stations ……………………………..………… 100
xiv
Table 3.92: Employees briefed by supervisors/managers …………………..………….. 101
Table 3.93: Effectiveness of security measures at petrol stations ……………………… 101
Table 3.94: Reasons for ineffectiveness of security measures …………………………. 102
Table 3.95: Keeping record of violent criminal incidents at petrol station……………... 102
Table 3.96: Security policies and procedures at petrol station …………………….…… 103
Table 3.97: Employees’ familiarity to policies and procedures………………………… 103
Table 3.98: Posters/manuals/signs etc.at petrol stations ……………………………….. 104
Table 3.99: Emergency plan at petrol station …………………………………………... 104
Table 3.100: Testing emergency plan at petrol station …………………………………... 105
Table 3.101: Frequency of testing of emergency plan…………………………………… 105
Table 3.102: Security awareness programme at petrol station …………………………... 106
Table 3.103: Most vulnerable assets at petrol station ……………………………………. 106
Table 3.104: Employees staying away from work as a result of crime .............................. 107
Table 3.105: Frequency of employees being away from work as a result of crime or
fear of crime ……………………………………………………………….. 107
Table 3.106: Handling of crime at petrol station ………………………………................ 108
Table 3.107: Employees witnessing crime at petrol stations ……………………………. 108
Table 3.108: Specific crimes occurring at petrol stations ……………………………….. 109
Table 3.109: Frequent occurrence of crime at petrol stations …………………………… 110
Table 3.110: Reporting of crime at petrol stations ………………………………………. 111
Table 3.111: Reporting of crime at petrol stations by employees….…………………….. 112
Table 3.112: Specific action that was taken after crime was reported…………………… 112
Table 3.113: Police’s promptness when reacting to crime reported….………………...... 113
Table 3.114: Respondents as victims of crime at petrol stations ………………………... 113
Table 3.115: Perpetrators of crime against employees …………………………………... 114
Table 3.116: Frequency of occurrence of crime at petrol stations ………………............. 114
Table 3.117: Respondents stealing from petrol stations …………………………………... 115
Table 3.118: Outside people approaching employees for information about petrol
Stations……………………………………………………………………... 115
Table 3.119: Employees agreeing to give outside people information about petrol
station………………………………………………………………………. 116
Table 3.120: Outside people offering to pay employees for information requested about
the petrol station …………………………………………………………… 116
Table 3.121: Outside people paying for information requested from employees………... 117
xv
Table 3.122: Firearm being brought to the petrol station ………………………………... 117
Table 3.123: Gun safes at petrol stations ………………………………………………… 118
Table 3.124: Specific number of perpetrators involved in crime at petrol stations……… 118
Table 3.125: Race of perpetrators involved at petrol station crime……………………… 119
Table 3.126: Gender of perpetrators……………………………………………………… 119
Table 3.127: Perpetrators armed with weapon…………………………………………… 120
Table 3.128: Specific types of weapons of perpetrators …………………………………. 120
Table 3.129: Time spent by perpetrators on site when committing crime ………………. 121
Table 3.130: Perpetrators approaching petrol station for committing an offence ……….. 121
Table 3.131: Perpetrators familiarity to petrol station …………………………………… 122
Table 3.132: The level of training of perpetrators ……………………………………….. 122
Table 3.133: Perpetrators appearing better trained than law enforcement agencies……... 123
Table 3.134: Perpetrators better trained than reaction officers responding to the petrol
station ……………………………………………………………………… 124
Table 3.135: Trauma counselling programme for employees at petrol stations ……….... 124
Table 3.136: Barriers around petrol stations….………………………………………….. 125
Table 3.137: Easy escape routes near petrol stations ……………………………………. 125
xvi
ACKNOWLEDGEMENTS
I would like to thank the almighty God who gave me the strength to finish this qualification.
In addition, I would like to thank the following people, who made it possible for me to
achieve this qualification:
Family members:
My wife, Magdeline Kole, for her tireless support throughout my studies, my daughter
Tumisang, my son Modisaotsile and my mom, Baratang.
Relatives:
Grandmothers: Reginah and Rebecca Morwane; grandfathers: Lazarus Morwane and the late
Toro Kole; my aunt, Mabotha and my uncle Olebile. Thanks to all of them for their
foundational support in my education.
UNISA:
Prof. Anthony Minnaar (my Chair of Department and Supervisor) for his guidance and
encouragement throughout this research and for his assistance with the technical layout,
formatting and language editing (that was an ongoing process). Mr Charles Rogers, my
former colleague who, before retiring, told me that he would really like to see me finish this
qualification within the stipulated time. Prof. David Masiloane for his guidance and the
Research Directorate at UNISA for granting me support funding for my research activities.
Finally my thanks to the statisticians, Suwissa Muchengetwa and Rajab Ssekuma, for the
statistical analysis on my collected data of the dissertation.
Friends:
Thanks to Gordon Cassim and Ezekiel Lehong, both my former colleagues, for providing
encouragement and support.
Oil Companies:
Thanks to all those who participated in the study as either employers or employees of the
following oil companies: BP (Banda Kondi and all her team); Engen (David Chiat and his
team); Sasol (Frank Vilakazi, Thokozile Keitumetse and their team); and Total (Michael
Leon and his team).

xvii
EXECUTIVE SUMMARY
Security measures need to be put in place in order to deal with any security weaknesses that
might occur or be observed. Care should be taken when addressing any crime or loss problem
in any organisation, in this research study more specifically: petrol stations. It is clear that
because of their diverse locations petrol stations have different levels of risks, e.g. low,
medium and/or high risks. The study explored many issues including, among the others:
security measures; petrol stations’ busiest times; vulnerable assets at petrol stations.
This study sought to answer the following research questions:
• Are there effective security measures at petrol stations in Gauteng?
• What type and extent of security measures are in place for the protection of petrol
stations?
• How effective are these security measures in deflecting armed robberies?
• Why are petrol stations being robbed?
• What is the profile of the perpetrators who are robbing petrol stations?
• What is the extent of losses suffered by robbed petrol stations?
• What is the role of the petrol station employees in robberies?
The UNISA-developed Security Risk Management Model, adapted, customised and suitable
for fighting crime or for loss prevention at petrol stations, was recommended for
implementation at petrol stations. It has a series of different interlinked important steps.
These steps are crime causation factors, policy/mandate, orientation phase, risk analysis
exercise, security survey, security control measures, service level agreement, return on
investment, implementation of security measures, maintenance of security measures, report to
the management, etc. that need to be followed.
The main research instrument for the collection of information used in the study was a
questionnaire. For the purpose of constructive inputs, many people, including in the academic
field, were contacted on their views in relation to the questionnaire before it was
administered.
xviii
A literature review was conducted with a view of linking the empirical data collected through
questionnaires with the theoretic information gathered from various sources inter alia: the
internet, books, interviews and newspaper articles.
The research which was done for this study was mainly aimed at looking at the effectiveness
of security measures at petrol stations in Gauteng. The findings being presented were
accompanied by recommendations on improving the security measures at petrol stations.
These recommendations were made with reference to different stakeholders i.e. franchisees,
employees, oil companies and government.

1
CHAPTER ONE
MOTIVATION FOR THE RESEARCH AND THE RESEARCH METHOD OLOGY
1.1 INTRODUCTION
Within the context of high crime levels in South Africa over the last few years, from 2000 -
2009, it is clear that petrol stations,1 in particular in the Gauteng Province, are being faced
with a major challenge in combating the crime that is occurring at their sites. This is not
something to be left only to law enforcement agencies acting on their own. It has become
obvious that there is a need for security measures to be put in place at petrol stations in order
to avoid or minimise the crime risks at these sites. However, the concern is “how effective are
the security measures at petrol stations?” This research study deals mainly with an
investigation and analysis of security measures at petrol stations and their effect or impact on
the prevention and reduction of crime at petrol station.
Security measures tend to differ from one branded petrol station to the other. Criminals
appear to first study the petrol station environment before launching their criminal attacks.
The rate at which crimes are increasing at petrol stations indicates a clear need for an
examination of security measures at petrol stations. This study aims to establish the
effectiveness or lack of security measures in combating such criminal attacks.
1.2 PROBLEM STATEMENT
Petrol stations in Gauteng are regularly attacked by heavily armed criminals for the purposes
of stealing money, goods and even theft from patrons. The attacks appear to be well planned
and, in most cases, are very successful in the sense that the criminals escape without getting
caught with substantial amounts of money. The results of these criminal attacks are mainly
severe monetary loss, sometimes loss of lives, malicious damage to property and petrol theft
during the attack. In addition, the use of firearms is frequent with people being shot and
injured and on occasion killed.
1 Different parts of the world have their own unique terms, other than ‘petrol station’ or ‘garage’ to describe a
facility selling fuel (petrol or diesel) and other services for vehicles. For example “A filling station, fuelling
station, gas station, service station or petrol station is a facility which sells fuel and lubricants for motor
vehicles” (Anon, nd) . For the purpose of this study, the term “petrol station” will be used to mean petrol and
diesel as most people are familiar with that term.
2
1.2.1 The crime facing petrol stations
Petrol stations, like any other business, are exposed to a number of risks. Some of the risks
that face such business both locally and abroad, are the following: burglary; ATM crimes
(e.g. bombing2); robbery/armed robbery; vehicle theft; hijacking of staff or customers; retail
shrinkage3 (shoplifting and employee theft); assault (of petrol attendants and customers);
petrol card fraud; vandalism to the security measures or malicious damage to the property;
and cash heists.
“To study risks in a particular situation it is constructive to consider what might motivate the
criminal. For example: theft may be performed for reasons such as desperate need (theft of
food); personal gain (keep or sell goods); avarice (desire to possess the object); duress (steal
by threatening another person); jealousy (satisfaction to take from the owner) and malice
(steal to destroy/harm the owner)” (Lyons 1988: 12).
1.2.2 Vulnerable assets at petrol stations
Whenever there are criminal activities at petrol stations some assets get taken or damaged,
Injuries and even death to personnel and/or customers occur. The following are some those
vulnerable items taken: cash; safe; goods such as cigarettes and cellphone recharge vouchers,
while damage can occur to the security measures, ATMs or other facilities on site, while
injuries/death may well be sustained by armed response unit personnel, the petrol station
management, employees and customers.
Any security measures implemented at petrol stations should generally be as extensive or
comprehensive in line with the value of the item (s)/persons to be protected. Whenever a
company wants to implement security measures they should firstly, know the nature and
extent of the threats facing them. Secondly, evaluate the specific measures needed to fully
protect all assets. Thirdly, the extent (range) of valuables/goods on the premises. Finally, test
the effectiveness (i.e. how well they work) of the implemented security measures (Lombaard
2002: 10). The vulnerable factor for all these should also come into the reckoning.
2 In an interview, Louw (2009), when asked what her take was on ATM bombings, since she had an ATM machine in her petrol station store she said that ATMs are all right in the store because they are safe and they make life easier for clients. 3 In an interview Louw (2009) indicated that shrinkage was sometimes caused by customers as they would grab small items like medication from the shelves (of the convenience store at the petrol station) in put them in their pockets. This would, however, be detected through the CCTV system (and footage used for later follow up for evidence and possible prosecution.
3
1.3 PURPOSE OF THE RESEARCH
The purposes of this research study include the following:
• Develop a “safer petrol station model” inter alia by collating “best practices”.
• Look at the effectiveness of security measures at various petrol stations in Gauteng. The
threats or risks facing these petrol stations to be investigated, in order to see if the security
measures in place are appropriate and effective.
• Identify possible shortcomings in implemented/existing security measures.
• Investigate the extent of financial losses suffered by petrol stations resulting from
criminal activity inter alia armed robberies.
• Determine if there are security policies and procedures in place at petrol stations in
Gauteng.
• Determine the roles of different stakeholders, i.e. franchisees, oil companies, employees,
and contracted security company guards, towards security measures.
• Determine modus operandi of perpetrators, what time of day, and month petrol stations
are attacked.
• Investigate what are the causes/reasons/opportunities leading to armed robberies at petrol
stations.
• Determine the different types of crimes committed at petrol stations.
• On the basis of the research results, recommendations and holistic, preventative and
protective security measures will be formulated and submitted to the petrol industry,
garage owners/franchisees and retailers.
4
1.4 RESEARCH QUESTIONS
The questions posed in this research are the following:
• Are there effective security measures in place for the protection of petrol stations in
Gauteng?
• What type and extent of security measures are being implemented to secure petrol
stations?
• How effective are these security measures in deflecting armed robberies?
• Why are petrol stations being robbed?
• What is the modus operandi mainly used by the criminals to carry out the armed
robberies? (If any)
• What is the profile of petrol station robbers?
• What is the extent of losses suffered by robbed petrol stations?
• What is the role of the petrol station employees in the robberies?
1.5 VALUE OF THE RESEARCH
• This is the first study4 of its kind conducted in South Africa and more specifically in
Gauteng.
• This research will highlight the current status of the security measures at the petrol
stations.
• These petrol stations (Sasol/Exel, BP, Total, Caltex/Zenex, Engen, and Shell) would
hopefully be guided by the findings of the study to improve any shortcomings and
weaknesses that might be revealed from the research analysis.
• The petrol stations, supplier and owner companies, retailers or franchisees are losing
substantial amounts of money.
4 The researcher became interested doing this study while still working for Sasol Oil Company as a Security co-ordinator during the period: September 2007 – December 2007. This work entailed, among others, doing regular security threat assessments at petrol stations; security advisory role between the oil company and their franchisees; responding to the security incidents at the sites where the researcher was responsible.
5
• There has also been loss of life physical injury in some of the robberies.
• UNISA: Research results can be inputted into future study guides of the Department of
Security Risk Management.
1.6 INDUSTRY SPECIFIC TERMINOLOGY AND DEFINITIONS
Below are the main industry specific terminology and definitions that are used in the
environment of petrol stations by managers to classify types of ownership models of petrol
stations (Caltex, 2010 & Bisht, 2007):
• Company Owned Company Operated (COCO) petrol station:
In this class of business, the oil company has full control over the petrol station, i.e. in all
the standards and operational procedures and expenditures. The oil company basically
takes on only two responsibilities, namely: to advance the interest of the oil company; and
to ensure that the petrol station is operated accordingly. The latter occurs when the oil
company appoints a manager to operate the petrol station on its behalf. Here cooperation
between the oil company and the petrol station manager seems to be better than in the
other operating categories specifically in terms of security measures that should be in
place. This is simply because if the petrol station is attacked the oil company is directly
affected in terms of its image and financially (due to direct losses to the COCO petrol
station) Bisht (2007)
• Company Owned Retailer Operated (CORO) petrol station:
In this class the oil company owns the petrol station and it is operated by a franchised
dealer. Any security measure that ought to be in place at the petrol station means that the
franchisees (themselves) have to go through all the channels to request for their
implementation and installation. Although the oil companies have generally set security
standards for their petrol stations, the location of the petrol station would always
determine the level of security that is needed or necessary at that particular petrol station.
This means that the set standards will not suit each petrol station everywhere. It is here
where communication issues become problematic. If a franchisee feels like putting in
place some security measures e.g. putting a bullet resistant glass around the cashier area,
the oil company may well argue that it is unacceptable as it impacts on the general image
of the specific brand. This would not necessarily be the same with another oil company;
in fact this (bullet-proof glass) might well be a requirement within their security
6
standards. At the end of the day it is all about different policies of different oil companies,
rightly so (Caltext, 2010).
• Retailer Owned Retailer Operated (RORO) petrol station:
The oil company has no say or ownership other than of the tanks, pumps and peripherals
like signage. No control over operating standards and can only advice. Independent
owner/retailer owns petrol station site and operates the business. The image of the oil
company will always play an important role in this regard (Caltex, 2010)
• South African Petroleum Industry Association (SAPIA):
SAPIA is the association that represents the common interests of Oil companies (BP,
Sasol, Total, Chevron, Engen, Shell and Petro-SA) in order to contribute positively to the
economy and social progress of the country (SAPIA, Nd). There is an ‘Oil Industry
Security Forum’ within SAPIA that looks at security issues in order to advise their oil
companies accordingly. Security challenges are discussed in this forum by means of
getting information together regarding all criminal activities from their member petrol
stations, including such information as the modus operandi adopted by criminals, etc. in
order that they are able to disseminate such information and warn their petrol stations
accordingly (SAPIA, Nd)
1.7 RESEARCH METHODOLOGY
1.7.1 Research design
Stratified systematic sampling with a random start was adopted in this study (Babie and
Mouton (2001:198; as cited in Welman and Kruger (2001:59)). This is a probability sampling
where all units of analysis (in this case petrol stations), have an equal chance of being
selected into the study Welman and Kruger (2001: 47- 47). It is important to create the
opportunity for all variables to be inclusive in the study in order to avoid some imbalances in
the study. All participating petrol stations sent the list with the number of their petrol stations
in the country. The researcher had to select only the targeted region, being all those which are
based in Gauteng. A table of random numbers (from 1 until the specific number of petrol
station in Gauteng) was drawn from each list. The random number was determined before
going on with the number that would represent the randomly selected unit of analysis.
Reserve random start sample was drawn to accommodate those who, by some reasons they
7
would withdraw from the study. Since Gauteng is a big area, the Province was divided into
five regions: North Gauteng, South Gauteng, West Gauteng, East Gauteng and Central
Gauteng (Johannesburg). The researcher was again mindful of ensuring that the same
principle of probability sampling was followed. The sampling results came out with 20
employers to be contacted for the study whereby only 18 agreed to participate and 64
employees who were scheduled to participate and only 41 took part in the study
In terms of case studies, the researcher consulted different sources of information in order to
have a better knowledge (intrinsic case studies) about petrol stations environment from
different people in different oil companies in South Africa and more so in Gauteng. Berg
(2004:251, 256). Among these were interviews that were conducted, newspaper articles, the
researcher’s personal experience, and websites. The information gained from these sources
was used to guide the research questions.
Multiple methods called triangulation were used to observe reality from different sides to the
same point Berg (2004:5). The main reason for using this triangulation method was to ensure
that what one method could not uncover would be uncovered by the other method during the
study.
All these individuals admitted that this kind of research was suitable for implementation in
the field for the collection of the specific type of industry-related information on the chosen
topic. There were two questionnaires: one aimed at employers which had 86 questions and
one for employees, also with 86 questions. The questionnaires were distributed to participants
at twenty (20) selected franchisees (petrol stations) with sixty four (64) participating
employees targeted. Eighteen (90%)5 employers returned questionnaires while only 41 (51%)
employees responded.
1.7.2 Problems encountered during the research
Negative attitude towards completing the questionnaires
Initially all selected petrol stations from all the oil companies operating in South Africa (BP,
CALTEX/CHEVRON, ENGEN, SASOL, SHELL and TOTAL) agreed to participate in the
research.
5 Please note that most percentages have been rounded off either up or down.
8
However, due to withdrawals, delays in getting participation, and no official response
received, only petrol stations from four of the oil companies (BP, ENGEN, SASOL and
TOTAL) participated in the research. Of the four oil companies who participated, one oil
company authorized the research to be conducted only with employers and not with
employees.
The field work (handing out and administering the questionnaires) was conducted by field
workers who were employed by the researcher. Though respondents were informed about
this and questionnaires were sent (dropped off at participating petrol stations) well in
advance, some respondents subsequently informed field workers that the questionnaires had
‘too many questions’.
Some protocols contacting petrol station management, confirming permission to undertake
research, meeting in person, letter of confidentiality, adherence to privacy and anonymity,
consent forms, setting up suitable dates, getting buy-in from employees to participate, etc.
required by petrol companies to be followed via company management channels to enable
research to take place at their petrol stations were quite lengthy, delaying and at times
research (interviews and administering of questionnaire) was only permitted to be undertaken
within a limited ‘two-day time’ period.
Some oil companies wanted to dictate to the researcher which petrol stations should
participate in the study. This was contrary to the research methods adopted by the researcher
(e.g. sampling procedures followed).
One oil company restricted the research to only include employers and not employees. Yet
the same oil company’s employers were so cooperative that they wanted the study to cover
their employees as well. However, there was nothing the researcher could do about this since
this oil company had already decided, on their behalf, not to allow participation by
employees. Some of the oil companies were only active at the start but when the research was
about to be conducted they withdrew their participation.
While some franchisees/employers/operators complained about the lengthy questionnaires,
employees, by and large, were very cooperative in participating fully in the study.
9
All responses were directly from each respondent and these responses generally reflected
their own experiences at their places of work.
Some clarifying questions asked by respondents about the questionnaire were not relevant to
the context and thrust of the study’s focus.
Geographic location of petrol stations
Field workers did not have any difficulty getting to petrol stations because the researcher
made it clear that every fieldworker was allocated to the site very familiar and convenient to
them. Some had their own transport for farther areas.
Uncompleted questionnaires
Some respondents did not answer some of the open-ended questions hence making it difficult
for the researcher to make informed decisions on those aspects. Language was not a barrier at
all in respondents’ completing questionnaires since most field workers understood more than
one official language. Fieldworkers could explain in vernacular language when non-English
speaking respondents were involved.
It was indicated in the covering letter and in the consent form that participants were not in
any way forced to participate in the study and that they could, if they chose to do so –
withdraw their participation from the study at any time during the interview.
1.7.2 Data collection methods and field work practice
The researcher requested the oil companies (Sasol/Excel, Shell, Chevron/Caltex, Engen, BP
and Total) their petrol stations databases for Gauteng Province with all relevant information
like area, telephone/cellphone, fax, email or physical address – which they agreed to provide.
Random selection of units of analysis was performed on these lists and oil companies were
informed about the selection results in order for them to alert their selected petrol stations.
Five petrol stations from each brand of six oil companies were randomly selected for the
study with a total of 30 franchisees/operators/employers and 120 employees being selected
(targeted), i.e. one operator and four employees from each of the selected (sampled) petrol
stations.
10
Not all brands participated in the study and that impacted negatively on the target population
(Chevron/Caltex and Shell decided not to participate fully (limited participation granted) in
the study. Accordingly the final target population group changed to only four oil company
petrol stations with 20 franchisees/operators/employers being selected. Eventually, only 18
(90%) of the selected franchisees/operators/employers participated fully in the study. In terms
of employees the actual target was 80 employees, with only 41 (51%) of employees
participating by responding and returning completed questionnaires. This reduced number
was a result of BP only allowing for franchisees to participate in the study and not the
employees at the selected petrol station). In addition, some petrol station operators restricted
the number of employees permitted to participate in the study to less than the four selected
employees per petrol station.
Most of the data was collected by means of two separate questionnaires for employers and
employees respectively. Each questionnaire contained a total of 86 questions. All
questionnaires, consent forms. Examples of these documents are attached are Annexure A:
Employees’ Questionnaire, Annexure B: Employers’ Questionnaire and Annexure C:
Consent form were sent well in advance to the actual fieldwork to all participating petrol
stations. That was done in order that participants had enough time to study them with field
workers visiting the selected petrol stations on the days set aside for the filling in of
questionnaires and assisting such process where there was any clarification (of questions and
procedures) needed. The full research proposal was included in the documentation sent to
participating petrol stations so that participants had full knowledge of focus, aims, objectives
and methods used of the study.
The employer questionnaires were largely administered by means of face-to-face interviews
with employers, in particular to deal with the open-ended question. – From the pilot study it
was recognised that these questions might need clarifying questions (e.g. respondents might
need to explain their responses) be posed by the interviewer to the respondents.
As a result of the application of the interview technique as opposed to the self-administered
(respondents filling in on their own) questionnaire method only 18 employers were prepared
to give up their time to be interviewed in the study.
11
The collected data from the questionnaires was collated, coded, processed and statistically
analysed in order to:
• Establish what can be done to reduce crime at petrol stations.
• Examine security measures protecting petrol stations and their effectiveness.
• Establish the profile of perpetrators of crime at petrol stations.
• Find out if petrol station employees and employers are security cautious
1.7.3 Coding of information
Two different master coding sheets were formulated. One for the employers’/
operators’/franchisees’ questionnaire and one for the employees’ questionnaire. Coding was
first done on the hardcopy questionnaire by hand then inputted on a computer using Excel
software. The information (coded data on excel sheets) was then taken to a professional
statistician for statistical analysis purposes. All questions including ‘‘yes’/no’ or open-ended
questions were catered for in the coding process. The open-ended questions responses were
first clustered in similar categories with each such category assigned a code (number). Data
was categorised and clustered into themes in order for it to be easy to analyse.
1.7.4 Validity of research design: External validity
The findings obtained in this study can be applied at petrol stations, inside or outside
Gauteng, which did not participate in the study because the study was representative sample.
Therefore, the findings of the study can be generalised because the people who participated in
the study were not influenced in any way. They acted as they would have acted under normal
circumstances at their areas during the study Bless & Higson-Smith (1995:82). Bless et al.
(1995:82-83) state that the studies which mainly employ high level of external validity have
low internal validity and that it is very rare that the study could achieve both high internal or
high external validity.
1.8 CONCLUSION
This chapter aimed at providing a clear picture of how the research was conducted. All
research guidelines, including ethical issues were correctly followed. Confidentiality and
anonymity of respondents and collected information was upheld by both the researcher and
the supervisor. Correct methods of referencing were followed throughout.
12
No one was compelled to participate in the study. All participation was voluntary with the
questionnaire being accompanied by a consent form as well as a covering letter outlining the
focus, aims and objectives of the study. In addition copies of the full research proposal
accompanied the disseminated documentation. All participants were free to answer the
questionnaires, with questions formulated in a straightforward unambiguous manner with the
questionnaire being piloted beforehand. Participants could also ask for clarification of any
question in the questionnaires. The Respondents were also free to withdraw and stop the
interview at any stage of the process.
The main research questions which this research study sought to answer were the following:
− Are there effective security measures in place for the protection of petrol stations in
Gauteng?;
− How effective are these security measures in deflecting armed robberies?;
− Why are petrol stations being robbed?;
− What is the modus operandi mainly used by the criminals to carry out the armed
robberies? (if any);
− What is the profile of petrol station robbers?;
− What is the extent of the losses suffered by robbed petrol stations?;
− What type and extent of security measures are being implemented to secure petrol
stations?; and
− What is the role of petrol station employees in the robberies?
The above research questions were the primary focus and discussed throughout the research
study.
13
CHAPTER TWO
LITERATURE REVIEW
2.1 INTRODUCTION
This chapter deals with the literature review. The researcher found that there was a distinct
lack of literature on this specific topic and study focus area. However, a wider search for
linking information to the various broad aspects of the study was undertaken.
2.1.1 Petrol stations in South Africa and other parts of the world
According to Anon (nd) the estimated number of petrol stations in South Africa in 2008 was
6 500. In comparison, other African countries such as Nigeria (in African terms one of the
bigger economies) had about 4 700 petrol stations operating; Kenya had 1 300; Tanzania had
about 1 000 petrol stations, while Malawi had about 500 petrol stations. In contrast a country
such as Turkey (similar sized economy and population to South Africa) had about 12 139
petrol stations while the UK (much bigger economy but smaller country in terms of distances
that have to be travelled) had about 9 271 (down from 18 000) but the USA (much bigger
geographic size) had about 200 000 while Canada had about 14 000 petrol stations; and India
had about 15 000 petrol stations. The number of petrol stations can be linked to the number
of vehicles a specific population owns, as well as land size of a country, but numbers are also
proportionate in some cases to the size of the population (e.g. Canada). The numbers of petrol
stations in the countries listed above give a very good indication of how big this industry is
worldwide.
A Security Risk Management Model was followed in order to conduct this study. Below is a
description of the model and how security practitioners could (potentially) apply it at their
petrol stations in order to fight crime. It must, however, be remembered by management, as
well as security managers/security officers, that it depends on what one intends to achieve in
a security program/ that will guide one in the application, implementation and utilisation of a
security risk management model.
14
2.2 THE (ROGERS) SECURITY RISK MANAGEMENT MODEL
Rogers (2005: v), building on the work of other practitioners but customising a basic risk
management model to the security environment, developed what he termed a Security6
(Crime) Risk Management Model. This model forms the basis of the risk assessment and risk
analysis in the security management undergraduate security modules taught to security
management students at the University of South Africa (UNISA)7 undertaking Diploma in
Security Management and the BTech in Security Risk Management degree studies.
Rogers (2005: v) alluded to the Security (Crime) Risk Management Model as a model that is
followed in order to solve any security problem at a company, organisation or at business or
residential premises as and when the need arises. One will have to understand what to do and
implement (in terms of policies, procedures and security measures/systems) when a security
programme is put in place in an organisation. Security measures are put in place criminals try
by all means to bypass these security measures, i.e. an action or measure will inevitably lead
to some sort of response or reaction. 8 In most instances criminals tend to succeed, especially
if they are able to exploit shortcomings or perceived opportunities to perpetrate criminal acts.
That would clearly mean that their reaction or attack on the security system was equal or
more than surpassed that action applied to the security system.
6 In this context the term ‘security’ is applied not to the ‘State’ security field but more to the physical and industrial security environment of access control, loss prevention and protection of residential and business premises. 7 The first three-year Diploma in Security Management was initially offered as from 1995, with a degree (BTech in Security Risk Management) being developed in 1998 by the Programme Group: Security Management in the Faculty of Public Safety and Criminal Justice at the TechnikonSA for the period up to 2003. Later (after the merger with UNISA in January 2004) these tertiary qualifications were offered by the Department of Security Risk Management (2004-2008) and currently in the Programme: Security Science within the merged Department of Criminology & Security Science in the School of Criminal Justice at the UNISA College of Law. 8 In such a situation Sir Isaac Newton’s Third Law of Motion comes to mind, i.e.”For every action there is an equal and opposite reaction” (The Physics Classroom, nd).

15
Figure 2.1: The Rogers Security Risk Management Model
(Rogers 2005: v-xi)
The Rogers’ developed Security Risk Management Model has nine basic steps that need to be
followed in its application.
Step 1: Factors causing crime
There will always be underlying factors causing the crime/risk that the organisation
experiences. These could well include the following:
• Greed of perpetrators;
• Need of perpetrators;
• Opportunity presenting itself to perpetrators; and many more.
Briefly these can be listed as desire (predisposing factors), opportunity (precipitating factors)
and ability (physical ability and intelligence) and graphically represented as the so-called
‘Triangle of Crime Causation’ ( Rogers, 2005: 6-8, ).
Step 2: Security policy and mandate
Step 3: Orientation
phase
Step 6: Security risk
control measures
Step 4: Risk analysis
exercise
Step 5: Security survey
THE SECURITY RISK
MANAGEMENT MODEL
Step 7: Return on investment
Step 8: Security risk
management report
Step 9: Implementation and evaluation
of security measures
Step 1: Factors
causing crime
16
Step 1 in the application of the Security Risk Management Model, would be the occurrence
of a crime leading to the recognition by management of the existence of a ‘security’ problem
and the acknowledgement by them that action to deal with or prevent future such crime
problems must be implemented. This recognition of the problem would lead to Step 2.
Step 2: Security policy and mandate
Top management would first give consent (i.e. a mandate to act and take action) to a security
practitioner for undertaking security activities at their organisation. All security processes,
security policies and security procedures will be made available to be scrutinized by the
security practitioner. This consent is very important in that without it no security activities
can take place in an organization. According to Rogers (2005: vii) “the organization may also
be a signatory to a contract with a security company that has been contracted to protect the
assets of the organization. This contract is normally termed a ‘service level agreement’.”
Step 3: Orientation phase
This is the stage where the appointed or contracted security practitioner familiarises
him/herself with the security processes in the organisation including the building/premises
(preliminary site visit) where the problem or crime risk occurred. The following steps in the
Security Risk Management process are then triggered in that the security practitioner:
• “Walks the risk” by physically observing what goes on in line with the job he/she is
mandated to do.
• “Talks the risk” by speaking to relevant people like other managers, external consultants,
academics in the field, nearby police station officials in order to establish crime trends in
the area and so on.
• “Reads the risk” i.e. reading from and referring to the loss control books, incident
registers, internet, relevant security journals, company policy documents, etc.
17
Step 4: Risk analysis exercise
The following actions are taken at this stage:
• All assets are identified.
• All risks that assets are exposed to are identified.
• The extent to which the risks will affect the organisation should they occur, is calculated
or identified.
Step 5: Security survey
By its definition, a security survey is a critical onsite examination and analysis of an
industrial plant, business, home, public private institution in the light of prevailing criminal
threat, in order to determine the present security status, identify security deficiencies or
excesses, determine the level of protection needed and make recommendations to improve
overall security (Fennelley 1992: 141).
During the orientation phase the security practitioner should have familiarised himself/herself
with the building, core business conducted in the building, security measures and drafted
some sort of check lists (mainly on physical security measures), e.g. check list on the CCTV
system, alarm system, fence, security lighting, windows, doors, key control, procedures, .. In
short the practitioner will look at the security system according to the definition of the survey
above.
Step 6: Security risk control measures
Security risk control measures are measures put in place to counteract identified risks. These
control measures may take the following forms: human security; technical security; security
procedures; security policy; and security aids (Rogers 2005: x).
Step 7: Return-on-investment exercise
This is the stage where the security practitioner will take into consideration the cost of
security measures, whether they are cost effective in that the security solution should save the
company money instead of making the company lose more money.
18
For example:
1. You should not buy a turnstile system costing R25 000 and install it at an access control
point which does not really need to be used since the company has several entry/exit
points. Instead, the permanent closure of that access control point should be requested (as
a more cost effective security measure).
2. A company loses R500 000 due to the theft of laptops per annum. However, when a
CCTV surveillance system, costing the company R25 000, is installed, the loss is reduced
to about R70 000 per annum. Hence the company benefits from the return on investment
exercise that you have undertaken
Step 8: Security risk management report
Once steps 1-7 have been completed the security practitioner prepares a full report and
submits such to the top management of the organisation that appointed him/her to do the job.
This report contains all the findings and recommendations. The money to be spent on security
measures is also calculated, as well as the potential savings for the company after security
measures are put in place. These estimates must be clear, logical and convincing. If top
management are convinced of the appropriateness of the recommendations, it would be more
than likely that they accept and approve of the costs and implementation. This would be when
the implementation phase starts.
Step 9: Implementation and evaluation of approved security measures
Having given the go-ahead for implementation the contracted security practitioner would
most probably also oversee such process. After a period of operations, the effectiveness of the
recommended and now installed security measure must be evaluated. This is often done by
means of a so-called ‘penetration’ exercise whereby the system is tested in order to identify
any gap or shortcoming that may arise.
19
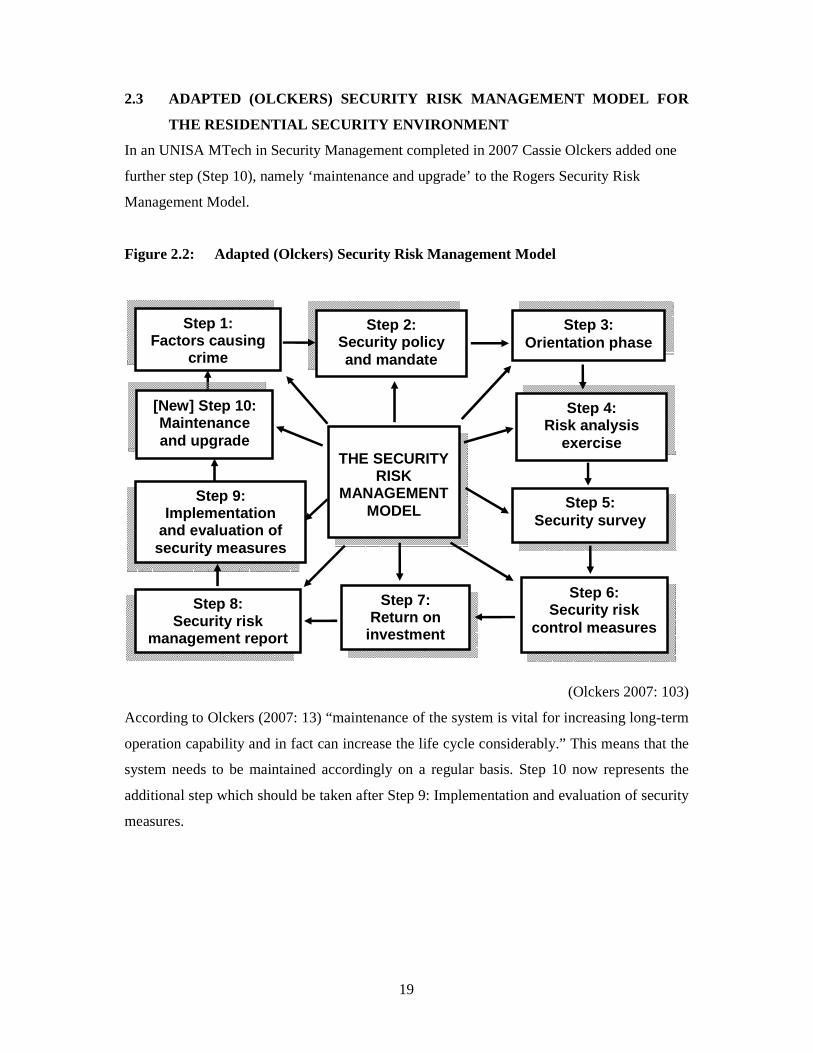
2.3 ADAPTED (OLCKERS) SECURITY RISK MANAGEMENT MODE L FOR
THE RESIDENTIAL SECURITY ENVIRONMENT
In an UNISA MTech in Security Management completed in 2007 Cassie Olckers added one
further step (Step 10), namely ‘maintenance and upgrade’ to the Rogers Security Risk
Management Model.
Figure 2.2: Adapted (Olckers) Security Risk Management Model
(Olckers 2007: 103)
According to Olckers (2007: 13) “maintenance of the system is vital for increasing long-term
operation capability and in fact can increase the life cycle considerably.” This means that the
system needs to be maintained accordingly on a regular basis. Step 10 now represents the
additional step which should be taken after Step 9: Implementation and evaluation of security
measures.
Step 2: Security policy and mandate
Step 3: Orientation phase
Step 6: Security risk
control measures
Step 4: Risk analysis
exercise
Step 5: Security survey
THE SECURITY
RISK MANAGEMENT
MODEL
Step 7: Return on
investment
Step 8: Security risk
management report
Step 9: Implementation
and evaluation of security measures
Step 1: Factors causing
crime
[New] Step 10: Maintenance and upgrade

20
2.4 RECOMMENDED (KOLE) SECURITY RISK MANAGEMENT MODEL F OR
PETROL STATIONS
Figure 2.3: (Kole) Security Risk Management Model for petrol stations
Both the Rogers and Olckers models lead logically to the third model Kole addition that now
includes the insertion of an additional step (new Step 7) of service level agreements (SLAs) –
a step that is recommended and emanates from the research undertaken for this study for
implementation at petrol stations.
This additional step is outlined in more detail below:
2.4.1 Service level agreement (SLAs)
A Service Level Agreement (SLA) is entered into by parties who agree on specific things for
example security services, for instance guarding services, armed response, cash-in-transit
services, investigations or installation of security aids or products (CCTV surveillance
system, alarm system, turnstiles, gates, fence, walls/barricades, metal detector, x-ray
machines, scanners, security lighting, such an SLA should also contain operational matters
Step 2: Security policy and mandate
Step 3: Orientation phase
Step 6: Security risk
control measures
Step 4: Risk analysis
exercise
Step 5: Security survey
THE SECURITY RISK
MANAGEMENT MODEL
Step 8: Return on investment
Step 9: Security risk management
report
Step 10: Implementation
and evaluation of security
Step 1: Factors
causing crime
Step 11: Maintenance and upgrade
[New] Step 7: Service Level Agreements
21
regarding operations, extent of services, maintenance schedules as well as sanctions if the
service provider/s do not fulfil all these conditions of service and operational requirements. In
this regard, after the security risk control measures exercise is conducted and security
measures as solutions are proposed a Service Level Agreement regarding each and every
security measure proposed should be drafted and looked at by top management of the
contracting company/business/organisation. This should be signed by SLA. If a company
where a CCTV surveillance system was installed at a total of R250 000,00 and the following
week after installation the system gets struck by the lightning and there was no SLA in place
before the security measures were taken over by the security practitioner or user of the
services, who will be responsible for replacing the system – the providers/installers or the
security practitioner? If a signed agreed to SLA had been in place immediately when the
system was handed over, such confusion would then beforehand have been avoided. Any
professional security practitioner needs to ask for a SLA for any security measure
recommended to be put in place. Such agreement needs to be studied properly before it is
signed by the parties to the agreement (e.g. security practitioner and company). If possible,
the security practitioner should ask for a detailed service level agreement from the service
provider/installer which can then be attached as an annexure to the final report submitted for
approval to top management. This would also serve the purpose of informing top
management of the kind of agreement to be implemented between the security practitioner
and the providers of the security measures. Depending on the nature of the security measure
(e.g. security guards, fence, boom gates, turnstiles, X-rays, alarm systems etc.) the following
is an example of the kind of information that should be contained in the SLA:
• Services: All services rendered should be specified;
• Rate of payment for services: Payment is highlighted, e.g. how much should be paid per
hour, day or week for specified services;
• Reimbursement for expenses: This refers to some instances where the service provider or
installer purchased parts/goods from his own pocket and it should be stated that the client
should reimburse the service provider (on submission of a receipt of costs) after
installation was completed;
22
• Invoicing: The method of invoice which will be followed by the parties signing
agreement;
• Confidential information: This clause will highlight how confidential information should
be handled by service provider if they encounter any such information in the process;
• Staff: Agreement on members of staff (number, kind of skills they should have; training)
that will render the services;
• Use of work product: Any restrictions if any, regarding this aspect, should be highlighted;
• Client representative: This will be a person who will always be contacted on behalf of the
client. The service provider should never have to see or deal with different people every
time he/she visits the client;
• Independent status: The service provider will always need to highlight to the client if
he/she rendering services all by himself/herself or in conjunction with others (e.g. any
company in partnership with the provider should be highlighted);
• Liability: This point highlights who will be responsible for what between the service
provider and the client regarding services or products rendered;
• Entire agreement: The entire agreement should be clear and understandable to all parties
(no uncertainties in interpretation or any ambiguities in meaning);
• Applicable laws: All laws and/or regulations affecting the agreement should be
highlighted and adhered to by all parties to the agreement;
• Scope of agreement: Specify what the agreement will cover;
• Additional work: Indicate how additional work should be dealt with under the agreement;
• Notices: Period of notice that parties should serve should be highlighted; and
• Termination of services/products: Grounds on which termination of services/products will
be initiated by any party to agreement.
23
Service Level Agreements at petrol stations can be further enhanced if personnel or security
officers deployed there are trained in certain skills such as observation, reporting of
suspicious activity and/or persons, special characteristics of persons observed are
remembered – all as part of an integrated security measures/system.
2.5 OBSERVATION SKILLS
Observation skills refer to being able to observe specific areas, things or activities and to
remember such information for reporting purposes. Such information can form a very
powerful weapon against any kind of violent action by any perpetrator at a petrol station. One
does not need to fight an attacker; but one only needs to observe carefully. As part of a
Security Risk Management Model, these skills need to be taught to all petrol stations
employees. The kind of information when observing should refer to the following:
2.5.1 Reporting about persons
The following characteristics of observed persons (e.g. perpetrators at petrol stations) should
be noted so as to make them unique in order to fairly closely fit the description given about
them:
• Build (e.g. stout looking): Look at how persons are built,
• Race (e.g. black, white, Indian, coloured etc.): Race is often equated to skin colour, and as
an identifying feature this is a more relevant identifier.
• Age (e.g. about 19): By looking at a person one can estimate the age of that person;
• Sex (e.g. male): It is very important to differentiate whether the person was a male or a
female.
• Hair (e.g. straight, curly etc.): All persons have different kinds of hair. In order to be
accurate you need to observe that specifically. In addition, the colour of the hair is also
important, e.g. blonde, brown or shades of etc. ;
• Height (e.g. about 1. 7m): People are measured in metres;
24
• Scars (e.g. on the forehead): Another aspect making a person unique are scars anywhere
on the body, e.g. above the eye, on the chin and so on;
• Language (e.g. English): If the observed person/s speak(s) be sure to try and identify the
language spoken.
• Any other distinguishing features or characteristics that are different or can be used to
identify a person, e.g. left leg limp, or clothes worn, a watch, etc.
2.5.2 Reporting about vehicles
In the case of providing a description about a vehicle (that might have been used in
perpetrating a crime or as a getaway vehicle), the following characteristics and/or features
(details) should be looked for: registration numbers of a vehicle; make of the vehicle (e.g.
Toyota); model (e.g. Corolla) and year of manufacture of the vehicle (e.g. 2007); marks on
the vehicle (e.g. scratch on the front left door; bumper dent etc.); tints if applicable (e.g. all
windows tinted); from which direction the vehicle came from and in which direction the
vehicle departed (Fennelley, 2004: 73).
All such descriptions of vehicles used in crime at petrol stations should be communicated to
all employees so that they can be on the look out for the return of such ‘suspicious’ vehicles
in order to be able to report any criminal activity at petrol stations.
As a general rule, besides the information of persons and vehicles associated with any
observed criminal activity at a petrol station, any other objects used by perpetrators or
behaviour should also be noted for later description. Very importantly, employees need to
know that any suspicious object should never be handled but reported to the police
immediately.
25
2.6 CONTINGENCY PLAN
A ‘contingency plan’ refers to the actions that should be taken in case of unforeseen
situations. It is expected that petrol stations should have a contingency plan of the risks facing
them. According to Lombaard and Kole (2008: 191-194) actions to be taken after some of the
listed risks (in a Contingency Plan) occur would be as follows:
2.6.1 Suspicious looking objects
Employees would need to act as follows:
• Never touch or handle any suspicious looking object;
• Cordon off the immediate area where a suspicious object has been found;
• Inform immediate supervisor/manager of the finding of such object; and
• Try to identify exactly what the object is or looks like.
2.6.2 Suspicious looking persons
Employees need to do the following when observing suspicious looking and/or suspiciously
acting persons (and possibly recognising previous such persons/suspects):
• Do not panic;
• Remain vigilant;
• Inform security on site;
• Alert your colleague/supervisor/manager;
• Keep close observation at all times; and
• But above all petrol station employees should not attempt to arrest, detain or restrain
them on by themselves. This can only be done if a criminal or violent act is
perpetrated and then only with back-up of other persons (security personnel or police)
or by persons delegated for such a security/policing task.
2.6.3 Robbery/armed robbery/hostage situation
The following actions (by petrol station employees but also by customers and management
who might be caught up in the situation) should be taken in cases of robbery or armed
robbery or a hostage situation emanating from such criminal action:
• the attackers must be listened to and one should always do as they instruct you, i.e. do not
try to resist them. One should also never try to become a “hero”. Furthermore, do not
26
attempt to run away. Moreover, never do anything that will suggest to attackers that you
may retaliate. In other words do not antagonise them, they are already in a tense situation
and any action from the victim’s or bystanders side can trigger a violent reaction;
• As an conjunct to the above also never argue with the attackers;
• While not resisting or arguing with them one can at the same time keep a close watch of
everything going on, taking note of the perpetrators actions, features, clothes they are
wearing etc. , so that one would be able to give a clear description and valuable
information later to the police (e.g. vehicle, weapons used and persons themselves);
• One should try to remain calm at all times;
• If able to or the opportunity presents itself the panic alarm should be pressed;
• When shots are fired, take cover;
• If you any one is injured they will have to wait until help arrives (the situation is resolved
or the attackers flee); and
• If kidnapped one should ensure that a note is made of the registration number of vehicle/s
and the routes taken by the hostage takers.
2.6.4 Fire emergencies
The following actions should be taken in case of fire on the premises:
• Try to extinguish fire only if you can and if the fire is not too large;
• Inform your supervisor/manager;
• Contact fire marshals immediately;
• Raise an alarm;
• Cordon off the affected area;
• Alert all the tenants at the premises;
• Switch off the main electrical switch;
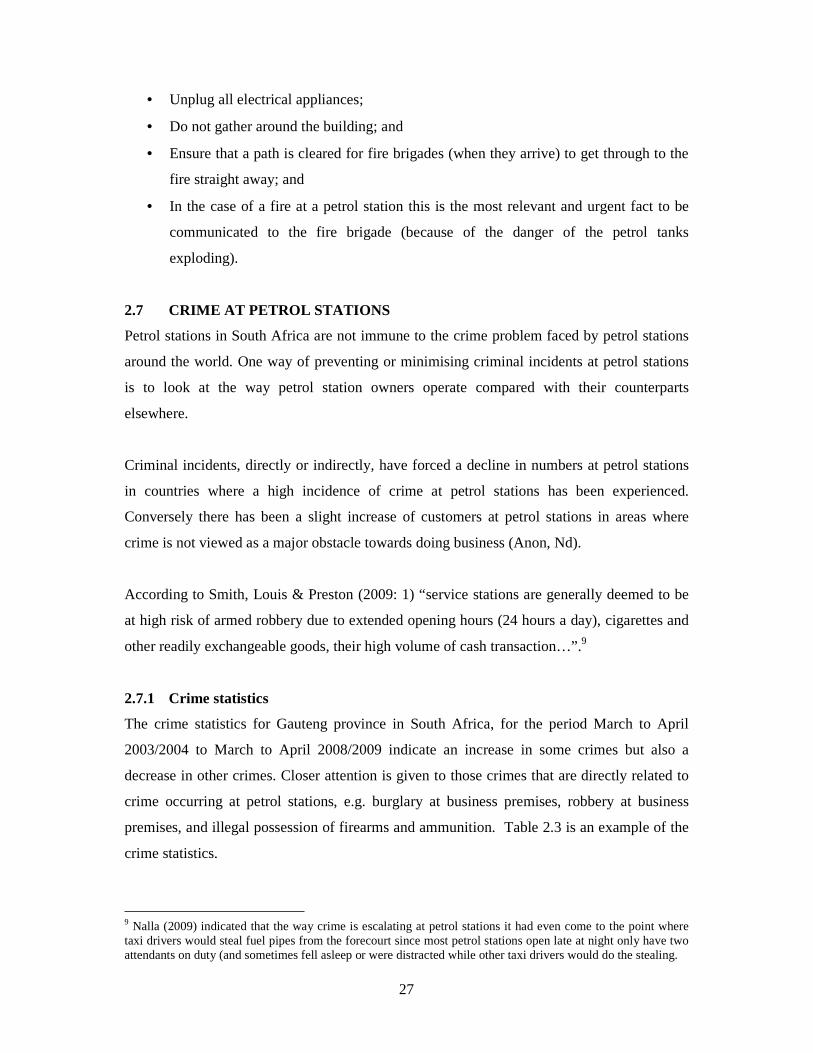
27
• Unplug all electrical appliances;
• Do not gather around the building; and
• Ensure that a path is cleared for fire brigades (when they arrive) to get through to the
fire straight away; and
• In the case of a fire at a petrol station this is the most relevant and urgent fact to be
communicated to the fire brigade (because of the danger of the petrol tanks
exploding).
2.7 CRIME AT PETROL STATIONS
Petrol stations in South Africa are not immune to the crime problem faced by petrol stations
around the world. One way of preventing or minimising criminal incidents at petrol stations
is to look at the way petrol station owners operate compared with their counterparts
elsewhere.
Criminal incidents, directly or indirectly, have forced a decline in numbers at petrol stations
in countries where a high incidence of crime at petrol stations has been experienced.
Conversely there has been a slight increase of customers at petrol stations in areas where
crime is not viewed as a major obstacle towards doing business (Anon, Nd).
According to Smith, Louis & Preston (2009: 1) “service stations are generally deemed to be
at high risk of armed robbery due to extended opening hours (24 hours a day), cigarettes and
other readily exchangeable goods, their high volume of cash transaction…”.9
2.7.1 Crime statistics
The crime statistics for Gauteng province in South Africa, for the period March to April
2003/2004 to March to April 2008/2009 indicate an increase in some crimes but also a
decrease in other crimes. Closer attention is given to those crimes that are directly related to
crime occurring at petrol stations, e.g. burglary at business premises, robbery at business
premises, and illegal possession of firearms and ammunition. Table 2.3 is an example of the
crime statistics.
9 Nalla (2009) indicated that the way crime is escalating at petrol stations it had even come to the point where taxi drivers would steal fuel pipes from the forecourt since most petrol stations open late at night only have two attendants on duty (and sometimes fell asleep or were distracted while other taxi drivers would do the stealing.
28
Figure 2.3: Crime in Gauteng Province from April to March: 2003/2004 – 2008/2009
Crime category April 2006 -
March 2007
April 2007 -
March 2008
April 2008 -
March 2009
Burglary at business premises 14 559 15 117 17 295
Robbery at business premises 4 492 5 098 6 216
Illegal possession of firearm and
ammunition
3 883 3 459 4 003
(SAPS, 2003/2004-2008/2009)
From this table it can be seen that these specific crimes have shown an increasing trend over
the reporting period. According to Visser (2009) crime in some areas may decrease in terms
of statistics but increase in terms of impact, for example. less armed robbery was committed
at petrol stations though more cash was taken.
2.7.2 Organised crime
According to Govender (2009), crime, including that committed at petrol stations in South
Africa and more specifically in Gauteng is generally committed by organised syndicates. In
addition, these syndicates may be operating from different areas, even outside the Gauteng
province.
While security is needed at petrol stations, it should be borne in mind that too much security
will be equal to no security because they will fail to serve their purpose effectively. There
will be loopholes as a result. This situation needs to be taken care of by petrol station
companies, franchisees and employees.
Govender’s own experience indicated that most crimes committed at petrol stations were
committed by people who knew the facility (site) very well. This means that there was a great
possibility that internal staff members were colluding with perpetrators in that regard. The
perpetrators were usually heavily armed with firearms (often AK-47s) and explosives while
they carry out these crimes at petrol stations. Petrol stations owners should therefore build
more trust with their employees, so that employees accept responsibility safety and security at
their work.
29
2.7.3 Effectiveness of police in dealing with crime at petrol stations
Govender (2009) went on to explain that the police are not effectively combating crime at
petrol stations. This is because of a lack of expertise on the side of police in handling
organised crime. In some instances, police do make an arrest but most of these cases (in
Govender’s experience) were not successfully prosecuted in court because by the time the
police had effected an arrest they had not followed basic policing/conventional methods from
the beginning. For example: arrest the suspect, get the statement from the suspect, witnesses,
obtain the evidence (properly), connect the suspect to the evidence (if collected), connect the
suspect to accomplices and arrest the accomplices.
Arrested suspects should be informed about their Constitutional rights to remain silent
(section 35 (b) (i) of the Constitution of the Republic of South Africa 108 of 1996), get
statements from them (accomplices) and then detain all the suspects.
Unfortunately, these constraints are an ever present problem within the context of the high
incidence of crime in South Africa. Allied to this, is the fact that SAPS detectives carry a
high volume of cases. This is much higher than the international norm of approximately 20
case dockets with anything from 80 to 140 being handled simultaneously by South African
detectives. With such a high number of cases detectives still need to make follow-ups on all
of their current cases in order to trace outstanding members of syndicates. Due to such a case
overload some detectives take the easy option of closing cases merely by stating ‘Undetected
– suspects/victims/witnesses can’t be found or traced or insufficient evidence’.
The law does not allow criminals to be detained for a longer period (other than the standard
48 hours) before being formally charged simply because there is a lack of evidence. There is
no provision in the law to keep them detained for longer than the maximum (two working
days) while the police try to find additional evidence and information on the specific crime,
without charging them. Suspects have the right to be timeously charged and granted bail if
the crime is not a serious one. The only way suspects can be kept in detention is if bail is
denied and the police then have to make comprehensive motivation that such suspects are a
‘flight risk’ or the violent nature of the crime, in such cases of poor investigation or
insufficient evidence been collected, these cases are withdrawn and then criminals are back
on streets doing crime again (Govender, 2009).
30
2.7.4 Financial impact of crime at petrol stations
Petrol stations continue to lose more money because of crime, while inexperienced detectives
move too fast towards using unconventional investigative methods at the expense of
conventional methods. Millions of taxpayers’ money tend to be lost or wasted because of the
ineffectiveness of the detectives investigating crimes at petrol stations and of not being in
possession of the necessary skills and know how. Visser (2009) indicated that petrol stations
are losing about R1 500 per month just as a result of internal theft/shrinkage. In the
2008/2009 financial year it was estimated by Visser (2009) that petrol stations lost about
R4m as a result of violent crimes.
Crime impacts negatively on petrol stations. Some franchisees sell their petrol stations
because they do not make the level of profit they expected because of crime losses. Others
close at night (high risk time) giving rise to reduced numbers of petrol attendants working at
night with those without night work at petrol stations becoming unemployed. Another impact
in terms of motorists are that they are being inconvenienced as they will not be able to access
facilities near them. Oil companies’ images are also are tarnished in the process.
According to Mr Peter Morgan, the Fuel Retail Association (FRA) CEO, 60% of petrol
station owners are in overdraft. The context example of this overdraft situation being that
where a petrol station owner/franchisee is, for instance, supplied with 34 000 litres of fuel for
which the operator had to pay on delivery an amount of R350 000. It takes on average
(medium-sized petrol station) a few days to get this amount of fuel sold (Brooks, 2008).
2.7.5 Public and private partnership in fighting crime
Fighting crime is not solely the responsibility of the state, i.e. the police. In the new
dispensation, the fight against crime is the responsibility of the Government as well as the
private sector, and citizens. One way of all role-players co-operating and working together is
by setting up a central information collection centre for the collecting, sharing and analysis of
crime information. This concept, the so-called ‘Fusion Centres’, originated in the USA, and
can serve as a model for any country. Fusion Centres in America were a joint initiative of the
Department of Justice and the Department of Homeland Security and were started with the
specific purpose of information-sharing by public and private institutions in order to combat
crime in the USA at community level.
31
Since their inception in 2008 relatively few have been set up, but the concept has in recent
times gained credence with more being established n the USA. Those that have become
operational in the USA are proving to be successful. Criticism of Fusion Centres is that some
people feel that they are only aimed at third parties (all organisations that are not formally
included in the government, e.g. political parties, educational institutions and so on).
A Fusion Centre is defined as a "collaborative effort of two or more agencies that provide
resources, expertise, and information to the centre with the goal of maximizing their ability to
detect, prevent, investigate, and respond to criminal and terrorist activity.” (Fusion Centres
Guidelines, 2006:2)
From the definition above, these agencies include:
• Department of Justice;
• Intelligence;
• Public police; and
• Private security (Fusion Centres Guidelines, 2006: 13)
Petrol stations, like other industries, are regulated by law in terms of licensing, costs for
operation and service standards (Petroleum Products Amendment Act, 2003). While Section
12 and Section 14 of the Occupational Health and Safety Act (1993), clearly binds both the
employer and the employee to work together in making it as reasonable as possible to achieve
a safe working environment. This indicates that issues threatening safety and security of
people at workplace should be brought to the attention of the employer immediately. One of
these issues could well be all petrol stations working together and providing information to a
dedicated ‘Petrol Station’ Fusion Centre which is similar to how the South African Banking
Risk Intelligence Centre (SABRIC) operates.
2.7.6 Garage cards at petrol stations
The use of garage (credit) cards is seen by some petrol stations as a means of reducing crime
at petrol stations. Garage cards have their own advantages to petrol station owners e.g. less
cash would be on the premises but also disadvantages for customers.
32
According to Laing (2009) one of the disadvantages for customers is that “unlike credit cards
garage cards charge customers transaction fees: R3 per fill up on credit card statement plus an
additional monthly fee of R7.40.” Moreover, ccustomers have argued that garage cards will
make them vulnerable to crime, as their information might get into the wrong hands and be
used against them. In some places ffraudsters fit “skimmers” to the chip and pin machines (at
petrol stations), sometimes with the knowledge of a petrol-station employee such a person
might be working together with a criminal syndicate), when he or she is distracted. These
devices read customers’ card details and allow the criminals to make counterfeit copies of the
garage cards. The chip cannot be cloned, but the criminals (fraudsters) can make use of the
counterfeited cards abroad in countries that have not adopted the “chip and pin” system
(Hussain, 2007).
In South Africa customers use garage credit cards, garage debit cards or business garage
credit cards. These cards have some benefits to customers, for e.g. can pay for fuel (diesel,
petrol or oil), spares, tollgate fees, repairs and maintenance costs. However, these cards can
only be used in South Africa. Individuals have to apply for these cards at their banking
institutions where specific criteria for opening them would be, amongst others, no
outstanding judgements against an individual, good credit record, sound cash income, fixed
employment (Nedbank, Nd).
2.7.7 Fleet cards
Apart from the garage cards mentioned above, fleet cards are also used for the payment of
fuel at petrol stations. They are mainly used by companies. This is a type of a card that has
the full information about the vehicle registration number and expiry date. Each issued card
to a company/business can only be used to fill up the specific vehicle to which it has been
allocated. Accordingly it is easy to match the vehicle being filled with fuel with the
registration number written on it. Only the vehicle assigned to it will be serviced accordingly
e.g. service, repairs, fuel filling and oil. Irregularities can therefore be easily detected if, for
example, it is used for filling any other vehicle (i.e. if it has been stolen or is being misused
by an employee). As a result of the checks embedded in such a card it is easy to manage but
criminals have stolen and do steal them or counterfeit them and then simply place false
number plates on a vehicle that correspond with the registration number indicated on the
card. To counteract this additional information is now being placed on the cards, e.g. colour
and make of vehicle and engine number (VIN) (Fleet Cards USA, 2009).
33
2.7.8 Card fraud
Cloned cards are mainly used to defraud customers. At one stage at one filling station, in
Alberton, south of Johannesburg, this was recognised at the petrol station. Police were called,
but when they arrived, the perpetrators had long left. It was discovered that about R70 000,
00 had already been withdrawn from the card (Izgorsek, 2009)
2.7.9 Role of staff in preventing crime at petrol stations
Petrol attendants should not blindly trust all customers unconditionally, especially when there
are reasonable grounds for suspicion. In one case a petrol attendant was approached by two
men in a Citi-Golf Volkswagen motor vehicle where the petrol cap had been replaced with a
piece of cloth.
The petrol attendant removed the cloth when filling the car to an amount of R200. 00. The
petrol was paid for with two hundred rand notes which subsequently turned out to be fakes.10
When asked about how that could have happened the petrol attendant explained that the
petrol cap was missing when he filled the car but that he had ‘trusted’ the men in the car even
though he did not know them or had not seen them before. He also said it is difficult to ask
customers for ‘pre-payment’ before filling the car with fuel since they become abusive
(Izgorsek, 2009).
Some garages have installed ultraviolet scanning machines that can pick up whether
banknotes are false (counterfeit) or not. But this can only be done after receiving the money
and the machines are inside the building at the cashier’s desk. More often than not such
fraudsters drive off as soon as they hand over the banknotes to a petrol attendant. However,
although the false notes are detected and the owner has to accept the loss, the identification of
false money so soon after the act of fraud points to the rationale for petrol station attendants
to be on the lookout for any suspicious behaviour, act or object and to be observant. In such
cases, the vehicle registration number and other details and description of the fraudsters
should be collected and reported (possibly to a future petrol station fusion centre) from where
it can be collected and disseminated to all petrol stations as a warning to be on the lookout for
the perpetrators in the future. When false money is detected, this must also be reported to the
10 According to Kardamey (2009), one of the measures to detect counterfeit banknotes is to install a ‘cameo’ safes, which not only rejects dirty money but also detects and rejects fake money.
34
police, so that they can follow the trail of false money as often the perpetrators pass such
false notes to businesses in the area of their operations as well.
2.7.10 Forecourt crime
In 2007, BP took it upon itself to reduce crime at its service stations as they had already
experienced 345 robberies at their branded petrol stations around the country. One of the
measures BP introduced was the payment for fuel by means of Visa or branded debit cards.
South African banks were willing to assist in this situation by giving a second credit card for
this to their clients who were eligible for them. This was the first move of that nature and
other brand garages/petrol stations watched very closely whether it would prove to be
successful or not. As a result of its implementation BP had to make debit card readers
available at their petrol station forecourts so that customers could swipe their debit cards.
This system was in fact instituted by BP at the time when the South African government had
as yet not authorised such action. 11 However, it was BP’s intention to make this system
applicable to all its petrol stations by the end of 2007 (Bhengu, 2007).
A year later, when BP undertook its evaluation of the success of introducing the debit card
system, it found that it had reduced the amount of cash transactions by R280m and as a result
this considerably reduced the vulnerability of their petrol stations to armed robberies (SAPA,
2008). Based on the apparent success of the BP debit card system the other garages followed
and instituted their own debit card systems (Laing, 2009).
There are some assets at petrol stations that criminal perpetrators specifically target. As a
result this makes petrol station sites and the employees/visitors vulnerable. The following
case emphasises this: On Monday, 7 August 2006, a security guard at a petrol station, who
was patrolling the area, when approaching robbers who were vandalising the ATM machine
by using chains to pull it out of the wall, was shot and killed (SAPA, 2008).
Petrol stations in Gauteng are so busy that they generate large cash flow volumes on a daily
basis. The researcher’s experience at petrol stations reflected that an average petrol station
can at least bring in about R70 000 a day during the week, and about R200 000 over
weekends (Friday until Monday morning).
11 However, BP had launched its debit card system after getting special permission from the Department of Minerals and Energy to do so. This permission was granted since because BP had paid a merchant’s fee.
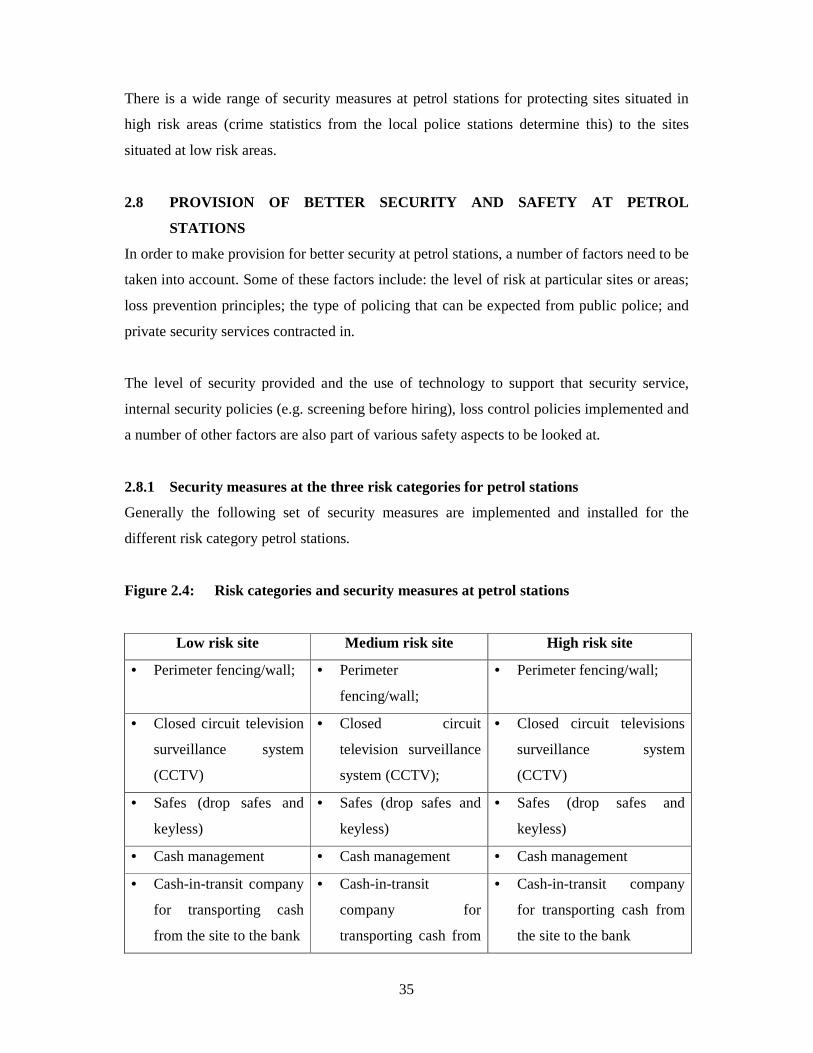
35
There is a wide range of security measures at petrol stations for protecting sites situated in
high risk areas (crime statistics from the local police stations determine this) to the sites
situated at low risk areas.
2.8 PROVISION OF BETTER SECURITY AND SAFETY AT PETR OL
STATIONS
In order to make provision for better security at petrol stations, a number of factors need to be
taken into account. Some of these factors include: the level of risk at particular sites or areas;
loss prevention principles; the type of policing that can be expected from public police; and
private security services contracted in.
The level of security provided and the use of technology to support that security service,
internal security policies (e.g. screening before hiring), loss control policies implemented and
a number of other factors are also part of various safety aspects to be looked at.
2.8.1 Security measures at the three risk categories for petrol stations
Generally the following set of security measures are implemented and installed for the
different risk category petrol stations.
Figure 2.4: Risk categories and security measures at petrol stations
Low risk site Medium risk site High risk site
• Perimeter fencing/wall; • Perimeter
fencing/wall;
• Perimeter fencing/wall;
• Closed circuit television
surveillance system
(CCTV)
• Closed circuit
television surveillance
system (CCTV);
• Closed circuit televisions
surveillance system
(CCTV)
• Safes (drop safes and
keyless)
• Safes (drop safes and
keyless)
• Safes (drop safes and
keyless)
• Cash management • Cash management • Cash management
• Cash-in-transit company
for transporting cash
from the site to the bank
• Cash-in-transit
company for
transporting cash from
• Cash-in-transit company
for transporting cash from
the site to the bank
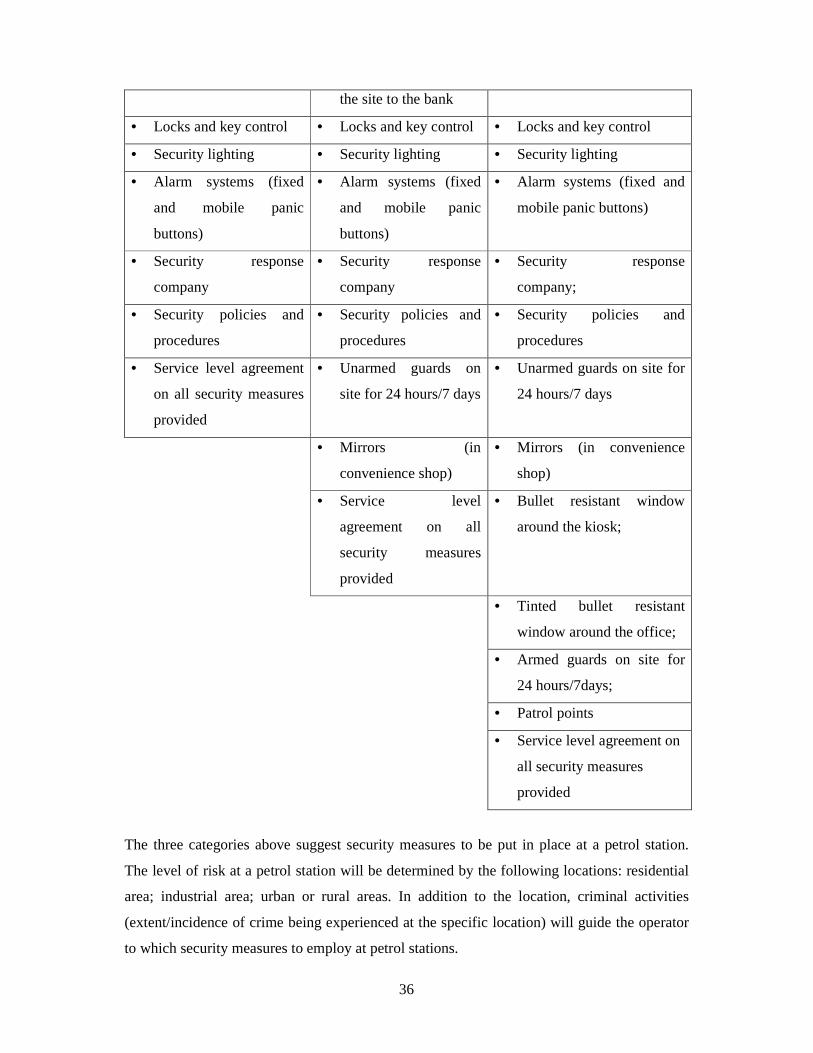
36
the site to the bank
• Locks and key control • Locks and key control • Locks and key control
• Security lighting • Security lighting • Security lighting
• Alarm systems (fixed
and mobile panic
buttons)
• Alarm systems (fixed
and mobile panic
buttons)
• Alarm systems (fixed and
mobile panic buttons)
• Security response
company
• Security response
company
• Security response
company;
• Security policies and
procedures
• Security policies and
procedures
• Security policies and
procedures
• Service level agreement
on all security measures
provided
• Unarmed guards on
site for 24 hours/7 days
• Unarmed guards on site for
24 hours/7 days
• Mirrors (in
convenience shop)
• Mirrors (in convenience
shop)
• Service level
agreement on all
security measures
provided
• Bullet resistant window
around the kiosk;
• Tinted bullet resistant
window around the office;
• Armed guards on site for
24 hours/7days;
• Patrol points
• Service level agreement on
all security measures
provided
The three categories above suggest security measures to be put in place at a petrol station.
The level of risk at a petrol station will be determined by the following locations: residential
area; industrial area; urban or rural areas. In addition to the location, criminal activities
(extent/incidence of crime being experienced at the specific location) will guide the operator
to which security measures to employ at petrol stations.
37
Some owners of petrol stations (oil companies/operators/franchisees) ignore or fail to
implement or make use of any of the above security measures until they become victims of
crime, for example, one may find at a certain petrol station site that there is no CCTV
surveillance system in place; no alarm system, and the operator/franchisee/employee transfers
large amounts of cash daily to the bank instead of outsourcing that task to a professional
cash-in-transit company. Outsourcing also sees to it that the cash will be insured by the
collecting company. Often the resulting losses are sustained due to a crime (as a consequence
of no or inadequate security measures), take the owner a long time to recover or may even
cause them to sell the petrol station in order to terminate crime risk completely.
According to the research conducted by Hadland (2002: 41-42) the following key issues were
recommended in terms of reducing crime risks at petrol stations:
Organisational (internal and external linkages)
• Improved communication amongst the oil companies in order to deal with crime facing
petrol stations;
• Improved relationship with the South African Police Services, Department of Justice and
National Prosecuting Authority.
Other risk and crime reduction suggestions emanating from Hadland’s research referred to
the workplace and conditions of work of petrol stations employees, namely:
• Developing a defined career path for petrol stations employees (employees will see
working at petrol stations as a long term career (loyalty built up) and not as a
temporary/casual form of work;
• Adherence to safety (and security) issues at all times;
• The setting of minimum working conditions for petrol station employees (looking after
the welfare of employees);

38
• Training petrol stations employees on security awareness and security procedures, e.g.
dealing with armed robbery situation and applying observation techniques (as outlined
previously);
• Petrol station management should be provided with management training in order to
manage their teams more effectively.
Furthermore, Hadland (2002) mentions in this context (making petrol stations safer working
sites) of making optimal use of technology and resources available in order to ensure the:
• Creation of an environment at petrol stations where cash is not kept; and
• Making use of low cost life insurance for the employees.
In terms of fulfilling all regulatory and/or legislation requirements the following steps should
be implemented, namely:
• Setting up of minimum safety standards at petrol stations, e.g. the prohibition of careless
cash handling, CCTV, signage and installing all required safety equipment, drop-safes
and their effective use.
• All legislative requirements should be met before allowing an operator to start running
business.
According to the researcher’s experience while working in the petrol station environment, not
all of or even some of Hadland’s valuable recommendations were adhered to by
owners/franchisees at the various brand petrol stations. Such lack of implementation or
adherence to the recommendations can pose a continuous risk of crime occurring at such a
petrol station. This risk is clearly evident by the continuing high number of attacks being
experienced at certain petrol stations.
39
Some of the problems of ‘drive-offs’12 at petrol stations, which are worldwide, can be
overcome by adopting a more workable means of making the payment. In the United
State/Canada in the urban areas where petrol stations have been identified as being in a high
risk area, the method of payment for fuel is before a customer pumps the fuel, while any cash
change will be collected by the customer at a bullet proof window (protecting the cashier)
(Wikipedia, Nd).
With the continued high incidence of crime at petrol stations the South African law
enforcement agencies have issued requests to owners of petrol stations to improve their
security equipment protecting their sites, e.g. the CCTV surveillance system. This came after
criminal cases were reported by petrol station owners but the existing surveillance system
which failed to detect or provide any concrete evidence (e.g. digital video footage that was
usable) of the criminal activity.
This can be confirmed from the researcher’s own experience during the time he was working
at petrol stations as a security co-ordinator. At some petrol stations one could hardly identify
or recognise a person from the CCTV footages and the police found it difficult to identify
suspects at all. None of this helped the State to prove any case against any suspect beyond
reasonable doubt.
Technological security measures (e.g. CCTV) are helpful to be used for improving security
and safety at petrol stations. However, these can also be used by perpetrators, in collusion
with the garage/petrol station employee/s. For example: a victim of garage credit card scam
had his/her money withdrawn from South Africa and Australia as a result of having used the
garage card at a specific petrol station. The victim knew of about 60 similar cases at that
particular petrol station. The victim was under the impression that it had been ‘safe’ to use
the card at this petrol station but the modus operandi of the criminals had been a hidden
camera pointed at the keypad at the cash point which made it possible for them to watch and
collect the information (PIN) as it was being inserted by the victim, while also scanning the
information on the card. It was realised that criminals were targeting petrol stations for
perpetrating such fraud because the petrol station sites, especially late at night were mainly
manned by one person dealing with many customers (Hussein, 2007).
12 When a customer fills up his/her vehicle and drives off without payment being made for the fuel purchase.
40
2.8.2 Loss or crime prevention
According to Tyska and Fennelly (2000: 171) crime prevention is defined as anticipation,
recognition, and appraisal of a crime risk and the initiation of some action to remove or
reduce it. This is why security measures are put in place to counteract security or crime
problems.
Tyska and Fennelly (2000: 172) further state that managing crime risks involves “removing
some risks entirely; reducing some risks by decreasing the extent to which injury or loss can
occur; spreading some risks through physical, electronic and procedural security measures
that deny, detect, delay or deter the criminal attack; transferring some risks through purchase
of insurance or involvement of other potential victims; and accepting some risks.”
2.8.3 Protection of petrol stations
Who should be responsible for the safety and security of citizens? Operators/dealers together
with their assets (e.g. properties, employees, etc.) are members of society and they all also
deserve protection from the state. The Constitution of the Republic of South Africa, Act 108
of 1996, clearly states that “the objectives of the police service are to prevent, combat and
investigate crime, to maintain public order, to protect and secure the inhabitants of the
Republic and their property, and to uphold and enforce the law”. According to Minnaar
(2007: 132) modern security requires that the security practitioners perform the tasks similar
to that of the police namely “managing security risks, (potential crime), risk (crime) profiling,
risk (crime) analysis (identifying vulnerabilities, risk reduction, investigating any breaches in
the provision of security and collecting information/intelligence as well as evidence of
breaches of security” which might be committed against the organisations and its assets
including the people, and in this case – petrol stations.
It is therefore the government’s responsibility to render some sort, at the very least, basic
level of protection to the citizens. However, if citizens want more than that they would
invariably have to pay for such services themselves (Goldstein, 2007). The South African
government has over the years admitted to the fact that it is not always able to deliver certain
services by itself and therefore it needs to go into public-private partnerships from the various
sectors throughout society (e.g. private security service providers) in order to fight crime. It is
because of this reason that a separate radio channel was created within the 10111 emergency
telephone number to be manned by a security officer (paid for by the private security industry

41
companies) who was to alert police of crime immediately should there be a need (often
business and residential alarm systems are only linked to a private control room and not
directly to the local police station. Accordingly, an alarm incident would first go through to a
private security company control room and it is these operators while responding would also
report it to the police – but only if it is a crime in progress since they first have to screen out
false alarms. It is because of these reasons, among others, that on 14 November 2008, a
Memorandum of Understanding (MoU) was entered into by South African Government and
private security industry and Standard Operational Procedures set in order to make these
issues which are mentioned more practical (Geldenhuys, nd).
2.8.4 Why prefer private security over public police?
Simonsen (1998: 79) lists the differences between private security and public security as the
following:
• Prevention: Private security prevent crime by physically being posted at the sites they
protect;
• General service: Private security render a wide range of services for which they are
employed (contracted/paid for) to perform for an organization;
• Proactive: Most of the times (usually 24/7 at a high risk site) private security officials are
visible and therefore deter would be criminals;
• Organization defined/specific: Private security officials only protect the organization or
their client based on the policies of that organization;
• Protect an organization: Private security have a mandate to protect the organization only
(which contracts them) and are not responsible for the entire society or anyone not on the
protected site/property;
• Private funding: Private security officials are paid from the monthly payments clients pay
in order to obtain such services. The owner of the private security organization will then
pay his/her employees.
42
2.8.5 Public police (law enforcement)
In contrast public law enforcement officials (e.g. police) carry out their duties in line with the
following points:
• Apprehension: They work towards arresting suspects;
• Prosecution: Collect sufficient evidence and develop a case which will secure a successful
prosecution of culprits in a court of law;
• Reactive: Police mainly respond to crimes committed;
• Statute defined: Police normally work according to the law;
• Protect a society: Police officers also have a mandate to ‘protect’ all members of the
public, rich or poor, young or old, black or white (the term ‘protect’ is very wide and can
be interpreted with an all-encompassing meaning or with a more narrow policing
interpretation, i.e. protection (making safe) is implied if general policing activities are
enforced);
• Tax supported: Police get paid by the State for doing their job with tax payers’ moneys.
Petrol stations operators should therefore take informed decisions as to where to invest in
safety and security services for the safety of their petrol station sites by taking into
consideration all the factors mentioned under the two bodies above that provide ‘protection,
safety and security’ services. Accordingly safety measures can be an integration and
combination of making use of both forms of protection.
2.8.6 Personnel policies for internal security
“The first line of internal security defence is the human resource department, where bad risks
can be screened out by use of reasonable security procedures. Screening is the process of
finding the person best qualified for the job in terms of both skills and personal integrity.”
(Fischer and Green 1998: 325). In this case study, petrol stations operators or dealers need to
take the initiative for better screening of employees before hiring them. If dishonest
employees are hired in any organisation they will definitely have a negative impact on the
business. Accordingly we can here talk about confidential information regarding important
43
processes at a petrol station leaking out, which at the very least can place the station in a very
vulnerable situation.
2.8.7 Loss control programme
According to Bottom and Kostanoski (1983: 93) loss countermeasures which are put in place
will only be part of a loss control program which is short term and loss control management
should form the second part of loss control. The latter should then be viewed as a long term
approach since it will seek to know where, how and when loss is being experienced and how
to manage the underlying (causative) factors. Bottom and Kostanoski (1983: 1-23) use the
acronym WAECUP (waste, accident, error, crime, unethical practices). These are different
types of losses that any organisation can suffer from, financially.
Taking every factor into consideration, all various risks will be covered and a specific
countermeasure suggested. With this in mind, one can follow the “proposed security
management model of petrol stations” and, surely, the loss control programme will be
controlled properly
2.8.8 Adding an extra “Eye/I” to CCTV at petrol stations
Fennelley (2004: 341) states that CCTV without being watched, somebody will always play a
reactive role but when somebody is continuously watching the CCTV it becomes proactive
and hence interactive security (I-CCTV). Fennelley goes on to say that the person monitoring
the CCTV system should have a means of communication with all other stakeholders e.g. two
way radios, monitoring stations and so on. As long as the surveillance system at petrol
stations does not play a proactive role it will be difficult to reduce crime or risks of crime
happening hence failing to fulfil the rationale of engaging technology at petrol stations.
Fennelley (2004: 341) defines interactive monitoring as having the ability to see, hear and
speak to a location in real time (while recording remotely) by a professional, with the ability
to analyse the situation and respond accordingly.
2.8.9 Suspicious behaviour
Fennelley (2004: 338) emphasised the fact that what needs to be reported immediately is a
suspicious behaviour not suspicious persons. Some signs of suspicious behaviour will include
but not limited to parking unusually for a longer time or near designated parking lot; entering
the store and not buying anything. Other factors include going back to the car; becoming
44
violent to the employees or customers; raising one’s voice or asking suspicious questions like
what nation are you.
2.8.10 Crime Prevention Through Environmental Design (CPTED)
Any category (CO-CO, CO-RO and RO-RO) of petrol station may benefit from the
application of Crime Prevention Through Environmental Design (CPTED). In terms of
CPTED it is important to look at the layout of the facility (petrol station) and factors around it
that will impact on security, for example, hills, rivers, natural forests, fences and roads. These
factors can be manipulated to suit the business environment, for example, cutting back the
natural forest to the required level to enable clear vision if an intruder approaches the facility
from the rear.
According to Ortmeier (2002:85) “Security and safety concepts are incorporated into the
planning of the facility or community. In conjunction with community programs, CPTED
may be applied to residential and business areas to increase public safety and reduce citizen
fear of crime”. Ortmeier (2002:85) goes on to say that poorly planned security promotes
crime instead of combating it.
2.8.11 Loss control and insurance
“Losses will always be with us. As security professionals we must control these losses and
minimize them” (Bottom & Kostanoski 1983: vii). This statement is very relevant to the
petrol station environment due to criminal incidents that take place and as a result causing
severe financial loss to these entities. A Loss Prevention Programme can entail a number of
different approaches inter alia having insurance cover.
Businesses will always be faced by challenges from crime or loss. It is for that reason that
business owners will need to have insurance to cover their businesses. Getting insurance
cover in business usually covers three categories of loss. The following categories may be
taken as cover:
• Crime insurance: this covers all crime-related losses. It is a known fact that this cover
would be ideal for petrol stations given the almost daily criminal attacks on them.
• Kidnap and ransom: this covers incidents where any member of staff is kidnapped and a
ransom needs to be paid. This, in most cases, applies to top management of an
45
organization where they and/or their family members would be kidnapped and they would
be expected to pay a ransom.
• Liability insurance: this refers to intentional or unintentional acts/omission or commission
of an act leading to injury and/or loss (damage). An owner would need such cover for
such unpredictable or unknown situations like floods or fire. (Bottom et al, 1983: 128).
Loss is better controlled when one has good security policies and procedures in place, which
are understood and followed properly by all employees. Security breaches of these policies
and procedures should be viewed seriously in that disciplinary procedures should apply to all
the members of staff who violate them. Franchisees should take a lead in making sure that a
detailed security program/plan is developed and maintained.
2.11 TYPE OF SENSITIVE INFORMATION MOST SOUGHT AFTE R AND USED
BY CRIMINALS IN ATTACKS ON PETROL STATIONS
According to the researcher’s own personal experience working in the petrol station industry,
the following information was found to be of critical importance and helpful to criminals
since they would always ask about it:
− key control procedures (they would normally want to know where are the keys to, for
example, a safe, manager’s office etc.);
− location of cash and the processes around it (where is cash on the premises and who
handles it and when, whether there is a drop-safe etc.);
− safes or strong rooms (how much money is kept in a safe);
− the busiest times at the petrol station (perpetrators would normally wish to know how
busy the station is, at what times, etc. as this information was an indication of when there
would be the most cash on hand i.e. optimal time to rob);
− key people involved in cash management (these would normally include internal and
external people);
46
− which C-I-T company working with the petrol station owner and information on such
aspects as delivery and collection methods;
− routes mainly used by C-I-T company (to perpetrators routes are very important because
they can utilize them to launch their attacks and plan their getaway);
− whereabouts of petrol station manager (when is the manager in and what he/she does
when at the station);
− whether an alarm system is installed, how it is operated and whether linked to a response
company (it is important for any perpetrator to know if the petrol station has an alarm
system and if so who responds (response company) to an alarm incident);
− installed CCTV surveillance system and its effectiveness (even if a CCTV surveillance
system is known by perpetrators to be protecting the premises most know that some of the
systems provide only poor footages. Information on the technical specifications and
quality of the system as a whole is also required by perpetrators. This is why perpetrators
would always ask how effective is the CCTV on the premises); and
− security arrangements during working hours and after hours (perpetrators, as well, would
like to work in a “safe-low risk environment” without being disturbed by anyone).
Such information assists perpetrators to plan more successfully when they strike a particular
petrol station, This points to the need for the screening of employees, the training of
employees to be trained in security awareness and observation and information collection
techniques, and to report and provide such information to security officers or police
investigators.
2.12 CONCLUSION
In this Chapter the Security Risk Management Model was dealt with in order to make one
well acquainted with the process of dealing with any security (crime) problem that might face
or be experienced by an organization/company. A more suitable model for petrol stations was
suggested by the researcher.
47
This is a well formulated and frequently applied model (in the security context of the South
African private security industry) that is easy to follow by security practitioners. It is
therefore strongly recommended that this model be understood by security practitioners and
any other person who need to apply such Security Risk Management Model in terms of the
implementation of specific security measures. In this study the researcher followed the model
(as developed and adapted by Rogers and Olckers) while conducting the collection of
research information, i.e. the crime problem was identified; a security survey was conducted,
risk analysis exercise was conducted; return on investments (by companies) on security
measures was looked at and recommendations (which will be highlighted in Chapter 4) on
security measures were formulated.
Petrol stations need such tips which should be made understandable to all members of staff,
not only security personnel because some petrol stations do not have any security personnel
on site. Furthermore, each individual petrol station’s Contingency Plan should be tested
regularly, since it will need to be followed in case of any emergency arising (be it fire,
disaster or crime).
A number of approaches in dealing with or providing better security were also discussed
within the context of crime at petrol stations. A brief summary of the type of information that
criminals try to obtain so that they can better plan a criminal attack on a petrol station was
provided. This links up to other measures such as observation skills that are needed to reduce
the current levels of crime being perpetrated at petrol station sites. Overall the context of
petrol station crime was sketched which provided the framework for the actual research
undertaken in this study as well as providing the context for the findings and
recommendations. The research findings will be dealt with in more detail in the next chapter.
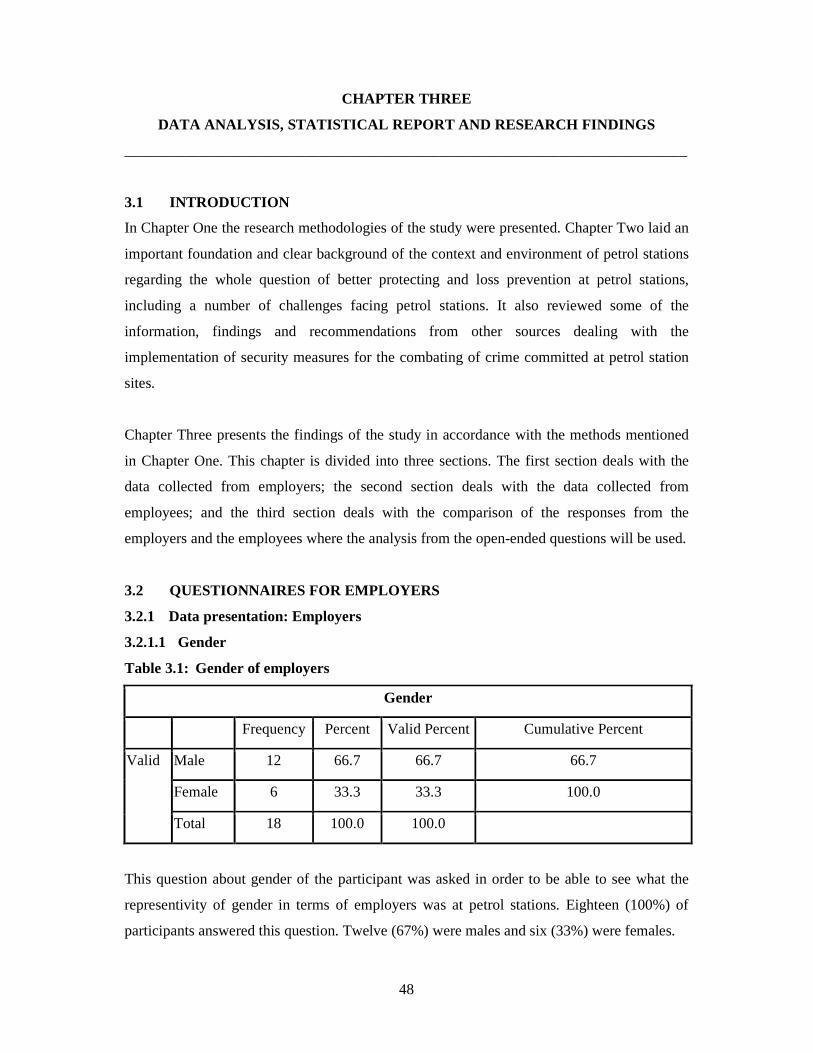
48
CHAPTER THREE
DATA ANALYSIS, STATISTICAL REPORT AND RESEARCH FIND INGS
___________________________________________________________________________
3.1 INTRODUCTION
In Chapter One the research methodologies of the study were presented. Chapter Two laid an
important foundation and clear background of the context and environment of petrol stations
regarding the whole question of better protecting and loss prevention at petrol stations,
including a number of challenges facing petrol stations. It also reviewed some of the
information, findings and recommendations from other sources dealing with the
implementation of security measures for the combating of crime committed at petrol station
sites.
Chapter Three presents the findings of the study in accordance with the methods mentioned
in Chapter One. This chapter is divided into three sections. The first section deals with the
data collected from employers; the second section deals with the data collected from
employees; and the third section deals with the comparison of the responses from the
employers and the employees where the analysis from the open-ended questions will be used.
3.2 QUESTIONNAIRES FOR EMPLOYERS
3.2.1 Data presentation: Employers
3.2.1.1 Gender
Table 3.1: Gender of employers
Gender
Frequency Percent Valid Percent Cumulative Percent
Valid Male 12 66.7 66.7 66.7
Female 6 33.3 33.3 100.0
Total 18 100.0 100.0
This question about gender of the participant was asked in order to be able to see what the
representivity of gender in terms of employers was at petrol stations. Eighteen (100%) of
participants answered this question. Twelve (67%) were males and six (33%) were females.
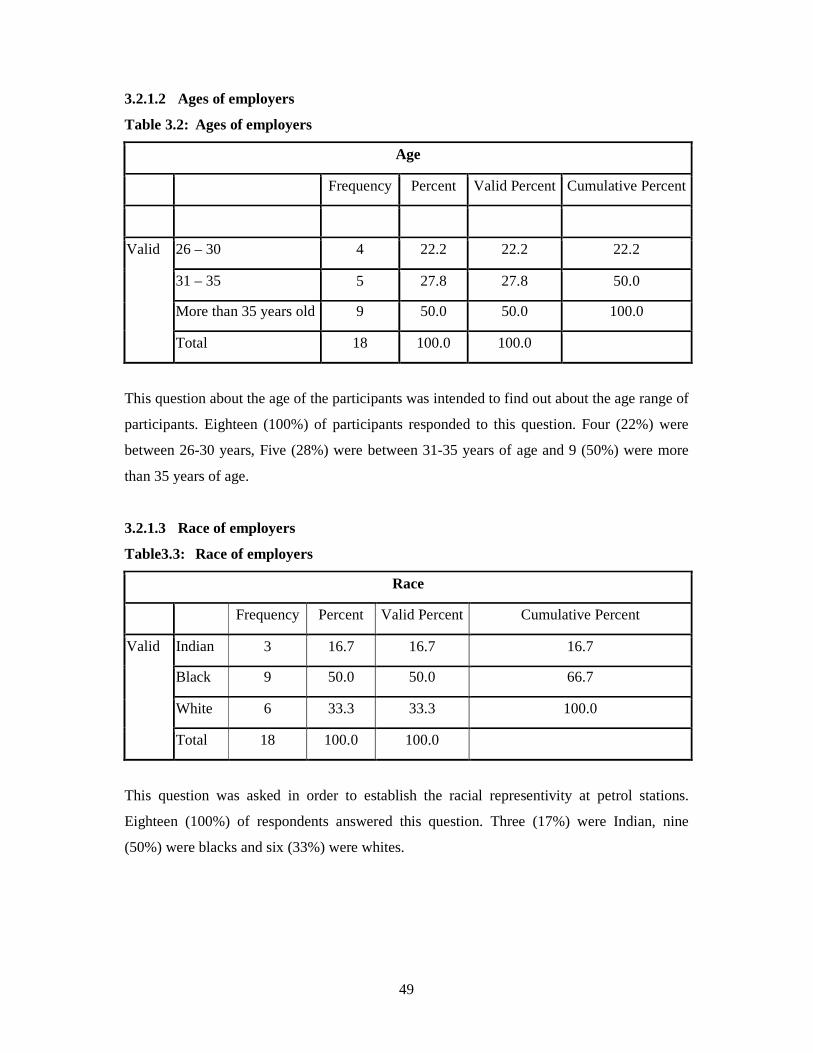
49
3.2.1.2 Ages of employers
Table 3.2: Ages of employers
Age
Frequency Percent Valid Percent Cumulative Percent
Valid 26 – 30 4 22.2 22.2 22.2
31 – 35 5 27.8 27.8 50.0
More than 35 years old 9 50.0 50.0 100.0
Total 18 100.0 100.0
This question about the age of the participants was intended to find out about the age range of
participants. Eighteen (100%) of participants responded to this question. Four (22%) were
between 26-30 years, Five (28%) were between 31-35 years of age and 9 (50%) were more
than 35 years of age.
3.2.1.3 Race of employers
Table3.3: Race of employers
Race
Frequency Percent Valid Percent Cumulative Percent
Valid Indian 3 16.7 16.7 16.7
Black 9 50.0 50.0 66.7
White 6 33.3 33.3 100.0
Total 18 100.0 100.0
This question was asked in order to establish the racial representivity at petrol stations.
Eighteen (100%) of respondents answered this question. Three (17%) were Indian, nine
(50%) were blacks and six (33%) were whites.
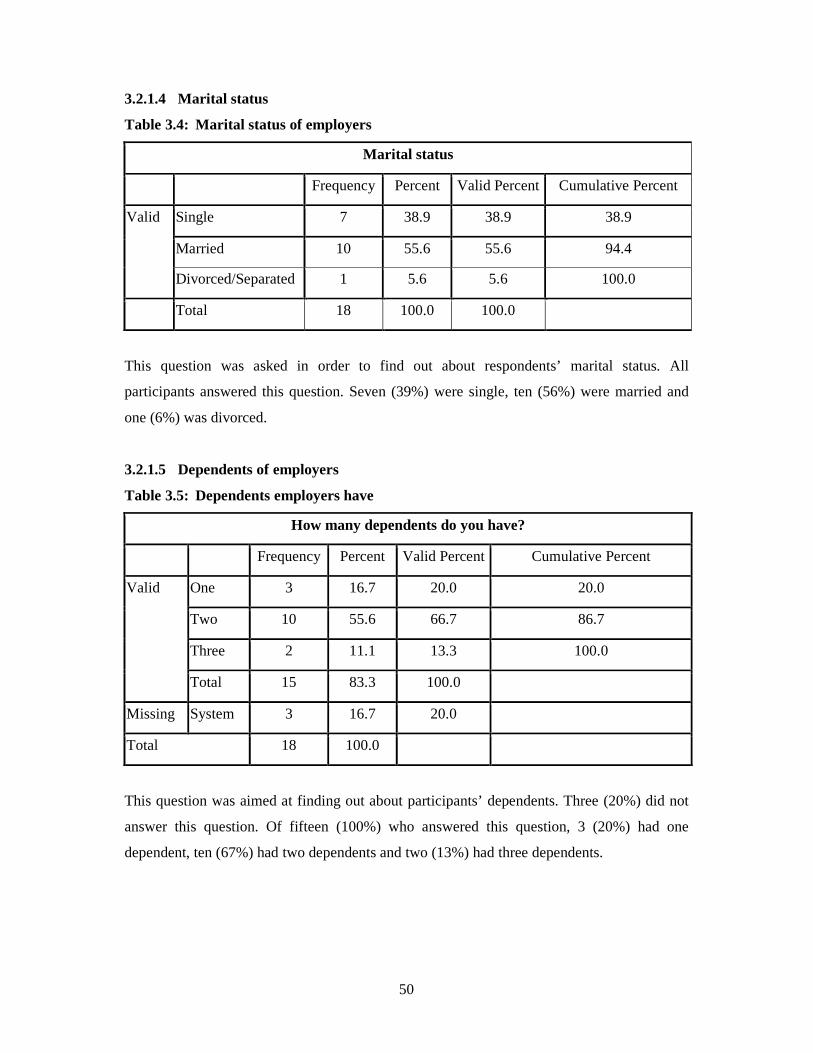
50
3.2.1.4 Marital status
Table 3.4: Marital status of employers
Marital status
Frequency Percent Valid Percent Cumulative Percent
Valid Single 7 38.9 38.9 38.9
Married 10 55.6 55.6 94.4
Divorced/Separated 1 5.6 5.6 100.0
Total 18 100.0 100.0
This question was asked in order to find out about respondents’ marital status. All
participants answered this question. Seven (39%) were single, ten (56%) were married and
one (6%) was divorced.
3.2.1.5 Dependents of employers
Table 3.5: Dependents employers have
How many dependents do you have?
Frequency Percent Valid Percent Cumulative Percent
Valid One 3 16.7 20.0 20.0
Two 10 55.6 66.7 86.7
Three 2 11.1 13.3 100.0
Total 15 83.3 100.0
Missing System 3 16.7 20.0
Total 18 100.0
This question was aimed at finding out about participants’ dependents. Three (20%) did not
answer this question. Of fifteen (100%) who answered this question, 3 (20%) had one
dependent, ten (67%) had two dependents and two (13%) had three dependents.
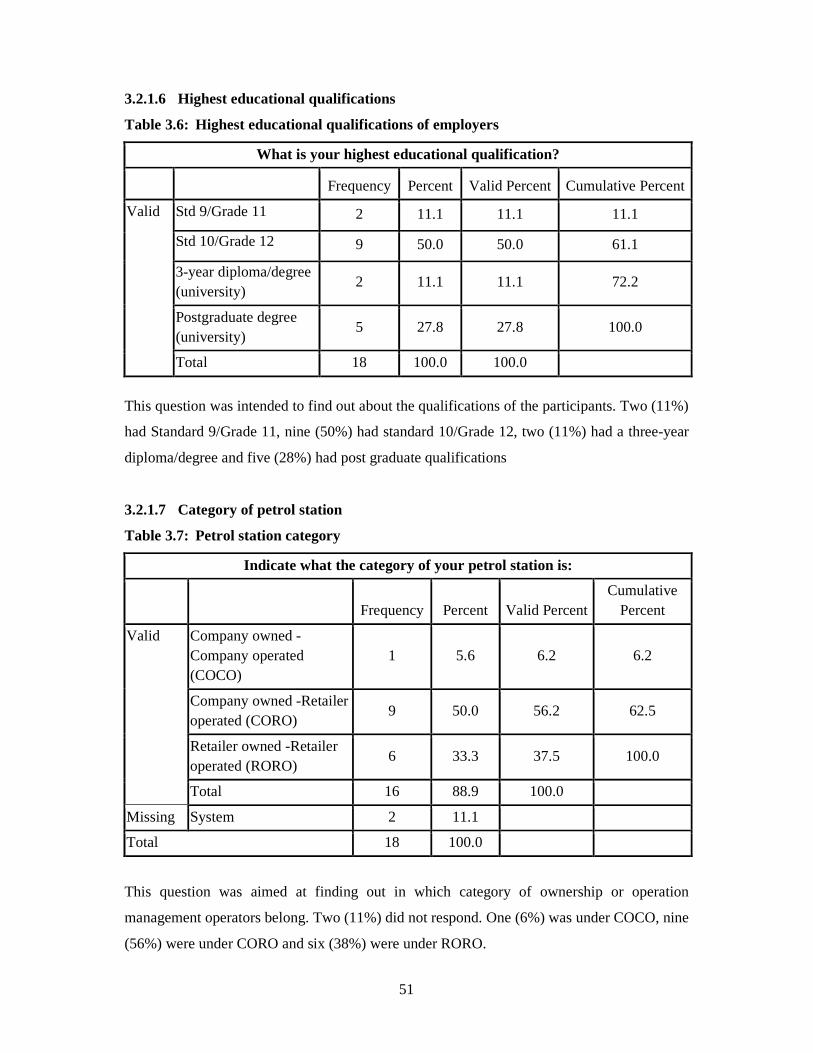
51
3.2.1.6 Highest educational qualifications
Table 3.6: Highest educational qualifications of employers
What is your highest educational qualification?
Frequency Percent Valid Percent Cumulative Percent
Valid Std 9/Grade 11 2 11.1 11.1 11.1
Std 10/Grade 12 9 50.0 50.0 61.1
3-year diploma/degree (university)
2 11.1 11.1 72.2
Postgraduate degree (university)
5 27.8 27.8 100.0
Total 18 100.0 100.0
This question was intended to find out about the qualifications of the participants. Two (11%)
had Standard 9/Grade 11, nine (50%) had standard 10/Grade 12, two (11%) had a three-year
diploma/degree and five (28%) had post graduate qualifications
3.2.1.7 Category of petrol station
Table 3.7: Petrol station category
Indicate what the category of your petrol station is:
Frequency Percent Valid Percent
Cumulative Percent
Valid Company owned -Company operated (COCO)
1 5.6 6.2 6.2
Company owned -Retailer operated (CORO)
9 50.0 56.2 62.5
Retailer owned -Retailer operated (RORO)
6 33.3 37.5 100.0
Total 16 88.9 100.0
Missing System 2 11.1
Total 18 100.0
This question was aimed at finding out in which category of ownership or operation
management operators belong. Two (11%) did not respond. One (6%) was under COCO, nine
(56%) were under CORO and six (38%) were under RORO.
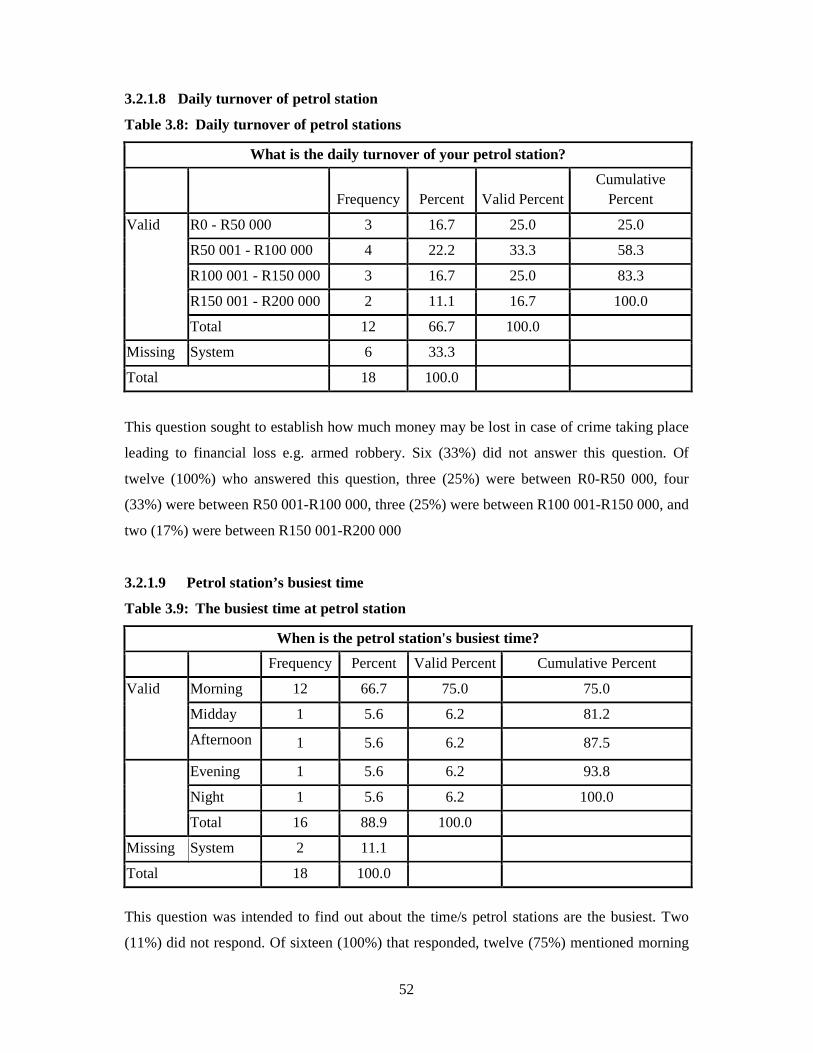
52
3.2.1.8 Daily turnover of petrol station
Table 3.8: Daily turnover of petrol stations
What is the daily turnover of your petrol station?
Frequency Percent Valid Percent
Cumulative Percent
Valid R0 - R50 000 3 16.7 25.0 25.0
R50 001 - R100 000 4 22.2 33.3 58.3
R100 001 - R150 000 3 16.7 25.0 83.3
R150 001 - R200 000 2 11.1 16.7 100.0
Total 12 66.7 100.0
Missing System 6 33.3
Total 18 100.0
This question sought to establish how much money may be lost in case of crime taking place
leading to financial loss e.g. armed robbery. Six (33%) did not answer this question. Of
twelve (100%) who answered this question, three (25%) were between R0-R50 000, four
(33%) were between R50 001-R100 000, three (25%) were between R100 001-R150 000, and
two (17%) were between R150 001-R200 000
3.2.1.9 Petrol station’s busiest time
Table 3.9: The busiest time at petrol station
When is the petrol station's busiest time?
Frequency Percent Valid Percent Cumulative Percent
Valid Morning 12 66.7 75.0 75.0
Midday 1 5.6 6.2 81.2
Afternoon 1 5.6 6.2 87.5
Evening 1 5.6 6.2 93.8
Night 1 5.6 6.2 100.0
Total 16 88.9 100.0
Missing System 2 11.1
Total 18 100.0
This question was intended to find out about the time/s petrol stations are the busiest. Two
(11%) did not respond. Of sixteen (100%) that responded, twelve (75%) mentioned morning
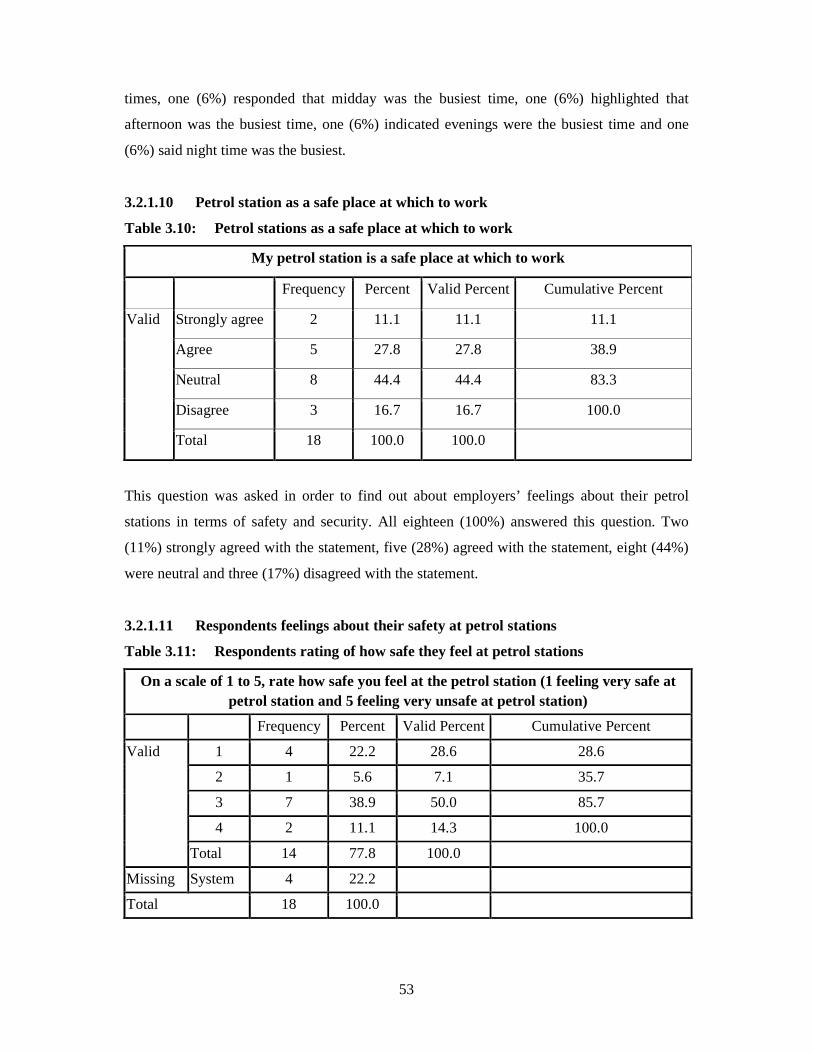
53
times, one (6%) responded that midday was the busiest time, one (6%) highlighted that
afternoon was the busiest time, one (6%) indicated evenings were the busiest time and one
(6%) said night time was the busiest.
3.2.1.10 Petrol station as a safe place at which to work
Table 3.10: Petrol stations as a safe place at which to work
My petrol station is a safe place at which to work
Frequency Percent Valid Percent Cumulative Percent
Valid Strongly agree 2 11.1 11.1 11.1
Agree 5 27.8 27.8 38.9
Neutral 8 44.4 44.4 83.3
Disagree 3 16.7 16.7 100.0
Total 18 100.0 100.0
This question was asked in order to find out about employers’ feelings about their petrol
stations in terms of safety and security. All eighteen (100%) answered this question. Two
(11%) strongly agreed with the statement, five (28%) agreed with the statement, eight (44%)
were neutral and three (17%) disagreed with the statement.
3.2.1.11 Respondents feelings about their safety at petrol stations
Table 3.11: Respondents rating of how safe they feel at petrol stations
On a scale of 1 to 5, rate how safe you feel at the petrol station (1 feeling very safe at petrol station and 5 feeling very unsafe at petrol station)
Frequency Percent Valid Percent Cumulative Percent
Valid 1 4 22.2 28.6 28.6
2 1 5.6 7.1 35.7
3 7 38.9 50.0 85.7
4 2 11.1 14.3 100.0
Total 14 77.8 100.0
Missing System 4 22.2
Total 18 100.0
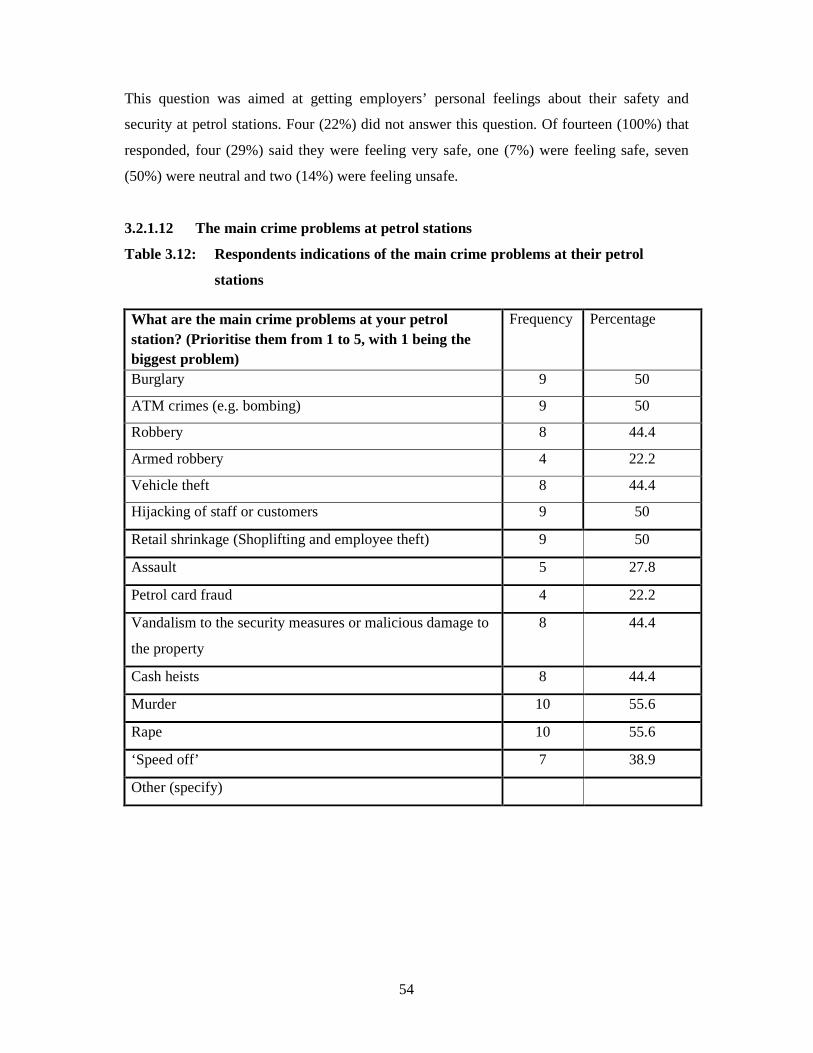
54
This question was aimed at getting employers’ personal feelings about their safety and
security at petrol stations. Four (22%) did not answer this question. Of fourteen (100%) that
responded, four (29%) said they were feeling very safe, one (7%) were feeling safe, seven
(50%) were neutral and two (14%) were feeling unsafe.
3.2.1.12 The main crime problems at petrol stations
Table 3.12: Respondents indications of the main crime problems at their petrol
stations
What are the main crime problems at your petrol station? (Prioritise them from 1 to 5, with 1 being the biggest problem)
Frequency Percentage
Burglary 9 50
ATM crimes (e.g. bombing) 9 50
Robbery 8 44.4
Armed robbery 4 22.2
Vehicle theft 8 44.4
Hijacking of staff or customers 9 50
Retail shrinkage (Shoplifting and employee theft) 9 50
Assault 5 27.8
Petrol card fraud 4 22.2
Vandalism to the security measures or malicious damage to
the property
8 44.4
Cash heists 8 44.4
Murder 10 55.6
Rape 10 55.6
‘Speed off’ 7 38.9
Other (specify)
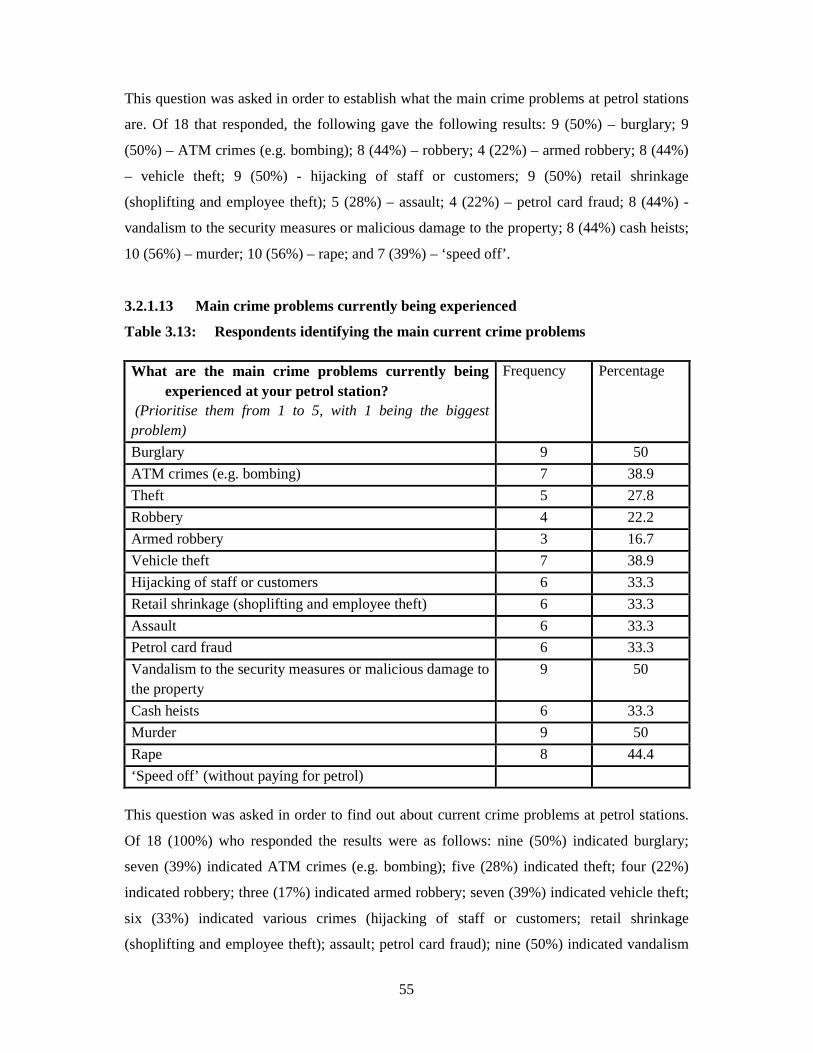
55
This question was asked in order to establish what the main crime problems at petrol stations
are. Of 18 that responded, the following gave the following results: 9 (50%) – burglary; 9
(50%) – ATM crimes (e.g. bombing); 8 (44%) – robbery; 4 (22%) – armed robbery; 8 (44%)
– vehicle theft; 9 (50%) - hijacking of staff or customers; 9 (50%) retail shrinkage
(shoplifting and employee theft); 5 (28%) – assault; 4 (22%) – petrol card fraud; 8 (44%) -
vandalism to the security measures or malicious damage to the property; 8 (44%) cash heists;
10 (56%) – murder; 10 (56%) – rape; and 7 (39%) – ‘speed off’.
3.2.1.13 Main crime problems currently being experienced
Table 3.13: Respondents identifying the main current crime problems
This question was asked in order to find out about current crime problems at petrol stations.
Of 18 (100%) who responded the results were as follows: nine (50%) indicated burglary;
seven (39%) indicated ATM crimes (e.g. bombing); five (28%) indicated theft; four (22%)
indicated robbery; three (17%) indicated armed robbery; seven (39%) indicated vehicle theft;
six (33%) indicated various crimes (hijacking of staff or customers; retail shrinkage
(shoplifting and employee theft); assault; petrol card fraud); nine (50%) indicated vandalism
What are the main crime problems currently being experienced at your petrol station?
(Prioritise them from 1 to 5, with 1 being the biggest problem)
Frequency Percentage
Burglary 9 50
ATM crimes (e.g. bombing) 7 38.9
Theft 5 27.8
Robbery 4 22.2
Armed robbery 3 16.7
Vehicle theft 7 38.9
Hijacking of staff or customers 6 33.3
Retail shrinkage (shoplifting and employee theft) 6 33.3
Assault 6 33.3
Petrol card fraud 6 33.3
Vandalism to the security measures or malicious damage to the property
9 50
Cash heists 6 33.3
Murder 9 50
Rape 8 44.4
‘Speed off’ (without paying for petrol)

56
to the security measures or malicious damage to the property; six (33%) indicated cash heists;
nine (50%) indicated murder and eight (44%) indicated rape.
3.2.1.14 Management participating in community police forum.
Table 3.14: Management’s participation in community police forum in a view of
reducing crime at petrol station
Crime at a petrol station can be reduced if management participates in local community police forum (CPF)
Frequency Percent Valid Percent Cumulative Percent
Valid Strongly agree 6 33.3 33.3 33.3
Agree 8 44.4 44.4 77.8
Neutral 2 11.1 11.1 88.9
Disagree 2 11.1 11.1 100.0
Total 18 100.0 100.0
This question was aimed at finding out about the feelings of employers about community
police forum (CPF). All respondents (100%) answered this question. Six (33%) strongly
agreed with the statement, eight (44%) agreed with the statement, two (11%) were neutral
and 2 (11%) disagreed with the statement.
3.2.1.15 Participation in local projects
Table 3.15: Petrol station management participating in local projects
Participation in local projects by petrol station management as part of their social
responsibility (community upliftment) helps reduce crime at petrol stations
Frequency Percent Valid Percent Cumulative Percent
Valid Strongly agree 4 22.2 22.2 22.2
Agree 9 50.0 50.0 72.2
Neutral 3 16.7 16.7 88.9
Disagree 2 11.1 11.1 100.0
Total 18 100.0 100.0
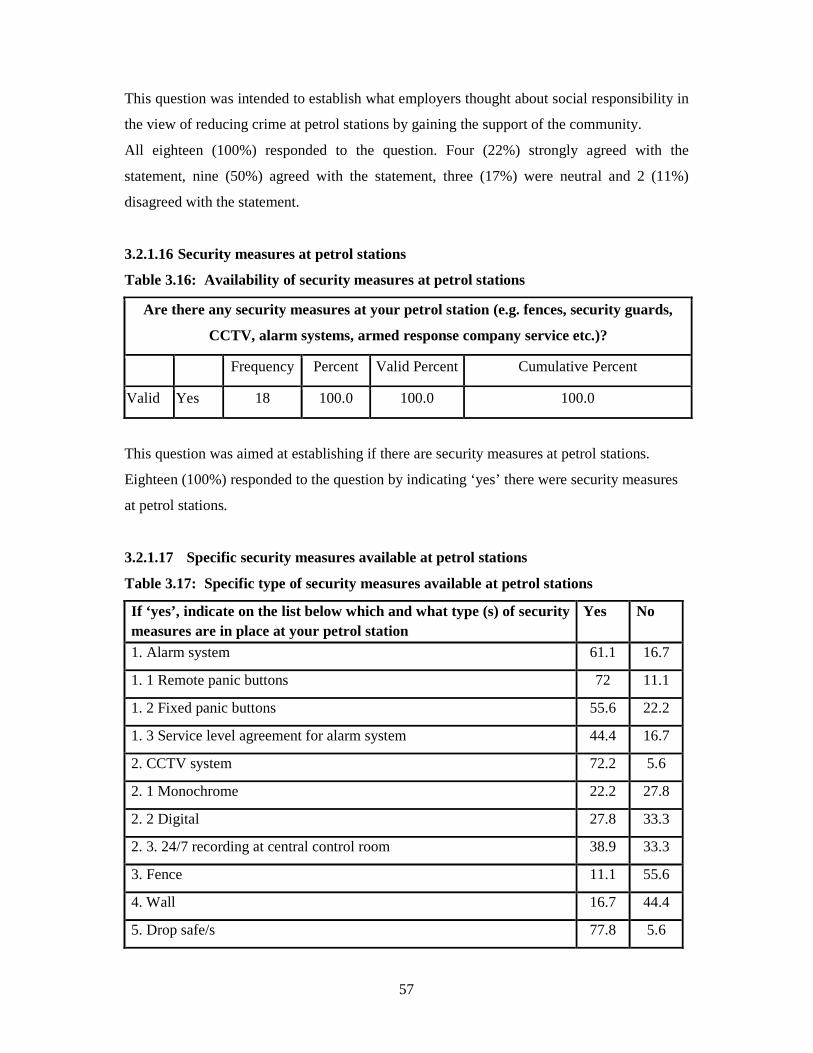
57
This question was intended to establish what employers thought about social responsibility in
the view of reducing crime at petrol stations by gaining the support of the community.
All eighteen (100%) responded to the question. Four (22%) strongly agreed with the
statement, nine (50%) agreed with the statement, three (17%) were neutral and 2 (11%)
disagreed with the statement.
3.2.1.16 Security measures at petrol stations
Table 3.16: Availability of security measures at petrol stations
Are there any security measures at your petrol station (e.g. fences, security guards,
CCTV, alarm systems, armed response company service etc.)?
Frequency Percent Valid Percent Cumulative Percent
Valid Yes 18 100.0 100.0 100.0
This question was aimed at establishing if there are security measures at petrol stations.
Eighteen (100%) responded to the question by indicating ‘yes’ there were security measures
at petrol stations.
3.2.1.17 Specific security measures available at petrol stations
Table 3.17: Specific type of security measures available at petrol stations
If ‘yes’, indicate on the list below which and what type (s) of security measures are in place at your petrol station
Yes No
1. Alarm system 61.1 16.7
1. 1 Remote panic buttons 72 11.1
1. 2 Fixed panic buttons 55.6 22.2
1. 3 Service level agreement for alarm system 44.4 16.7
2. CCTV system 72.2 5.6
2. 1 Monochrome 22.2 27.8
2. 2 Digital 27.8 33.3
2. 3. 24/7 recording at central control room 38.9 33.3
3. Fence 11.1 55.6
4. Wall 16.7 44.4
5. Drop safe/s 77.8 5.6
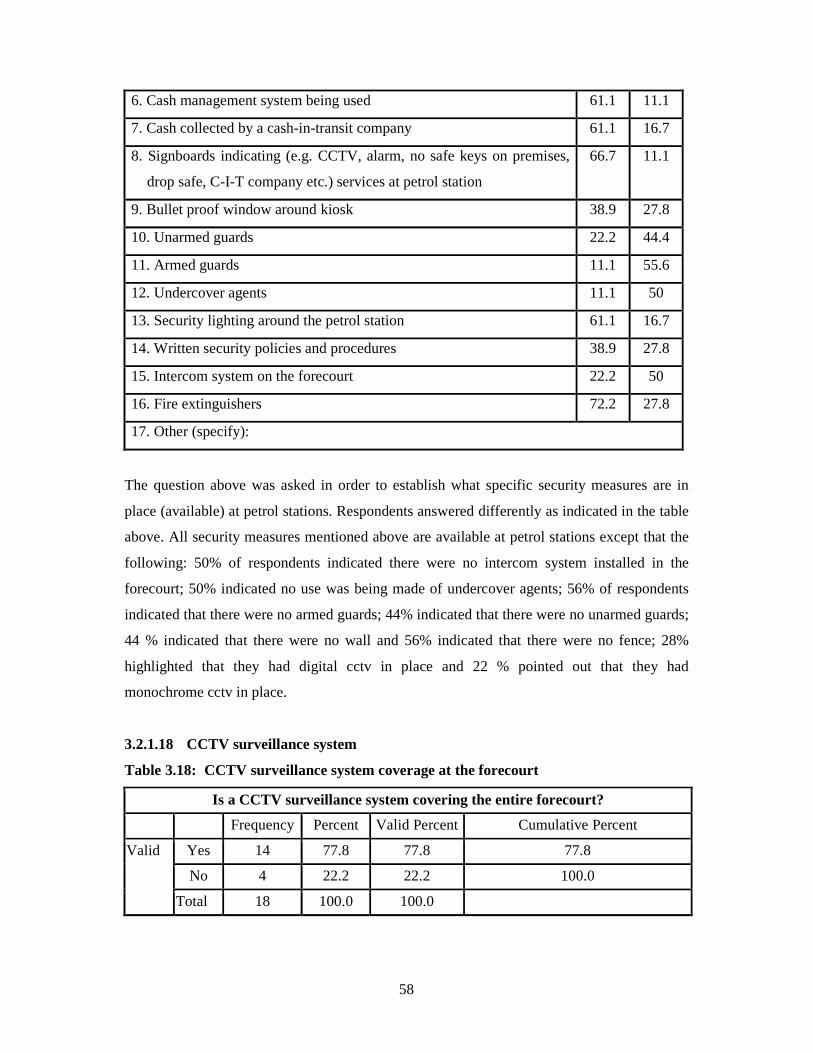
58
6. Cash management system being used 61.1 11.1
7. Cash collected by a cash-in-transit company 61.1 16.7
8. Signboards indicating (e.g. CCTV, alarm, no safe keys on premises,
drop safe, C-I-T company etc.) services at petrol station
66.7 11.1
9. Bullet proof window around kiosk 38.9 27.8
10. Unarmed guards 22.2 44.4
11. Armed guards 11.1 55.6
12. Undercover agents 11.1 50
13. Security lighting around the petrol station 61.1 16.7
14. Written security policies and procedures 38.9 27.8
15. Intercom system on the forecourt 22.2 50
16. Fire extinguishers 72.2 27.8
17. Other (specify):
The question above was asked in order to establish what specific security measures are in
place (available) at petrol stations. Respondents answered differently as indicated in the table
above. All security measures mentioned above are available at petrol stations except that the
following: 50% of respondents indicated there were no intercom system installed in the
forecourt; 50% indicated no use was being made of undercover agents; 56% of respondents
indicated that there were no armed guards; 44% indicated that there were no unarmed guards;
44 % indicated that there were no wall and 56% indicated that there were no fence; 28%
highlighted that they had digital cctv in place and 22 % pointed out that they had
monochrome cctv in place.
3.2.1.18 CCTV surveillance system
Table 3.18: CCTV surveillance system coverage at the forecourt
Is a CCTV surveillance system covering the entire forecourt?
Frequency Percent Valid Percent Cumulative Percent
Valid Yes 14 77.8 77.8 77.8
No 4 22.2 22.2 100.0
Total 18 100.0 100.0
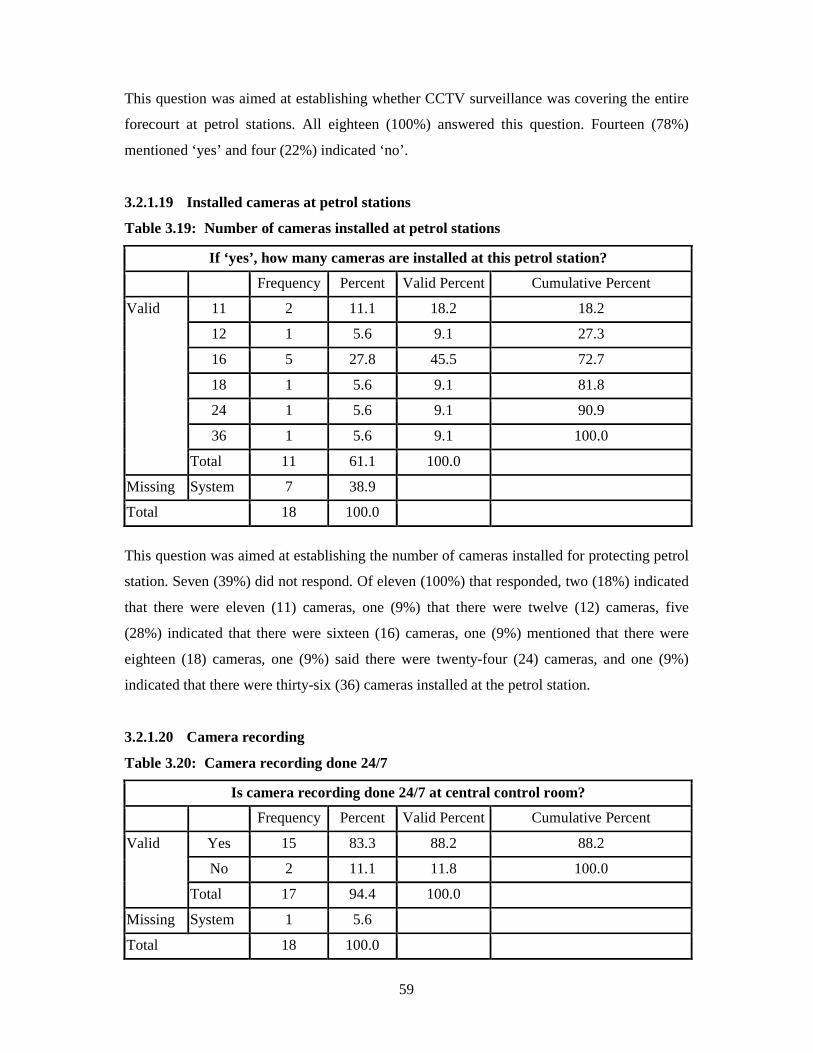
59
This question was aimed at establishing whether CCTV surveillance was covering the entire
forecourt at petrol stations. All eighteen (100%) answered this question. Fourteen (78%)
mentioned ‘yes’ and four (22%) indicated ‘no’.
3.2.1.19 Installed cameras at petrol stations
Table 3.19: Number of cameras installed at petrol stations
If ‘yes’, how many cameras are installed at this petrol station?
Frequency Percent Valid Percent Cumulative Percent
Valid 11 2 11.1 18.2 18.2
12 1 5.6 9.1 27.3
16 5 27.8 45.5 72.7
18 1 5.6 9.1 81.8
24 1 5.6 9.1 90.9
36 1 5.6 9.1 100.0
Total 11 61.1 100.0
Missing System 7 38.9
Total 18 100.0
This question was aimed at establishing the number of cameras installed for protecting petrol
station. Seven (39%) did not respond. Of eleven (100%) that responded, two (18%) indicated
that there were eleven (11) cameras, one (9%) that there were twelve (12) cameras, five
(28%) indicated that there were sixteen (16) cameras, one (9%) mentioned that there were
eighteen (18) cameras, one (9%) said there were twenty-four (24) cameras, and one (9%)
indicated that there were thirty-six (36) cameras installed at the petrol station.
3.2.1.20 Camera recording
Table 3.20: Camera recording done 24/7
Is camera recording done 24/7 at central control room?
Frequency Percent Valid Percent Cumulative Percent
Valid Yes 15 83.3 88.2 88.2
No 2 11.1 11.8 100.0
Total 17 94.4 100.0
Missing System 1 5.6
Total 18 100.0
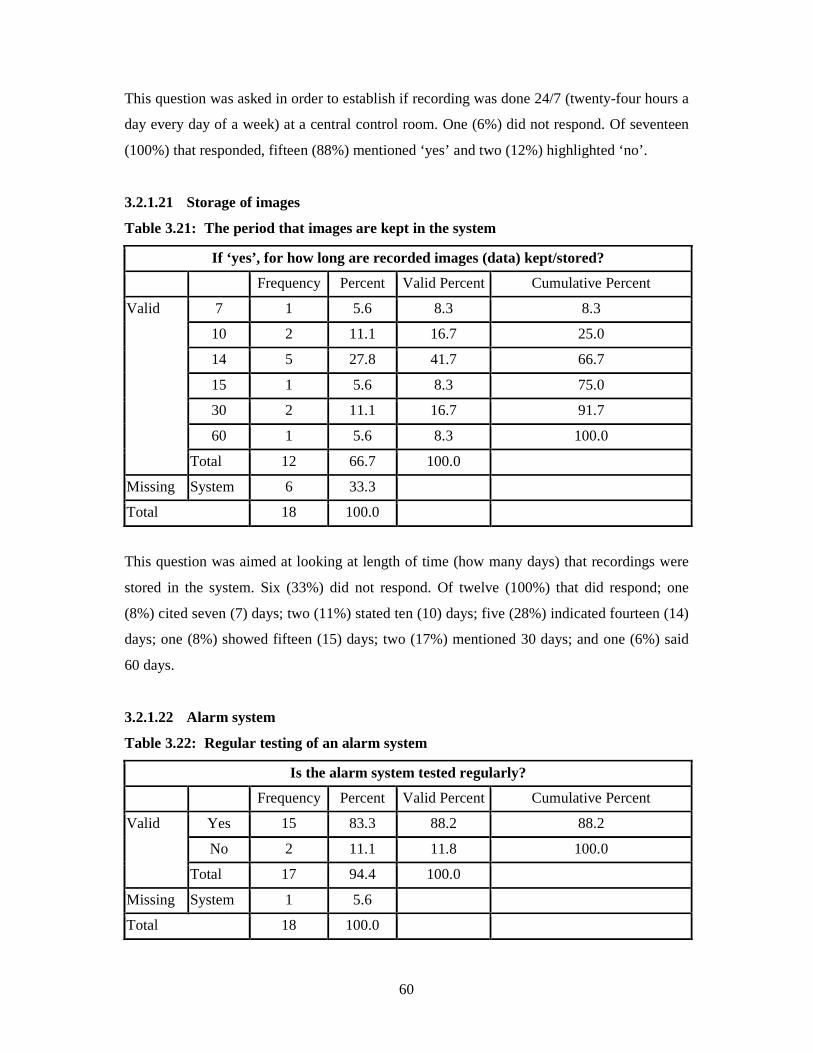
60
This question was asked in order to establish if recording was done 24/7 (twenty-four hours a
day every day of a week) at a central control room. One (6%) did not respond. Of seventeen
(100%) that responded, fifteen (88%) mentioned ‘yes’ and two (12%) highlighted ‘no’.
3.2.1.21 Storage of images
Table 3.21: The period that images are kept in the system
If ‘yes’, for how long are recorded images (data) kept/stored?
Frequency Percent Valid Percent Cumulative Percent
Valid 7 1 5.6 8.3 8.3
10 2 11.1 16.7 25.0
14 5 27.8 41.7 66.7
15 1 5.6 8.3 75.0
30 2 11.1 16.7 91.7
60 1 5.6 8.3 100.0
Total 12 66.7 100.0
Missing System 6 33.3
Total 18 100.0
This question was aimed at looking at length of time (how many days) that recordings were
stored in the system. Six (33%) did not respond. Of twelve (100%) that did respond; one
(8%) cited seven (7) days; two (11%) stated ten (10) days; five (28%) indicated fourteen (14)
days; one (8%) showed fifteen (15) days; two (17%) mentioned 30 days; and one (6%) said
60 days.
3.2.1.22 Alarm system
Table 3.22: Regular testing of an alarm system
Is the alarm system tested regularly?
Frequency Percent Valid Percent Cumulative Percent
Valid Yes 15 83.3 88.2 88.2
No 2 11.1 11.8 100.0
Total 17 94.4 100.0
Missing System 1 5.6
Total 18 100.0
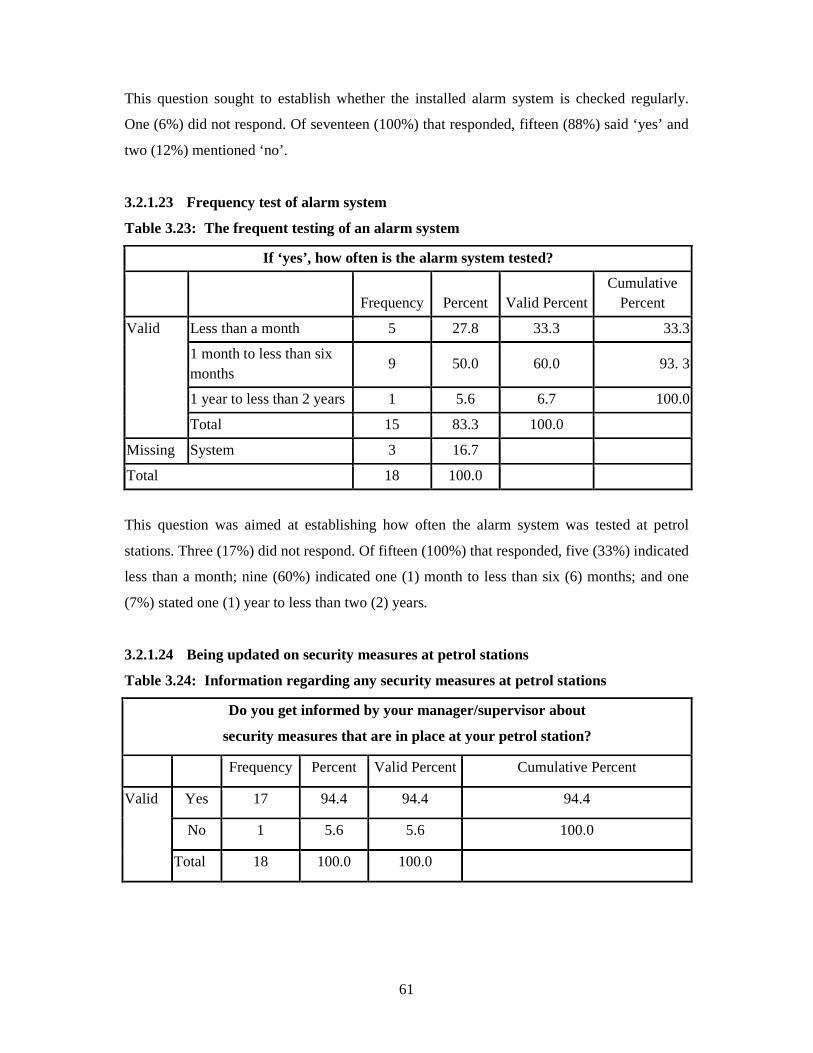
61
This question sought to establish whether the installed alarm system is checked regularly.
One (6%) did not respond. Of seventeen (100%) that responded, fifteen (88%) said ‘yes’ and
two (12%) mentioned ‘no’.
3.2.1.23 Frequency test of alarm system
Table 3.23: The frequent testing of an alarm system
If ‘yes’, how often is the alarm system tested?
Frequency Percent Valid Percent
Cumulative Percent
Valid Less than a month 5 27.8 33.3 33.3
1 month to less than six months
9 50.0 60.0 93. 3
1 year to less than 2 years 1 5.6 6.7 100.0
Total 15 83.3 100.0
Missing System 3 16.7
Total 18 100.0
This question was aimed at establishing how often the alarm system was tested at petrol
stations. Three (17%) did not respond. Of fifteen (100%) that responded, five (33%) indicated
less than a month; nine (60%) indicated one (1) month to less than six (6) months; and one
(7%) stated one (1) year to less than two (2) years.
3.2.1.24 Being updated on security measures at petrol stations
Table 3.24: Information regarding any security measures at petrol stations
Do you get informed by your manager/supervisor about
security measures that are in place at your petrol station?
Frequency Percent Valid Percent Cumulative Percent
Valid Yes 17 94.4 94.4 94.4
No 1 5.6 5.6 100.0
Total 18 100.0 100.0
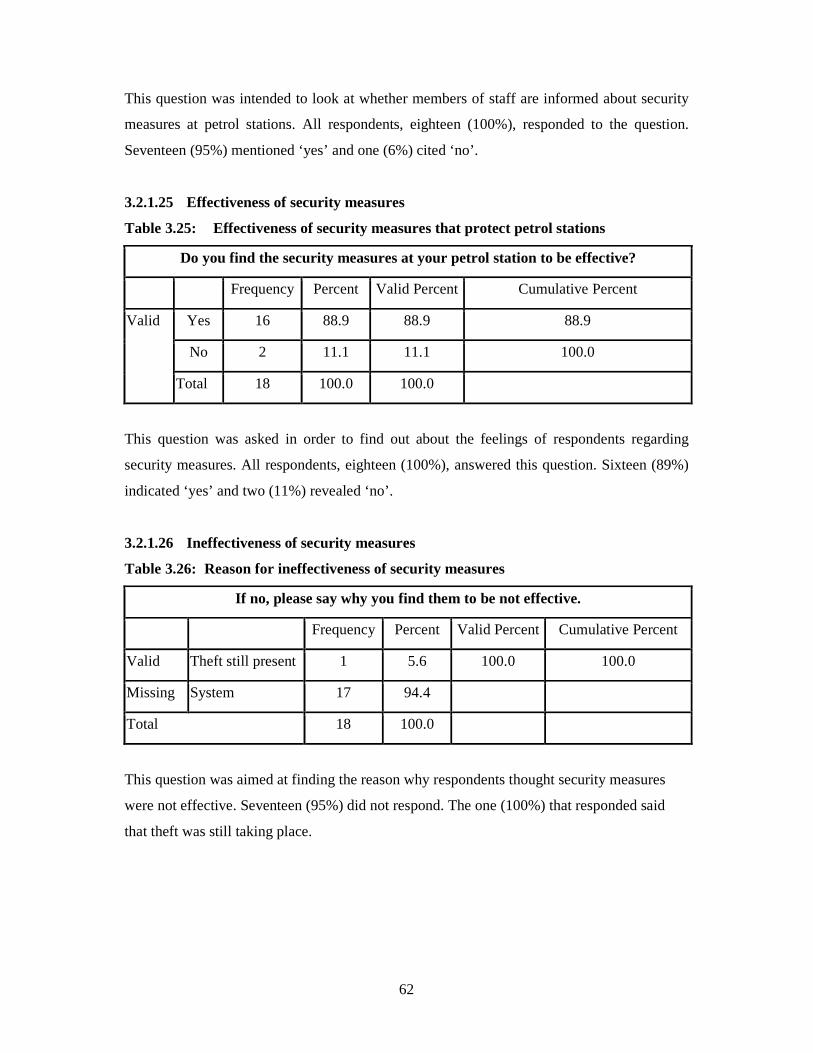
62
This question was intended to look at whether members of staff are informed about security
measures at petrol stations. All respondents, eighteen (100%), responded to the question.
Seventeen (95%) mentioned ‘yes’ and one (6%) cited ‘no’.
3.2.1.25 Effectiveness of security measures
Table 3.25: Effectiveness of security measures that protect petrol stations
Do you find the security measures at your petrol station to be effective?
Frequency Percent Valid Percent Cumulative Percent
Valid Yes 16 88.9 88.9 88.9
No 2 11.1 11.1 100.0
Total 18 100.0 100.0
This question was asked in order to find out about the feelings of respondents regarding
security measures. All respondents, eighteen (100%), answered this question. Sixteen (89%)
indicated ‘yes’ and two (11%) revealed ‘no’.
3.2.1.26 Ineffectiveness of security measures
Table 3.26: Reason for ineffectiveness of security measures
If no, please say why you find them to be not effective.
Frequency Percent Valid Percent Cumulative Percent
Valid Theft still present 1 5.6 100.0 100.0
Missing System 17 94.4
Total 18 100.0
This question was aimed at finding the reason why respondents thought security measures
were not effective. Seventeen (95%) did not respond. The one (100%) that responded said
that theft was still taking place.

63
3.2.1.27 Criminal incidents at petrol stations
Table 3.27: Records of criminal incidents kept by the petrol station
Does your petrol station keep record of violent and/or criminal incidents that occur at
your petrol station? (incident management system in place)
Frequency Percent Valid Percent Cumulative Percent
Valid Yes 10 55.6 55.6 55.6
No 5 27.8 27.8 83.3
Unsure 3 16.7 16.7 100.0
Total 18 100.0 100.0
This question was intended to find out about the record keeping of incidents at petrol stations.
Eighteen (100%) responded to the question. Ten (56%) said ‘yes’, five (28%) indicated no
and three (17%) were unsure.
3.2.1.28 Security Policies and procedures
Table 3.28: Availability of security policies and procedures at petrol stations
Do you have security policies and procedures in place at your petrol station regarding
station security?
Frequency Percent Valid Percent Cumulative Percent
Valid Yes 13 72.2 72.2 72.2
No 1 5.6 5.6 77.8
Unsure 4 22.2 22.2 100.0
Total 18 100.0 100.0
This question sought to establish whether there were security policies and procedures at
petrol stations. Eighteen (100%) responded to the question. Thirteen (72%) said ‘yes’, one
(6%) indicated ‘no’ and four (22%) were ‘unsure’.
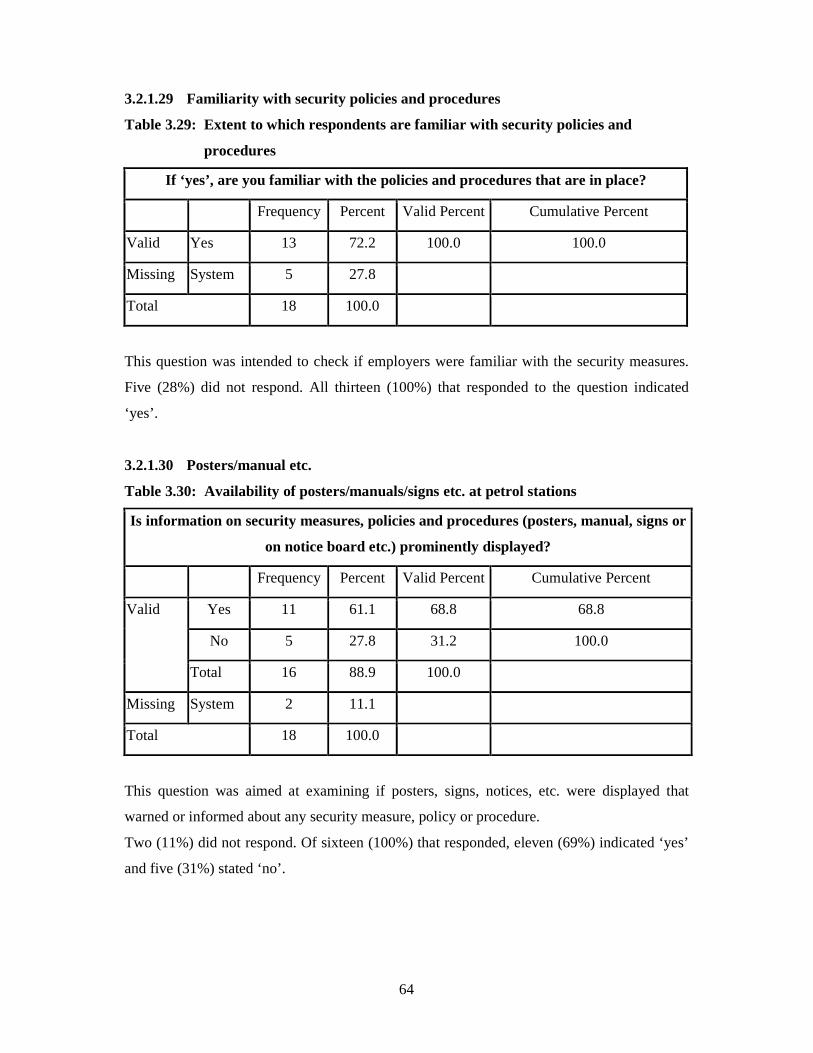
64
3.2.1.29 Familiarity with security policies and procedures
Table 3.29: Extent to which respondents are familiar with security policies and
procedures
If ‘yes’, are you familiar with the policies and procedures that are in place?
Frequency Percent Valid Percent Cumulative Percent
Valid Yes 13 72.2 100.0 100.0
Missing System 5 27.8
Total 18 100.0
This question was intended to check if employers were familiar with the security measures.
Five (28%) did not respond. All thirteen (100%) that responded to the question indicated
‘yes’.
3.2.1.30 Posters/manual etc.
Table 3.30: Availability of posters/manuals/signs etc. at petrol stations
Is information on security measures, policies and procedures (posters, manual, signs or
on notice board etc.) prominently displayed?
Frequency Percent Valid Percent Cumulative Percent
Valid Yes 11 61.1 68.8 68.8
No 5 27.8 31.2 100.0
Total 16 88.9 100.0
Missing System 2 11.1
Total 18 100.0
This question was aimed at examining if posters, signs, notices, etc. were displayed that
warned or informed about any security measure, policy or procedure.
Two (11%) did not respond. Of sixteen (100%) that responded, eleven (69%) indicated ‘yes’
and five (31%) stated ‘no’.
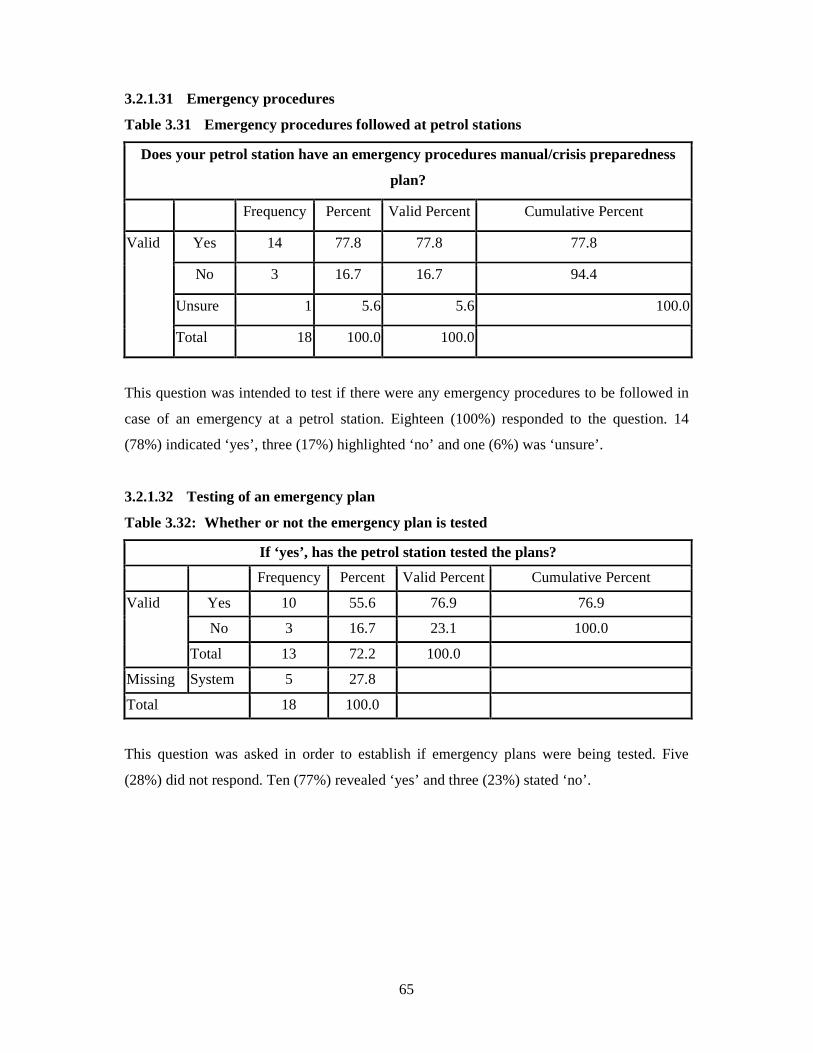
65
3.2.1.31 Emergency procedures
Table 3.31 Emergency procedures followed at petrol stations
Does your petrol station have an emergency procedures manual/crisis preparedness
plan?
Frequency Percent Valid Percent Cumulative Percent
Valid Yes 14 77.8 77.8 77.8
No 3 16.7 16.7 94.4
Unsure 1 5.6 5.6 100.0
Total 18 100.0 100.0
This question was intended to test if there were any emergency procedures to be followed in
case of an emergency at a petrol station. Eighteen (100%) responded to the question. 14
(78%) indicated ‘yes’, three (17%) highlighted ‘no’ and one (6%) was ‘unsure’.
3.2.1.32 Testing of an emergency plan
Table 3.32: Whether or not the emergency plan is tested
If ‘yes’, has the petrol station tested the plans?
Frequency Percent Valid Percent Cumulative Percent
Valid Yes 10 55.6 76.9 76.9
No 3 16.7 23.1 100.0
Total 13 72.2 100.0
Missing System 5 27.8
Total 18 100.0
This question was asked in order to establish if emergency plans were being tested. Five
(28%) did not respond. Ten (77%) revealed ‘yes’ and three (23%) stated ‘no’.
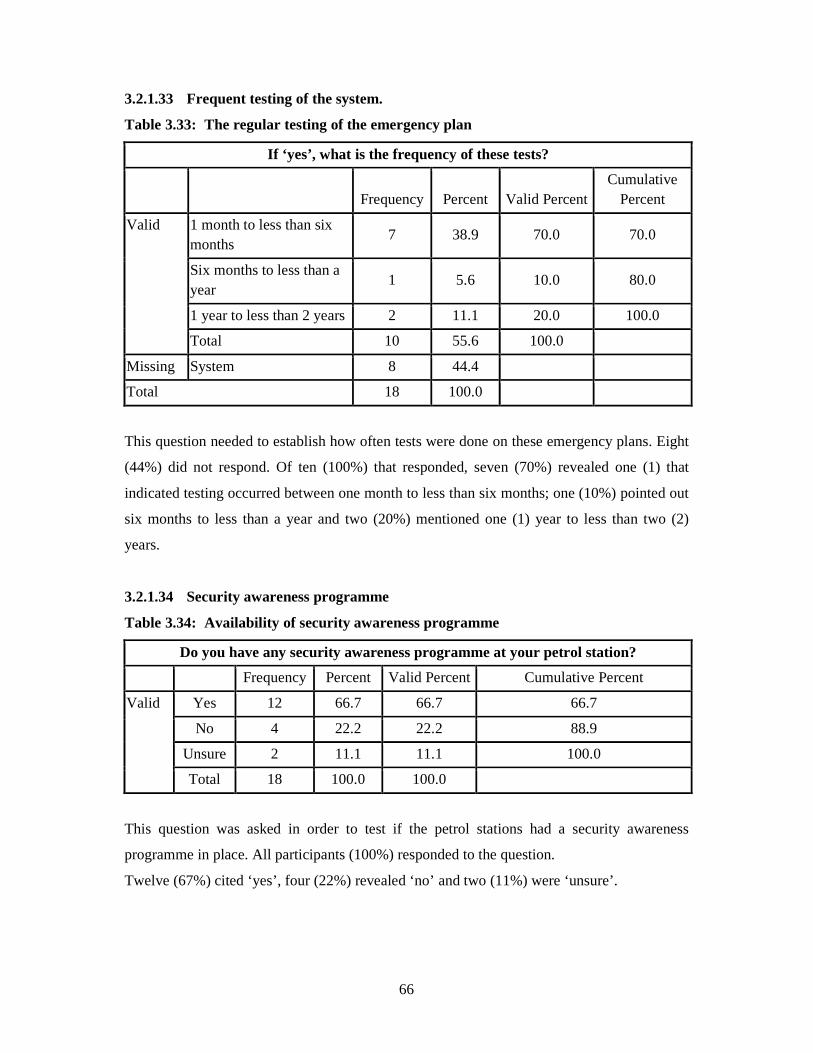
66
3.2.1.33 Frequent testing of the system.
Table 3.33: The regular testing of the emergency plan
If ‘yes’, what is the frequency of these tests?
Frequency Percent Valid Percent
Cumulative Percent
Valid 1 month to less than six months
7 38.9 70.0 70.0
Six months to less than a year
1 5.6 10.0 80.0
1 year to less than 2 years 2 11.1 20.0 100.0
Total 10 55.6 100.0
Missing System 8 44.4
Total 18 100.0
This question needed to establish how often tests were done on these emergency plans. Eight
(44%) did not respond. Of ten (100%) that responded, seven (70%) revealed one (1) that
indicated testing occurred between one month to less than six months; one (10%) pointed out
six months to less than a year and two (20%) mentioned one (1) year to less than two (2)
years.
3.2.1.34 Security awareness programme
Table 3.34: Availability of security awareness programme
Do you have any security awareness programme at your petrol station?
Frequency Percent Valid Percent Cumulative Percent
Valid Yes 12 66.7 66.7 66.7
No 4 22.2 22.2 88.9
Unsure 2 11.1 11.1 100.0
Total 18 100.0 100.0
This question was asked in order to test if the petrol stations had a security awareness
programme in place. All participants (100%) responded to the question.
Twelve (67%) cited ‘yes’, four (22%) revealed ‘no’ and two (11%) were ‘unsure’.
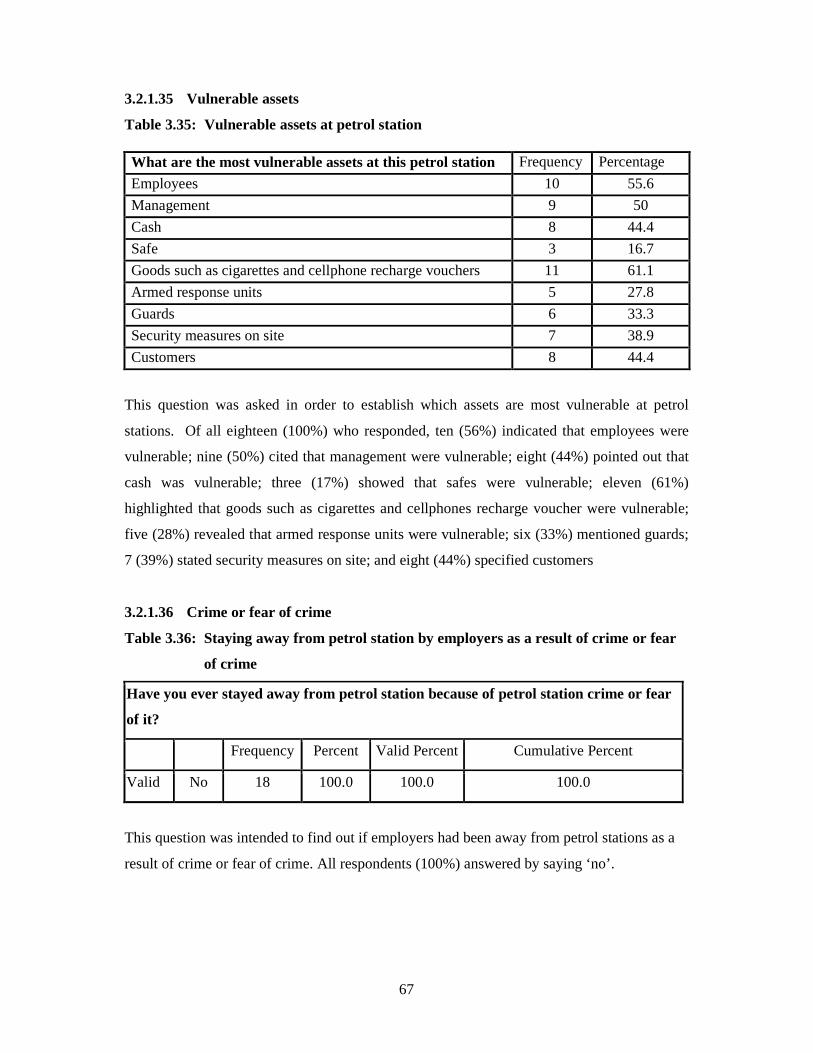
67
3.2.1.35 Vulnerable assets
Table 3.35: Vulnerable assets at petrol station
This question was asked in order to establish which assets are most vulnerable at petrol
stations. Of all eighteen (100%) who responded, ten (56%) indicated that employees were
vulnerable; nine (50%) cited that management were vulnerable; eight (44%) pointed out that
cash was vulnerable; three (17%) showed that safes were vulnerable; eleven (61%)
highlighted that goods such as cigarettes and cellphones recharge voucher were vulnerable;
five (28%) revealed that armed response units were vulnerable; six (33%) mentioned guards;
7 (39%) stated security measures on site; and eight (44%) specified customers
3.2.1.36 Crime or fear of crime
Table 3.36: Staying away from petrol station by employers as a result of crime or fear
of crime
Have you ever stayed away from petrol station because of petrol station crime or fear
of it?
Frequency Percent Valid Percent Cumulative Percent
Valid No 18 100.0 100.0 100.0
This question was intended to find out if employers had been away from petrol stations as a
result of crime or fear of crime. All respondents (100%) answered by saying ‘no’.
What are the most vulnerable assets at this petrol station Frequency Percentage
Employees 10 55.6
Management 9 50
Cash 8 44.4
Safe 3 16.7
Goods such as cigarettes and cellphone recharge vouchers 11 61.1
Armed response units 5 27.8
Guards 6 33.3
Security measures on site 7 38.9
Customers 8 44.4
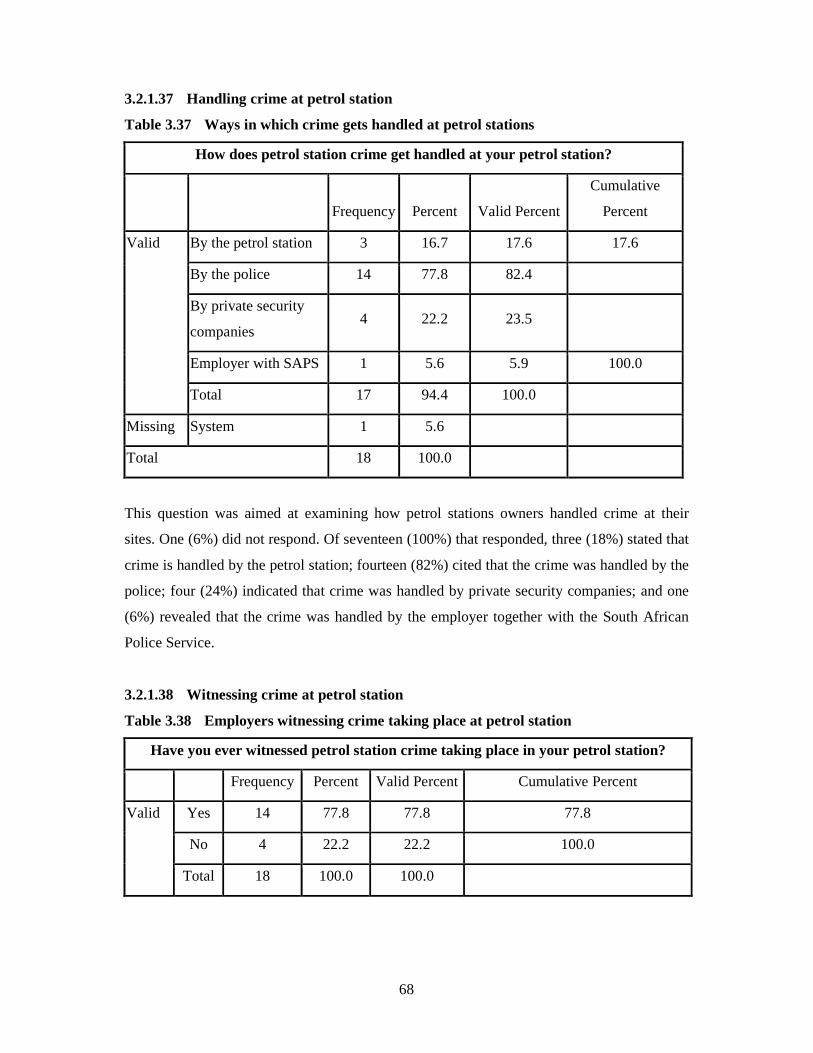
68
3.2.1.37 Handling crime at petrol station
Table 3.37 Ways in which crime gets handled at petrol stations
How does petrol station crime get handled at your petrol station?
Frequency Percent Valid Percent
Cumulative
Percent
Valid By the petrol station 3 16.7 17.6 17.6
By the police 14 77.8 82.4
By private security
companies 4 22.2 23.5
Employer with SAPS 1 5.6 5.9 100.0
Total 17 94.4 100.0
Missing System 1 5.6
Total 18 100.0
This question was aimed at examining how petrol stations owners handled crime at their
sites. One (6%) did not respond. Of seventeen (100%) that responded, three (18%) stated that
crime is handled by the petrol station; fourteen (82%) cited that the crime was handled by the
police; four (24%) indicated that crime was handled by private security companies; and one
(6%) revealed that the crime was handled by the employer together with the South African
Police Service.
3.2.1.38 Witnessing crime at petrol station
Table 3.38 Employers witnessing crime taking place at petrol station
Have you ever witnessed petrol station crime taking place in your petrol station?
Frequency Percent Valid Percent Cumulative Percent
Valid Yes 14 77.8 77.8 77.8
No 4 22.2 22.2 100.0
Total 18 100.0 100.0
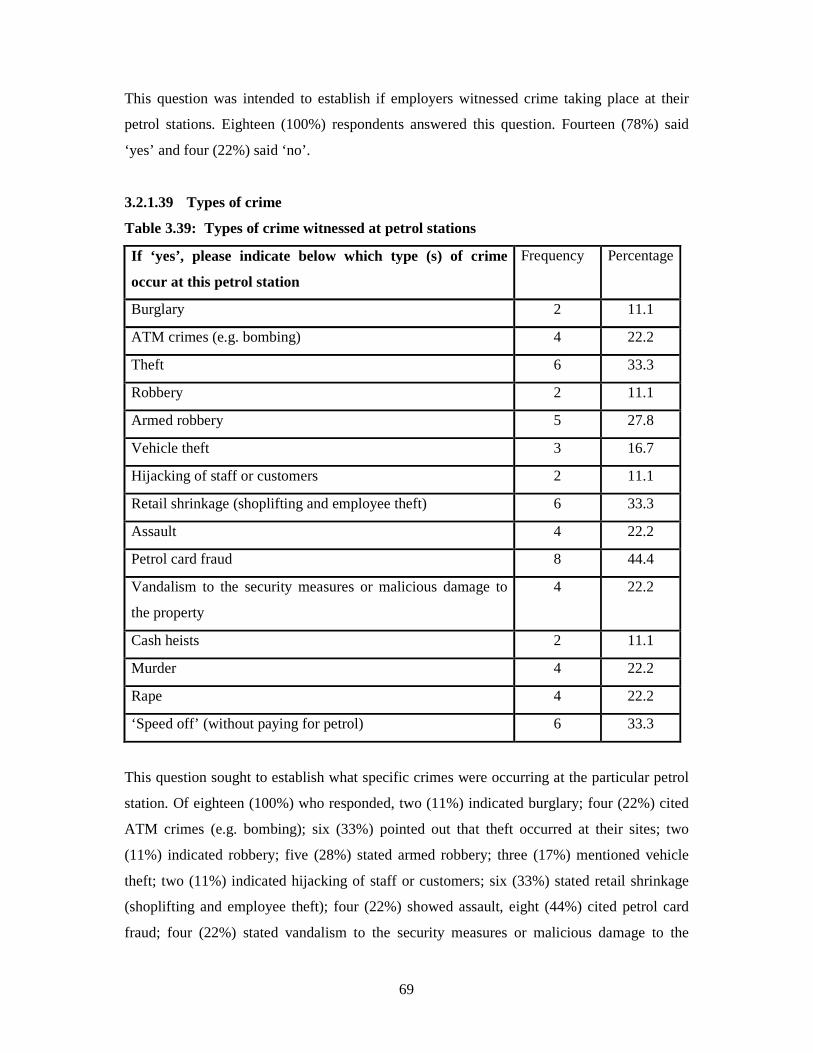
69
This question was intended to establish if employers witnessed crime taking place at their
petrol stations. Eighteen (100%) respondents answered this question. Fourteen (78%) said
‘yes’ and four (22%) said ‘no’.
3.2.1.39 Types of crime
Table 3.39: Types of crime witnessed at petrol stations
If ‘yes’, please indicate below which type (s) of crime
occur at this petrol station
Frequency Percentage
Burglary 2 11.1
ATM crimes (e.g. bombing) 4 22.2
Theft 6 33.3
Robbery 2 11.1
Armed robbery 5 27.8
Vehicle theft 3 16.7
Hijacking of staff or customers 2 11.1
Retail shrinkage (shoplifting and employee theft) 6 33.3
Assault 4 22.2
Petrol card fraud 8 44.4
Vandalism to the security measures or malicious damage to
the property
4 22.2
Cash heists 2 11.1
Murder 4 22.2
Rape 4 22.2
‘Speed off’ (without paying for petrol) 6 33.3
This question sought to establish what specific crimes were occurring at the particular petrol
station. Of eighteen (100%) who responded, two (11%) indicated burglary; four (22%) cited
ATM crimes (e.g. bombing); six (33%) pointed out that theft occurred at their sites; two
(11%) indicated robbery; five (28%) stated armed robbery; three (17%) mentioned vehicle
theft; two (11%) indicated hijacking of staff or customers; six (33%) stated retail shrinkage
(shoplifting and employee theft); four (22%) showed assault, eight (44%) cited petrol card
fraud; four (22%) stated vandalism to the security measures or malicious damage to the
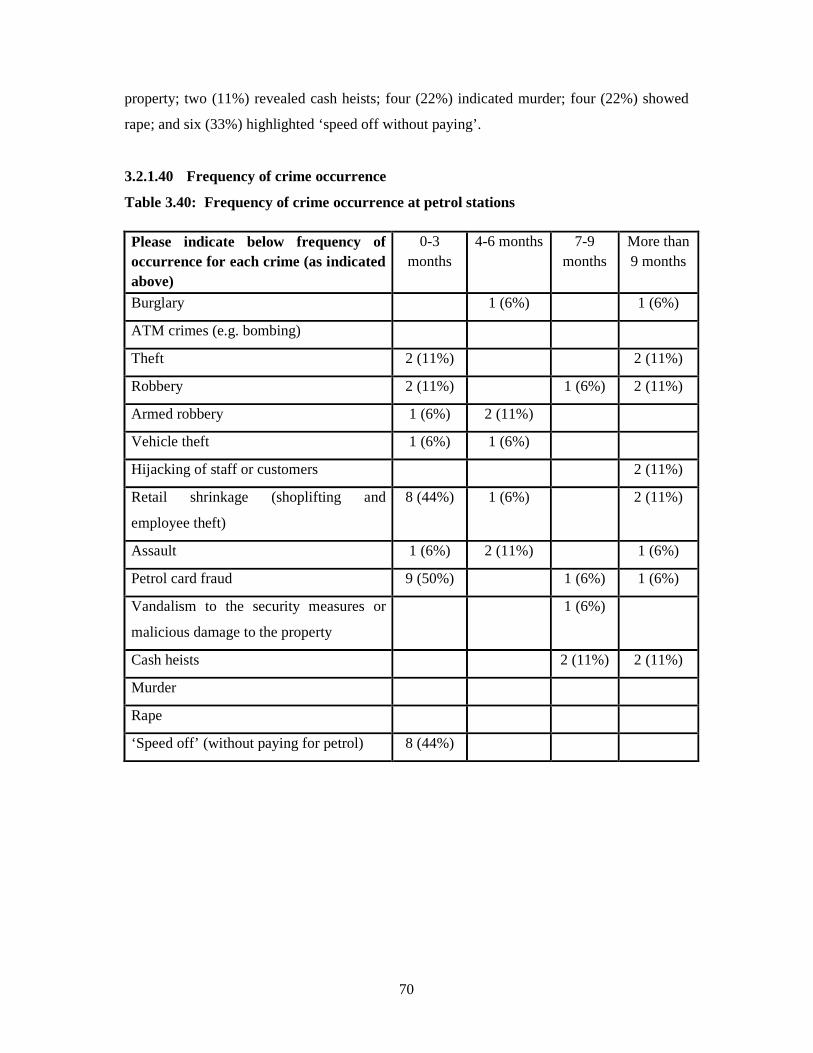
70
property; two (11%) revealed cash heists; four (22%) indicated murder; four (22%) showed
rape; and six (33%) highlighted ‘speed off without paying’.
3.2.1.40 Frequency of crime occurrence
Table 3.40: Frequency of crime occurrence at petrol stations
Please indicate below frequency of occurrence for each crime (as indicated above)
0-3 months
4-6 months 7-9 months
More than 9 months
Burglary 1 (6%) 1 (6%)
ATM crimes (e.g. bombing)
Theft 2 (11%) 2 (11%)
Robbery 2 (11%) 1 (6%) 2 (11%)
Armed robbery 1 (6%) 2 (11%)
Vehicle theft 1 (6%) 1 (6%)
Hijacking of staff or customers 2 (11%)
Retail shrinkage (shoplifting and
employee theft)
8 (44%) 1 (6%) 2 (11%)
Assault 1 (6%) 2 (11%) 1 (6%)
Petrol card fraud 9 (50%) 1 (6%) 1 (6%)
Vandalism to the security measures or
malicious damage to the property
1 (6%)
Cash heists 2 (11%) 2 (11%)
Murder
Rape
‘Speed off’ (without paying for petrol) 8 (44%)
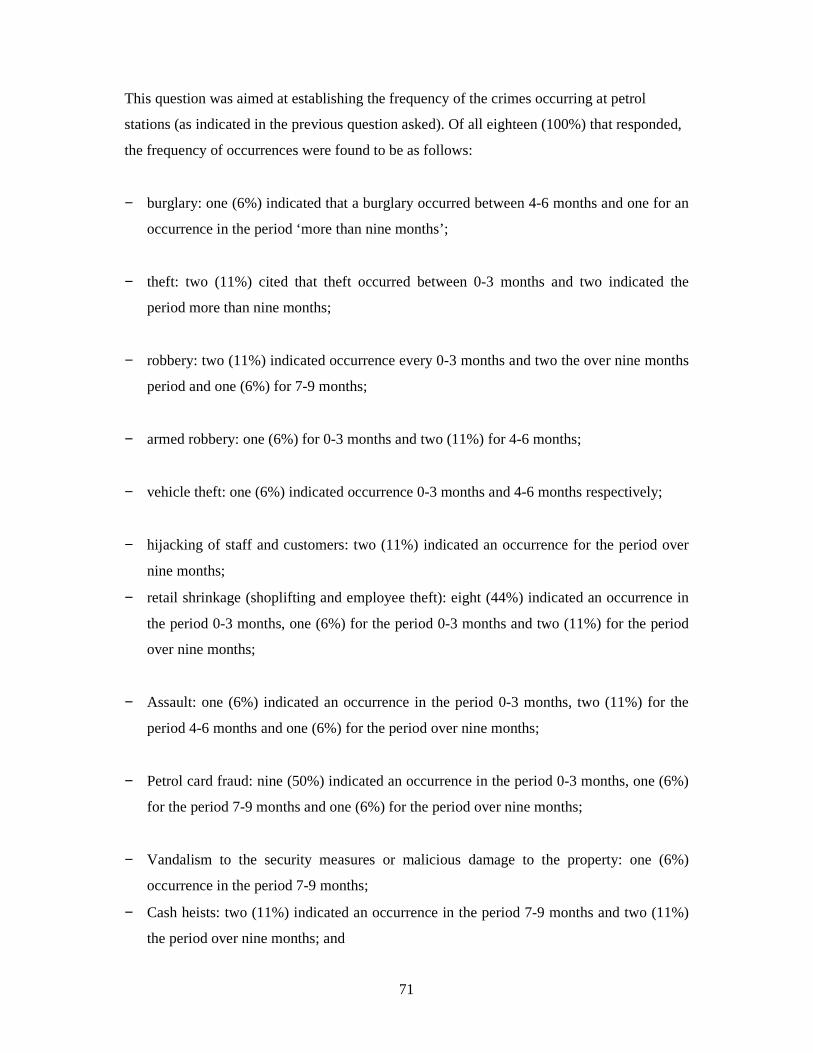
71
This question was aimed at establishing the frequency of the crimes occurring at petrol
stations (as indicated in the previous question asked). Of all eighteen (100%) that responded,
the frequency of occurrences were found to be as follows:
− burglary: one (6%) indicated that a burglary occurred between 4-6 months and one for an
occurrence in the period ‘more than nine months’;
− theft: two (11%) cited that theft occurred between 0-3 months and two indicated the
period more than nine months;
− robbery: two (11%) indicated occurrence every 0-3 months and two the over nine months
period and one (6%) for 7-9 months;
− armed robbery: one (6%) for 0-3 months and two (11%) for 4-6 months;
− vehicle theft: one (6%) indicated occurrence 0-3 months and 4-6 months respectively;
− hijacking of staff and customers: two (11%) indicated an occurrence for the period over
nine months;
− retail shrinkage (shoplifting and employee theft): eight (44%) indicated an occurrence in
the period 0-3 months, one (6%) for the period 0-3 months and two (11%) for the period
over nine months;
− Assault: one (6%) indicated an occurrence in the period 0-3 months, two (11%) for the
period 4-6 months and one (6%) for the period over nine months;
− Petrol card fraud: nine (50%) indicated an occurrence in the period 0-3 months, one (6%)
for the period 7-9 months and one (6%) for the period over nine months;
− Vandalism to the security measures or malicious damage to the property: one (6%)
occurrence in the period 7-9 months;
− Cash heists: two (11%) indicated an occurrence in the period 7-9 months and two (11%)
the period over nine months; and
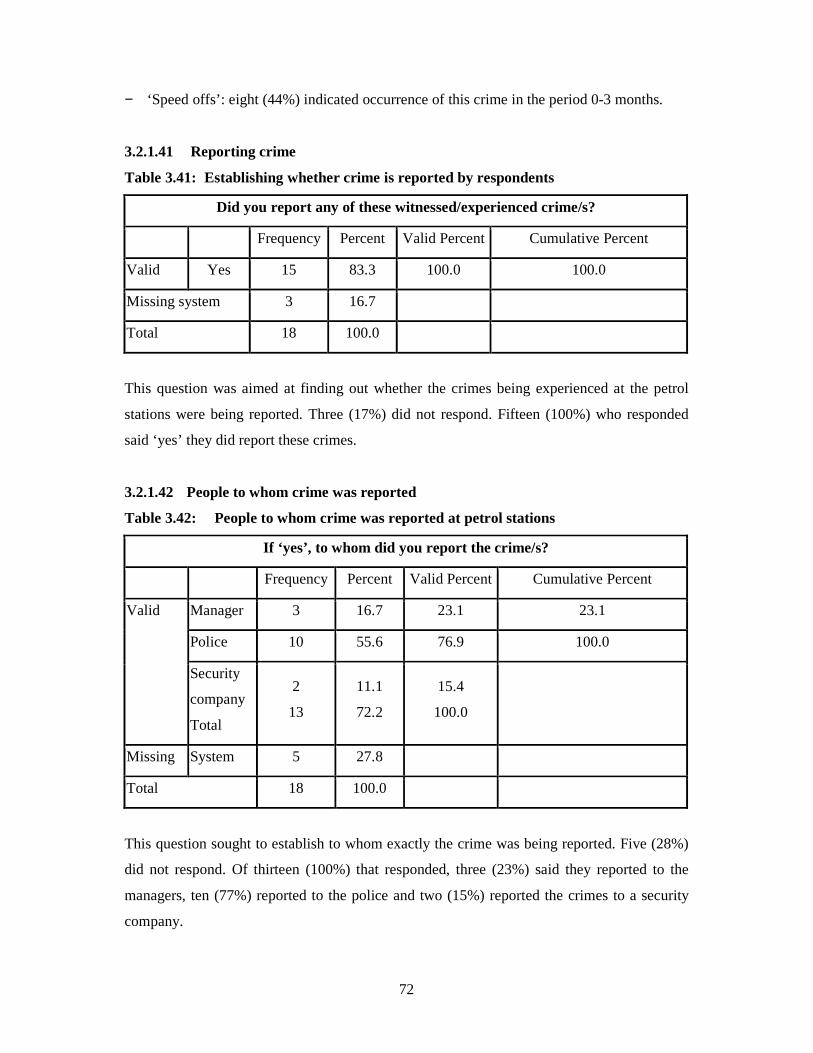
72
− ‘Speed offs’: eight (44%) indicated occurrence of this crime in the period 0-3 months.
3.2.1.41 Reporting crime
Table 3.41: Establishing whether crime is reported by respondents
Did you report any of these witnessed/experienced crime/s?
Frequency Percent Valid Percent Cumulative Percent
Valid Yes 15 83.3 100.0 100.0
Missing system 3 16.7
Total 18 100.0
This question was aimed at finding out whether the crimes being experienced at the petrol
stations were being reported. Three (17%) did not respond. Fifteen (100%) who responded
said ‘yes’ they did report these crimes.
3.2.1.42 People to whom crime was reported
Table 3.42: People to whom crime was reported at petrol stations
If ‘yes’, to whom did you report the crime/s?
Frequency Percent Valid Percent Cumulative Percent
Valid Manager 3 16.7 23.1 23.1
Police 10 55.6 76.9 100.0
Security
company
Total
2
13
11.1
72.2
15.4
100.0
Missing System 5 27.8
Total 18 100.0
This question sought to establish to whom exactly the crime was being reported. Five (28%)
did not respond. Of thirteen (100%) that responded, three (23%) said they reported to the
managers, ten (77%) reported to the police and two (15%) reported the crimes to a security
company.
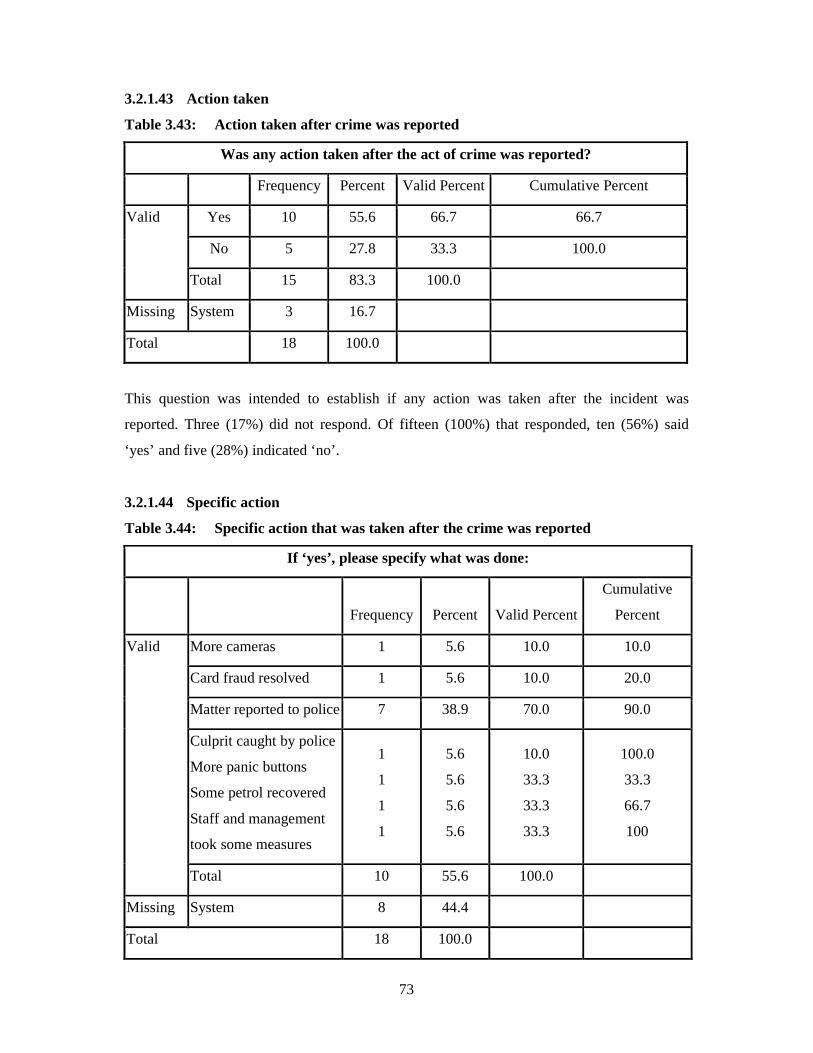
73
3.2.1.43 Action taken
Table 3.43: Action taken after crime was reported
Was any action taken after the act of crime was reported?
Frequency Percent Valid Percent Cumulative Percent
Valid Yes 10 55.6 66.7 66.7
No 5 27.8 33.3 100.0
Total 15 83.3 100.0
Missing System 3 16.7
Total 18 100.0
This question was intended to establish if any action was taken after the incident was
reported. Three (17%) did not respond. Of fifteen (100%) that responded, ten (56%) said
‘yes’ and five (28%) indicated ‘no’.
3.2.1.44 Specific action
Table 3.44: Specific action that was taken after the crime was reported
If ‘yes’, please specify what was done:
Frequency Percent Valid Percent
Cumulative
Percent
Valid More cameras 1 5.6 10.0 10.0
Card fraud resolved 1 5.6 10.0 20.0
Matter reported to police 7 38.9 70.0 90.0
Culprit caught by police
More panic buttons
Some petrol recovered
Staff and management
took some measures
1
1
1
1
5.6
5.6
5.6
5.6
10.0
33.3
33.3
33.3
100.0
33.3
66.7
100
Total 10 55.6 100.0
Missing System 8 44.4
Total 18 100.0
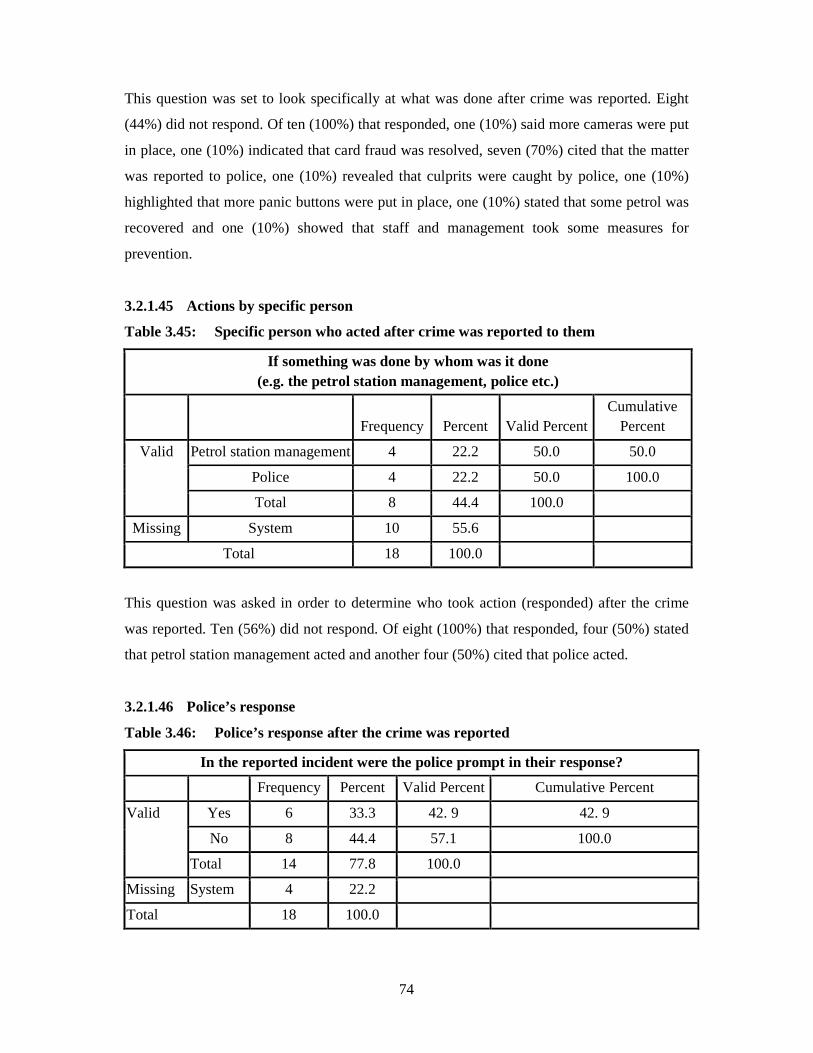
74
This question was set to look specifically at what was done after crime was reported. Eight
(44%) did not respond. Of ten (100%) that responded, one (10%) said more cameras were put
in place, one (10%) indicated that card fraud was resolved, seven (70%) cited that the matter
was reported to police, one (10%) revealed that culprits were caught by police, one (10%)
highlighted that more panic buttons were put in place, one (10%) stated that some petrol was
recovered and one (10%) showed that staff and management took some measures for
prevention.
3.2.1.45 Actions by specific person
Table 3.45: Specific person who acted after crime was reported to them
If something was done by whom was it done (e.g. the petrol station management, police etc.)
Frequency Percent Valid Percent
Cumulative Percent
Valid Petrol station management 4 22.2 50.0 50.0
Police 4 22.2 50.0 100.0
Total 8 44.4 100.0
Missing System 10 55.6
Total 18 100.0
This question was asked in order to determine who took action (responded) after the crime
was reported. Ten (56%) did not respond. Of eight (100%) that responded, four (50%) stated
that petrol station management acted and another four (50%) cited that police acted.
3.2.1.46 Police’s response
Table 3.46: Police’s response after the crime was reported
In the reported incident were the police prompt in their response?
Frequency Percent Valid Percent Cumulative Percent
Valid Yes 6 33.3 42. 9 42. 9
No 8 44.4 57.1 100.0
Total 14 77.8 100.0
Missing System 4 22.2
Total 18 100.0
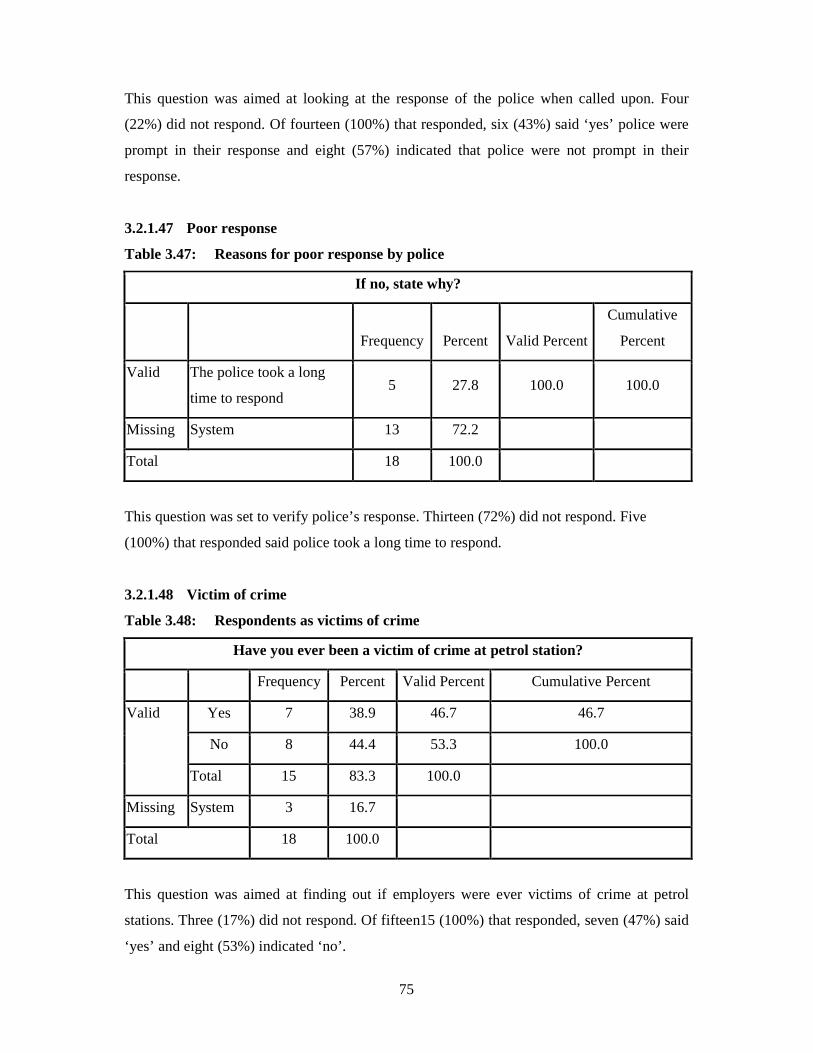
75
This question was aimed at looking at the response of the police when called upon. Four
(22%) did not respond. Of fourteen (100%) that responded, six (43%) said ‘yes’ police were
prompt in their response and eight (57%) indicated that police were not prompt in their
response.
3.2.1.47 Poor response
Table 3.47: Reasons for poor response by police
If no, state why?
Frequency Percent Valid Percent
Cumulative
Percent
Valid The police took a long
time to respond 5 27.8 100.0 100.0
Missing System 13 72.2
Total 18 100.0
This question was set to verify police’s response. Thirteen (72%) did not respond. Five
(100%) that responded said police took a long time to respond.
3.2.1.48 Victim of crime
Table 3.48: Respondents as victims of crime
Have you ever been a victim of crime at petrol station?
Frequency Percent Valid Percent Cumulative Percent
Valid Yes 7 38.9 46.7 46.7
No 8 44.4 53.3 100.0
Total 15 83.3 100.0
Missing System 3 16.7
Total 18 100.0
This question was aimed at finding out if employers were ever victims of crime at petrol
stations. Three (17%) did not respond. Of fifteen15 (100%) that responded, seven (47%) said
‘yes’ and eight (53%) indicated ‘no’.
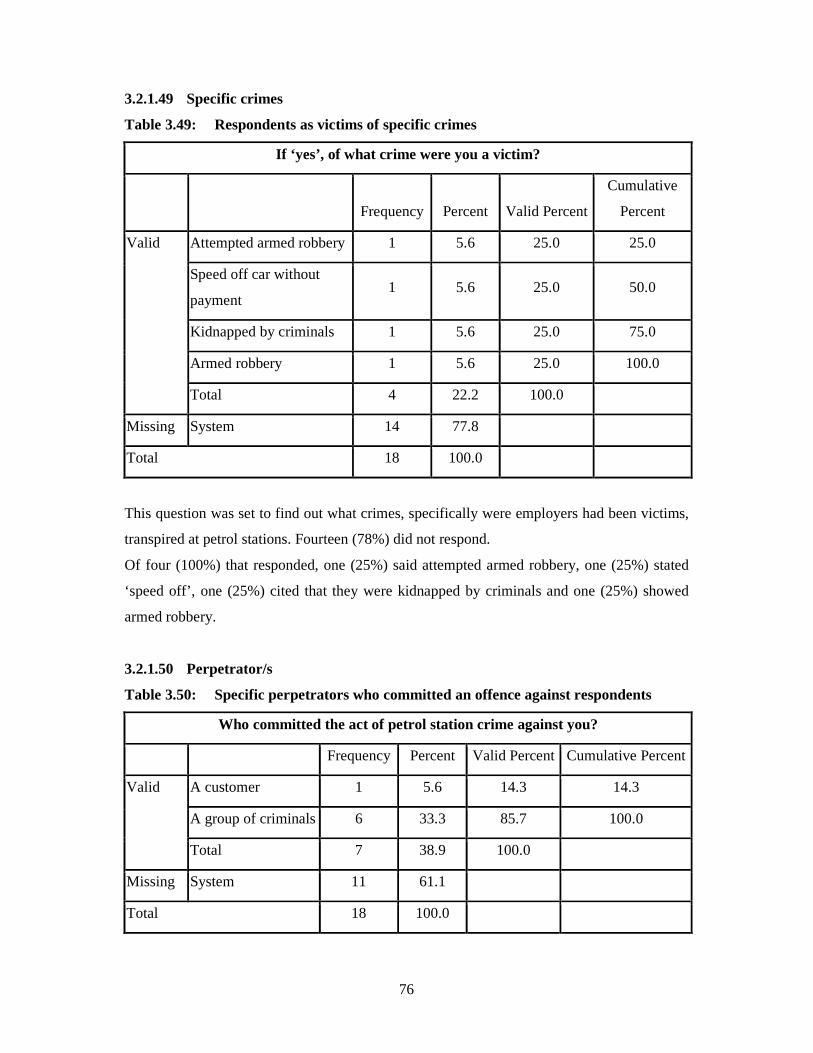
76
3.2.1.49 Specific crimes
Table 3.49: Respondents as victims of specific crimes
If ‘yes’, of what crime were you a victim?
Frequency Percent Valid Percent
Cumulative
Percent
Valid Attempted armed robbery 1 5.6 25.0 25.0
Speed off car without
payment 1 5.6 25.0 50.0
Kidnapped by criminals 1 5.6 25.0 75.0
Armed robbery 1 5.6 25.0 100.0
Total 4 22.2 100.0
Missing System 14 77.8
Total 18 100.0
This question was set to find out what crimes, specifically were employers had been victims,
transpired at petrol stations. Fourteen (78%) did not respond.
Of four (100%) that responded, one (25%) said attempted armed robbery, one (25%) stated
‘speed off’, one (25%) cited that they were kidnapped by criminals and one (25%) showed
armed robbery.
3.2.1.50 Perpetrator/s
Table 3.50: Specific perpetrators who committed an offence against respondents
Who committed the act of petrol station crime against you?
Frequency Percent Valid Percent Cumulative Percent
Valid A customer 1 5.6 14.3 14.3
A group of criminals 6 33.3 85.7 100.0
Total 7 38.9 100.0
Missing System 11 61.1
Total 18 100.0
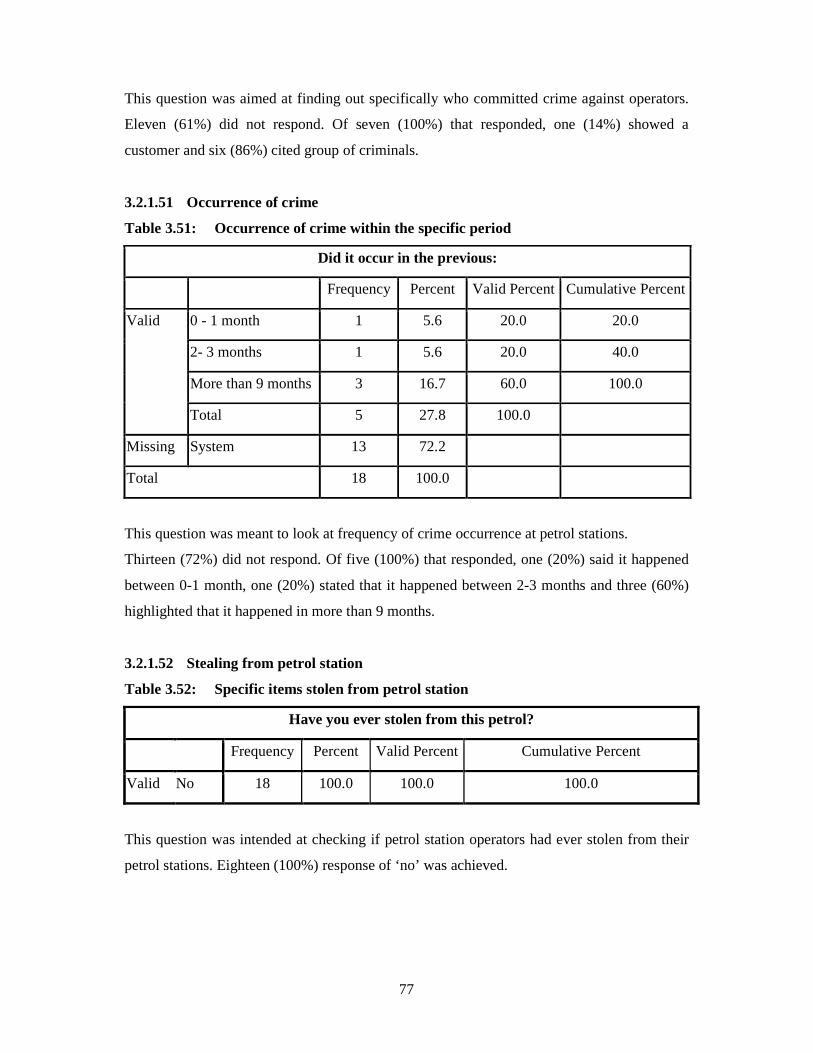
77
This question was aimed at finding out specifically who committed crime against operators.
Eleven (61%) did not respond. Of seven (100%) that responded, one (14%) showed a
customer and six (86%) cited group of criminals.
3.2.1.51 Occurrence of crime
Table 3.51: Occurrence of crime within the specific period
Did it occur in the previous:
Frequency Percent Valid Percent Cumulative Percent
Valid 0 - 1 month 1 5.6 20.0 20.0
2- 3 months 1 5.6 20.0 40.0
More than 9 months 3 16.7 60.0 100.0
Total 5 27.8 100.0
Missing System 13 72.2
Total 18 100.0
This question was meant to look at frequency of crime occurrence at petrol stations.
Thirteen (72%) did not respond. Of five (100%) that responded, one (20%) said it happened
between 0-1 month, one (20%) stated that it happened between 2-3 months and three (60%)
highlighted that it happened in more than 9 months.
3.2.1.52 Stealing from petrol station
Table 3.52: Specific items stolen from petrol station
Have you ever stolen from this petrol?
Frequency Percent Valid Percent Cumulative Percent
Valid No 18 100.0 100.0 100.0
This question was intended at checking if petrol station operators had ever stolen from their
petrol stations. Eighteen (100%) response of ‘no’ was achieved.
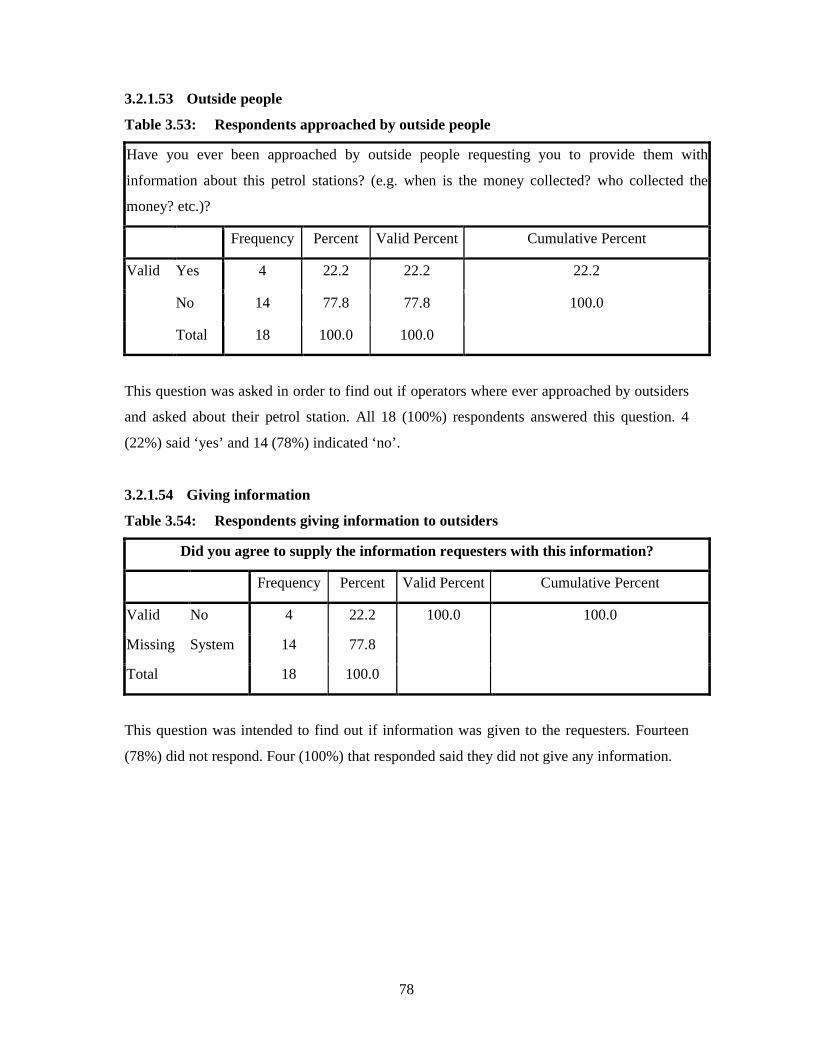
78
3.2.1.53 Outside people
Table 3.53: Respondents approached by outside people
Have you ever been approached by outside people requesting you to provide them with
information about this petrol stations? (e.g. when is the money collected? who collected the
money? etc.)?
Frequency Percent Valid Percent Cumulative Percent
Valid Yes 4 22.2 22.2 22.2
No 14 77.8 77.8 100.0
Total 18 100.0 100.0
This question was asked in order to find out if operators where ever approached by outsiders
and asked about their petrol station. All 18 (100%) respondents answered this question. 4
(22%) said ‘yes’ and 14 (78%) indicated ‘no’.
3.2.1.54 Giving information
Table 3.54: Respondents giving information to outsiders
Did you agree to supply the information requesters with this information?
Frequency Percent Valid Percent Cumulative Percent
Valid No 4 22.2 100.0 100.0
Missing System 14 77.8
Total 18 100.0
This question was intended to find out if information was given to the requesters. Fourteen
(78%) did not respond. Four (100%) that responded said they did not give any information.
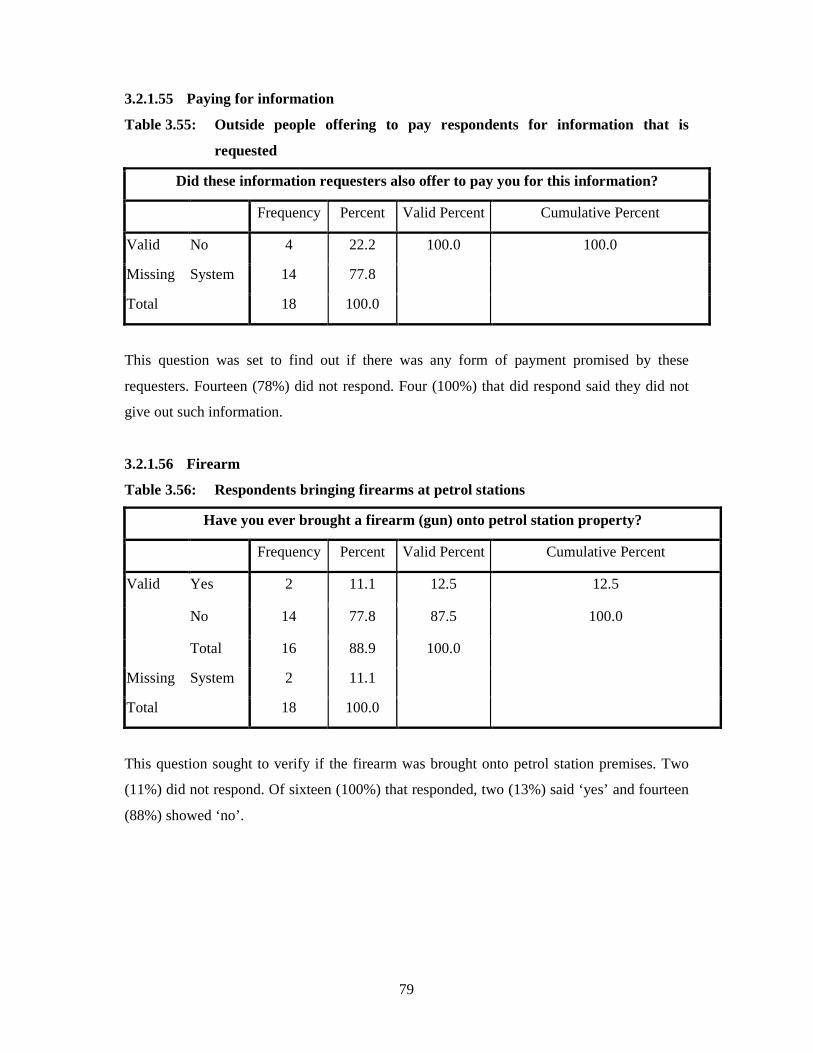
79
3.2.1.55 Paying for information
Table 3.55: Outside people offering to pay respondents for information that is
requested
Did these information requesters also offer to pay you for this information?
Frequency Percent Valid Percent Cumulative Percent
Valid No 4 22.2 100.0 100.0
Missing System 14 77.8
Total 18 100.0
This question was set to find out if there was any form of payment promised by these
requesters. Fourteen (78%) did not respond. Four (100%) that did respond said they did not
give out such information.
3.2.1.56 Firearm
Table 3.56: Respondents bringing firearms at petrol stations
Have you ever brought a firearm (gun) onto petrol station property?
Frequency Percent Valid Percent Cumulative Percent
Valid Yes 2 11.1 12.5 12.5
No 14 77.8 87.5 100.0
Total 16 88.9 100.0
Missing System 2 11.1
Total 18 100.0
This question sought to verify if the firearm was brought onto petrol station premises. Two
(11%) did not respond. Of sixteen (100%) that responded, two (13%) said ‘yes’ and fourteen
(88%) showed ‘no’.
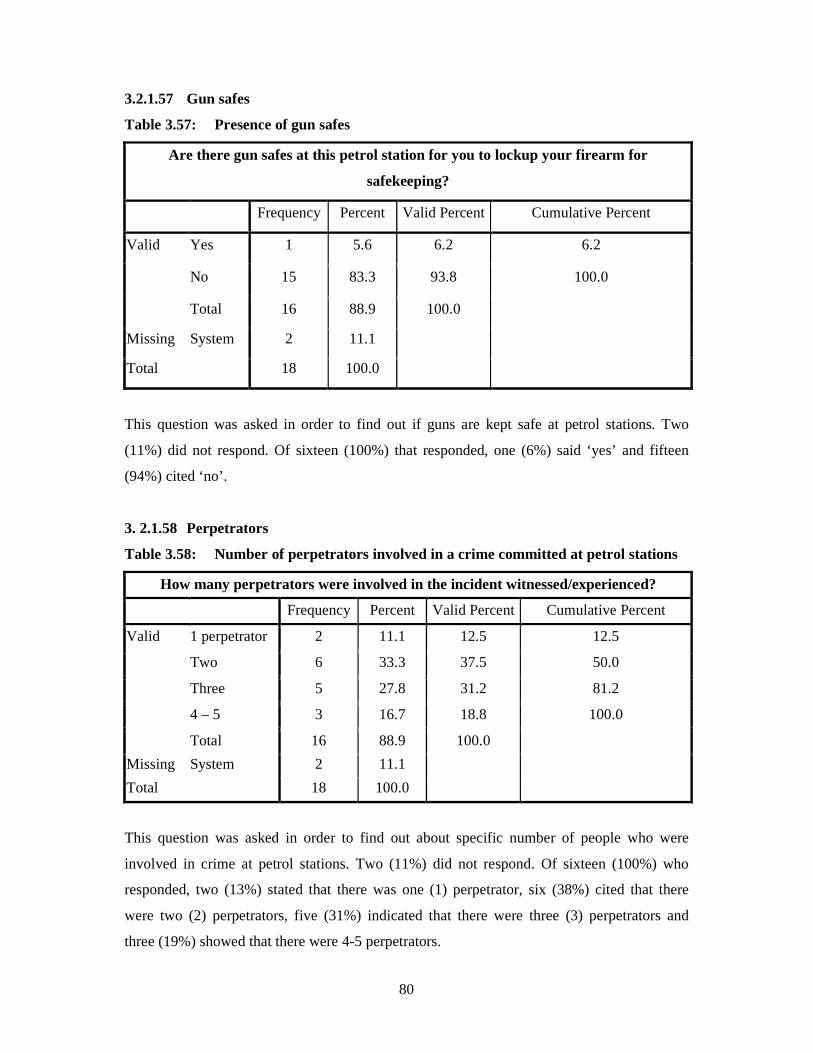
80
3.2.1.57 Gun safes
Table 3.57: Presence of gun safes
Are there gun safes at this petrol station for you to lockup your firearm for
safekeeping?
Frequency Percent Valid Percent Cumulative Percent
Valid Yes 1 5.6 6.2 6.2
No 15 83.3 93.8 100.0
Total 16 88.9 100.0
Missing System 2 11.1
Total 18 100.0
This question was asked in order to find out if guns are kept safe at petrol stations. Two
(11%) did not respond. Of sixteen (100%) that responded, one (6%) said ‘yes’ and fifteen
(94%) cited ‘no’.
3. 2.1.58 Perpetrators
Table 3.58: Number of perpetrators involved in a crime committed at petrol stations
How many perpetrators were involved in the incident witnessed/experienced?
Frequency Percent Valid Percent Cumulative Percent
Valid 1 perpetrator 2 11.1 12.5 12.5
Two 6 33.3 37.5 50.0
Three 5 27.8 31.2 81.2
4 – 5 3 16.7 18.8 100.0
Total 16 88.9 100.0
Missing System 2 11.1
Total 18 100.0
This question was asked in order to find out about specific number of people who were
involved in crime at petrol stations. Two (11%) did not respond. Of sixteen (100%) who
responded, two (13%) stated that there was one (1) perpetrator, six (38%) cited that there
were two (2) perpetrators, five (31%) indicated that there were three (3) perpetrators and
three (19%) showed that there were 4-5 perpetrators.
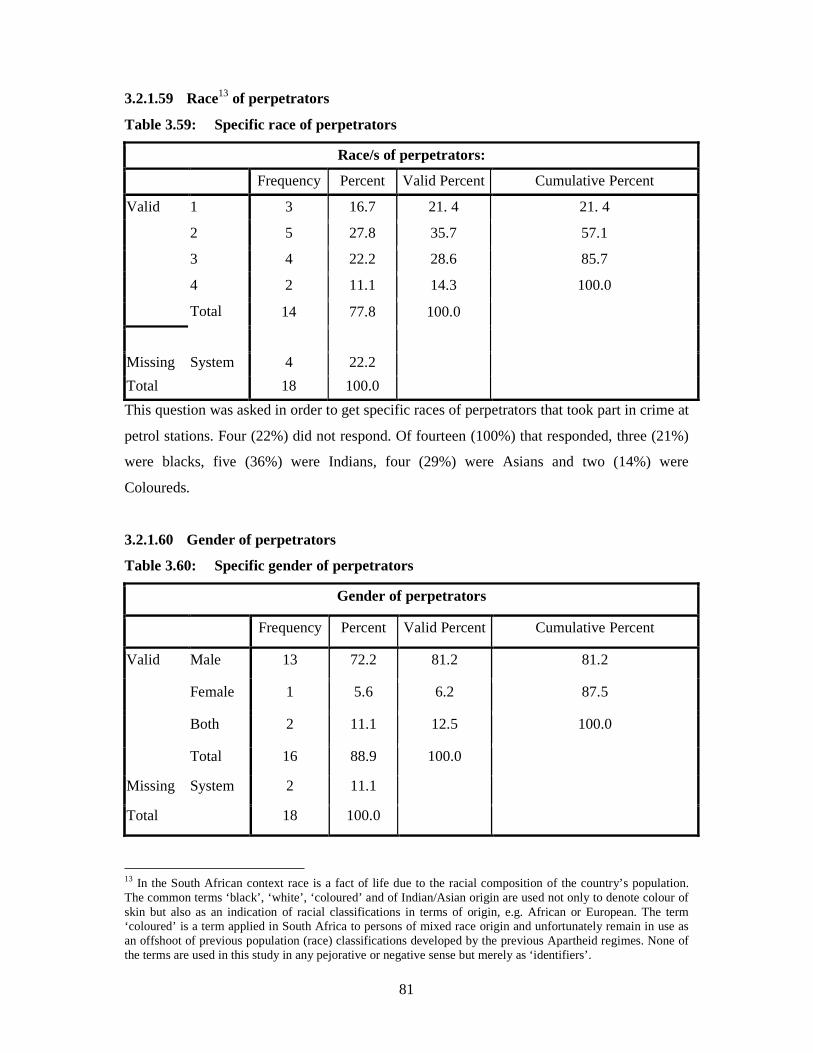
81
3.2.1.59 Race13 of perpetrators
Table 3.59: Specific race of perpetrators
Race/s of perpetrators:
Frequency Percent Valid Percent Cumulative Percent
Valid 1 3 16.7 21. 4 21. 4
2 5 27.8 35.7 57.1
3 4 22.2 28.6 85.7
4 2 11.1 14.3 100.0
Total 14 77.8 100.0
Missing System 4 22.2
Total 18 100.0
This question was asked in order to get specific races of perpetrators that took part in crime at
petrol stations. Four (22%) did not respond. Of fourteen (100%) that responded, three (21%)
were blacks, five (36%) were Indians, four (29%) were Asians and two (14%) were
Coloureds.
3.2.1.60 Gender of perpetrators
Table 3.60: Specific gender of perpetrators
Gender of perpetrators
Frequency Percent Valid Percent Cumulative Percent
Valid Male 13 72.2 81.2 81.2
Female 1 5.6 6.2 87.5
Both 2 11.1 12.5 100.0
Total 16 88.9 100.0
Missing System 2 11.1
Total 18 100.0
13 In the South African context race is a fact of life due to the racial composition of the country’s population. The common terms ‘black’, ‘white’, ‘coloured’ and of Indian/Asian origin are used not only to denote colour of skin but also as an indication of racial classifications in terms of origin, e.g. African or European. The term ‘coloured’ is a term applied in South Africa to persons of mixed race origin and unfortunately remain in use as an offshoot of previous population (race) classifications developed by the previous Apartheid regimes. None of the terms are used in this study in any pejorative or negative sense but merely as ‘identifiers’.
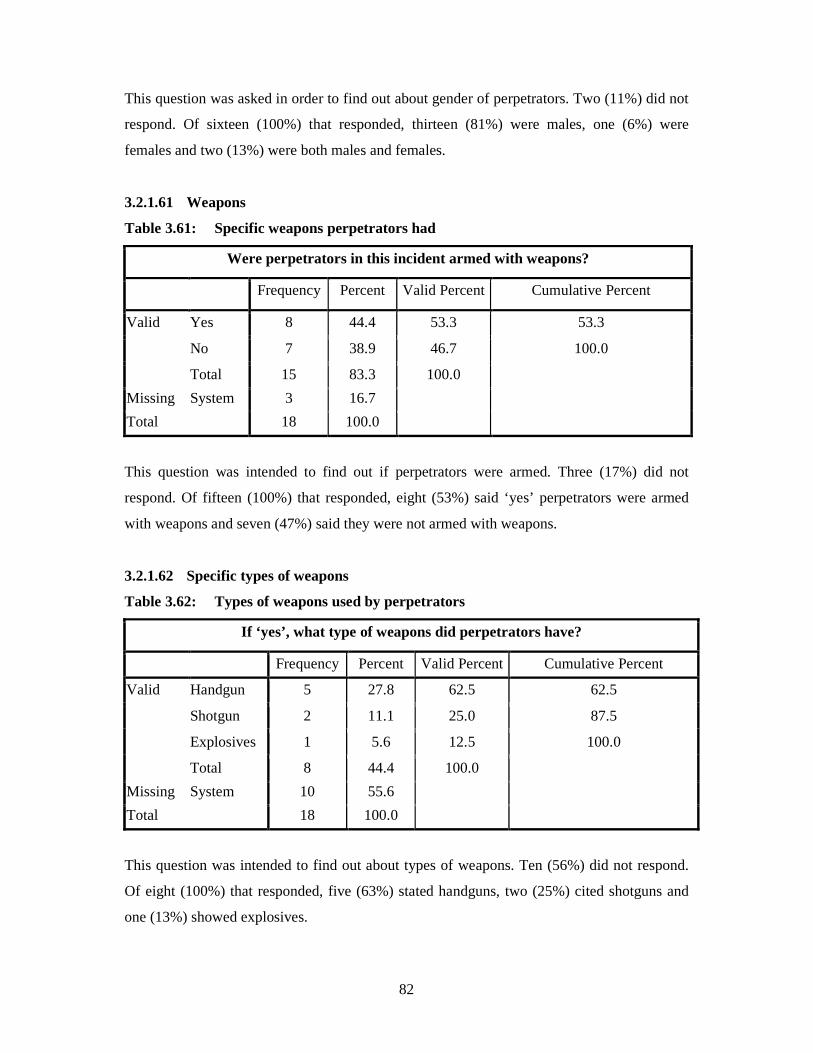
82
This question was asked in order to find out about gender of perpetrators. Two (11%) did not
respond. Of sixteen (100%) that responded, thirteen (81%) were males, one (6%) were
females and two (13%) were both males and females.
3.2.1.61 Weapons
Table 3.61: Specific weapons perpetrators had
Were perpetrators in this incident armed with weapons?
Frequency Percent Valid Percent Cumulative Percent
Valid Yes 8 44.4 53.3 53.3
No 7 38.9 46.7 100.0
Total 15 83.3 100.0
Missing System 3 16.7
Total 18 100.0
This question was intended to find out if perpetrators were armed. Three (17%) did not
respond. Of fifteen (100%) that responded, eight (53%) said ‘yes’ perpetrators were armed
with weapons and seven (47%) said they were not armed with weapons.
3.2.1.62 Specific types of weapons
Table 3.62: Types of weapons used by perpetrators
If ‘yes’, what type of weapons did perpetrators have?
Frequency Percent Valid Percent Cumulative Percent
Valid Handgun 5 27.8 62.5 62.5
Shotgun 2 11.1 25.0 87.5
Explosives 1 5.6 12.5 100.0
Total 8 44.4 100.0
Missing System 10 55.6
Total 18 100.0
This question was intended to find out about types of weapons. Ten (56%) did not respond.
Of eight (100%) that responded, five (63%) stated handguns, two (25%) cited shotguns and
one (13%) showed explosives.
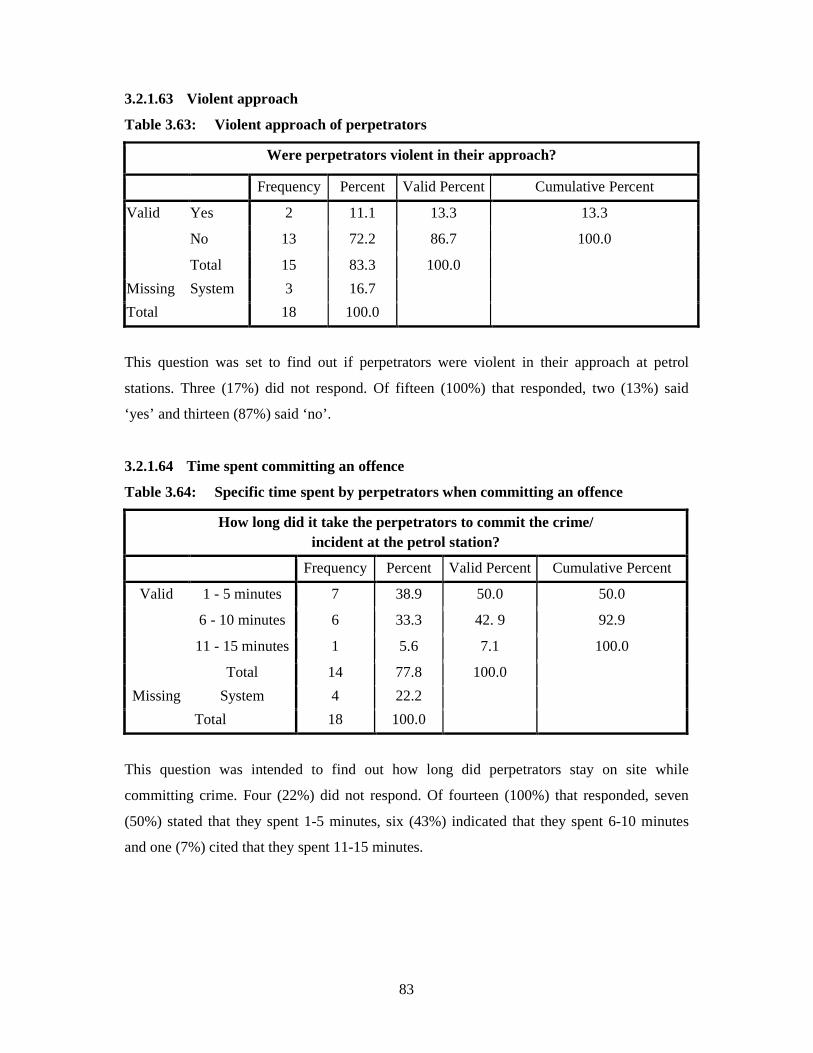
83
3.2.1.63 Violent approach
Table 3.63: Violent approach of perpetrators
Were perpetrators violent in their approach?
Frequency Percent Valid Percent Cumulative Percent
Valid Yes 2 11.1 13.3 13.3
No 13 72.2 86.7 100.0
Total 15 83.3 100.0
Missing System 3 16.7
Total 18 100.0
This question was set to find out if perpetrators were violent in their approach at petrol
stations. Three (17%) did not respond. Of fifteen (100%) that responded, two (13%) said
‘yes’ and thirteen (87%) said ‘no’.
3.2.1.64 Time spent committing an offence
Table 3.64: Specific time spent by perpetrators when committing an offence
How long did it take the perpetrators to commit the crime/ incident at the petrol station?
Frequency Percent Valid Percent Cumulative Percent
Valid 1 - 5 minutes 7 38.9 50.0 50.0
6 - 10 minutes 6 33.3 42. 9 92.9
11 - 15 minutes 1 5.6 7.1 100.0
Total 14 77.8 100.0
Missing System 4 22.2
Total 18 100.0
This question was intended to find out how long did perpetrators stay on site while
committing crime. Four (22%) did not respond. Of fourteen (100%) that responded, seven
(50%) stated that they spent 1-5 minutes, six (43%) indicated that they spent 6-10 minutes
and one (7%) cited that they spent 11-15 minutes.
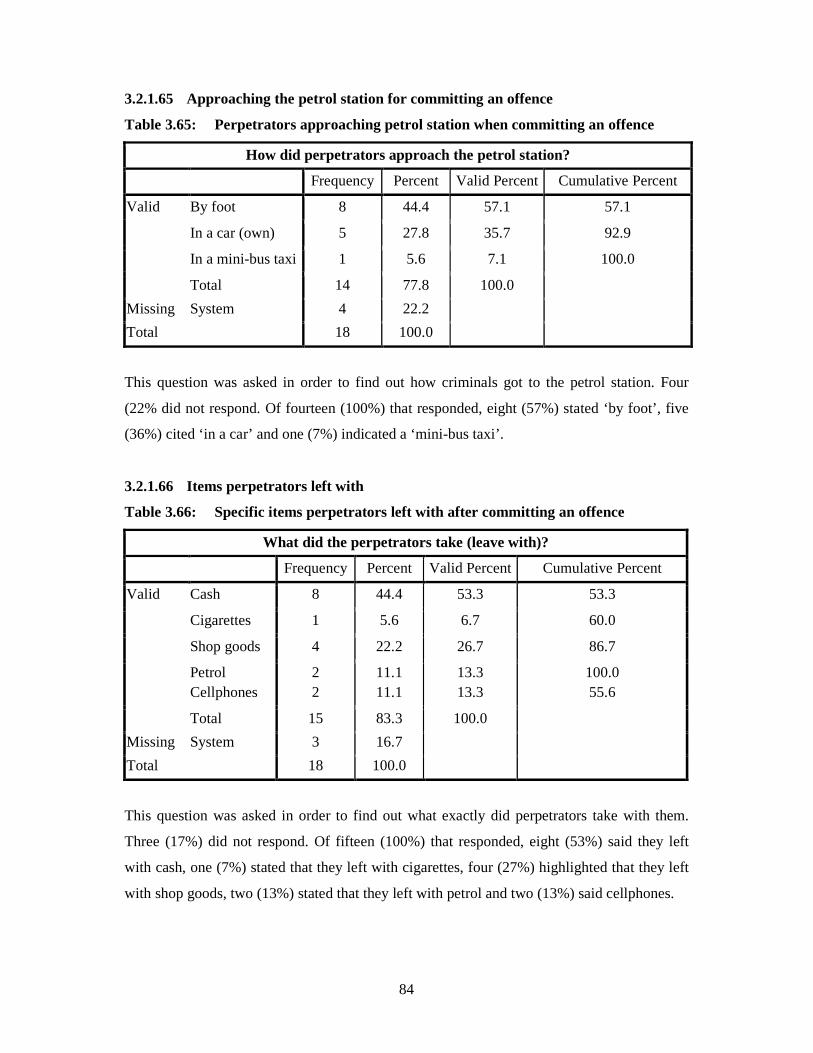
84
3.2.1.65 Approaching the petrol station for committing an offence
Table 3.65: Perpetrators approaching petrol station when committing an offence
How did perpetrators approach the petrol station?
Frequency Percent Valid Percent Cumulative Percent
Valid By foot 8 44.4 57.1 57.1
In a car (own) 5 27.8 35.7 92.9
In a mini-bus taxi 1 5.6 7.1 100.0
Total 14 77.8 100.0
Missing System 4 22.2
Total 18 100.0
This question was asked in order to find out how criminals got to the petrol station. Four
(22% did not respond. Of fourteen (100%) that responded, eight (57%) stated ‘by foot’, five
(36%) cited ‘in a car’ and one (7%) indicated a ‘mini-bus taxi’.
3.2.1.66 Items perpetrators left with
Table 3.66: Specific items perpetrators left with after committing an offence
What did the perpetrators take (leave with)?
Frequency Percent Valid Percent Cumulative Percent
Valid Cash 8 44.4 53.3 53.3
Cigarettes 1 5.6 6.7 60.0
Shop goods 4 22.2 26.7 86.7
Petrol Cellphones
2 2
11.1 11.1
13.3 13.3
100.0 55.6
Total 15 83.3 100.0
Missing System 3 16.7
Total 18 100.0
This question was asked in order to find out what exactly did perpetrators take with them.
Three (17%) did not respond. Of fifteen (100%) that responded, eight (53%) said they left
with cash, one (7%) stated that they left with cigarettes, four (27%) highlighted that they left
with shop goods, two (13%) stated that they left with petrol and two (13%) said cellphones.
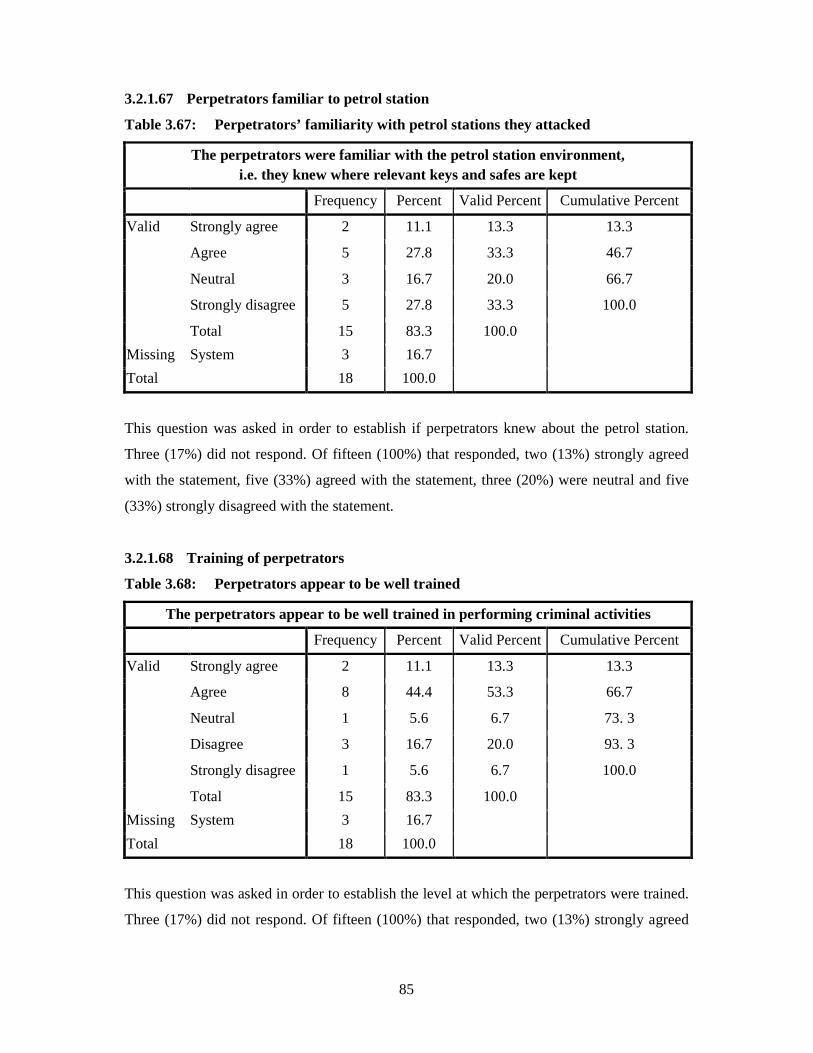
85
3.2.1.67 Perpetrators familiar to petrol station
Table 3.67: Perpetrators’ familiarity with petrol stations they attacked
The perpetrators were familiar with the petrol station environment, i.e. they knew where relevant keys and safes are kept
Frequency Percent Valid Percent Cumulative Percent
Valid Strongly agree 2 11.1 13.3 13.3
Agree 5 27.8 33.3 46.7
Neutral 3 16.7 20.0 66.7
Strongly disagree 5 27.8 33.3 100.0
Total 15 83.3 100.0
Missing System 3 16.7
Total 18 100.0
This question was asked in order to establish if perpetrators knew about the petrol station.
Three (17%) did not respond. Of fifteen (100%) that responded, two (13%) strongly agreed
with the statement, five (33%) agreed with the statement, three (20%) were neutral and five
(33%) strongly disagreed with the statement.
3.2.1.68 Training of perpetrators
Table 3.68: Perpetrators appear to be well trained
The perpetrators appear to be well trained in performing criminal activities
Frequency Percent Valid Percent Cumulative Percent
Valid Strongly agree 2 11.1 13.3 13.3
Agree 8 44.4 53.3 66.7
Neutral 1 5.6 6.7 73. 3
Disagree 3 16.7 20.0 93. 3
Strongly disagree 1 5.6 6.7 100.0
Total 15 83.3 100.0
Missing System 3 16.7
Total 18 100.0
This question was asked in order to establish the level at which the perpetrators were trained.
Three (17%) did not respond. Of fifteen (100%) that responded, two (13%) strongly agreed
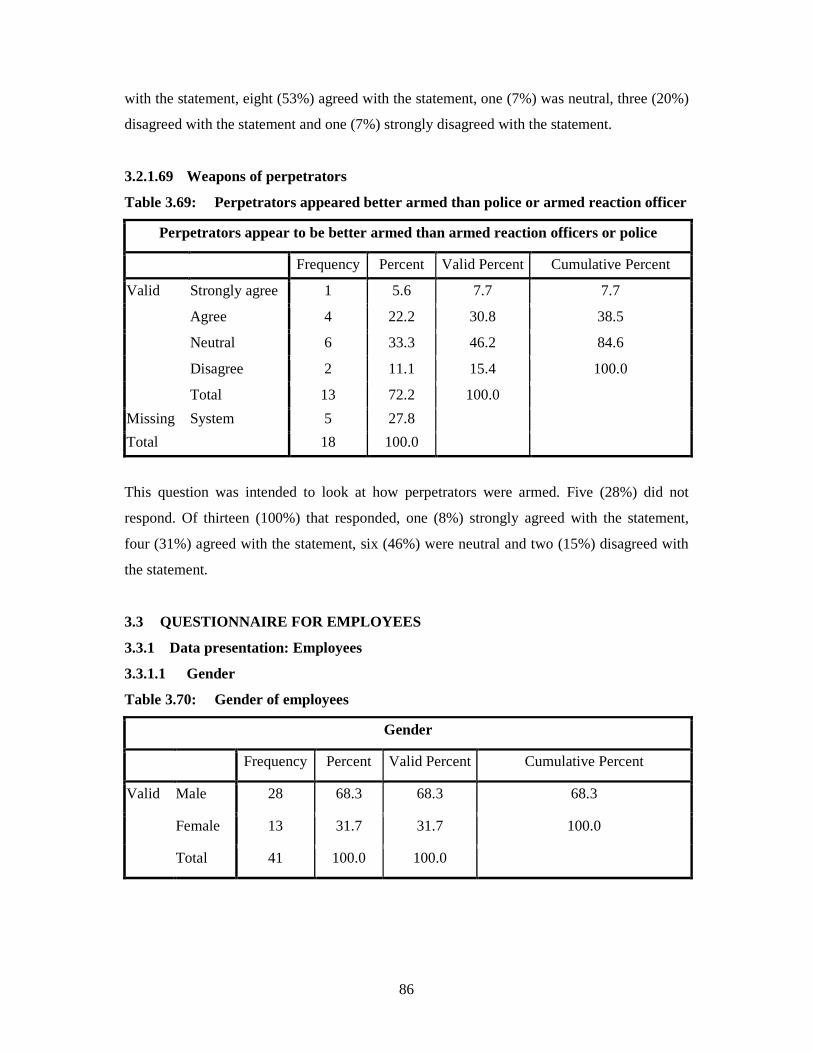
86
with the statement, eight (53%) agreed with the statement, one (7%) was neutral, three (20%)
disagreed with the statement and one (7%) strongly disagreed with the statement.
3.2.1.69 Weapons of perpetrators
Table 3.69: Perpetrators appeared better armed than police or armed reaction officer
Perpetrators appear to be better armed than armed reaction officers or police
Frequency Percent Valid Percent Cumulative Percent
Valid Strongly agree 1 5.6 7.7 7.7
Agree 4 22.2 30.8 38.5
Neutral 6 33.3 46.2 84.6
Disagree 2 11.1 15.4 100.0
Total 13 72.2 100.0
Missing System 5 27.8
Total 18 100.0
This question was intended to look at how perpetrators were armed. Five (28%) did not
respond. Of thirteen (100%) that responded, one (8%) strongly agreed with the statement,
four (31%) agreed with the statement, six (46%) were neutral and two (15%) disagreed with
the statement.
3.3 QUESTIONNAIRE FOR EMPLOYEES
3.3.1 Data presentation: Employees
3.3.1.1 Gender
Table 3.70: Gender of employees
Gender
Frequency Percent Valid Percent Cumulative Percent
Valid Male 28 68.3 68.3 68.3
Female 13 31.7 31.7 100.0
Total 41 100.0 100.0
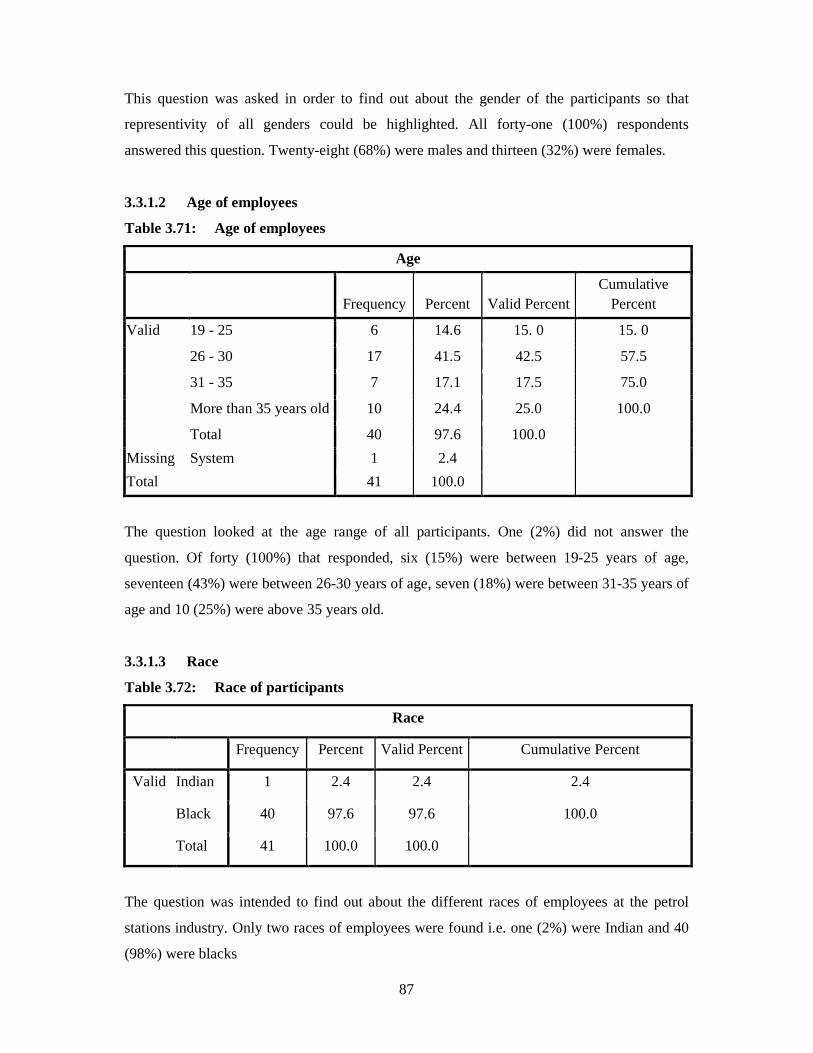
87
This question was asked in order to find out about the gender of the participants so that
representivity of all genders could be highlighted. All forty-one (100%) respondents
answered this question. Twenty-eight (68%) were males and thirteen (32%) were females.
3.3.1.2 Age of employees
Table 3.71: Age of employees
Age
Frequency Percent Valid Percent
Cumulative Percent
Valid 19 - 25 6 14.6 15. 0 15. 0
26 - 30 17 41.5 42.5 57.5
31 - 35 7 17.1 17.5 75.0
More than 35 years old 10 24.4 25.0 100.0
Total 40 97.6 100.0
Missing System 1 2.4
Total 41 100.0
The question looked at the age range of all participants. One (2%) did not answer the
question. Of forty (100%) that responded, six (15%) were between 19-25 years of age,
seventeen (43%) were between 26-30 years of age, seven (18%) were between 31-35 years of
age and 10 (25%) were above 35 years old.
3.3.1.3 Race
Table 3.72: Race of participants
Race
Frequency Percent Valid Percent Cumulative Percent
Valid Indian 1 2.4 2.4 2.4
Black 40 97.6 97.6 100.0
Total 41 100.0 100.0
The question was intended to find out about the different races of employees at the petrol
stations industry. Only two races of employees were found i.e. one (2%) were Indian and 40
(98%) were blacks
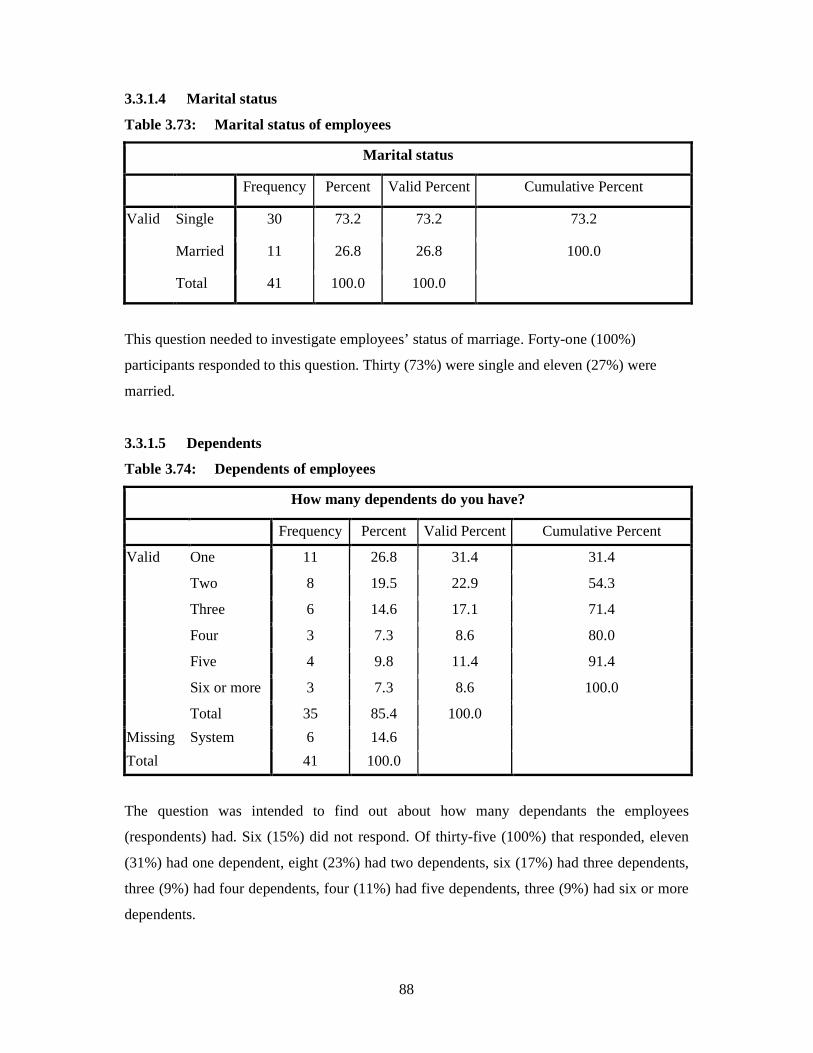
88
3.3.1.4 Marital status
Table 3.73: Marital status of employees
Marital status
Frequency Percent Valid Percent Cumulative Percent
Valid Single 30 73.2 73.2 73.2
Married 11 26.8 26.8 100.0
Total 41 100.0 100.0
This question needed to investigate employees’ status of marriage. Forty-one (100%)
participants responded to this question. Thirty (73%) were single and eleven (27%) were
married.
3.3.1.5 Dependents
Table 3.74: Dependents of employees
How many dependents do you have?
Frequency Percent Valid Percent Cumulative Percent
Valid One 11 26.8 31.4 31.4
Two 8 19.5 22.9 54.3
Three 6 14.6 17.1 71.4
Four 3 7.3 8.6 80.0
Five 4 9.8 11.4 91.4
Six or more 3 7.3 8.6 100.0
Total 35 85.4 100.0
Missing System 6 14.6
Total 41 100.0
The question was intended to find out about how many dependants the employees
(respondents) had. Six (15%) did not respond. Of thirty-five (100%) that responded, eleven
(31%) had one dependent, eight (23%) had two dependents, six (17%) had three dependents,
three (9%) had four dependents, four (11%) had five dependents, three (9%) had six or more
dependents.

89
3.3.1.6 Highest educational qualifications
Table 3.75: Employees’ highest educational qualifications
What is your highest educational qualification?
Frequency Percent
Valid Percent
Cumulative Percent
Valid Std 6/Grade 8 1 2.4 2.4 2.4
Std 7/Grade 9 3 7.3 7.3 9.8
Std 8/Grade 10 6 14.6 14.6 24.4
Std 9/Grade 11 4 9.8 9.8 34.1
Std 10/Grade 12 25 61.0 61.0 95.1
1-year certificate/diploma (FETC) 2 4.9 4.9 100.0
Total 41 100.0 100.0
This question was intended to find out about employees’ level of education. All forty-one
(100%) participants responded to this question. One (2%) had Standard 6/Grade 8, three (7%)
had Standard 7/Grade 9, six (15%) had Standard 8/Grade 10, four (10%) had Standard
9/Grade 11, twenty-five (61%) had Standard 10/Grade 12 and two (5%) had 1 year certificate
or diploma.
3.3.1.7 Employees’ positions
Table 3.76: Current positions of employees
What is your current work position?
Frequency Percent Valid Percent Cumulative Percent
Valid Petrol attendant 16 39.0 40.0 40.0
Cashier 14 34.1 35. 0 75.0
Supervisor 8 19.5 20.0 95. 0
Manager 2 4.9 5. 0 100.0
Total 40 97.6 100.0
Missing System 1 2.4
Total 41 100.0
The question aimed at verifying employees’ positions at their workplaces. One (2%) did not
answer. Of forty (100%) that responded, sixteen (40%) were petrol attendants, fourteen
(35%) were cashiers, eight (20%) were supervisors and two (5%) were managers.
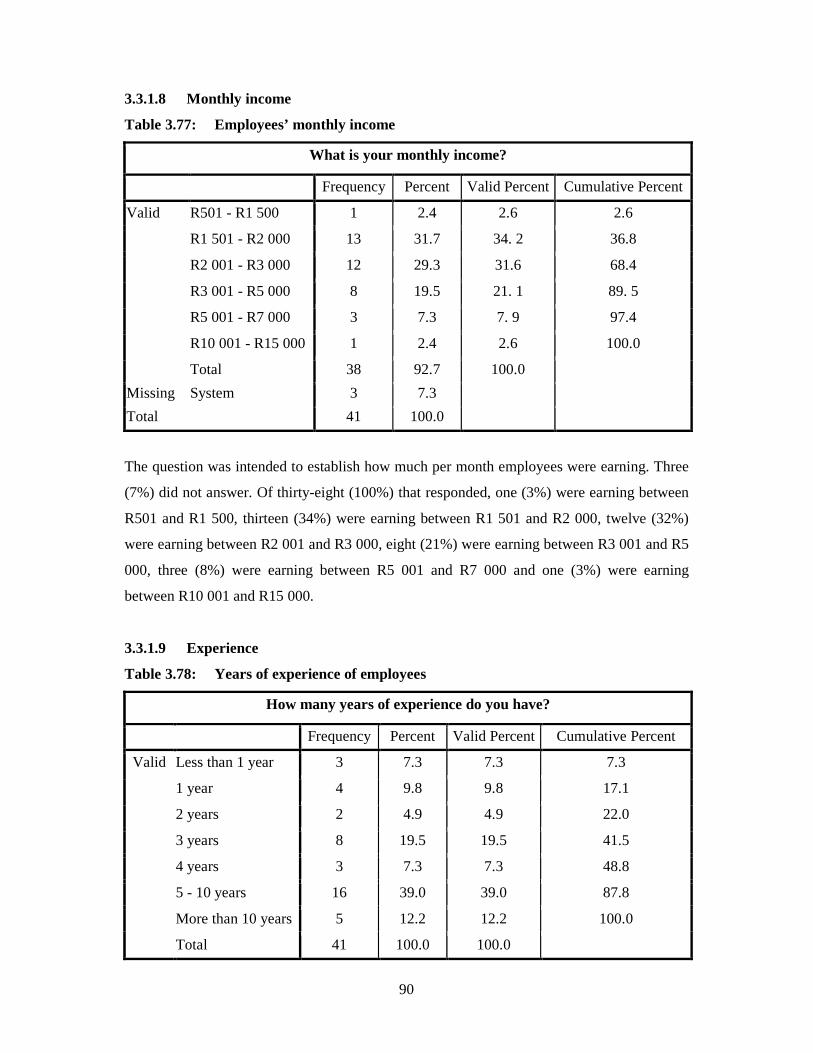
90
3.3.1.8 Monthly income
Table 3.77: Employees’ monthly income
What is your monthly income?
Frequency Percent Valid Percent Cumulative Percent
Valid R501 - R1 500 1 2.4 2.6 2.6
R1 501 - R2 000 13 31.7 34. 2 36.8
R2 001 - R3 000 12 29.3 31.6 68.4
R3 001 - R5 000 8 19.5 21. 1 89. 5
R5 001 - R7 000 3 7.3 7. 9 97.4
R10 001 - R15 000 1 2.4 2.6 100.0
Total 38 92.7 100.0
Missing System 3 7.3
Total 41 100.0
The question was intended to establish how much per month employees were earning. Three
(7%) did not answer. Of thirty-eight (100%) that responded, one (3%) were earning between
R501 and R1 500, thirteen (34%) were earning between R1 501 and R2 000, twelve (32%)
were earning between R2 001 and R3 000, eight (21%) were earning between R3 001 and R5
000, three (8%) were earning between R5 001 and R7 000 and one (3%) were earning
between R10 001 and R15 000.
3.3.1.9 Experience
Table 3.78: Years of experience of employees
How many years of experience do you have?
Frequency Percent Valid Percent Cumulative Percent
Valid Less than 1 year 3 7.3 7.3 7.3
1 year 4 9.8 9.8 17.1
2 years 2 4.9 4.9 22.0
3 years 8 19.5 19.5 41.5
4 years 3 7.3 7.3 48.8
5 - 10 years 16 39.0 39.0 87.8
More than 10 years 5 12.2 12.2 100.0
Total 41 100.0 100.0
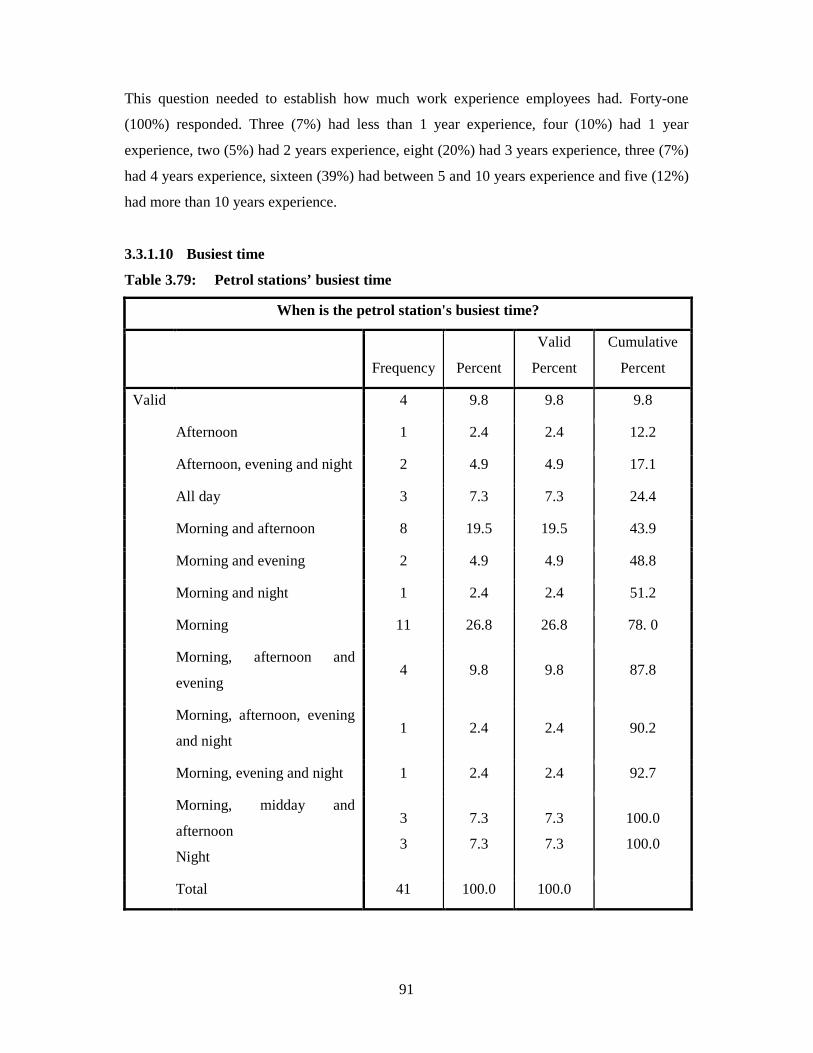
91
This question needed to establish how much work experience employees had. Forty-one
(100%) responded. Three (7%) had less than 1 year experience, four (10%) had 1 year
experience, two (5%) had 2 years experience, eight (20%) had 3 years experience, three (7%)
had 4 years experience, sixteen (39%) had between 5 and 10 years experience and five (12%)
had more than 10 years experience.
3.3.1.10 Busiest time
Table 3.79: Petrol stations’ busiest time
When is the petrol station's busiest time?
Frequency Percent
Valid
Percent
Cumulative
Percent
Valid 4 9.8 9.8 9.8
Afternoon 1 2.4 2.4 12.2
Afternoon, evening and night 2 4.9 4.9 17.1
All day 3 7.3 7.3 24.4
Morning and afternoon 8 19.5 19.5 43.9
Morning and evening 2 4.9 4.9 48.8
Morning and night 1 2.4 2.4 51.2
Morning 11 26.8 26.8 78. 0
Morning, afternoon and
evening 4 9.8 9.8 87.8
Morning, afternoon, evening
and night 1 2.4 2.4 90.2
Morning, evening and night 1 2.4 2.4 92.7
Morning, midday and
afternoon
Night
3
3
7.3
7.3
7.3
7.3
100.0
100.0
Total 41 100.0 100.0
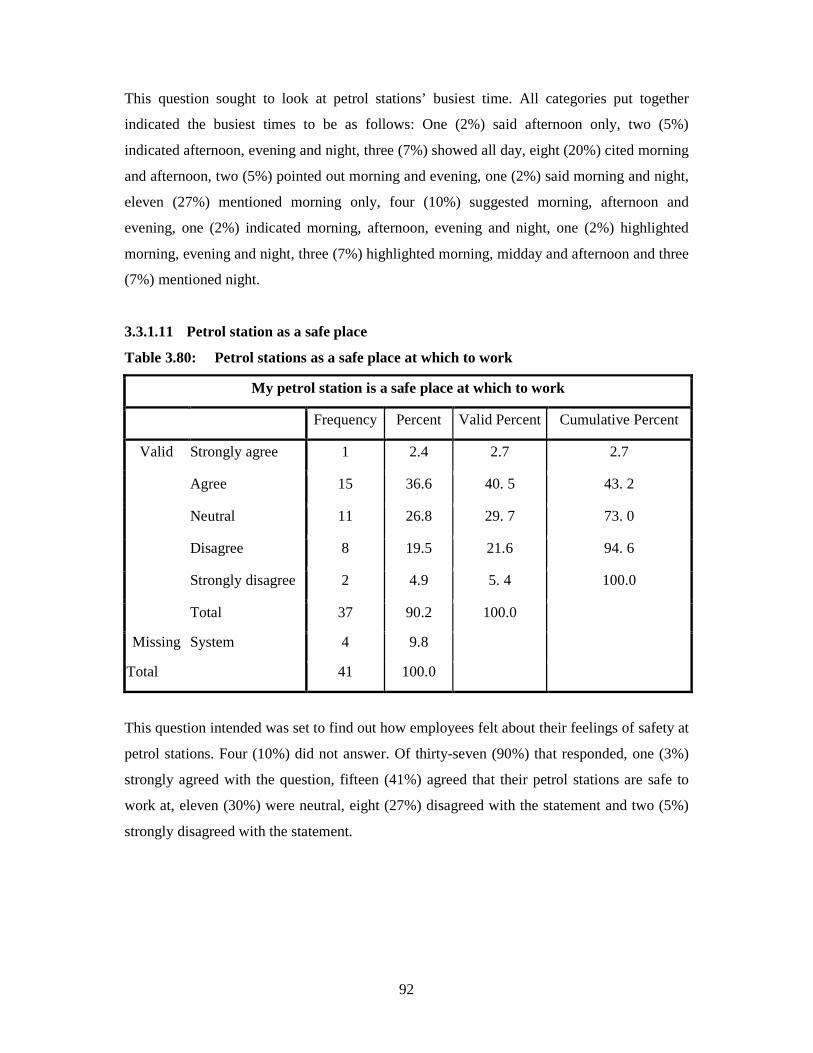
92
This question sought to look at petrol stations’ busiest time. All categories put together
indicated the busiest times to be as follows: One (2%) said afternoon only, two (5%)
indicated afternoon, evening and night, three (7%) showed all day, eight (20%) cited morning
and afternoon, two (5%) pointed out morning and evening, one (2%) said morning and night,
eleven (27%) mentioned morning only, four (10%) suggested morning, afternoon and
evening, one (2%) indicated morning, afternoon, evening and night, one (2%) highlighted
morning, evening and night, three (7%) highlighted morning, midday and afternoon and three
(7%) mentioned night.
3.3.1.11 Petrol station as a safe place
Table 3.80: Petrol stations as a safe place at which to work
My petrol station is a safe place at which to work
Frequency Percent Valid Percent Cumulative Percent
Valid Strongly agree 1 2.4 2.7 2.7
Agree 15 36.6 40. 5 43. 2
Neutral 11 26.8 29. 7 73. 0
Disagree 8 19.5 21.6 94. 6
Strongly disagree 2 4.9 5. 4 100.0
Total 37 90.2 100.0
Missing System 4 9.8
Total 41 100.0
This question intended was set to find out how employees felt about their feelings of safety at
petrol stations. Four (10%) did not answer. Of thirty-seven (90%) that responded, one (3%)
strongly agreed with the question, fifteen (41%) agreed that their petrol stations are safe to
work at, eleven (30%) were neutral, eight (27%) disagreed with the statement and two (5%)
strongly disagreed with the statement.

93
3.3.1.12 Feeling of safety
Table 3.81: Employees feeling of safety at petrol station
On a scale of 1 to 5, rate how safe you feel at the petrol station
Frequency Percent Valid Percent Cumulative Percent
Valid 1 7 17.1 18.9 18.9
2 7 17.1 18.9 37.8
3 8 19.5 21.6 59.5
4 6 14.6 16.2 75.7
5 9 22.0 24.3 100.0
Total 37 90.2 100.0
Missing System 4 9.8
Total 41 100.0
This question aimed at establishing how employees would rate their safety at petrol stations.
Four (10%) did not answer. Of thirty-seven (90%) who answered, seven (19%) felt ‘very
safe’; seven (19%) felt ‘safe’; eight (27%) were ‘neutral’; six (16%) indicated that they were
feeling unsafe and nine (24%) indicated that they were feeling very unsafe.
3.3.1.13 Main crime problems
Table 3.82: The main crime problems at petrol stations
What are the main crime problems currently being experienced at your petrol station? (Prioritise them from 1 to 5, with 1 being the biggest problem)
Frequency Percentage
Burglary 1 2.4
ATM crimes (e.g. bombing) 1 2.4
Theft 10 24.4
Robbery 10 24.4
Armed robbery 14 34.1
Vehicle theft 2 4.9
Hijacking of staff or customers 1 2.4
Retail shrinkage (shoplifting and employee theft) 13 31.7
Assault 5 12.2
Petrol card fraud 19 46.3
Vandalism to the security measures or malicious damage to the property
4 9.8
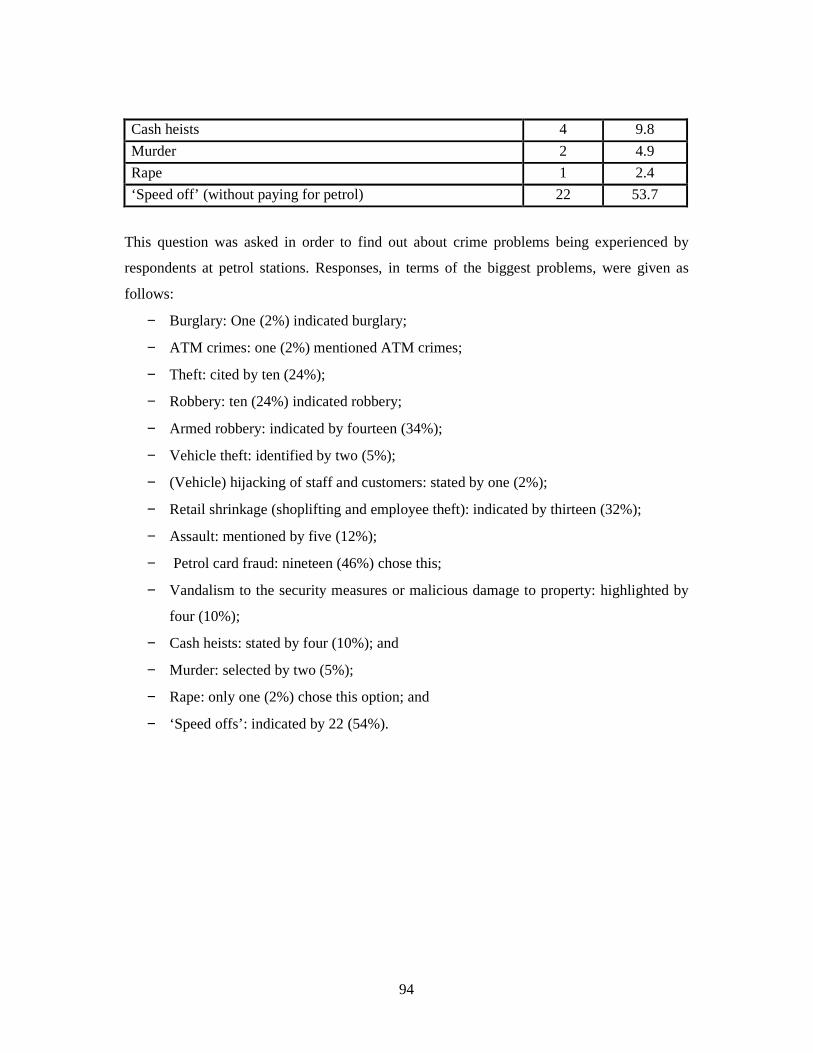
94
This question was asked in order to find out about crime problems being experienced by
respondents at petrol stations. Responses, in terms of the biggest problems, were given as
follows:
− Burglary: One (2%) indicated burglary;
− ATM crimes: one (2%) mentioned ATM crimes;
− Theft: cited by ten (24%);
− Robbery: ten (24%) indicated robbery;
− Armed robbery: indicated by fourteen (34%);
− Vehicle theft: identified by two (5%);
− (Vehicle) hijacking of staff and customers: stated by one (2%);
− Retail shrinkage (shoplifting and employee theft): indicated by thirteen (32%);
− Assault: mentioned by five (12%);
− Petrol card fraud: nineteen (46%) chose this;
− Vandalism to the security measures or malicious damage to property: highlighted by
four (10%);
− Cash heists: stated by four (10%); and
− Murder: selected by two (5%);
− Rape: only one (2%) chose this option; and
− ‘Speed offs’: indicated by 22 (54%).
Cash heists 4 9.8
Murder 2 4.9
Rape 1 2.4
‘Speed off’ (without paying for petrol) 22 53.7
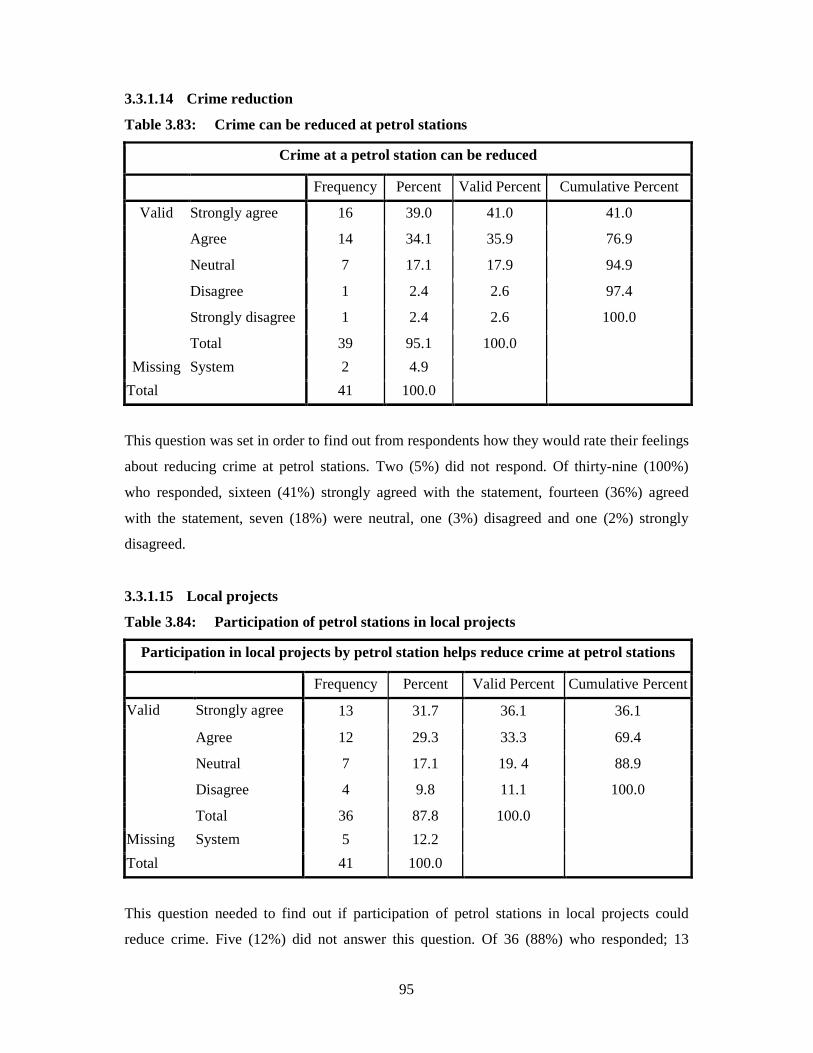
95
3.3.1.14 Crime reduction
Table 3.83: Crime can be reduced at petrol stations
Crime at a petrol station can be reduced
Frequency Percent Valid Percent Cumulative Percent
Valid Strongly agree 16 39.0 41.0 41.0
Agree 14 34.1 35.9 76.9
Neutral 7 17.1 17.9 94.9
Disagree 1 2.4 2.6 97.4
Strongly disagree 1 2.4 2.6 100.0
Total 39 95.1 100.0
Missing System 2 4.9
Total 41 100.0
This question was set in order to find out from respondents how they would rate their feelings
about reducing crime at petrol stations. Two (5%) did not respond. Of thirty-nine (100%)
who responded, sixteen (41%) strongly agreed with the statement, fourteen (36%) agreed
with the statement, seven (18%) were neutral, one (3%) disagreed and one (2%) strongly
disagreed.
3.3.1.15 Local projects
Table 3.84: Participation of petrol stations in local projects
Participation in local projects by petrol station helps reduce crime at petrol stations
Frequency Percent Valid Percent Cumulative Percent
Valid Strongly agree 13 31.7 36.1 36.1
Agree 12 29.3 33.3 69.4
Neutral 7 17.1 19. 4 88.9
Disagree 4 9.8 11.1 100.0
Total 36 87.8 100.0
Missing System 5 12.2
Total 41 100.0
This question needed to find out if participation of petrol stations in local projects could
reduce crime. Five (12%) did not answer this question. Of 36 (88%) who responded; 13
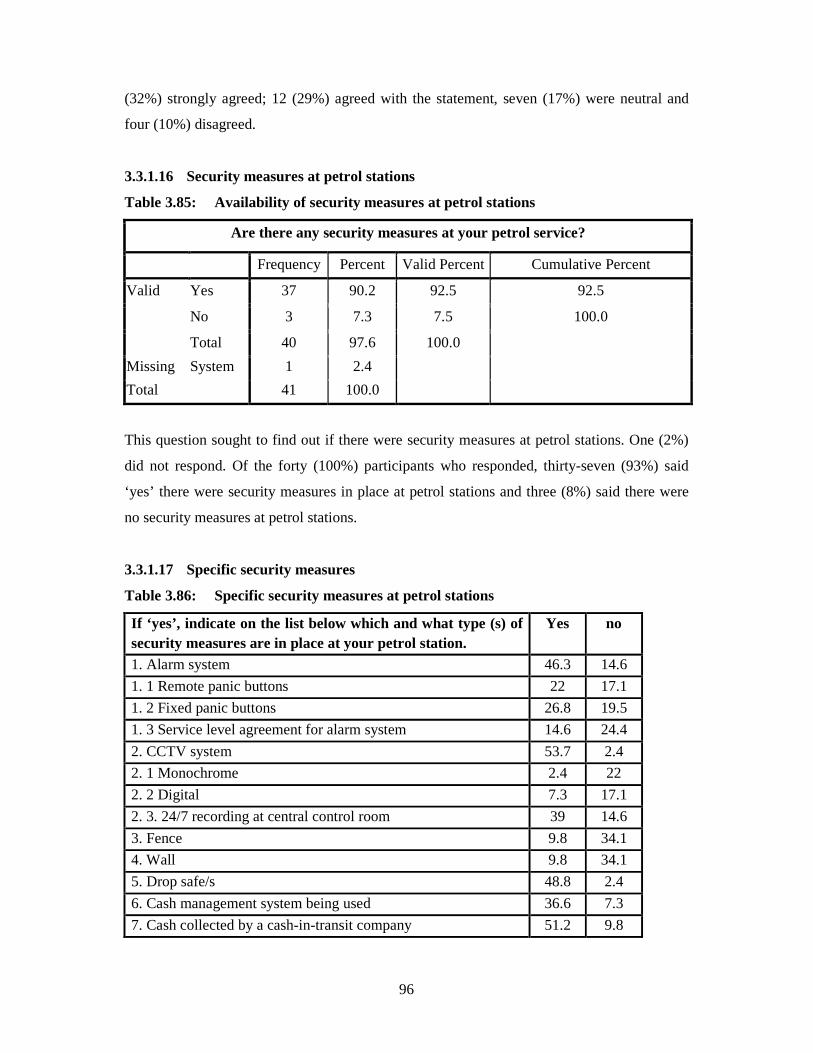
96
(32%) strongly agreed; 12 (29%) agreed with the statement, seven (17%) were neutral and
four (10%) disagreed.
3.3.1.16 Security measures at petrol stations
Table 3.85: Availability of security measures at petrol stations
Are there any security measures at your petrol service?
Frequency Percent Valid Percent Cumulative Percent
Valid Yes 37 90.2 92.5 92.5
No 3 7.3 7.5 100.0
Total 40 97.6 100.0
Missing System 1 2.4
Total 41 100.0
This question sought to find out if there were security measures at petrol stations. One (2%)
did not respond. Of the forty (100%) participants who responded, thirty-seven (93%) said
‘yes’ there were security measures in place at petrol stations and three (8%) said there were
no security measures at petrol stations.
3.3.1.17 Specific security measures
Table 3.86: Specific security measures at petrol stations
If ‘yes’, indicate on the list below which and what type (s) of security measures are in place at your petrol station.
Yes no
1. Alarm system 46.3 14.6
1. 1 Remote panic buttons 22 17.1
1. 2 Fixed panic buttons 26.8 19.5
1. 3 Service level agreement for alarm system 14.6 24.4
2. CCTV system 53.7 2.4
2. 1 Monochrome 2.4 22
2. 2 Digital 7.3 17.1
2. 3. 24/7 recording at central control room 39 14.6
3. Fence 9.8 34.1
4. Wall 9.8 34.1
5. Drop safe/s 48.8 2.4
6. Cash management system being used 36.6 7.3
7. Cash collected by a cash-in-transit company 51.2 9.8
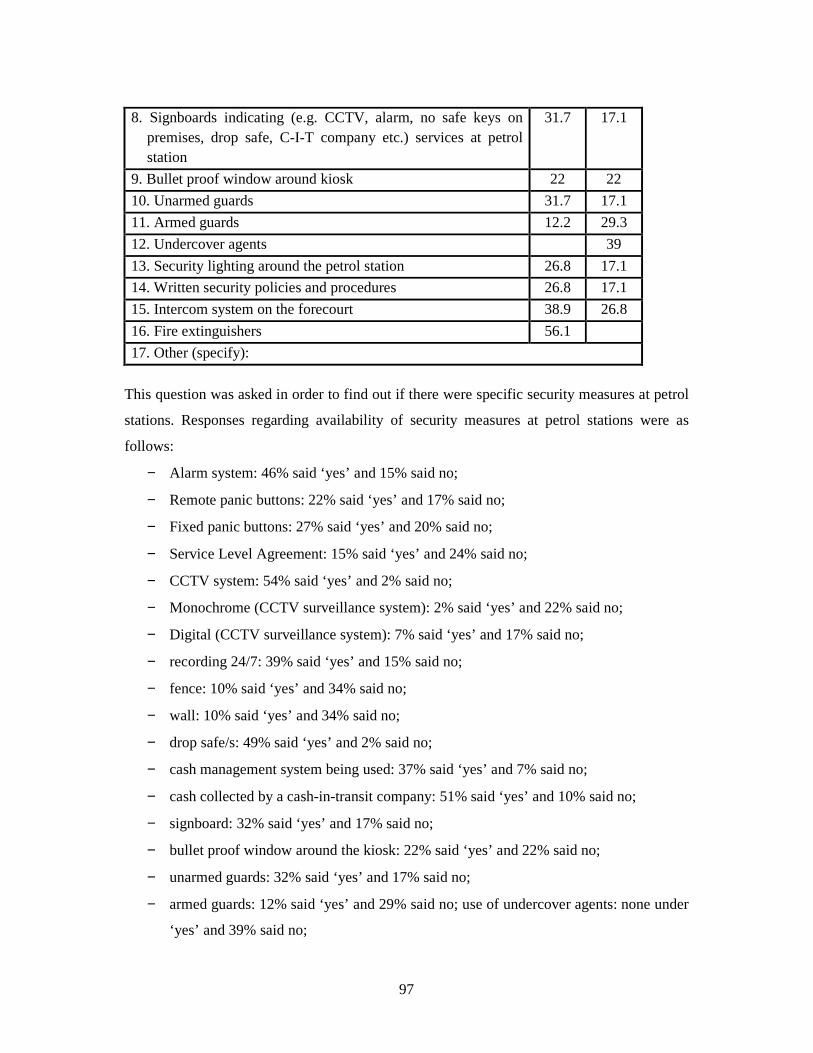
97
8. Signboards indicating (e.g. CCTV, alarm, no safe keys on
premises, drop safe, C-I-T company etc.) services at petrol station
31.7 17.1
9. Bullet proof window around kiosk 22 22
10. Unarmed guards 31.7 17.1
11. Armed guards 12.2 29.3
12. Undercover agents 39
13. Security lighting around the petrol station 26.8 17.1
14. Written security policies and procedures 26.8 17.1
15. Intercom system on the forecourt 38.9 26.8
16. Fire extinguishers 56.1
17. Other (specify):
This question was asked in order to find out if there were specific security measures at petrol
stations. Responses regarding availability of security measures at petrol stations were as
follows:
− Alarm system: 46% said ‘yes’ and 15% said no;
− Remote panic buttons: 22% said ‘yes’ and 17% said no;
− Fixed panic buttons: 27% said ‘yes’ and 20% said no;
− Service Level Agreement: 15% said ‘yes’ and 24% said no;
− CCTV system: 54% said ‘yes’ and 2% said no;
− Monochrome (CCTV surveillance system): 2% said ‘yes’ and 22% said no;
− Digital (CCTV surveillance system): 7% said ‘yes’ and 17% said no;
− recording 24/7: 39% said ‘yes’ and 15% said no;
− fence: 10% said ‘yes’ and 34% said no;
− wall: 10% said ‘yes’ and 34% said no;
− drop safe/s: 49% said ‘yes’ and 2% said no;
− cash management system being used: 37% said ‘yes’ and 7% said no;
− cash collected by a cash-in-transit company: 51% said ‘yes’ and 10% said no;
− signboard: 32% said ‘yes’ and 17% said no;
− bullet proof window around the kiosk: 22% said ‘yes’ and 22% said no;
− unarmed guards: 32% said ‘yes’ and 17% said no;
− armed guards: 12% said ‘yes’ and 29% said no; use of undercover agents: none under
‘yes’ and 39% said no;
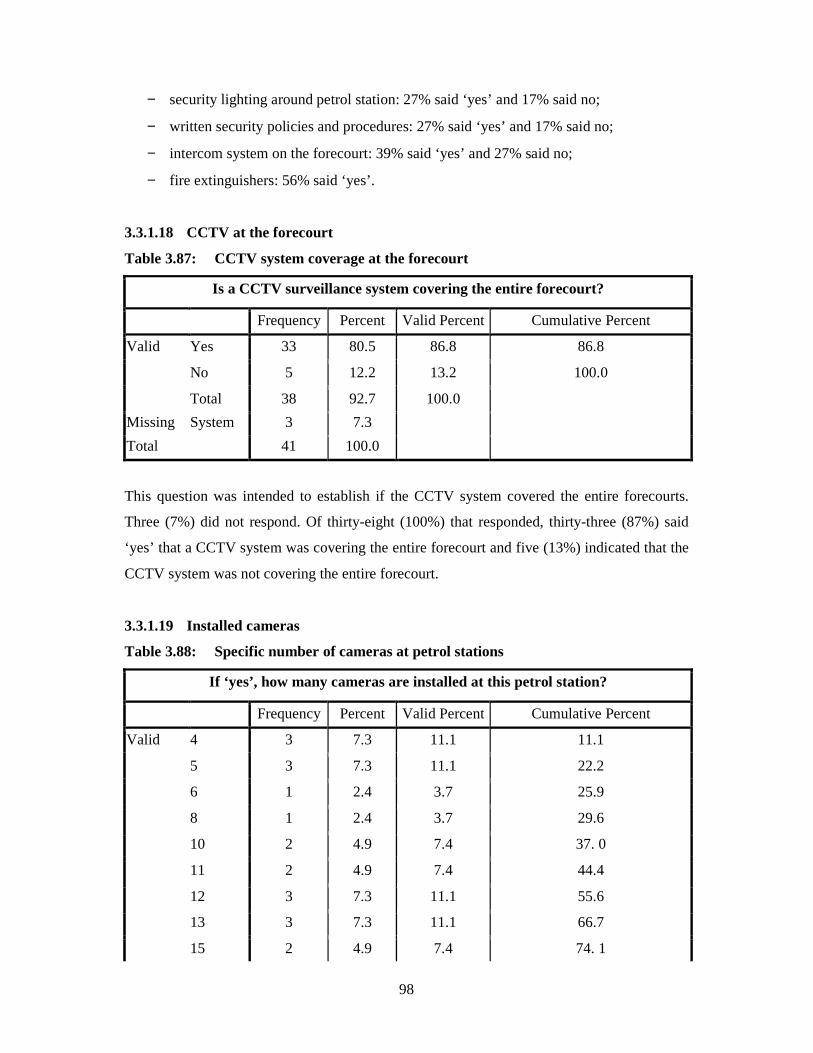
98
− security lighting around petrol station: 27% said ‘yes’ and 17% said no;
− written security policies and procedures: 27% said ‘yes’ and 17% said no;
− intercom system on the forecourt: 39% said ‘yes’ and 27% said no;
− fire extinguishers: 56% said ‘yes’.
3.3.1.18 CCTV at the forecourt
Table 3.87: CCTV system coverage at the forecourt
Is a CCTV surveillance system covering the entire forecourt?
Frequency Percent Valid Percent Cumulative Percent
Valid Yes 33 80.5 86.8 86.8
No 5 12.2 13.2 100.0
Total 38 92.7 100.0
Missing System 3 7.3
Total 41 100.0
This question was intended to establish if the CCTV system covered the entire forecourts.
Three (7%) did not respond. Of thirty-eight (100%) that responded, thirty-three (87%) said
‘yes’ that a CCTV system was covering the entire forecourt and five (13%) indicated that the
CCTV system was not covering the entire forecourt.
3.3.1.19 Installed cameras
Table 3.88: Specific number of cameras at petrol stations
If ‘yes’, how many cameras are installed at this petrol station?
Frequency Percent Valid Percent Cumulative Percent
Valid 4 3 7.3 11.1 11.1
5 3 7.3 11.1 22.2
6 1 2.4 3.7 25.9
8 1 2.4 3.7 29.6
10 2 4.9 7.4 37. 0
11 2 4.9 7.4 44.4
12 3 7.3 11.1 55.6
13 3 7.3 11.1 66.7
15 2 4.9 7.4 74. 1

99
16 1 2.4 3.7 77.8
17 1 2.4 3.7 81.5
24 2 4.9 7.4 88.9
25 1 2.4 3.7 92.6
36 2 4.9 7.4 100.0
Total 27 65.9 100.0
Missing System 14 34.1
Total 41 100.0
This question was intended to verify how many CCTV cameras are in place at petrol stations.
Fourteen (34%) did not respond. Of twenty-seven (100%) that responded, three (11%) had
four (4) cameras; three (11%) had five (5) cameras; one (4%) had six (6) cameras; one (4%)
had eight (8) cameras; two (7%) had ten (10) cameras; two (5%) had eleven (11) cameras;
three (7%) had twelve (12) cameras; three (7%) had thirteen (13) cameras; two (2%) had
fifteen (15) cameras; one (2%) had sixteen (16) cameras;
one (2%) had seventeen (17) cameras; two (5%) had twenty-four (24) cameras; one (2%) had
twenty-five (25) cameras and two (5%) had thirty-six (36) cameras.
3.3.1.20 Recording for 24/7
Table 3.89: Recording done 24/7
Is camera recording done 24/7 at central control room?
Frequency Percent Valid Percent Cumulative Percent
Valid Yes 33 80.5 86.8 86.8
No 5 12.2 13.2 100.0
Total 38 92.7 100.0
Missing System 3 7.3
Total 41 100.0
This question was intended to find out if recording was done for 24 hours a day in a week at a
central control room. Three (7%) did not respond. Of thirty-eight (100%) that responded,
thirty-three (87%) said ‘yes’ recording was done at a central control room and five (13%)
indicated it was not done in a central control room.
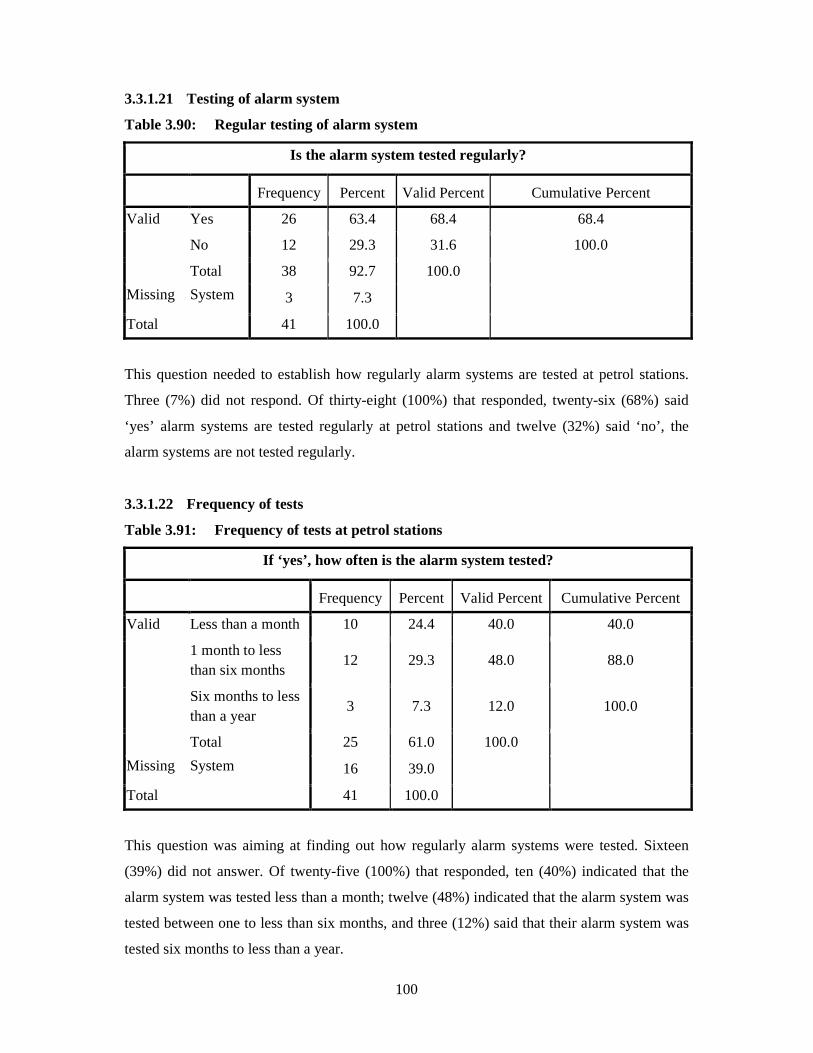
100
3.3.1.21 Testing of alarm system
Table 3.90: Regular testing of alarm system
Is the alarm system tested regularly?
Frequency Percent Valid Percent Cumulative Percent
Valid Yes 26 63.4 68.4 68.4
No 12 29.3 31.6 100.0
Total 38 92.7 100.0
Missing System 3 7.3
Total 41 100.0
This question needed to establish how regularly alarm systems are tested at petrol stations.
Three (7%) did not respond. Of thirty-eight (100%) that responded, twenty-six (68%) said
‘yes’ alarm systems are tested regularly at petrol stations and twelve (32%) said ‘no’, the
alarm systems are not tested regularly.
3.3.1.22 Frequency of tests
Table 3.91: Frequency of tests at petrol stations
If ‘yes’, how often is the alarm system tested?
Frequency Percent Valid Percent Cumulative Percent
Valid Less than a month 10 24.4 40.0 40.0
1 month to less than six months
12 29.3 48.0 88.0
Six months to less than a year
3 7.3 12.0 100.0
Total 25 61.0 100.0
Missing System 16 39.0
Total 41 100.0
This question was aiming at finding out how regularly alarm systems were tested. Sixteen
(39%) did not answer. Of twenty-five (100%) that responded, ten (40%) indicated that the
alarm system was tested less than a month; twelve (48%) indicated that the alarm system was
tested between one to less than six months, and three (12%) said that their alarm system was
tested six months to less than a year.
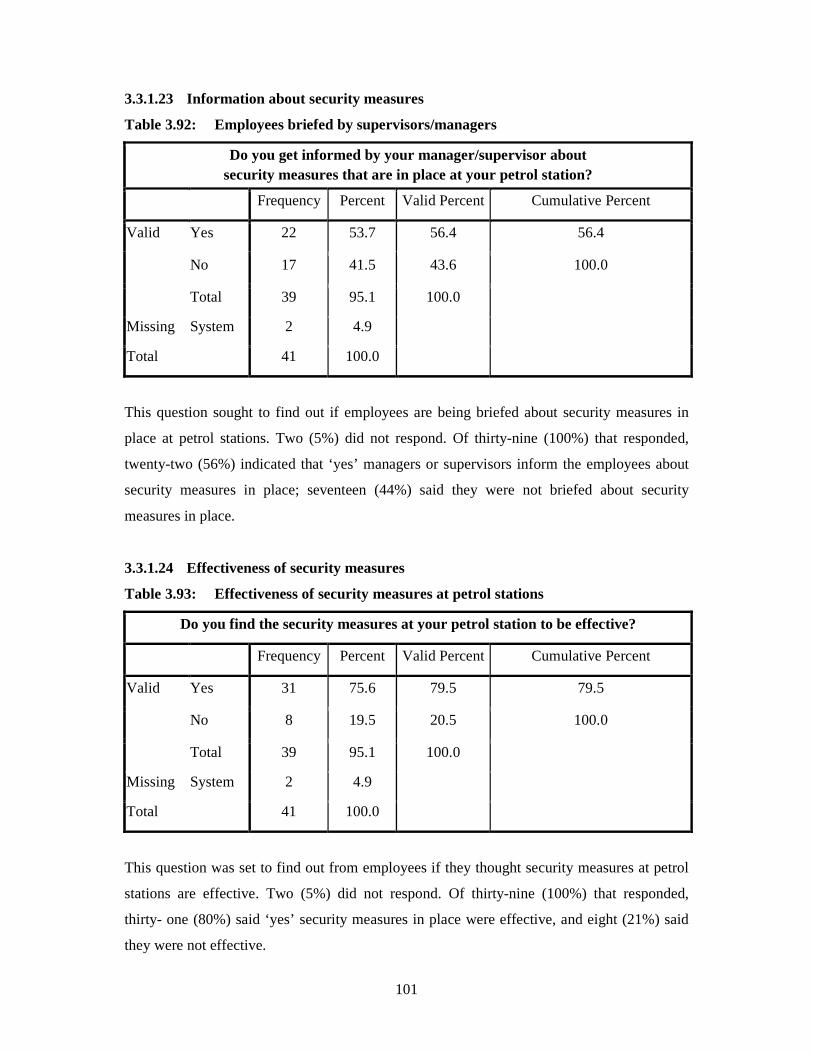
101
3.3.1.23 Information about security measures
Table 3.92: Employees briefed by supervisors/managers
Do you get informed by your manager/supervisor about security measures that are in place at your petrol station?
Frequency Percent Valid Percent Cumulative Percent
Valid Yes 22 53.7 56.4 56.4
No 17 41.5 43.6 100.0
Total 39 95.1 100.0
Missing System 2 4.9
Total 41 100.0
This question sought to find out if employees are being briefed about security measures in
place at petrol stations. Two (5%) did not respond. Of thirty-nine (100%) that responded,
twenty-two (56%) indicated that ‘yes’ managers or supervisors inform the employees about
security measures in place; seventeen (44%) said they were not briefed about security
measures in place.
3.3.1.24 Effectiveness of security measures
Table 3.93: Effectiveness of security measures at petrol stations
Do you find the security measures at your petrol station to be effective?
Frequency Percent Valid Percent Cumulative Percent
Valid Yes 31 75.6 79.5 79.5
No 8 19.5 20.5 100.0
Total 39 95.1 100.0
Missing System 2 4.9
Total 41 100.0
This question was set to find out from employees if they thought security measures at petrol
stations are effective. Two (5%) did not respond. Of thirty-nine (100%) that responded,
thirty- one (80%) said ‘yes’ security measures in place were effective, and eight (21%) said
they were not effective.
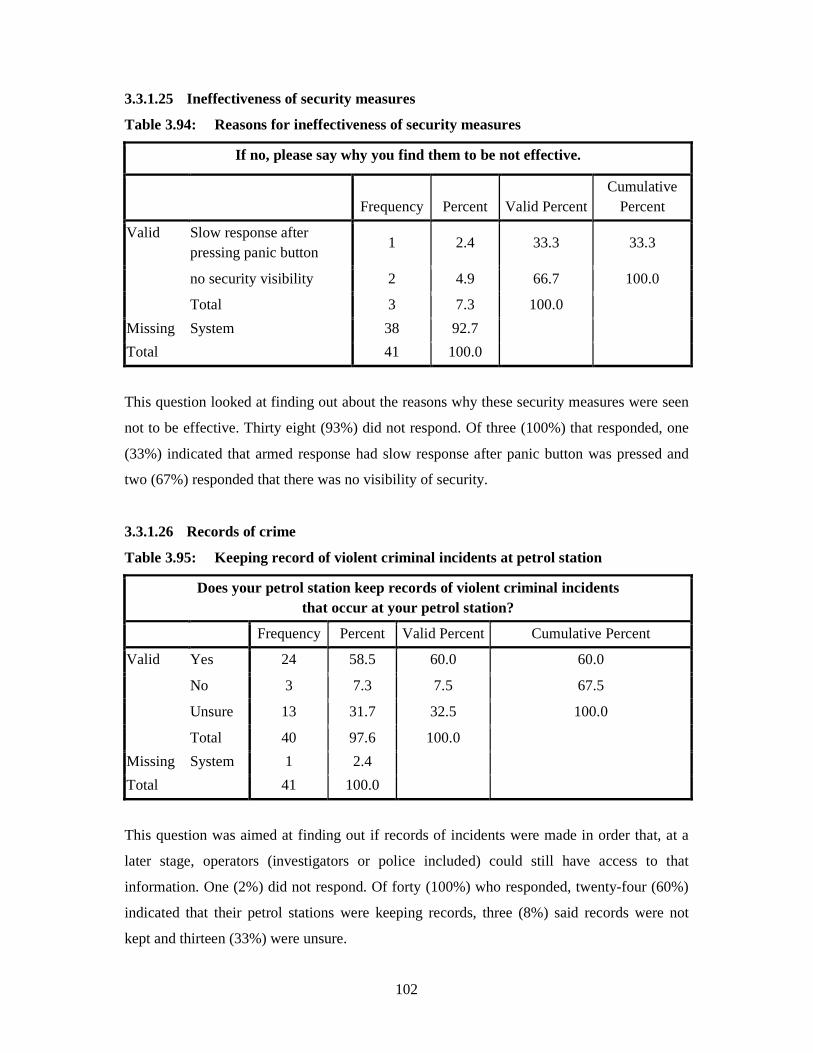
102
3.3.1.25 Ineffectiveness of security measures
Table 3.94: Reasons for ineffectiveness of security measures
If no, please say why you find them to be not effective.
Frequency Percent Valid Percent
Cumulative Percent
Valid Slow response after pressing panic button
1 2.4 33.3 33.3
no security visibility 2 4.9 66.7 100.0
Total 3 7.3 100.0
Missing System 38 92.7
Total 41 100.0
This question looked at finding out about the reasons why these security measures were seen
not to be effective. Thirty eight (93%) did not respond. Of three (100%) that responded, one
(33%) indicated that armed response had slow response after panic button was pressed and
two (67%) responded that there was no visibility of security.
3.3.1.26 Records of crime
Table 3.95: Keeping record of violent criminal incidents at petrol station
Does your petrol station keep records of violent criminal incidents that occur at your petrol station?
Frequency Percent Valid Percent Cumulative Percent
Valid Yes 24 58.5 60.0 60.0
No 3 7.3 7.5 67.5
Unsure 13 31.7 32.5 100.0
Total 40 97.6 100.0
Missing System 1 2.4
Total 41 100.0
This question was aimed at finding out if records of incidents were made in order that, at a
later stage, operators (investigators or police included) could still have access to that
information. One (2%) did not respond. Of forty (100%) who responded, twenty-four (60%)
indicated that their petrol stations were keeping records, three (8%) said records were not
kept and thirteen (33%) were unsure.
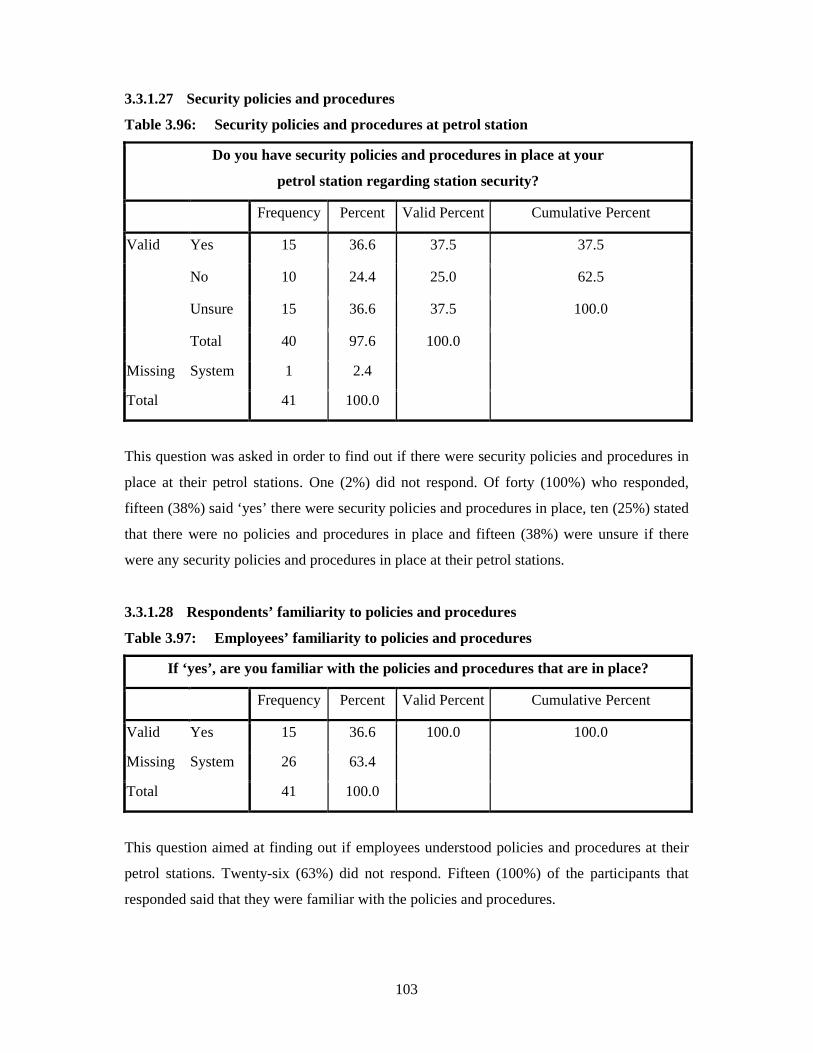
103
3.3.1.27 Security policies and procedures
Table 3.96: Security policies and procedures at petrol station
Do you have security policies and procedures in place at your
petrol station regarding station security?
Frequency Percent Valid Percent Cumulative Percent
Valid Yes 15 36.6 37.5 37.5
No 10 24.4 25.0 62.5
Unsure 15 36.6 37.5 100.0
Total 40 97.6 100.0
Missing System 1 2.4
Total 41 100.0
This question was asked in order to find out if there were security policies and procedures in
place at their petrol stations. One (2%) did not respond. Of forty (100%) who responded,
fifteen (38%) said ‘yes’ there were security policies and procedures in place, ten (25%) stated
that there were no policies and procedures in place and fifteen (38%) were unsure if there
were any security policies and procedures in place at their petrol stations.
3.3.1.28 Respondents’ familiarity to policies and procedures
Table 3.97: Employees’ familiarity to policies and procedures
If ‘yes’, are you familiar with the policies and procedures that are in place?
Frequency Percent Valid Percent Cumulative Percent
Valid Yes 15 36.6 100.0 100.0
Missing System 26 63.4
Total 41 100.0
This question aimed at finding out if employees understood policies and procedures at their
petrol stations. Twenty-six (63%) did not respond. Fifteen (100%) of the participants that
responded said that they were familiar with the policies and procedures.
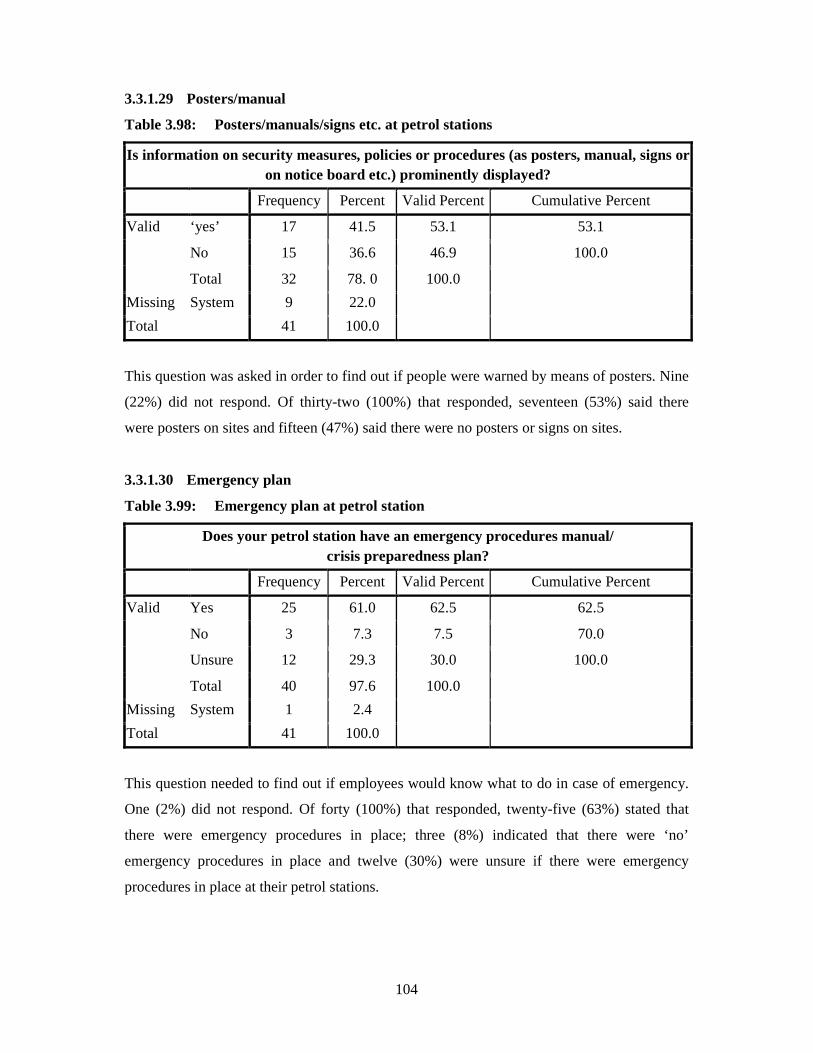
104
3.3.1.29 Posters/manual
Table 3.98: Posters/manuals/signs etc. at petrol stations
Is information on security measures, policies or procedures (as posters, manual, signs or on notice board etc.) prominently displayed?
Frequency Percent Valid Percent Cumulative Percent
Valid ‘yes’ 17 41.5 53.1 53.1
No 15 36.6 46.9 100.0
Total 32 78. 0 100.0
Missing System 9 22.0
Total 41 100.0
This question was asked in order to find out if people were warned by means of posters. Nine
(22%) did not respond. Of thirty-two (100%) that responded, seventeen (53%) said there
were posters on sites and fifteen (47%) said there were no posters or signs on sites.
3.3.1.30 Emergency plan
Table 3.99: Emergency plan at petrol station
Does your petrol station have an emergency procedures manual/ crisis preparedness plan?
Frequency Percent Valid Percent Cumulative Percent
Valid Yes 25 61.0 62.5 62.5
No 3 7.3 7.5 70.0
Unsure 12 29.3 30.0 100.0
Total 40 97.6 100.0
Missing System 1 2.4
Total 41 100.0
This question needed to find out if employees would know what to do in case of emergency.
One (2%) did not respond. Of forty (100%) that responded, twenty-five (63%) stated that
there were emergency procedures in place; three (8%) indicated that there were ‘no’
emergency procedures in place and twelve (30%) were unsure if there were emergency
procedures in place at their petrol stations.
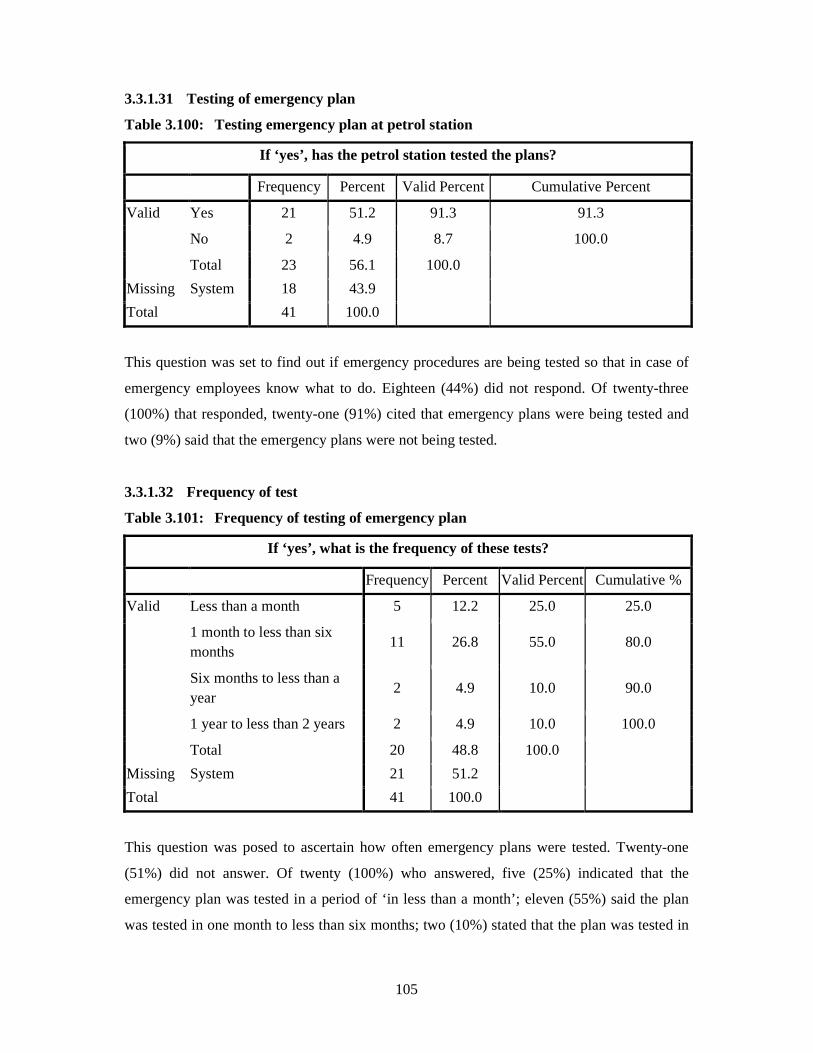
105
3.3.1.31 Testing of emergency plan
Table 3.100: Testing emergency plan at petrol station
If ‘yes’, has the petrol station tested the plans?
Frequency Percent Valid Percent Cumulative Percent
Valid Yes 21 51.2 91.3 91.3
No 2 4.9 8.7 100.0
Total 23 56.1 100.0
Missing System 18 43.9
Total 41 100.0
This question was set to find out if emergency procedures are being tested so that in case of
emergency employees know what to do. Eighteen (44%) did not respond. Of twenty-three
(100%) that responded, twenty-one (91%) cited that emergency plans were being tested and
two (9%) said that the emergency plans were not being tested.
3.3.1.32 Frequency of test
Table 3.101: Frequency of testing of emergency plan
If ‘yes’, what is the frequency of these tests?
Frequency Percent Valid Percent Cumulative %
Valid Less than a month 5 12.2 25.0 25.0
1 month to less than six months
11 26.8 55.0 80.0
Six months to less than a year
2 4.9 10.0 90.0
1 year to less than 2 years 2 4.9 10.0 100.0
Total 20 48.8 100.0
Missing System 21 51.2
Total 41 100.0
This question was posed to ascertain how often emergency plans were tested. Twenty-one
(51%) did not answer. Of twenty (100%) who answered, five (25%) indicated that the
emergency plan was tested in a period of ‘in less than a month’; eleven (55%) said the plan
was tested in one month to less than six months; two (10%) stated that the plan was tested in
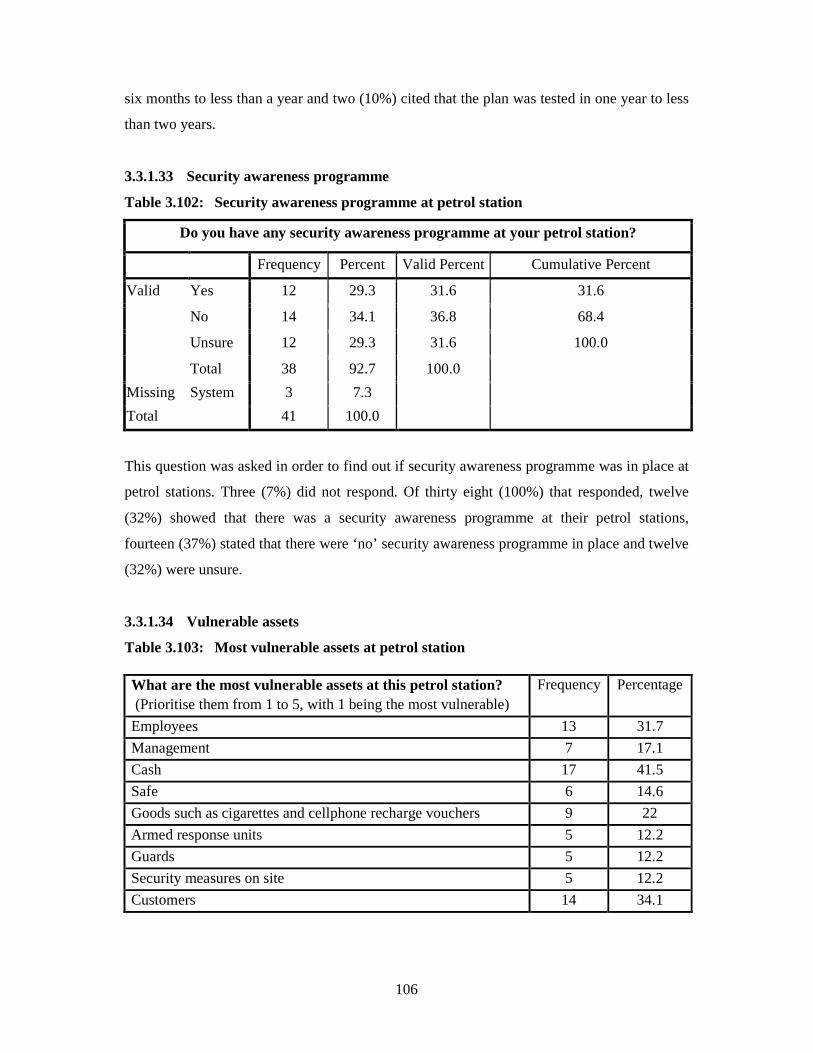
106
six months to less than a year and two (10%) cited that the plan was tested in one year to less
than two years.
3.3.1.33 Security awareness programme
Table 3.102: Security awareness programme at petrol station
Do you have any security awareness programme at your petrol station?
Frequency Percent Valid Percent Cumulative Percent
Valid Yes 12 29.3 31.6 31.6
No 14 34.1 36.8 68.4
Unsure 12 29.3 31.6 100.0
Total 38 92.7 100.0
Missing System 3 7.3
Total 41 100.0
This question was asked in order to find out if security awareness programme was in place at
petrol stations. Three (7%) did not respond. Of thirty eight (100%) that responded, twelve
(32%) showed that there was a security awareness programme at their petrol stations,
fourteen (37%) stated that there were ‘no’ security awareness programme in place and twelve
(32%) were unsure.
3.3.1.34 Vulnerable assets
Table 3.103: Most vulnerable assets at petrol station
What are the most vulnerable assets at this petrol station? (Prioritise them from 1 to 5, with 1 being the most vulnerable)
Frequency Percentage
Employees 13 31.7
Management 7 17.1
Cash 17 41.5
Safe 6 14.6
Goods such as cigarettes and cellphone recharge vouchers 9 22
Armed response units 5 12.2
Guards 5 12.2
Security measures on site 5 12.2
Customers 14 34.1
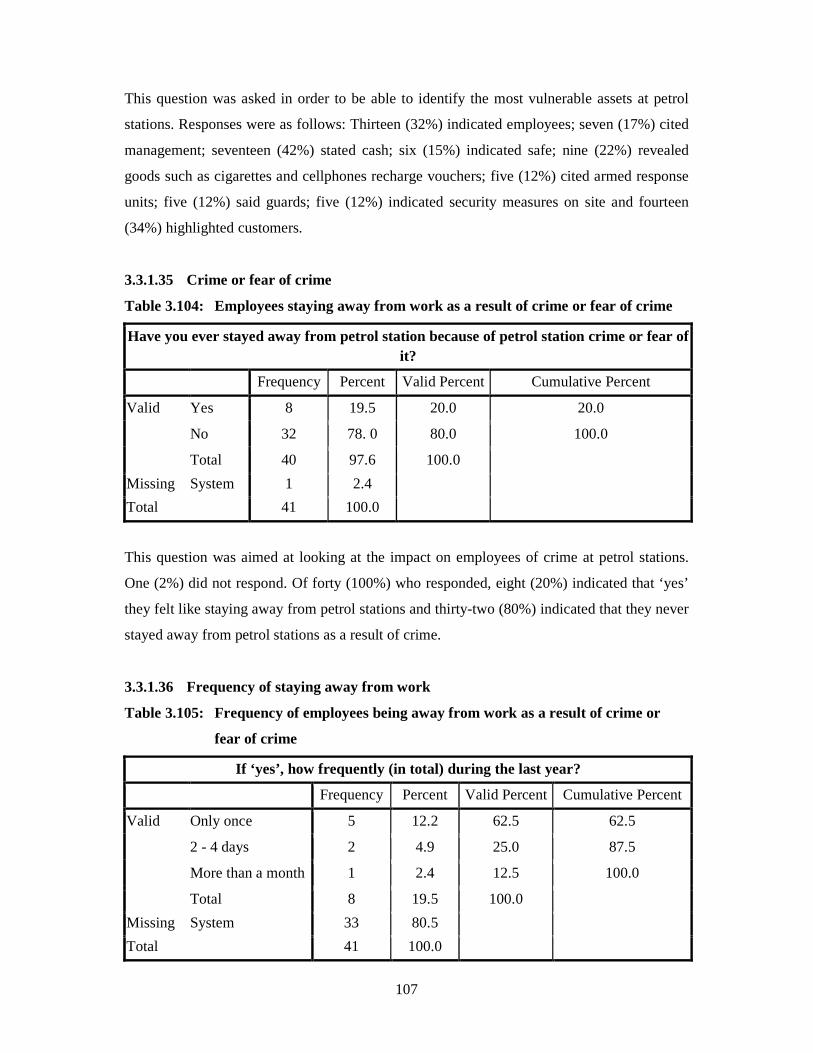
107
This question was asked in order to be able to identify the most vulnerable assets at petrol
stations. Responses were as follows: Thirteen (32%) indicated employees; seven (17%) cited
management; seventeen (42%) stated cash; six (15%) indicated safe; nine (22%) revealed
goods such as cigarettes and cellphones recharge vouchers; five (12%) cited armed response
units; five (12%) said guards; five (12%) indicated security measures on site and fourteen
(34%) highlighted customers.
3.3.1.35 Crime or fear of crime
Table 3.104: Employees staying away from work as a result of crime or fear of crime
Have you ever stayed away from petrol station because of petrol station crime or fear of it?
Frequency Percent Valid Percent Cumulative Percent
Valid Yes 8 19.5 20.0 20.0
No 32 78. 0 80.0 100.0
Total 40 97.6 100.0
Missing System 1 2.4
Total 41 100.0
This question was aimed at looking at the impact on employees of crime at petrol stations.
One (2%) did not respond. Of forty (100%) who responded, eight (20%) indicated that ‘yes’
they felt like staying away from petrol stations and thirty-two (80%) indicated that they never
stayed away from petrol stations as a result of crime.
3.3.1.36 Frequency of staying away from work
Table 3.105: Frequency of employees being away from work as a result of crime or
fear of crime
If ‘yes’, how frequently (in total) during the last year?
Frequency Percent Valid Percent Cumulative Percent
Valid Only once 5 12.2 62.5 62.5
2 - 4 days 2 4.9 25.0 87.5
More than a month 1 2.4 12.5 100.0
Total 8 19.5 100.0
Missing System 33 80.5
Total 41 100.0
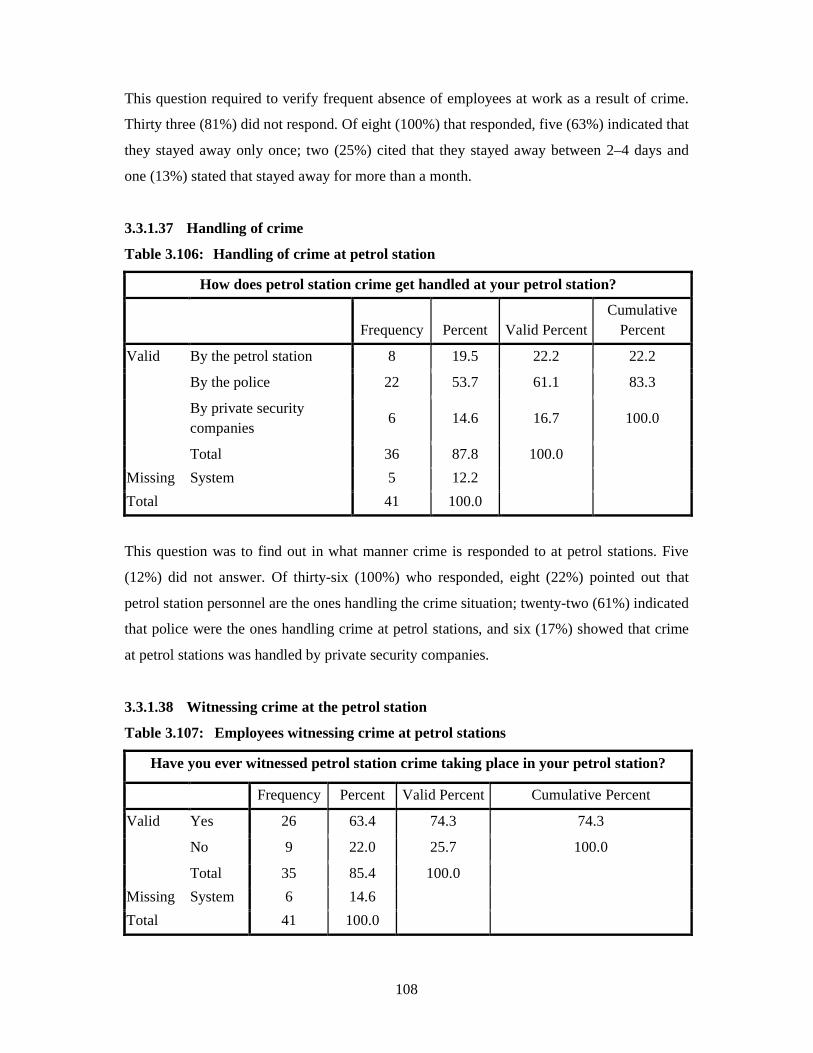
108
This question required to verify frequent absence of employees at work as a result of crime.
Thirty three (81%) did not respond. Of eight (100%) that responded, five (63%) indicated that
they stayed away only once; two (25%) cited that they stayed away between 2–4 days and
one (13%) stated that stayed away for more than a month.
3.3.1.37 Handling of crime
Table 3.106: Handling of crime at petrol station
How does petrol station crime get handled at your petrol station?
Frequency Percent Valid Percent
Cumulative Percent
Valid By the petrol station 8 19.5 22.2 22.2
By the police 22 53.7 61.1 83.3
By private security companies
6 14.6 16.7 100.0
Total 36 87.8 100.0
Missing System 5 12.2
Total 41 100.0
This question was to find out in what manner crime is responded to at petrol stations. Five
(12%) did not answer. Of thirty-six (100%) who responded, eight (22%) pointed out that
petrol station personnel are the ones handling the crime situation; twenty-two (61%) indicated
that police were the ones handling crime at petrol stations, and six (17%) showed that crime
at petrol stations was handled by private security companies.
3.3.1.38 Witnessing crime at the petrol station
Table 3.107: Employees witnessing crime at petrol stations
Have you ever witnessed petrol station crime taking place in your petrol station?
Frequency Percent Valid Percent Cumulative Percent
Valid Yes 26 63.4 74.3 74.3
No 9 22.0 25.7 100.0
Total 35 85.4 100.0
Missing System 6 14.6
Total 41 100.0
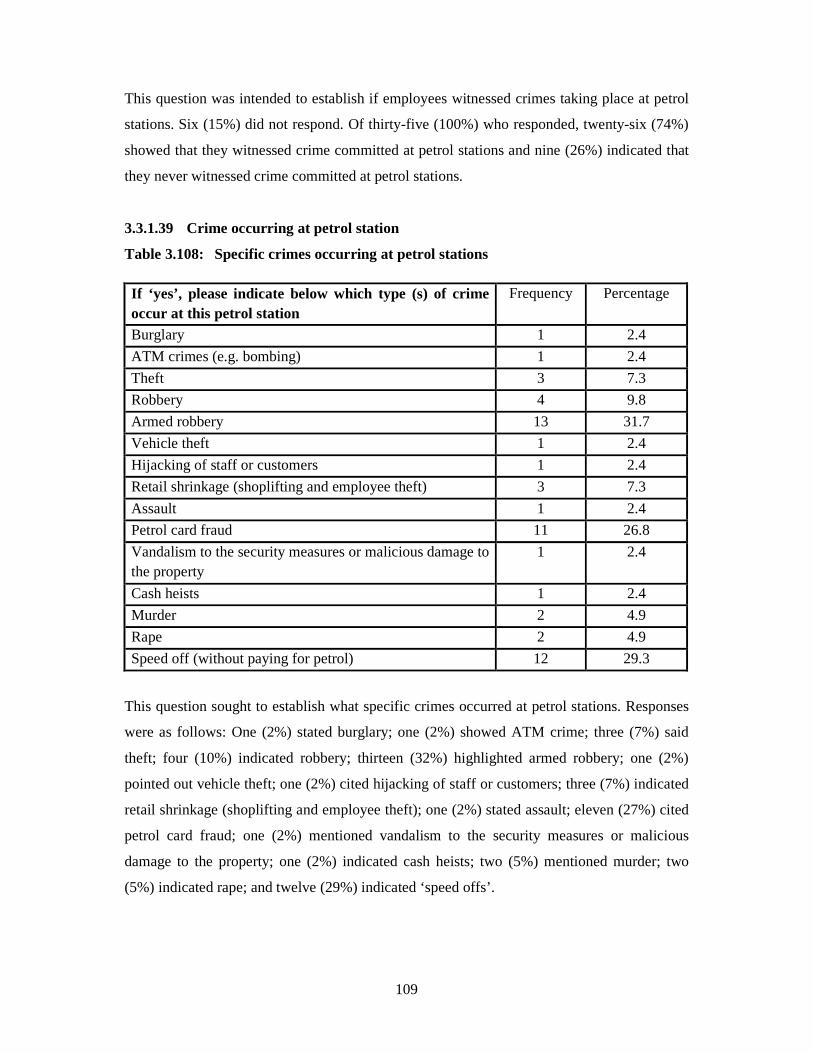
109
This question was intended to establish if employees witnessed crimes taking place at petrol
stations. Six (15%) did not respond. Of thirty-five (100%) who responded, twenty-six (74%)
showed that they witnessed crime committed at petrol stations and nine (26%) indicated that
they never witnessed crime committed at petrol stations.
3.3.1.39 Crime occurring at petrol station
Table 3.108: Specific crimes occurring at petrol stations
This question sought to establish what specific crimes occurred at petrol stations. Responses
were as follows: One (2%) stated burglary; one (2%) showed ATM crime; three (7%) said
theft; four (10%) indicated robbery; thirteen (32%) highlighted armed robbery; one (2%)
pointed out vehicle theft; one (2%) cited hijacking of staff or customers; three (7%) indicated
retail shrinkage (shoplifting and employee theft); one (2%) stated assault; eleven (27%) cited
petrol card fraud; one (2%) mentioned vandalism to the security measures or malicious
damage to the property; one (2%) indicated cash heists; two (5%) mentioned murder; two
(5%) indicated rape; and twelve (29%) indicated ‘speed offs’.
If ‘yes’, please indicate below which type (s) of crime occur at this petrol station
Frequency Percentage
Burglary 1 2.4
ATM crimes (e.g. bombing) 1 2.4
Theft 3 7.3
Robbery 4 9.8
Armed robbery 13 31.7
Vehicle theft 1 2.4
Hijacking of staff or customers 1 2.4
Retail shrinkage (shoplifting and employee theft) 3 7.3
Assault 1 2.4
Petrol card fraud 11 26.8
Vandalism to the security measures or malicious damage to the property
1 2.4
Cash heists 1 2.4
Murder 2 4.9
Rape 2 4.9
Speed off (without paying for petrol) 12 29.3

110
3.3.1.40 Frequent occurrence of crime
Table 3.109: Frequent occurrence of crime at petrol stations
This question was asked in order to establish frequency of occurrence of crime at petrol
stations. Responses were as follows:
− Burglary: One (2%) 7-9 months and seven (17%) more than nine months;
− ATM crime: seven (17%) indicated more than nine months;
− theft: four (10%) 0-3 months; two (5%) 4-6 months; one (2%) 7-9 months and two
(5%) more than nine months;
− robbery: one (2%) 0-3 months; two (5%) 4-6 months; five (12%) 7-9 months; three
(7%) more than nine months;
− armed robbery: one (2%) 0-3 months; three (7%) 4-6 months; four (10%) 7-9 months;
five (12%) more than nine months;
Please indicate below frequency of occurrence for each crime (as indicated above)
0-3 months
4-6 months
7-9 months More than 9 months
Burglary 1 (2%) 7 (17%)
ATM crimes (e.g. bombing) 7 (17%)
Theft 4 (10%) 2 (5%) 1 (2%) 2 (5%)
Robbery 1 (2%) 2 (5%) 5 (12%) 3 (7%)
Armed robbery 1 (2%) 3 (7%) 4 (10%) 5 (12%)
Vehicle theft 1 (2%) 7 (17%)
Hijacking of staff or customers 6 (15%)
Retail shrinkage (shoplifting and employee theft)
9 (22%) 1 (2%) 1 (2%)
Assault
Petrol card fraud 11 (27%) 2 (5%) 1 (2%)
Vandalism to the security measures or malicious damage to the property
1 (2%) 3 (7%) 3 (7%)
Cash heists 1 (2%) 1 (2%) 2 (5%) 4 (10%)
Murder 7 (17%)
Rape 7 (17%)
Speed off (without paying for petrol) 15 (37%) 3 (7%)

111
− vehicle theft: one (2%) 4-6 months; seven (17%) more than nine months;
− hijacking of staff or customers: six (15%) more than nine months;
− retail shrinkage (shoplifting and employee theft): nine (22%) 0-3 months; one (2%) 4-
6 months; one (2%) 7- 9 months;
− petrol card fraud: eleven (27%) 0-3 months; two (5%) 4-6 months; one (2%) 7-9
months;
− vandalism to security measures or malicious damage to property: one (2%) 4-6
months; three (7%) 7-9 months; three (7%) more than nine months;
− cash heists: one (2%) 0-3 months; one (2%) 4-6 months; two (5%) 7-9 months; four
(10%) more than nine months;
− murder: seven (17%) more than nine months;
− rape: seven (17%) more than nine months; ‘speed off’: fifteen (37%) 0-3 months;
three (7%) 4-6 months.
3.3.1.41 Reporting of crime
Table 3.110: Reporting of crime at petrol stations
Did you report any of these witnessed/experienced crime/s?
Frequency Percent Valid Percent Cumulative Percent
Valid Yes 29 70.7 87.9 87.9
No 4 9.8 12.1 100.0
Total 33 80.5 100.0
Missing System 8 19.5
Total 41 100.0
This question needed to find out how employees reacted after witnessing crimes at petrol
stations. Eight (20%) did not answer. Of thirty three (100%) that responded, twenty nine
(88%) indicated that they did report crimes they witnessed and four (12%) indicated that they
did not report the crime they witnessed.

112
3.3.1.42 Reporting of crime
Table 3.111: Reporting of crime at petrol stations by employees
If ‘yes’, to whom did you report the crime/s?
Frequency Percent Valid Percent Cumulative Percent
Valid Manager 15 36.6 53.6 53.6
Supervisor 8 19.5 14.3 67.9
Colleague 2 4.9 33.3 100.0
Police Security company
8 2
19.5
4.9
33.3
5. 7
100.0
Total 35 85.4
Missing System 6 14.6
Total 41 100.0
This question was set in order to find out who got informed in cases of crime committed at
petrol stations. Six (15%) did not respond. Of thirty five (100%) that responded, fifteen
(54%) informed managers, eight (14%) informed supervisor, two (5%) informed colleague,
eight (33%) informed police and two (5%) informed security company
3.3.1.43 Action taken after crime was reported
Table 3.112: Specific action that was taken after crime was reported at petrol station
Was any action taken after the act of crime was reported?
Frequency Percent Valid Percent Cumulative Percent
Valid Yes 23 56.1 88.5 88.5
No 3 7.3 11.5 100.0
Total 26 63.4 100.0
Missing System 15 36.6
Total 41 100.0
This question was asked in order to find out if anybody who was informed of a crime at a
petrol station did act. Fifteen (37%) did not respond. Of twenty-six (100%) that responded,
twenty-three (89%) said that action was taken after they reported and three (12%) indicated
that no action was taken after they had reported the crime/s.
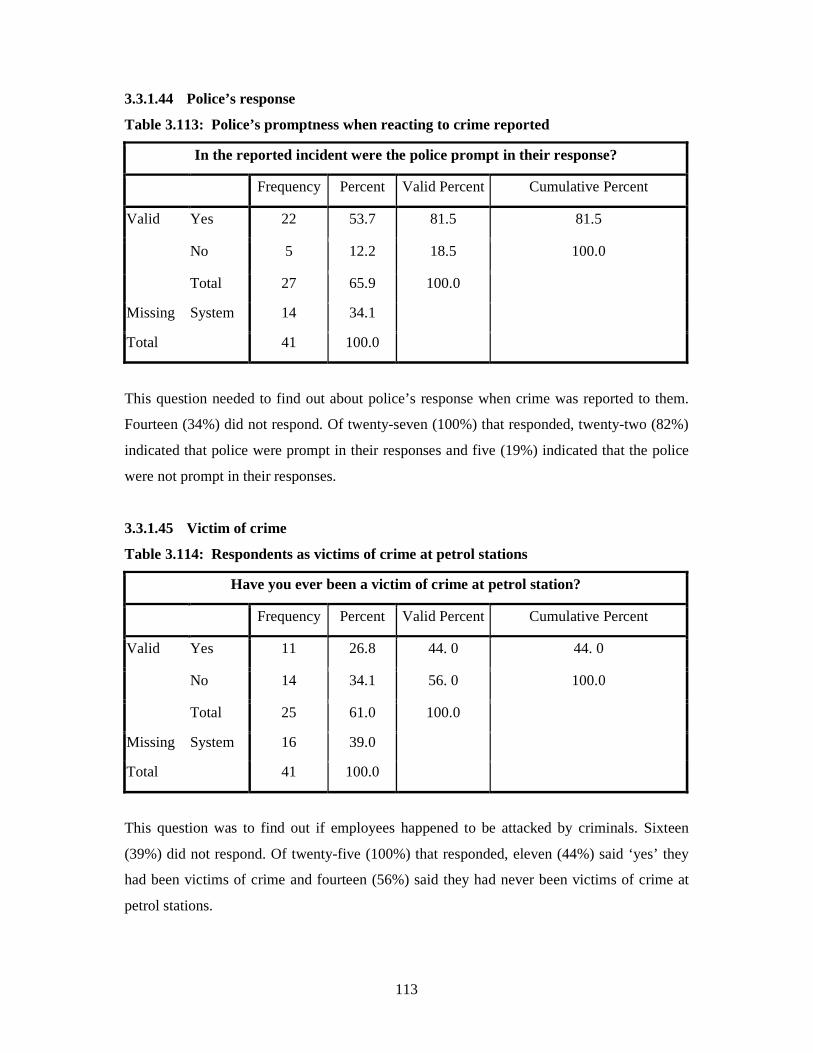
113
3.3.1.44 Police’s response
Table 3.113: Police’s promptness when reacting to crime reported
In the reported incident were the police prompt in their response?
Frequency Percent Valid Percent Cumulative Percent
Valid Yes 22 53.7 81.5 81.5
No 5 12.2 18.5 100.0
Total 27 65.9 100.0
Missing System 14 34.1
Total 41 100.0
This question needed to find out about police’s response when crime was reported to them.
Fourteen (34%) did not respond. Of twenty-seven (100%) that responded, twenty-two (82%)
indicated that police were prompt in their responses and five (19%) indicated that the police
were not prompt in their responses.
3.3.1.45 Victim of crime
Table 3.114: Respondents as victims of crime at petrol stations
Have you ever been a victim of crime at petrol station?
Frequency Percent Valid Percent Cumulative Percent
Valid Yes 11 26.8 44. 0 44. 0
No 14 34.1 56. 0 100.0
Total 25 61.0 100.0
Missing System 16 39.0
Total 41 100.0
This question was to find out if employees happened to be attacked by criminals. Sixteen
(39%) did not respond. Of twenty-five (100%) that responded, eleven (44%) said ‘yes’ they
had been victims of crime and fourteen (56%) said they had never been victims of crime at
petrol stations.
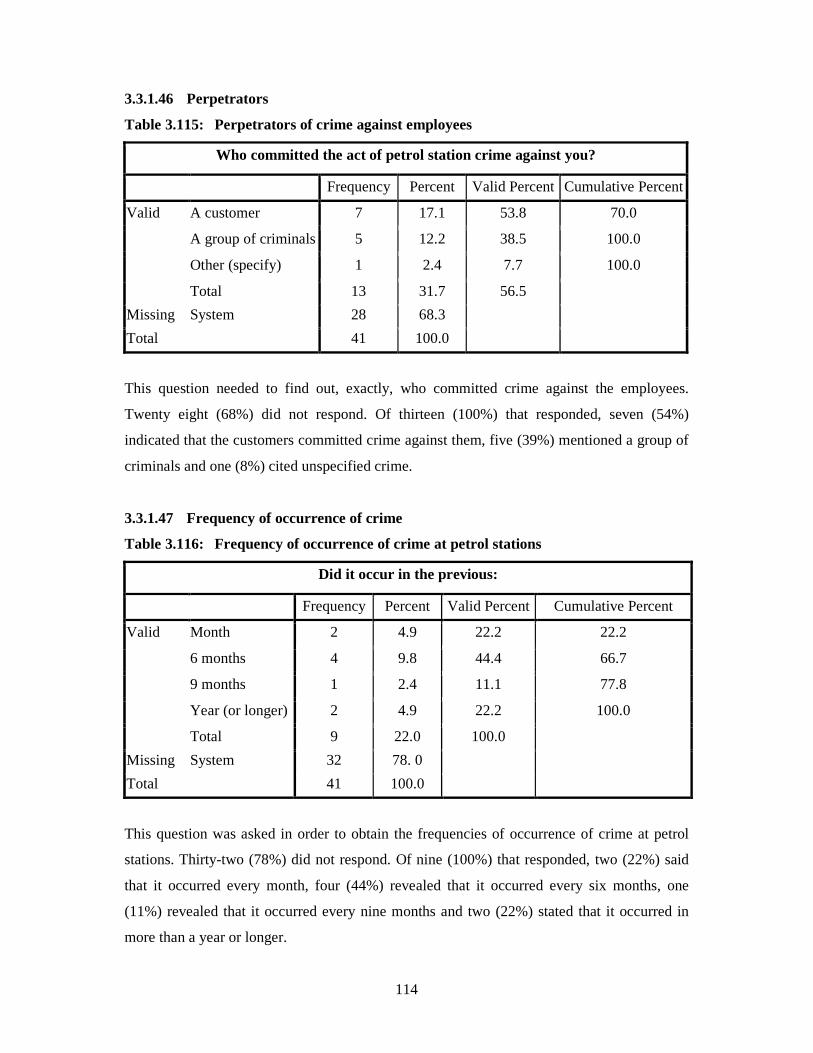
114
3.3.1.46 Perpetrators
Table 3.115: Perpetrators of crime against employees
Who committed the act of petrol station crime against you?
Frequency Percent Valid Percent Cumulative Percent
Valid A customer 7 17.1 53.8 70.0
A group of criminals 5 12.2 38.5 100.0
Other (specify) 1 2.4 7.7 100.0
Total 13 31.7 56.5
Missing System 28 68.3
Total 41 100.0
This question needed to find out, exactly, who committed crime against the employees.
Twenty eight (68%) did not respond. Of thirteen (100%) that responded, seven (54%)
indicated that the customers committed crime against them, five (39%) mentioned a group of
criminals and one (8%) cited unspecified crime.
3.3.1.47 Frequency of occurrence of crime
Table 3.116: Frequency of occurrence of crime at petrol stations
Did it occur in the previous:
Frequency Percent Valid Percent Cumulative Percent
Valid Month 2 4.9 22.2 22.2
6 months 4 9.8 44.4 66.7
9 months 1 2.4 11.1 77.8
Year (or longer) 2 4.9 22.2 100.0
Total 9 22.0 100.0
Missing System 32 78. 0
Total 41 100.0
This question was asked in order to obtain the frequencies of occurrence of crime at petrol
stations. Thirty-two (78%) did not respond. Of nine (100%) that responded, two (22%) said
that it occurred every month, four (44%) revealed that it occurred every six months, one
(11%) revealed that it occurred every nine months and two (22%) stated that it occurred in
more than a year or longer.
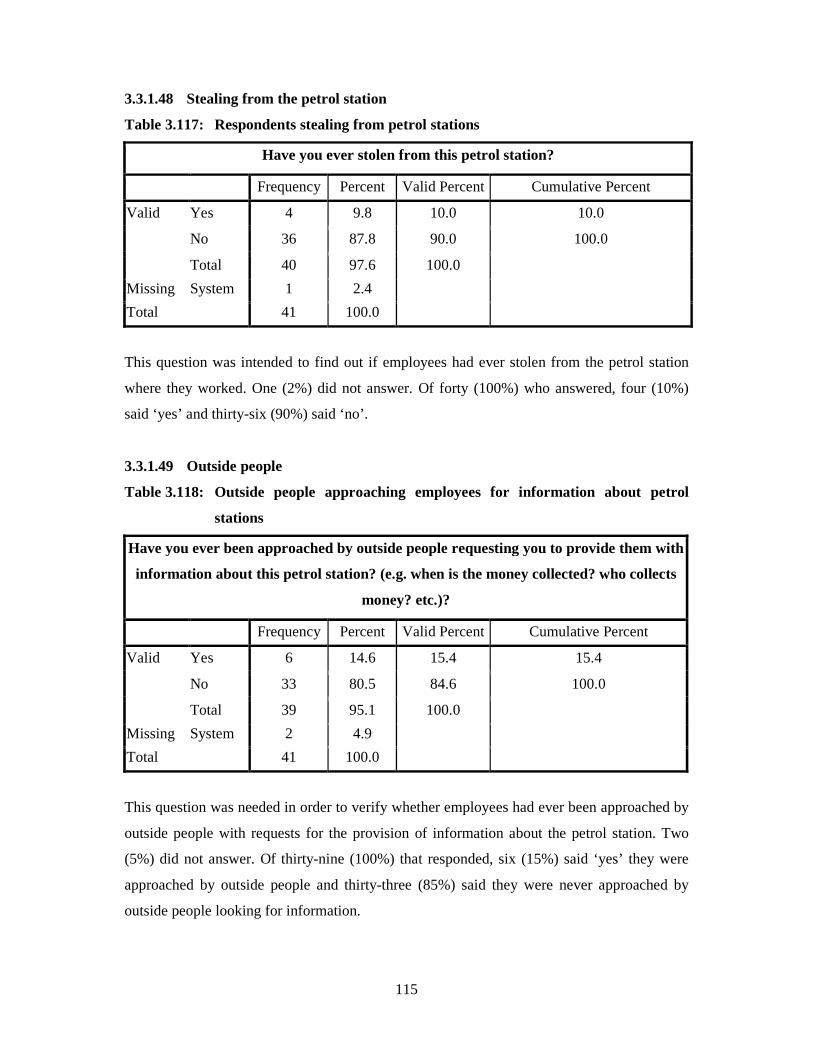
115
3.3.1.48 Stealing from the petrol station
Table 3.117: Respondents stealing from petrol stations
Have you ever stolen from this petrol station?
Frequency Percent Valid Percent Cumulative Percent
Valid Yes 4 9.8 10.0 10.0
No 36 87.8 90.0 100.0
Total 40 97.6 100.0
Missing System 1 2.4
Total 41 100.0
This question was intended to find out if employees had ever stolen from the petrol station
where they worked. One (2%) did not answer. Of forty (100%) who answered, four (10%)
said ‘yes’ and thirty-six (90%) said ‘no’.
3.3.1.49 Outside people
Table 3.118: Outside people approaching employees for information about petrol
stations
Have you ever been approached by outside people requesting you to provide them with
information about this petrol station? (e.g. when is the money collected? who collects
money? etc.)?
Frequency Percent Valid Percent Cumulative Percent
Valid Yes 6 14.6 15.4 15.4
No 33 80.5 84.6 100.0
Total 39 95.1 100.0
Missing System 2 4.9
Total 41 100.0
This question was needed in order to verify whether employees had ever been approached by
outside people with requests for the provision of information about the petrol station. Two
(5%) did not answer. Of thirty-nine (100%) that responded, six (15%) said ‘yes’ they were
approached by outside people and thirty-three (85%) said they were never approached by
outside people looking for information.

116
3.3.1.50 Giving information
Table 3.119: Employees agreeing to give outside people information about petrol
station
Did you agree to supply the information requesters with this information?
Frequency Percent Valid Percent Cumulative Percent
Valid Yes 1 2.4 16.7 16.7
No 5 12.2 83.3 100.0
Total 6 14.6 100.0
Missing System 35 85.4
Total 41 100.0
This question was aimed at finding out if employees had agreed to leak such kind of
information as requested by outside people.
Thirty-five (85%) did not respond. Of six (100%) that responded, one (17%) said ‘yes’ they
had provided such type of information and five (83%) said they had not given such
information out.
3.3.1.51 Offering to pay for information requested
Table 3.120: Outside people offering to pay employees for information requested about
the petrol station
Did these information requesters also offer to pay you for this information?
Frequency Percent Valid Percent Cumulative Percent
Valid Yes 4 9.8 66.7 66.7
No 2 4.9 33.3 100.0
Total 6 14.6 100.0
Missing System 35 85.4
Total 41 100.0
This question was asked in order to establish if it had been a question of ‘selling’ some kind
of information to criminals, i.e. offer of payment in exchange for the provision of
information. Thirty-five (85%) did not respond. Of six (100%) that responded, four (67%)
said ‘yes’ they were promised payment had they given information and two (33%) said they
had not been promised payment.
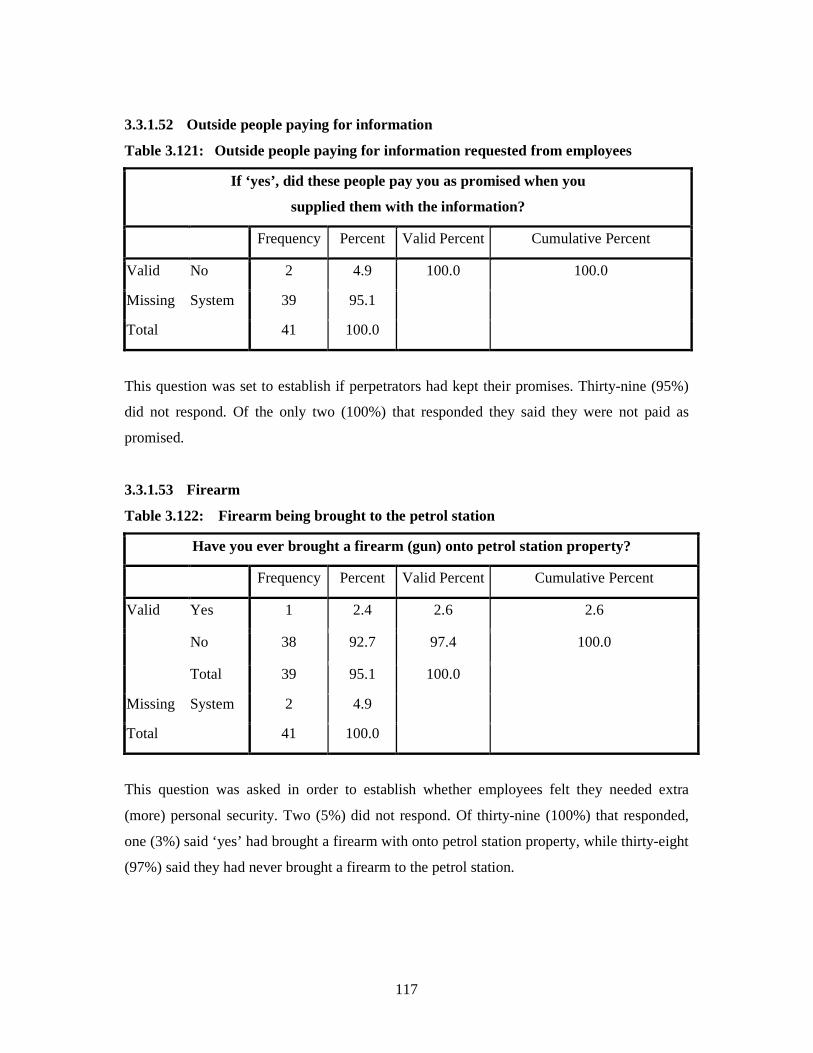
117
3.3.1.52 Outside people paying for information
Table 3.121: Outside people paying for information requested from employees
If ‘yes’, did these people pay you as promised when you
supplied them with the information?
Frequency Percent Valid Percent Cumulative Percent
Valid No 2 4.9 100.0 100.0
Missing System 39 95.1
Total 41 100.0
This question was set to establish if perpetrators had kept their promises. Thirty-nine (95%)
did not respond. Of the only two (100%) that responded they said they were not paid as
promised.
3.3.1.53 Firearm
Table 3.122: Firearm being brought to the petrol station
Have you ever brought a firearm (gun) onto petrol station property?
Frequency Percent Valid Percent Cumulative Percent
Valid Yes 1 2.4 2.6 2.6
No 38 92.7 97.4 100.0
Total 39 95.1 100.0
Missing System 2 4.9
Total 41 100.0
This question was asked in order to establish whether employees felt they needed extra
(more) personal security. Two (5%) did not respond. Of thirty-nine (100%) that responded,
one (3%) said ‘yes’ had brought a firearm with onto petrol station property, while thirty-eight
(97%) said they had never brought a firearm to the petrol station.
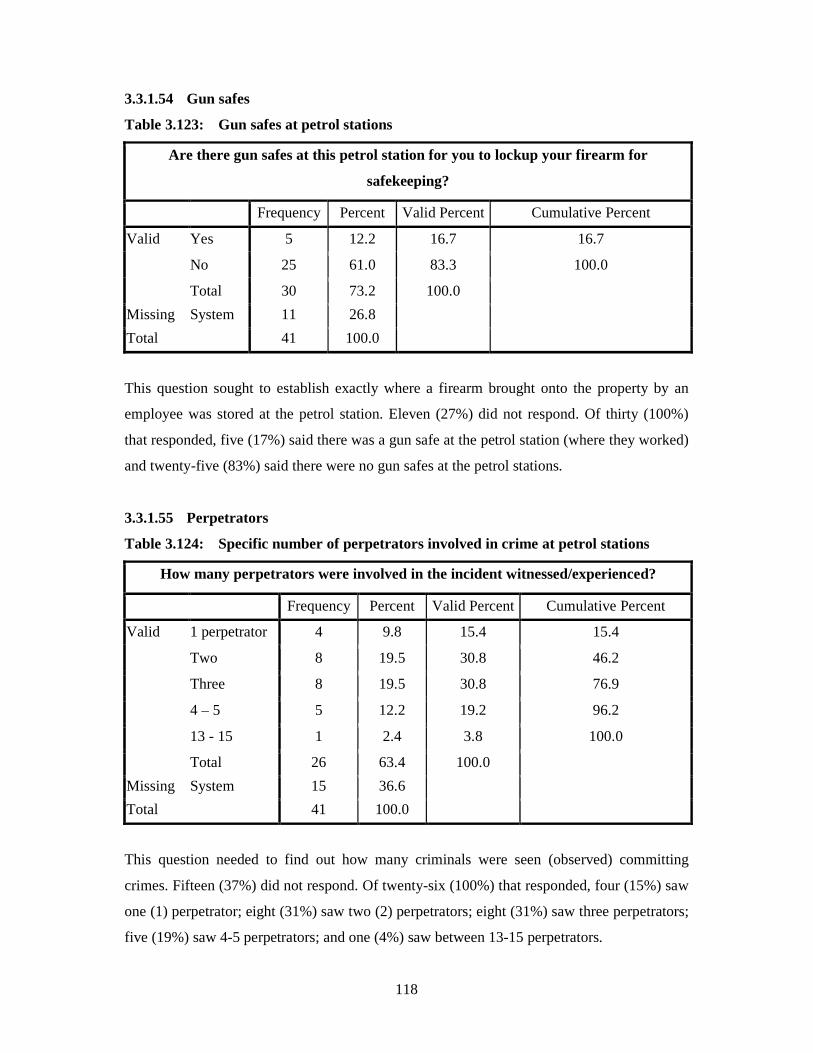
118
3.3.1.54 Gun safes
Table 3.123: Gun safes at petrol stations
Are there gun safes at this petrol station for you to lockup your firearm for
safekeeping?
Frequency Percent Valid Percent Cumulative Percent
Valid Yes 5 12.2 16.7 16.7
No 25 61.0 83.3 100.0
Total 30 73.2 100.0
Missing System 11 26.8
Total 41 100.0
This question sought to establish exactly where a firearm brought onto the property by an
employee was stored at the petrol station. Eleven (27%) did not respond. Of thirty (100%)
that responded, five (17%) said there was a gun safe at the petrol station (where they worked)
and twenty-five (83%) said there were no gun safes at the petrol stations.
3.3.1.55 Perpetrators
Table 3.124: Specific number of perpetrators involved in crime at petrol stations
How many perpetrators were involved in the incident witnessed/experienced?
Frequency Percent Valid Percent Cumulative Percent
Valid 1 perpetrator 4 9.8 15.4 15.4
Two 8 19.5 30.8 46.2
Three 8 19.5 30.8 76.9
4 – 5 5 12.2 19.2 96.2
13 - 15 1 2.4 3.8 100.0
Total 26 63.4 100.0
Missing System 15 36.6
Total 41 100.0
This question needed to find out how many criminals were seen (observed) committing
crimes. Fifteen (37%) did not respond. Of twenty-six (100%) that responded, four (15%) saw
one (1) perpetrator; eight (31%) saw two (2) perpetrators; eight (31%) saw three perpetrators;
five (19%) saw 4-5 perpetrators; and one (4%) saw between 13-15 perpetrators.
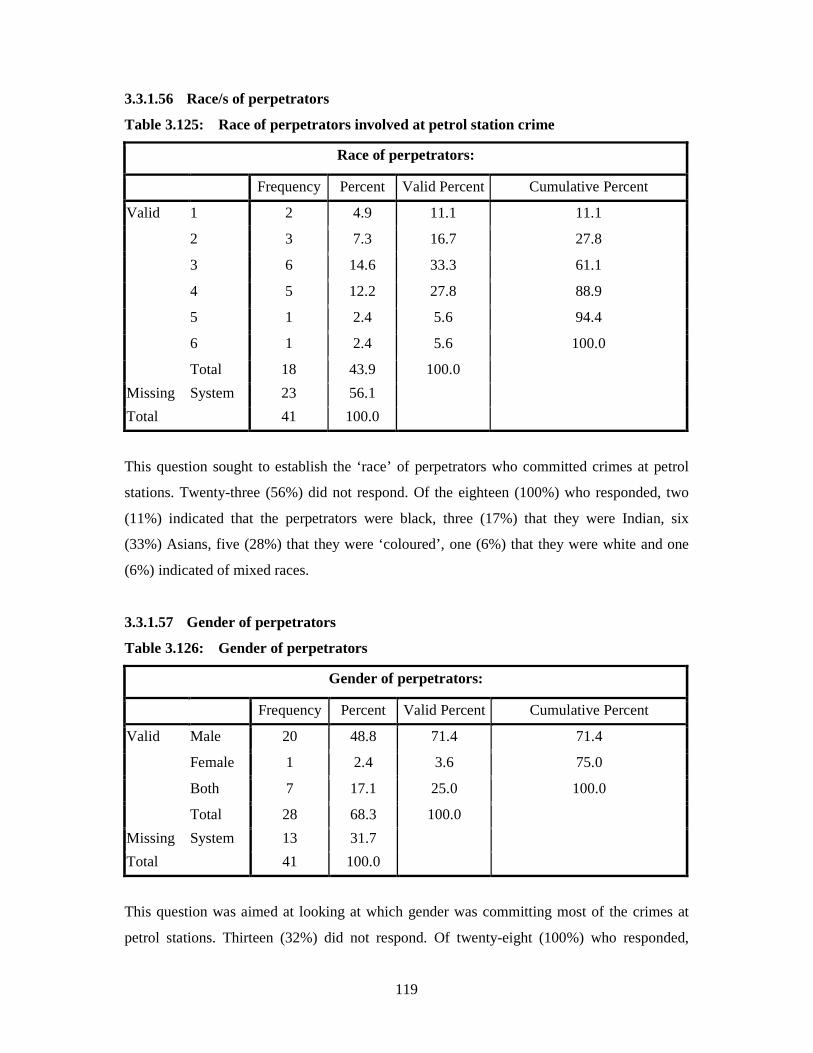
119
3.3.1.56 Race/s of perpetrators
Table 3.125: Race of perpetrators involved at petrol station crime
Race of perpetrators:
Frequency Percent Valid Percent Cumulative Percent
Valid 1 2 4.9 11.1 11.1
2 3 7.3 16.7 27.8
3 6 14.6 33.3 61.1
4 5 12.2 27.8 88.9
5 1 2.4 5.6 94.4
6 1 2.4 5.6 100.0
Total 18 43.9 100.0
Missing System 23 56.1
Total 41 100.0
This question sought to establish the ‘race’ of perpetrators who committed crimes at petrol
stations. Twenty-three (56%) did not respond. Of the eighteen (100%) who responded, two
(11%) indicated that the perpetrators were black, three (17%) that they were Indian, six
(33%) Asians, five (28%) that they were ‘coloured’, one (6%) that they were white and one
(6%) indicated of mixed races.
3.3.1.57 Gender of perpetrators
Table 3.126: Gender of perpetrators
Gender of perpetrators:
Frequency Percent Valid Percent Cumulative Percent
Valid Male 20 48.8 71.4 71.4
Female 1 2.4 3.6 75.0
Both 7 17.1 25.0 100.0
Total 28 68.3 100.0
Missing System 13 31.7
Total 41 100.0
This question was aimed at looking at which gender was committing most of the crimes at
petrol stations. Thirteen (32%) did not respond. Of twenty-eight (100%) who responded,
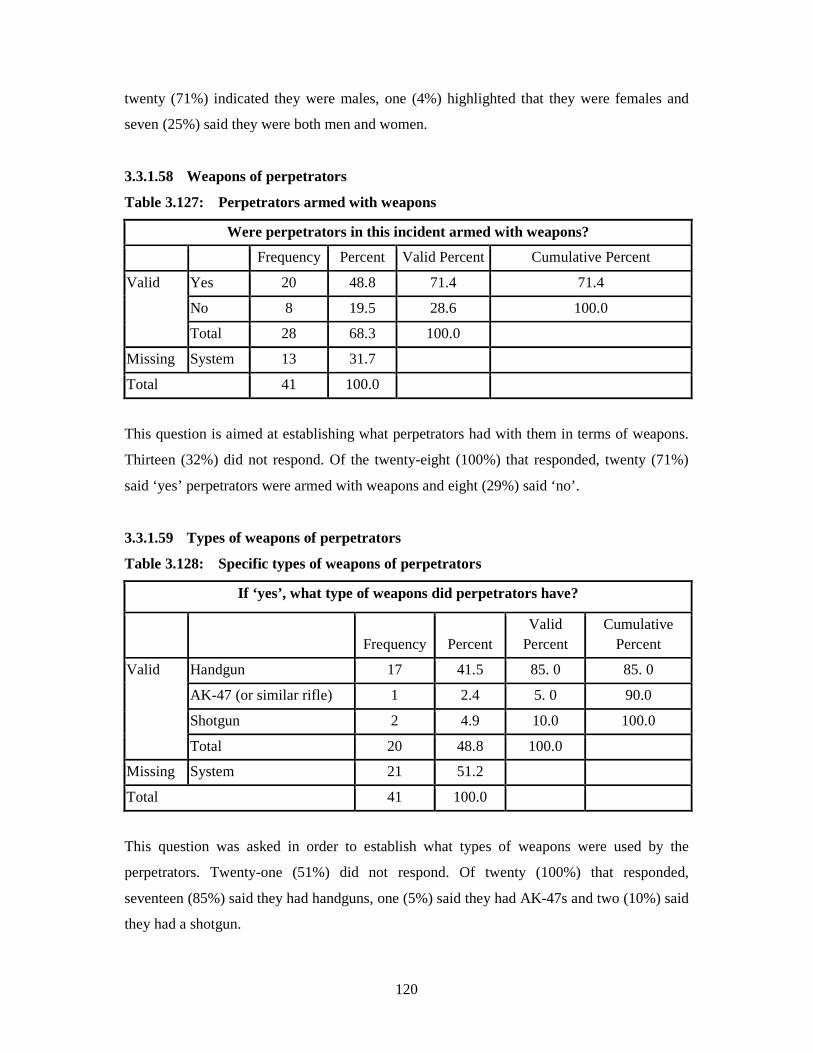
120
twenty (71%) indicated they were males, one (4%) highlighted that they were females and
seven (25%) said they were both men and women.
3.3.1.58 Weapons of perpetrators
Table 3.127: Perpetrators armed with weapons
Were perpetrators in this incident armed with weapons?
Frequency Percent Valid Percent Cumulative Percent
Valid Yes 20 48.8 71.4 71.4
No 8 19.5 28.6 100.0
Total 28 68.3 100.0
Missing System 13 31.7
Total 41 100.0
This question is aimed at establishing what perpetrators had with them in terms of weapons.
Thirteen (32%) did not respond. Of the twenty-eight (100%) that responded, twenty (71%)
said ‘yes’ perpetrators were armed with weapons and eight (29%) said ‘no’.
3.3.1.59 Types of weapons of perpetrators
Table 3.128: Specific types of weapons of perpetrators
If ‘yes’, what type of weapons did perpetrators have?
Frequency Percent
Valid Percent
Cumulative Percent
Valid Handgun 17 41.5 85. 0 85. 0
AK-47 (or similar rifle) 1 2.4 5. 0 90.0
Shotgun 2 4.9 10.0 100.0
Total 20 48.8 100.0
Missing System 21 51.2
Total 41 100.0
This question was asked in order to establish what types of weapons were used by the
perpetrators. Twenty-one (51%) did not respond. Of twenty (100%) that responded,
seventeen (85%) said they had handguns, one (5%) said they had AK-47s and two (10%) said
they had a shotgun.
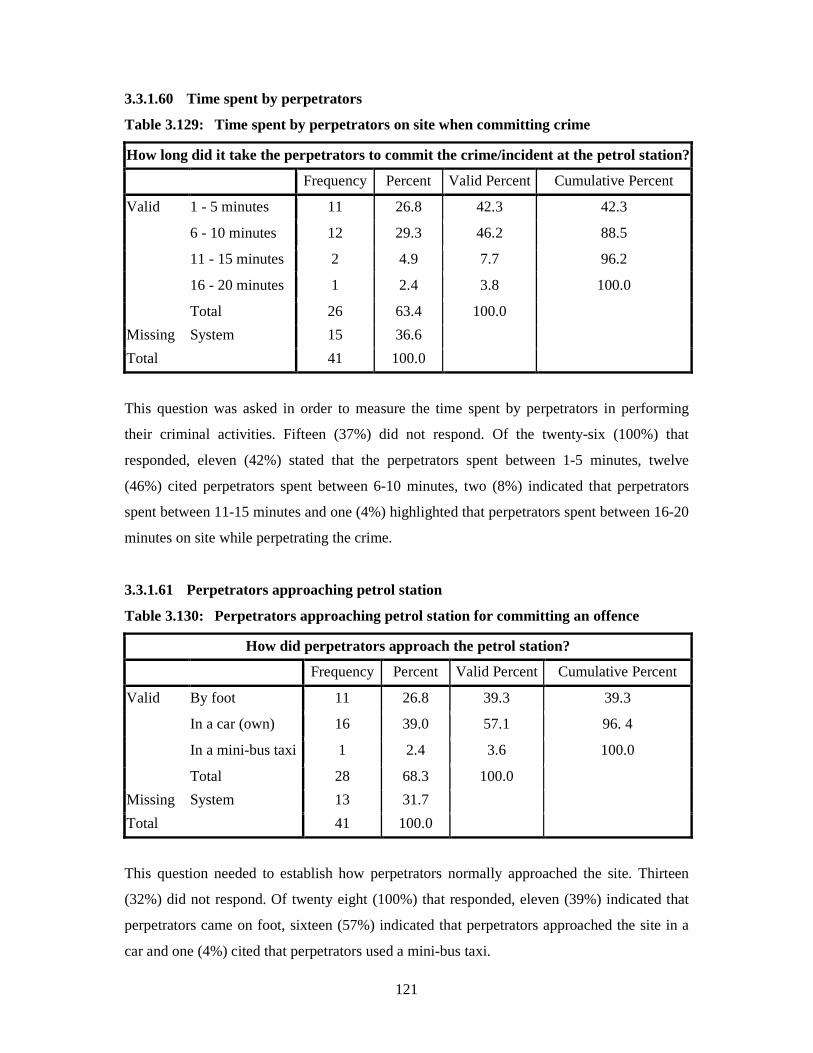
121
3.3.1.60 Time spent by perpetrators
Table 3.129: Time spent by perpetrators on site when committing crime
How long did it take the perpetrators to commit the crime/incident at the petrol station?
Frequency Percent Valid Percent Cumulative Percent
Valid 1 - 5 minutes 11 26.8 42.3 42.3
6 - 10 minutes 12 29.3 46.2 88.5
11 - 15 minutes 2 4.9 7.7 96.2
16 - 20 minutes 1 2.4 3.8 100.0
Total 26 63.4 100.0
Missing System 15 36.6
Total 41 100.0
This question was asked in order to measure the time spent by perpetrators in performing
their criminal activities. Fifteen (37%) did not respond. Of the twenty-six (100%) that
responded, eleven (42%) stated that the perpetrators spent between 1-5 minutes, twelve
(46%) cited perpetrators spent between 6-10 minutes, two (8%) indicated that perpetrators
spent between 11-15 minutes and one (4%) highlighted that perpetrators spent between 16-20
minutes on site while perpetrating the crime.
3.3.1.61 Perpetrators approaching petrol station
Table 3.130: Perpetrators approaching petrol station for committing an offence
How did perpetrators approach the petrol station?
Frequency Percent Valid Percent Cumulative Percent
Valid By foot 11 26.8 39.3 39.3
In a car (own) 16 39.0 57.1 96. 4
In a mini-bus taxi 1 2.4 3.6 100.0
Total 28 68.3 100.0
Missing System 13 31.7
Total 41 100.0
This question needed to establish how perpetrators normally approached the site. Thirteen
(32%) did not respond. Of twenty eight (100%) that responded, eleven (39%) indicated that
perpetrators came on foot, sixteen (57%) indicated that perpetrators approached the site in a
car and one (4%) cited that perpetrators used a mini-bus taxi.
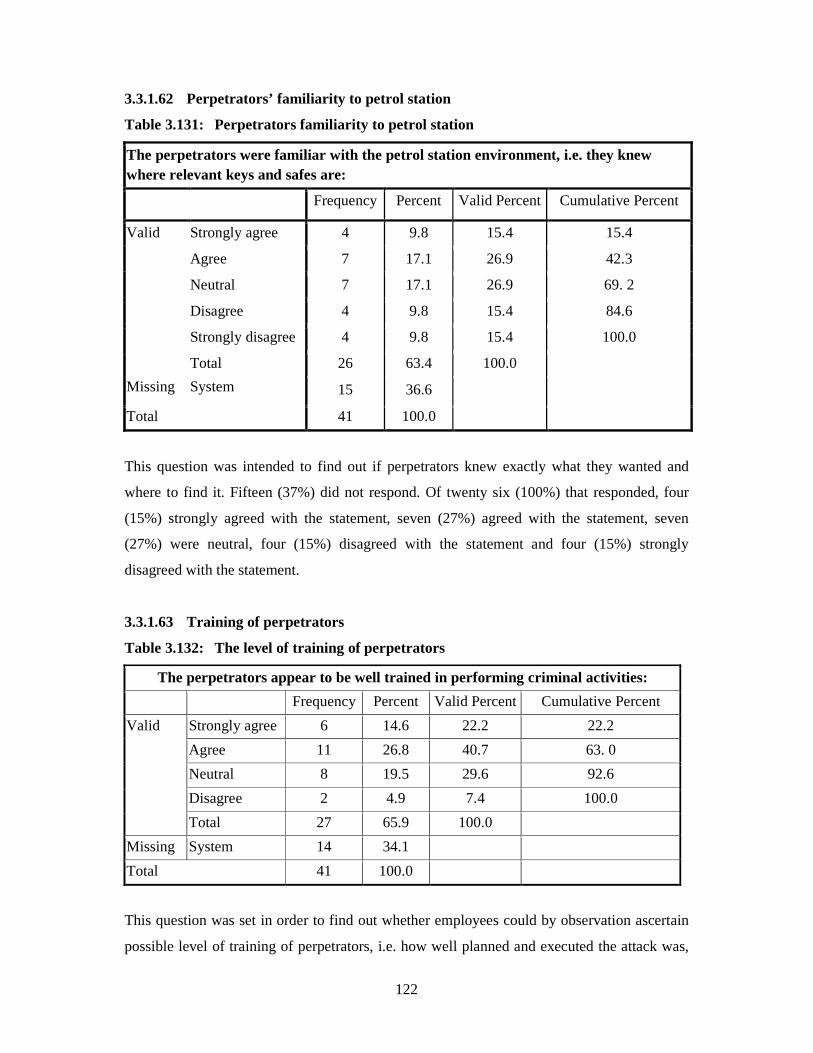
122
3.3.1.62 Perpetrators’ familiarity to petrol station
Table 3.131: Perpetrators familiarity to petrol station
The perpetrators were familiar with the petrol station environment, i.e. they knew where relevant keys and safes are:
Frequency Percent Valid Percent Cumulative Percent
Valid Strongly agree 4 9.8 15.4 15.4
Agree 7 17.1 26.9 42.3
Neutral 7 17.1 26.9 69. 2
Disagree 4 9.8 15.4 84.6
Strongly disagree 4 9.8 15.4 100.0
Total 26 63.4 100.0
Missing System 15 36.6
Total 41 100.0
This question was intended to find out if perpetrators knew exactly what they wanted and
where to find it. Fifteen (37%) did not respond. Of twenty six (100%) that responded, four
(15%) strongly agreed with the statement, seven (27%) agreed with the statement, seven
(27%) were neutral, four (15%) disagreed with the statement and four (15%) strongly
disagreed with the statement.
3.3.1.63 Training of perpetrators
Table 3.132: The level of training of perpetrators
The perpetrators appear to be well trained in performing criminal activities:
Frequency Percent Valid Percent Cumulative Percent
Valid Strongly agree 6 14.6 22.2 22.2
Agree 11 26.8 40.7 63. 0
Neutral 8 19.5 29.6 92.6
Disagree 2 4.9 7.4 100.0
Total 27 65.9 100.0
Missing System 14 34.1
Total 41 100.0
This question was set in order to find out whether employees could by observation ascertain
possible level of training of perpetrators, i.e. how well planned and executed the attack was,
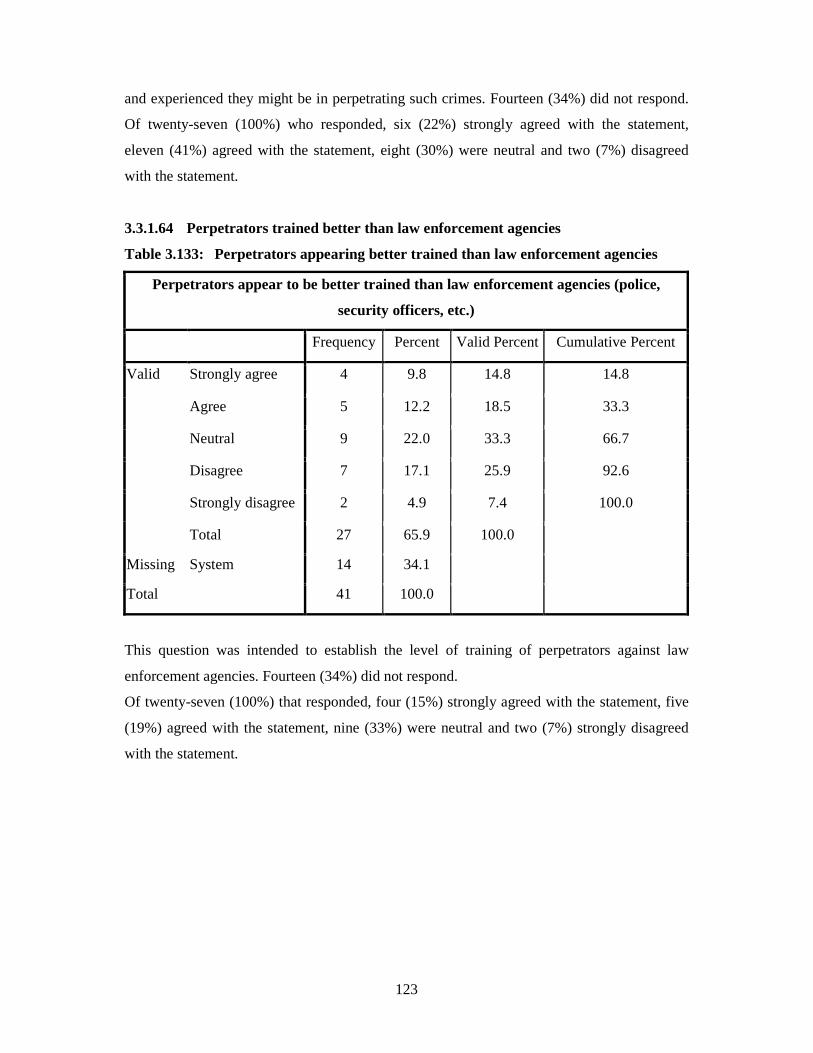
123
and experienced they might be in perpetrating such crimes. Fourteen (34%) did not respond.
Of twenty-seven (100%) who responded, six (22%) strongly agreed with the statement,
eleven (41%) agreed with the statement, eight (30%) were neutral and two (7%) disagreed
with the statement.
3.3.1.64 Perpetrators trained better than law enforcement agencies
Table 3.133: Perpetrators appearing better trained than law enforcement agencies
Perpetrators appear to be better trained than law enforcement agencies (police,
security officers, etc.)
Frequency Percent Valid Percent Cumulative Percent
Valid Strongly agree 4 9.8 14.8 14.8
Agree 5 12.2 18.5 33.3
Neutral 9 22.0 33.3 66.7
Disagree 7 17.1 25.9 92.6
Strongly disagree 2 4.9 7.4 100.0
Total 27 65.9 100.0
Missing System 14 34.1
Total 41 100.0
This question was intended to establish the level of training of perpetrators against law
enforcement agencies. Fourteen (34%) did not respond.
Of twenty-seven (100%) that responded, four (15%) strongly agreed with the statement, five
(19%) agreed with the statement, nine (33%) were neutral and two (7%) strongly disagreed
with the statement.
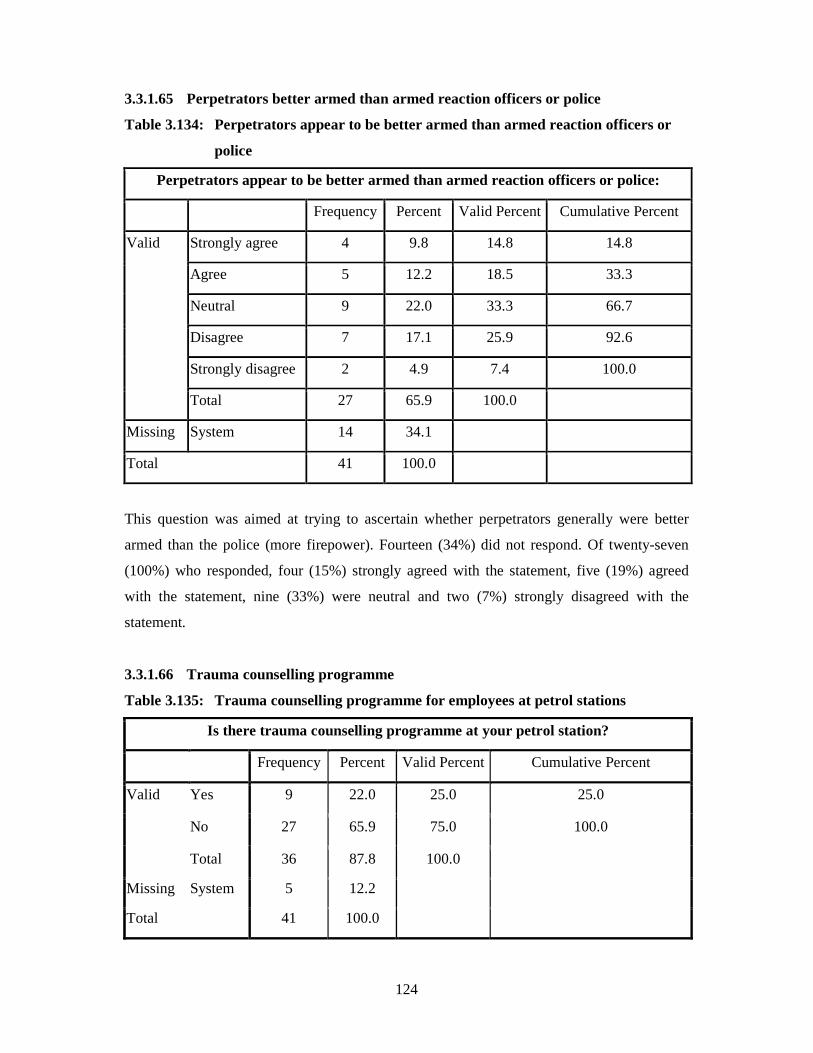
124
3.3.1.65 Perpetrators better armed than armed reaction officers or police
Table 3.134: Perpetrators appear to be better armed than armed reaction officers or
police
Perpetrators appear to be better armed than armed reaction officers or police:
Frequency Percent Valid Percent Cumulative Percent
Valid Strongly agree 4 9.8 14.8 14.8
Agree 5 12.2 18.5 33.3
Neutral 9 22.0 33.3 66.7
Disagree 7 17.1 25.9 92.6
Strongly disagree 2 4.9 7.4 100.0
Total 27 65.9 100.0
Missing System 14 34.1
Total 41 100.0
This question was aimed at trying to ascertain whether perpetrators generally were better
armed than the police (more firepower). Fourteen (34%) did not respond. Of twenty-seven
(100%) who responded, four (15%) strongly agreed with the statement, five (19%) agreed
with the statement, nine (33%) were neutral and two (7%) strongly disagreed with the
statement.
3.3.1.66 Trauma counselling programme
Table 3.135: Trauma counselling programme for employees at petrol stations
Is there trauma counselling programme at your petrol station?
Frequency Percent Valid Percent Cumulative Percent
Valid Yes 9 22.0 25.0 25.0
No 27 65.9 75.0 100.0
Total 36 87.8 100.0
Missing System 5 12.2
Total 41 100.0
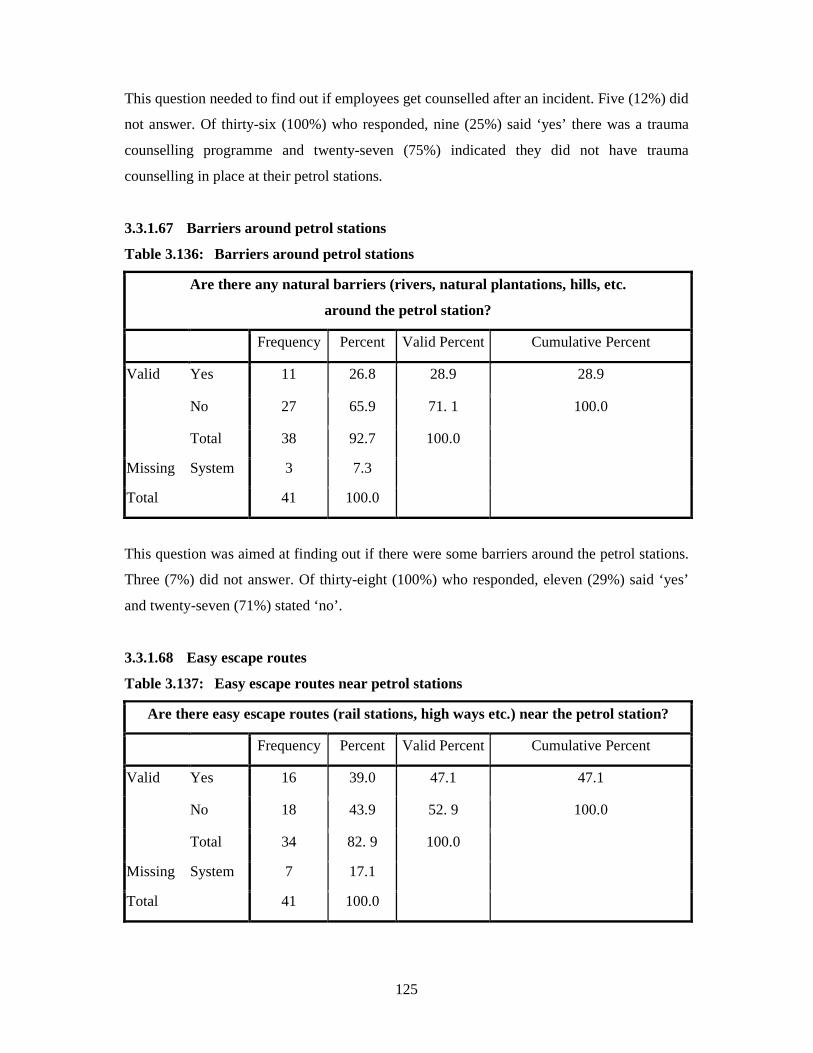
125
This question needed to find out if employees get counselled after an incident. Five (12%) did
not answer. Of thirty-six (100%) who responded, nine (25%) said ‘yes’ there was a trauma
counselling programme and twenty-seven (75%) indicated they did not have trauma
counselling in place at their petrol stations.
3.3.1.67 Barriers around petrol stations
Table 3.136: Barriers around petrol stations
Are there any natural barriers (rivers, natural plantations, hills, etc.
around the petrol station?
Frequency Percent Valid Percent Cumulative Percent
Valid Yes 11 26.8 28.9 28.9
No 27 65.9 71. 1 100.0
Total 38 92.7 100.0
Missing System 3 7.3
Total 41 100.0
This question was aimed at finding out if there were some barriers around the petrol stations.
Three (7%) did not answer. Of thirty-eight (100%) who responded, eleven (29%) said ‘yes’
and twenty-seven (71%) stated ‘no’.
3.3.1.68 Easy escape routes
Table 3.137: Easy escape routes near petrol stations
Are there easy escape routes (rail stations, high ways etc.) near the petrol station?
Frequency Percent Valid Percent Cumulative Percent
Valid Yes 16 39.0 47.1 47.1
No 18 43.9 52. 9 100.0
Total 34 82. 9 100.0
Missing System 7 17.1
Total 41 100.0
126
This question was aimed at establishing if there were escape routes near the petrol stations.
Seven (17%) did not respond. Of thirty four (83%) who responded, sixteen (47%) said ‘yes’
and eighteen (53%) cited ‘no’.
3.4 STATISTICAL COMPARISON OF EMPLOYEES’ AND MANAG ERS’
QUESTIONNAIRES
Findings in this section deal with issues for comparative purposes between the responses in
the questionnaires from employees and the questionnaires from employers. The issues for
comparison only included common aspects which were investigated in both questionnaires
and were all open-ended questions.
3.4.1 Open-ended questions
For the purpose of comparison of the responses to open-ended questions from employees and
employers the following questions were posed to both sets of respondents:
• specify what action was taken after crime was reported at petrol station;
• if something was done after crime was reported at petrol station by whom was it done
(e.g. petrol station management, police etc.);
• state why police were not prompt in their response in the reported incidents; what crime
have you been a victim at petrol station?;
• state what the specific information was requested by outside people about the petrol
station (e.g. when is the money collected?)
• who collects the money? etc.;
• state which crime/incident you witnessed/experienced at petrol station;
• if perpetrators were violent in their approach what did they do?; recommendations on
preventing criminal incidents at petrol station;
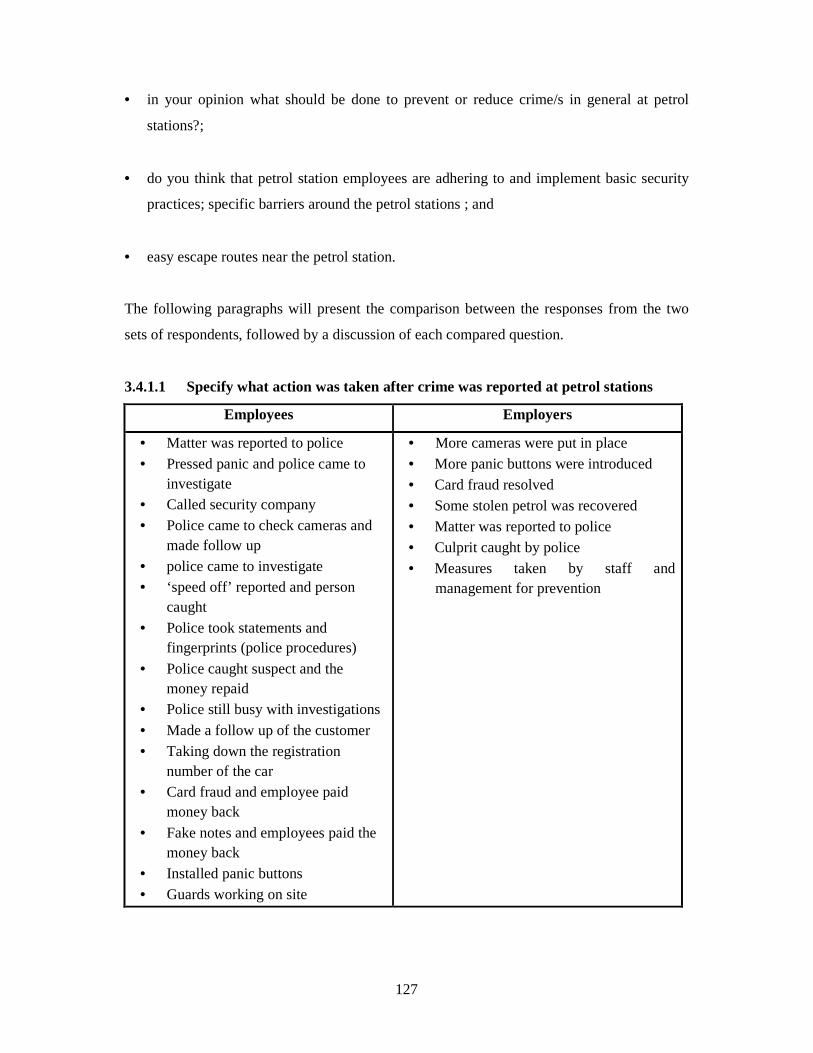
127
• in your opinion what should be done to prevent or reduce crime/s in general at petrol
stations?;
• do you think that petrol station employees are adhering to and implement basic security
practices; specific barriers around the petrol stations ; and
• easy escape routes near the petrol station.
The following paragraphs will present the comparison between the responses from the two
sets of respondents, followed by a discussion of each compared question.
3.4.1.1 Specify what action was taken after crime was reported at petrol stations
Employees Employers
• Matter was reported to police • Pressed panic and police came to
investigate • Called security company • Police came to check cameras and
made follow up • police came to investigate • ‘speed off’ reported and person
caught • Police took statements and
fingerprints (police procedures)
• Police caught suspect and the money repaid
• Police still busy with investigations
• Made a follow up of the customer • Taking down the registration
number of the car • Card fraud and employee paid
money back
• Fake notes and employees paid the money back
• Installed panic buttons • Guards working on site
• More cameras were put in place • More panic buttons were introduced • Card fraud resolved • Some stolen petrol was recovered • Matter was reported to police • Culprit caught by police • Measures taken by staff and
management for prevention
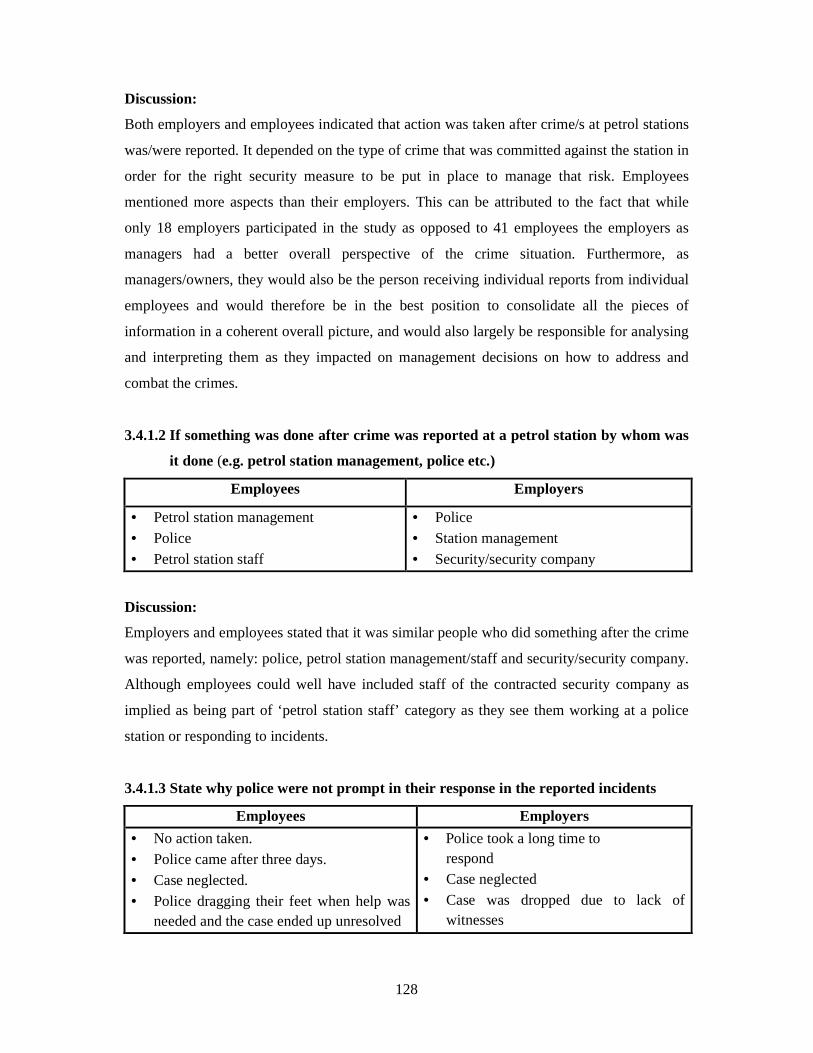
128
Discussion:
Both employers and employees indicated that action was taken after crime/s at petrol stations
was/were reported. It depended on the type of crime that was committed against the station in
order for the right security measure to be put in place to manage that risk. Employees
mentioned more aspects than their employers. This can be attributed to the fact that while
only 18 employers participated in the study as opposed to 41 employees the employers as
managers had a better overall perspective of the crime situation. Furthermore, as
managers/owners, they would also be the person receiving individual reports from individual
employees and would therefore be in the best position to consolidate all the pieces of
information in a coherent overall picture, and would also largely be responsible for analysing
and interpreting them as they impacted on management decisions on how to address and
combat the crimes.
3.4.1.2 If something was done after crime was reported at a petrol station by whom was
it done (e.g. petrol station management, police etc.)
Employees Employers
• Petrol station management • Police • Petrol station staff
• Police • Station management • Security/security company
Discussion:
Employers and employees stated that it was similar people who did something after the crime
was reported, namely: police, petrol station management/staff and security/security company.
Although employees could well have included staff of the contracted security company as
implied as being part of ‘petrol station staff’ category as they see them working at a police
station or responding to incidents.
3.4.1.3 State why police were not prompt in their response in the reported incidents
Employees Employers
• No action taken. • Police came after three days. • Case neglected. • Police dragging their feet when help was
needed and the case ended up unresolved
• Police took a long time to respond
• Case neglected • Case was dropped due to lack of
witnesses
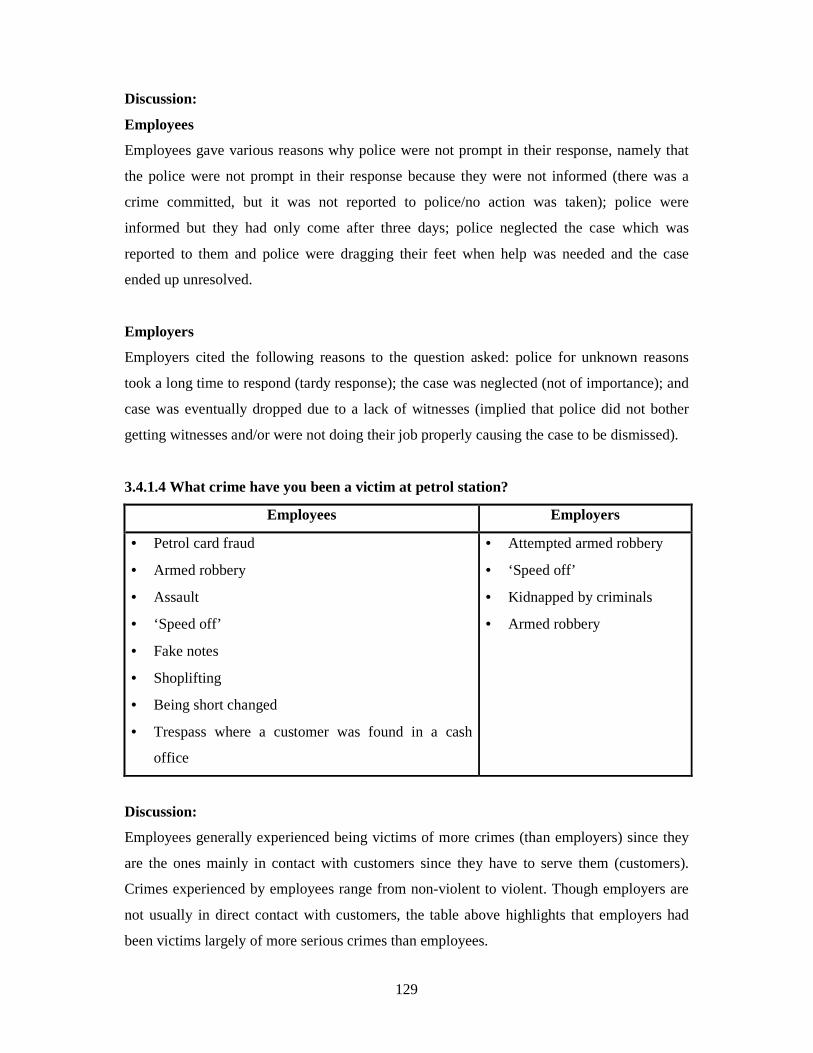
129
Discussion:
Employees
Employees gave various reasons why police were not prompt in their response, namely that
the police were not prompt in their response because they were not informed (there was a
crime committed, but it was not reported to police/no action was taken); police were
informed but they had only come after three days; police neglected the case which was
reported to them and police were dragging their feet when help was needed and the case
ended up unresolved.
Employers
Employers cited the following reasons to the question asked: police for unknown reasons
took a long time to respond (tardy response); the case was neglected (not of importance); and
case was eventually dropped due to a lack of witnesses (implied that police did not bother
getting witnesses and/or were not doing their job properly causing the case to be dismissed).
3.4.1.4 What crime have you been a victim at petrol station?
Employees Employers
• Petrol card fraud
• Armed robbery
• Assault
• ‘Speed off’
• Fake notes
• Shoplifting
• Being short changed
• Trespass where a customer was found in a cash
office
• Attempted armed robbery
• ‘Speed off’
• Kidnapped by criminals
• Armed robbery
Discussion:
Employees generally experienced being victims of more crimes (than employers) since they
are the ones mainly in contact with customers since they have to serve them (customers).
Crimes experienced by employees range from non-violent to violent. Though employers are
not usually in direct contact with customers, the table above highlights that employers had
been victims largely of more serious crimes than employees.
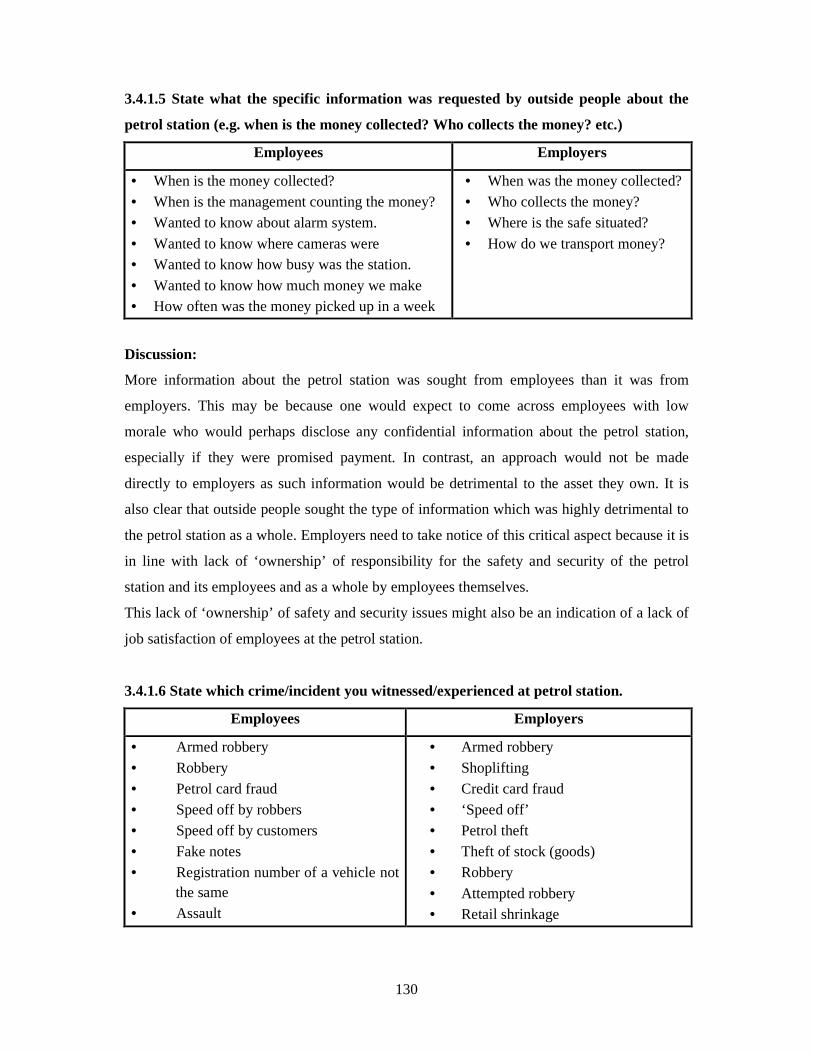
130
3.4.1.5 State what the specific information was requested by outside people about the
petrol station (e.g. when is the money collected? Who collects the money? etc.)
Employees Employers
• When is the money collected? • When is the management counting the money? • Wanted to know about alarm system.
• Wanted to know where cameras were • Wanted to know how busy was the station.
• Wanted to know how much money we make • How often was the money picked up in a week
• When was the money collected? • Who collects the money? • Where is the safe situated?
• How do we transport money?
Discussion:
More information about the petrol station was sought from employees than it was from
employers. This may be because one would expect to come across employees with low
morale who would perhaps disclose any confidential information about the petrol station,
especially if they were promised payment. In contrast, an approach would not be made
directly to employers as such information would be detrimental to the asset they own. It is
also clear that outside people sought the type of information which was highly detrimental to
the petrol station as a whole. Employers need to take notice of this critical aspect because it is
in line with lack of ‘ownership’ of responsibility for the safety and security of the petrol
station and its employees and as a whole by employees themselves.
This lack of ‘ownership’ of safety and security issues might also be an indication of a lack of
job satisfaction of employees at the petrol station.
3.4.1.6 State which crime/incident you witnessed/experienced at petrol station.
Employees Employers
• Armed robbery • Robbery • Petrol card fraud • Speed off by robbers • Speed off by customers • Fake notes • Registration number of a vehicle not
the same • Assault
• Armed robbery • Shoplifting • Credit card fraud • ‘Speed off’ • Petrol theft • Theft of stock (goods) • Robbery
• Attempted robbery • Retail shrinkage
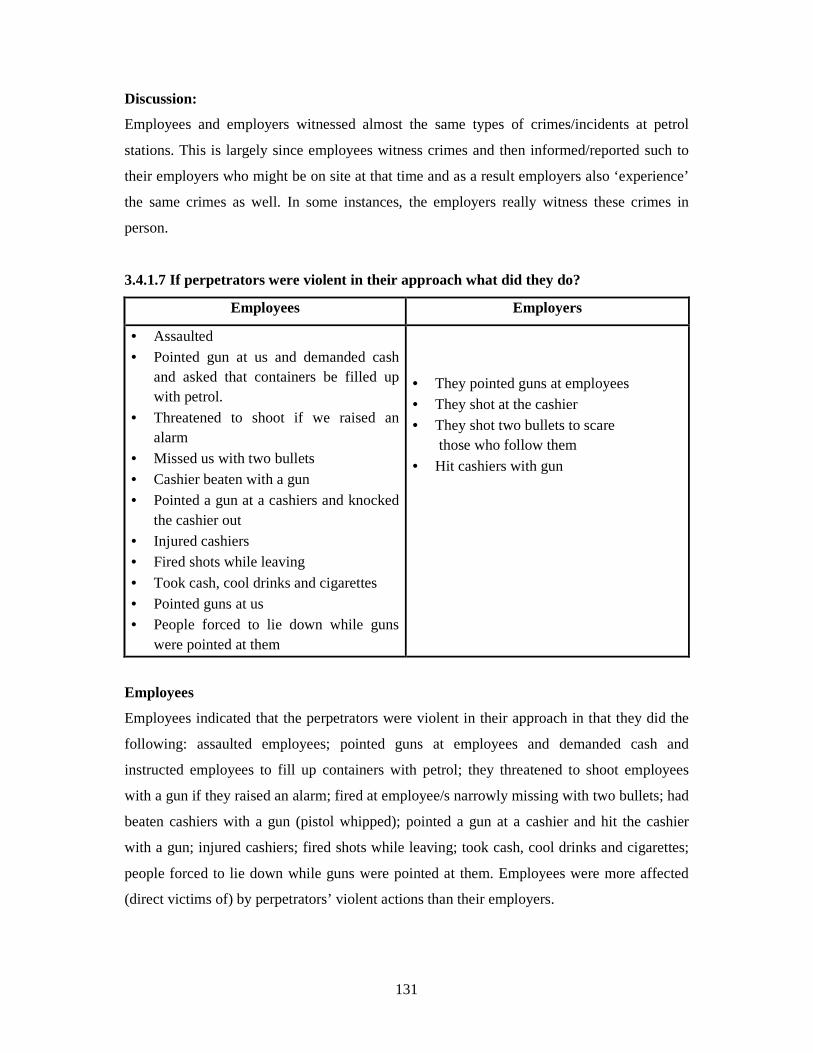
131
Discussion:
Employees and employers witnessed almost the same types of crimes/incidents at petrol
stations. This is largely since employees witness crimes and then informed/reported such to
their employers who might be on site at that time and as a result employers also ‘experience’
the same crimes as well. In some instances, the employers really witness these crimes in
person.
3.4.1.7 If perpetrators were violent in their approach what did they do?
Employees Employers
• Assaulted • Pointed gun at us and demanded cash
and asked that containers be filled up with petrol.
• Threatened to shoot if we raised an alarm
• Missed us with two bullets • Cashier beaten with a gun • Pointed a gun at a cashiers and knocked
the cashier out • Injured cashiers • Fired shots while leaving
• Took cash, cool drinks and cigarettes • Pointed guns at us • People forced to lie down while guns
were pointed at them
• They pointed guns at employees • They shot at the cashier • They shot two bullets to scare
those who follow them
• Hit cashiers with gun
Employees
Employees indicated that the perpetrators were violent in their approach in that they did the
following: assaulted employees; pointed guns at employees and demanded cash and
instructed employees to fill up containers with petrol; they threatened to shoot employees
with a gun if they raised an alarm; fired at employee/s narrowly missing with two bullets; had
beaten cashiers with a gun (pistol whipped); pointed a gun at a cashier and hit the cashier
with a gun; injured cashiers; fired shots while leaving; took cash, cool drinks and cigarettes;
people forced to lie down while guns were pointed at them. Employees were more affected
(direct victims of) by perpetrators’ violent actions than their employers.
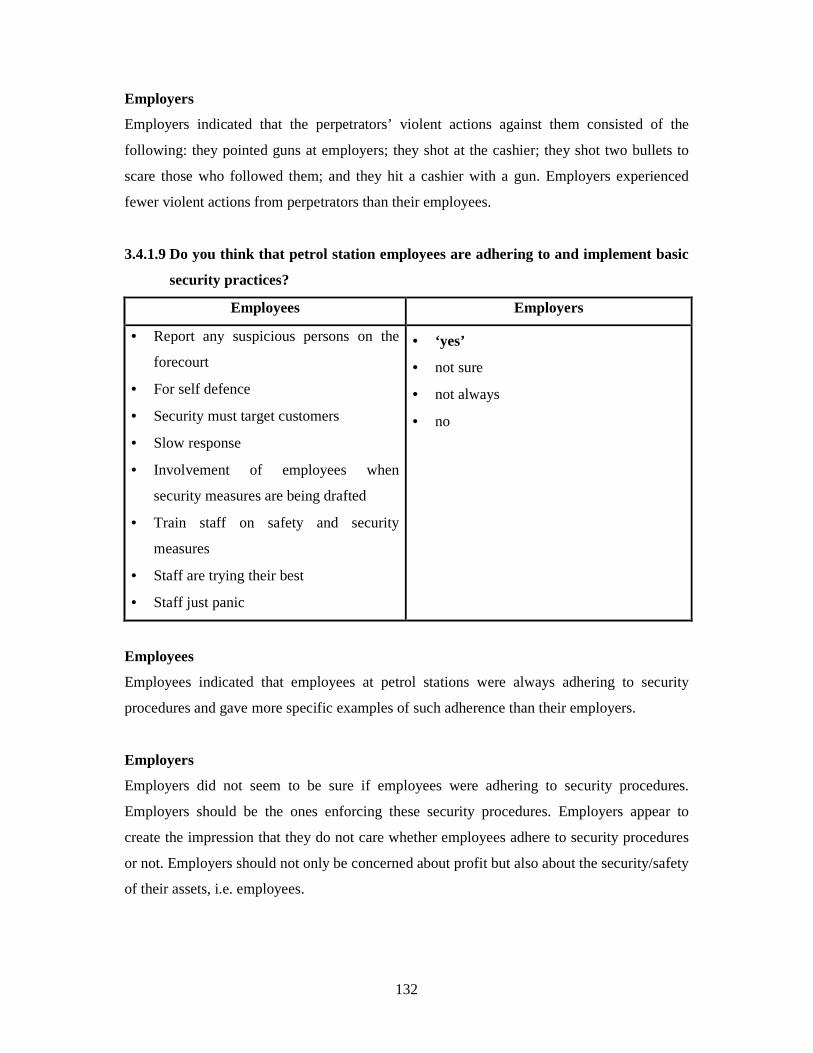
132
Employers
Employers indicated that the perpetrators’ violent actions against them consisted of the
following: they pointed guns at employers; they shot at the cashier; they shot two bullets to
scare those who followed them; and they hit a cashier with a gun. Employers experienced
fewer violent actions from perpetrators than their employees.
3.4.1.9 Do you think that petrol station employees are adhering to and implement basic
security practices?
Employees Employers
• Report any suspicious persons on the
forecourt
• For self defence
• Security must target customers
• Slow response
• Involvement of employees when
security measures are being drafted
• Train staff on safety and security
measures
• Staff are trying their best
• Staff just panic
• ‘yes’
• not sure
• not always
• no
Employees
Employees indicated that employees at petrol stations were always adhering to security
procedures and gave more specific examples of such adherence than their employers.
Employers
Employers did not seem to be sure if employees were adhering to security procedures.
Employers should be the ones enforcing these security procedures. Employers appear to
create the impression that they do not care whether employees adhere to security procedures
or not. Employers should not only be concerned about profit but also about the security/safety
of their assets, i.e. employees.

133
3.4.1.10 Specific barriers around the petrol stations
Employees Employers
• Hills
• Rivers
• Bush
• Natural plantation
• Trees
• Flowers (in beds)
• Water (feature)
• River
Employees
Employees, again, mentioned more barriers than their employers and even included the one
barrier (rivers) mentioned by their employers.
Employers
The employers only mentioned rivers as barriers around their petrol stations – in sharp
contrast to their employees, who mentioned a number of barriers. One could here suggest that
employers need to know more about basic security in order to boost their understanding about
security so that they can think about implementing the appropriate barriers at petrol stations
for better security.
3.4.1.11 Easy escape routes near the petrol station
Employees Employers
• Highways
• Parks
• Main roads
• Railway stations
• Near routes that go to locations
• Run across and get a taxi nearby
• Highway
• Main road
• Residential road
• Rail station
Discussion:
Employees mentioned more escape routes than their employers while all points mentioned by
employers were highlighted by employees.

134
Employers mentioned fewer escape routes than their employees. This again is a possible
indication that employers are not firsthand observers of physical experience of the crimes
happening as most of them are in offices inside the building or elsewhere.
3.5 CONCLUSION
The employers’ and employees’ questionnaires were statistically presented. Every question
from the questionnaires was dealt with. Responses from open-ended questions from
employers and employees questionnaires were compared whereby only comparable items
(where the same questions were posed to both target groups) from both questionnaires were
considered.
A number of differences were found, but overall, while largely more detail/information was
provided by employees, the responses were broadly similar.
The more detail provided by employees, particularly about their experience of the crimes, is
ascribed to the fact that they are the ones that more often than not have direct and close
experience of the crime as and when such crimes are being perpetrated. Employers in contrast
are not always present or in such close proximity and often are only secondary recipients of
such crime experiences.
135
CHAPTER FOUR
INTERPRETATION AND DISCUSSION OF RESEARCH FINDINGS,
RECOMMENDATIONS AND CONCLUSION
___________________________________________________________________________
4.1 INTRODUCTION
In Chapter 3, data which was collected by using questionnaires for employers and employees
at petrol stations was presented and analysed. In this Chapter, the information will be
interpreted, research findings will be identified and recommendations made based on the
aims of the study.
4.2 INTERPRETATION OF RESEARCH FINDINGS
4.2.1 Employers biographical details
Gender
A total of 18 franchisees (a term used for operator owners or managers) responded to the
questionnaires. Of the 18 franchisees twelve (67%) were males and six (33%) were females.
Deduction:
The disparity in gender equity may be attributed to the fact that this was previously a strongly
male dominated field (industry). It is only nowadays that women have started to join the
industry and started to move into franchisee positions. In most cases managerial posts are
awarded to people who are more experienced (i.e. long time serving males).
Age
In terms of age the following responses from all eighteen (100%) franchisees that four (22%)
were between 26-30 years; five (28%) were between 31-35 years of age; and nine (50%)
were more than 35 years of age.
Deduction:
The majority of the franchisees were older than 35 years of age. None of the franchisees who
responded were younger than 26 years. This is a true reflection of the real life situation.
Indeed, at 26 years and lower, you are too young to be a franchisee/manager in this particular
environment. The challenges in the field, would need somebody who is mature and ready to
face complex business situations, inter alia the crime threat.

136
Race
In terms of race three (17%) respondents were Indian; nine (50%) were black; and six (33%)
were white.
Deduction:
Half of the franchisees were black whilst a third were whites and about 17% Indians. This
clearly represents the changes resulting from of the current Black Economic Empowerment
Policy (BEE) whereby blacks have a 75% better chance of becoming employers or operators
than their counterparts (from the other racial groupings).
Marital status
In terms of marital status almost half, which is 56% of the respondents, are married whilst
39% are single.
Deduction:
One can conclude that most of the respondents had families. Most of the franchisees have two
dependents, only a tenth have three or more dependents. Since most franchisees are 35 years
and older, it is a distinct possibility that at this age a franchisee would be married with
dependents.
Highest educational qualification
In terms of highest educational qualification: two (11%) had Standard 9/Grade 11; nine
(50%) had Standard 10/Grade 12; two (11%) had three-year diploma/degree; and five (28%)
had postgraduate qualifications.
Deduction:
The highest educational qualification attained by most of the respondents is Standard
10/Grade 12. However, only 11% had a three-year diploma/degree, while a relatively larger
proportion (28%) had a postgraduate qualification. Thus, two-fifths of the respondents have
undergone tertiary education. While it would appear that a tertiary qualification is not an
absolute pre-requisite to run this kind of business, when applying to become a franchisee,
what matters, is the applicants’ capital funding and proven managerial ability or experienced
to run a business.
137
4.2.2 Profile of the petrol station
Ownership/operator categories
Fifty-six percent of the petrol stations were company owned-retailer operated (CORO) while
38% were retailer owned-retailer operated (RORO).
Deduction:
Most of the operators fall under the category of ‘company owned-retailer operated’. This has
a negative bearing on some petrol stations when it comes to security measures. In some
instances operators might well feel like putting some security measures in place but oil
company owners (brand) would often reject their ideas, arguing that their image would be
interfered with and was not worth the extra costs (for security measures). Some oil companies
also feel that putting a bullet resistant glass around the cash area would impact negatively on
the interaction with the customers.14
Daily turnover
In terms of daily turnover, three (25%) of the petrol stations reported a turnover of between
R0-R50 000; four (33%) were between R50 001-R100 000; three (25%) were between R100
001-R150 000; and two (17%) were between R150 001-R200 000 daily turnover.
Deduction:
Most of the petrol stations have a daily turnover of more than R50 000. It is evident that
when criminals launch their attacks on the second or third day of the cash collection, they can
get off with substantial amounts of cash. For example, most weekend they can get away with
about R150 000, 00 (Friday, Saturday and Sunday).
Busiest time
In terms of the busiest time, twelve (75%) mentioned in the morning; one (6%) responded
that midday was the busiest time, one (6%) highlighted that afternoon was the busiest time,
one (6%) indicated evenings were the busiest time and one (6%) said night time was the
busiest.
14 This information gleaned from the time that the researcher worked in the industry.
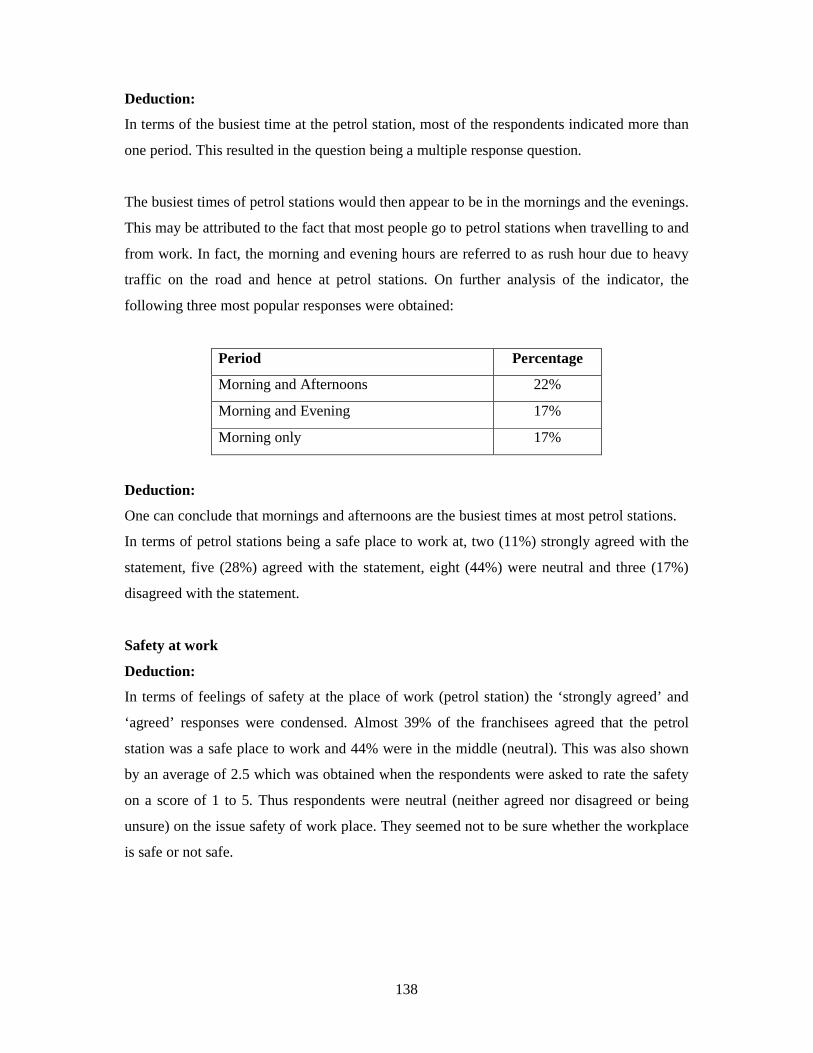
138
Deduction:
In terms of the busiest time at the petrol station, most of the respondents indicated more than
one period. This resulted in the question being a multiple response question.
The busiest times of petrol stations would then appear to be in the mornings and the evenings.
This may be attributed to the fact that most people go to petrol stations when travelling to and
from work. In fact, the morning and evening hours are referred to as rush hour due to heavy
traffic on the road and hence at petrol stations. On further analysis of the indicator, the
following three most popular responses were obtained:
Period Percentage
Morning and Afternoons 22%
Morning and Evening 17%
Morning only 17%
Deduction:
One can conclude that mornings and afternoons are the busiest times at most petrol stations.
In terms of petrol stations being a safe place to work at, two (11%) strongly agreed with the
statement, five (28%) agreed with the statement, eight (44%) were neutral and three (17%)
disagreed with the statement.
Safety at work
Deduction:
In terms of feelings of safety at the place of work (petrol station) the ‘strongly agreed’ and
‘agreed’ responses were condensed. Almost 39% of the franchisees agreed that the petrol
station was a safe place to work and 44% were in the middle (neutral). This was also shown
by an average of 2.5 which was obtained when the respondents were asked to rate the safety
on a score of 1 to 5. Thus respondents were neutral (neither agreed nor disagreed or being
unsure) on the issue safety of work place. They seemed not to be sure whether the workplace
is safe or not safe.
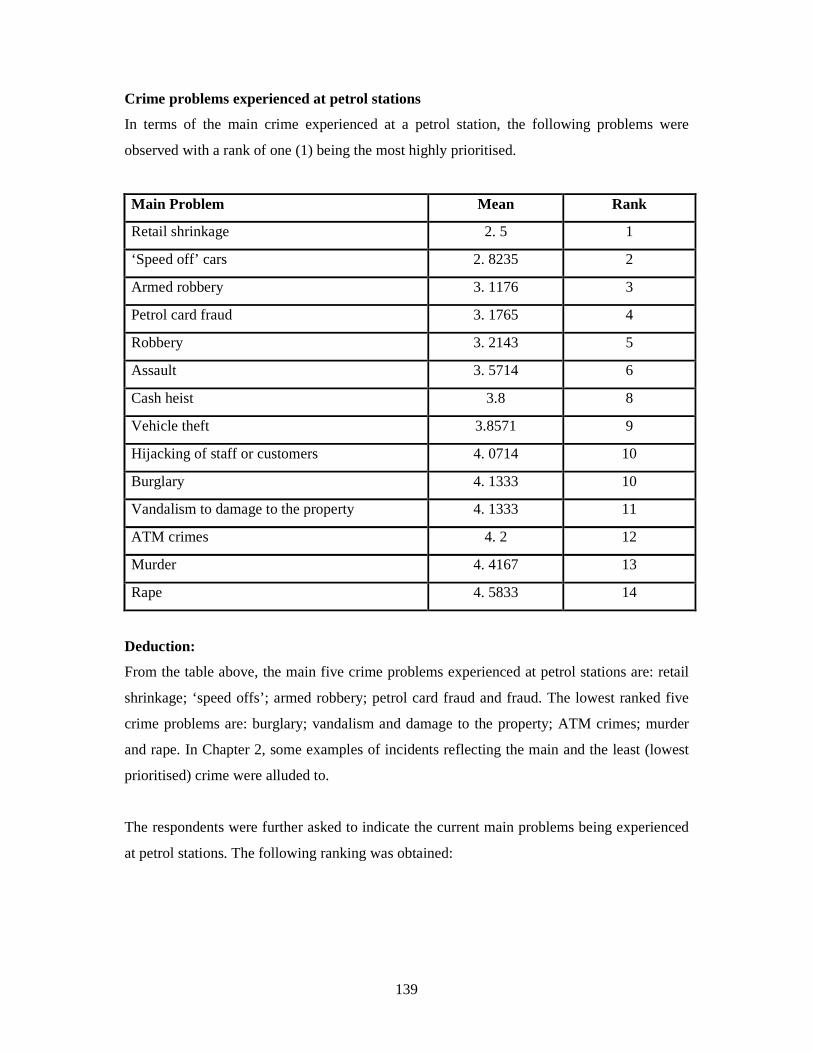
139
Crime problems experienced at petrol stations
In terms of the main crime experienced at a petrol station, the following problems were
observed with a rank of one (1) being the most highly prioritised.
Main Problem Mean Rank
Retail shrinkage 2. 5 1
‘Speed off’ cars 2. 8235 2
Armed robbery 3. 1176 3
Petrol card fraud 3. 1765 4
Robbery 3. 2143 5
Assault 3. 5714 6
Cash heist 3.8 8
Vehicle theft 3.8571 9
Hijacking of staff or customers 4. 0714 10
Burglary 4. 1333 10
Vandalism to damage to the property 4. 1333 11
ATM crimes 4. 2 12
Murder 4. 4167 13
Rape 4. 5833 14
Deduction:
From the table above, the main five crime problems experienced at petrol stations are: retail
shrinkage; ‘speed offs’; armed robbery; petrol card fraud and fraud. The lowest ranked five
crime problems are: burglary; vandalism and damage to the property; ATM crimes; murder
and rape. In Chapter 2, some examples of incidents reflecting the main and the least (lowest
prioritised) crime were alluded to.
The respondents were further asked to indicate the current main problems being experienced
at petrol stations. The following ranking was obtained:
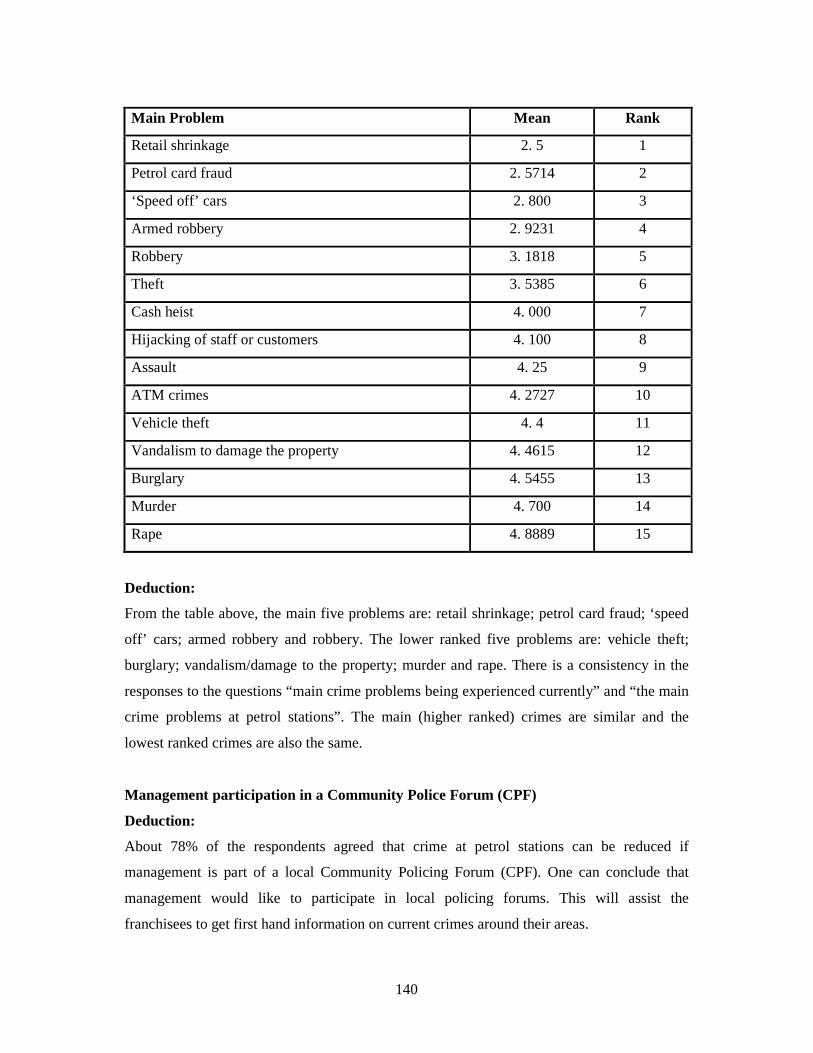
140
Main Problem Mean Rank
Retail shrinkage 2. 5 1
Petrol card fraud 2. 5714 2
‘Speed off’ cars 2. 800 3
Armed robbery 2. 9231 4
Robbery 3. 1818 5
Theft 3. 5385 6
Cash heist 4. 000 7
Hijacking of staff or customers 4. 100 8
Assault 4. 25 9
ATM crimes 4. 2727 10
Vehicle theft 4. 4 11
Vandalism to damage the property 4. 4615 12
Burglary 4. 5455 13
Murder 4. 700 14
Rape 4. 8889 15
Deduction:
From the table above, the main five problems are: retail shrinkage; petrol card fraud; ‘speed
off’ cars; armed robbery and robbery. The lower ranked five problems are: vehicle theft;
burglary; vandalism/damage to the property; murder and rape. There is a consistency in the
responses to the questions “main crime problems being experienced currently” and “the main
crime problems at petrol stations”. The main (higher ranked) crimes are similar and the
lowest ranked crimes are also the same.
Management participation in a Community Police Forum (CPF)
Deduction:
About 78% of the respondents agreed that crime at petrol stations can be reduced if
management is part of a local Community Policing Forum (CPF). One can conclude that
management would like to participate in local policing forums. This will assist the
franchisees to get first hand information on current crimes around their areas.
141
Criminal statistics can be updated and they will be able to network with the police from the
nearest local police station so that in case of emergency police would respond more promptly
(because of the good co-operative relationship built up). Operators will also be informed by
the kind of information disseminated by the local CPFs of how to improve their security.
Most petrol stations where police, metro police or security response officers are given
tea/coffee for free is a subtle encouragement to law enforcement officers to be more visible or
patrol more frequently in the vicinity. Accordingly, less crime is experienced by such petrol
stations as opposed to the one’s not providing such ‘community service’ (providing tea/coffee
and eats for free).
Participation in local community projects
In terms of participation in local community projects, four (22%) strongly agreed with the
statement; nine (50%) agreed with the statement; three (17%) were neutral and two (11%)
disagreed with the statement. Only 11% disagreed.
Deduction:
This is supported by the fact that at least 72% of the franchisees agreed that participation in
local projects by petrol station management as part of their social responsibility towards
community upliftment which helps to reduce crime at petrol stations. It always benefits a
petrol station to have the surrounding community to “buy in” (co-operate, report crime,
provide support etc.) or be involved in such security and crime issues affecting petrol
stations. Some criminals are known to the community and will therefore be warned by the
community members not to target the local ‘friendly’ petrol station.
4.2.3 Security measures
Eighteen (100%) responded to the question by indicating ‘yes’ there were security measures
at petrol stations.
Deduction:
It is clear that all petrol stations have some form of security measures in place. Be that as it
may, to have security measures in place at petrol stations is one thing and their effectiveness
in avoiding or reducing crime is another. You can have all security measures in place but if
they are not well coordinated, implemented and procedures enforced and applied on a regular
basis they will not serve any positive purpose.
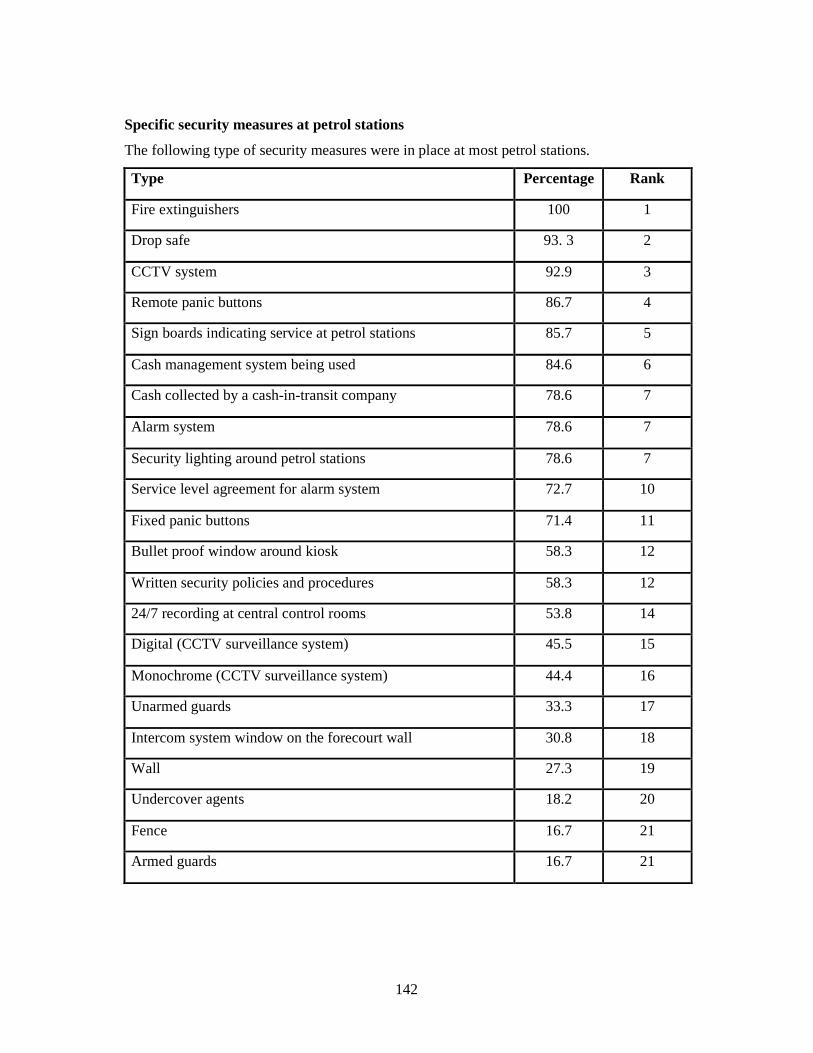
142
Specific security measures at petrol stations
The following type of security measures were in place at most petrol stations.
Type Percentage Rank
Fire extinguishers 100 1
Drop safe 93. 3 2
CCTV system 92.9 3
Remote panic buttons 86.7 4
Sign boards indicating service at petrol stations 85.7 5
Cash management system being used 84.6 6
Cash collected by a cash-in-transit company 78.6 7
Alarm system 78.6 7
Security lighting around petrol stations 78.6 7
Service level agreement for alarm system 72.7 10
Fixed panic buttons 71.4 11
Bullet proof window around kiosk 58.3 12
Written security policies and procedures 58.3 12
24/7 recording at central control rooms 53.8 14
Digital (CCTV surveillance system) 45.5 15
Monochrome (CCTV surveillance system) 44.4 16
Unarmed guards 33.3 17
Intercom system window on the forecourt wall 30.8 18
Wall 27.3 19
Undercover agents 18.2 20
Fence 16.7 21
Armed guards 16.7 21
143
Deduction:
All the petrol stations have fire extinguishers installed. This is in line with the minimum
requirements to set up such a business and the Occupational Health and Safety Act No 85 of
1993. Furthermore, most of the petrol stations make use of a drop safe and CCTV cameras.
CCTV systems ranked number 3 and when broken down into digital and monochrome they
gave an indication that 44% of CCTV is monochrome and 46% is digital remote panic
buttons, sign boards indicating service at petrol stations and cash management systems are
also used. The least security measures are unarmed guards, intercom system window in the
forecourt, walls, undercover agents, fence and armed guards. Most petrol stations do not have
guards whether armed or not armed.
CCTV surveillance cameras
In terms of CCTV coverage at the forecourt, about 78% of the respondents indicated that a
CCTV surveillance system covers the entire forecourt.
Deduction:
It can be concluded that most of the petrol stations have CCTV coverage at the forecourt.
This is a critical area where drive off, armed robbery, card fraud and other crimes can be
traced.
Of the eleven cameras at petrol stations, (100%) that responded, two (18%) pointed out that
there were eleven (11) cameras, one (9%) highlighted that there were twelve (12) cameras,
five (28%) had indicated that there were sixteen (16) cameras, one (9%) mentioned that there
were eighteen (18) cameras, one (9%) said there were twenty-four (24) cameras and one (9%)
indicated that there were thirty-six (36) cameras.
Deduction:
On average there are 17 cameras at a petrol station and 88% of the respondents agreed that
the recording is done 24 hours a day. That means, there is a continuous recording of what is
taking place. They also indicated that the recorded images are kept for almost 20 days.
Testing of alarm system
Almost 90% of the respondents agreed that the alarm system is tested regularly of those 33%
agreed that it is tested in less than a month: 60% said it was tested within a period of one
144
month to six months; whilst 7% indicated that it is tested from 1 year to less than 2 years.
Thus, most of the alarm systems are tested within a period of six months.
Deduction:
Franchisees that test their alarm system at least once a month need to be commended.
However, this is equipment that helps in terms of emergency and therefore needs to be tested
at least once a month in order to test its effectiveness. Any failure by the system should be
attended to immediately.
Informed of security measures
Almost 94% of the respondents of the respondents indicated that they are informed by their
managers (security managers from oil companies) about the security measures in place at
petrol stations.
Deduction:
It is quite logical to inform staff about all the security measures that are in place at the petrol
station in order that they should know where their strengths would be when attacked so that
they should complement security system in place. Example, if an employee is being attacked,
he/she may shift wisely to the point where a camera is facing so that the culprit should be
recorded.
Effectiveness of security measures
89% of the respondents agreed that the security measures are effective. The minority who
disagreed attributed this to theft which they indicated that it is still present.
Deduction:
Petrol stations, like any other business, need security measures in place and they need to be
effective. The only time they will be effective is when they serve their purposes of protection
of the facility.
Recording of incidents
Almost half, which is 56% of the respondents, indicated that the petrol station kept a record
of violent (or criminal) incidents that occur at the petrol station.
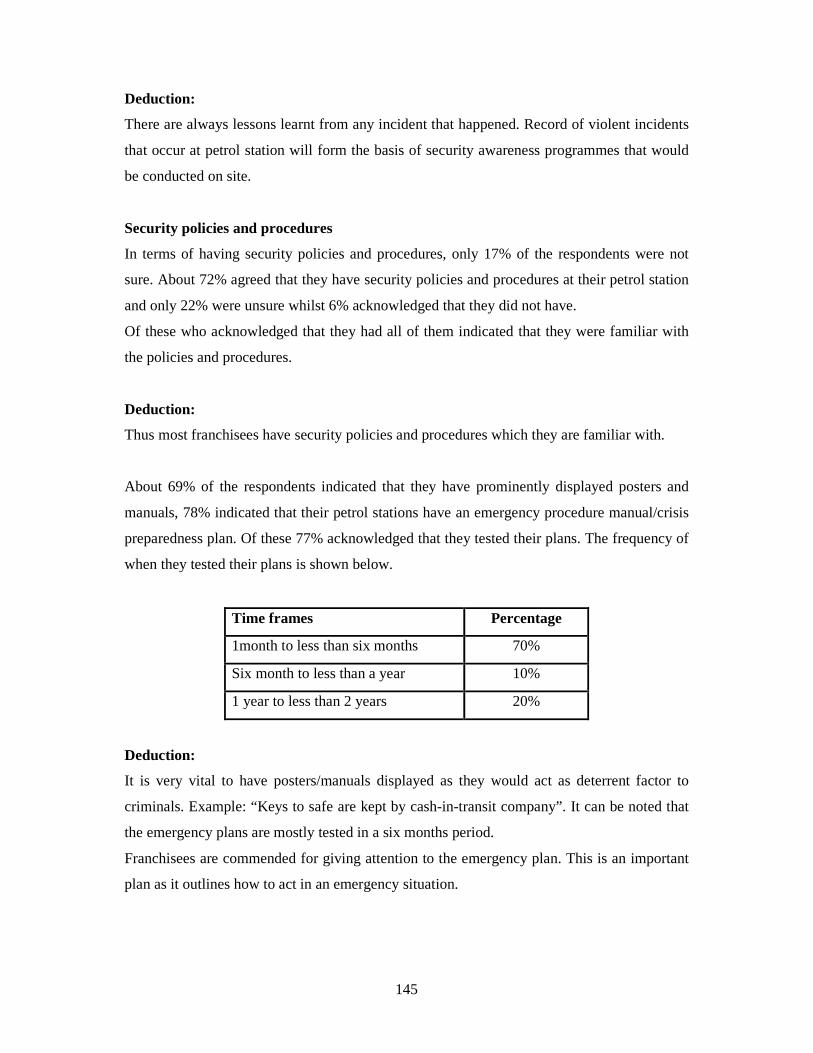
145
Deduction:
There are always lessons learnt from any incident that happened. Record of violent incidents
that occur at petrol station will form the basis of security awareness programmes that would
be conducted on site.
Security policies and procedures
In terms of having security policies and procedures, only 17% of the respondents were not
sure. About 72% agreed that they have security policies and procedures at their petrol station
and only 22% were unsure whilst 6% acknowledged that they did not have.
Of these who acknowledged that they had all of them indicated that they were familiar with
the policies and procedures.
Deduction:
Thus most franchisees have security policies and procedures which they are familiar with.
About 69% of the respondents indicated that they have prominently displayed posters and
manuals, 78% indicated that their petrol stations have an emergency procedure manual/crisis
preparedness plan. Of these 77% acknowledged that they tested their plans. The frequency of
when they tested their plans is shown below.
Time frames Percentage
1month to less than six months 70%
Six month to less than a year 10%
1 year to less than 2 years 20%
Deduction:
It is very vital to have posters/manuals displayed as they would act as deterrent factor to
criminals. Example: “Keys to safe are kept by cash-in-transit company”. It can be noted that
the emergency plans are mostly tested in a six months period.
Franchisees are commended for giving attention to the emergency plan. This is an important
plan as it outlines how to act in an emergency situation.
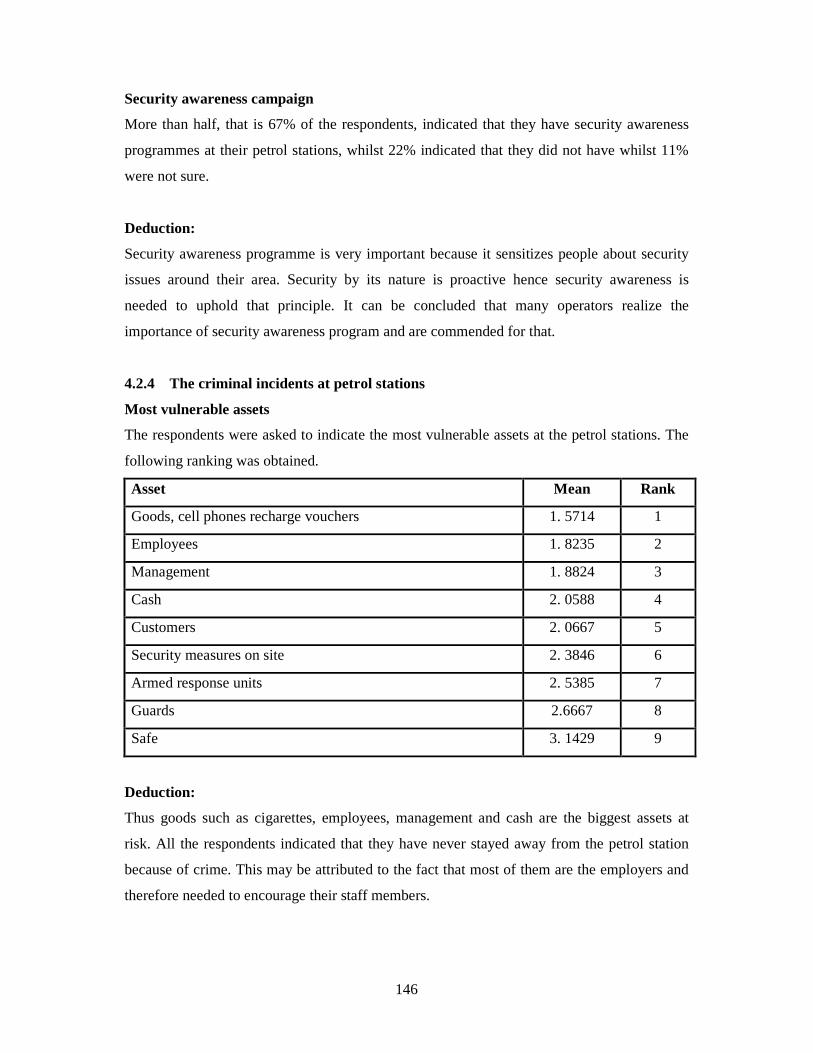
146
Security awareness campaign
More than half, that is 67% of the respondents, indicated that they have security awareness
programmes at their petrol stations, whilst 22% indicated that they did not have whilst 11%
were not sure.
Deduction:
Security awareness programme is very important because it sensitizes people about security
issues around their area. Security by its nature is proactive hence security awareness is
needed to uphold that principle. It can be concluded that many operators realize the
importance of security awareness program and are commended for that.
4.2.4 The criminal incidents at petrol stations
Most vulnerable assets
The respondents were asked to indicate the most vulnerable assets at the petrol stations. The
following ranking was obtained.
Asset Mean Rank
Goods, cell phones recharge vouchers 1. 5714 1
Employees 1. 8235 2
Management 1. 8824 3
Cash 2. 0588 4
Customers 2. 0667 5
Security measures on site 2. 3846 6
Armed response units 2. 5385 7
Guards 2.6667 8
Safe 3. 1429 9
Deduction:
Thus goods such as cigarettes, employees, management and cash are the biggest assets at
risk. All the respondents indicated that they have never stayed away from the petrol station
because of crime. This may be attributed to the fact that most of them are the employers and
therefore needed to encourage their staff members.
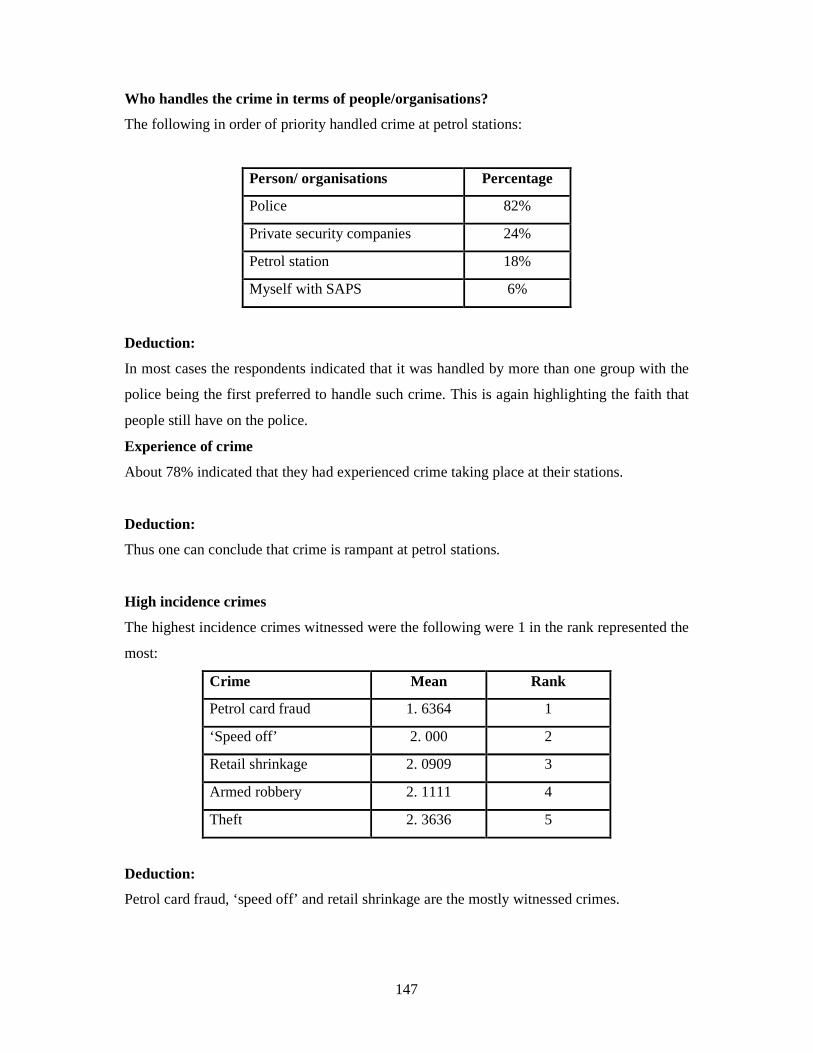
147
Who handles the crime in terms of people/organisations?
The following in order of priority handled crime at petrol stations:
Person/ organisations Percentage
Police 82%
Private security companies 24%
Petrol station 18%
Myself with SAPS 6%
Deduction:
In most cases the respondents indicated that it was handled by more than one group with the
police being the first preferred to handle such crime. This is again highlighting the faith that
people still have on the police.
Experience of crime
About 78% indicated that they had experienced crime taking place at their stations.
Deduction:
Thus one can conclude that crime is rampant at petrol stations.
High incidence crimes
The highest incidence crimes witnessed were the following were 1 in the rank represented the
most:
Crime Mean Rank
Petrol card fraud 1. 6364 1
‘Speed off’ 2. 000 2
Retail shrinkage 2. 0909 3
Armed robbery 2. 1111 4
Theft 2. 3636 5
Deduction:
Petrol card fraud, ‘speed off’ and retail shrinkage are the mostly witnessed crimes.
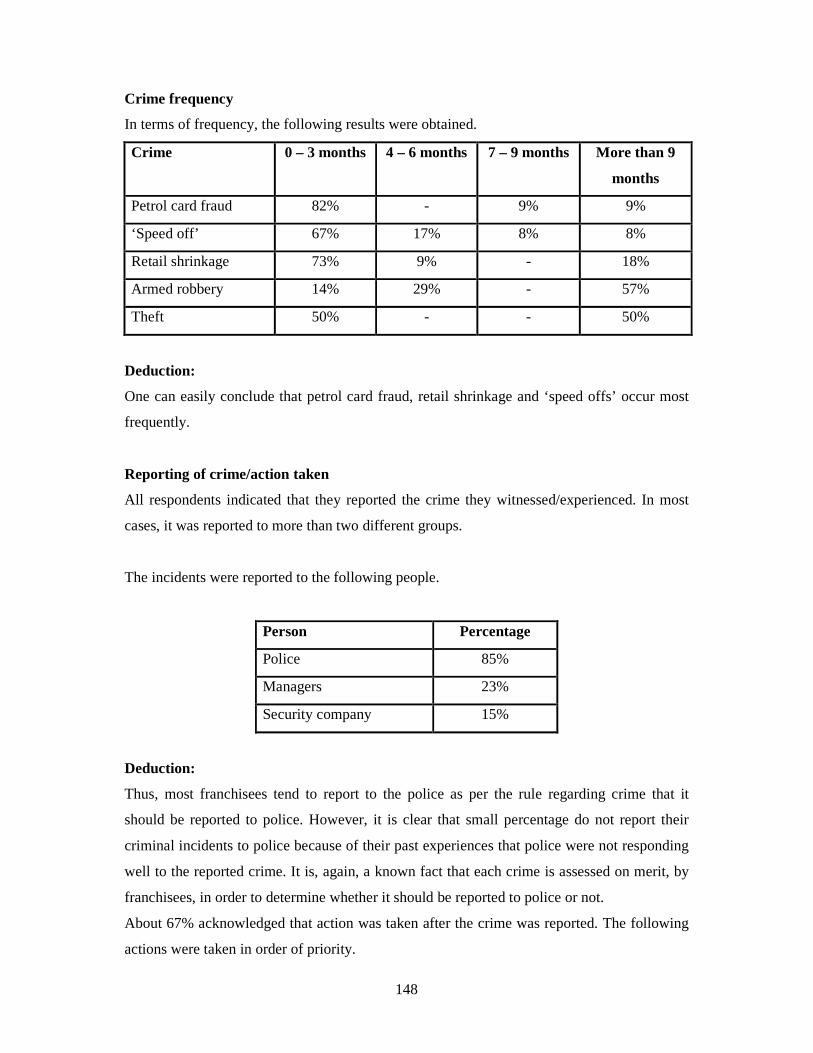
148
Crime frequency
In terms of frequency, the following results were obtained.
Crime 0 – 3 months 4 – 6 months 7 – 9 months More than 9
months
Petrol card fraud 82% - 9% 9%
‘Speed off’ 67% 17% 8% 8%
Retail shrinkage 73% 9% - 18%
Armed robbery 14% 29% - 57%
Theft 50% - - 50%
Deduction:
One can easily conclude that petrol card fraud, retail shrinkage and ‘speed offs’ occur most
frequently.
Reporting of crime/action taken
All respondents indicated that they reported the crime they witnessed/experienced. In most
cases, it was reported to more than two different groups.
The incidents were reported to the following people.
Person Percentage
Police 85%
Managers 23%
Security company 15%
Deduction:
Thus, most franchisees tend to report to the police as per the rule regarding crime that it
should be reported to police. However, it is clear that small percentage do not report their
criminal incidents to police because of their past experiences that police were not responding
well to the reported crime. It is, again, a known fact that each crime is assessed on merit, by
franchisees, in order to determine whether it should be reported to police or not.
About 67% acknowledged that action was taken after the crime was reported. The following
actions were taken in order of priority.
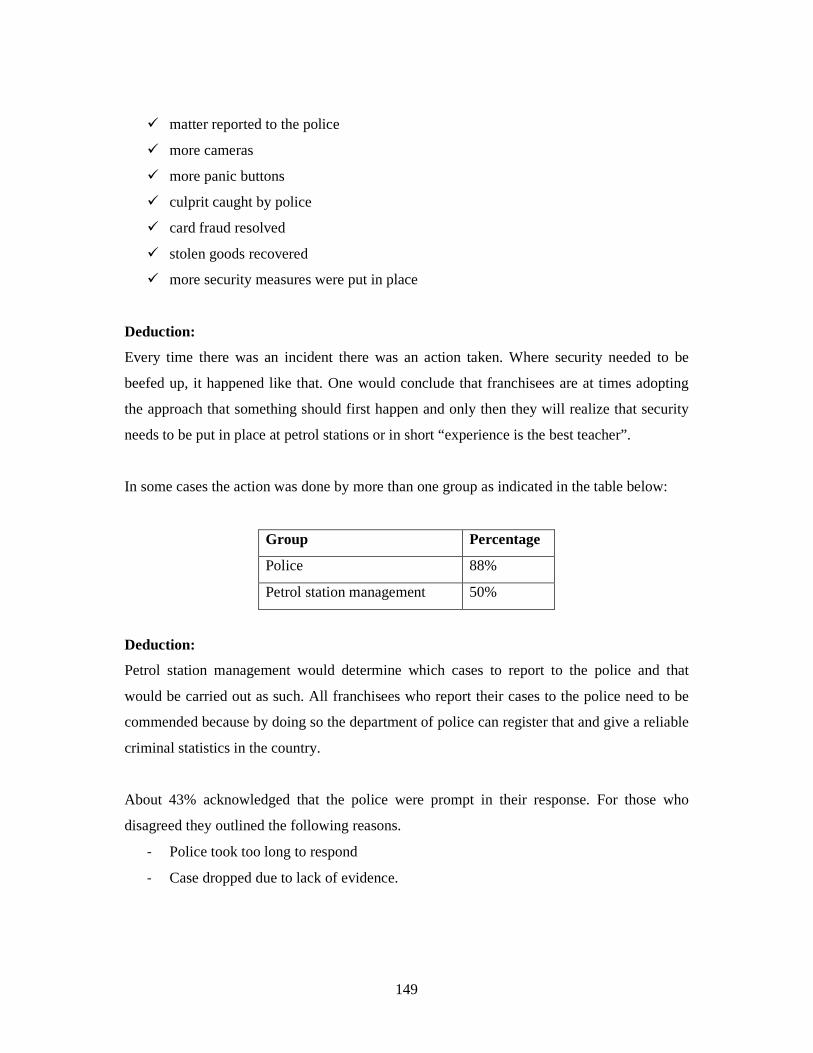
149
� matter reported to the police
� more cameras
� more panic buttons
� culprit caught by police
� card fraud resolved
� stolen goods recovered
� more security measures were put in place
Deduction:
Every time there was an incident there was an action taken. Where security needed to be
beefed up, it happened like that. One would conclude that franchisees are at times adopting
the approach that something should first happen and only then they will realize that security
needs to be put in place at petrol stations or in short “experience is the best teacher”.
In some cases the action was done by more than one group as indicated in the table below:
Group Percentage
Police 88%
Petrol station management 50%
Deduction:
Petrol station management would determine which cases to report to the police and that
would be carried out as such. All franchisees who report their cases to the police need to be
commended because by doing so the department of police can register that and give a reliable
criminal statistics in the country.
About 43% acknowledged that the police were prompt in their response. For those who
disagreed they outlined the following reasons.
- Police took too long to respond
- Case dropped due to lack of evidence.

150
Deduction:
Generally the police’s response to crime when called upon was poor.
Victims of crime
More than half, which is 57% of the respondents, indicated that they have been victims of
crime. They experienced the following crimes
• armed robbery;
• ‘speed off’;
• kidnapped by criminals; and
• attempted armed robbery.
Deduction:
Franchisees have been victims of more violent crimes and therefore should know better about
what specific security measures should be put in place at their petrol stations. In some
instances they get disadvantaged by the category of petrol station which is Company owned-
Retailer operated whereby the oil company looks more to its image than the security needs of
operators.
In terms of who committed the crime against respondents, some respondents gave more than
one response. All the franchisees indicated that most crimes were committed by groups of
criminals, 14% of the respondents indicated that they were committed by customers and also
group of criminals.
Deduction:
It can be concluded that most crimes at petrol station were committed by group of criminals
whereby some of them had been known as customers. It is clear that high levels of security
should be exercised at all times since people perceived to be customers are at times on a
mission to study the area in order to detect loopholes in the security system that can be
exploited.
About 40% indicated that the incident occurred within six months. All the respondents
indicated that they have never stolen from the petrol stations.
151
Deduction:
In some instances the attackers will take a break from their criminal activity before launching
another attack.
This is derived from the common knowledge that immediately after the attack people will be
alert but after a few months people again start to be careless (slacken off in terms of being
vigilant or enforcing procedures) and they will attack the station again. Of course, operators
were not expected to steal from their petrol station. They needed to set a good example to
their employees.
Approached for inside information
About 22% indicated that they have been approached by outside people for information. The
most frequently asked questions were:
� when is the money collected?
� how do we transport cash?
� who collects the money?
� where is the safe situated?
All those who were approached refused to supply the information and also they indicated that
the requestors were prepared to pay for the information.
Deduction:
It is clear that perpetrators would not mind asking any person who would provide them with
the necessary information. In this business you have an operator as the owner or an operator
on behalf of the oil company, normally called the manager. Imagine if a frustrated manager is
approached by such people. Critical information which is detrimental to the petrol station
might be leaked. More so if perpetrators are prepared to pay for that information.
Firearms on premises and gun safes
Only 13% of the respondents indicated that they brought a firearms (guns) onto petrol station.
Only 6% indicated that there are no gun safes at their stations. Those who said that there were
no gun safes at the station, gave the following reasons:
152
� do not bring firearms at work
� do not have firearms
� firearm is on them all the time.
Deduction:
It is clear that there are no gun safes at petrol stations, which is in contravention with
Firearms Control Act 60 of 2000 whereby at workplace gun safes should be provided for in
order to discourage unnecessary incidents resulting from reckless storage of firearm.
4.2.5 Perpetrators profile
Types of crime being perpetrated
Some franchisees experienced more than one crime. The following crimes were experienced
or witnessed at the station:
� Armed robbery
� Shoplifting
� ‘Speed off’
� Retail shrinkage (theft of stock)
� Petrol theft
� Robbery
� Attempted armed robbery
Deduction:
Everyone is vulnerable to crime at petrol stations, including franchisees. These are people
who have to make decisions that security measures are put in place at petrol stations. It is
because of this reason that franchisees feel bad when oil companies do not approve their
plans of putting in security countermeasures that satisfy them.
Perpetrators
Sixty eight percent (68%) of the respondents indicated that the perpetrators moved in groups
of two or three whilst 19% indicated that they moved in groups of 4 or 5. The perpetrators are
mostly blacks. 81% indicated that they were males whilst 13% indicated that they were both
males and females. In terms of race of perpetrators, three (21. 4%) were blacks, five (36%)
were Indians, four (29%) were Asians and two (14%) were Coloureds.
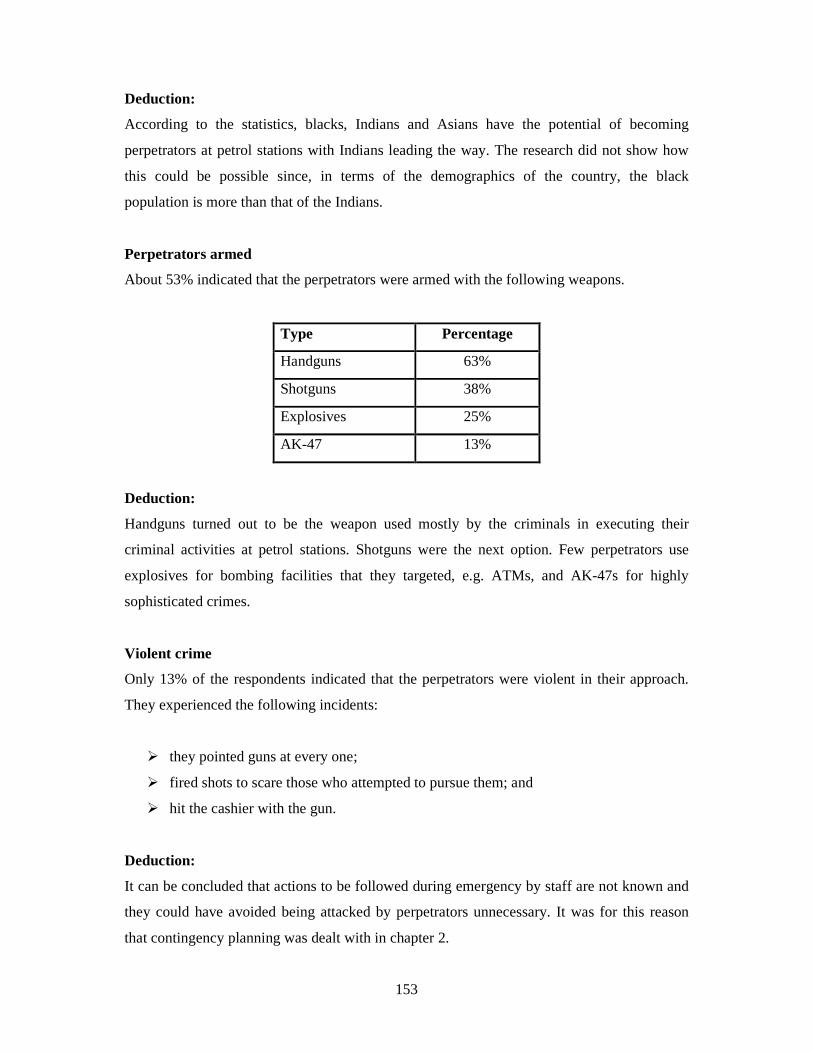
153
Deduction:
According to the statistics, blacks, Indians and Asians have the potential of becoming
perpetrators at petrol stations with Indians leading the way. The research did not show how
this could be possible since, in terms of the demographics of the country, the black
population is more than that of the Indians.
Perpetrators armed
About 53% indicated that the perpetrators were armed with the following weapons.
Type Percentage
Handguns 63%
Shotguns 38%
Explosives 25%
AK-47 13%
Deduction:
Handguns turned out to be the weapon used mostly by the criminals in executing their
criminal activities at petrol stations. Shotguns were the next option. Few perpetrators use
explosives for bombing facilities that they targeted, e.g. ATMs, and AK-47s for highly
sophisticated crimes.
Violent crime
Only 13% of the respondents indicated that the perpetrators were violent in their approach.
They experienced the following incidents:
� they pointed guns at every one;
� fired shots to scare those who attempted to pursue them; and
� hit the cashier with the gun.
Deduction:
It can be concluded that actions to be followed during emergency by staff are not known and
they could have avoided being attacked by perpetrators unnecessary. It was for this reason
that contingency planning was dealt with in chapter 2.
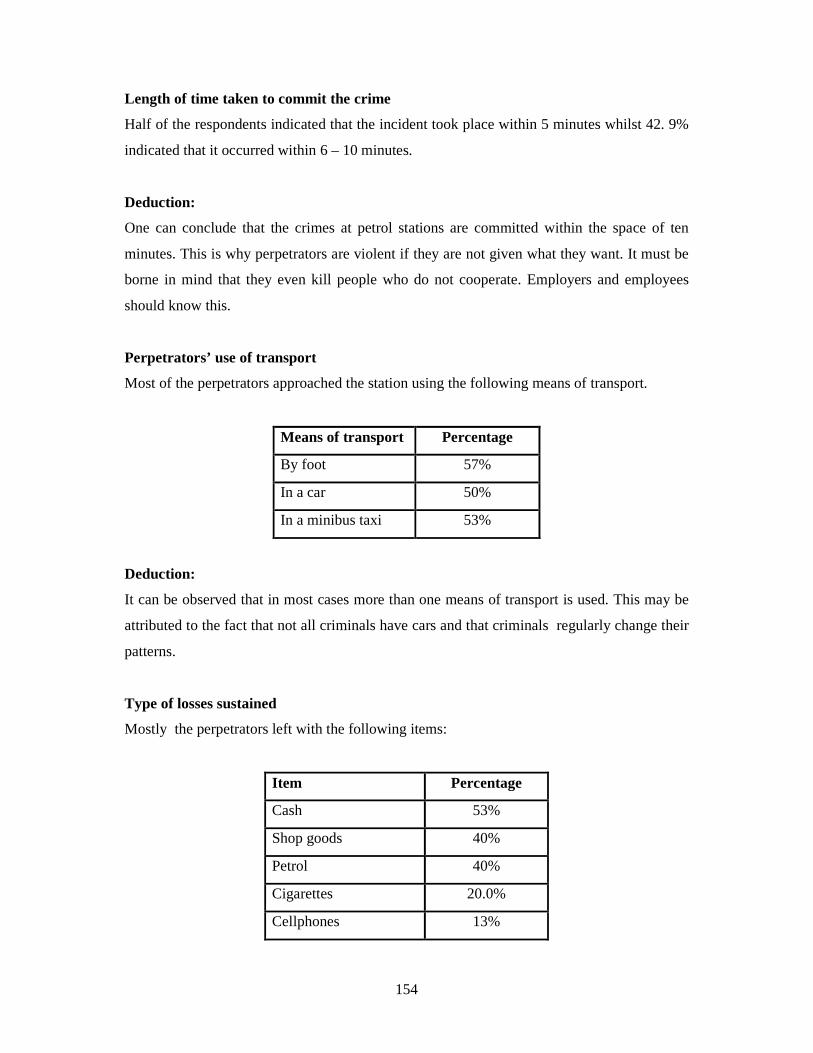
154
Length of time taken to commit the crime
Half of the respondents indicated that the incident took place within 5 minutes whilst 42. 9%
indicated that it occurred within 6 – 10 minutes.
Deduction:
One can conclude that the crimes at petrol stations are committed within the space of ten
minutes. This is why perpetrators are violent if they are not given what they want. It must be
borne in mind that they even kill people who do not cooperate. Employers and employees
should know this.
Perpetrators’ use of transport
Most of the perpetrators approached the station using the following means of transport.
Means of transport Percentage
By foot 57%
In a car 50%
In a minibus taxi 53%
Deduction:
It can be observed that in most cases more than one means of transport is used. This may be
attributed to the fact that not all criminals have cars and that criminals regularly change their
patterns.
Type of losses sustained
Mostly the perpetrators left with the following items:
Item Percentage
Cash 53%
Shop goods 40%
Petrol 40%
Cigarettes 20.0%
Cellphones 13%
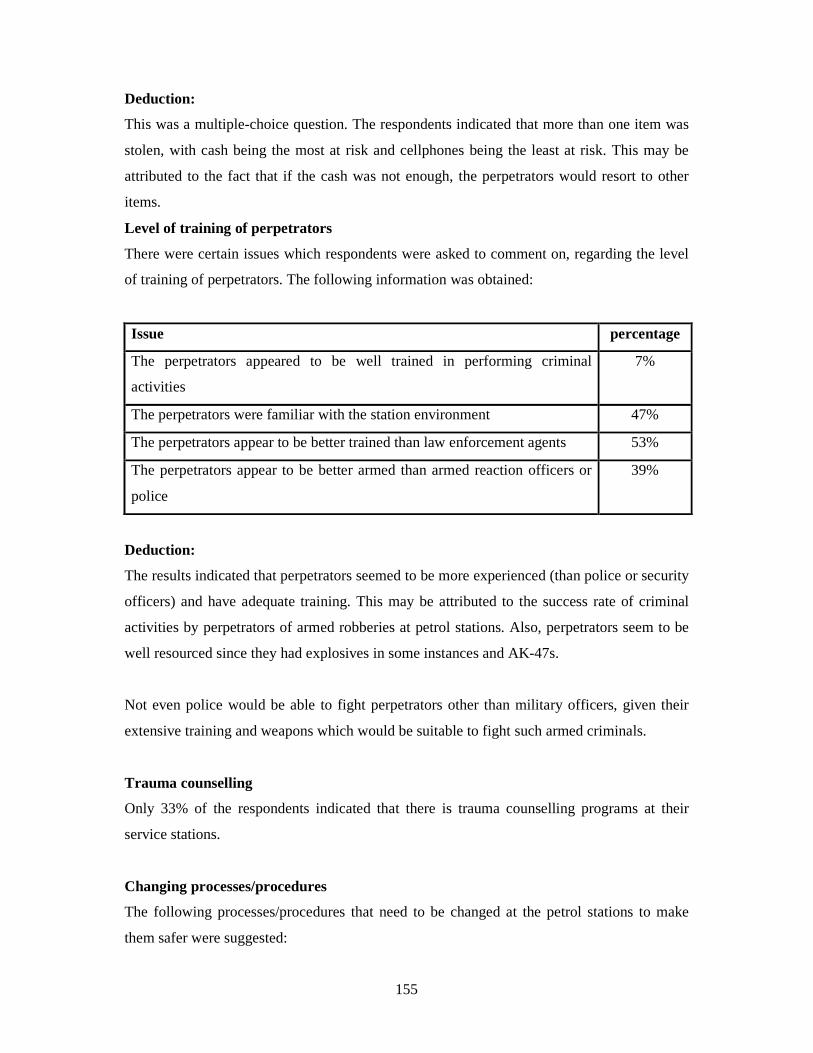
155
Deduction:
This was a multiple-choice question. The respondents indicated that more than one item was
stolen, with cash being the most at risk and cellphones being the least at risk. This may be
attributed to the fact that if the cash was not enough, the perpetrators would resort to other
items.
Level of training of perpetrators
There were certain issues which respondents were asked to comment on, regarding the level
of training of perpetrators. The following information was obtained:
Issue percentage
The perpetrators appeared to be well trained in performing criminal
activities
7%
The perpetrators were familiar with the station environment 47%
The perpetrators appear to be better trained than law enforcement agents 53%
The perpetrators appear to be better armed than armed reaction officers or
police
39%
Deduction:
The results indicated that perpetrators seemed to be more experienced (than police or security
officers) and have adequate training. This may be attributed to the success rate of criminal
activities by perpetrators of armed robberies at petrol stations. Also, perpetrators seem to be
well resourced since they had explosives in some instances and AK-47s.
Not even police would be able to fight perpetrators other than military officers, given their
extensive training and weapons which would be suitable to fight such armed criminals.
Trauma counselling
Only 33% of the respondents indicated that there is trauma counselling programs at their
service stations.
Changing processes/procedures
The following processes/procedures that need to be changed at the petrol stations to make
them safer were suggested:
156
� Staff awareness and training
� Have 24/7 private security guards
� Payment before any transaction
� Keep the minimum cash at service stations
� Beef up security
� Guard patrolling inside the shop
� Reduce hours of work up to twelve midnight
� Central controlling monitoring systems
� Bullet proof glass around cashier
� Install CCTV cameras.
� Cash vans to collect cash at appropriate time
� Build strong bond with community
� Credit card fraud management
Interpretation:
All of the above mentioned security procedures were said to be present at petrol stations, but
they seemed not to be followed properly.
Deduction:
Security measures may be available at petrol stations but if they are not effective they mean
nothing.
Adherence to and implementing of security measures
About 69% of the respondents agreed that the petrol station employees are adhering to and
implementing basic security activities.
Deduction:
If there are ineffective security procedures in place, even if they are followed they would not
avoid or minimize crime from taking place at petrol stations.
157
Natural barriers around petrol stations
Only 6% of the respondents agreed that there were natural barriers like rivers and 44%
indicated that there are easy escape routes near the petrol stations. The type of escape routes
were indicated as follows:
- Highways
- Main road
- Residential road
- Rail station
Interpretation:
Criminals are using highways, main roads, residential roads and rail stations to attack the
petrol station.
Deduction:
All routes to the petrol station should be channelled accordingly. An example is to put fences
in place that will serve that purpose. CCTV cameras could also be used to protect such areas.
4.3 STATISTICAL REPORT OF THE EMPLOYEES QUESTIONNAIRES
4.3.1 Biographical details
Gender
A total of 41 employees responded to the questionnaire. About 68% of the respondents were
males.
Deduction:
This may be attributed to the fact that most of the employees at petrol stations are males, as it
is a male dominated field.
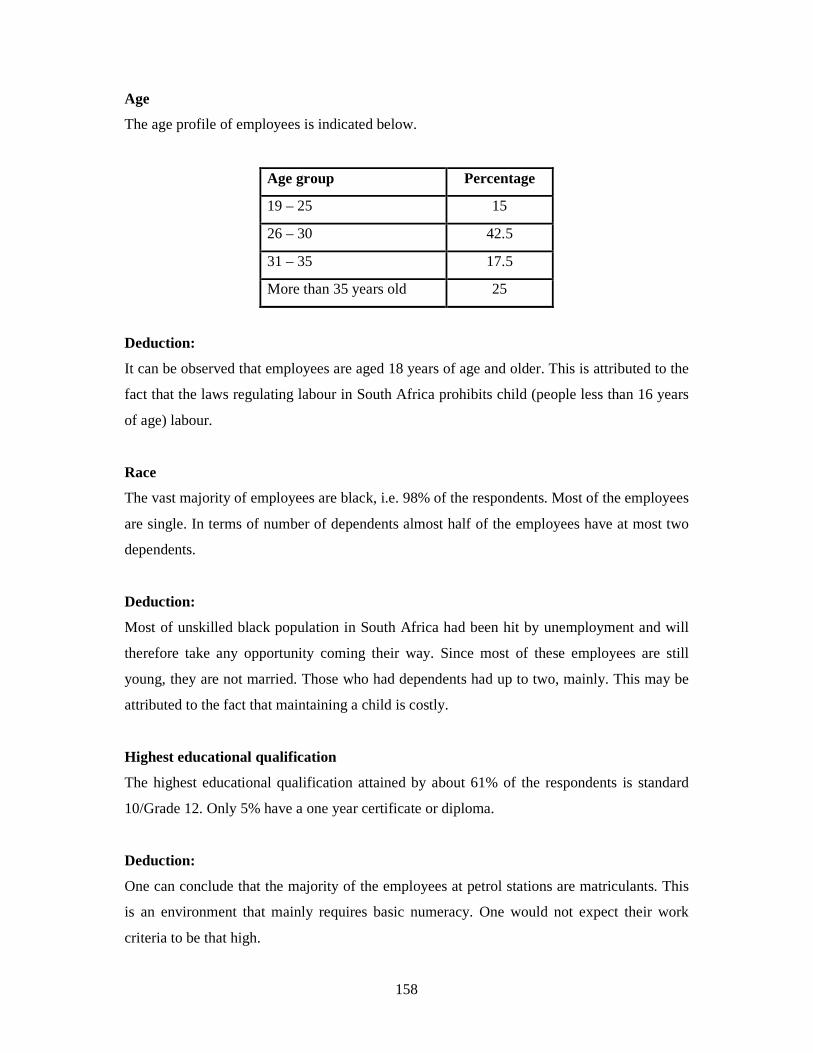
158
Age
The age profile of employees is indicated below.
Age group Percentage
19 – 25 15
26 – 30 42.5
31 – 35 17.5
More than 35 years old 25
Deduction:
It can be observed that employees are aged 18 years of age and older. This is attributed to the
fact that the laws regulating labour in South Africa prohibits child (people less than 16 years
of age) labour.
Race
The vast majority of employees are black, i.e. 98% of the respondents. Most of the employees
are single. In terms of number of dependents almost half of the employees have at most two
dependents.
Deduction:
Most of unskilled black population in South Africa had been hit by unemployment and will
therefore take any opportunity coming their way. Since most of these employees are still
young, they are not married. Those who had dependents had up to two, mainly. This may be
attributed to the fact that maintaining a child is costly.
Highest educational qualification
The highest educational qualification attained by about 61% of the respondents is standard
10/Grade 12. Only 5% have a one year certificate or diploma.
Deduction:
One can conclude that the majority of the employees at petrol stations are matriculants. This
is an environment that mainly requires basic numeracy. One would not expect their work
criteria to be that high.
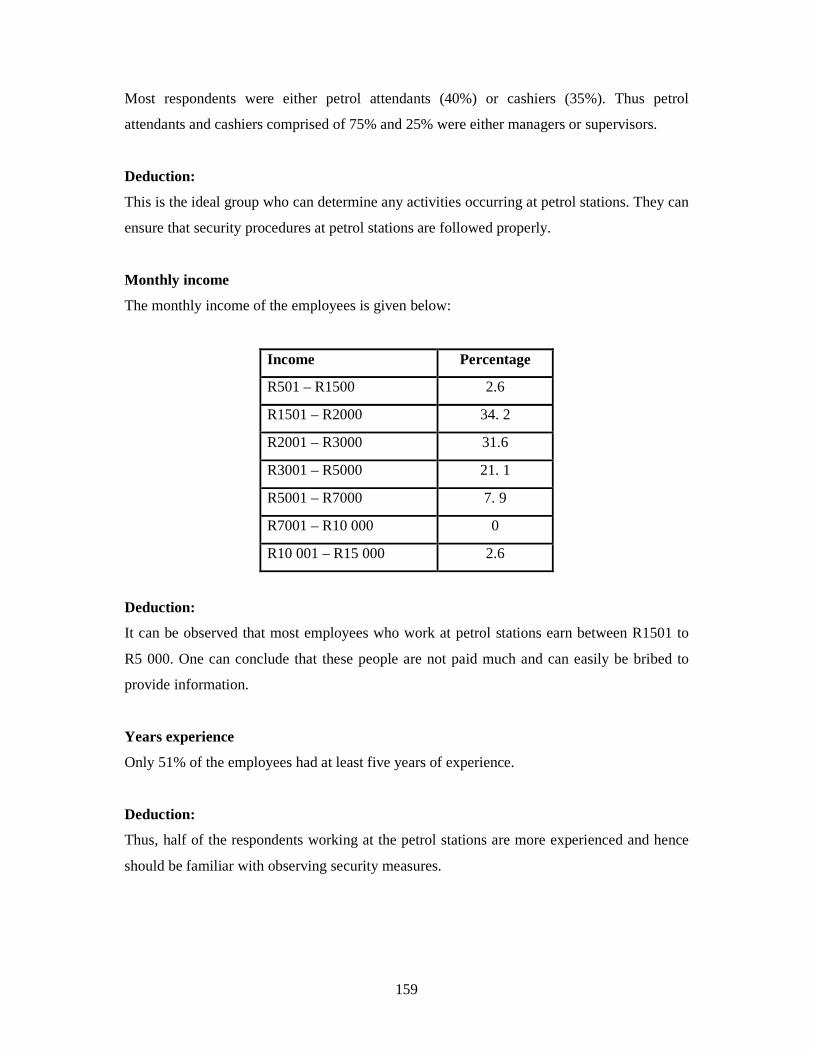
159
Most respondents were either petrol attendants (40%) or cashiers (35%). Thus petrol
attendants and cashiers comprised of 75% and 25% were either managers or supervisors.
Deduction:
This is the ideal group who can determine any activities occurring at petrol stations. They can
ensure that security procedures at petrol stations are followed properly.
Monthly income
The monthly income of the employees is given below:
Income Percentage
R501 – R1500 2.6
R1501 – R2000 34. 2
R2001 – R3000 31.6
R3001 – R5000 21. 1
R5001 – R7000 7. 9
R7001 – R10 000 0
R10 001 – R15 000 2.6
Deduction:
It can be observed that most employees who work at petrol stations earn between R1501 to
R5 000. One can conclude that these people are not paid much and can easily be bribed to
provide information.
Years experience
Only 51% of the employees had at least five years of experience.
Deduction:
Thus, half of the respondents working at the petrol stations are more experienced and hence
should be familiar with observing security measures.

160
4.3.2 Profile of the petrol station
Busiest time
In terms of the profile of the petrol stations, the busiest times are:
20% cited morning and afternoon and 27% mentioned morning only.
Deduction:
This was a multiple response question were some respondents indicated more than one
response. It can be noted that the busiest time of most petrol stations is the morning and
afternoon. This can be attributed to fact that these are rush hours and most people buy fuel
when going to work or coming from work.
Safety at work
In terms of whether the petrol station was a safe place to work at, the following responses
were obtained. Forty three of the respondents agreed that petrol stations are safe places to
work, 30% were undecided and almost 27% disagreed with the petrol station being a safe
place to work.
Deduction:
Only less than half of the respondents are of the opinion that petrol stations are safe places to
work at. It is clear that it is a challenge of employers at petrol stations to ensure that they put
security measures in place which will make employees to feel that petrol stations are safe.
Problems/crimes experienced at petrol station
In terms of main problems being experienced at the petrol station, the following problems
were observed. Rank 1 being the mostly highly prioritized.
Problem Mean Rank Petrol card fraud 1. 5357 1
‘Speed off’ 1. 6552 2
Armed robbery 2. 0000 3
Theft 2. 2174 4
Robbery 2. 3333 5
Retail shrinkage 2. 5000 6
Cash heists 3. 3529 7
Vandalism to security measures 3. 3889 8
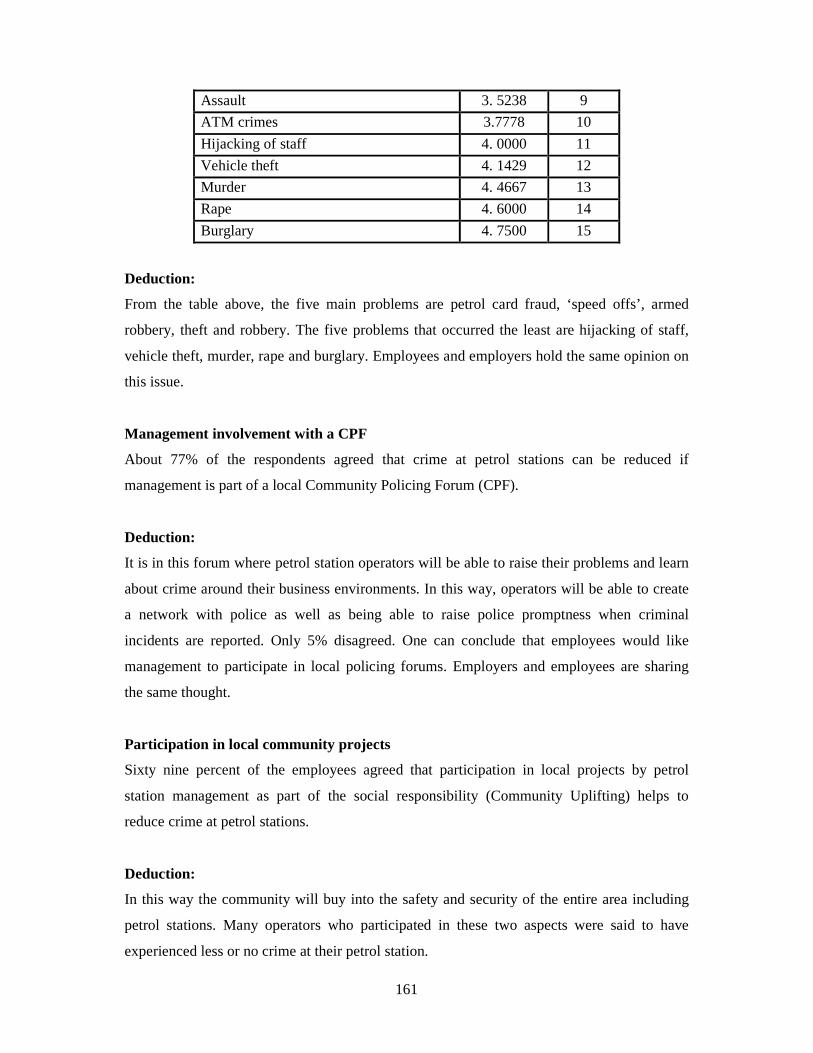
161
Assault 3. 5238 9
ATM crimes 3.7778 10
Hijacking of staff 4. 0000 11
Vehicle theft 4. 1429 12
Murder 4. 4667 13
Rape 4. 6000 14
Burglary 4. 7500 15
Deduction:
From the table above, the five main problems are petrol card fraud, ‘speed offs’, armed
robbery, theft and robbery. The five problems that occurred the least are hijacking of staff,
vehicle theft, murder, rape and burglary. Employees and employers hold the same opinion on
this issue.
Management involvement with a CPF
About 77% of the respondents agreed that crime at petrol stations can be reduced if
management is part of a local Community Policing Forum (CPF).
Deduction:
It is in this forum where petrol station operators will be able to raise their problems and learn
about crime around their business environments. In this way, operators will be able to create
a network with police as well as being able to raise police promptness when criminal
incidents are reported. Only 5% disagreed. One can conclude that employees would like
management to participate in local policing forums. Employers and employees are sharing
the same thought.
Participation in local community projects
Sixty nine percent of the employees agreed that participation in local projects by petrol
station management as part of the social responsibility (Community Uplifting) helps to
reduce crime at petrol stations.
Deduction:
In this way the community will buy into the safety and security of the entire area including
petrol stations. Many operators who participated in these two aspects were said to have
experienced less or no crime at their petrol station.
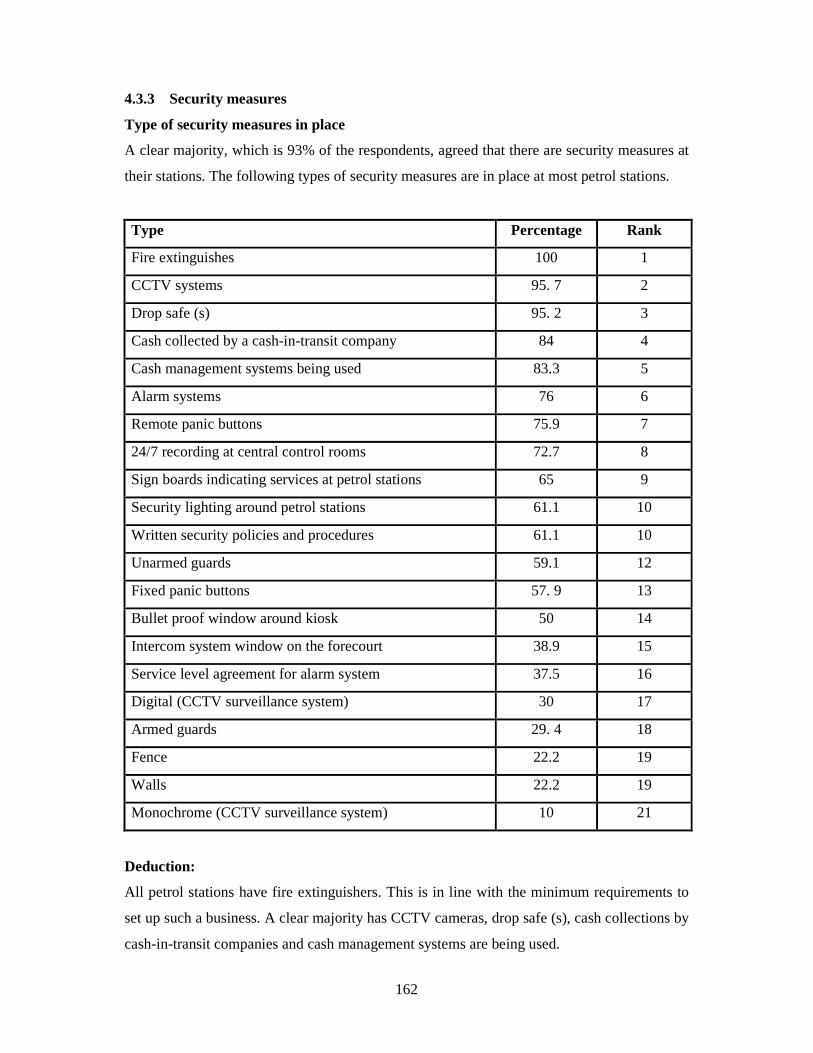
162
4.3.3 Security measures
Type of security measures in place
A clear majority, which is 93% of the respondents, agreed that there are security measures at
their stations. The following types of security measures are in place at most petrol stations.
Type Percentage Rank
Fire extinguishes 100 1
CCTV systems 95. 7 2
Drop safe (s) 95. 2 3
Cash collected by a cash-in-transit company 84 4
Cash management systems being used 83.3 5
Alarm systems 76 6
Remote panic buttons 75.9 7
24/7 recording at central control rooms 72.7 8
Sign boards indicating services at petrol stations 65 9
Security lighting around petrol stations 61.1 10
Written security policies and procedures 61.1 10
Unarmed guards 59.1 12
Fixed panic buttons 57. 9 13
Bullet proof window around kiosk 50 14
Intercom system window on the forecourt 38.9 15
Service level agreement for alarm system 37.5 16
Digital (CCTV surveillance system) 30 17
Armed guards 29. 4 18
Fence 22.2 19
Walls 22.2 19
Monochrome (CCTV surveillance system) 10 21
Deduction:
All petrol stations have fire extinguishers. This is in line with the minimum requirements to
set up such a business. A clear majority has CCTV cameras, drop safe (s), cash collections by
cash-in-transit companies and cash management systems are being used.
163
The least utilised security measures are digital (CCTV surveillance system), armed guards,
fence, walls and monochrome (CCTV surveillance system).
CCTV coverage
About 87% of the respondents indicated that a CCTV surveillance system covers the entire
forecourt at the petrol station. On average there are 14 cameras installed at each garage. Also
about 87% of the respondents agreed that camera recording is done 24 hours a day. It is a
continuous recording for 24/7 hours a day with images being stored for all most a month.
Employers indicated that the CCTV system could store data for a minimum of 20 days.
Deduction:
Having a CCTV system is one thing while a strategically placed and effective CCTV system
is another. What was not indicated was that such systems were optimal and strategically
placed and the use of images can be used as evidence. In addition, while images may well be
recorded there was no indication that monitors in a central control room for each specific
petrol station were being viewed 24/7. Continuous live monitoring takes place, so that any
incident viewed by the cameras (and ‘red flagged’ by control room operators) can be
responded to immediately. It is therefore assumed that all CCTV surveillance systems were
only operational in terms of recording. It is a known fact that the recorded images are
generally of poor quality. So the operations of such CCTV surveillance systems should be
reviewed and adjusted to become more effective in terms of combating and reducing crime.
Alarm systems tested
About 68% of the respondents agreed that the alarm system is tested regularly. Of these, 40%
agreed that it is tested during a time period of less than a month.
Forty eight (48%) of the respondents said that it was tested within a period of one month,
whilst 12% said it was tested only in a period of more than six months to less than a year.
Deduction:
Thus, one can conclude that less than half of the petrol stations test their alarm systems in a
period of one month or less. It is reasonably good practice to test an alarm system on a
regular monthly basis.
164
Informed of security measures/policies/procedures
About 50% of the respondents indicated that they are informed by their managers/supervisors
about the security measures in place at their stations. This percentage includes 25% of the
respondents who are managers/supervisors.
Deduction:
This points to the fact that at least half of the respondents indicated that they were not
informed. This is not a positive situation to be in when it comes to effectively applying these
measures.
Security measures in place
A clear majority of 80% of the respondents indicated that the security measures in place at
their stations are effective. The 20% who indicated that security measures were not effective
attributed this to the fact that there is slow response (from police and/or security company
officers) when panic buttons are pressed.
Deduction:
Overall, employees appear to exhibit faith in the effectiveness of the security measures in
place at petrol stations. However, police response is still problematic because 20% felt that
their response is poor.
Record keeping of incidents
More than half of the respondents, that is 60%, indicated that petrol stations kept a record of
violent (or criminal) incidents that occurred at the petrol stations. That no formal incident
management system is in place points to a glaring shortcoming in any integrated security
system for implementation at petrol stations.
Deduction:
Employers and employees agree that records are kept for incidents that occurred at petrol
stations. The lack of record keeping, for those petrol stations not keeping them – 40%, is a
serious shortcoming. Such records could be used to analyse and learn from, so that the
manner of handling such situations at petrol stations in future could be improved.
165
Awareness of security measures
Thirty eight percent (38%) of respondents indicated that there were security policies and
procedures in place at petrol stations. Furthermore, 25% of respondents cited that there were
no security policies and procedures in place and 38% highlighted that they were unsure of
whether or not there were security policies and procedures in place.
Deduction:
These responses point to the fact of the lack of security measures, or alternately a lack of
communication of them to employees. Much still needs to be done at petrol stations regarding
security policies and procedures. Sound security policies and procedures suitable for petrol
stations need to be designed, implemented and adhered to.
Display of information
About 53% of the respondents agreed that the posters, manuals, signs or notice boards are
prominently displayed.
Deduction:
More than half of petrol station owners are making use of posters, manual signs and notice
boards to convey warning messages to the public e.g. this area is protected by CCTV system
or keys to the safes are kept by the armed response company.
Emergency procedures awareness
In terms of emergency procedures manuals/crisis preparedness, 63% of the respondents
agreed that the plan was in place whilst 30% were not sure.
Deduction:
One can conclude that the majority of the respondents have prepared and tested emergency
plans.
Testing of plans
Ninety one percent of the respondents agreed that petrol stations have tested the plans. The
frequency of when they are tested is shown below.
166
Time Frames Percentages
Less than a month 25
One month to less than six months 55
Six months to less than a year 10
One year to less than two years 10
Deduction:
One can conclude that most petrol stations tested their plans on a monthly basis to less than
six months. Petrol stations that tested their plans on a monthly basis need to be commended.
Security awareness programmes
Only 32% of the respondents agreed that they have security awareness programs at their
stations, 37% disagreed and 32% were unsure.
Deduction:
It can be noted that in most cases employees are not aware of security awareness programs at
their work place. This may be attributed to the fact that security awareness was not taken
seriously by employers hence the high number of successful attacks against petrol stations by
perpetrators.
4.3.4 The criminal incidents at petrol stations
Assets at risk from crime
The respondents ranked the assets at risk at petrol stations as follows:
Asset Mean Rank
Cash 1. 6000 1
Employees 1. 9565 2
Customers 2. 1667 3
Goods such as cigarettes, etc 2. 3158 4
Management 2.6364 5
Guards 2.7692 6
Security measures on site 2. 8667 7
Armed response units 3. 1538 8
Safe 3. 2273 9
167
Interpretation:
Thus cash, employees and customers are the biggest assets at risk while security measures on
site, armed response unit and safes were indicated to be the least vulnerable assets. This may
be attributed to the fact that criminals, on average, spend only ten minutes on site to
perpetrate their criminal activity, so they tend to avoid activities that are time consuming in
their commission. It is for this reason that perpetrators do not like anyone standing in their
way, especially armed response units or police. Criminals plan according to information
about the operations and security measures in place in order to avoid these risks to the
success of their operations
Deduction:
Every time there is an armed robbery at a petrol station, cash is taken by criminals,
employees and customers also tend to be hurt or killed in the process. It is therefore
suggested that security measures at petrol stations should be designed to cover the protection
of all people including members of the public.
Impact of experiencing crime
Only 20% of the respondents indicated that they stayed away from their work stations for fear
of crime. In terms of the frequency, about 63% stayed away only once; 25% for a period of 2-
4 days and 13% for more than a month.
Deduction:
Contrary to the employers, employees tend to be more traumatized by the crime that takes
place at petrol stations (closer proximity to the actual act generally than
franchisees/managers).
Employees, therefore, had decided to stay away from work as a result of fear of crime. This
brings in the lack of a security awareness program that should be designed and followed by
all. It is clear that employees do not know what to do in case of crime, hence a decision to
stay home is taken (to try and avoid it). It can easily be concluded that most of the employees
had stayed away from work as a result of crime.
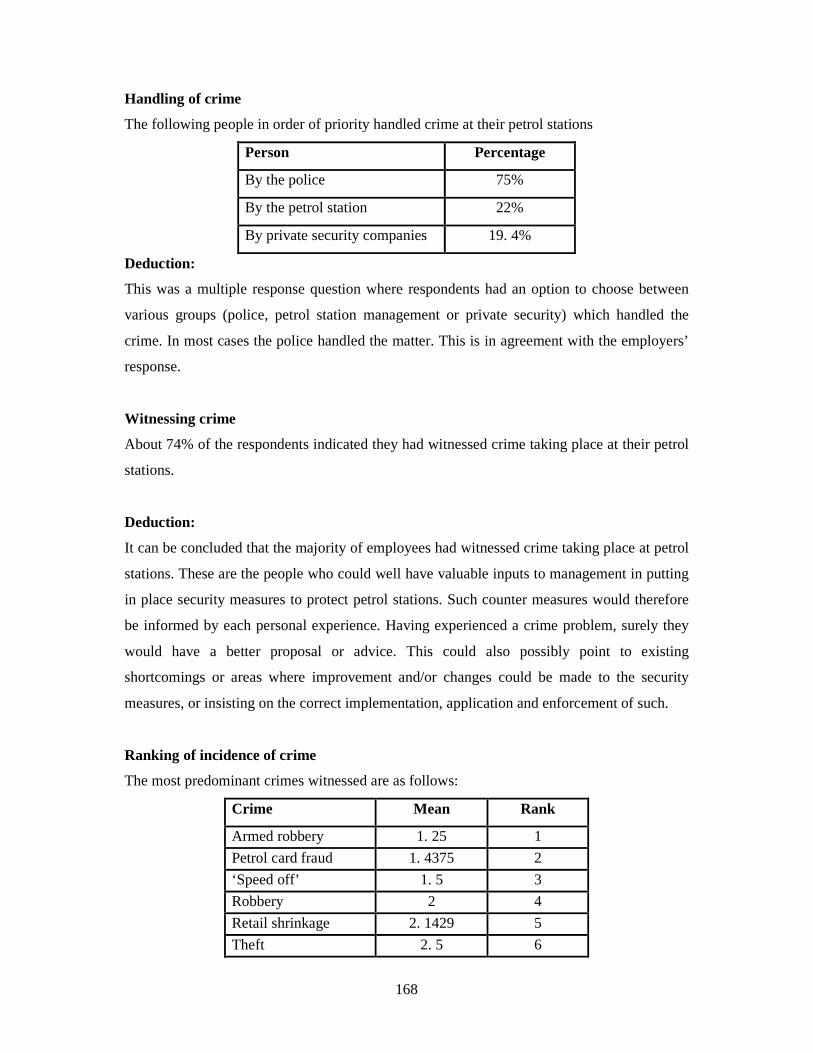
168
Handling of crime
The following people in order of priority handled crime at their petrol stations
Person Percentage
By the police 75%
By the petrol station 22%
By private security companies 19. 4%
Deduction:
This was a multiple response question where respondents had an option to choose between
various groups (police, petrol station management or private security) which handled the
crime. In most cases the police handled the matter. This is in agreement with the employers’
response.
Witnessing crime
About 74% of the respondents indicated they had witnessed crime taking place at their petrol
stations.
Deduction:
It can be concluded that the majority of employees had witnessed crime taking place at petrol
stations. These are the people who could well have valuable inputs to management in putting
in place security measures to protect petrol stations. Such counter measures would therefore
be informed by each personal experience. Having experienced a crime problem, surely they
would have a better proposal or advice. This could also possibly point to existing
shortcomings or areas where improvement and/or changes could be made to the security
measures, or insisting on the correct implementation, application and enforcement of such.
Ranking of incidence of crime
The most predominant crimes witnessed are as follows:
Crime Mean Rank
Armed robbery 1. 25 1
Petrol card fraud 1. 4375 2
‘Speed off’ 1. 5 3
Robbery 2 4
Retail shrinkage 2. 1429 5
Theft 2. 5 6
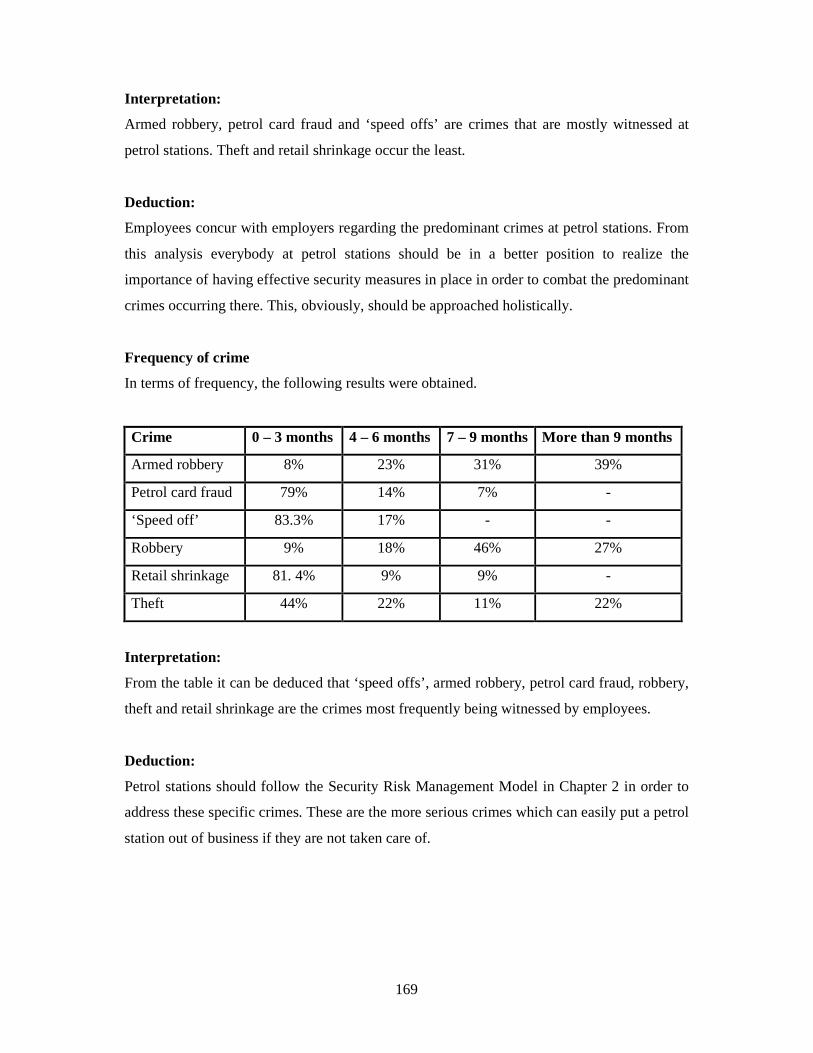
169
Interpretation:
Armed robbery, petrol card fraud and ‘speed offs’ are crimes that are mostly witnessed at
petrol stations. Theft and retail shrinkage occur the least.
Deduction:
Employees concur with employers regarding the predominant crimes at petrol stations. From
this analysis everybody at petrol stations should be in a better position to realize the
importance of having effective security measures in place in order to combat the predominant
crimes occurring there. This, obviously, should be approached holistically.
Frequency of crime
In terms of frequency, the following results were obtained.
Crime 0 – 3 months 4 – 6 months 7 – 9 months More than 9 months
Armed robbery 8% 23% 31% 39%
Petrol card fraud 79% 14% 7% -
‘Speed off’ 83.3% 17% - -
Robbery 9% 18% 46% 27%
Retail shrinkage 81. 4% 9% 9% -
Theft 44% 22% 11% 22%
Interpretation:
From the table it can be deduced that ‘speed offs’, armed robbery, petrol card fraud, robbery,
theft and retail shrinkage are the crimes most frequently being witnessed by employees.
Deduction:
Petrol stations should follow the Security Risk Management Model in Chapter 2 in order to
address these specific crimes. These are the more serious crimes which can easily put a petrol
station out of business if they are not taken care of.
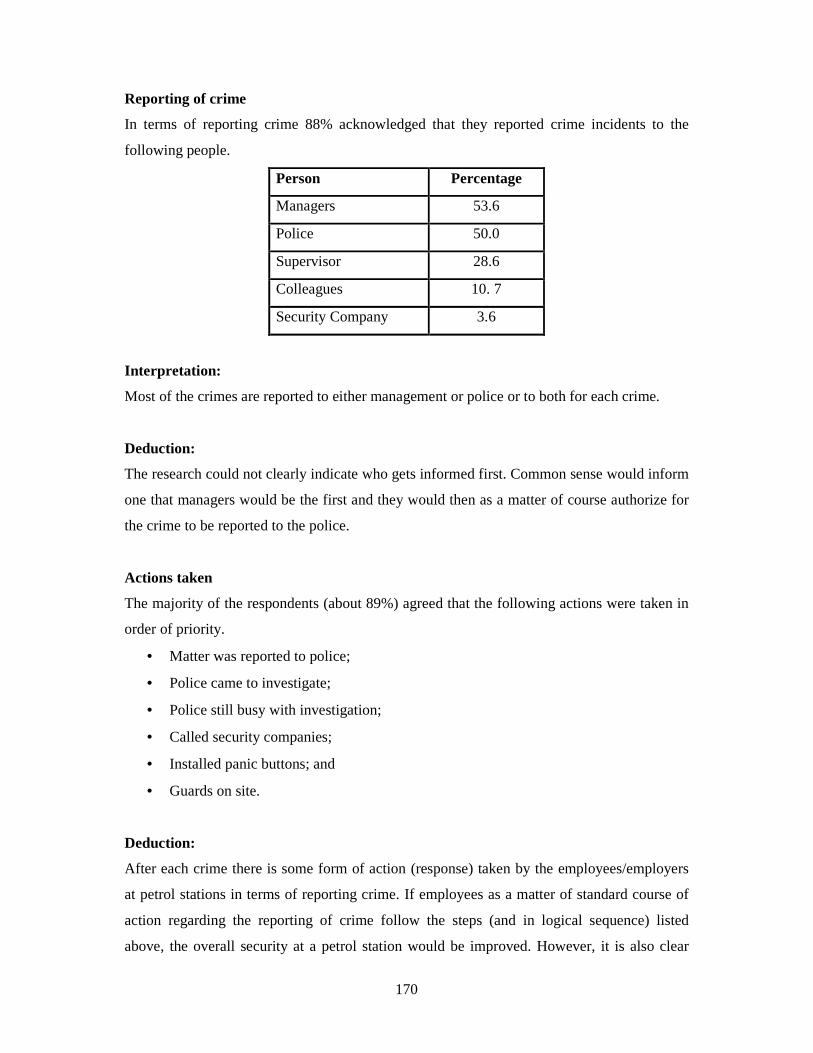
170
Reporting of crime
In terms of reporting crime 88% acknowledged that they reported crime incidents to the
following people.
Person Percentage
Managers 53.6
Police 50.0
Supervisor 28.6
Colleagues 10. 7
Security Company 3.6
Interpretation:
Most of the crimes are reported to either management or police or to both for each crime.
Deduction:
The research could not clearly indicate who gets informed first. Common sense would inform
one that managers would be the first and they would then as a matter of course authorize for
the crime to be reported to the police.
Actions taken
The majority of the respondents (about 89%) agreed that the following actions were taken in
order of priority.
• Matter was reported to police;
• Police came to investigate;
• Police still busy with investigation;
• Called security companies;
• Installed panic buttons; and
• Guards on site.
Deduction:
After each crime there is some form of action (response) taken by the employees/employers
at petrol stations in terms of reporting crime. If employees as a matter of standard course of
action regarding the reporting of crime follow the steps (and in logical sequence) listed
above, the overall security at a petrol station would be improved. However, it is also clear

171
that more security policies and procedures should be in place and that they should be adhered
to by everyone at all times. This will also lead to a heightened security consciousness among
employees and employers alike.
In the reporting process, in some cases, action was taken by more than one group. Action
(responses) was taken by the following groups.
Group Percentage
Police 55
Station management 40
Security/security company 5
Interpretation:
The police, station management and security companies were the main role-players in terms
of taking action after the crime had been reported.
Deduction:
The responses indicate that, in fact, everyone informed about crime at a petrol station was
taking some sort of action/response.
Police response
A large proportion, 80%, of respondents agreed that the police were prompt in their response.
For those who said ‘no’ 20% that the police response was not prompt, gave the following
reasons for this:
� The police only came after some days;
� no action taken;
� Case neglected; and
� Police took too long and case was unresolved.
Deduction:
There are times when the community is happy about the response, of the police to the crime.
Taking into consideration the resources of the public police, one would commend the efforts
the police do put in to deal with crime in their areas. It must be borne in mind that the SAPS
are still faced with many of its own challenges, like any other institution Govender (2009)

172
alluded to such limiting issues to effective policing like lack of experience of some members
in complex cases, case docket overload, etc.
Victims of crime
Forty-four percent of the employees have been victims of crime. They experienced the
following crimes:
� Armed robbery;
� Petrol fraud card;
� ‘Speed offs’;
� Shoplifting;
� Assault; and
� Fake notes.
Deduction:
A broad spectrum of witnessed crime confirms the fact that security is everybody’s
responsibility, including employees. If there is a security guard on site then employees should
act as their ‘eyes and ears’. All on site should know how to act in case of any crime taking
place in their presence in order to avoid or minimize crime.
Perpetrators
On commenting on who committed the crime, some respondents gave more than one
response. About 70% of the employees indicated that most crimes were committed by
customers while 50% indicated that crimes were committed by a group of criminals. Thus,
there are 20% who indicated that the crimes were committed by both the customers and a
group of criminals (i.e. customers often acted as a group and not individually on their own).
Deduction:
All employees should be alert at all times and report any suspicious actions to the station
management immediately.
Time period of frequency of attacks
About 67% of the employees indicated that the crime incident had occurred during the past
six months.
173
Deduction:
Perpetrators attack a petrol station and then often wait for a reasonably long period of time
for the employees to relax (slacken vigilance) before attacking again.
Stolen from employer
Ten percent of the employees indicated that they have stolen from their employers. The items
stolen in order of priority were:
• Cash/money
• Sweets
• Cellphones vouchers
Deduction:
There should be some form of strict policies and procedures regulating these offences. Staff
should be made to account for their mistakes or unaccounted losses that occur on their shifts,
e.g. discipline staff who are found to have committed such offence. The research could not
indicate what or whether action is taken against culprits.
Approached for inside information
Almost 15% of respondents had been approached by outside people for information about the
petrol station operations. The most frequent questions in this regard asked were:
− When is the money collected?
− How often is the money picked up from the safe?
− How busy is the station?
− How does the alarm system work?
− When does the management count the money?
− The position of the cameras.
− Wanted to know how much money is made (on a daily basis turnover amount).
Of those who were approached, 16% of the respondents indicated that they had agreed to
supply such information, while 67% indicated that the information requesters were prepared
to pay those who supplied them with this information. These respondents also indicated that
the requestors had never kept their payment promises.
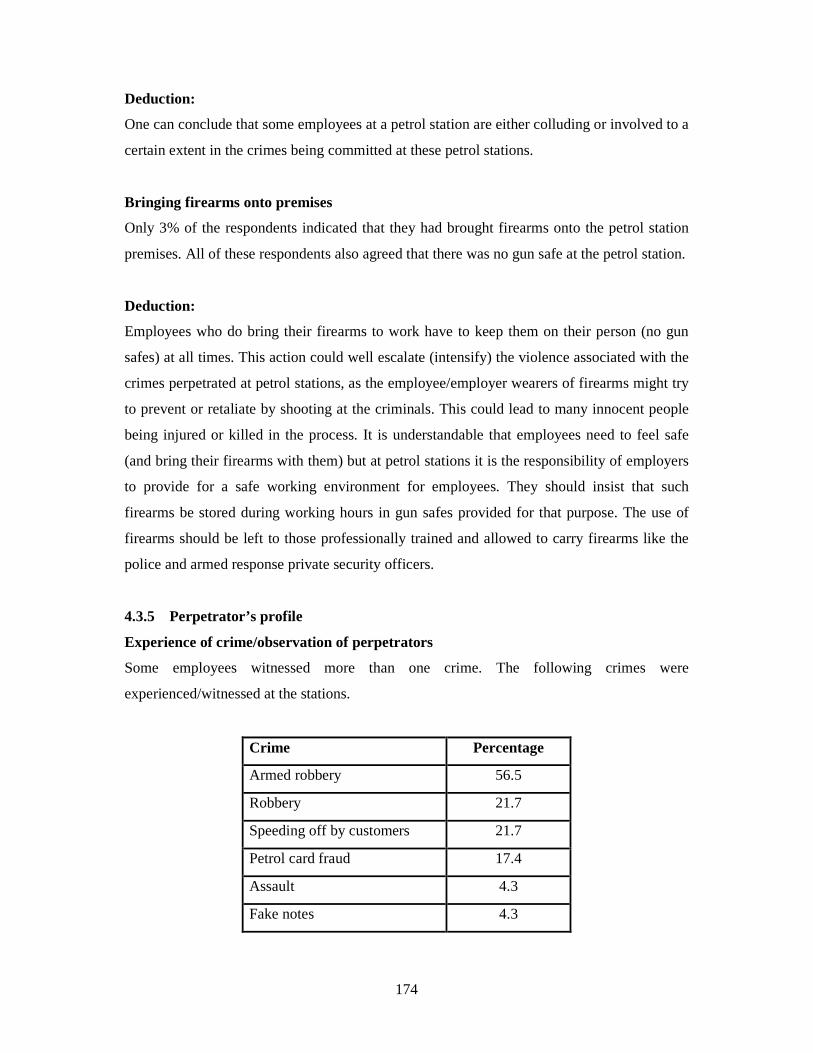
174
Deduction:
One can conclude that some employees at a petrol station are either colluding or involved to a
certain extent in the crimes being committed at these petrol stations.
Bringing firearms onto premises
Only 3% of the respondents indicated that they had brought firearms onto the petrol station
premises. All of these respondents also agreed that there was no gun safe at the petrol station.
Deduction:
Employees who do bring their firearms to work have to keep them on their person (no gun
safes) at all times. This action could well escalate (intensify) the violence associated with the
crimes perpetrated at petrol stations, as the employee/employer wearers of firearms might try
to prevent or retaliate by shooting at the criminals. This could lead to many innocent people
being injured or killed in the process. It is understandable that employees need to feel safe
(and bring their firearms with them) but at petrol stations it is the responsibility of employers
to provide for a safe working environment for employees. They should insist that such
firearms be stored during working hours in gun safes provided for that purpose. The use of
firearms should be left to those professionally trained and allowed to carry firearms like the
police and armed response private security officers.
4.3.5 Perpetrator’s profile
Experience of crime/observation of perpetrators
Some employees witnessed more than one crime. The following crimes were
experienced/witnessed at the stations.
Crime Percentage
Armed robbery 56.5
Robbery 21.7
Speeding off by customers 21.7
Petrol card fraud 17.4
Assault 4.3
Fake notes 4.3
175
Interpretation:
Employees more frequently experienced/witnessed the following crimes: armed robbery,
robbery, speeding off, petrol card fraud, assault and fake notes.
Deduction:
The most problematic crimes experienced at petrol stations are those experienced by
employees (see discussion previously on such crimes). Most of these can be termed ‘contact’
crimes in the sense that they flow from the interaction between forecourt employees and
customers (who turn out to be criminals).
Modus operandi of perpetrators
Almost 61% of the respondents indicated that the perpetrators moved in groups of twos or
threes whilst 19% indicated that they operated in groups of four to five.
Deduction:
Employees should be more alert to the fact that they more often than not operate in groups of
two or three persons.
Race and gender of perpetrators
It was indicated that the perpetrators are mostly black followed by groups (gangs) of different
races. Seventy-one percent of the respondents indicated that the perpetrators were all males
whilst 25% indicated that they were both males and females.
Deduction:
Contrary to employers’ responses, employees stated that most perpetrators were black
persons.
This may be attributed to the fact that blacks (Africans) represent a large majority of the
South African population, and this group is also the one that has the highest levels of
unemployment. It must be borne in mind that foreign nationals (from Africa) are suspected of
also being involved in attacks on petrol stations. Such foreign nationals from Africa are also
those who are living in the direst and poorest of conditions (i.e. marginalised often by virtue
of their undocumented or refugee status having fled countries in Africa like Zimbabwe). The
research question was not clear in terms of black South African or black foreigner.
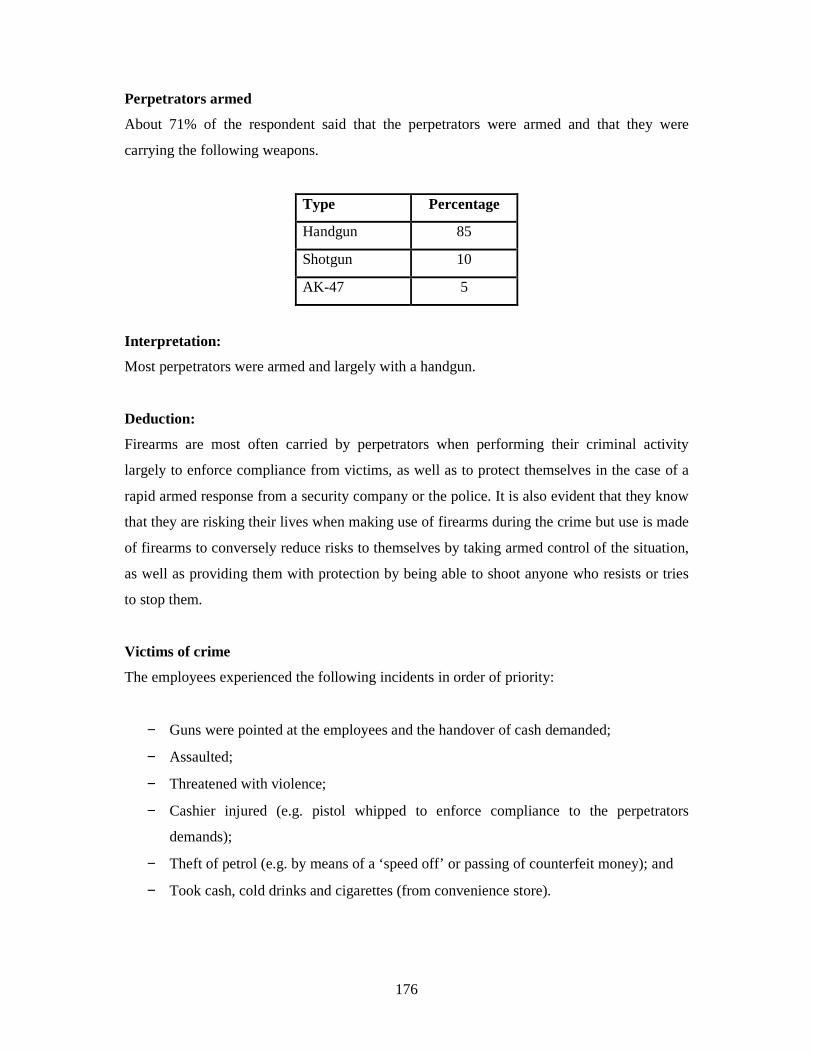
176
Perpetrators armed
About 71% of the respondent said that the perpetrators were armed and that they were
carrying the following weapons.
Type Percentage
Handgun 85
Shotgun 10
AK-47 5
Interpretation:
Most perpetrators were armed and largely with a handgun.
Deduction:
Firearms are most often carried by perpetrators when performing their criminal activity
largely to enforce compliance from victims, as well as to protect themselves in the case of a
rapid armed response from a security company or the police. It is also evident that they know
that they are risking their lives when making use of firearms during the crime but use is made
of firearms to conversely reduce risks to themselves by taking armed control of the situation,
as well as providing them with protection by being able to shoot anyone who resists or tries
to stop them.
Victims of crime
The employees experienced the following incidents in order of priority:
− Guns were pointed at the employees and the handover of cash demanded;
− Assaulted;
− Threatened with violence;
− Cashier injured (e.g. pistol whipped to enforce compliance to the perpetrators
demands);
− Theft of petrol (e.g. by means of a ‘speed off’ or passing of counterfeit money); and
− Took cash, cold drinks and cigarettes (from convenience store).
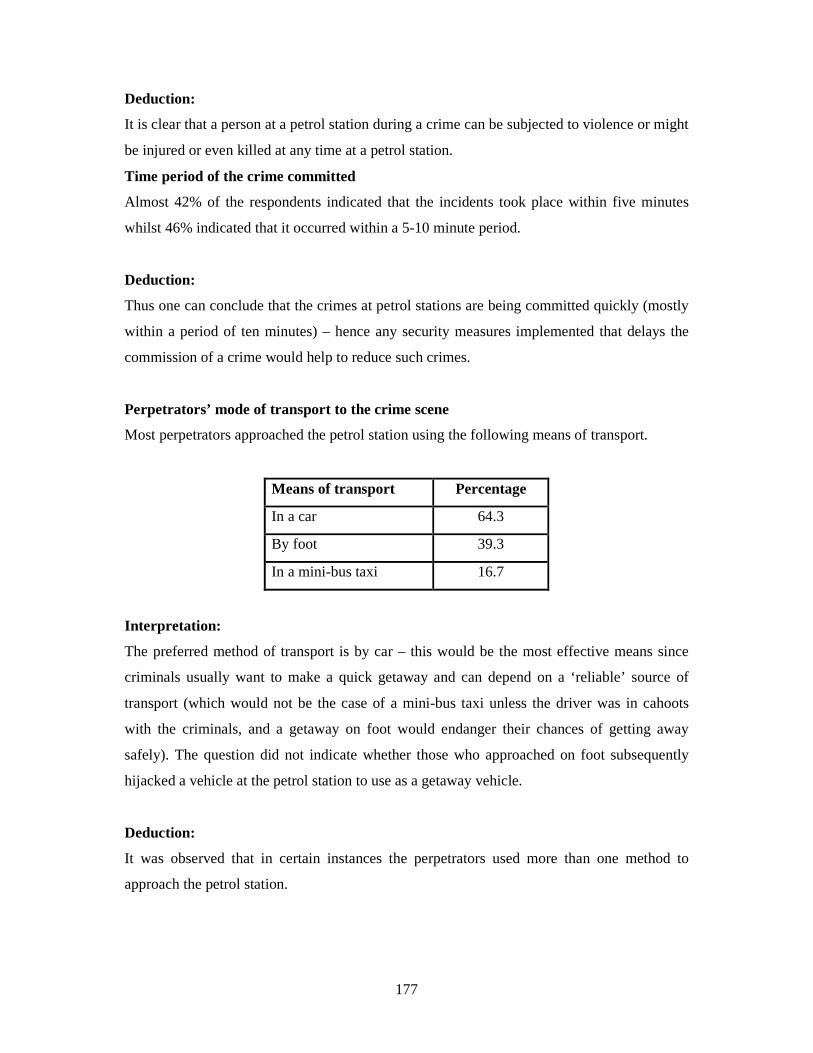
177
Deduction:
It is clear that a person at a petrol station during a crime can be subjected to violence or might
be injured or even killed at any time at a petrol station.
Time period of the crime committed
Almost 42% of the respondents indicated that the incidents took place within five minutes
whilst 46% indicated that it occurred within a 5-10 minute period.
Deduction:
Thus one can conclude that the crimes at petrol stations are being committed quickly (mostly
within a period of ten minutes) – hence any security measures implemented that delays the
commission of a crime would help to reduce such crimes.
Perpetrators’ mode of transport to the crime scene
Most perpetrators approached the petrol station using the following means of transport.
Means of transport Percentage
In a car 64.3
By foot 39.3
In a mini-bus taxi 16.7
Interpretation:
The preferred method of transport is by car – this would be the most effective means since
criminals usually want to make a quick getaway and can depend on a ‘reliable’ source of
transport (which would not be the case of a mini-bus taxi unless the driver was in cahoots
with the criminals, and a getaway on foot would endanger their chances of getting away
safely). The question did not indicate whether those who approached on foot subsequently
hijacked a vehicle at the petrol station to use as a getaway vehicle.
Deduction:
It was observed that in certain instances the perpetrators used more than one method to
approach the petrol station.
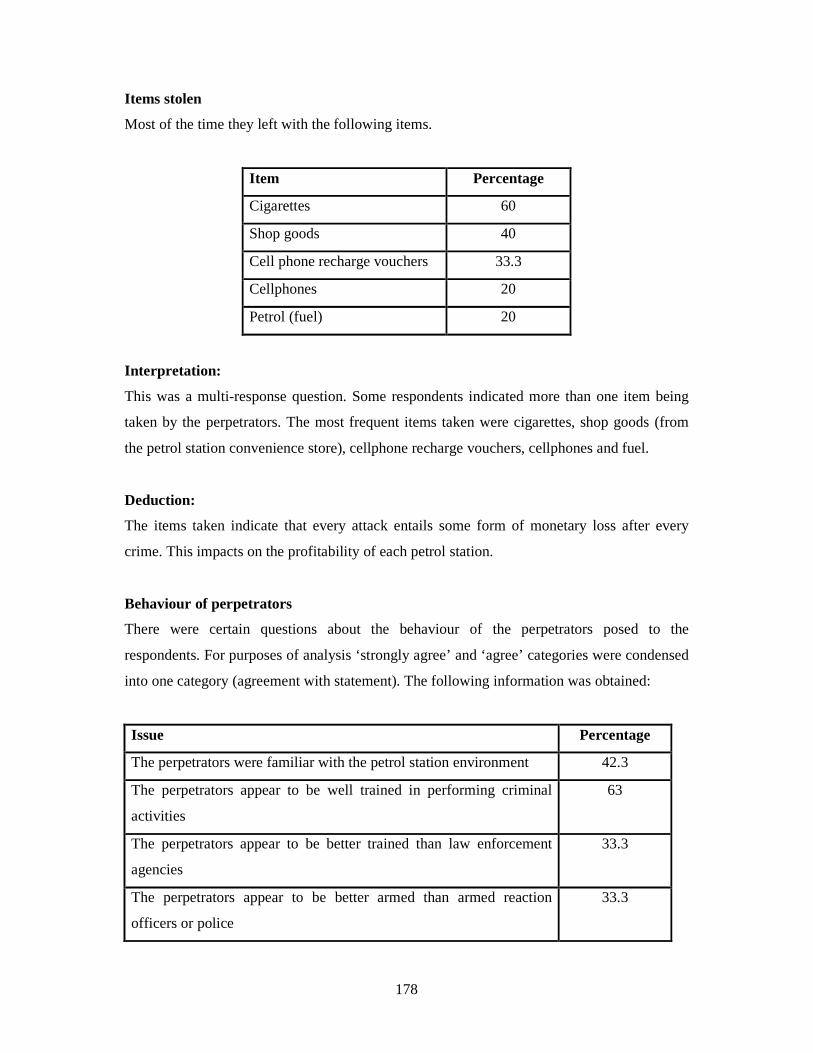
178
Items stolen
Most of the time they left with the following items.
Item Percentage
Cigarettes 60
Shop goods 40
Cell phone recharge vouchers 33.3
Cellphones 20
Petrol (fuel) 20
Interpretation:
This was a multi-response question. Some respondents indicated more than one item being
taken by the perpetrators. The most frequent items taken were cigarettes, shop goods (from
the petrol station convenience store), cellphone recharge vouchers, cellphones and fuel.
Deduction:
The items taken indicate that every attack entails some form of monetary loss after every
crime. This impacts on the profitability of each petrol station.
Behaviour of perpetrators
There were certain questions about the behaviour of the perpetrators posed to the
respondents. For purposes of analysis ‘strongly agree’ and ‘agree’ categories were condensed
into one category (agreement with statement). The following information was obtained:
Issue Percentage
The perpetrators were familiar with the petrol station environment 42.3
The perpetrators appear to be well trained in performing criminal
activities
63
The perpetrators appear to be better trained than law enforcement
agencies
33.3
The perpetrators appear to be better armed than armed reaction
officers or police
33.3
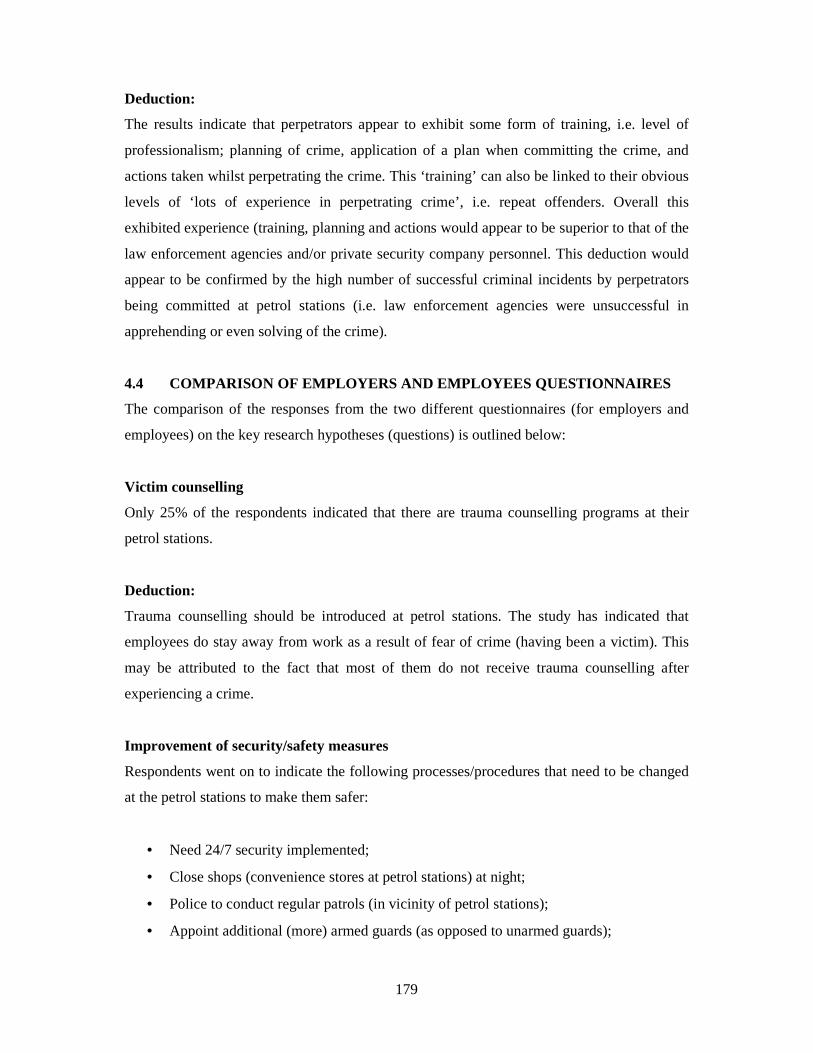
179
Deduction:
The results indicate that perpetrators appear to exhibit some form of training, i.e. level of
professionalism; planning of crime, application of a plan when committing the crime, and
actions taken whilst perpetrating the crime. This ‘training’ can also be linked to their obvious
levels of ‘lots of experience in perpetrating crime’, i.e. repeat offenders. Overall this
exhibited experience (training, planning and actions would appear to be superior to that of the
law enforcement agencies and/or private security company personnel. This deduction would
appear to be confirmed by the high number of successful criminal incidents by perpetrators
being committed at petrol stations (i.e. law enforcement agencies were unsuccessful in
apprehending or even solving of the crime).
4.4 COMPARISON OF EMPLOYERS AND EMPLOYEES QUESTIONNAIRES
The comparison of the responses from the two different questionnaires (for employers and
employees) on the key research hypotheses (questions) is outlined below:
Victim counselling
Only 25% of the respondents indicated that there are trauma counselling programs at their
petrol stations.
Deduction:
Trauma counselling should be introduced at petrol stations. The study has indicated that
employees do stay away from work as a result of fear of crime (having been a victim). This
may be attributed to the fact that most of them do not receive trauma counselling after
experiencing a crime.
Improvement of security/safety measures
Respondents went on to indicate the following processes/procedures that need to be changed
at the petrol stations to make them safer:
• Need 24/7 security implemented;
• Close shops (convenience stores at petrol stations) at night;
• Police to conduct regular patrols (in vicinity of petrol stations);
• Appoint additional (more) armed guards (as opposed to unarmed guards);
180
• Improve patrol security;
• Make full use of cameras (more and 24/7 monitoring);
• More visible police and security;
• Staff to be trained in self-defence techniques;
• Installing of new complete pumps that operate inside cash office;
• Taxi owners’ offices should be built near stations to help with the protecting
(guarding) of petrol station premises; and
• Become involved with the community.
Deduction:
Overall security measures at petrol stations need to be realigned to each individual petrol
station’s security needs in order for them to be more effective.
A large proportion of respondents (88%) agreed that petrol station employees are adhering to
and implementing basic security activities. The reasons given by these groups for this were
that the following activities/actions were in fact being done:
− Reporting any suspicious person or behaviour in the forecourt; and
− Trying their best (to prevent crime or reduce it).
For those who disagreed (i.e. security measures not effective) gave the following reasons.
− Slow response (by almost all role players).
− They (employees) just panic.
Deduction:
Employees may adhere to security policies and procedures but if they are not effective, as
indicated, then more of these policies and procedures need to be changed, adapted, and
broadly, be implemented and applied properly by ensuring adherence to a full security plan
(its policies, procedures and operationalising of them). If this is not done there will be no
improvement or no positive impact.
181
Natural barriers around a petrol station
Only 29% of respondents indicated that there are natural barriers like hills, rivers, trees,
natural plantations, bush, flower beds and water features around their petrol stations.
Deduction:
All barriers around petrol station should be modified to suit the security needs of the petrol
station to make it less vulnerable. For example: bushes or trees (where criminals can hide)
very close to the petrol station should be cut down or trimmed.
Forty-seven percent of respondents indicated that there are easy escape routes near the petrol
stations. The type of escape routes indicated were as follows:
− highways;
− main routes (roads)
− nearby taxi rank;
− parks;
− railway stations; and
− near route that goes directly to townships or informal squatter settlements.
Deduction:
Too many easy escape routes are dangerous and therefore need to be minimized. If possible,
surround the petrol station with a palisade fence barricade so that there is only one entrance
and exit to and from the petrol station premises.
4.5 RECOMMENDATIONS
The researcher felt that there was a need for additional studies to be conducted in this area of
study in order to confirm that the challenges facing petrol stations are well understood and
that all stakeholders (oil companies, franchisees, operators, employees, government agencies
and security companies) at petrol stations know their roles in the security programmes of the
petrol stations. Emanating from the research results and the responses the following
recommendations are made:
182
4.5.1 General recommendations
It is recommended that:
1. At the very least it should be ensured that a basic standard security measures’ program is
in place at each and every petrol station. This action will ensure that all petrol stations
under all brands have some form of security that should be in place when operating this
kind of business. Each individual petrol station should go through the process of drafting
a Security Plan for the specific petrol station, taking into account such petrol station’s
individual and customise security needs based on an analysis of all risk factors at the site
(see the Kole Security Risk Management Model).
2. Proper oversight of the basic security measures. This should ideally first start with the
petrol station owner and employees and then move up to oil companies themselves. Each
stakeholder should play his/her role within the overall security measures plan.
3. Ensure security policies and procedures are in place and explained to the staff (e.g.
cashiers or petrol attendants), i.e. they must be clearly informed and be part of regular
security awareness training and campaigns. Apart from other security measures, if
employees do not know what to do in case of an emergency, e.g. a criminal attack, they
might be killed in the process. Lack of understanding of security procedures might lead to
them unintentionally exposing the petrol station to a wide range of vulnerabilities and
risks.
4. Security awareness programs to be conducted regularly. This will sensitise people’s
attitude towards security and as a result they will tend to make security a habit.
5. Improvement of communication and sharing of information between all petrol stations.
All brands should interact and co-operate on challenges facing them and collectively
come up with a solution, i.e. co-ordinate responses.
6. Petrol stations should make greater use of relevant security service providers in, for e.g.
cash-in-transit services, armed response and so on. It is not a good idea to transport cash
to the banks by themselves while there are such services available from people who are
trained to do it.
183
7. Conduct regular and continuous security audits. Given that risks change, one might not
know of them without conducting security audits/assessments and impact/evalaution
exercises.
8. Oil Companies should take drastic steps against all petrol stations carrying their brand
name, that do not follow at least the standard basic security precautions (as outlined in the
Standard Security Plan for Petrol Stations – the first recommendation made above). Oil
companies need to realise that if a petrol station is attacked, the image of the brand
becomes tarnished as well.
4.5.2 Recommendations to oil companies
The following recommendations are specifically based to the oil companies. It is
recommended that oil companies:
1. Create a set of minimum security standards to which all petrol stations will have to
comply if they want to continue to operate. If you have one petrol station applying their
own security measures, at the end you will have an unbalanced and uncontrolled
situation or even fail to manage risk effectively at individual petrol stations.
2. Put security measures in place and charge the franchisees for the service (oil companies
should remember, it is their brand and they are responsible for protecting it).
Alternatively, possibly pick up 50% of the costs for security measures and services while
franchisees would be responsible for 50% of costs (by making them carry some of the
costs might ensure more positive buy-in and active support to their implementation).
3. Ensure that the amount of cash in tills is limited to smaller amounts. If tills are full, i.e.
not emptied on a regular basis, such a situation itself will appeal to criminals to attack the
petrol stations. Others would not necessarily need to have been professional criminals to
rob the station, i.e. the opportunity presented by a full till that can be openly viewed by
members of the public will inevitably lead to amateurs also trying their luck and possibly
succeed in robbing a till full of cash. Such a cash-management security measure can be
implemented by means of installing big enough ‘drop safes’ or of getting a cash
collection and transit company to collect money daily or even several times a day.
184
4. Inspect sites regularly (create an inspection information database for each petrol station)
and share the collated and analysed information amongst franchisees so that they can
learn and become aware of successful ‘best practices’ being implemented at certain sites
across the whole industry. Such information sharing would also be about ‘bad’ or
unsuccessful, ineffective practices so that franchisees can avoid doing the same mistake.
5. Penalise or sanction franchisees which are robbed of large sums of money based on a site
inspection visit report undertaken immediately after such crime incident, and if such
inspection visits report shows negligence on the part of the franchisee or non-compliance
to the ‘Standard Basic Security Plan for Petrol Stations’.
6. Train franchisees on basic security issues so that they can filter such training all the way
down to all employee levels.
7. Put crash barriers in front of the petrol station building so that attackers are unable to
crash through the front windows of the building and rob the convenience store (as has
happened according to one interviewee).
8. Improve communication with petrol station operators and disseminate all relevant
information regarding security measures, programmes, plans, policies and procedures
expected from them to be implemented.
9. Ensure that the company provides franchisee operators with the necessary resources to be
able to effectively curb crime at their petrol stations.
4.5.3 Recommendations to petrol station owners/franchisees/operators
It is recommended that they:
1. Communicate with other franchisees in order to share views on security measures best
practices and crime information etc. This will enable them to jointly identify
problems/risks/crimes and to come up with practical solutions to those problems.
2. Ensure adherence to a daily seven days a week. Even on holidays pick up of cash in
order to avoid the accumulation of large of amounts cash, thus reducing amounts
available at any one time that can be stolen (robbed) during an attack.
185
3. Look after your employees. Better working conditions, care for their overall welfare and
working conditions, motivate15 them in doing their job so that they take on
responsibilities (‘ownership’) in their jobs. Satisfied (happy) employees do not provide
confidential information about the petrol station.
4. Have a clearly written Code of Conduct that is disseminated to all staff and is
understood by all employees so that they know how to conduct themselves.
5. Discuss security issues at regularly held staff meetings. Once security is made a regular
topic, staff will start practising security precautions, thus becoming security aware and
security conscious at all times.
6. Check if security procedures are being followed at all times by employees. Observe
employees when performing their jobs where security precautions are needed.
7. Read and familiarise yourself with your Service Level Agreements (SLAs) with regard
to all your security aspects, e.g. CCTV, alarm, cash-in-transit, etc. It is poor business
and management practices to only read your SLAs when you are in trouble (experienced
a setback or incident).
8. Put certain security standards in place. These standards should be audited regularly in
order to identify any gaps (shortcomings) and efforts to be made to close such gaps
should they arise.
9. At the very least, implement a set of basic security measures, e.g. CCTV surveillance
system. There is not always a need to have multiple cameras if a few are strategically
placed based on a risk site assessment, alarm, lighting, fence, wall, burglar bars on
windows, bullet proof resistant window (at cash office/kiosk), a drop safe, and so on. In
other words tighten the basic security measures to make it difficult for the perpetrator to
walk in-and-out easily and take your hard-earned money. In the current tight economic
situation (and small margins on the sale of fuel) no loss, however, small can be ill-
afforded.
15 Visser (2009) indicated that one of the reasons why she had a committed staff group efficiently doing their job was that at times she rewards them for the job well done. In this way she keeps the morale of her staff high.
186
10. Screen prospective employees before and during their employment period. Screening
should not only be a once-off thing. People and their circumstances and therefore their
behaviour change all the time.
11. Test emergency procedures regularly. You will then be able to spot any ineffective part
on your emergency procedure once you conduct regular testing. You will, once again, be
able to address discrepancies accordingly while not in an actual emergency.
12. If at all possible (and affordable) have 24-hour/seven days a week private security on
site. Another advantage of involving private security is that if you are not happy about a
specific guard you would be able to get the company to replace such person (in contrast
you have to live with the quality and abilities of the SAPS personnel based at the local
police station).
13. Arrange for more police presence/visibility. Another factor in attracting police visibility
is to offer free coffee/tea to law enforcement agencies’ personnel who might be
patrolling in the area (SAPS, Metro Police, private security armed response) especially
at night. In turn you will receive ‘free’ coverage or protection from private security
business and an extended one from the local police, if they make your petrol station a
regular port of call while patrolling the area.
14. Install CCTV cameras. There is no way this business (petrol stations) can operate
effectively and relatively risk free without the installation of good quality CCTV
cameras with recording 24/7 capabilities. This does not suggest that once you have
CCTV cameras you are obviously guaranteed of obtaining good evidence. This evidence
will still be tested, beyond reasonable doubt, in a court of law.
Therefore, the recording must be of a good quality (definition) and the system also needs
both day night capabilities for clarity of the recorded images. In addition, arrangements
should be made of longer storage periods of time than the average of only 20 days.
Furthermore, all recorded incidents should be archived for possible future reference.
15. Within a brand, franchisee operators should develop a network of staff from different
garages. This will assist in terms of generating ideas and possible solutions by staff
members.
187
16. Belong to a local franchisee/operators forum so that these staff generated ideas (and own
developed ones) can be discussed and generic solutions be formulated.
17. Make use of cash collection-and-transit services. Never take the chance of delivering
money to the bank yourself. This is very risky. If this has been done successfully in the
past, know that it is only a matter of time before one gets attacked and robbed. Criminals
are sure to find out the piece of information that you personally deposit the takings.
18. Employ guards. Visibility of guards (even unarmed ones) at petrol stations serves as an
important deterrent factor. Depending on the level of risk the petrol station is exposed
to, unarmed guards would be ideal if they are engaged in a low to medium risk area.
19. Get involved in your local Community Police Forum (CPF). There is no way one could
fight crime without coming into contact with your local Community Police Forum and
making closer contact with the police (through the CPF). Also get to know what is
happening in your area (crime-wise). Try to learn regularly about new threats facing
your area.
20. Have 24/7 alarm system. This will help in case of an emergency since there will be no
time to contact police or armed response during an attack. Such a system must have the
feature of panic buttons (if at all possible mobile ones that can be carried on your
person), so that no delay, if the opportunity presents itself, is experienced in pressing the
panic button.
21. Encourage the use of panic buttons. Train employees on how to use them and if possible
arrange for a sufficient number of mobile ones to distribute to employees on duty.
22. Build a protected kiosk for cashiers. The cashier area should be protected with bullet
resistant glass which enhances the site ‘hardening capabilities of such a security
measure.
As a result it becomes a little more difficult for perpetrators to simply jump the queue barrier
and attack employees or even rob the station. Be that as it may, entrance into this protected
kiosk area needs to be locked (with a re-inforced steel door and strong lock) at all times,
failing which will render the glass a ‘useless’ security measure because perpetrators can
188
easily access the cash through an open or unlocked door or a ‘weak’ (not re-inforced and
strengthened) door.
23. Use of scanners to scan registration numbers of vehicles entering the forecourt. This can
be done via one dedicated camera which simultaneously stores the scanned information
for future use . One of the first steps in trying to apprehend suspect/s is by having the
requisite accurate information regarding a vehicle they might utilise for the attack. Even
if the number plates might be false or the vehicle has been stolen or hijacked this
information will provide leads however slim for follow up investigations.
24. Liaise with police to sort out police responses to the reported crimes. Station
commissioners should be informed about any experiences of poor or tardy police
responses so that this can be addressed by the police persons in charge.
25. Franchisees should stop pattern behaviour (fixed habits) for e.g. vary times for the
collection of cash. Advise cash management companies not to stick to the same time,
same routes and same people (C-I-T guards) at all times.
26. If possible, petrol stations should be sited on or near busy roads. Perpetrators prefer to
work in quiet areas. In full view of busy traffic is not to the liking of criminals (more
risk of being observed and recognised, more potential witnesses, etc.)
27. Management can allow taxis to park at the petrol station at night. (Obviously such
concession will have conditions attached). Mutual agreement should be reached between
petrol station owner and taxi owners where possible. Taxis parked at the petrol station
act as deterrent factor to would-be criminals. This would be highly recommended at
high risk sites.
28. Train petrol attendants on safety and security control measures. Safety precautions and
knowledge of following the security control measures should be identified as the highest
priority on the security agenda of petrol station operators.
29. Ensure that payment is made before filling a car . If a customer needs fuel for R200, for
example, let them pay and then an attendant will be guided by what he/she is given. This
action will reduce in particular drive-offs. Small ultra-violet machines can be placed in
the forecourt to check authenticity of banknotes.
189
4.5.4 Recommendation to employees (petrol attendants/cashiers/car wash employees)
It is recommended that employees:
1. Be alert at all times. When an employee is passive, an impression is created for
perpetrators that they (criminals) will easily be successful in robbing the petrol station if
employees appear not to be vigilant or posing no risk to them.
2. Be visible. Watch out for each other because one employee is another employee’s
protector. Do not allow a situation to arise where employees cannot see each other
(especially at night or in rain).
3. Report any irregularity (suspicious activity, behaviour or object) to the franchisee or
manager immediately. As an employee at the forefront of serving customers you are more
likely to witness irregularities taking place or activity aimed at the petrol station
4. Report before going on duty if not feeling well. This will assist in terms of upholding the
principle of alertness by employees.
5. Store personal belongings (franchisee to provide appropriate store facilities/rest room for
employees). Employees should have separate area where their belongings are kept. This
will avoid the temptation to commit internal theft.
6. Familiarise yourself with your full employment contract, conditions of employment, code
of conduct, company policies and procedures, in order for employees to know what are
the ‘dos’ and ‘do nots’ so that they do not transgress any of the conditions of employment
and operating procedures. Also by knowing the code of conduct, it will assist employees
in terms of how they should relate to the issues touching their jobs.
7. Use panic buttons as stipulated in case of any emergency. Care should be exercised (if
you are a supervisor) when allocating panic buttons to employees. Employees should be
trained in their correct usage and application.
190
4.5.5 Government (legislation and law enforcement agencies)
It is recommended that:
1. The government come up with a policy that will bind all oil companies to putting security
measures in place so that employees, customers and petrol station owners themselves are
all protected within a safer environment at petrol station premises.
2. Institute and conduct regular official safety and security inspections at petrol stations in
order to see if petrol stations are complying with the laid down (legislated) rules and
regulations. The Occupational Health and Safety Act No 85 of 1993 provides for specific
responsibilities of employees and employers to create and uphold a safe working
environment.
3. Improve the investigative skills of investigators who handle criminal cases at petrol
stations by retraining them. Many cases had been lost due to the lack of the necessary
experience (or use of poor/inadequate investigative methods) by investigators. Incidents
of corruption in the police need to be investigated and culprits sanctioned.
4. Retrain police continuously. Have a sound schedule whereby police officers will attend
different training.
5. The Police to look at improving police response to crime scenes. Set specific
standard/time in which police should respond. This should form part of their key
performance areas.
6. Strengthen the criminal justice system, unblock the bottlenecks, prosecute faster and more
effectively so that the public can see that criminals are being caught and punished without
long delays occurring.
7. Allocate enough resources to police. Vehicles, equipment – such as two-way radios,
cellphones, and firearms (with sufficient firepower to match that of criminals) should be
made available to police in order to enable them to perform their tasks more effectively.
8. Review how insurance companies work in the petrochemical industry. Investigate
whether customers assisted fairly in terms of protecting or covering their businesses.

191
9. Re-engineer industry-specific partnerships so as to more effectively fight crime by means
of public-private partnerships. Facilitate and organise regular meetings with different
stakeholders in order to share views and ideas on curbing crime.
4.6 CONCLUSION
The study came up with possible solutions to the crime problem experienced by petrol
stations in Gauteng. This research output may assist even petrol stations outside Gauteng to
deal with similar problems.
While the majority of both employers and employees agreed that there are security measures
at petrol stations, the concern still remains “why sites are still being attacked and more money
lost while there are security measures at petrol stations?” This involves the question of risks
which are changing after a period of time. If that situation comes into being, it clearly means
that something must be done to improve security measures in order to balance the equation
properly. It also points to the possible inadequacy or non-implementation of existing security
measures.
It is still a reality that people in the petrol station industry still consider such security
measures as alarm systems, CCTV and a drop safe from a purely security point of view and,
for instance, fire extinguishers only from a safety point of view, and refuse to look at
security measures in a more comprehensive and holistic manner. Existing security measures
would appear not to be as effective as they should be. For instance alarm systems are not
serviced according to maintenance and operational needs and sometimes not even operated
properly in the case of an emergency. In order for security systems to be of value and
meaningful to petrol stations, continuous evaluation of the existing security measures should
take place regularly. Only in this way can these security measures be improved and adapted
from time to time as well.
The study indicated that employers and employees have faith (possibly misplaced or overly
optimistic in their efficacy) in their security measures in deflecting crime, especially armed
robberies. It should be borne in mind that the security component will only be effective if it is
applicable to or covers what is called the “4Ps” (i.e. personnel, physical security, policies and
procedures) within a comprehensive security and safety programme/plan. There should be a
192
strong link between all these ‘4Ps’. A weak link can affect the effectiveness of the whole
system will be affected negatively.
Petrol stations tend to be robbed when different stakeholders do not fully carry out their
assigned responsibilities accordingly, e.g. employers do not have effective security policies
and procedures in place, do not inform employees of them, lack of compliance by employees
to them, etc. Even when employers get their plans in place, police might not be fulfilling their
role fully, e.g. not responding promptly when called upon. Failure to conduct background
checks on employees before and during their employment might also negatively impact on
the proper implementation of a security plan by employers, i.e. dishonest employers working
covertly against it by supplying inside information to criminal syndicates. The reluctance of
certain oil companies to provide the necessary security measures or support to their
franchisees is also a factor.
The study showed that the modus operandi used by perpetrators differed. The number of
people attacking the petrol stations also differed but in most cases, ranged from two to seven.
Different vehicles were used for getting to the crime scene, as well as for getting away and
different firearms were used, although a handgun was the preferred choice of firearm.
Perpetrators were from various races. It was also indicated that in some instances people from
foreign countries were also involved in the attacks. The culprits appeared to be in possession
of inside information regarding various aspects of the operations of the petrol station when
they attacked it. This is a particular point of concern to petrol station franchisee operators and
the oil companies alike that people (not staff members of a petrol station) would know about
sensitive information of the site which would assist them in their planning and successful
execution of such criminal attacks. At the very least the integrity of employees in handling
confidential issues can be questioned.
The level of training of the robbers was also perceived by observers/witnesses to be higher
than that of the police or armed response officers. They also appeared to be better resourced
In most cases criminals were largely successful in their commission of crime efforts at petrol
stations.

193
Hopefully, the Security Risk Management model as suggested for dealing with crime at
petrol stations and the findings and the recommendations made in this study will assist all
stakeholders at petrol stations to reduce crime and the attendant financial losses.
194
LIST OF REFERENCES/BIBLIOGRAPHY
1. BOOKS, PUBLICATIONS AND JOURNALS
Berg, B.L. 2004. Qualitative research methods for the social sciences. Fifth edition Boston:
Pearson
Bless, C. & Higson-Smith, C. 1995. Fundamentals of social research methods: An African
Perspective. Second edition. Kenwyn: Juta
Bottom, N. R. & Kostanoski, J. 1983. Security and loss control. New York: Macmillan
Crowe, T. D. 1991. Crime Prevention through Environmental Design. Stoneham, MA:
Butterworth-Heinemann
Fennelley, L. J. 2004. Handbook of Loss Prevention and Crime Prevention. Fourth edition.
Elsevier: Butterworth
Fennely, L. J. 2004. Effective physical security. Third edition. Burlington, Mass. : Elsevier
Butterworth-Heinemann
Fischer, R. J. & Green, G. 1988. Introduction to Security. Sixth edition. Boston: Butterworth
Fischer, R. J. & Green, G. 2004. Introduction to security. Seventh edition. Boston, Mass. :
Butterworth-Heinemann
Greene, M, R & Serbein, O, N. 1993. Risk Management: Text and cases. Second edition.
Reston, Virginia: Reston Publishing Co.
Hadland, A. 2002. In terror and in silence: An investigation into safety levels and standards
at petrol stations. Petrol station 5 project. Human Science Research Council: Pretoria
Izgorsek, W. 2009. Tame times – Alberton. Fraudulent fuels. 8: July 9
Jones, P. H. 1997. Retail loss control. 2nd Ed. Oxford: Butterworth-Heinemann
195
June, D. L. 2000. Protection, security, and safeguards: Practical approaches and
perspectives. Boca Raton: CRC Press
King, G. 2000. Protective security. Durban: Butterworths
Laing, R. 2009. Garage cards still an excuse for bankers to outdo clients. Sunday times. 35,
22 February.
Lombaard, C. & Kole, O. J. 2008. Security Principles & Practices: Study guide for SEP111A.
2nd edition Pretoria: University of South Africa.
Lyons, S.L. 1988. Security of premises: A manual for managers. Cambridge: Butterworth
Minnaar, A. 2007. Oversight and monitoring of non-state/private policing: The Private
security practitioners in South Africa. (pp.127 – 149) in: Gumedze, S. (Ed). Private Security
in Africa: Manifestation, challenges and regulation. Institute for security studies: ISS
Monograph No. 139. Brooklyn: Institute for Security Studies
Olckers, C. 2007. An examination of the impact of residential security measures on the
incidents of residential burglary in two selected northern suburb of Johannesburg: A security
risk management approach. Unpublished dissertation. MTech: Security Management.
Pretoria: University of South Africa
Ortmeier, P.J. 2002. Security management: An introduction. Upper Saddle River, N.J.:
Prentice Hall
Rogers, F.C. 2005. Security Practice III/Security Risk Management IV: SEP361S/SRM401S.
2nd edition. Florida: Technikon SA.
Sennewald, C, A. 2003. Effective Security Management. Burlington, MA: Butterworth-
Heinemann
Simonsen, C. E. 1998. Private Security In America: An Introduction. Upper Saddle River,
New Jersey: Prentice Hall
196
Smith, L., Louis, E & Preston, L. 2009. Service station armed robbery in Australia. Trends
and issues in crime and criminal justice. Series no. 373. Canberra: Australian Institute of
Criminology. Available at: http://www.aic.gov.au/publications/current%20series/tandi/361-
380/tandi373.aspx. Accessed: 1 August 2009
Tyska, L. A. & Fennelly, L. J. 2000. Physical Security: 150 things you should know. Boston:
Butterworth
Welman, J.C. & Kruger S.J. 2001. Research methodology. Second edition. Cape Town,
Oxford: Oxford University Press.
2. INTERNET
Anon. 2006. Fusion Centre Guidelines: Developing and Sharing Information and Intelligence
in a New Era. April 2006. Available at:
www.iir.com/global/products/fusion_center_executive_summary.pdf Accessed
24/07/2009
Bisht, S. 2007. How reliance has changed India’s petro retail sector. Available at: http://in.rediff.com/money/2007/feb/06reliance.htm Accessed 11.08.2010
Brooks, N. 2008. What’s in a petrol price: Deregulation of the petrol will not cause a
decrease in the price. Available at:
http://209.85.229.132/search?q=cache:5x7QBe_Y6-
wJ:www.moneyweb.co.za/mw/view/mw/en/page295023%3Foid%3D198378%26sn%3D200
9%2BDetail%26pid%3D302588+Morgan+of+fuel+retail+association+in+South+Africa&cd
=2&hl=en&ct=clnk
Bhengu, X. 2007. BP beats the system. The Sowetan, 24 August. Available at:
www. sowetan. co. za/News/Business/Article. aspx?id=546797. Accessed on 22/07/2009.
Caltex. 2010. Operate a Caltex Station. Available at: http://www.caltex.com/ph/en/ph_retailer.asp Accessed 11.08.2010
197
Crime Statistics. April 2008 - March 2009. Gauteng Province. Available at:
http: //www. saps. gov. za/statistics/reports/crimestats/2009/provinces/gauteng/pdf/gauteng.
pdf. Accessed on 10/12/2009.
Fleet Cards USA, 2009. Fleet Card Management. Available at:
www.fleetcardsusa.com/FleetFacts/fleet_card_management.aspx. Accessed 22/07/2009
Geldenhuys, K. nd. SAPS and Private Security industry join hands in PE. Available at:
http://www.servamus.co.za/index.php?option=com_content&task=view&id=328
(Accessed 20/08/2009)
Goldstein, A. 2007. The Private Arm of the Law: Some question the granting of power to
Security Firms. 3 January. Available at:
http://www.prisonplanet.com/articles/january2007/030107Private.htm Accessed 20/08/2008
Hussain, A. 2007. Do not use cards at petrol stations. The Sunday Times, 18 February.
Available at: www.timesonline.co.uk/tol/money/consumer_affairs/article1400176.ece
Accessed 22/07/2009
Nedbank, Nd. Garage debit cards. Available at:
www.nedbank.co.za/WEBSITE/CONTENT/products/product_detail.asp?SubSubcatid=1864
&Subcatid=501&ProductID=19. Accessed 22/07/2009.
Republic of South Africa. 1993. Occupational Health and Safety Act No 85 of 1993.
Pretoria: Government Printers
Republic of South Africa, 1996. The Constitution of the Republic of South Africa 108 of
1996. Pretoria: Government Printers
Republic of South Africa. 2003. Petroleum Products Amendment Act No 58 of 2003. Pretoria:
Government Printers
Roestoff, A. 2009. Thieves are targeting E Rand filling stations. The Citizen, 19 May.
Available at: http://www.citizen.co.za. Accessed 28/02/2008.
198
Sapa, 2008. Garages may accept debit cards. 14 July. Available at:
www.fin24.com/articles/default/display_article.aspx?Nav=ns&ArticleID=1518-
1786_2357149. Accessed 22/07/2009
South African Petroleum Industry Association (SAPIA). 2007. Publications: SAPIA
Corporate Profile. 20 December. Available at: www.sapia.co.za. Accessed 19/7/2008.
SAPA, 2006. Guard shot during Pta robbery. 07 August. Available at:
http: //www. news24. com/News24/South_Africa/News/0,,2-7-1442_1979245,00. html.
Accessed on 27/02/2008.
The Physics Classroom. Nd. Physics tutorial: Newton’s Laws. Available at:
http://www.physicsclassroom.com/Class/newtlaws/u2l4a.cfm. Accessed 18/10/2009
Wikipedia. Nd. Filling station. Available at: http: //en. wikipedia. org/wiki/petrol_station.
Accessed 28/02/2008.
Wikipedia. Nd. Filling station: Payment methods. Available at: http: //en. wikipedia.
org/wiki/petrol_station. Accessed 28/02/2008.
3. INTERVIEWS
Interview 1: Mr M. Nalla. 11 August 2009. Manager. Total garage. Alrode.
Interview 2: Mrs Letitia Visser. 19 August. 2009. Franchisee. Sasol Swartgoud. Suideroord
Interview 3: Mr Ziyaad Kardamey. 01 September 2009. Manager. Engen petrol station.
Glenvista.
Interview 4: Mrs Annita Louw. 01 September 2009. Operator. BP EI CORRO. Northcliff.
Interview 5: Mr George Govender. 02 September 2009. Lecturer. Department of Criminology
and Security Sciences. School of Criminal Justice. College of Law. UNISA.
Muckleneuk Campus. Pretoria. Formerly Commissioner, South African Police
Services, South Africa
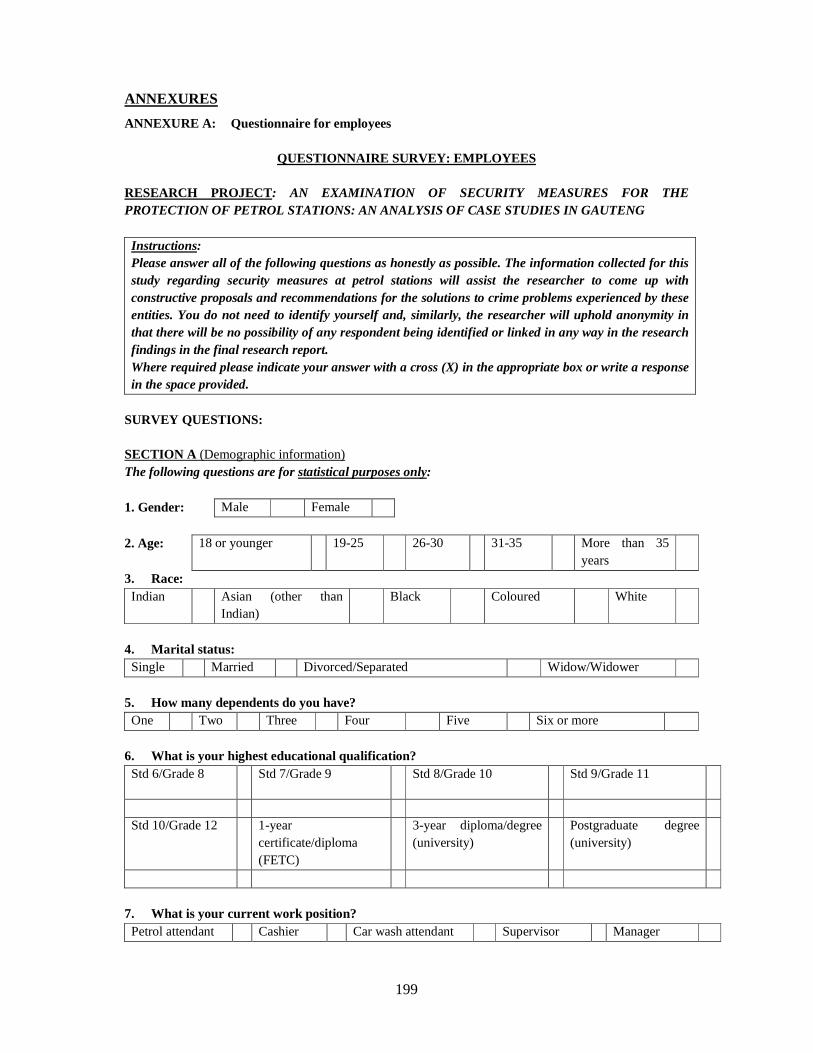
199
ANNEXURES
ANNEXURE A: Questionnaire for employees
QUESTIONNAIRE SURVEY: EMPLOYEES RESEARCH PROJECT: AN EXAMINATION OF SECURITY MEASURES FOR THE PROTECTION OF PETROL STATIONS: AN ANALYSIS OF CASE STUDIES IN GAUTENG
Instructions: Please answer all of the following questions as honestly as possible. The information collected for this study regarding security measures at petrol stations will assist the researcher to come up with constructive proposals and recommendations for the solutions to crime problems experienced by these entities. You do not need to identify yourself and, similarly, the researcher will uphold anonymity in that there will be no possibility of any respondent being identified or linked in any way in the research findings in the final research report. Where required please indicate your answer with a cross (X) in the appropriate box or write a response in the space provided.
SURVEY QUESTIONS: SECTION A (Demographic information) The following questions are for statistical purposes only: 1. Gender: Male Female 2. Age: 18 or younger 19-25 26-30 31-35 More than 35
years
3. Race: Indian Asian (other than
Indian) Black Coloured White
4. Marital status: Single Married Divorced/Separated Widow/Widower
5. How many dependents do you have? One Two Three Four Five Six or more
6. What is your highest educational qualification? Std 6/Grade 8 Std 7/Grade 9 Std 8/Grade 10 Std 9/Grade 11
Std 10/Grade 12 1-year
certificate/diploma (FETC)
3-year diploma/degree (university)
Postgraduate degree (university)
7. What is your current work position? Petrol attendant Cashier Car wash attendant Supervisor Manager
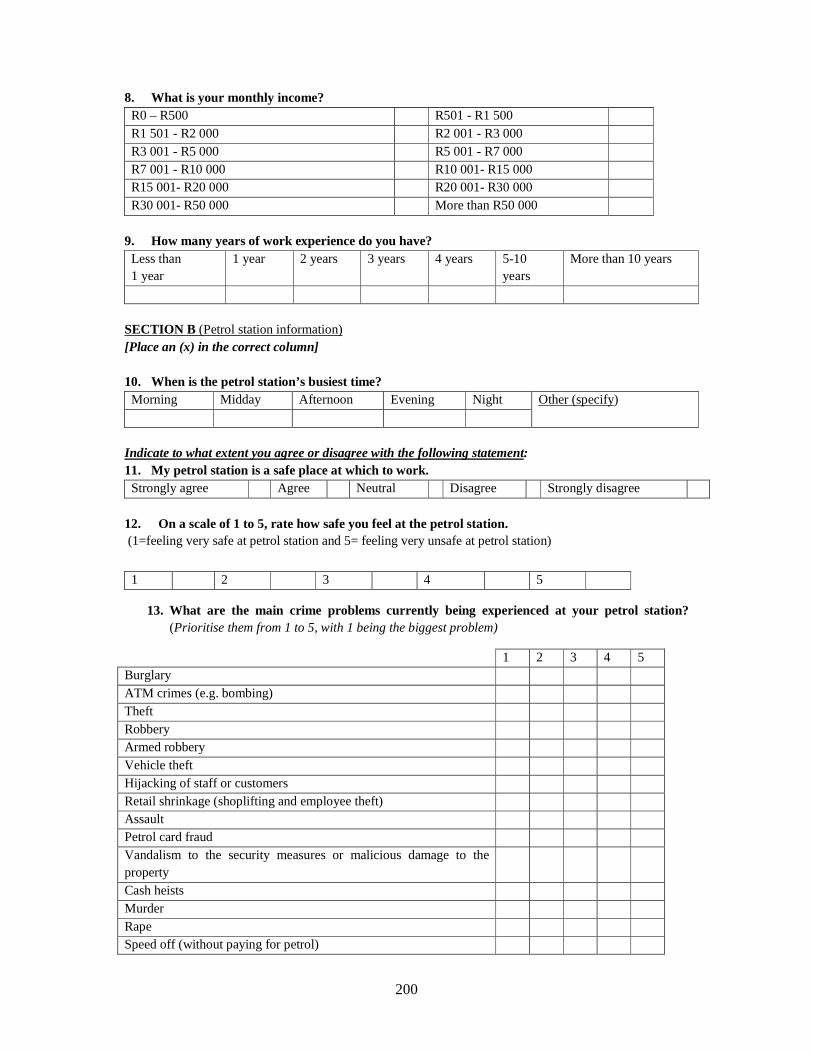
200
8. What is your monthly income? R0 – R500 R501 - R1 500 R1 501 - R2 000 R2 001 - R3 000 R3 001 - R5 000 R5 001 - R7 000 R7 001 - R10 000 R10 001- R15 000 R15 001- R20 000 R20 001- R30 000 R30 001- R50 000 More than R50 000
9. How many years of work experience do you have? Less than 1 year
1 year 2 years 3 years 4 years 5-10 years
More than 10 years
SECTION B (Petrol station information) [Place an (x) in the correct column] 10. When is the petrol station’s busiest time? Morning Midday Afternoon Evening Night Other (specify)
Indicate to what extent you agree or disagree with the following statement: 11. My petrol station is a safe place at which to work. Strongly agree Agree Neutral Disagree Strongly disagree
12. On a scale of 1 to 5, rate how safe you feel at the petrol station. (1=feeling very safe at petrol station and 5= feeling very unsafe at petrol station)
13. What are the main crime problems currently being experienced at your petrol station? (Prioritise them from 1 to 5, with 1 being the biggest problem)
1 2 3 4 5
1 2 3 4 5 Burglary ATM crimes (e.g. bombing) Theft Robbery Armed robbery Vehicle theft Hijacking of staff or customers Retail shrinkage (shoplifting and employee theft) Assault Petrol card fraud Vandalism to the security measures or malicious damage to the property
Cash heists Murder Rape Speed off (without paying for petrol)
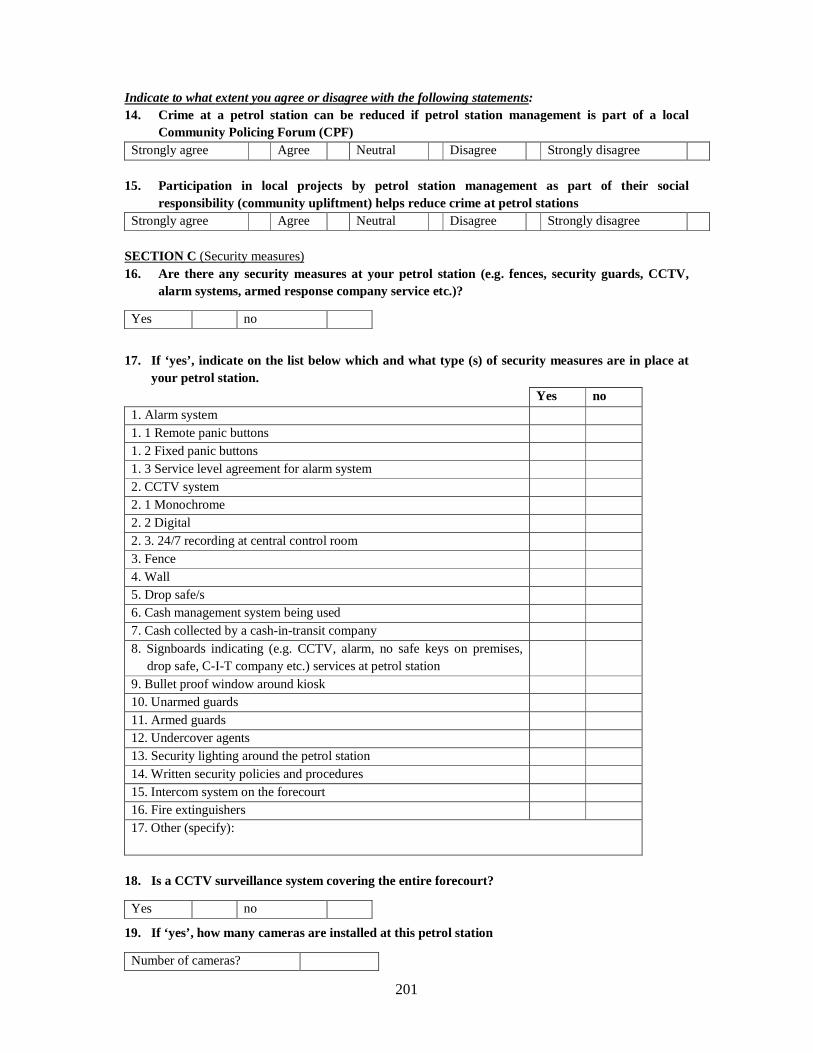
201
Indicate to what extent you agree or disagree with the following statements: 14. Crime at a petrol station can be reduced if petrol station management is part of a local
Community Policing Forum (CPF) Strongly agree Agree Neutral Disagree Strongly disagree
15. Participation in local projects by petrol station management as part of their social
responsibility (community upliftment) helps reduce crime at petrol stations Strongly agree Agree Neutral Disagree Strongly disagree
SECTION C (Security measures) 16. Are there any security measures at your petrol station (e.g. fences, security guards, CCTV,
alarm systems, armed response company service etc.)?
17. If ‘yes’, indicate on the list below which and what type (s) of security measures are in place at
your petrol station. Yes no 1. Alarm system 1. 1 Remote panic buttons 1. 2 Fixed panic buttons 1. 3 Service level agreement for alarm system 2. CCTV system 2. 1 Monochrome 2. 2 Digital 2. 3. 24/7 recording at central control room 3. Fence 4. Wall 5. Drop safe/s 6. Cash management system being used 7. Cash collected by a cash-in-transit company 8. Signboards indicating (e.g. CCTV, alarm, no safe keys on premises,
drop safe, C-I-T company etc.) services at petrol station
9. Bullet proof window around kiosk 10. Unarmed guards 11. Armed guards 12. Undercover agents 13. Security lighting around the petrol station 14. Written security policies and procedures 15. Intercom system on the forecourt 16. Fire extinguishers 17. Other (specify):
18. Is a CCTV surveillance system covering the entire forecourt?
19. If ‘yes’, how many cameras are installed at this petrol station
Yes no
Yes no
Number of cameras?
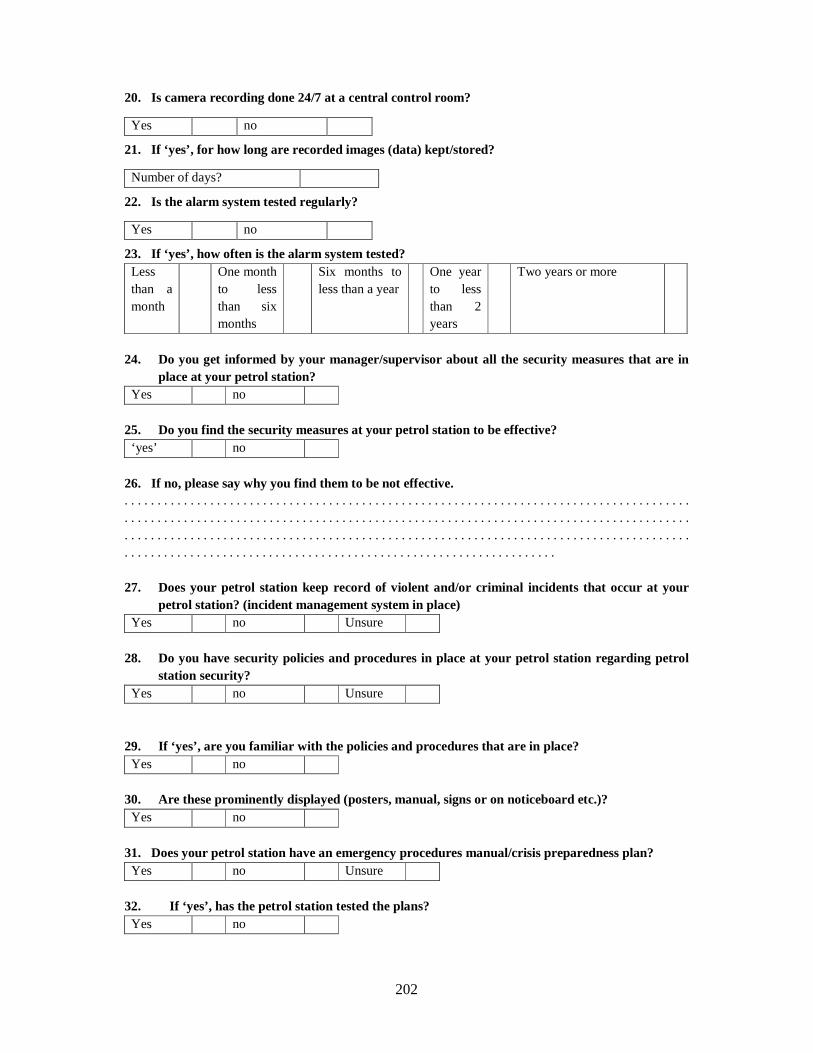
202
20. Is camera recording done 24/7 at a central control room?
21. If ‘yes’, for how long are recorded images (data) kept/stored?
22. Is the alarm system tested regularly?
23. If ‘yes’, how often is the alarm system tested? Less than a month
One month to less than six months
Six months to less than a year
One year to less than 2 years
Two years or more
24. Do you get informed by your manager/supervisor about all the security measures that are in
place at your petrol station? Yes no
25. Do you find the security measures at your petrol station to be effective? ‘yes’ no
26. If no, please say why you find them to be not effective. . . . . . . . . . . . . . . . . . . . . . . . . . . . . . . . . . . . . . . . . . . . . . . . . . . . . . . . . . . . . . . . . . . . . . . . . . . . . . . . . . . . . . . . . . . . . . . . . . . . . . . . . . . . . . . . . . . . . . . . . . . . . . . . . . . . . . . . . . . . . . . . . . . . . . . . . . . . . . . . . . . . . . . . . . . . . . . . . . . . . . . . . . . . . . . . . . . . . . . . . . . . . . . . . . . . . . . . . . . . . . . . . . . . . . . . . . . . . . . . . . . . . . . . . . . . . . . . . . . . . . . . . . . . . . . . . . . . . . . . . . . . . . . . . . . . . . . . . . . . . . . . . . . . . . . . . . . . . . . . . . . . . 27. Does your petrol station keep record of violent and/or criminal incidents that occur at your
petrol station? (incident management system in place) Yes no Unsure
28. Do you have security policies and procedures in place at your petrol station regarding petrol
station security? Yes no Unsure
29. If ‘yes’, are you familiar with the policies and procedures that are in place? Yes no
30. Are these prominently displayed (posters, manual, signs or on noticeboard etc.)? Yes no
31. Does your petrol station have an emergency procedures manual/crisis preparedness plan? Yes no Unsure
32. If ‘yes’, has the petrol station tested the plans? Yes no
Yes no
Number of days?
Yes no
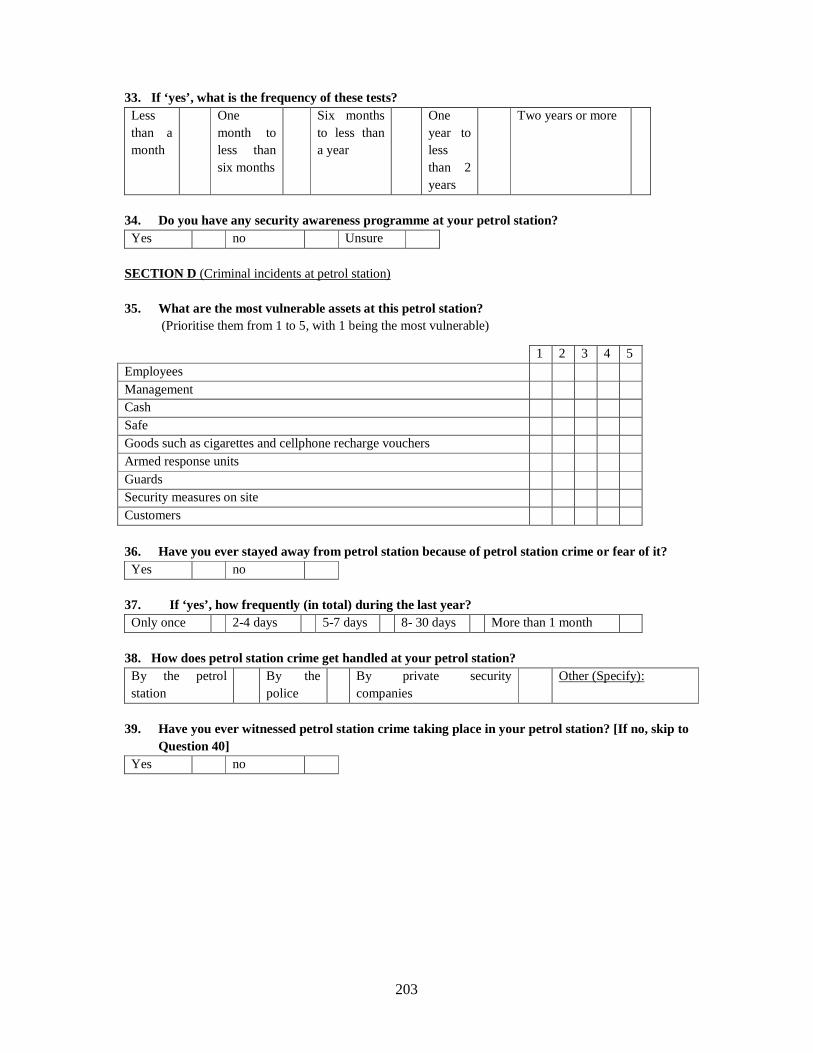
203
33. If ‘yes’, what is the frequency of these tests? Less than a month
One month to less than six months
Six months to less than a year
One year to less than 2 years
Two years or more
34. Do you have any security awareness programme at your petrol station? Yes no Unsure
SECTION D (Criminal incidents at petrol station) 35. What are the most vulnerable assets at this petrol station?
(Prioritise them from 1 to 5, with 1 being the most vulnerable)
36. Have you ever stayed away from petrol station because of petrol station crime or fear of it? Yes no
37. If ‘yes’, how frequently (in total) during the last year? Only once 2-4 days 5-7 days 8- 30 days More than 1 month
38. How does petrol station crime get handled at your petrol station? By the petrol station
By the police
By private security companies
Other (Specify):
39. Have you ever witnessed petrol station crime taking place in your petrol station? [If no, skip to
Question 40] Yes no
1 2 3 4 5 Employees Management Cash Safe Goods such as cigarettes and cellphone recharge vouchers Armed response units Guards Security measures on site Customers
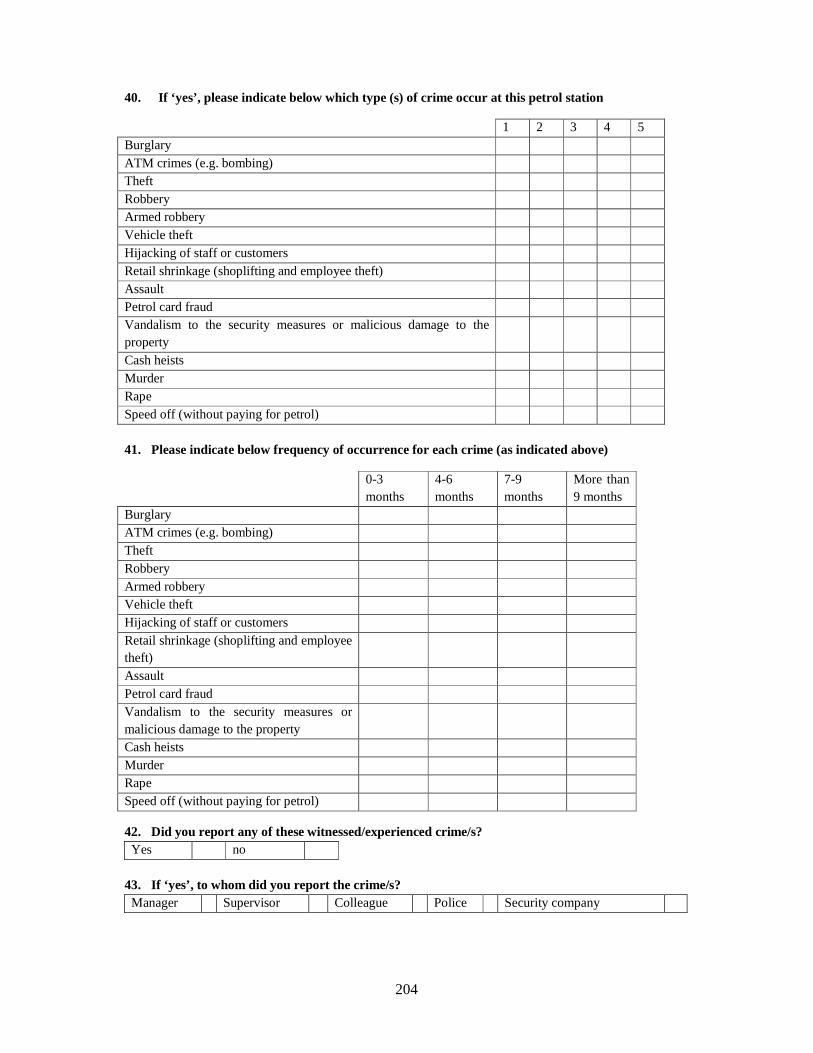
204
40. If ‘yes’, please indicate below which type (s) of crime occur at this petrol station
41. Please indicate below frequency of occurrence for each crime (as indicated above)
42. Did you report any of these witnessed/experienced crime/s? Yes no
43. If ‘yes’, to whom did you report the crime/s? Manager Supervisor Colleague Police Security company
1 2 3 4 5 Burglary ATM crimes (e.g. bombing) Theft Robbery Armed robbery Vehicle theft Hijacking of staff or customers Retail shrinkage (shoplifting and employee theft) Assault Petrol card fraud Vandalism to the security measures or malicious damage to the property
Cash heists Murder Rape Speed off (without paying for petrol)
0-3 months
4-6 months
7-9 months
More than 9 months
Burglary ATM crimes (e.g. bombing) Theft Robbery Armed robbery Vehicle theft Hijacking of staff or customers Retail shrinkage (shoplifting and employee theft)
Assault Petrol card fraud Vandalism to the security measures or malicious damage to the property
Cash heists Murder Rape Speed off (without paying for petrol)
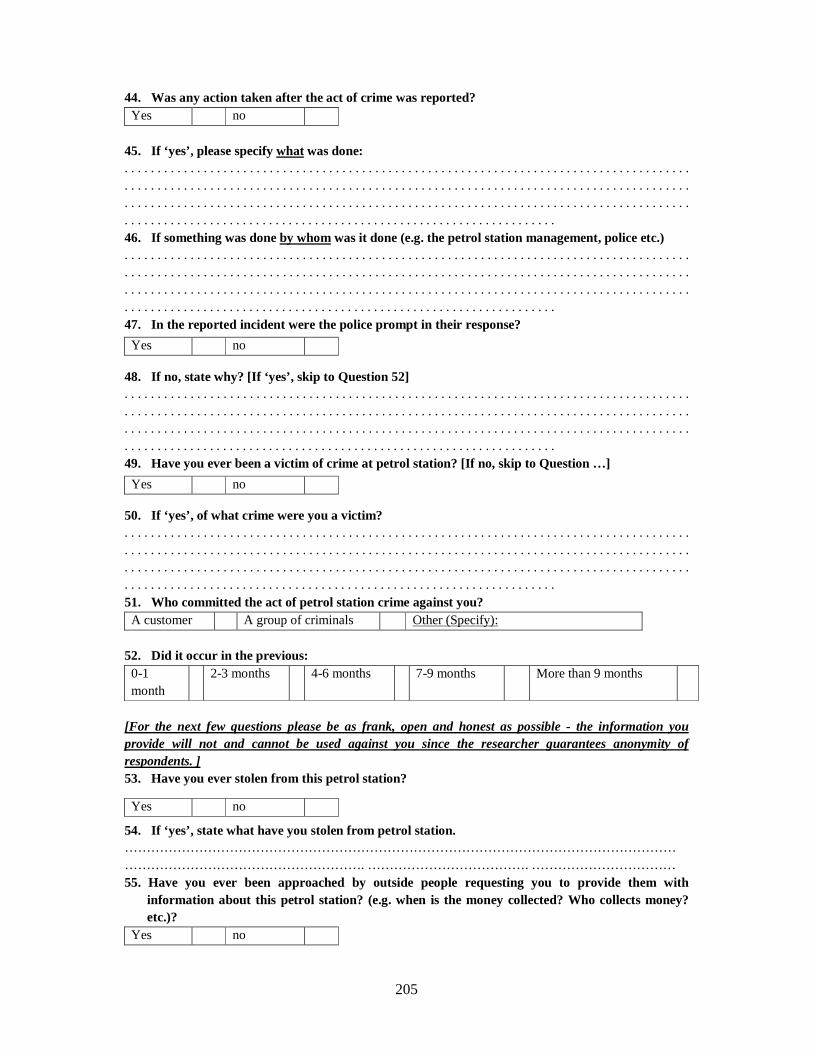
205
44. Was any action taken after the act of crime was reported? Yes no
45. If ‘yes’, please specify what was done: . . . . . . . . . . . . . . . . . . . . . . . . . . . . . . . . . . . . . . . . . . . . . . . . . . . . . . . . . . . . . . . . . . . . . . . . . . . . . . . . . . . . . . . . . . . . . . . . . . . . . . . . . . . . . . . . . . . . . . . . . . . . . . . . . . . . . . . . . . . . . . . . . . . . . . . . . . . . . . . . . . . . . . . . . . . . . . . . . . . . . . . . . . . . . . . . . . . . . . . . . . . . . . . . . . . . . . . . . . . . . . . . . . . . . . . . . . . . . . . . . . . . . . . . . . . . . . . . . . . . . . . . . . . . . . . . . . . . . . . . . . . . . . . . . . . . . . . . . . . . . . . . . . . . . . . . . . . . . . . . . . . . 46. If something was done by whom was it done (e.g. the petrol station management, police etc.) . . . . . . . . . . . . . . . . . . . . . . . . . . . . . . . . . . . . . . . . . . . . . . . . . . . . . . . . . . . . . . . . . . . . . . . . . . . . . . . . . . . . . . . . . . . . . . . . . . . . . . . . . . . . . . . . . . . . . . . . . . . . . . . . . . . . . . . . . . . . . . . . . . . . . . . . . . . . . . . . . . . . . . . . . . . . . . . . . . . . . . . . . . . . . . . . . . . . . . . . . . . . . . . . . . . . . . . . . . . . . . . . . . . . . . . . . . . . . . . . . . . . . . . . . . . . . . . . . . . . . . . . . . . . . . . . . . . . . . . . . . . . . . . . . . . . . . . . . . . . . . . . . . . . . . . . . . . . . . . . . . . . 47. In the reported incident were the police prompt in their response?
48. If no, state why? [If ‘yes’, skip to Question 52] . . . . . . . . . . . . . . . . . . . . . . . . . . . . . . . . . . . . . . . . . . . . . . . . . . . . . . . . . . . . . . . . . . . . . . . . . . . . . . . . . . . . . . . . . . . . . . . . . . . . . . . . . . . . . . . . . . . . . . . . . . . . . . . . . . . . . . . . . . . . . . . . . . . . . . . . . . . . . . . . . . . . . . . . . . . . . . . . . . . . . . . . . . . . . . . . . . . . . . . . . . . . . . . . . . . . . . . . . . . . . . . . . . . . . . . . . . . . . . . . . . . . . . . . . . . . . . . . . . . . . . . . . . . . . . . . . . . . . . . . . . . . . . . . . . . . . . . . . . . . . . . . . . . . . . . . . . . . . . . . . . . . 49. Have you ever been a victim of crime at petrol station? [If no, skip to Question …]
50. If ‘yes’, of what crime were you a victim? . . . . . . . . . . . . . . . . . . . . . . . . . . . . . . . . . . . . . . . . . . . . . . . . . . . . . . . . . . . . . . . . . . . . . . . . . . . . . . . . . . . . . . . . . . . . . . . . . . . . . . . . . . . . . . . . . . . . . . . . . . . . . . . . . . . . . . . . . . . . . . . . . . . . . . . . . . . . . . . . . . . . . . . . . . . . . . . . . . . . . . . . . . . . . . . . . . . . . . . . . . . . . . . . . . . . . . . . . . . . . . . . . . . . . . . . . . . . . . . . . . . . . . . . . . . . . . . . . . . . . . . . . . . . . . . . . . . . . . . . . . . . . . . . . . . . . . . . . . . . . . . . . . . . . . . . . . . . . . . . . . . . 51. Who committed the act of petrol station crime against you? A customer A group of criminals Other (Specify):
52. Did it occur in the previous: 0-1 month
2-3 months 4-6 months 7-9 months More than 9 months
[For the next few questions please be as frank, open and honest as possible - the information you provide will not and cannot be used against you since the researcher guarantees anonymity of respondents. ] 53. Have you ever stolen from this petrol station?
54. If ‘yes’, state what have you stolen from petrol station. ………………………………………………………………………………………………………………………………………………………………. ………………………………. …………………………… 55. Have you ever been approached by outside people requesting you to provide them with
information about this petrol station? (e.g. when is the money collected? Who collects money? etc.)?
Yes no
Yes no
Yes no
Yes no
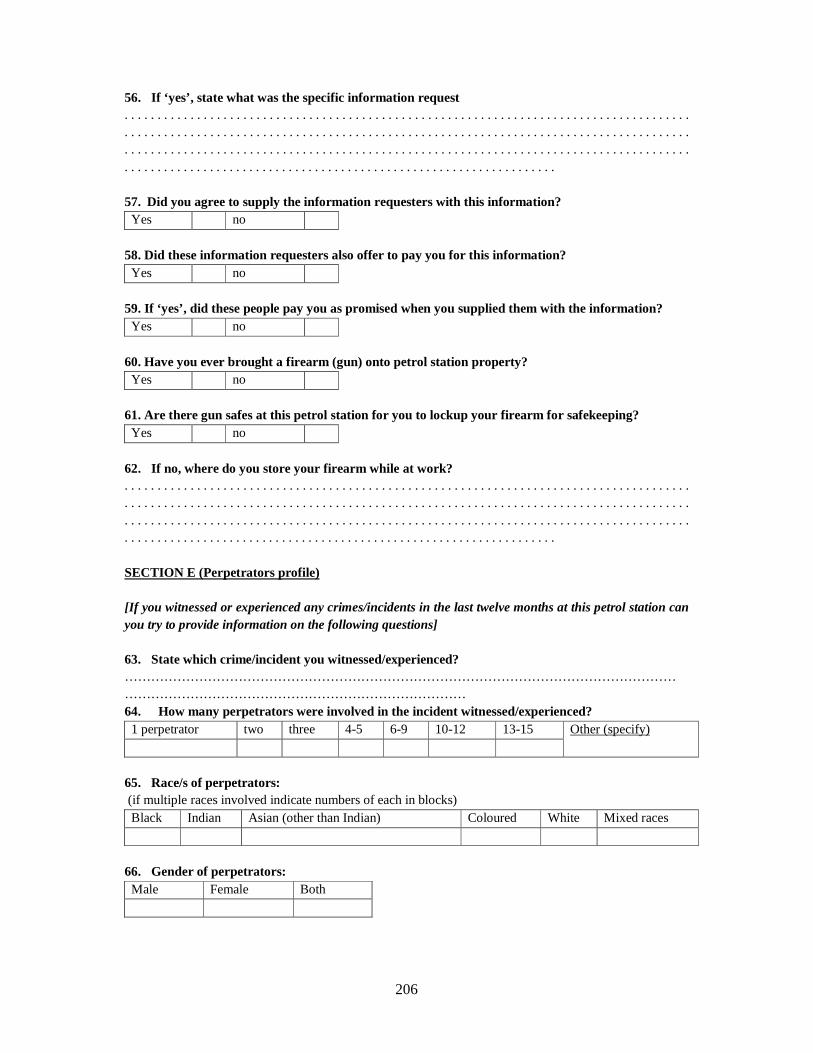
206
56. If ‘yes’, state what was the specific information request . . . . . . . . . . . . . . . . . . . . . . . . . . . . . . . . . . . . . . . . . . . . . . . . . . . . . . . . . . . . . . . . . . . . . . . . . . . . . . . . . . . . . . . . . . . . . . . . . . . . . . . . . . . . . . . . . . . . . . . . . . . . . . . . . . . . . . . . . . . . . . . . . . . . . . . . . . . . . . . . . . . . . . . . . . . . . . . . . . . . . . . . . . . . . . . . . . . . . . . . . . . . . . . . . . . . . . . . . . . . . . . . . . . . . . . . . . . . . . . . . . . . . . . . . . . . . . . . . . . . . . . . . . . . . . . . . . . . . . . . . . . . . . . . . . . . . . . . . . . . . . . . . . . . . . . . . . . . . . . . . . . . 57. Did you agree to supply the information requesters with this information? Yes no
58. Did these information requesters also offer to pay you for this information? Yes no
59. If ‘yes’, did these people pay you as promised when you supplied them with the information? Yes no
60. Have you ever brought a firearm (gun) onto petrol station property? Yes no
61. Are there gun safes at this petrol station for you to lockup your firearm for safekeeping? Yes no
62. If no, where do you store your firearm while at work? . . . . . . . . . . . . . . . . . . . . . . . . . . . . . . . . . . . . . . . . . . . . . . . . . . . . . . . . . . . . . . . . . . . . . . . . . . . . . . . . . . . . . . . . . . . . . . . . . . . . . . . . . . . . . . . . . . . . . . . . . . . . . . . . . . . . . . . . . . . . . . . . . . . . . . . . . . . . . . . . . . . . . . . . . . . . . . . . . . . . . . . . . . . . . . . . . . . . . . . . . . . . . . . . . . . . . . . . . . . . . . . . . . . . . . . . . . . . . . . . . . . . . . . . . . . . . . . . . . . . . . . . . . . . . . . . . . . . . . . . . . . . . . . . . . . . . . . . . . . . . . . . . . . . . . . . . . . . . . . . . . . . SECTION E (Perpetrators profile) [If you witnessed or experienced any crimes/incidents in the last twelve months at this petrol station can you try to provide information on the following questions] 63. State which crime/incident you witnessed/experienced? …………………………………………………………………………………………………………………………………………………………………………………… 64. How many perpetrators were involved in the incident witnessed/experienced? 1 perpetrator two three 4-5 6-9 10-12 13-15 Other (specify)
65. Race/s of perpetrators: (if multiple races involved indicate numbers of each in blocks) Black Indian Asian (other than Indian) Coloured White Mixed races
66. Gender of perpetrators: Male Female Both
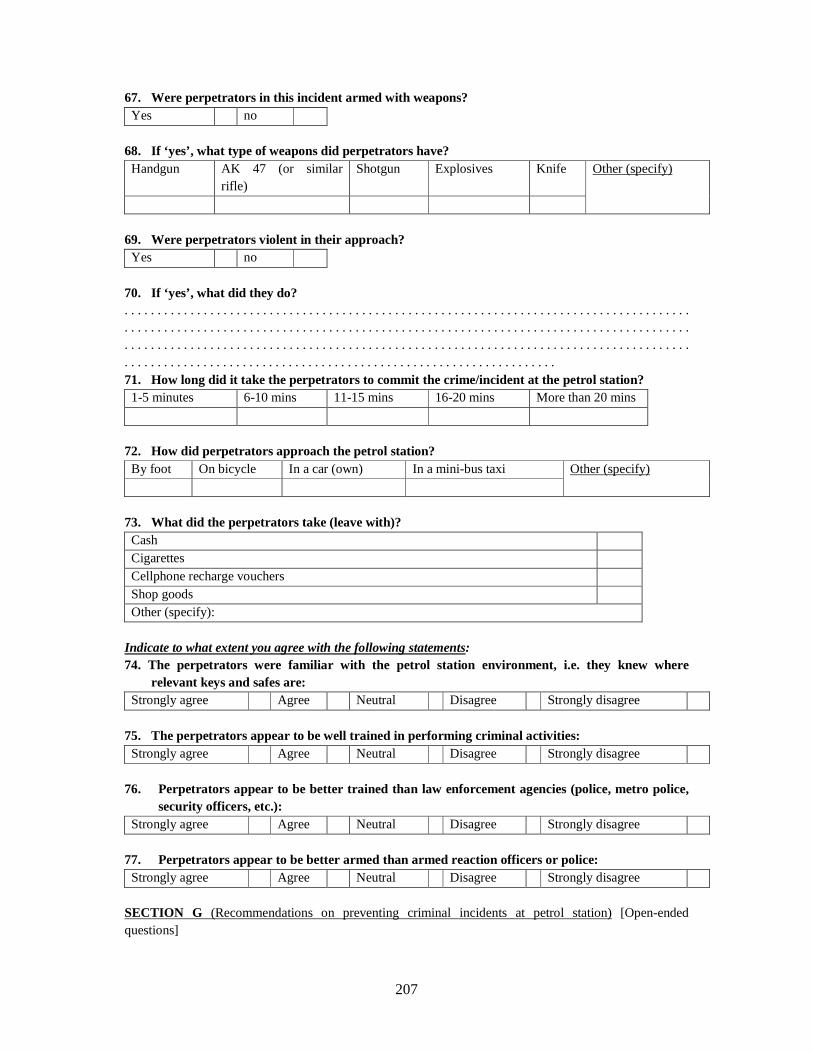
207
67. Were perpetrators in this incident armed with weapons? Yes no
68. If ‘yes’, what type of weapons did perpetrators have? Handgun AK 47 (or similar
rifle) Shotgun Explosives Knife Other (specify)
69. Were perpetrators violent in their approach? Yes no
70. If ‘yes’, what did they do? . . . . . . . . . . . . . . . . . . . . . . . . . . . . . . . . . . . . . . . . . . . . . . . . . . . . . . . . . . . . . . . . . . . . . . . . . . . . . . . . . . . . . . . . . . . . . . . . . . . . . . . . . . . . . . . . . . . . . . . . . . . . . . . . . . . . . . . . . . . . . . . . . . . . . . . . . . . . . . . . . . . . . . . . . . . . . . . . . . . . . . . . . . . . . . . . . . . . . . . . . . . . . . . . . . . . . . . . . . . . . . . . . . . . . . . . . . . . . . . . . . . . . . . . . . . . . . . . . . . . . . . . . . . . . . . . . . . . . . . . . . . . . . . . . . . . . . . . . . . . . . . . . . . . . . . . . . . . . . . . . . . . 71. How long did it take the perpetrators to commit the crime/incident at the petrol station? 1-5 minutes 6-10 mins 11-15 mins 16-20 mins More than 20 mins
72. How did perpetrators approach the petrol station? By foot On bicycle In a car (own) In a mini-bus taxi Other (specify)
73. What did the perpetrators take (leave with)? Cash Cigarettes Cellphone recharge vouchers Shop goods Other (specify):
Indicate to what extent you agree with the following statements: 74. The perpetrators were familiar with the petrol station environment, i.e. they knew where
relevant keys and safes are: Strongly agree Agree Neutral Disagree Strongly disagree
75. The perpetrators appear to be well trained in performing criminal activities: Strongly agree Agree Neutral Disagree Strongly disagree
76. Perpetrators appear to be better trained than law enforcement agencies (police, metro police,
security officers, etc.): Strongly agree Agree Neutral Disagree Strongly disagree
77. Perpetrators appear to be better armed than armed reaction officers or police: Strongly agree Agree Neutral Disagree Strongly disagree
SECTION G (Recommendations on preventing criminal incidents at petrol station) [Open-ended questions]
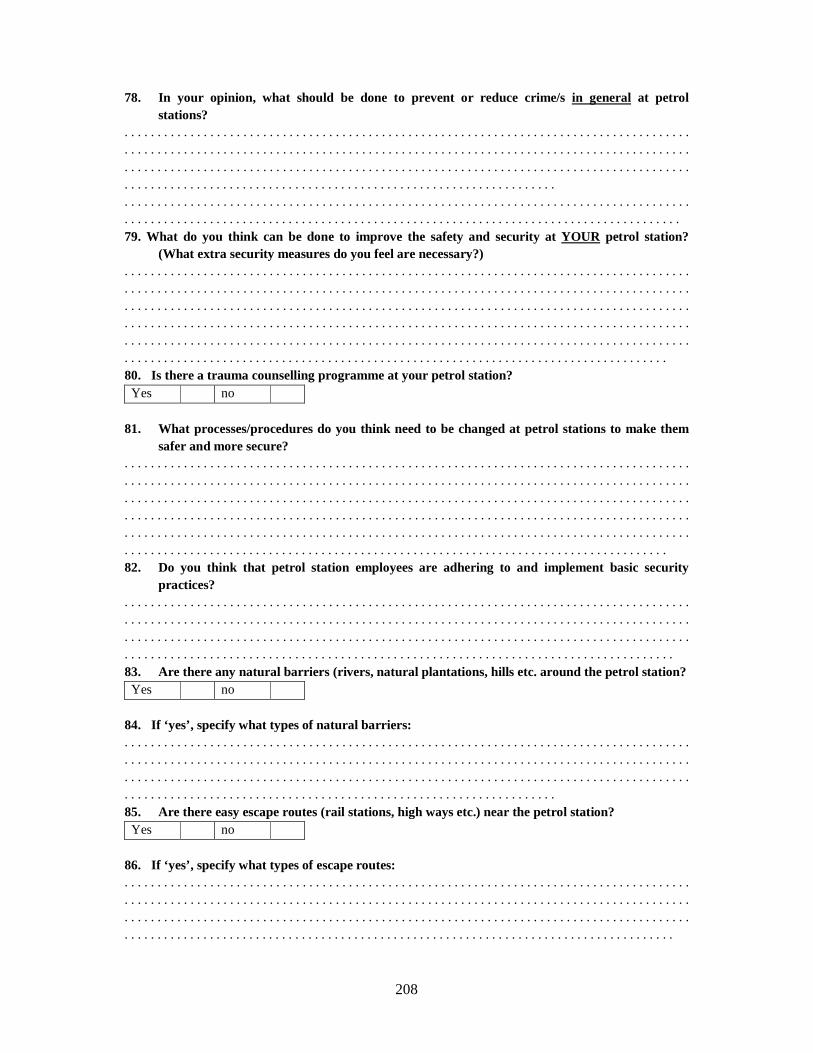
208
78. In your opinion, what should be done to prevent or reduce crime/s in general at petrol stations?
. . . . . . . . . . . . . . . . . . . . . . . . . . . . . . . . . . . . . . . . . . . . . . . . . . . . . . . . . . . . . . . . . . . . . . . . . . . . . . . . . . . . . .
. . . . . . . . . . . . . . . . . . . . . . . . . . . . . . . . . . . . . . . . . . . . . . . . . . . . . . . . . . . . . . . . . . . . . . . . . . . . . . . . . . . . . .
. . . . . . . . . . . . . . . . . . . . . . . . . . . . . . . . . . . . . . . . . . . . . . . . . . . . . . . . . . . . . . . . . . . . . . . . . . . . . . . . . . . . . .
. . . . . . . . . . . . . . . . . . . . . . . . . . . . . . . . . . . . . . . . . . . . . . . . . . . . . . . . . . . . . . . . . .
. . . . . . . . . . . . . . . . . . . . . . . . . . . . . . . . . . . . . . . . . . . . . . . . . . . . . . . . . . . . . . . . . . . . . . . . . . . . . . . . . . . . . .
. . . . . . . . . . . . . . . . . . . . . . . . . . . . . . . . . . . . . . . . . . . . . . . . . . . . . . . . . . . . . . . . . . . . . . . . . . . . . . . . . . . . . 79. What do you think can be done to improve the safety and security at YOUR petrol station?
(What extra security measures do you feel are necessary?) . . . . . . . . . . . . . . . . . . . . . . . . . . . . . . . . . . . . . . . . . . . . . . . . . . . . . . . . . . . . . . . . . . . . . . . . . . . . . . . . . . . . . . . . . . . . . . . . . . . . . . . . . . . . . . . . . . . . . . . . . . . . . . . . . . . . . . . . . . . . . . . . . . . . . . . . . . . . . . . . . . . . . . . . . . . . . . . . . . . . . . . . . . . . . . . . . . . . . . . . . . . . . . . . . . . . . . . . . . . . . . . . . . . . . . . . . . . . . . . . . . . . . . . . . . . . . . . . . . . . . . . . . . . . . . . . . . . . . . . . . . . . . . . . . . . . . . . . . . . . . . . . . . . . . . . . . . . . . . . . . . . . . . . . . . . . . . . . . . . . . . . . . . . . . . . . . . . . . . . . . . . . . . . . . . . . . . . . . . . . . . . . . . . . . . . . . . . . . . . . . . . . . . . . . . . . . . . . . . . . . . . . . . . . . . . . . . . . . . . . . . . . . . . . . . . . . . . . . . . . . . . . . . . . . . . . . . . . . . . . . . . . . . . . . . . . . . . . . . . . . . . . . . . . . . . . . 80. Is there a trauma counselling programme at your petrol station? Yes no
81. What processes/procedures do you think need to be changed at petrol stations to make them
safer and more secure? . . . . . . . . . . . . . . . . . . . . . . . . . . . . . . . . . . . . . . . . . . . . . . . . . . . . . . . . . . . . . . . . . . . . . . . . . . . . . . . . . . . . . . . . . . . . . . . . . . . . . . . . . . . . . . . . . . . . . . . . . . . . . . . . . . . . . . . . . . . . . . . . . . . . . . . . . . . . . . . . . . . . . . . . . . . . . . . . . . . . . . . . . . . . . . . . . . . . . . . . . . . . . . . . . . . . . . . . . . . . . . . . . . . . . . . . . . . . . . . . . . . . . . . . . . . . . . . . . . . . . . . . . . . . . . . . . . . . . . . . . . . . . . . . . . . . . . . . . . . . . . . . . . . . . . . . . . . . . . . . . . . . . . . . . . . . . . . . . . . . . . . . . . . . . . . . . . . . . . . . . . . . . . . . . . . . . . . . . . . . . . . . . . . . . . . . . . . . . . . . . . . . . . . . . . . . . . . . . . . . . . . . . . . . . . . . . . . . . . . . . . . . . . . . . . . . . . . . . . . . . . . . . . . . . . . . . . . . . . . . . . . . . . . . . . . . . . . . . . . . . . . . . . . . . . . . . 82. Do you think that petrol station employees are adhering to and implement basic security
practices? . . . . . . . . . . . . . . . . . . . . . . . . . . . . . . . . . . . . . . . . . . . . . . . . . . . . . . . . . . . . . . . . . . . . . . . . . . . . . . . . . . . . . . . . . . . . . . . . . . . . . . . . . . . . . . . . . . . . . . . . . . . . . . . . . . . . . . . . . . . . . . . . . . . . . . . . . . . . . . . . . . . . . . . . . . . . . . . . . . . . . . . . . . . . . . . . . . . . . . . . . . . . . . . . . . . . . . . . . . . . . . . . . . . . . . . . . . . . . . . . . . . . . . . . . . . . . . . . . . . . . . . . . . . . . . . . . . . . . . . . . . . . . . . . . . . . . . . . . . . . . . . . . . . . . . . . . . . . . . . . . . . . . . . . . . . . . . . . . . . . . . 83. Are there any natural barriers (rivers, natural plantations, hills etc. around the petrol station? Yes no
84. If ‘yes’, specify what types of natural barriers: . . . . . . . . . . . . . . . . . . . . . . . . . . . . . . . . . . . . . . . . . . . . . . . . . . . . . . . . . . . . . . . . . . . . . . . . . . . . . . . . . . . . . . . . . . . . . . . . . . . . . . . . . . . . . . . . . . . . . . . . . . . . . . . . . . . . . . . . . . . . . . . . . . . . . . . . . . . . . . . . . . . . . . . . . . . . . . . . . . . . . . . . . . . . . . . . . . . . . . . . . . . . . . . . . . . . . . . . . . . . . . . . . . . . . . . . . . . . . . . . . . . . . . . . . . . . . . . . . . . . . . . . . . . . . . . . . . . . . . . . . . . . . . . . . . . . . . . . . . . . . . . . . . . . . . . . . . . . . . . . . . . . 85. Are there easy escape routes (rail stations, high ways etc.) near the petrol station? Yes no
86. If ‘yes’, specify what types of escape routes: . . . . . . . . . . . . . . . . . . . . . . . . . . . . . . . . . . . . . . . . . . . . . . . . . . . . . . . . . . . . . . . . . . . . . . . . . . . . . . . . . . . . . . . . . . . . . . . . . . . . . . . . . . . . . . . . . . . . . . . . . . . . . . . . . . . . . . . . . . . . . . . . . . . . . . . . . . . . . . . . . . . . . . . . . . . . . . . . . . . . . . . . . . . . . . . . . . . . . . . . . . . . . . . . . . . . . . . . . . . . . . . . . . . . . . . . . . . . . . . . . . . . . . . . . . . . . . . . . . . . . . . . . . . . . . . . . . . . . . . . . . . . . . . . . . . . . . . . . . . . . . . . . . . . . . . . . . . . . . . . . . . . . . . . . . . . . . . . . . . . . .
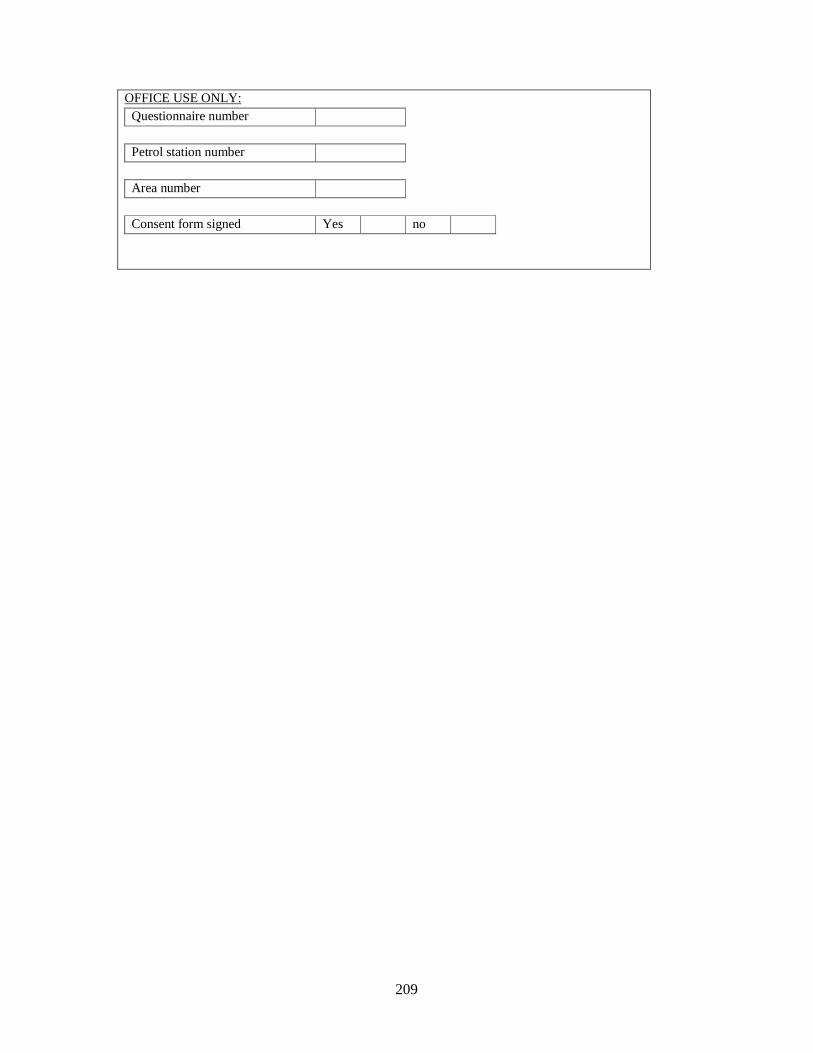
209
OFFICE USE ONLY: Questionnaire number
Petrol station number
Area number
Consent form signed Yes no
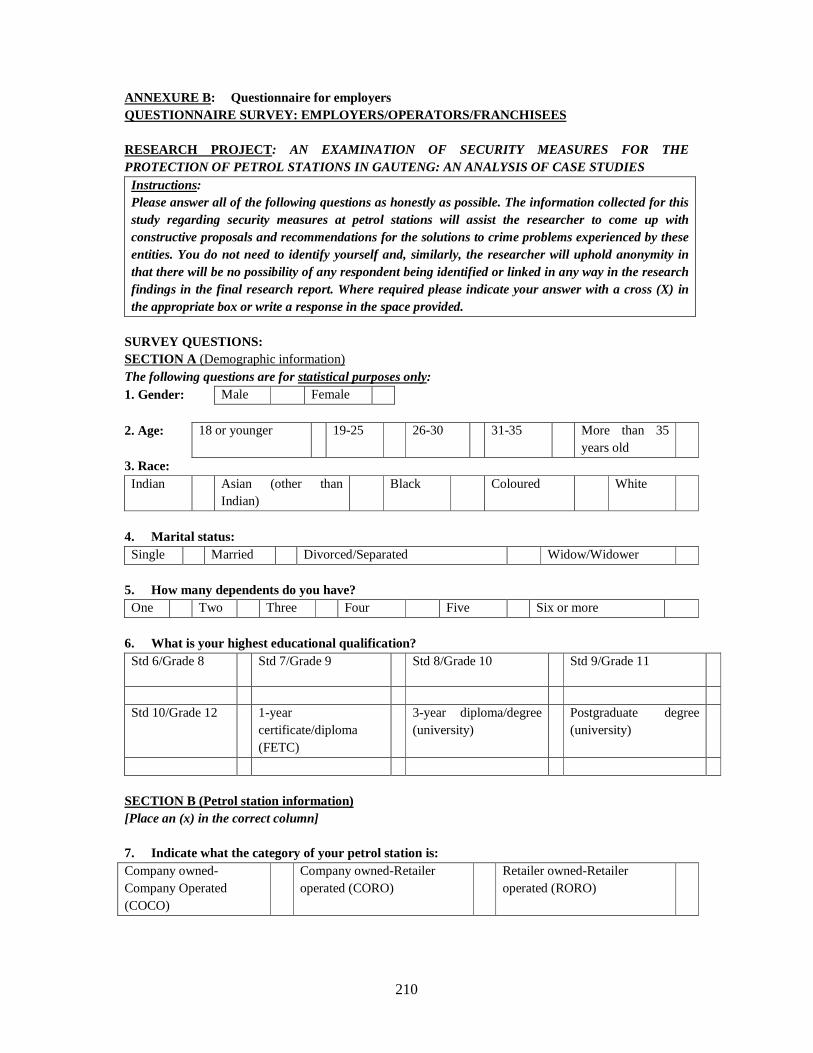
210
ANNEXURE B: Questionnaire for employers QUESTIONNAIRE SURVEY: EMPLOYERS/OPERATORS/FRANCHISE ES RESEARCH PROJECT: AN EXAMINATION OF SECURITY MEASURES FOR THE PROTECTION OF PETROL STATIONS IN GAUTENG: AN ANALYSIS OF CASE STUDIES
Instructions: Please answer all of the following questions as honestly as possible. The information collected for this study regarding security measures at petrol stations will assist the researcher to come up with constructive proposals and recommendations for the solutions to crime problems experienced by these entities. You do not need to identify yourself and, similarly, the researcher will uphold anonymity in that there will be no possibility of any respondent being identified or linked in any way in the research findings in the final research report. Where required please indicate your answer with a cross (X) in the appropriate box or write a response in the space provided.
SURVEY QUESTIONS: SECTION A (Demographic information) The following questions are for statistical purposes only: 1. Gender: Male Female 2. Age: 18 or younger 19-25 26-30 31-35 More than 35
years old
3. Race: Indian Asian (other than
Indian) Black Coloured White
4. Marital status: Single Married Divorced/Separated Widow/Widower
5. How many dependents do you have? One Two Three Four Five Six or more
6. What is your highest educational qualification? Std 6/Grade 8 Std 7/Grade 9 Std 8/Grade 10 Std 9/Grade 11
Std 10/Grade 12 1-year
certificate/diploma (FETC)
3-year diploma/degree (university)
Postgraduate degree (university)
SECTION B (Petrol station information) [Place an (x) in the correct column] 7. Indicate what the category of your petrol station is: Company owned-Company Operated (COCO)
Company owned-Retailer operated (CORO)
Retailer owned-Retailer operated (RORO)
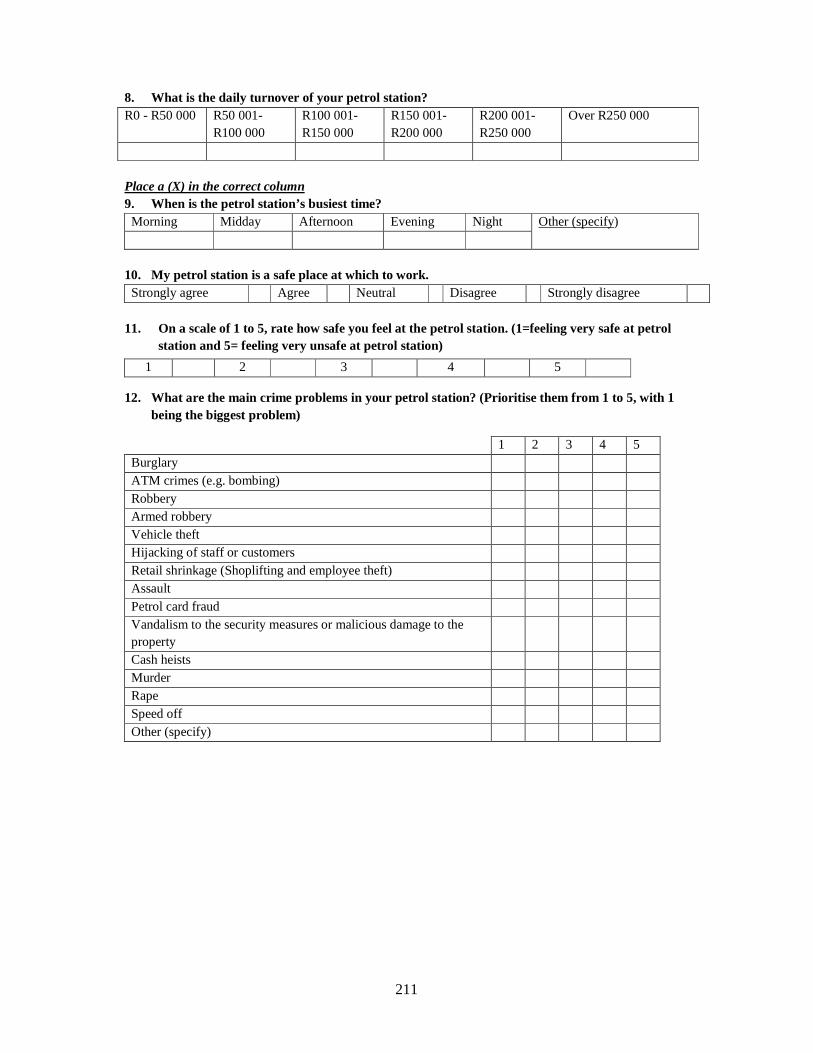
211
8. What is the daily turnover of your petrol station? R0 - R50 000 R50 001-
R100 000 R100 001- R150 000
R150 001- R200 000
R200 001- R250 000
Over R250 000
Place a (X) in the correct column 9. When is the petrol station’s busiest time? Morning Midday Afternoon Evening Night Other (specify)
10. My petrol station is a safe place at which to work. Strongly agree Agree Neutral Disagree Strongly disagree
11. On a scale of 1 to 5, rate how safe you feel at the petrol station. (1=feeling very safe at petrol
station and 5= feeling very unsafe at petrol station)
12. What are the main crime problems in your petrol station? (Prioritise them from 1 to 5, with 1 being the biggest problem)
1 2 3 4 5
1 2 3 4 5 Burglary ATM crimes (e.g. bombing) Robbery Armed robbery Vehicle theft Hijacking of staff or customers Retail shrinkage (Shoplifting and employee theft) Assault Petrol card fraud Vandalism to the security measures or malicious damage to the property
Cash heists Murder Rape Speed off Other (specify)
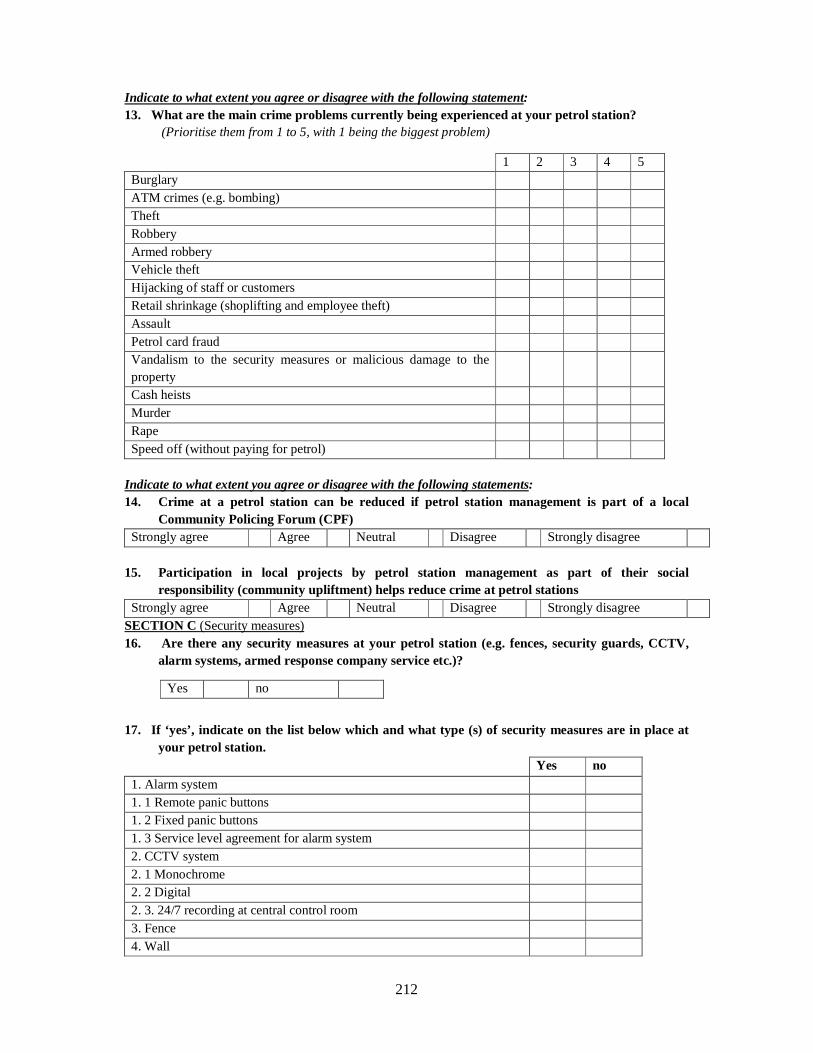
212
Indicate to what extent you agree or disagree with the following statement: 13. What are the main crime problems currently being experienced at your petrol station?
(Prioritise them from 1 to 5, with 1 being the biggest problem)
Indicate to what extent you agree or disagree with the following statements: 14. Crime at a petrol station can be reduced if petrol station management is part of a local
Community Policing Forum (CPF) Strongly agree Agree Neutral Disagree Strongly disagree
15. Participation in local projects by petrol station management as part of their social
responsibility (community upliftment) helps reduce crime at petrol stations Strongly agree Agree Neutral Disagree Strongly disagree
SECTION C (Security measures) 16. Are there any security measures at your petrol station (e.g. fences, security guards, CCTV,
alarm systems, armed response company service etc.)? 17. If ‘yes’, indicate on the list below which and what type (s) of security measures are in place at
your petrol station. Yes no 1. Alarm system 1. 1 Remote panic buttons 1. 2 Fixed panic buttons 1. 3 Service level agreement for alarm system 2. CCTV system 2. 1 Monochrome 2. 2 Digital 2. 3. 24/7 recording at central control room 3. Fence 4. Wall
1 2 3 4 5 Burglary ATM crimes (e.g. bombing) Theft Robbery Armed robbery Vehicle theft Hijacking of staff or customers Retail shrinkage (shoplifting and employee theft) Assault Petrol card fraud Vandalism to the security measures or malicious damage to the property
Cash heists Murder Rape Speed off (without paying for petrol)
Yes no
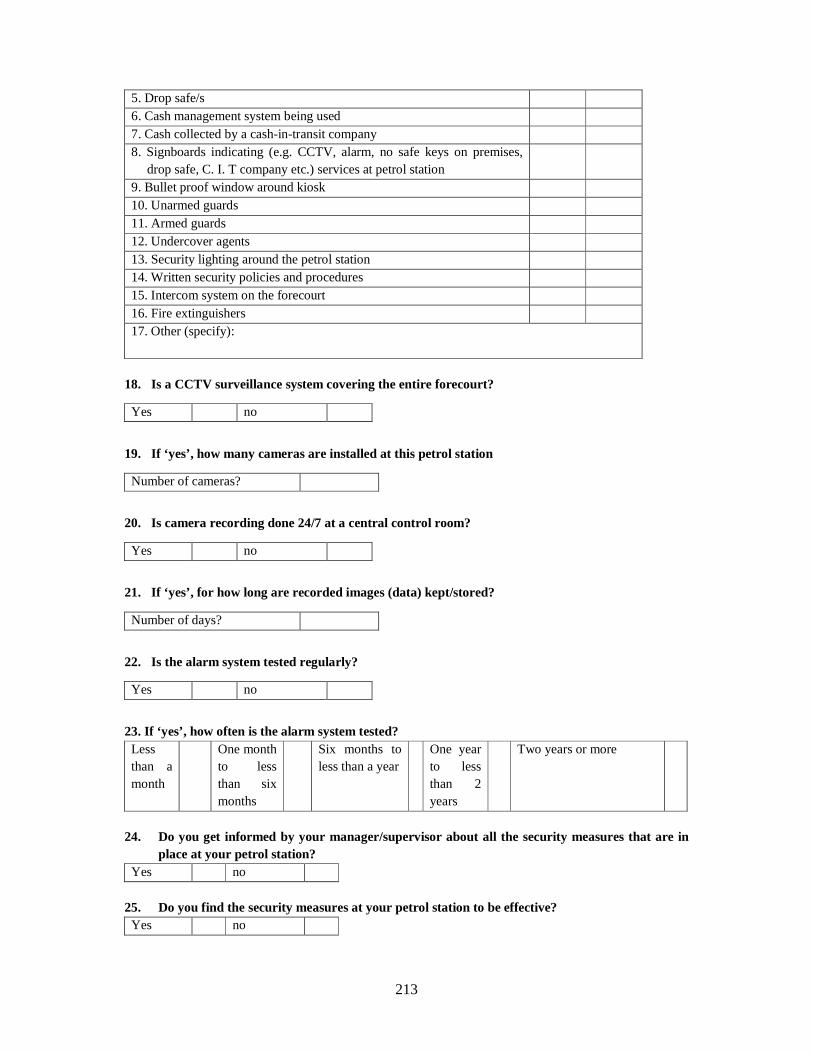
213
5. Drop safe/s 6. Cash management system being used 7. Cash collected by a cash-in-transit company 8. Signboards indicating (e.g. CCTV, alarm, no safe keys on premises,
drop safe, C. I. T company etc.) services at petrol station
9. Bullet proof window around kiosk 10. Unarmed guards 11. Armed guards 12. Undercover agents 13. Security lighting around the petrol station 14. Written security policies and procedures 15. Intercom system on the forecourt 16. Fire extinguishers 17. Other (specify):
18. Is a CCTV surveillance system covering the entire forecourt?
19. If ‘yes’, how many cameras are installed at this petrol station
20. Is camera recording done 24/7 at a central control room?
21. If ‘yes’, for how long are recorded images (data) kept/stored?
22. Is the alarm system tested regularly?
23. If ‘yes’, how often is the alarm system tested? Less than a month
One month to less than six months
Six months to less than a year
One year to less than 2 years
Two years or more
24. Do you get informed by your manager/supervisor about all the security measures that are in
place at your petrol station? Yes no
25. Do you find the security measures at your petrol station to be effective? Yes no
Yes no
Number of cameras?
Yes no
Number of days?
Yes no
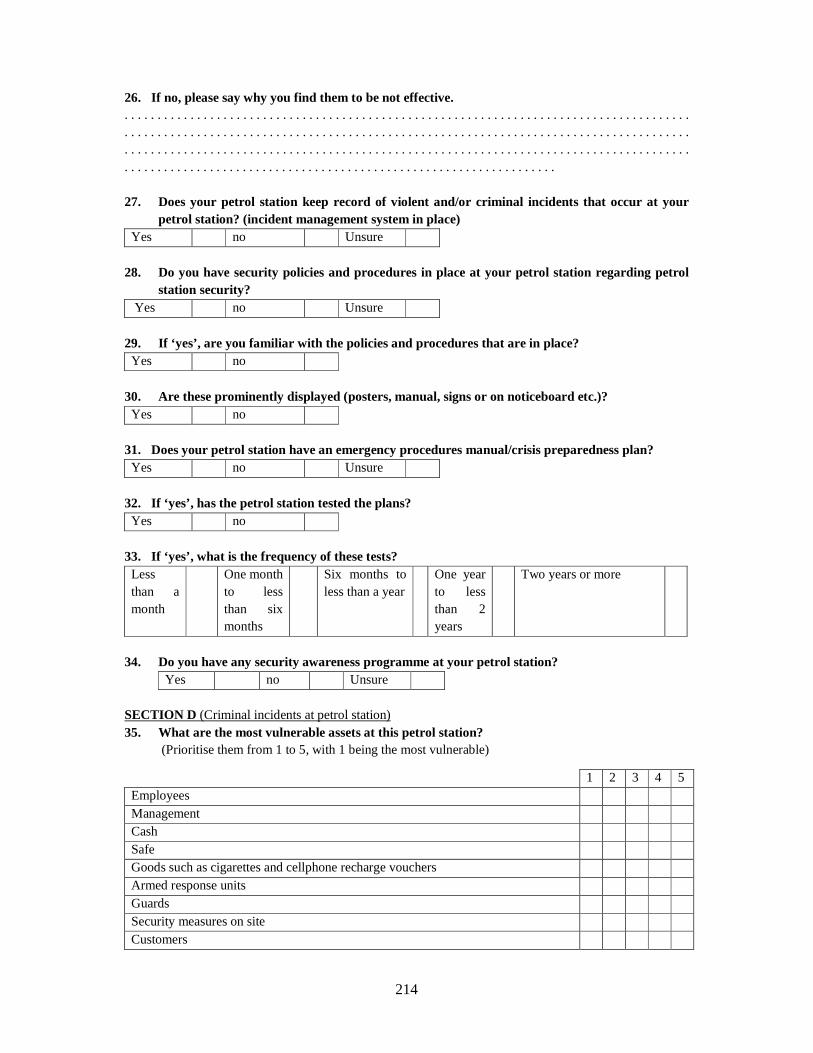
214
26. If no, please say why you find them to be not effective. . . . . . . . . . . . . . . . . . . . . . . . . . . . . . . . . . . . . . . . . . . . . . . . . . . . . . . . . . . . . . . . . . . . . . . . . . . . . . . . . . . . . . . . . . . . . . . . . . . . . . . . . . . . . . . . . . . . . . . . . . . . . . . . . . . . . . . . . . . . . . . . . . . . . . . . . . . . . . . . . . . . . . . . . . . . . . . . . . . . . . . . . . . . . . . . . . . . . . . . . . . . . . . . . . . . . . . . . . . . . . . . . . . . . . . . . . . . . . . . . . . . . . . . . . . . . . . . . . . . . . . . . . . . . . . . . . . . . . . . . . . . . . . . . . . . . . . . . . . . . . . . . . . . . . . . . . . . . . . . . . . . . 27. Does your petrol station keep record of violent and/or criminal incidents that occur at your
petrol station? (incident management system in place) Yes no Unsure
28. Do you have security policies and procedures in place at your petrol station regarding petrol
station security? Yes no Unsure
29. If ‘yes’, are you familiar with the policies and procedures that are in place? Yes no
30. Are these prominently displayed (posters, manual, signs or on noticeboard etc.)? Yes no
31. Does your petrol station have an emergency procedures manual/crisis preparedness plan? Yes no Unsure
32. If ‘yes’, has the petrol station tested the plans? Yes no
33. If ‘yes’, what is the frequency of these tests? Less than a month
One month to less than six months
Six months to less than a year
One year to less than 2 years
Two years or more
34. Do you have any security awareness programme at your petrol station?
Yes no Unsure SECTION D (Criminal incidents at petrol station) 35. What are the most vulnerable assets at this petrol station?
(Prioritise them from 1 to 5, with 1 being the most vulnerable)
1 2 3 4 5 Employees Management Cash Safe Goods such as cigarettes and cellphone recharge vouchers Armed response units Guards Security measures on site Customers
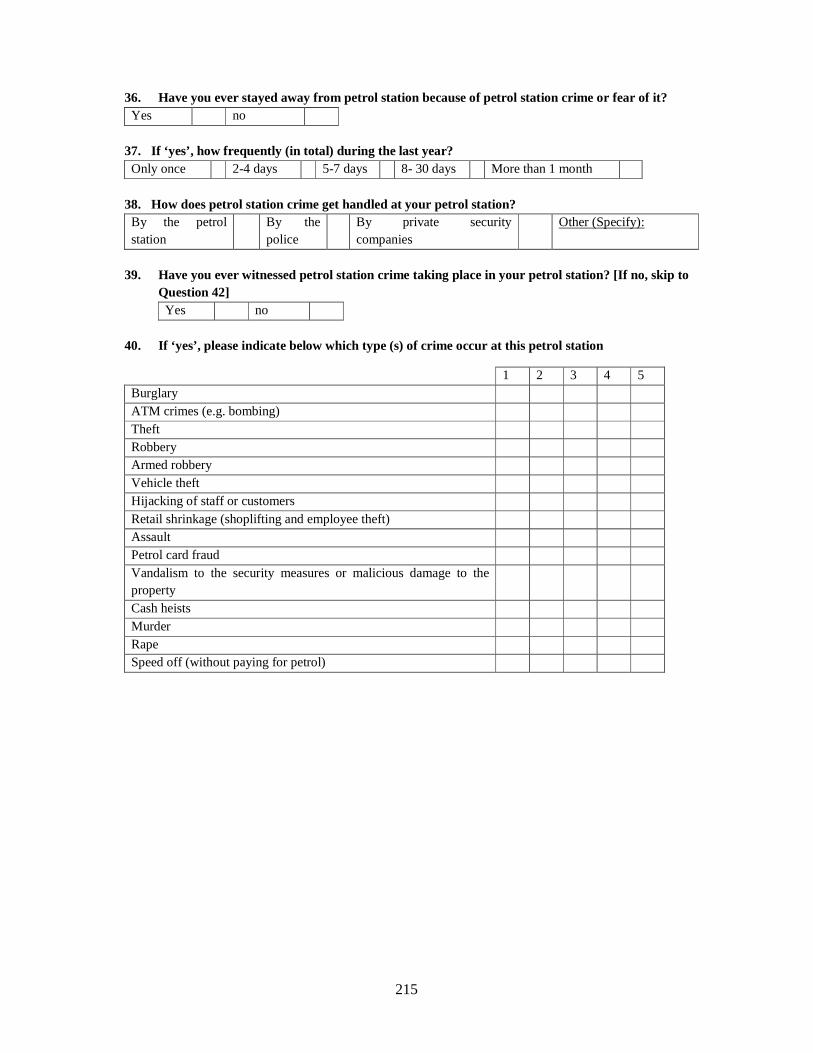
215
36. Have you ever stayed away from petrol station because of petrol station crime or fear of it? Yes no
37. If ‘yes’, how frequently (in total) during the last year? Only once 2-4 days 5-7 days 8- 30 days More than 1 month
38. How does petrol station crime get handled at your petrol station? By the petrol station
By the police
By private security companies
Other (Specify):
39. Have you ever witnessed petrol station crime taking place in your petrol station? [If no, skip to
Question 42] Yes no
40. If ‘yes’, please indicate below which type (s) of crime occur at this petrol station
1 2 3 4 5 Burglary ATM crimes (e.g. bombing) Theft Robbery Armed robbery Vehicle theft Hijacking of staff or customers Retail shrinkage (shoplifting and employee theft) Assault Petrol card fraud Vandalism to the security measures or malicious damage to the property
Cash heists Murder Rape Speed off (without paying for petrol)
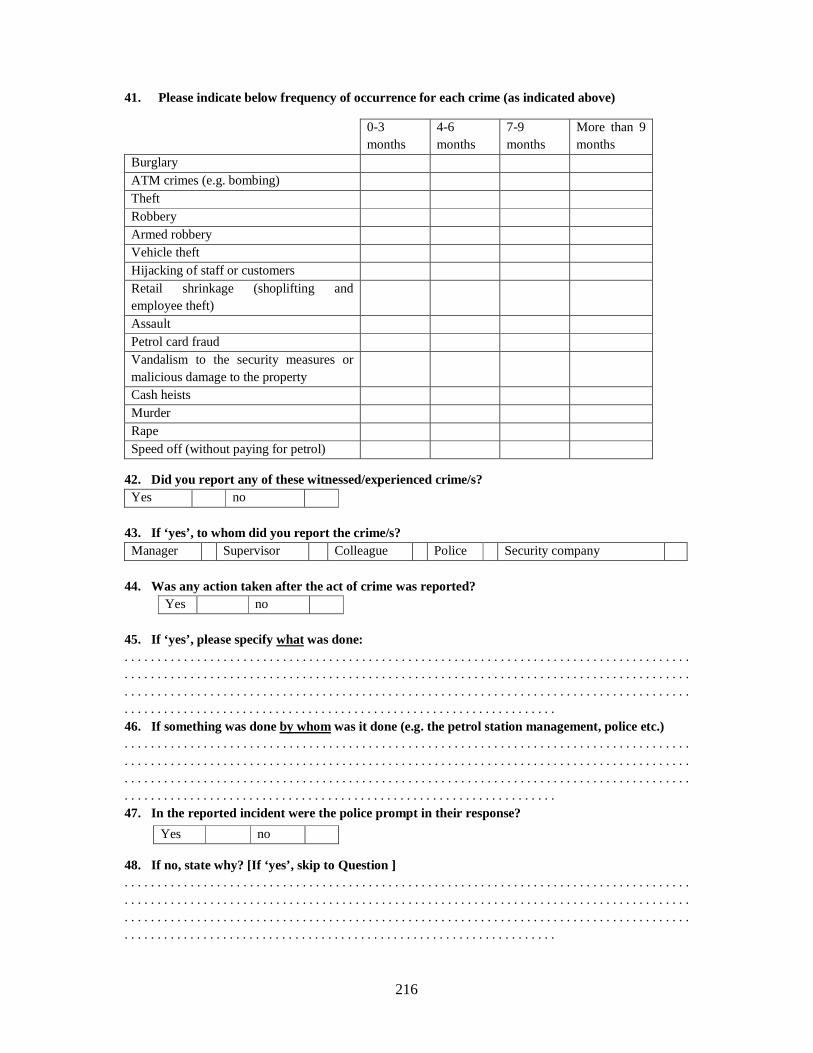
216
41. Please indicate below frequency of occurrence for each crime (as indicated above)
42. Did you report any of these witnessed/experienced crime/s? Yes no
43. If ‘yes’, to whom did you report the crime/s? Manager Supervisor Colleague Police Security company
44. Was any action taken after the act of crime was reported?
Yes no 45. If ‘yes’, please specify what was done: . . . . . . . . . . . . . . . . . . . . . . . . . . . . . . . . . . . . . . . . . . . . . . . . . . . . . . . . . . . . . . . . . . . . . . . . . . . . . . . . . . . . . . . . . . . . . . . . . . . . . . . . . . . . . . . . . . . . . . . . . . . . . . . . . . . . . . . . . . . . . . . . . . . . . . . . . . . . . . . . . . . . . . . . . . . . . . . . . . . . . . . . . . . . . . . . . . . . . . . . . . . . . . . . . . . . . . . . . . . . . . . . . . . . . . . . . . . . . . . . . . . . . . . . . . . . . . . . . . . . . . . . . . . . . . . . . . . . . . . . . . . . . . . . . . . . . . . . . . . . . . . . . . . . . . . . . . . . . . . . . . . . 46. If something was done by whom was it done (e.g. the petrol station management, police etc.) . . . . . . . . . . . . . . . . . . . . . . . . . . . . . . . . . . . . . . . . . . . . . . . . . . . . . . . . . . . . . . . . . . . . . . . . . . . . . . . . . . . . . . . . . . . . . . . . . . . . . . . . . . . . . . . . . . . . . . . . . . . . . . . . . . . . . . . . . . . . . . . . . . . . . . . . . . . . . . . . . . . . . . . . . . . . . . . . . . . . . . . . . . . . . . . . . . . . . . . . . . . . . . . . . . . . . . . . . . . . . . . . . . . . . . . . . . . . . . . . . . . . . . . . . . . . . . . . . . . . . . . . . . . . . . . . . . . . . . . . . . . . . . . . . . . . . . . . . . . . . . . . . . . . . . . . . . . . . . . . . . . . 47. In the reported incident were the police prompt in their response?
48. If no, state why? [If ‘yes’, skip to Question ] . . . . . . . . . . . . . . . . . . . . . . . . . . . . . . . . . . . . . . . . . . . . . . . . . . . . . . . . . . . . . . . . . . . . . . . . . . . . . . . . . . . . . . . . . . . . . . . . . . . . . . . . . . . . . . . . . . . . . . . . . . . . . . . . . . . . . . . . . . . . . . . . . . . . . . . . . . . . . . . . . . . . . . . . . . . . . . . . . . . . . . . . . . . . . . . . . . . . . . . . . . . . . . . . . . . . . . . . . . . . . . . . . . . . . . . . . . . . . . . . . . . . . . . . . . . . . . . . . . . . . . . . . . . . . . . . . . . . . . . . . . . . . . . . . . . . . . . . . . . . . . . . . . . . . . . . . . . . . . . . . . . .
0-3 months
4-6 months
7-9 months
More than 9 months
Burglary ATM crimes (e.g. bombing) Theft Robbery Armed robbery Vehicle theft Hijacking of staff or customers Retail shrinkage (shoplifting and employee theft)
Assault Petrol card fraud Vandalism to the security measures or malicious damage to the property
Cash heists Murder Rape Speed off (without paying for petrol)
Yes no
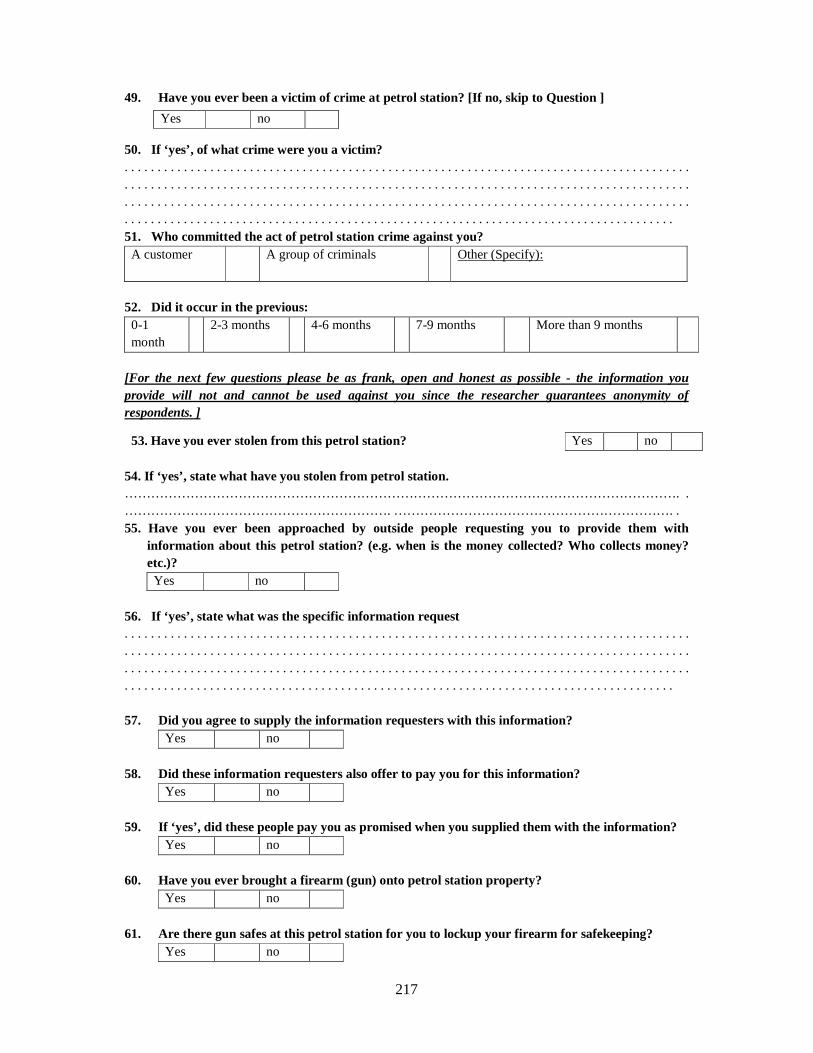
217
49. Have you ever been a victim of crime at petrol station? [If no, skip to Question ]
50. If ‘yes’, of what crime were you a victim? . . . . . . . . . . . . . . . . . . . . . . . . . . . . . . . . . . . . . . . . . . . . . . . . . . . . . . . . . . . . . . . . . . . . . . . . . . . . . . . . . . . . . . . . . . . . . . . . . . . . . . . . . . . . . . . . . . . . . . . . . . . . . . . . . . . . . . . . . . . . . . . . . . . . . . . . . . . . . . . . . . . . . . . . . . . . . . . . . . . . . . . . . . . . . . . . . . . . . . . . . . . . . . . . . . . . . . . . . . . . . . . . . . . . . . . . . . . . . . . . . . . . . . . . . . . . . . . . . . . . . . . . . . . . . . . . . . . . . . . . . . . . . . . . . . . . . . . . . . . . . . . . . . . . . . . . . . . . . . . . . . . . . . . . . . . . . . . . . . . . . . 51. Who committed the act of petrol station crime against you? A customer A group of criminals Other (Specify):
52. Did it occur in the previous: 0-1 month
2-3 months 4-6 months 7-9 months More than 9 months
[For the next few questions please be as frank, open and honest as possible - the information you provide will not and cannot be used against you since the researcher guarantees anonymity of respondents. ]
54. If ‘yes’, state what have you stolen from petrol station. ………………………………………………………………………………………………………………. . ……………………………………………………. ………………………………………………………. . 55. Have you ever been approached by outside people requesting you to provide them with
information about this petrol station? (e.g. when is the money collected? Who collects money? etc.)? Yes no
56. If ‘yes’, state what was the specific information request . . . . . . . . . . . . . . . . . . . . . . . . . . . . . . . . . . . . . . . . . . . . . . . . . . . . . . . . . . . . . . . . . . . . . . . . . . . . . . . . . . . . . . . . . . . . . . . . . . . . . . . . . . . . . . . . . . . . . . . . . . . . . . . . . . . . . . . . . . . . . . . . . . . . . . . . . . . . . . . . . . . . . . . . . . . . . . . . . . . . . . . . . . . . . . . . . . . . . . . . . . . . . . . . . . . . . . . . . . . . . . . . . . . . . . . . . . . . . . . . . . . . . . . . . . . . . . . . . . . . . . . . . . . . . . . . . . . . . . . . . . . . . . . . . . . . . . . . . . . . . . . . . . . . . . . . . . . . . . . . . . . . . . . . . . . . . . . . . . . . . . 57. Did you agree to supply the information requesters with this information?
Yes no 58. Did these information requesters also offer to pay you for this information?
Yes no 59. If ‘yes’, did these people pay you as promised when you supplied them with the information?
Yes no 60. Have you ever brought a firearm (gun) onto petrol station property?
Yes no 61. Are there gun safes at this petrol station for you to lockup your firearm for safekeeping?
Yes no
Yes no
53. Have you ever stolen from this petrol station? Yes no
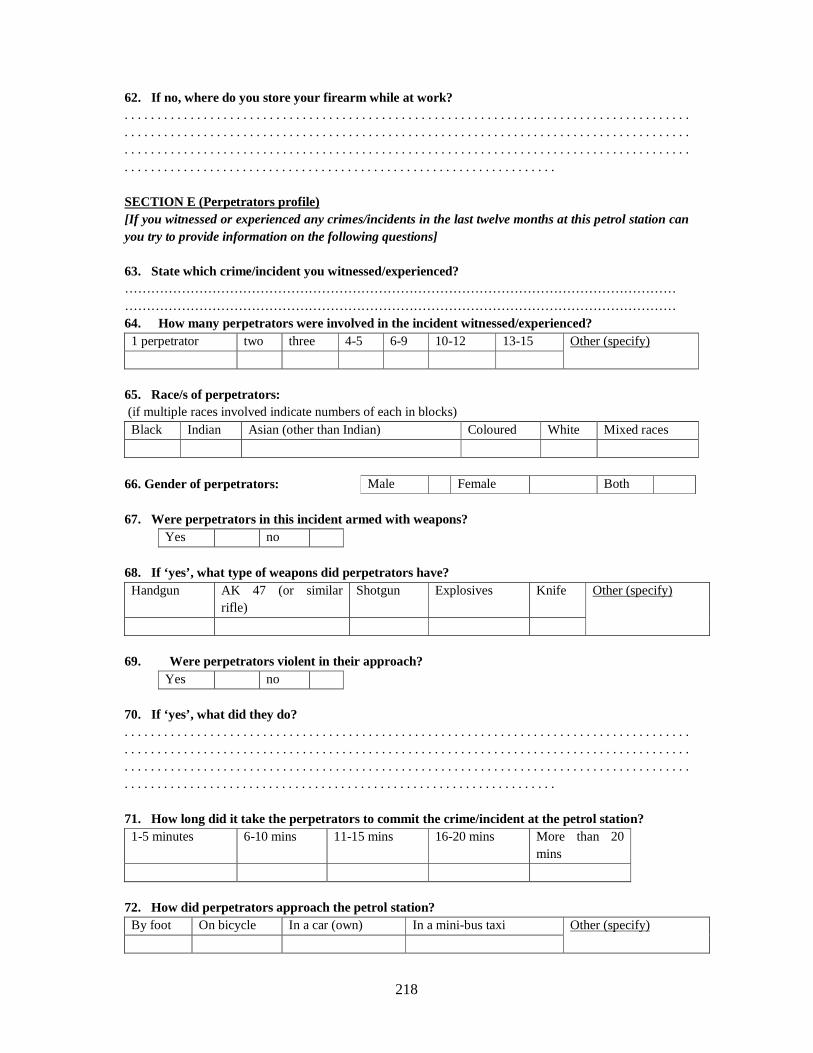
218
62. If no, where do you store your firearm while at work? . . . . . . . . . . . . . . . . . . . . . . . . . . . . . . . . . . . . . . . . . . . . . . . . . . . . . . . . . . . . . . . . . . . . . . . . . . . . . . . . . . . . . . . . . . . . . . . . . . . . . . . . . . . . . . . . . . . . . . . . . . . . . . . . . . . . . . . . . . . . . . . . . . . . . . . . . . . . . . . . . . . . . . . . . . . . . . . . . . . . . . . . . . . . . . . . . . . . . . . . . . . . . . . . . . . . . . . . . . . . . . . . . . . . . . . . . . . . . . . . . . . . . . . . . . . . . . . . . . . . . . . . . . . . . . . . . . . . . . . . . . . . . . . . . . . . . . . . . . . . . . . . . . . . . . . . . . . . . . . . . . . . SECTION E (Perpetrators profile) [If you witnessed or experienced any crimes/incidents in the last twelve months at this petrol station can you try to provide information on the following questions] 63. State which crime/incident you witnessed/experienced? ……………………………………………………………………………………………………………………………………………………………………………………………………………………………… 64. How many perpetrators were involved in the incident witnessed/experienced? 1 perpetrator two three 4-5 6-9 10-12 13-15 Other (specify)
65. Race/s of perpetrators: (if multiple races involved indicate numbers of each in blocks) Black Indian Asian (other than Indian) Coloured White Mixed races
66. Gender of perpetrators: Male Female Both 67. Were perpetrators in this incident armed with weapons?
Yes no 68. If ‘yes’, what type of weapons did perpetrators have? Handgun AK 47 (or similar
rifle) Shotgun Explosives Knife Other (specify)
69. Were perpetrators violent in their approach?
Yes no 70. If ‘yes’, what did they do? . . . . . . . . . . . . . . . . . . . . . . . . . . . . . . . . . . . . . . . . . . . . . . . . . . . . . . . . . . . . . . . . . . . . . . . . . . . . . . . . . . . . . . . . . . . . . . . . . . . . . . . . . . . . . . . . . . . . . . . . . . . . . . . . . . . . . . . . . . . . . . . . . . . . . . . . . . . . . . . . . . . . . . . . . . . . . . . . . . . . . . . . . . . . . . . . . . . . . . . . . . . . . . . . . . . . . . . . . . . . . . . . . . . . . . . . . . . . . . . . . . . . . . . . . . . . . . . . . . . . . . . . . . . . . . . . . . . . . . . . . . . . . . . . . . . . . . . . . . . . . . . . . . . . . . . . . . . . . . . . . . . . 71. How long did it take the perpetrators to commit the crime/incident at the petrol station? 1-5 minutes 6-10 mins 11-15 mins 16-20 mins More than 20
mins
72. How did perpetrators approach the petrol station? By foot On bicycle In a car (own) In a mini-bus taxi Other (specify)
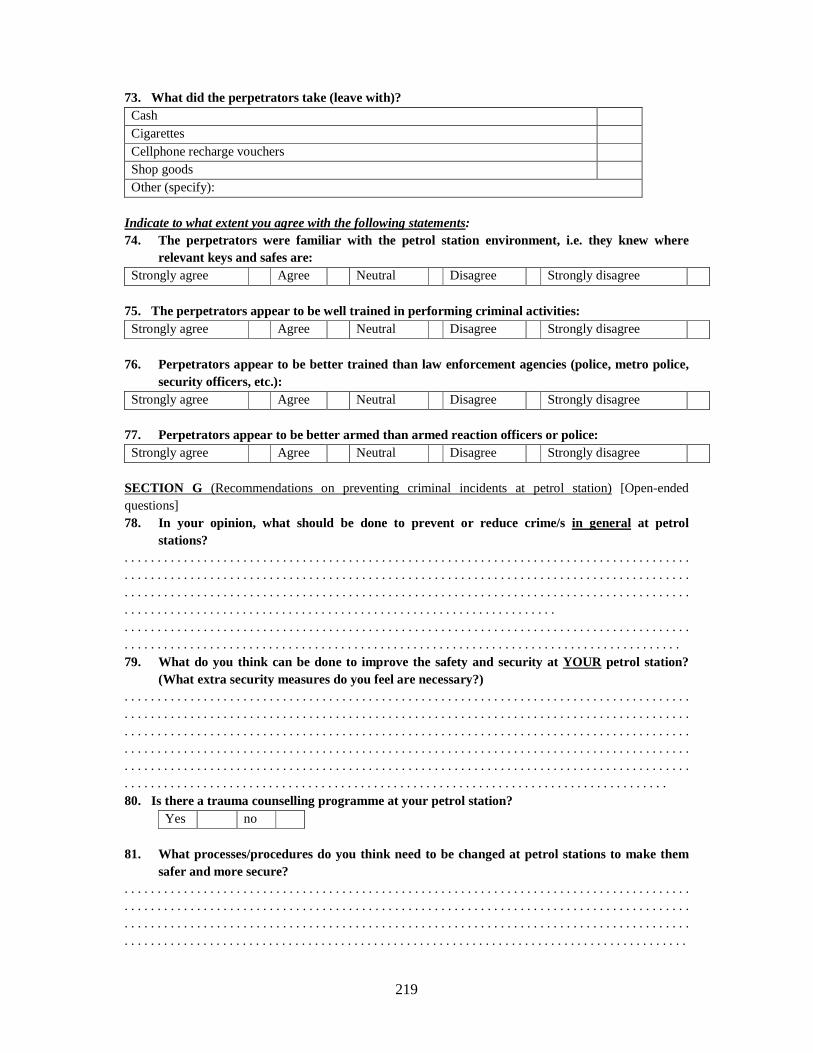
219
73. What did the perpetrators take (leave with)? Cash Cigarettes Cellphone recharge vouchers Shop goods Other (specify):
Indicate to what extent you agree with the following statements: 74. The perpetrators were familiar with the petrol station environment, i.e. they knew where
relevant keys and safes are: Strongly agree Agree Neutral Disagree Strongly disagree
75. The perpetrators appear to be well trained in performing criminal activities: Strongly agree Agree Neutral Disagree Strongly disagree
76. Perpetrators appear to be better trained than law enforcement agencies (police, metro police,
security officers, etc.): Strongly agree Agree Neutral Disagree Strongly disagree
77. Perpetrators appear to be better armed than armed reaction officers or police: Strongly agree Agree Neutral Disagree Strongly disagree
SECTION G (Recommendations on preventing criminal incidents at petrol station) [Open-ended questions] 78. In your opinion, what should be done to prevent or reduce crime/s in general at petrol
stations? . . . . . . . . . . . . . . . . . . . . . . . . . . . . . . . . . . . . . . . . . . . . . . . . . . . . . . . . . . . . . . . . . . . . . . . . . . . . . . . . . . . . . . . . . . . . . . . . . . . . . . . . . . . . . . . . . . . . . . . . . . . . . . . . . . . . . . . . . . . . . . . . . . . . . . . . . . . . . . . . . . . . . . . . . . . . . . . . . . . . . . . . . . . . . . . . . . . . . . . . . . . . . . . . . . . . . . . . . . . . . . . . . . . . . . . . . . . . . . . . . . . . . . . . . . . . . . . . . . . . . . . . . . . . . . . . . . . . . . . . . . . . . . . . . . . . . . . . . . . . . . . . . . . . . . . . . . . . . . . . . . . . . . . . . . . . . . . . . . . . . . . . . . . . . . . . . . . . . . . . . . . . . . . . . . . . . . . . . . . . . . . . . . . . . . . . . . . . . . . . . . . . . . . . . . . . . . . . . . . . . . . . . . . . . . . . . . . . . . . . . . . . . . . . . . . . . . . . . . . . . . . . . . . . . . . . . . . . . . . . . . . . . . . . . . . . . . . 79. What do you think can be done to improve the safety and security at YOUR petrol station?
(What extra security measures do you feel are necessary?) . . . . . . . . . . . . . . . . . . . . . . . . . . . . . . . . . . . . . . . . . . . . . . . . . . . . . . . . . . . . . . . . . . . . . . . . . . . . . . . . . . . . . . . . . . . . . . . . . . . . . . . . . . . . . . . . . . . . . . . . . . . . . . . . . . . . . . . . . . . . . . . . . . . . . . . . . . . . . . . . . . . . . . . . . . . . . . . . . . . . . . . . . . . . . . . . . . . . . . . . . . . . . . . . . . . . . . . . . . . . . . . . . . . . . . . . . . . . . . . . . . . . . . . . . . . . . . . . . . . . . . . . . . . . . . . . . . . . . . . . . . . . . . . . . . . . . . . . . . . . . . . . . . . . . . . . . . . . . . . . . . . . . . . . . . . . . . . . . . . . . . . . . . . . . . . . . . . . . . . . . . . . . . . . . . . . . . . . . . . . . . . . . . . . . . . . . . . . . . . . . . . . . . . . . . . . . . . . . . . . . . . . . . . . . . . . . . . . . . . . . . . . . . . . . . . . . . . . . . . . . . . . . . . . . . . . . . . . . . . . . . . . . . . . . . . . . . . . . . . . . . . . . . . . . . . . . 80. Is there a trauma counselling programme at your petrol station?
Yes no 81. What processes/procedures do you think need to be changed at petrol stations to make them
safer and more secure? . . . . . . . . . . . . . . . . . . . . . . . . . . . . . . . . . . . . . . . . . . . . . . . . . . . . . . . . . . . . . . . . . . . . . . . . . . . . . . . . . . . . . . . . . . . . . . . . . . . . . . . . . . . . . . . . . . . . . . . . . . . . . . . . . . . . . . . . . . . . . . . . . . . . . . . . . . . . . . . . . . . . . . . . . . . . . . . . . . . . . . . . . . . . . . . . . . . . . . . . . . . . . . . . . . . . . . . . . . . . . . . . . . . . . . . . . . . . . . . . . . . . . . . . . . . . . . . . . . . . . . . . . . . . . . . . . . . . . . . . . . . . . . . . . . . . . . . . . . . . . . . . . . . . . . . . . . . . . . . . . . . . . . . . . . . . . . . . . . . . . . . .

220
82. Do you think that petrol station employees are adhering to and implement basic security practices?
. . . . . . . . . . . . . . . . . . . . . . . . . . . . . . . . . . . . . . . . . . . . . . . . . . . . . . . . . . . . . . . . . . . . . . . . . . . . . . . . . . . . . .
. . . . . . . . . . . . . . . . . . . . . . . . . . . . . . . . . . . . . . . . . . . . . . . . . . . . . . . . . . . . . . . . . . . . . . . . . . . . . . . . . . . . . .
. . . . . . . . . . . . . . . . . . . . . . . . . . . . . . . . . . . . . . . . . . . . . . . . . . . . . . . . . . . . . . . . . . . . . . . . . . . . . . . . . . . . . .
. . . . . . . . . . . . . . . . . . . . . . . . . . . . . . . . . . . . . . . . . . . . . . . . . . . . . . . . . . . . . . . . . . . . . . . . . . . . . . . . . . . . 83. Are there any natural barriers (rivers, natural plantations, hills etc. around the petrol station?
Yes no 84. If ‘yes’, specify what types of natural barriers: . . . . . . . . . . . . . . . . . . . . . . . . . . . . . . . . . . . . . . . . . . . . . . . . . . . . . . . . . . . . . . . . . . . . . . . . . . . . . . . . . . . . . . . . . . . . . . . . . . . . . . . . . . . . . . . . . . . . . . . . . . . . . . . . . . . . . . . . . . . . . . . . . . . . . . . . . . . . . . . . . . . . . . . . . . . . . . . . . . . . . . . . . . . . . . . . . . . . . . . . . . . . . . . . . . . . . . . . . . . . . . . . . . . . . . . . . . . . . . . . . . . . . . . . . . . . . . . . . . . . . . . . . . . . . . . . . . . . . . . . . . . . . . . . . . . . . . . . . . . . . . . . . . . . . . . . . . . . . . . . . . . . 85. Are there easy escape routes (rail stations, high ways etc.) near the petrol station?
Yes no 86. If ‘yes’, specify what types of escape routes: . . . . . . . . . . . . . . . . . . . . . . . . . . . . . . . . . . . . . . . . . . . . . . . . . . . . . . . . . . . . . . . . . . . . . . . . . . . . . . . . . . . . . . . . . . . . . . . . . . . . . . . . . . . . . . . . . . . . . . . . . . . . . . . . . . . . . . . . . . . . . . . . . . . . . . . . . . . . . . . . . . . . . . . . . . . . . . . . . . . . . . . . . . . . . . . . . . . . . . . . . . . . . . . . . . . . . . . . . . . . . . . . . . . . . . . . . . . . . . . . . . . . . . . . . . . . . . . . . . . . . . . . . . . . . . . . . . . . . . . . . . . . . . . . . . . . . . . . . . . . . . . . . . . . . . . . . . . . . . . . . . . . . . . . . . . . . . . . . . . . . . OFFICE USE ONLY: Questionnaire number
Petrol station number
Area number
Consent form signed Yes no

221
ANNEXURE C: Consent form AGREEMENT: I hereby consent to: − being interviewed on the topic “AN EXAMINATION OF SECURITY MEASURES FOR THE
PROTECTION OF PETROL STATIONS: AN ANALYSIS OF CASE STUDIES IN GAUTENG”
− follow-up interviews if necessary; − the interviews being recorded in writing or by using tape recorder; − the use of data derived from these interviews by the interviewer in a research report as he deems
appropriate. I also understand that: − I am free to end my involvement or to cancel my consent to participate in the research at any time
should I want to; − information rendered up to the point of my termination of participation could, however, still be
used by the researcher; − anonymity is guaranteed by the researcher and data will under no circumstances be reported in
such a way as to reveal my identity; − I am free to determine that specific information that I reveal should not be recorded in writing; − no reimbursement will be made by the researcher for information rendered or for my participation
in this project; − I will in no way derive any personal benefit from taking part in this research project; − by signing this agreement I undertake to give honest answers to reasonable questions and not to
mislead the researcher; − I will receive the original copy of this agreement on signing it. I hereby acknowledge that the researcher/interviewer: − discussed the aims and objectives of this research project with me; − informed me about the contents of this agreement; − explained the implications of my signing this agreement; In co-signing this agreement the researcher undertakes to: − maintain confidentiality, anonymity, and privacy regarding the identity of the subject and
information rendered by the interviewee. ____________________________ _____________________________ (Interviewee signature) (Interviewer signature) ________________ ___________________ (Date) (Date) I, (interviewer signature)______________________ certify that I explained the contents of the above document.
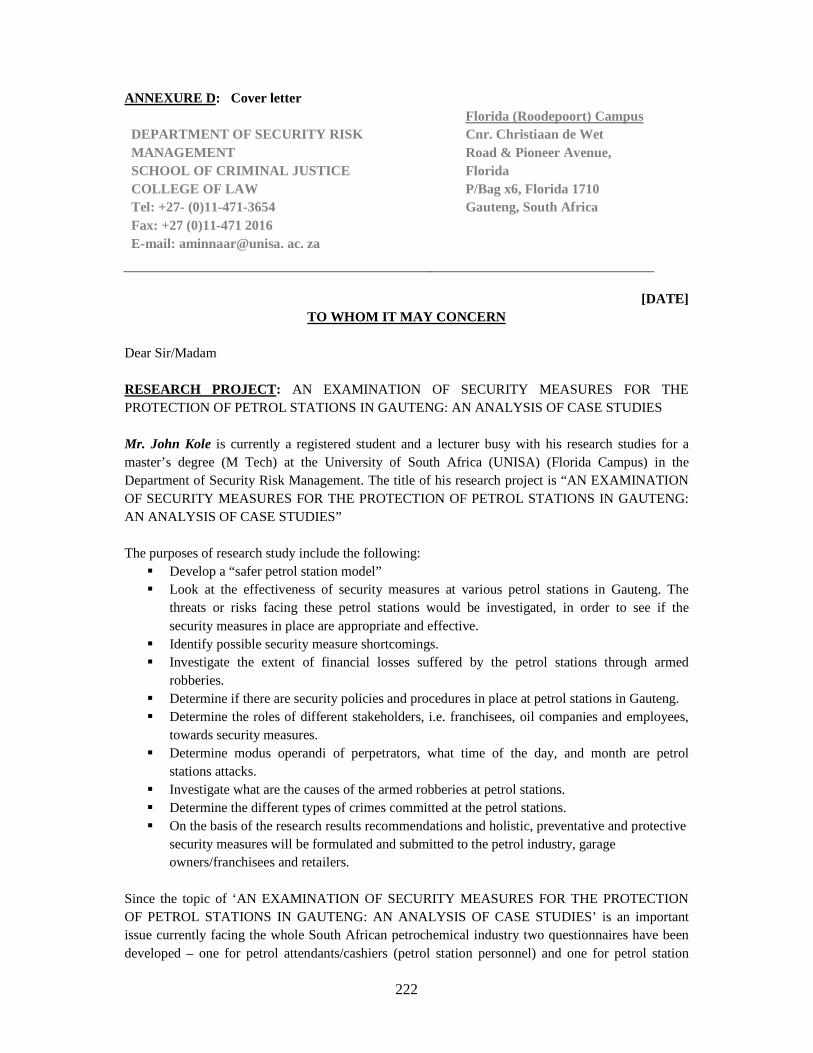
222
ANNEXURE D: Cover letter DEPARTMENT OF SECURITY RISK MANAGEMENT SCHOOL OF CRIMINAL JUSTICE COLLEGE OF LAW Tel: +27- (0)11-471-3654 Fax: +27 (0)11-471 2016 E-mail: aminnaar@unisa. ac. za
Florida (Roodepoort) Campus Cnr. Christiaan de Wet Road & Pioneer Avenue, Florida P/Bag x6, Florida 1710 Gauteng, South Africa
[DATE]
TO WHOM IT MAY CONCERN Dear Sir/Madam RESEARCH PROJECT: AN EXAMINATION OF SECURITY MEASURES FOR THE PROTECTION OF PETROL STATIONS IN GAUTENG: AN ANALYSIS OF CASE STUDIES Mr. John Kole is currently a registered student and a lecturer busy with his research studies for a master’s degree (M Tech) at the University of South Africa (UNISA) (Florida Campus) in the Department of Security Risk Management. The title of his research project is “AN EXAMINATION OF SECURITY MEASURES FOR THE PROTECTION OF PETROL STATIONS IN GAUTENG: AN ANALYSIS OF CASE STUDIES” The purposes of research study include the following:
� Develop a “safer petrol station model” � Look at the effectiveness of security measures at various petrol stations in Gauteng. The
threats or risks facing these petrol stations would be investigated, in order to see if the security measures in place are appropriate and effective.
� Identify possible security measure shortcomings. � Investigate the extent of financial losses suffered by the petrol stations through armed
robberies. � Determine if there are security policies and procedures in place at petrol stations in Gauteng. � Determine the roles of different stakeholders, i.e. franchisees, oil companies and employees,
towards security measures. � Determine modus operandi of perpetrators, what time of the day, and month are petrol
stations attacks. � Investigate what are the causes of the armed robberies at petrol stations. � Determine the different types of crimes committed at the petrol stations. � On the basis of the research results recommendations and holistic, preventative and protective
security measures will be formulated and submitted to the petrol industry, garage owners/franchisees and retailers.
Since the topic of ‘AN EXAMINATION OF SECURITY MEASURES FOR THE PROTECTION OF PETROL STATIONS IN GAUTENG: AN ANALYSIS OF CASE STUDIES’ is an important issue currently facing the whole South African petrochemical industry two questionnaires have been developed – one for petrol attendants/cashiers (petrol station personnel) and one for petrol station
223
manager/franchisee/operator. These have been sent out to all selected petrol stations in the Gauteng region. Research information plays an increasingly important role not only for management decisions but also for decisions affecting the industry as a whole. Your company’s participation in this study would therefore immeasurably add to the above research project since the wider the participation the more enriched the collected data would be. Accordingly could you please assist Mr Kole in the collection of research information for his Mtech studies by distributing the enclosed questionnaires (one for your petrol station personnel manager/franchisee/operator; five to any randomly selected petrol station employees - irrespective of the petrol station service or function the latter perform). Self-addressed envelopes are also enclosed for the convenient return post of the completed questionnaires. Your co-operation would be greatly appreciated. Please note that respondents are not required to identify themselves or the petrol station for which they work in anyway in the questionnaire. All responses are therefore completely confidential and will not be used in anyway that may identify the participant. If any verification is required you can contact Mr Kole’s research supervisor, Prof. Anthony Minnaar (Department of Security Risk Management, School of Criminal Justice, College of Law at UNISA) (Tel: (011) 471 3654) or (cell 083894 9485) (e-mail: aminnar@unisa. ac. za). Mr Kole’s contact details are as follows: Tel: (011) (011) 471 2912; Fax: (011) 471 2016) Cell: 082 253 4882
Thanking you Yours sincerely ______________________ (Prof) Anthony Minnaar Head of Department
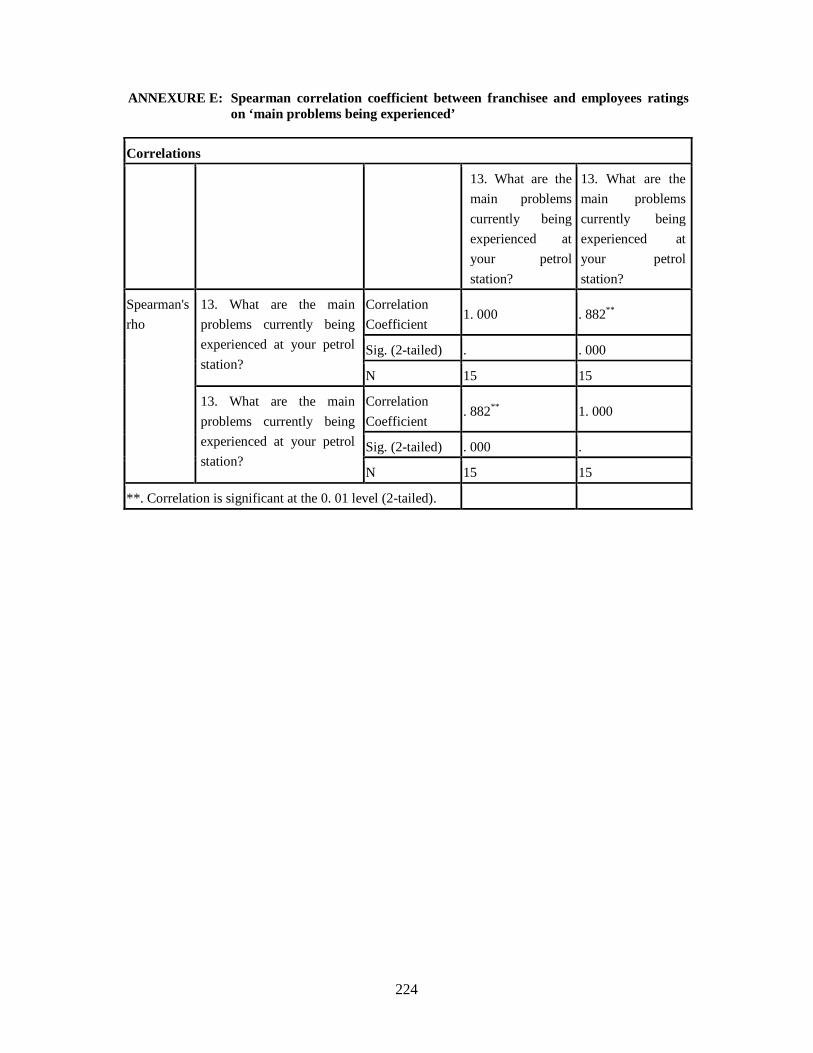
224
ANNEXURE E: Spearman correlation coefficient between franchisee and employees ratings on ‘main problems being experienced’
Correlations
13. What are the
main problems
currently being
experienced at
your petrol
station?
13. What are the
main problems
currently being
experienced at
your petrol
station?
Spearman's
rho
13. What are the main
problems currently being
experienced at your petrol
station?
Correlation
Coefficient 1. 000 . 882**
Sig. (2-tailed) . . 000
N 15 15
13. What are the main
problems currently being
experienced at your petrol
station?
Correlation
Coefficient . 882** 1. 000
Sig. (2-tailed) . 000 .
N 15 15
**. Correlation is significant at the 0. 01 level (2-tailed).
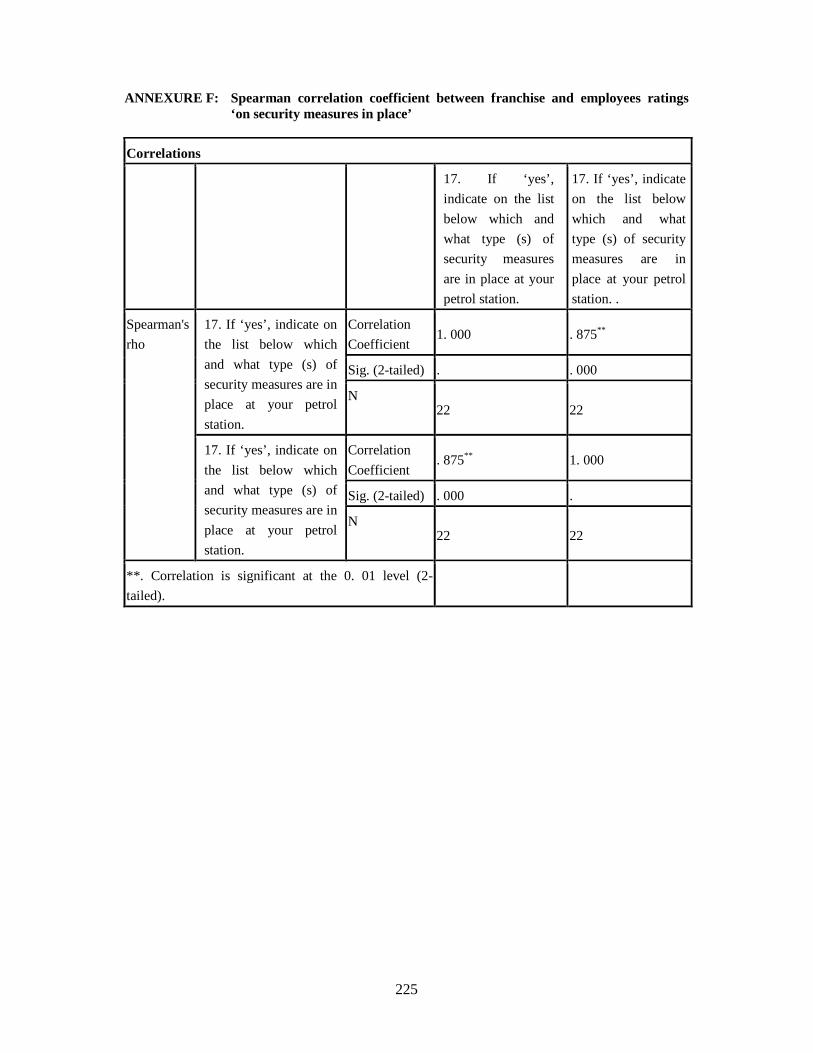
225
ANNEXURE F: Spearman correlation coefficient between franchise and employees ratings ‘on security measures in place’
Correlations
17. If ‘yes’,
indicate on the list
below which and
what type (s) of
security measures
are in place at your
petrol station.
17. If ‘yes’, indicate
on the list below
which and what
type (s) of security
measures are in
place at your petrol
station. .
Spearman's
rho
17. If ‘yes’, indicate on
the list below which
and what type (s) of
security measures are in
place at your petrol
station.
Correlation
Coefficient 1. 000 . 875**
Sig. (2-tailed) . . 000
N 22 22
17. If ‘yes’, indicate on
the list below which
and what type (s) of
security measures are in
place at your petrol
station.
Correlation
Coefficient . 875** 1. 000
Sig. (2-tailed) . 000 .
N 22 22
**. Correlation is significant at the 0. 01 level (2-
tailed).
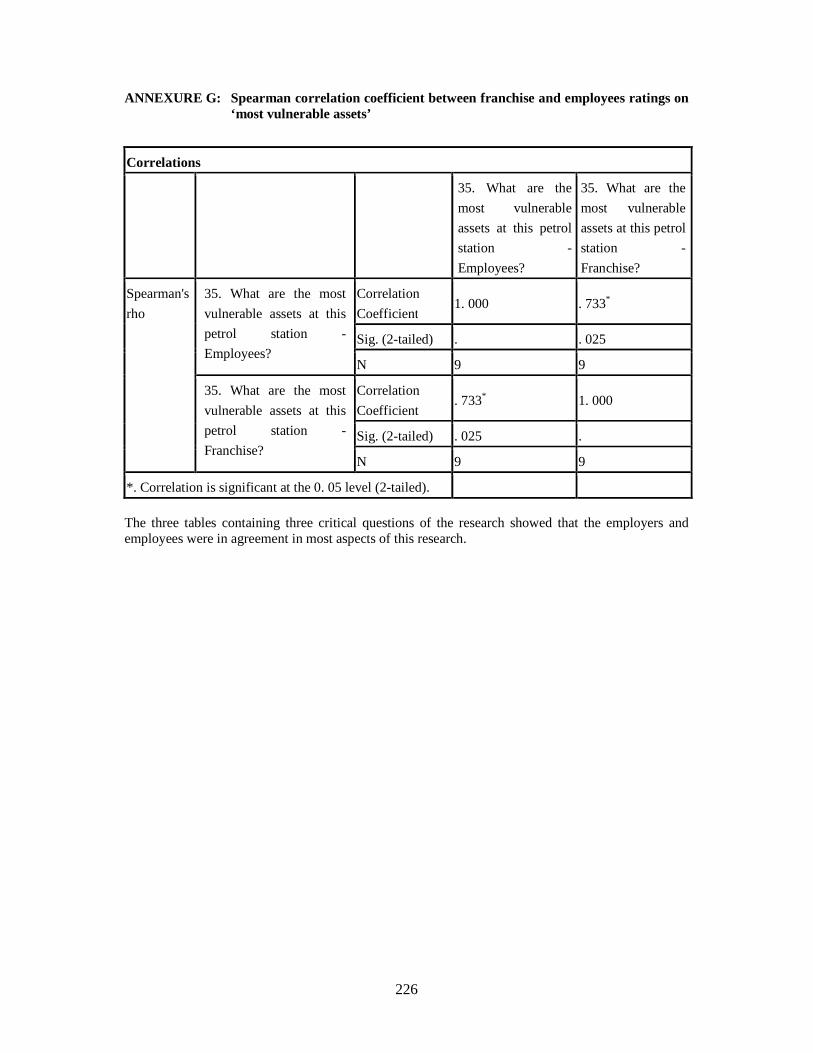
226
ANNEXURE G: Spearman correlation coefficient between franchise and employees ratings on ‘most vulnerable assets’
Correlations
35. What are the
most vulnerable
assets at this petrol
station -
Employees?
35. What are the
most vulnerable
assets at this petrol
station -
Franchise?
Spearman's
rho
35. What are the most
vulnerable assets at this
petrol station -
Employees?
Correlation
Coefficient 1. 000 . 733*
Sig. (2-tailed) . . 025
N 9 9
35. What are the most
vulnerable assets at this
petrol station -
Franchise?
Correlation
Coefficient . 733* 1. 000
Sig. (2-tailed) . 025 .
N 9 9
*. Correlation is significant at the 0. 05 level (2-tailed).
The three tables containing three critical questions of the research showed that the employers and employees were in agreement in most aspects of this research.