examination of cash nutrition assistance program benefits ... · noncash benefits versus ......
TRANSCRIPT

Examination of Cash Nutrition AssistanceProgram Benefits in Puerto Rico
Food and Nutrition ServiceU.S. Department of Agriculture 3101 Park Center Drive Alexandria, VA 22302
2015

USDA is an Equal Opportunity Provider

Examination of Cash Nutrition Assistance Program Benefits in Puerto Rico
Final Report
Authors: Carole Trippe
Rachel Gaddes Alexandra Suchman
Kate Place (Mathematica) James Mabli (Mathematica)
Chrystine Tadler Teresa DeAtley
Brian Estes
August 6, 2015
Submitted to: Office of Policy Support Food and Nutrition Service U.S. Department of Agriculture 3101 Park Center Drive Alexandria, VA 22302 Project Officer: Bob Dalrymple
Submitted by: Insight Policy Research, Inc. 1901 N. Moore Street Suite 1100 Arlington, VA 22209 Project Director: Carole Trippe
Suggested Citation: Trippe, C., Gaddes, R., Suchman, A., Place, K., Mabli, J., Tadler, C., DeAtley, T., & Estes, B. (2015). Examination of Cash Nutrition Assistance Program Benefits in Puerto Rico. Prepared by Insight Policy Research under Contract No. AG-3198-C-14-0006. Alexandria, VA: U.S. Department of Agriculture, Food and Nutrition Service.

ACKNOWLEDGEMENTS
This report was prepared by Insight Policy Research, Inc. under Contract Number AG-3198-C-14-0006 for the U.S. Department of Agriculture’s Food and Nutrition Service (FNS). Many people contributed in meaningful ways to this report. As project officer from FNS, Bob Dalrymple guided the project from beginning to end. Kathryn Law and many others from FNS provided helpful comments on the report. Eric Ratchford, Regional Director at FNS’ Mid-Atlantic Regional Office, and the Office of the Assistant Secretary for Planning and Evaluation at the U.S. Department of Health and Human Services provided useful materials and consultation for the study.
We are especially grateful to the officials of Puerto Rico’s Administración de Desarrollo Socioeconómico de la Familia (ADSEF) for their support and help throughout the project and for providing us with crucial information and data for use in our study. In particular, we would like to recognize Marta Elsa Fernández Pabellón, Administrator of ADSEF; Jenice M. Vázquez Pagán, Esq., Deputy Administrator; Magdalena Arana Frau, Esq., Legal Affairs Director; Wilmer Lebrón Otero, Auxiliary Administrator of Operational Services; Aura Rosa, Director, Unit for Retailer Control and Inspection; María Cristina Pacheco Alcalá, Consultant; Mildred Villegas, NAP Director; Yelitza Amaro, Coordinator, Mi PAN Nutritivo; Nefatalí Ojeda Álvarez, Office of Information Systems Director; and Luis Leduc and Omar Flores, Information Technology Consultants. We are also grateful to Maribel López Méndez and Carlos Ramírez of EVERTEC for providing us with useful information on the EBT process and access to EBT transaction data.
We would also like to acknowledge many people and organizations in Puerto Rico who assisted with our data collection efforts. As consultants to Insight, Shiara M. Francisquini Oquendo, Coral M. Odiot Rivera, and Luis Gabriel Nieves offered skilled data collection efforts, on-the-ground logistics support, and acted as our liaisons throughout Puerto Rico. We also thank the team from Ipsos, the local survey research firm in Puerto Rico, for conducting and ensuring a successful survey and focus group data collection effort. The excellent team includes Esteban Rivera, the survey staff, and local moderators. Many community-based organizations generously provided information about the NAP population and also recruited participants and hosted focus groups; they served as a crucial link to connect us with NAP participants for this study. Our thanks to Bill’s Kitchen, Estancia Corazón, Centros Sor Isolina Ferré, Incubadora Bieke, and La Fondita de Jesús for their critical support. We are also grateful for the cooperation of the group residential facilities, retailers, and two retailer associations for participating in interviews and sharing their opinions and insights.
We are grateful to Carol Olander and Bill Kluxen for their thoughtful review of this report and very helpful comments. Finally, many Insight colleagues provided invaluable review, research assistance, and advice. Anne Peterson contributed to virtually every aspect of the study and provided helpful advice and review throughout the project. Meg Tucker contributed to the survey design; Claire Wilson conducted a very helpful final review; and Rebekah Myers, Elaine Wilcox-Cook, and Elaine Ayo provided research assistance on all aspects of the report. Dar Haddix edited the report. Daven Ralston provided production services. We are also thankful to additional individuals from Mathematica Policy Research, including Franco Solleza and Laura Castner, who provided their programming, quality assurance, and review skills for the extant data analysis on geographic access to food retailers and benefit redemption patterns.

TABLE OF CONTENTS
EXECUTIVE SUMMARY ............................................................................................................................................ i
A. STUDY OVERVIEW .............................................................................................................................................. i B. SUMMARY OF FINDINGS .................................................................................................................................. ii C. SUMMARY AND CONCLUSIONS ..................................................................................................................... viii
I. INTRODUCTION ............................................................................................................................................. 1
A. BACKGROUND ON PUERTO RICO’S ECONOMY, FEDERAL ASSISTANCE RECEIVED, AND NAP PARTICIPANT CHARACTERISTICS ...................................................................................................................... 2
B. ORGANIZATION OF THE REPORT .................................................................................................................... 15
II. STUDY METHODOLOGY ............................................................................................................................... 16
A. STUDY METHODS ............................................................................................................................................ 16 B. STUDY CONSIDERATIONS ............................................................................................................................... 23
III. HISTORY AND PURPOSE OF CASH PORTION OF NAP BENEFITS .................................................................... 25
A. NUTRITION ASSISTANCE UNDER FEDERAL FOOD STAMP PROGRAM: 1973–1982 ........................................ 25 B. TRANSITION TO BLOCK GRANT: 1982–1999 ................................................................................................... 26 C. TRANSITION TO EBT WITH 100-PERCENT CASH REDEMPTION: 1999–2000 .................................................. 27 D. TRANSITION TO 75-PERCENT NONCASH AND 25-PERCENT CASH REDEMPTION: 2001 ................................. 29 E. RECENT STUDIES ON USE OF 25-PERCENT CASH PORTION OF BENEFIT ........................................................ 30
IV. ACCESS TO RETAILERS AND NONCASH BENEFIT REDEMPTION PATTERNS AMONG NAP PARTICIPANTS ................................................................................................................................. 32
A. NAP PARTICIPANTS’ GEOGRAPHIC ACCESS TO CERTIFIED RETAILERS ............................................................ 32 B. NAP BENEFIT REDEMPTION PATTERNS BASED ON TRANSACTION ANALYSIS ................................................ 36 C. NAP PARTICIPANT PERSPECTIVES ON ACCESS TO CERTIFIED RETAILERS ....................................................... 46 D. RETAILER PERSPECTIVES ON POTENTIAL BARRIERS TO REDEEMING NAP BENEFITS ..................................... 54 E. CASH PORTION OF BENEFIT REDEMPTION PATTERNS: FINDINGS FROM THE EBT TRANSACTION DATA ...... 57 F. NAP PARTICIPANTS’ REDEMPTION PRACTICES FOR THE WITHDRAWN CASH PORTION OF BENEFITS .......... 61 G. AWARENESS OF RESTRICTIONS ON ALLOWABLE NAP PURCHASES ............................................................... 65 H. REPORTED PURCHASES MADE WITH THE WITHDRAWN CASH PORTION OF NAP BENEFITS ......................... 67
VI. POTENTIAL IMPACTS OF DISCONTINUING THE CASH PORTION OF NAP BENEFITS ................................... 73
A. ACCESS TO FOOD ITEMS ................................................................................................................................. 73 B. USE OF THE CASH PORTION OF NAP BENEFITS .............................................................................................. 75 C. EFFECTS OF THE DISCONTINUATION OF THE CASH PORTION OF NAP BENEFITS ON NAP PARTICIPANTS
AND RETAILERS ............................................................................................................................................... 76 D. CONCLUSIONS ................................................................................................................................................ 82
ABBREVIATIONS AND ACRONYMS ................................................................................................................... AA-1
REFERENCES ........................................................................................................................................................ R-1
APPENDIX A: DETAILED DESCRIPTION OF STUDY METHODS ...............................................................................A-1
A.1. EXTANT DATA ANALYSIS METHODOLOGY................................................................................................ A-1 A.2. NAP CASH BENEFITS HOUSEHOLD SURVEY METHODOLOGY ................................................................. A-14 A.3. STAKEHOLDER ANALYSIS METHODOLOGY ............................................................................................. A-22
APPENDIX B: SUPPLEMENTAL TABLES ................................................................................................................. B-1
B.1. PUERTO RICO POPULATION: DEMOGRAPHIC AND INCOME CHARACTERISTICS ..................................... B-1
B.2. FEDERAL PAYMENTS RECEIVED BY PUERTO RICO COMPARED WITH THE UNITED STATES ..................... B-9 B.3. NAP PARTICIPANT POPULATION: DEMOGRAPHIC AND INCOME CHARACTERISTICS ............................ B-13 B.4. EXTANT DATA ANALYSIS TABLES ............................................................................................................ B-18 B.5. NAP CASH BENEFITS HOUSEHOLD SURVEY TABLES ............................................................................... B-28
APPENDIX C: SURVEY AND STAKEHOLDER DATA COLLECTION INSTRUMENTS .................................................... C-1
C.1. NAP CASH BENEFITS HOUSEHOLD SURVEY .............................................................................................. C-1 C.2. NAP FOCUS GROUP GUIDE ..................................................................................................................... C-14 C.3. RETAILER INTERVIEW GUIDES ................................................................................................................ C-19 C.4. CBO INTERVIEW GUIDE .......................................................................................................................... C-30 C.5. GROUP RESIDENTIAL FACILITY INTERVIEW GUIDE ................................................................................. C-33
APPENDIX D: NAP CERTIFICATION AND BENEFIT REDEMPTION PROCESS .......................................................... D-1
D.1. NAP CERTIFICATION PROCESS AND COSTS FOR RETAILERS ..................................................................... D-1 D.2. NAP BENEFIT REDEMPTION PROCESS ...................................................................................................... D-3

LIST OF TABLES
Table I.1. Study Objectives ..................................................................................................... 1 Table I.2. Percentage of Population in Poverty by Subgroup in Puerto Rico and the United States, 2013 ................................................................................................. 4 Table I.3. Actual Federal Spending in Puerto Rico Compared With Estimated Federal
Spending Under Puerto Rico Statehood for Selected Programs .......................... 11 Table I.4. Comparison of NAP and SNAP Selected Program Characteristics, FY 2014 ......... 12 Table II.1. Crosswalk of Study Objectives and Data Collection Methods .............................. 16 Table II.2. Sample Size and Number of Respondents by Substrata....................................... 18 Table IV.1. Median Distance (in Miles) to Nearest NAP Retailer by Store Type and
Unit Subgroup ....................................................................................................... 33 Table IV.2. Median Number of NAP Retailers Within Selected Distance of NAP Units by
Store Type and Urban/Rural Status ...................................................................... 35 Table IV.3. Median Number of NAP Retailers Within Selected Distance of NAP Units by
Subgroup and Urban/Rural Status ........................................................................ 35 Table IV.4. Median Distance (in Miles) to Nearest Retailer Where Participants Redeem
Noncash Benefits Versus Median Distance to Nearest Retailer by Type of Retailer and Urban/Rural Status ........................................................................................ 38
Table IV.5. Average Number of Transactions and Average Transaction Amount of Noncash Benefits by Unit Subgroups .................................................................................. 43
Table IV.6. Average Number of Transactions and Average Transaction Amount of Noncash Benefits by Degree of Geographic Access to Retailers ......................................... 43
Table IV.7. Average Number of Transactions and Average Transaction Amount of Noncash Benefits by Unit Location ...................................................................................... 44
Table IV.8. Cumulative Percentage Noncash Benefits Redeemed by Time Since Issuance Across Subgroups .................................................................................................. 45
Table IV.9. Cumulative Percentage of Benefits Redeemed by Week and Unit Location ....... 45 Table IV.10. Cumulative Percentage of Benefits Redeemed by Week and Degree
of Access ............................................................................................................... 46 Table IV.11. Value of Unspent Noncash Benefit at End of Issuance Month by Degree
of Access to Certified Retailers ............................................................................. 46 Table V.1. Percentage of Total Benefits Redeemed by Transaction Type ............................. 58 Table V.2. Average Number and Amount of Cash Transactions and Average Total Monthly
Redemption by Degree of Access ......................................................................... 60 Table V.3. Cumulative Percentage of Cash Portion Redeemed by Week and Degree
of Access ............................................................................................................... 61 Table V.4. Value of Unredeemed Cash Issuance at End of Month by Degree of Access to
Certified Retailers ................................................................................................. 61 Table V.5. Percentage of NAP Participants Using Cash Benefits To Buy Food Items
by Subgroup .......................................................................................................... 70 Table V.6. Reported Nonfood Items Purchased With The Withdrawn Cash Portion of NAP
Benefits by Subgroup ............................................................................................ 72

Table VI.1. Percentage of Cash Benefits Redeemed by Unit Subgroup ................................. 75 Table VI.2. Percentage of NAP Participants Who Said It Would Be More Difficult To Purchase
Food Or Essential Nonfood Products if Cash Portion of Benefits Were Discontinued by Subgroup .................................................................................... 78
Table VI.3. Distribution of Puerto Rico NAP Units by Poverty and Source of Income by Subgroup .......................................................................................................... 81
Table A.1.a. Retailer Categories From Original and Reclassified Data .................................... A-3 Table A.1.b. Distribution of NAP Unit Subgroups, June 2014 .................................................. A-6 Table A.1.c. Geocoding Results of NAP Unit Addresses .......................................................... A-8 Table A.1.d. Geocoding Results of NAP Retailer Addresses .................................................... A-8 Table A.2.a. Sampling Frame Count Versus Sample Sizes by Substrata ................................ A-16 Table A.2.b. Sample Size Versus Final Respondents by Substrata ......................................... A-18 Table A.2.c. Summary of Data Collection Results by Final Status ......................................... A-19 Table A.2.d. Response and Cooperation Rates ...................................................................... A-19 Table A.2.e. 95-Percent Confidence Interval Half-Widths for Percentages for Entire Sample
or Subgroups ...................................................................................................... A-21 Table A.3.a. Focus Group Member Demographic Characteristics ......................................... A-23 Table A.3.b. Retailer Characteristics ...................................................................................... A-24 Table A.3.c. Stakeholder Data Collected ............................................................................... A-25 Table A.3.d. Number of Retailers and NAP Participant Focus Groups by Study Region ....... A-25 Table A.3.e. Site Visit Activities .............................................................................................. A-27 Table A.3.f. Coding Scheme ................................................................................................... A-28 Table B.1.a. Demographic, Labor Force, Income, and Poverty Characteristics of Individuals in
Puerto Rico, Mississippi, and the United States, 2013 (In Percent Unless Otherwise Noted) ................................................................................................ B-1
Table B.1.b. Household Composition and Income of Households and Families in Puerto Rico, Mississippi, and the United States, 2013 (In Percent Unless Otherwise Noted) ................................................................................................ B-4
Table B.1.c. Characteristics of Individuals With Incomes Below 100 Percent of the Federal Poverty Level in Puerto Rico, Mississippi, and the United States, 2013 (In Percent Unless Otherwise Noted) .................................................................. B-5
Table B.1.d. Percentage of Key Population Subgroups in Poverty in Puerto Rico, Mississippi, and the United States, 2013 (Row Percents) ....................................................... B-6
Table B.1.e. Unemployment Rate by Age and Other Characteristics of Individuals in Puerto Rico, Mississippi, and the United States, 2013 .................................................... B-7
Table B.1.f. Annual Consumer Expenditures in Puerto Rico and the United States for Five Major Categories, 2013 ........................................................................................ B-8
Table B.2.a. Federal Government Expenditures for Direct Payments to Individuals in Puerto Rico and the United States, FY 2010 (Annual Federal Expenditures in Thousands of Dollars, per Capita Amounts in Actual Dollars)……………….……………………………B-9
Table B.2.b. Federal Government Grants-in-Aid to Puerto Rico and the United States, FY 2013 (Annual Federal Obligations in Thousands of Dollars, per Capita Amounts in Actual Dollars) .................................................................................................... B-10

Table B.3.a. Distribution of NAP and SNAP Units by Demographic Characteristics and Locality (In Percent Unless Otherwise Noted) ............................................ B-13
Table B.3.b. Distribution of NAP and SNAP Units by Poverty, Income, and Employment Characteristics (In Percent Unless Otherwise Noted) ....................................... B-14
Table B.3.c. Distribution of NAP Units by Poverty and Income Characteristics by Subgroup (Column Percents) ............................................................................................. B-15
Table B.3.d. Distribution of NAP Units by Poverty, Income, and Employment Characteristics by Subgroup (Row Percents) .............................................................................. B-16
Table B.3.e. Puerto Rico NAP Maximum Monthly Benefit Amounts by 75-Percent Noncash and 25-Percent Cash Portions, FY 2008–FY 2014 .............................................. B-17
Table B.4.a. Median Distance (in Miles) to Nearest Retailer Where Participants Redeem Benefits Versus Median Distance to Nearest Retailer by Type of Retailer and Unit Subgroup .................................................................................................... B-18
Table B.4.b. Average Transaction Amount and Average Total Monthly Redemption by Store Type .......................................................................................................... B-19
Table B.4.c. Average Number of Cash Transactions, Average Cash Transaction Amount, and Average Total Monthly Cash Redemption by Unit Subgroup and Transaction Type ................................................................................................ B-20
Table B.4.d. Average Cash Transaction Amount by Unit Subgroups and Transaction Type Including and Excluding Units With Zero Transactions ..................................... B-21
Table B.4.e. Average Number of Transactions, Average Transaction Amount, and Average Total Monthly Redemption by Level of Access (Defined by the Median Distance to Supermarkets, Superstores, and Large Grocery Stores) ............................... B-22
Table B.4.f. Distribution of Average Number of Monthly Transactions per Unit by Transaction Type ................................................................................................ B-23
Table B.4.g. Minimum Percentage of Total NAP Monthly Benefit (Cash and Noncash) Redeemed for EBT Food Purchases at a Certified Retailer by Unit-Month ....... B-24
Table B.4.h. Cumulative Percentage of Cash Portion Redeemed by Week and by Unit Subgroups .................................................................................................. B-27
Table B.5.a. Participant Decisions on Where To Shop........................................................... B-28 Table B.5.b. Access to Certified Retailers and Use of EBT Benefits ....................................... B-30 Table B.5.c. Access to Noncertified Retailers ........................................................................ B-31 Table B.5.d. Access to Cash Portion of Benefits .................................................................... B-32 Table B.5.e. Use of Cash Portion of Benefits ......................................................................... B-34 Table B.5.e.1 Use of Cash Portion of Benefits by Percent of Total NAP Participants ............. B-35 Table B.5.f. Impact of Removing Cash Portion of Benefits ................................................... B-36 Table B.5.g. Awareness of Regulations .................................................................................. B-41 Table D.1.a. NAP Certification Process and Costs for Retailers ............................................... D-1 Table D.1.b. NAP Certification Process and Costs for Retail Stores That Are Corporations .... D-2

LIST OF FIGURES
Figure E.1. Distribution of Distance (in Miles) to Nearest NAP Certified Retailer by Store Type ............................................................................................................... iv
Figure E.2. Percentage of NAP Participants Using Withdrawn Cash Benefits for Nonfood Items by Type of Product ........................................................................................ vi
Figure I.1. Median Household Income in Puerto Rico, Mississippi, and the United States, 2013 ................................................................................................. 3
Figure I.2. Poverty Rate, Unemployment Rate, and Labor Force Participation Rate in Puerto Rico, Mississippi, and the United States, 2013 ........................................... 4
Figure I.3. Federal Spending for Direct Payments and Grants in Puerto Rico and the United States per Capita, 2010 ............................................................................... 6
Figure I.4. Federal Spending for Major Programs To Assist Low-Income Residents of Puerto Rico and the United States per Capita ........................................................ 8
Figure I.5. Federal Spending for Nutrition Assistance Programs in Puerto Rico and the United States per Capita, FY 2013 ........................................................................ 10
Figure I.6. Percentage of NAP and SNAP Units by Income Characteristics ........................... 13 Figure I.7. Percentage of NAP Units With Zero Income by Subgroup, June 2014 ................. 14 Figure I.8. Percentage of NAP and SNAP Units by Selected Subgroup Characteristics ......... 15 Figure II.1. Map of Puerto Rico Showing Five Study Regions ................................................. 19 Figure II.2. Distribution of Retailers by Store Type ................................................................. 22 Figure III.1. Major Milestones in the History of The Cash Portion of Puerto Rico’s Nutrition
Assistance Program ............................................................................................... 25 Figure IV.1. Distribution of Distance (in Miles) to Nearest NAP Certified Retailer by
Store Type ............................................................................................................. 33 Figure IV.2. Distribution of Distance (in Miles) to Nearest Retailer Where Participants
Redeem Benefits Versus Distance to Nearest Retailer ......................................... 36 Figure IV.3. Median Distance (in Miles) to Nearest Retailer Where Participants Redeem
Benefits Versus Median Distance to Nearest Retailer by Type of Retailer .......... 37 Figure IV.4. Number of Transactions Made per Month ........................................................... 39 Figure IV.5. Average Transaction Amount ............................................................................... 40 Figure IV.6. Percentage of Noncash Transactions Made at Different Types of
Certified Retailers ................................................................................................. 41 Figure IV.7. Percentage of Noncash Benefits Spent by Type of Certified Retailer .................. 42 Figure IV.8. Type of Certified Store Where NAP Participants Bought Most of Their Food
by Subgroup .......................................................................................................... 47 Figure IV.9. Percentage of NAP Participants Who Shopped at Uncertified Retailers With the
Cash Portion of Their NAP Benefits by Location ................................................... 48 Figure IV.10. Type of Uncertified Store Where NAP Participants Shopped Using the Cash
Portion of Their NAP Benefits ............................................................................... 49 Figure IV.11. Mode of Travel to Certified Retailers Where NAP Participants Bought Most of
Their Food by Location.......................................................................................... 51 Figure IV.12. Ease of Traveling to Retailers by Type .................................................................. 53

Figure IV.13. Reported Ease or Difficulty of NAP Participants Traveling to Certified Retailers by Location and Unit Characteristics .................................................................... 53
Figure V.1. Percentage of Cash Benefit Redeemed as EBT Food Purchases Versus Cash Withdrawals by Unit Subgroup ............................................................................. 59
Figure V.2. Percentage of NAP Participants Who Said They Withdrew Cash From Their NAP Benefit Accounts in Last 30 Days .......................................................................... 62
Figure V.3. Percentage of Participants Who Reported Difficulty Withdrawing NAP Cash Benefits at ATM or Certified Retailer .................................................................... 63
Figure V.4. Percentage of NAP Participants Who Withdrew NAP Cash in the Last 30 Days by How Often They Spent It at a Certified Store .................................................. 65
Figure V.5. Percentage of NAP Participants Reporting Awareness of Purchase Restrictions ............................................................................................ 66
Figure V.6. Percentage of NAP Participants Using Cash Benefits to Buy Food and Nonfood Items ...................................................................................................... 68
Figure V.7. Percentage of NAP Participants Purchasing Any Food Items or Nonfood Items With Cash Portion of NAP Benefits ....................................................................... 69
Figure V.8. Percentage of NAP Participants Using Withdrawn Cash Benefits for Nonfood Items by Type of Product ...................................................................................... 71
Figure A.1.a. Distribution of Certified Retailers by Store Type ................................................. A-4 Figure A.3.a. Study Regions ..................................................................................................... A-22 Figure B.4.a. Average Cash Transaction Amount .................................................................... B-25 Figure B.4.b. Number of Cash Transactions Made per Month by Unit-Month ...................... B-26 Figure B.5.a. Types of Food Purchased in Last 30 Days at Certified Retailers ........................ B-42

Examination of Cash Nutrition Assistance Program Benefits in Puerto Rico
Page i
EXECUTIVE SUMMARY
The Nutrition Assistance Program (NAP) provides critical nutrition support for low-income residents of Puerto Rico, issuing a monthly benefit that includes both cash and noncash portions. NAP households must redeem at least 75 percent of their benefits electronically through electronic benefit transfer (EBT) at certified retailers, and may redeem the remaining portion (up to 25 percent) in cash. The entire benefit (both the noncash and cash portions) is supposed to be used only for the purchase of eligible food items.1 The purpose of the cash portion is to give participants with limited access to certified retailers a way to purchase food. In February 2014, the Agricultural Act of 2014 (P. L. 113–79, commonly known as the 2014 Farm Bill) reauthorized the NAP block grant and included a provision to phase out the cash portion of the NAP benefit coupled with an equivalent increase in the noncash portion (Agricultural Act of 2014, 2014, § 4025).
The 2014 Farm Bill also mandated a study to assess the potential adverse effects for both participants and food retailers of replacing the 25-percent cash portion with noncash benefits. This study examines the history and purpose of the cash portion, barriers to redeeming the noncash portion, and use of the cash portion for the purchase of nonfood and other prohibited items.
A. STUDY OVERVIEW
This study included the following complementary data collection methods: meetings with administrators from the U.S. Department of Agriculture’s (USDA) Food and Nutrition Service (FNS) and NAP agencies, a literature review, 18 NAP participant focus groups, 43 in-depth interviews with food retailers and other stakeholders, a telephone survey of NAP participants, and an extant data analysis to examine geographic access to certified retailers and participants’ redemption patterns.
The table below outlines the data collection methods used to address each of the study objectives specified by the legislation.
Study Objective Data Collection Sources and Method 1. Examine the history and purpose of distributing a
portion of the NAP monthly benefit in the form of cash and obtain background information on the economic environment of Puerto Rico, the amount of Federal assistance received, and the characteristics of NAP participants.
Meetings with FNS, Puerto Rico’s Administración de Desarrollo Socioeconómico de la Familia (ADSEF), FNS’ Mid-Atlantic Regional Office, and U.S. Department of Health and Human Services
Review of existing studies, data sources, and other documents
2. Examine the current barriers to redeeming the noncash portion of the NAP benefit for program participants and retailers.
Extant data from ADSEF, including NAP participant data, NAP retailer data, and EBT transaction data
NAP cash benefits household survey In-person interviews and focus groups with key
stakeholders 3. Examine the current use of the cash portion of the
NAP benefit for the purchase of nonfood and other prohibited items.
NAP cash benefits household survey In-person interviews and focus groups with key
stakeholders 4. Identify and assess potential adverse effects of
the discontinuation of the cash portion of the NAP Extant data from ADSEF, including NAP participant
data, NAP retailer data, and EBT transaction data
1 Eligible food is defined as any food or food product intended for human consumption except alcoholic beverages, tobacco, hot foods, and hot food products prepared for immediate consumption (Puerto Rico’s Administración de Desarrollo Socioeconómico de la Familia [ADSEF], 2015).

Examination of Cash Nutrition Assistance Program Benefits in Puerto Rico
Page ii
Study Objective Data Collection Sources and Method benefit for program participants and retailers. NAP cash benefits household survey
In-person interviews and focus groups with key stakeholders
Note Administración de Desarrollo Socioeconómico de la Familia = Administration for Socioeconomic Development of the Family
A review of the characteristics of the NAP population and discussions with NAP administrators identified key subgroups that comprise a large and vulnerable proportion of the NAP population. These vulnerable subgroups include NAP units with zero income, nonelderly members with disabilities, elderly members, children, and single mothers with children. Units living in rural areas were also identified as potentially vulnerable, given limited income opportunities and possibly reduced access to food retailers.
B. SUMMARY OF FINDINGS
1. What is the history and purpose of distributing a portion of NAP monthly benefits in the form of cash?
Since initial implementation in 1974, nutrition assistance in Puerto Rico has undergone substantial changes, evolving from a coupon-based entitlement program to the current block grant program delivered through an EBT system. There were four major milestones in the history of Puerto Rico’s NAP benefits:
1. Nutrition assistance under Federal Food Stamp Program (FSP): 1973–1982. Puerto Rico began receiving Federal nutrition assistance from the United States in November 1974, when the FSP was expanded to Puerto Rico. As in the United States, the FSP in Puerto Rico operated as an entitlement program under which all eligible persons received paper coupons redeemable for eligible food items from certified retailers.
2. Transition to block grant: 1982–1999. In July 1982, Congress replaced Puerto Rico’s FSP with an annual block grant to provide food assistance through NAP. Congress took this step in part to control FSP costs in Puerto Rico. Under the flexible design provisions of the initial block grant, Puerto Rico replaced food coupons with paper checks, creating a 100-percent cash benefit. Other provisions of the block grant limited eligibility, reduced benefit levels, and placed an annual cap on NAP benefits.
3. Transition to EBT with 100-percent cash redemption: 1999–2000. Based on concerns about the cost and inefficiency of delivering NAP benefits via mailing paper checks, Puerto Rico conducted a feasibility study on implementing an EBT system to replace paper checks. After conducting a pilot program, Puerto Rico fully transitioned to an EBT card system in October 2000 to deliver benefits. Although the Administración de Desarrollo Socioeconómico de la Familia (ADSEF)2 agency administering NAP was committed to implementing EBT through a combination of cash and noncash redemption, the initial phase of EBT allowed NAP participants to withdraw up to 100 percent of their benefit dollars as cash.
4. Transition to 75-percent noncash and 25-percent cash redemption under EBT: 2001. In late 2001, Puerto Rico restricted how and where NAP benefits could be redeemed. Puerto Rico mandated that 75 percent of a household’s monthly benefit be redeemed electronically via the
2 Administración de Desarrollo Socioeconómico de la Familia = Administration for Socioeconomic Development of the Family

Examination of Cash Nutrition Assistance Program Benefits in Puerto Rico
Page iii
EBT card at certified retailers’ point-of-sale (POS) devices. The new guidelines allowed participants to redeem the remainder of their NAP benefits, up to 25 percent, as cash for the purchase of eligible food items at any food retailer (certified or uncertified). ADSEF indicated the “75/25 initiative . . . encourages and enforces the utilization of the benefit as established in Federal law and regulations—only for the acquisition of food.”
According to ADSEF officials, the purpose of maintaining the 25-percent cash portion of benefits was—
To ensure NAP recipients who lived in remote parts of Puerto Rico (or who faced other mobility or transportation barriers) could still purchase basic food items from the closest or most easily accessed retailers, regardless of whether or not the retailers were certified
To allow retailers in remote areas of Puerto Rico to serve NAP participants even if they did not have access to the technological infrastructure necessary to operate EBT
2. Are there current barriers to redeeming the noncash portion of the NAP benefit for program participants and retailers?
NAP participants and retailers do not face significant barriers to the redemption of the noncash component of the NAP benefits. These findings were consistent across data sources and subgroups, urban and rural participants, and those with relatively high and low geographic access to certified retailers.
Participants live near certified retailers. Most participants lived near a certified retailer where they could redeem the noncash component: at least half of units lived within 0.2 miles of a certified retailer and at least three-quarters lived within 0.5 miles (see figure E.1). Participants in urban areas had access to certified retailers, with at least half of units living within 0.5 miles of two retailers and within 1 mile of seven retailers. Participants in rural areas had access to certified retailers as well; at least half of units in rural areas lived within 1 mile of five retailers and within 2 miles of nine retailers.

Examination of Cash Nutrition Assistance Program Benefits in Puerto Rico
Page iv
Figure E.1. Distribution of Distance (in Miles) To Nearest NAP Certified Retailer by Store Type
Source: SAIC and SDEC data3 Participants tend to travel farther than the nearest certified retailer to shop for food. Participants usually travel farther than the nearest retailer to purchase food because of lower prices or sales, which were the most important factors for determining where participants shopped with their NAP benefits. This finding suggests many NAP participants not only have adequate access to certified retailers, but also have access to multiple certified retailers and are able to choose where to shop.
Participants report it is easy to get to certified stores. Survey findings indicate NAP participants did not face difficulties redeeming the noncash portion of their NAP benefits. Almost all NAP participants (90.9 percent) indicated it was easy for them to get to the certified store where they bought most of their food, and there was no difference in these findings between participants residing in urban and rural areas. The vast majority of NAP participants reported they bought most of their food at certified supermarkets, and this finding held true for those residing in urban and rural areas and across all subgroups.
Participants exhaust almost all of their noncash benefits each month. NAP units spent nearly all of their noncash benefits each month, with $1.38 (1 percent) left over on average, according to EBT data. This was true regardless of geographic access to retailers. There also were no differences across subgroups or by urban and rural location. This complete drawdown of monthly noncash benefits suggests an absence of challenges to accessing certified retailers or using the noncash form of the NAP benefit. 3 Throughout the report, SAIC = Sistema de Administración e Información de Casos and SDEC = Sistema de Determinación de Elegibilidad de Casos.

Examination of Cash Nutrition Assistance Program Benefits in Puerto Rico
Page v
Retailers do not face barriers to becoming certified or processing EBT purchases. NAP certified retailers reported the certification process was easy and barriers to obtaining and maintaining NAP certification were minimal. Retailers considered the certification costs low, and most viewed NAP certification as advantageous for increasing customers and sales. Certified retailers also indicated processing noncash EBT purchases was easy, transaction costs were reasonable (EBT transaction costs were lower than credit card costs), and POS devices were easy to operate and affordable. For those retailers who were not certified, reasons included a lack of interest, insufficient knowledge about NAP, or a lack of demand from their customers. No uncertified retailers mentioned technology issues (e.g., lack of connectivity or processing equipment) or the cost of POS devices as a reason for being uncertified. While basic POS devices require an analog phone line, battery-operated mobile POS devices are also available, and were used by two NAP certified street vendors interviewed for the study.
3. Do NAP participants currently use the cash portion of benefits for the purchase of nonfood and other prohibited items?
NAP participants redeem most of the cash portion of their benefits as cash withdrawals and use the withdrawn cash for both food and nonfood purchases. The nonfood items purchased were primarily personal hygiene and cleaning products. Most recipients did not understand that the cash portion of the benefit was only supposed to be used for food purchases.
NAP participants redeem most of the cash portion of their monthly benefits as cash withdrawals from an ATM or a certified retailer. Based on EBT transaction data, withdrawals of the cash portion of NAP benefits (at ATMs and certified retailers) accounted for 70.8 percent of the total monthly cash NAP benefits redeemed, while EBT food purchases with the cash portion made up only 29.2 percent. Units with children redeemed a larger portion of their total monthly cash benefits as cash withdrawals than average units did (77.1 percent for units with children compared with 70.8 percent for units overall). Although most of the cash benefits were withdrawn, a minimum of 82.4 percent of the total NAP benefits (cash and noncash portions) was spent on food.
Most NAP participants purchase both food and nonfood items with their withdrawn NAP cash benefits. Based on survey data, 52.4 percent of total NAP participants reported purchasing at least some nonfood items with withdrawn cash, and 44.2 percent reported purchasing at least some food items with withdrawn cash. When including those who did not withdraw cash but instead used the cash portion of their benefits for EBT food purchases, more than three-quarters (78.9 percent) of all NAP participants purchased at least some food items with the cash portion of their benefits.
The most common nonfood items purchased with the withdrawn NAP cash benefits are cleaning supplies and personal hygiene products. Most NAP participants who purchased nonfood items with their withdrawn cash benefits used it to purchase cleaning supplies (such as laundry detergent and dish soap) and personal hygiene products (such as soap and toilet paper; see figure E.2). Only 1 out of 10 participants or fewer reported buying any other ineligible items or services with the withdrawn cash. The patterns of nonfood purchases were consistent across subgroups in the survey. For example, all subgroups were much more likely to purchase cleaning supplies and personal hygiene items than other nonfood items.

Examination of Cash Nutrition Assistance Program Benefits in Puerto Rico
Page vi
Figure E.2. Percentage of NAP Participants
Using Withdrawn Cash Benefits for Nonfood Items by Type of Product
Source: Insight tabulations of NAP cash benefits household survey data
Most participants view nonfood purchases with their cash benefits as essential. Most participants believe the nonfood purchases made with the cash portion of benefits are critical to the health and hygiene of their families given the high level of unemployment along with the lack of other sources of cash assistance in Puerto Rico.

Examination of Cash Nutrition Assistance Program Benefits in Puerto Rico
Page vii
4. What are the potential adverse effects of the discontinuation of the cash portion of NAP benefits for program participants and retailers?
Discontinuing the cash portion of NAP benefits would likely have little impact on participants’ access to food. However, given NAP participants’ reliance on cash benefits to purchase basic hygiene and cleaning products, combined with the lack of other sources of income, discontinuing the cash portion would likely have a significant adverse effect on participants’ ability to meet their basic personal needs.
Many NAP participants believe the removal of the cash portion of NAP benefits would be devastating. Based on survey results, a majority of NAP participants rated the impact of removing the cash portion of benefits as an 8 or higher on a scale of 1 (no impact) to 10 (high impact), with similar results for those in urban and rural areas and across subgroups. When asked in focus groups to discuss the impact of the discontinuation of cash benefits, most participants described the potential impact as devastating because they had no source of cash to purchase necessities other than the cash portion of their NAP benefits. In many groups, participants described how losing the cash portion would severely affect their ability to maintain their health and hygiene. They expressed concerns about not being able to keep themselves, their children, or their homes clean without the cash since they rely on it to buy soap and cleaning products.
NAP participants have limited access to other sources of income or cash assistance from Federal programs. The NAP population is poorer and has less access to cash income than does the SNAP population in the United States. Almost two-thirds of NAP units have zero cash income, including earned and unearned sources (SAIC data, June 2014). Thus, for two-thirds of NAP units, the cash portion of their benefits provides 100 percent of their cash income. In contrast, only 21.5 percent of SNAP units have zero income (Gray, 2014). In
addition, Puerto Rico receives substantially less in Federal funding than the States do for cash assistance programs—both overall and in terms of per capita amounts for low-income individuals (defined as those with income below 200 percent of the Federal poverty level). This is true for programs such as Supplemental Security Income (SSI) in the United States and its smaller predecessor, Aid to the Aged, Blind, and Disabled (AABD), in Puerto Rico; Temporary Assistance to Needy Families (TANF); and the Earned Income Tax Credit (EITC), which aim to assist low-income individuals and families. It is also true for programs such as Unemployment Insurance (UI) that serve the general population.
Community-based organizations and group residential facility administrators cited few potentially positive effects; most have mixed opinions. Most community-based organizations (CBOs) and group residential facility administrators shared many of the same concerns that participants had about discontinuation of the cash portion of the benefit. They stated losing the cash would be damaging to many families since many of their clients had no other source of cash.
“That’s the only income we have. I depend on that money to cover my basic needs. If I can’t count on that money, I can’t work because of my condition.
–Focus group participant
“That would mean that during that month I would eat, but I wouldn´t bathe, I could not clean the house, my son wouldn´t wear diapers, I couldn´t clean him.”
–Focus group participant
“I do not work, I am handicapped, nobody helps me, and I use [the cash benefit] to pay for medicine, hospital, purchases of soap, toothpaste, toilet paper, shampoo, etc. Do not remove the 25-percent cash component, please.”
–Focus group participant

Examination of Cash Nutrition Assistance Program Benefits in Puerto Rico
Page viii
These administrators also described how discontinuing the cash portion of the benefit could affect their clients’ ability to maintain their health and hygiene, as many use the cash to purchase medications and soap. On the other hand, these administrators also felt removing the cash portion of the benefit might improve their clients’ ability to meet nutritional needs since they would be required to spend all of their benefits on food.
There are no clear patterns of differences across vulnerable subgroups of the study concerning the effects of discontinuing the cash portion of benefits. Geographic access to certified retailers, use of cash benefits, and the anticipated effects of the cash benefit discontinuation were generally similar across the vulnerable subgroups included in the study and by urban versus rural location. Where findings varied somewhat by subgroups, they were mixed. No clear pattern emerged among the subgroups to indicate the discontinuation would affect any specific vulnerable group more than others.
Retailers hold mixed opinions about the potential impacts on their businesses. Certified retailers were divided on whether the discontinuation of the cash portion of the benefit would have a positive effect or no effect on their businesses. Some certified retailers felt their sales would increase since NAP customers would have to spend 100 percent of their benefits at their stores. These certified retailers estimated an increase in sales ranging from 10 percent to 30 percent. Others felt the discontinuation of the cash benefit would not affect their stores or sales; one such retailer explained that his store does not distribute cash to NAP clients, so the change would not affect his operations.
Uncertified retailers were divided evenly into three groups: (1) those who thought the discontinuation of the cash benefit would have a negative impact on their business, (2) those who thought it would have no effect, and (3) those who were unsure of the potential effect. For those uncertified retailers who predicted a negative effect, they anticipated losing sales due to customers not having cash to use at their stores, and NAP customers spending all of their benefits at certified supermarkets (instead of at their uncertified stores). Of the uncertified retailers who anticipated no impact, some said NAP participants were not shopping at their stores anyway, so the change would not affect their businesses. Others simply could not anticipate what the outcome would be.
C. SUMMARY AND CONCLUSIONS
Overall, findings from the complementary data sources used in this study indicate NAP participants do not face current barriers to redeeming the noncash portion of the NAP benefit. Discontinuing the cash portion would likely have little impact on participants’ access to food. However, the data sources also indicate that NAP participants rely heavily on the cash portion of benefits to purchase what participants consider as essential nonfood products needed to maintain the personal hygiene and cleanliness of their families. Given the difficult economic situation and scarcity of jobs in Puerto Rico combined with the lack of other sources of cash assistance, discontinuing the cash portion would likely have a significant adverse effect on participants’ ability to meet their basic hygiene and cleanliness needs. These adverse effects would be similar across vulnerable subgroups and for those in urban and rural areas.
The findings also indicate retailers (both NAP certified and uncertified) do not face barriers to being certified or to redeeming noncash benefits. Given the relative ease and low cost of becoming NAP certified, it is likely uncertified retailers would be able to become certified after the discontinuation of the cash portion of the benefit if they chose to do so. No uncertified retailers pointed to infrastructure, costs, or other technological reasons for not being certified; instead, they cited reasons such as a lack of interest, insufficient knowledge of NAP, and insufficient demand. In fact, some uncertified retailers

Examination of Cash Nutrition Assistance Program Benefits in Puerto Rico
Page ix
described ongoing plans to become certified in the near future to gain business and sales for their stores. Certified retailers felt the probable effects of discontinuing the cash benefit would be positive or neutral; uncertified retailers gave mixed predictions on the impact, with only a third anticipating negative effects due to a loss of business. Overall, when discussing the potential effects of discontinuing cash benefits, most were concerned about the implications and effects on low-income Puerto Rico residents rather than the effects on their businesses.

Examination of Cash Nutrition Assistance Program Benefits in Puerto Rico
Page 1
I. INTRODUCTION
This report presents the results of a study for the Food and Nutrition Service (FNS) of the U.S. Department of Agriculture (USDA) to assess the potential adverse effects of discontinuing the cash portion of benefits issued by Puerto Rico’s Nutrition Assistance Program (NAP). The study examines the history and purpose of the cash portion, barriers to redeeming the noncash portion, and use of the cash portion for the purchase of nonfood items. Congress mandated this study under a provision of the Agricultural Act of 2014 (P. L. 113–79), commonly known as the 2014 Farm Bill (Agricultural Act of 2014, 2014).
NAP provides critical support for low-income residents of Puerto Rico. Beginning in July 1982, Congress replaced the Food Stamp Program (FSP) (now known as the Supplemental Nutrition Assistance Program, or SNAP) in Puerto Rico with a Federal block grant to operate NAP. Under the flexible design provisions of the initial block grant, Puerto Rico replaced food coupons with checks, creating a cash benefit. Other provisions of the block grant limited eligibility, reduced benefit levels, and placed an annual cap on NAP benefits.
In late 2001, Puerto Rico implemented an EBT system to deliver benefits. With the transition to EBT, Puerto Rico required 75 percent of a household’s monthly benefit to be redeemed electronically through EBT for the purchase of eligible food items at NAP certified retailers. NAP households may choose to redeem the remaining 25 percent of the benefit in cash for the purchase of eligible food items at any food retailer (certified or uncertified). The objective of retaining a portion of the NAP benefit in cash is to give participants with limited access to certified retailers a way to purchase food.
In February 2014, the Agricultural Act of 2014 reauthorized the NAP block grant along with a provision to gradually phase out the cash portion of the NAP benefit beginning in fiscal year (FY) 2017 coupled with an equivalent increase in the noncash portion until, by FY 2021, no benefits in the form of cash will be issued (Agricultural Act of 2014, 2014, § 4025).4 Prior to the phaseout, the legislation requires a study of how the cash portion of the benefit is used and how its discontinuation may affect participants and retailers. It also allows the Secretary of Agriculture to exempt participants or categories of participants from the cash portion phaseout if the review finds they are likely to experience significant adverse effects.
The legislation specified four key objectives for this study, as shown in table I.1.
Table I.1. Study Objectives
1. Examine the history and purpose of distributing a portion of the NAP monthly benefit in the form of cash. 2. Examine the current barriers to redeeming the noncash portion of the NAP benefit for program
participants and retailers. 3. Examine the current use of the cash portion of the NAP benefit for the purchase of nonfood and other
prohibited items. 4. Identify and assess potential adverse effects of the discontinuation of the cash portion of the NAP benefit
for program participants and retailers.
4 The provision would change the ratio of the cash to noncash portion of NAP benefits to 20 percent cash and 80 percent noncash in FY 2017, 15 percent cash and 85 percent noncash in FY 2018, 10 percent cash and 90 percent noncash in FY 2019, 5 percent cash and 95 percent noncash in FY 2020, and 0 percent cash and 100 percent noncash in FY 2021.

Examination of Cash Nutrition Assistance Program Benefits in Puerto Rico
Page 2
A. BACKGROUND ON PUERTO RICO’S ECONOMY, FEDERAL ASSISTANCE
RECEIVED, AND NAP PARTICIPANT CHARACTERISTICS
To provide context for understanding the potential effects of discontinuing the cash portion of the NAP benefit, this section describes Puerto Rico’s current economy and population, the amount of Federal assistance it receives from the United States, and NAP participant characteristics.
1. Puerto Rico’s Economy and Population
Puerto Rico, with a population of about 3.6 million persons, is a self-governing Commonwealth of the United States. Residents of Puerto Rico are U.S. citizens and subject to a U.S. military draft, but they cannot vote in Federal elections, do not have voting representation in Congress, and are exempt from Federal personal income taxes. 5 Puerto Rico is very densely populated and urbanized. With 1,056 persons per square mile, the island is more densely populated than every State except for New Jersey and the District of Columbia.6 All but 9 of Puerto Rico’s 78 municipalities are considered metropolitan areas.7
Puerto Rico’s economic trends have generally followed those of the U.S. economy, but the latest downturn was longer and more extreme in Puerto Rico than in the United States. Since the summer of 2005, Puerto Rico has experienced a continuing slowdown in job creation, economic activity, housing, and trade (Administración de Desarrollo Socioeconómico de la Familia [ADSEF], 2015). Some of the factors contributing to the slowdown include the deteriorating labor market, reduced personal consumption, reduced public revenue, and diminished construction activity (ADSEF, 2015). Puerto Rico’s Government Development Bank (GDB) Economic Activity Index fell by 3.8 percent between FY 2013 and FY 2014 (GDB, 2015). To compound this issue, Puerto Rico is experiencing a debt crisis, which has led to cuts in government spending and increased taxes.
According to almost any income and employment measure, Puerto Rico’s population is very poor by U.S. standards. Compared with the United States, Puerto Rico has a lower median income, lower labor force participation, higher unemployment rates, and a greater percentage of individuals living in poverty. According to the American Community Survey (ACS) and the Puerto Rico Community Survey (PRCS) 8 for 2013—
Median income: Puerto Rico’s median annual household income ($19,000) is about half that of Mississippi, the poorest State ($38,000), and only 36.7 percent of the annual median income for the entire United States (see figure I.1).
Labor force participation: A much smaller percentage of the Puerto Rico population (44.8 percent) is in the labor force compared with the United States (63.2 percent) (see figure I.2).
Unemployment: The unemployment rate in Puerto Rico (18.1 percent) is more than twice that of the United States (8.4 percent) and much higher than in Mississippi (10.6 percent).
5 Residents of Puerto Rico are only required to file Federal income tax returns if they have income sources outside of Puerto Rico or if they are employees of the U.S. Government. 6 U.S. Census Bureau population estimates for July 1, 2013, and 2010 Census total land areas. 7 Based on the 2013 Rural-Urban Continuum Codes developed by FNS’ Economic Research Service (USDA, 2013b). 8 The PRCS is part of the U.S. Census Bureau’s ACS, customized for Puerto Rico.

Examination of Cash Nutrition Assistance Program Benefits in Puerto Rico
Page 3
Unemployment in Puerto Rico is particularly concentrated among younger residents: 65.7 percent of those aged 16 to 19 and 31.3 percent of those aged 20 to 24 are unemployed (see appendix table B.1.e).
Poverty: More than 45 percent of Puerto Rico’s population lives below the Federal poverty level—nearly three times the U.S. national average poverty rate (15.8 percent), and almost twice the rate in Mississippi (24.0 percent). The prevalence of poverty in Puerto Rico is higher than average for vulnerable groups such as children, individuals with disabilities, and unemployed individuals (see table I.2). The poverty rate for elderly individuals in Puerto Rico, while lower than the overall rate, is more than four times the rate for elderly persons in the United States.
Figure I.1. Median Household Income in Puerto Rico, Mississippi, and the United States, 2013
Source: U.S. Census Bureau, 2013; ACS and PRCS (1-year estimates)

Examination of Cash Nutrition Assistance Program Benefits in Puerto Rico
Page 4
Figure I.2. Poverty Rate, Unemployment Rate, and Labor Force Participation Rate
In Puerto Rico, Mississippi, and the United States, 2013
Source: U.S. Census Bureau, 2013; ACS and PRCS (1-year estimates)
Table I.2.
Percentage of Population in Poverty by Subgroup in Puerto Rico and the United States, 2013 Percentage In Poverty Ratio of
Poverty Rates for Puerto Rico
to Those for United States Puerto Rico United States
Total Individuals 45.4 15.8 2.9 Elderly individuals (age 65+) 40.4 9.6 4.2 Children (<age 18) 57.3 22.2 2.6 Individuals with disabilities 49.7 22.4 2.2 Unemployed individuals 66.1 33.6 2.0
Total Families 41.6 11.6 3.6
Female-headed families with children 69.9 41.0 1.7 Source: U.S. Census Bureau, 2013; ACS and PRCS (1-year estimates)
Cost of living
Differences in the cost of living in Puerto Rico compared with the United States should be considered when making comparisons of income and poverty. Although Puerto Rico uses the dollar in all transactions, it is possible that the average cost of living is higher or lower than in the United States.

Examination of Cash Nutrition Assistance Program Benefits in Puerto Rico
Page 5
Appendix table B.1.f presents data on consumer expenditures for both U.S. and Puerto Rico households for five major household categories in 2013: food, clothing, housing, medical care, and transportation. Overall, expenditures across these categories were about 12 percent higher in the United States than in Puerto Rico due to higher U.S. housing and transportation costs. However, expenditures for food, clothing, and medical care were higher in Puerto Rico. In 2013, the average household in Puerto Rico spent about 9 percent more on food than did households in the United States. Expenditures for clothing and medical care were much higher; the average household in Puerto Rico spent about 96 percent more on clothing and spent more than twice as much on medical care than did households in the United States.
2. Federal Assistance Programs in Puerto Rico
Puerto Rico residents are eligible for many of the same Federal programs as residents in the United States. However, many of these programs, particularly those that assist low-income individuals, are more limited in Puerto Rico. This is typically due to funding or eligibility restrictions; in some cases, the programs are not extended to Puerto Rico at all. As shown in figure I.3, residents of Puerto Rico receive less in overall Federal direct payments and grants than do residents of the United States on a per capita basis.9
9 Federal payments are divided into two major categories. One category is direct payments to individuals through programs such as Social Security, Medicare, and SNAP, which have Federal eligibility and benefit rules usually are administered directly by the Federal Government (exceptions include unemployment compensation and SNAP, which are administered at the State level).The other category is grants to State and local governments for programs such as TANF, Medicaid, and Head Start, in which States have a role in the design, administration, and use of the funds.

Examination of Cash Nutrition Assistance Program Benefits in Puerto Rico
Page 6
Figure I.3. Federal Spending for Direct Payments and Grants
In Puerto Rico and the United States per Capita, 2010
Source: U.S. Census Bureau, 2011 (table 10) Note The FY 2010 Consolidated Federal Funds Report (U.S. Census Bureau, 2011) is the last comprehensive report on both payments and grants published by the Census Bureau.
Below, we summarize differences in Federal payments to Puerto Rico and the United States primarily for programs aimed at assisting low-income individuals. All Federal payment amounts for low-income programs are presented in terms of per capita amounts for low-income individuals (calculated as the amount of Federal spending divided by the number of individuals with income below 200 percent of the Federal poverty level). Unless otherwise stated, all per capita amounts are for low-income individuals. Appendix tables B.2.a and B.2.b provide more-detailed information.10
Cash assistance
Puerto Rico receives substantially less in Federal funding than do States for three primary programs providing cash assistance to needy households. Puerto Rico receives no Federal funding for SSI, which provides up to $674 in monthly Federal benefits (and States may add additional supplements) to
10 Tables B.2.a and B.2.b compare major Federal payments to Puerto Rico and the United States for programs that provide (1) direct payments to individuals in FY 2010 based on the latest available Consolidated Federal Funds Report (CFFR) data for 14 programs (see U.S. Census Bureau, 2011), and (2) grants to State and local governments in FY 2013, based on the latest FY 2015 grant data for 37 programs (see OMB, 2012). We used this data for table B.2.b because it provides both the latest available data (FY 2013) and a level of detail needed to assess individual grant programs that is not provided in the CFFR data. There is no comparable source to update the direct payment data, so table B.2.a uses FY 2010 data.

Examination of Cash Nutrition Assistance Program Benefits in Puerto Rico
Page 7
individuals in the United States who are elderly or who are blind or have other disabilities and who have limited assets and income (Social Security Administration [SSA], n.d.). Instead, Puerto Rico receives a limited capped grant under AABD (a program that existed in the United States before SSI was created), which provides up to $64 in monthly benefits).11 Federal spending for the AABD program in Puerto Rico is about $24 million, or $9 per capita, compared with $459 per capita for the SSI program in the United States (see figure I.4).
Funding for TANF in Puerto Rico is substantially limited, and the maximum funding is set by statute. In FY 2013, Puerto Rico received $71.56 million in TANF funds, or $27 per capita, compared with $154 per capita in the United States. Additionally, Puerto Rico is not eligible for the TANF Contingency Fund, which provides additional TANF funds to States meeting certain criteria.
The EITC, a refundable tax credit available to the working poor in the United States, is not available to residents of Puerto Rico. In FY 2013, per capita EITC tax credits amounted to $501 in the United States. Individuals who do not earn enough income to pay Federal income taxes can still receive EITC refund checks.
11 In addition, AABD provides up to $100 per month for family shelter costs, for an average monthly AABD payment of $77 a month ($58 from Federal funds and $19 from Puerto Rico funds).

Examination of Cash Nutrition Assistance Program Benefits in Puerto Rico
Page 8
Figure I.4. Federal Spending for Major Programs
To Assist Low-Income Residents of Puerto Rico and the United States per Capita
Source: U.S. Census Bureau, 2011; U.S. Office of Management and Budget, 2012; U.S. Government Accountability Office, 2014; Administration for Families and Children. Notes
Per capita spending for each program is calculated as the annual amount of Federal spending divided by the number of individuals with income below 200 percent of the Federal poverty level in Puerto Rico and the United States.
TANF, Medicaid, Head Start, and Section 8 Housing Voucher amounts are for FY 2013; AABD/SSI amounts are for FY 2011; and EITC and Student Financial Assistance amounts are for FY 2010.
Health care assistance
Medicaid is a joint Federal-State program that finances health care coverage for low-income individuals. The Federal Government is authorized to spend as much money as States will match (in amounts determined under a Federal formula) for their Medicaid programs. In contrast, Puerto Rico receives a limited capped amount of Medicaid funding ($367 per capita compared with an average $2,677 in the United States).12
12 The Federal Medical Assistance Percentage for Puerto Rico is set by Federal statute at 55 percent (P. L. 111–148, as amended by P. L. 111–152, 1204(b)(2)(B), 124 Stat. 1029, 1055 (2010)). The total Federal contribution to Puerto Rico also is limited by statute. For example, in FY 2011, the statutory cap for spending in Puerto Rico was $290.6 million. However, Puerto Rico received additional funding made available under the Recovery Act and the Patient Protection and Affordable Care Act.

Examination of Cash Nutrition Assistance Program Benefits in Puerto Rico
Page 9
Social services
Head Start is a large program that aims to promote school readiness for young children. Puerto Rico is treated as a State for purposes of determining eligibility and funding for this program. The per capita funding for this program is similar in Puerto Rico and the United States ($99 and $71, respectively), but somewhat higher in Puerto Rico because the Head Start funding formula is based in part on the proportion of children living in poverty in a given State or territory, and Puerto Rico has a large percentage of children living in poverty.
Housing assistance
Funding for Section 8 Housing Choice Vouchers provides rental assistance to very low-income families. The per capita spending in Puerto Rico is $70 compared with $167 in the United States.
Education assistance
Student Financial Assistance provides funds (mostly through Pell Grants) to students from low-income families to help meet the cost of postsecondary education. Awards are based on need. Institutions and students in Puerto Rico are subject to the same statutory and regulatory requirements as those in the United States. The per capita spending in Puerto Rico ($360) is similar to, but somewhat lower than, that in the United States ($482).
Social insurance programs
The rules for determining Social Security and UI are the same in Puerto Rico and the States. Since Puerto Rico residents pay Social Security taxes and employers pay unemployment insurance payroll taxes, residents can receive full benefits if qualified. Per capita benefits for the total population are lower in Puerto Rico than they are in the United States ($1,919 compared with $2,254 for Social Security, and $100 versus $220 for UI). Here, lower levels of lifetime employment and earnings among residents of Puerto Rico are the likely explanation.
Nutrition assistance
Since 1982, Puerto Rico has received a Federal block grant to operate NAP as a replacement for SNAP, an entitlement program. A block grant limits eligibility criteria and benefit levels to stay within the block grant limits and is fundamentally different from an entitlement program that serves all who are eligible. A per capita comparison would be misleading. However, an earlier study using FY 2009 data examined how nutrition assistance would change if SNAP was reintroduced in Puerto Rico without any changes to the existing programs in Puerto Rico (Peterson et al., 2010). The study estimated that under SNAP, Puerto Rico would have received about $420 million more in benefits in FY 2009 than it did under NAP. The study also found an additional 85,000 households with 220,000 persons would receive benefits under SNAP, and the average monthly benefit would increase by $23 or 9.6 percent.
The other key FNS-funded nutrition assistance programs (National School Lunch and School Breakfast Programs, the Special Supplemental Nutrition Program for Women, Infants, and Children (WIC), and the Child and Adult Care Food Program) are funded as grants to States. Puerto Rico is treated the same as a State for determining eligibility and funding for these programs. Per capita funding is slightly lower in

Examination of Cash Nutrition Assistance Program Benefits in Puerto Rico
Page 10
Puerto Rico than the United States for all of these programs except for WIC, where it is slightly higher in Puerto Rico (see figure I.5).
Figure I.5. Federal Spending for Nutrition Assistance Programs
In Puerto Rico and the United States per Capita, FY 2013
Source: U.S. Office of Management and Budget, 2014 (tables 15-5–15-40); unpublished tables from FNS’ Mid-Atlantic Regional Office (for NAP grant); FNS program data. Note
Per capita spending for each program is calculated as the annual amount of Federal spending divided by the number of individuals with income below 200 percent of the Federal poverty level in Puerto Rico and the United States.
Overall, Puerto Rico receives substantially less in Federal funding than the United States does for cash assistance programs—both overall and on a per capita basis.13 This is true for cash assistance programs such as SSI/AABD, TANF, and EITC, which aim to assist low-income individuals and families. It is also true for programs such as UI that serve the general population. For many noncash programs, in which eligibility and funding policies are the same in the United States and Puerto Rico, the picture is more variable. For example, for Head Start and WIC, the per capita benefit in Puerto Rico is slightly higher, while for School Lunch and Section 8 housing programs, it is slightly lower. For NAP, which is funded through a capped grant and operated with tighter eligibility rules, per capita Federal funding (among the
13 Other forms of non-Federal assistance for low-income residents in Puerto Rico are also limited. According to ADSEF, there is only one small program funded by Puerto Rico and administered by ADSEF, the Economic and Social Rehabilitation Program. This is a training program designed to help very low-income Puerto Rico residents learn basic trades so they can join the workforce through employment or self-employment. According to information from FNS’ Mid-Atlantic Regional Office, this is the only non-Federal low-income program run by ADSEF or any other Puerto Rico agency.

Examination of Cash Nutrition Assistance Program Benefits in Puerto Rico
Page 11
low-income population) is almost the same as it is for SNAP. This is because a higher percentage of its low-income population, relative to even the poorest U.S. State, qualifies for benefits.
Another way to assess differences in Federal payments to Puerto Rico versus the United States is to compare actual Federal spending in Puerto Rico with estimated spending if Puerto Rico were to become a State. In a recent study, the U.S. Government Accountability Office (GAO) compared the amount of current Federal program spending in Puerto Rico to estimated Federal program spending in Puerto Rico under statehood for five key programs: Medicare, Medicaid, NAP/SNAP, AABD/SSI, and the Children's Health Insurance Program (CHIP) (GAO, 2014).14 There are both low and high estimates of Federal spending under statehood based on differing assumptions about program implementation.
Comparisons to the higher-end estimates show actual Federal spending for Medicare, Medicaid, NAP/SNAP, and AABD/SSI is less than it would be under statehood (see table 1.3). The analysis also shows that actual spending for Medicaid and AABD/SSI is less than what it would be under statehood, even using the lower-range estimates.15 For example, actual Medicaid spending in Puerto Rico is estimated to be between 32.6 percent and 62.3 percent of what it would be under statehood.
Table I.3. Actual Federal Spending in Puerto Rico Compared With
Estimated Federal Spending Under Puerto Rico Statehood for Selected Programs
Actual Federal Spending in Puerto Rico
(in millions of $)
Estimated Spending Under Puerto Rico Statehood
Actual Spending as a Percentage of
Estimated Spending Under Statehood
Low Range of Estimate
(in millions of $)
High Range of Estimate
(in millions of $)
Low Range of Estimate (Percent)
High Range of Estimate
(Percent) Medicare 4,500 4,500 6,000 100.0 75.0 NAP/SNAPa 1,900 1,700 2,600 111.8 73.1 Medicaid 685 1,100 2,100 62.3 32.6 AABD/SSIb 24 1,500 1,800 1.6 1.3 CHIP 100 0c 73 N/A 136.1 Total 7,209 8,800 12,573 81.9 57.3 Source: GAO, 2014 a Actual spending is for Puerto Rico's NAP and estimated spending is for SNAP. The low-range estimate of spending for SNAP under Puerto Rico statehood is less than actual spending because of the large income increase from adding SSI for which Puerto Rico residents would newly quality. b Actual spending is for Puerto Rico's AABD and estimated spending is for SSI. c The low estimate of zero assumes Puerto Rico would have discontinued its CHIP program and covered former CHIP recipients under Medicaid. Notes
The Federal spending estimate for Medicare is for 2010; for all other programs, estimates are for 2011. GAO’s estimates of SNAP spending under statehood include two additional midrange estimates (both are $2,000 million) that are higher than actual spending.
N/A indicates not applicable.
14 GAO also estimated Federal spending under Puerto Rico statehood for the Federal-Aid Highway Program, but the results were not included because they are outside the focus of this report. 15 The low-range estimate of spending for SNAP under Puerto Rico statehood is less than actual spending is that participants’ SNAP benefits would be reduced due to income received from SSI, for which Puerto Rico residents would newly qualify.

Examination of Cash Nutrition Assistance Program Benefits in Puerto Rico
Page 12
3. NAP Program and Participant Characteristics
The overall goal of NAP is to reduce hunger and increase food security by providing low-income individuals and families with access to food and a healthy diet (ADSEF, 2015). Just as for SNAP, to be eligible for NAP, households must meet certain eligibility criteria including asset and income limits. The FY 2014 asset limits for NAP and SNAP eligibility are similar, but the income limits, maximum benefit amounts, and cash redemption amounts differ across programs (see table 1.4).16 For example, while SNAP eligibility criteria include both monthly gross and net income limits, NAP only has a net income limit. Households need to have much lower net incomes under NAP than SNAP to be eligible. The NAP limit is not quite 37 percent of the net income cutoff for SNAP.
Maximum benefit amount and benefit form also differ between the two programs. Households receive much smaller maximum benefit amounts under NAP than SNAP. The maximum monthly NAP benefit amount for a three-person household in Puerto Rico is $315 compared with $497 under SNAP in the United States. While both SNAP and NAP issue and redeem benefits through EBT cards, a portion of the monthly NAP benefit may be redeemed in cash. NAP participants may redeem up to 25 percent of their benefits for cash, which may be used to purchase eligible food items at both NAP certified and uncertified retailers. Like the entire monthly SNAP benefit, 75 percent of the NAP benefit must be redeemed at program-certified retailers. Appendix table B.3.e lists maximum NAP benefit amounts for the cash and noncash portions of program benefits.
Table I.4. Comparison of NAP and SNAP Selected Program Characteristics, FY 2014a
Program Characteristic
NAP
SNAPb
NAP Threshold as Percentage of SNAP
Threshold Asset Limit $2,000
($3,000)c $2,250
($3,250)c 88.9%
(92.3%) Monthly gross income limit
(3-person household)
None
$2,116
N/A Monthly net income limit
(3-person household)
$599
$1,628
36.8% Maximum monthly benefit amount
(3-person household)
$315
$497
63.4% Cash portion of benefit allotment amountd Up to 25% of
monthly benefit
None
N/A Source: ADSEF, 2014; USDA, 2014 a Due to cost-of-living differences in Puerto Rico compared with the United States, the income limits and benefit amounts may not necessarily be comparable. They are shown simply to describe differences in the programs. b SNAP values are for the 48 States in the continental United States and the District of Columbia. c The higher asset limit is for households in which at least one member is elderly (aged 60 or older) or nonelderly with disabilities. d NAP participants may redeem up to 25 percent of their benefits in cash for purchases of eligible food items in certified and uncertified retailers. Notes The SNAP eligibility criteria are based on national eligibility standards. SNAP legislation provides for exceptions to the eligibility criteria in certain high-cost areas, such as Alaska and Hawaii, and to certain individuals such as those who are categorically eligible, elderly, or with disabilities. Furthermore, States have options to expand certain eligibility rules such as the asset limit. N/A indicates not applicable.
16 The SNAP eligibility criteria described are the national eligibility standards. SNAP legislation provides for exceptions to the eligibility criteria in certain high-cost areas, such as Alaska and Hawaii, and to certain individuals such as those who are categorically eligible, elderly, or with disabilities. Furthermore, States have options to expand certain eligibility rules such as the asset limit.

Examination of Cash Nutrition Assistance Program Benefits in Puerto Rico
Page 13
Vulnerable subgroups of the NAP population
According to ADSEF NAP administrative data for June 2014, almost two-thirds of NAP units have zero gross cash income, including earned and unearned sources (see figure I.6). Thus, for two-thirds of NAP units, the cash portion of their NAP benefits provides 100 percent of their cash income. In contrast, only 21.5 percent of SNAP units have zero income (Gray, 2014).17
Figure I.6. Percentage of NAP and SNAP Units by Income Characteristics
Source: SAIC data; Gray, 2014 Note NAP percentages are for June 2014, and SNAP percentages are for FY 2013 (most recent data available).
A large majority of NAP units with elderly members or with nonelderly members with disabilities have zero income (89.4 percent and 80.6 percent, respectively; see figure I.7).18 Among all NAP families with children, 33.3 percent have no other source of cash income, and 30.4 percent of families headed by a single mother have no other income. Comparing NAP families in rural versus urban areas, the proportion with zero income is similar but slightly lower for those living in rural areas (62.7 percent versus 65.5 percent).
17 The percentage of NAP and SNAP units that have zero income may not be directly comparable due to differences in program rules. For example, the percentage of SNAP units with zero income would be higher under the NAP income thresholds. In addition, NAP policy allows elderly individuals to file as a separate unit from the rest of the household even if they purchase and prepare food together. 18 The relatively high percentage of NAP units with elderly members who have zero income (89.4 percent) may be explained by NAP eligibility rules that allow elderly individuals to file as a separate unit from the rest of the household even if they purchase and prepare food together.

Examination of Cash Nutrition Assistance Program Benefits in Puerto Rico
Page 14
Figure I.7. Percentage of NAP Units With Zero Income by Subgroup, June 2014
Source: SAIC data
A review of the characteristics of the NAP population and discussions with NAP administrators identified key subgroups that comprise a large and vulnerable proportion of the NAP population. These vulnerable subgroups include NAP units with zero income, nonelderly members with disabilities, elderly members, children, and single mothers with children. Units living in rural areas were also identified as potentially vulnerable given limited income opportunities and possibly reduced access to food retailers. These are the key subgroups examined in this study.
Figure 1.8 describes the proportion of these subgroups in both NAP and SNAP. The largest subgroup in the NAP population is units with zero income (65.4 percent), while the smallest is composed of units living in rural areas (4.7 percent). This last figure is consistent with the fact that Puerto Rico, in general, is very densely populated.

Examination of Cash Nutrition Assistance Program Benefits in Puerto Rico
Page 15
Figure I.8. Percentage of NAP and SNAP Units by Selected Subgroup Characteristics
Source: SAIC data; Gray, 2014 Note
NAP percentages are for June 2014, and SNAP percentages are for FY 2013 (most recent data available).
B. ORGANIZATION OF THE REPORT
Following chapter II, which presents an overview of study methods, the remainder of this report assesses the cash portion of the NAP benefit and the likelihood of adverse effects due to discontinuing benefits in the form of cash. Chapter III describes the history and purpose of the cash component of NAP in Puerto Rico. Chapter IV examines barriers to redeeming the noncash portion of the NAP benefit, including NAP participants’ access to certified retailers, benefit redemption patterns, and retailer perspectives on redeeming NAP benefits; it also examines barriers by subgroups. Chapter V identifies NAP participant use of the cash portion of benefits (including the purchase of nonfood items). Chapter VI provides an assessment of whether discontinuing the cash portion of the NAP benefit would have adverse effects on participants and retailers and compares findings by subgroups.
Four appendices provide additional detail on the study methods and data. Appendix A provides a more-detailed description of the data sources and methods used to conduct the study. Appendix B provides detailed tables on the Puerto Rico population, Federal payments to Puerto Rico, and characteristics of the NAP population; it also includes detailed tables from the extant data analysis and NAP cash benefit household survey. Appendix C includes data collection instruments. Appendix D provides information on the NAP certification process and costs for retailers and the NAP benefit redemption process.

Examination of Cash Nutrition Assistance Program Benefits in Puerto Rico
Page 16
II. STUDY METHODOLOGY
The goal of this study is to provide information to help policymakers assess potential adverse effects of discontinuing the cash portion of the NAP benefit for both program participants and retailers. As specified in the legislation, steps to address this goal include examining the history and purpose of the cash portion of the NAP benefit, assessing the barriers to redeeming the noncash portion, and describing the current use of the cash portion for nonfood purchases.
This chapter presents the methods and data sources used to address the objectives of the study. Section A describes the study methods, and Section B discusses study limitations and considerations. Appendix A includes detailed descriptions of the data collection procedures and analytic approach.
A. STUDY METHODS
The study is based on five complementary data collection methods. Table II.1 outlines the data collection methods used to address each of the study objectives specified by the legislation.
Table II.1. Crosswalk of Study Objectives and Data Collection Methods
Study Objective Data Collection Sources and Method 1. Examine the history and purpose of distributing a
portion of the NAP monthly benefit in the form of cash and obtain background information on the economic environment of Puerto Rico, the amount of Federal assistance received, and the characteristics of NAP participants.
Meetings with FNS, Puerto Rico’s Administración de Desarrollo Socioeconómico de la Familia (ADSEF),19 FNS’ Mid-Atlantic Regional Office, and U.S. Department of Health and Human Services
Review of existing studies, data sources, and other documents
2. Examine the current barriers to redeeming the noncash portion of the NAP benefit for program participants and retailers.
Extant data from ADSEF, including NAP participant data, NAP retailer data, and EBT transaction data
NAP cash benefits household survey In-person interviews and focus groups with key
stakeholders 3. Examine the current use of the cash portion of the
NAP benefit for the purchase of nonfood and other prohibited items.
NAP cash benefits household survey In-person interviews and focus groups with key
stakeholders 4. Identify and assess potential adverse effects of
the discontinuation of the cash portion of the NAP benefit for program participants and retailers.
Extant data from ADSEF, including NAP participant data, NAP retailer data, and EBT transaction data
NAP cash benefits household survey In-person interviews and focus groups with key
stakeholders
Below, we describe each of the five data collection methods and how they address particular study objectives. Collectively, these data collection methods provide a rich and in-depth source of relevant information.
19 Administración de Desarrollo Socioeconómico de la Familia = Administration for Socioeconomic Development of the Family

Examination of Cash Nutrition Assistance Program Benefits in Puerto Rico
Page 17
1. Meetings With FNS, ADSEF, and U.S. Department of Health and Human Services Staff
As part of the planning process, the study team held in-depth meetings with key NAP program administrators from ADSEF and FNS’ Mid-Atlantic Regional Office (MARO) to obtain their input on the four study objectives. These discussions also covered the history and purpose of the cash portion of the NAP benefit, along with the perceived impact of discontinuing this form of the benefit. The study team also obtained information on the extant data sources needed for the study, including ADSEF’s administrative data on NAP participants and certified retailers. A meeting with EBT data administrators provided access to and a better understanding of the NAP benefit redemption data. As required by the legislation, the study team also consulted with U.S. Department of Health and Human Services (HHS) staff to obtain information on Federal assistance programs in Puerto Rico.
2. Review of Existing Documents, Studies, and Data Sources
The study team reviewed legislation, existing studies, internal reports, and memoranda associated with the evolution of NAP and the cash component of NAP benefits. The team collected these documents through both direct correspondence with FNS and ADSEF personnel and an online literature review. The review focused on examining changes in the operation and administration of nutrition assistance programs in Puerto Rico from the initial implementation of FSP in 1974 to the current NAP block grant.
The study team also used existing data sources to provide context for the study. ADSEF, U.S. Census Bureau data, FNS, MARO, GAO, and HHS provided information on (1) the economic environment in Puerto Rico, (2) the amount of Federal assistance provided to Puerto Rico by the United States, and (3) the characteristics of NAP participants (see appendices B.1–B.3 for detailed tables).
3. NAP Cash Benefits Household Survey
The study team designed and administered a telephone survey to assess NAP participants’ access to certified retailers, identify items purchased with the cash portion of their benefits, and explore potential impacts of discontinuing the cash portion of the benefit for individuals residing in urban versus rural locations and for key subgroups.
The survey instrument covered the following topics: (1) respondents’ decisions on where to shop for food (using their noncash and cash benefits); (2) respondents’ access to NAP retailers, including how frequently they shop for food, how they get to stores, and how easy or difficult it is to get there; (3) experiences accessing the cash portion of their NAP benefits; (4) items purchased with the cash portion of their NAP benefits and awareness of regulations governing purchases; and (5) the potential impact of discontinuing the cash portion of NAP benefits.
To develop the sampling frame, the ADSEF NAP office provided the study team with an administrative data file of all NAP units receiving NAP benefits as of June 2014 (i.e., 1 month prior to sampling).20 The sampling frame was restricted to NAP units actively receiving benefits in June 2014 to minimize recall
20 Throughout the remainder of the report, we use the term NAP unit instead of NAP household to refer to the group of individuals who form the NAP economic unit for determining eligibility and benefit amounts. A NAP unit is usually composed of all the individuals who share a residence, but there are some exceptions. For example, elderly individuals who share a residence with nonelderly individuals may file as their own unit separately from the rest of the household. In some cases, individuals who do not live in the residence because of work, school, or hospitalization can be included in the unit.

Examination of Cash Nutrition Assistance Program Benefits in Puerto Rico
Page 18
bias during the survey. During the administration of the survey, to elicit the most accurate information regarding redemption of NAP benefits, responses were requested from the individual in each NAP unit who performed the majority of the food shopping. Because the survey results are based on NAP participant responses, we report the findings in terms of NAP participants rather than NAP units. The NAP participant responses reflect the shopping patterns of the NAP unit.
The goal of the sample design was to allow statistically defensible inferences about the entire population of NAP units and about NAP units in urban areas as compared with rural areas. Insight added an indicator to each NAP unit to identify its urban or rural status based on the USDA Economic Research Service’s (ERS) Rural-Urban Continuum Codes (RRUC) for metropolitan and nonmetropolitan municipalities. 21 Due to the small population of NAP units in rural areas, oversampling was performed on this subgroup to ensure statistically accurate estimates.
The sample design was a stratified, random sample of 3,600 NAP units throughout Puerto Rico. Insight stratified the data based on urban and rural location and created substrata within each strata based on income and unit composition. Overall, 750 NAP participants, including 378 living in urban areas and 372 living in rural areas, completed the survey (see table II.2).
Table II.2. Sample Size and Number of Respondents by Substrata
Substrata Total Sample Size Number of Respondents Urban Rural
1,800 1,800
378 372
Zero income Non-zero income
2,308 1,292
471 279
Nonelderly members with disabilities Elderly members Single mothers
606 1,156 554
139 254 121
Total 3,600 750
The sampling procedures were also designed to allow comparisons between various subgroups, including units with zero income, nonelderly members with disabilities, elderly members, and single mothers with children, but the accuracy of subgroup estimates depends on the sample size resulting from the representation in the population (see appendix A.2 for more details on standard errors of these estimates).
The survey was conducted using computer-assisted telephone interviews between October and December 2014, and participants received a $10 gift card in the mail after participating in the survey. Appendix A.2 provides more details on the survey methods, including a discussion of the sample design, response rates, weighting procedures, and levels of sampling error. Appendix B.5 provides supplemental tables and appendix C.1 provides the survey instruments.
21See USDA, 2013b.

Examination of Cash Nutrition Assistance Program Benefits in Puerto Rico
Page 19
4. In-Depth Stakeholder Data Collection
1. Between October and November 2014, the study team collected additional information for the stakeholder analysis through the following steps:
2. Focus groups with NAP participants (18 groups)
3. Semi-structured in-person interviews with retailers (17 certified and 16 uncertified)
4. Semi-structured in-person interviews with directors of community-based organizations (CBOs) (5 CBOs) and residential facilities (5 facilities) that serve NAP participants
The protocols covered the following topics: (1) NAP participants’ shopping practices and perspectives on access to certified retailers; (2) retailers’ perspectives on barriers to redeeming noncash NAP benefits, including barriers to, and advantages or disadvantages of, being certified or uncertified; (3) the use of the cash portion of the benefit to purchase nonfood items; and (4) the potential impact of discontinuing the cash portion of the benefit on participants and retailers. Together, focus groups and in-person interviews provided rich qualitative data on stakeholder perspectives about the potential adverse effects of discontinuing the cash portion of the NAP benefit.
The study team divided Puerto Rico into five geographic study regions, and recruited stakeholders from all five regions to ensure broad representation, including certified and uncertified retailers as well as participants in both urban and rural areas (see figure II.1).
Figure II.1. Map of Puerto Rico Showing Five Study Regions
Focus groups with NAP participants
Focus groups were comprised of the general population of NAP participants. At least two groups were held with individuals from the following vulnerable subgroups: (1) living in rural areas; (2) zero income; (3) nonelderly members with disabilities; (4) elderly members; (5) single mothers with children; and (6) homeless individuals. Homeless individuals are an important vulnerable group of NAP participants. Since they cannot be identified in the NAP administrative data, they were recruited and included in two focus groups.
Examination of Cash Nutrition Assistance Program Benefits in Puerto Rico
Page 20
Staff from CBOs in each study region identified and recruited members of the focus groups. NAP participants were screened to determine their subgroup characteristics as well as to ensure receipt of NAP benefits within the last 6 months, responsibility for some or most household food shopping, and that they were at least 18 years old. The focus groups were held on site at the same CBOs and were conducted by professional Spanish-speaking moderators. CBOs received $50 per focus group, and participants each received a $50 gift card.
In-person interviews with retailers
The study team recruited and carried out semi-structured interviews with a mix of retailers (17 certified and 16 uncertified) from all five geographic study regions, urban and rural locations, and across all types of retailers. Interviews were conducted on site by professional Spanish-speaking field staff. There was no list or database of uncertified retailers to facilitate recruitment. Consequently, the study team identified and recruited uncertified retailers in person while in the field.
In-person interviews with CBOs and residential facilities
The study team conducted in-person interviews with the directors of five CBOs and managers of five residential facilities that served NAP participants and other vulnerable Puerto Rico residents. The CBOs represented food banks, soup kitchens, faith-based organizations, economic development associations, and organizations serving chronically ill individuals. The residential facilities served domestic violence survivors, homeless families, individuals with drug and/or alcohol addictions, and people living with chronic health problems.
Appendix A.3 provides more details on the in-person data collection from stakeholders. Details include a summary of focus group and retailer characteristics and a discussion of recruitment methods, data coding, and analysis. Appendices C.2 through C.5 provide the protocols used for the participant focus groups and interviews with retailers, CBOs, and residential facilities.
5. Extant Data Analysis on Geographic Access to Food Retailers and Benefit Redemption Patterns
The extant data analysis examines two distinct components: (1) NAP participants’ geographic access to certified retailers and (2) participants’ redemption patterns. The latter are examined by level of geographic access to certified retailers and by population subgroup.
Analyzing these data helps to assess whether NAP participants currently face barriers to redeeming the noncash portion of their benefits. Limited geographic access to certified retailers and incomplete drawdown of monthly benefits suggest potential challenges to using the noncash form of the NAP benefit. Conversely, the use of cash benefits redeemed electronically for food purchases at certified stores versus as cash back at an ATM or from a retailer suggest the absence of a cash benefit will not pose a barrier to food purchases. Both retailer access and benefit redemption patterns are analyzed by subgroup to identify whether some participants are more likely to face barriers with the discontinuation of cash benefits.

Examination of Cash Nutrition Assistance Program Benefits in Puerto Rico
Page 21
Geographic access to certified food retailers
Geographic access or proximity to NAP certified retailers is defined in terms of distance between home and the nearest certified retailer, as well as the number of certified retailers located close to participants’ homes. To conduct this analysis, the team geocoded participant and certified retailer addresses and then linked the files to calculate the distance between residence and store. For the density measure, the team counted the number of retailers, by type, within selected distances of units’ homes.
NAP units living within the median distance to the nearest retailer were defined as having greater geographic access. Units that lived more than the median distance to the nearest retailer were defined as having less geographic access.
Benefit redemption patterns
The study team also examined NAP participants’ benefit redemption patterns by form of benefit. To do this, the study team calculated the average number of transactions per unit and the amount spent per month, how quickly participants spent their benefits, and whether any of the allotment remained at the end of the month. For the cash portion of the benefit, the analysis also examined whether it was used for food purchases at certified retailers or received as cash. Redemption patterns were compared across different levels of store access and participant subgroups.
Data sources
The extant data covered a 1-year period: July 1, 2013, to June 30, 2014. The analyses were conducted at the unit-month level, where each unit-month represents a month that a NAP unit participated in the program. Four data sources were used to conduct these extant data analyses:
The Sistema de Administración e Información de Casos (SAIC) is the NAP participant database maintained by ADSEF. Study data contained all of the participants who received NAP benefits during the timeframe described above. The SAIC data were used for two purposes: (1) to locate NAP units’ addresses for the geographic access analysis and (2) to define unit characteristics—such as whether the unit had children, an elderly member, or a nonelderly member with disabilities—and whether the unit had income (earned or unearned). After creating subgroup variables from the participant information, the dataset was collapsed to the unit-month level. The 12 months of NAP participant data provided information on 739,294 units.
The Sistema de Determinación de Elegibilidad de Casos (SDEC) is the database of NAP certified retailers. In it, ADSEF maintains certification and background information for every retailer that participates or has participated in the NAP program. For this analysis, the data consisted of any retailer certified at any time from July 1, 2013, to June 30, 2014. The SDEC data were used for two purposes: (1) to locate the retailers on a map using address information in the file and (2) to determine store type, such as whether the store is a supermarket, small or medium grocery store, or convenience store. Figure II.2 presents the distribution of store types included in the analysis (appendix A.1 describes how 24 original retailer categories were combined into 8

Examination of Cash Nutrition Assistance Program Benefits in Puerto Rico
Page 22
categories for the analysis). In all, 3,217 certified retailers were active at some point during the year of the study period and were included in this analysis.22
Figure II.2. Distribution of Retailers by Store Type
Source: SDEC data Note The “Other” retailer category includes bakery and specialty stores; farmers’ markets and fruit and vegetable stands; and nutrition, health food, and other stores where people purchase food.
Centinela EBT data are NAP transaction data that EVERTEC, an ADSEF contractor, collects and
manages. The EBT transaction data are similar to the Anti-Fraud Locator for EBT Redemption Transaction system data used in the United States. The analysis file contained complete data for each unit’s monthly cash and electronic benefit issuances as well as data for each unit’s benefit redemption transactions for the period of July 1, 2013, to June 30, 2014. The entire year’s data were analyzed to account for seasonal differences in spending patterns. Prior to collapsing the transaction dataset to one observation per unit per month, we created a series of variables to characterize the units’ spending patterns, such as the number of cash and noncash benefit transactions per month and the average monthly transaction amount. There are a total of 36 variables and 74,804,182 unique observations.
U.S. Census Bureau data were used to assign latitude and longitude to participant and certified retailer addresses that the geocoding software did not locate at the street address level, as well as to characterize urban and rural municipalities. ZIP Codes, county subdivisions (barrios), and
22 The term “active” refers to retailers that were NAP certified and made NAP transactions (EBT food sales or cash withdrawal disbursements) during the specified period.
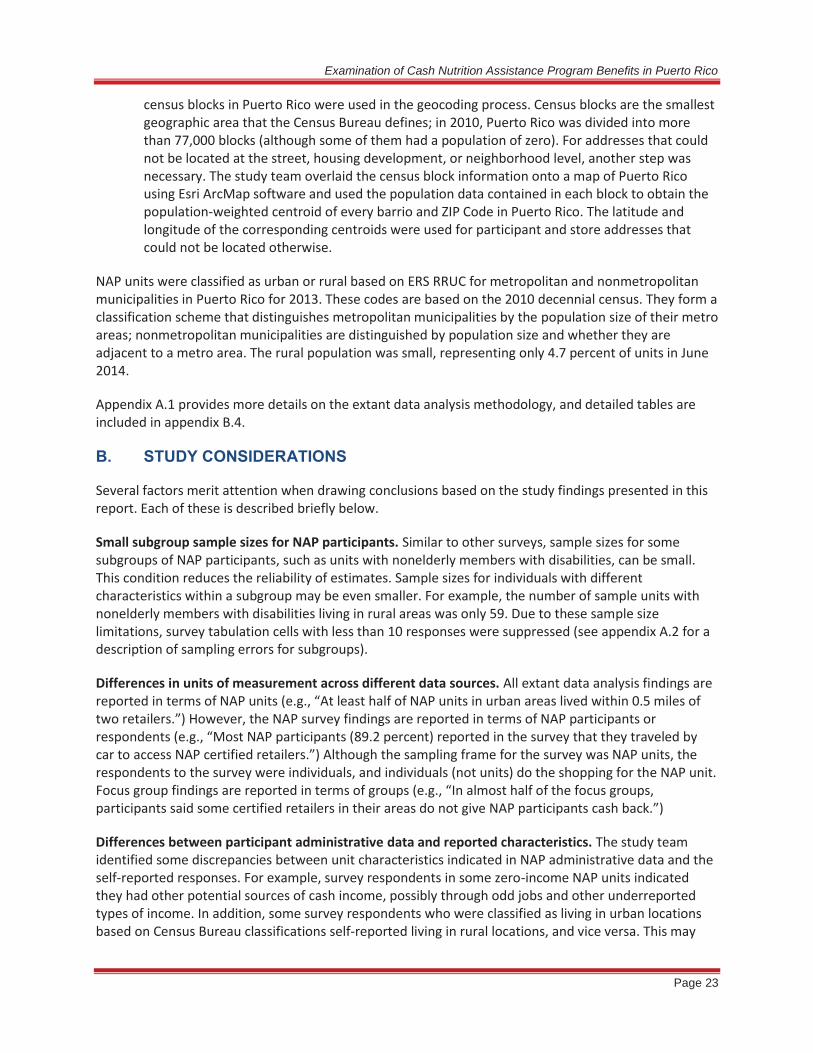
Examination of Cash Nutrition Assistance Program Benefits in Puerto Rico
Page 23
census blocks in Puerto Rico were used in the geocoding process. Census blocks are the smallest geographic area that the Census Bureau defines; in 2010, Puerto Rico was divided into more than 77,000 blocks (although some of them had a population of zero). For addresses that could not be located at the street, housing development, or neighborhood level, another step was necessary. The study team overlaid the census block information onto a map of Puerto Rico using Esri ArcMap software and used the population data contained in each block to obtain the population-weighted centroid of every barrio and ZIP Code in Puerto Rico. The latitude and longitude of the corresponding centroids were used for participant and store addresses that could not be located otherwise.
NAP units were classified as urban or rural based on ERS RRUC for metropolitan and nonmetropolitan municipalities in Puerto Rico for 2013. These codes are based on the 2010 decennial census. They form a classification scheme that distinguishes metropolitan municipalities by the population size of their metro areas; nonmetropolitan municipalities are distinguished by population size and whether they are adjacent to a metro area. The rural population was small, representing only 4.7 percent of units in June 2014.
Appendix A.1 provides more details on the extant data analysis methodology, and detailed tables are included in appendix B.4.
B. STUDY CONSIDERATIONS
Several factors merit attention when drawing conclusions based on the study findings presented in this report. Each of these is described briefly below.
Small subgroup sample sizes for NAP participants. Similar to other surveys, sample sizes for some subgroups of NAP participants, such as units with nonelderly members with disabilities, can be small. This condition reduces the reliability of estimates. Sample sizes for individuals with different characteristics within a subgroup may be even smaller. For example, the number of sample units with nonelderly members with disabilities living in rural areas was only 59. Due to these sample size limitations, survey tabulation cells with less than 10 responses were suppressed (see appendix A.2 for a description of sampling errors for subgroups).
Differences in units of measurement across different data sources. All extant data analysis findings are reported in terms of NAP units (e.g., “At least half of NAP units in urban areas lived within 0.5 miles of two retailers.”) However, the NAP survey findings are reported in terms of NAP participants or respondents (e.g., “Most NAP participants (89.2 percent) reported in the survey that they traveled by car to access NAP certified retailers.”) Although the sampling frame for the survey was NAP units, the respondents to the survey were individuals, and individuals (not units) do the shopping for the NAP unit. Focus group findings are reported in terms of groups (e.g., “In almost half of the focus groups, participants said some certified retailers in their areas do not give NAP participants cash back.”)
Differences between participant administrative data and reported characteristics. The study team identified some discrepancies between unit characteristics indicated in NAP administrative data and the self-reported responses. For example, survey respondents in some zero-income NAP units indicated they had other potential sources of cash income, possibly through odd jobs and other underreported types of income. In addition, some survey respondents who were classified as living in urban locations based on Census Bureau classifications self-reported living in rural locations, and vice versa. This may

Examination of Cash Nutrition Assistance Program Benefits in Puerto Rico
Page 24
reflect the subjective nature of how people view the area in which they live. We chose to use the ERS urban-rural classification to apply a consistent measure to examine urban versus rural differences.23
Limitations of qualitative stakeholder data. The stakeholder interview data cannot be used, by itself, to make definitive claims about the impact of discontinuing the cash portion of the NAP benefit. Given the relatively small number of stakeholders interviewed and their diverse experiences with NAP benefits, their opinions should not be considered in isolation. However, when integrated with other components of the study, the stakeholder analysis provides a rich and in-depth source of information about use of the cash portion of NAP benefits, barriers to redeeming the noncash portion of the benefit, and potential adverse effects of discontinuing the cash portion of the benefit.
Extant data analysis limitations. The extant data can be used to study where, when, and how NAP participants spent the noncash portion of their benefits, but its use is limited in the analysis of the cash portion of the benefit because once the cash is received by participants, no additional information is available on where and when it was used. Here the analyses of the survey and focus group data complement and supplement the extant data analysis.
23 After running and comparing tabulations based on self-reported and administrative data, no meaningful difference in the findings was observed.

Examination of Cash Nutrition Assistance Program Benefits in Puerto Rico
Page 25
III. HISTORY AND PURPOSE OF CASH PORTION OF NAP BENEFITS
This chapter describes the history and purpose of the cash component of NAP benefits in Puerto Rico over the past four decades. Since initial implementation in 1974, nutrition assistance in Puerto Rico has undergone substantial changes, evolving from a coupon-based entitlement program to the current block grant program delivered through an EBT system. The current EBT system in Puerto Rico makes 75 percent of a household’s benefit available for purchases at certified food retailers and 25 percent redeemable in cash (see figure III.1).
Figure III.1. Major Milestones in the History of The
Cash Portion of Puerto Rico’s Nutrition Assistance Program
Section A provides a brief history of Puerto Rico’s nutrition assistance through the FSP. Section B describes the formation of NAP. Sections C and D describe the transition to EBT and the 75/25 split in EBT benefit form. Section E provides a summary of recent research results.
A. NUTRITION ASSISTANCE UNDER FEDERAL FOOD STAMP PROGRAM: 1973–1982
Puerto Rico began receiving Federal nutrition assistance from the United States in November 1974, upon passage of the Agriculture and Consumer Protection Act of 1973.24 25 The legislation expanded FSP, which had been operational in the States since 1960, to Puerto Rico and other territories (Congressional 24 P. L. 91–671 (passed 1-11-71); Agriculture and Consumer Protection Act of 1973, P. L. 93–86 (passed 8-10-73) extended SNAP (then known as FSP) to the U.S. territories of Puerto Rico, Guam, and the Virgin Islands. 25 Though FSP was operational in Puerto Rico on November 1, 1974, Puerto Rico was not granted full coverage until a few years later, following the Food Stamp Act of 1977 ( P. L. 95–113).

Examination of Cash Nutrition Assistance Program Benefits in Puerto Rico
Page 26
Budget Office [CBO], 1977). As in the United States, FSP in Puerto Rico operated as an entitlement program under which all eligible persons received paper coupons that could be redeemed for food (Phoenix Planning & Evaluation, 1995a). Program participants received an “authorization to participate” card in the mail each month, which was then exchanged for paper coupons at local government offices throughout the island (USDA, 1983). The paper coupons could be redeemed only for eligible food items from certified food retailers; there was no exchange of coupons for cash (USDA, 1983).
During the first few years of FSP participation, Puerto Rico’s demand placed a substantial financial burden on the United States (CBO, 1977). By 1981, FSP in Puerto Rico provided $271 per capita per year, almost three times the $92 per capita provided to the poorest U.S. State at the time (Mathematica Policy Research [MPR], 1985a). Additionally, 56 percent of Puerto Rico’s residents were receiving benefits, a higher percentage of residents than in any of the States (U.S. Office of Management and Budget, 2005). In total, expenditures for Puerto Rico totaled 8 percent of all FSP dollars and accounted for 8 percent of the entire program’s participants (GAO, 1992).
B. TRANSITION TO BLOCK GRANT: 1982–1999
Beginning in July 1982, Congress replaced Puerto Rico’s FSP with an annual block grant to provide food assistance for needy persons through NAP.26 This step was taken in part to control FSP costs in Puerto Rico. Initially, $825 million was made available, representing approximately 75 percent of projected annual costs for FY 1982 (MPR, 1985a). For the first 5 years, funding for the block grant was capped at the original amount of $825 million (GAO, 1992). The program was funded primarily from the block grant; administrative expenses were shared 50/50 by Puerto Rico and the Federal Government.
Since 1986, the amount of the block grant steadily increased—largely to counteract inflation—and surpassed $1.5 billion beginning in FY 2006. Puerto Rico’s FY 2013–14 State Plan of Operations reported the total budget for NAP was approximately $2 billion, including the government of Puerto Rico’s share of the operating costs (ADSEF, 2014). Nearly 95 percent ($1.9 billion) of the total NAP budget was allocated for benefits to participants, with the remainder available for program administration.
The transition from the FSP entitlement program to the NAP block grant in 1982 shifted the administration of Puerto Rico’s program from the Federal Government to Puerto Rico, giving the island’s government more flexibility in administering the program. While NAP continued to serve the same program purpose as FSP (i.e., to “permit low income households to obtain a more nutritious diet . . . by increasing their food purchasing power”27) and operated via the same basic program structure, it differed from FSP in two important respects:
1. The income eligibility limits and benefit levels were reduced to bring program costs in line with the reduced funding level of the block grant. For example, households with incomes of more than 85 percent of the Federal poverty guideline (in July 1982) became ineligible, and benefit levels were reduced. For example, the maximum NAP benefit for a household of four was $199 compared with the previous maximum of $221 under FSP (MPR, 1985b).
2. Puerto Rico replaced the coupon system with checks that could be fully redeemed for cash. Participants received a paper check in the mail every month that could be cashed at any food
26 The Omnibus Budget Reconciliation Act of 1981; P. L. 97–35; later extended through P. L. 98–204. 27 From P. L. 95–113

Examination of Cash Nutrition Assistance Program Benefits in Puerto Rico
Page 27
retailer, check cashing business, bank, or other financial institution (Phoenix Planning & Evaluation, 1995a & 1995b).
The shift from issuing NAP benefits via coupons to paper check (with 100 percent of benefits paid in cash) was made to reduce administrative costs and simplify program operations. (USDA, 1983; MPR, 1985a; Phoenix Planning & Evaluation, 1995a). The use of checks eliminated some program abuse associated with the coupon system (for example, trafficking—that is, selling coupons for cash (USDA, 1983).
However, the transition did introduce other program vulnerabilities. With a cash-based benefit, ADSEF could no longer monitor where benefits were redeemed or what was purchased. (USDA, 1983; GAO, 1992). While NAP regulations specified that 100 percent of program benefits had to be redeemed for eligible food items,28 29 and ADSEF personnel explained these requirements to participants at application and recertification, once the check was cashed, it was impossible to confirm how the benefits were spent.
Perceptions regarding the use of cash benefits varied greatly among different stakeholders. Some stakeholders worried about the overall impact on Puerto Rico’s economy due to reduced levels of program funding possibly leading to lower economic activity. Others focused on whether NAP participants would continue to use the cash benefits to purchase nutritious food items, while still others feared the cash would be used for either illicit purposes (such as gambling and prostitution) or ineligible purchases (such as alcohol and tobacco products; USDA, 1983). A study conducted by MPR in 1985, however, found the shift from coupons to cash did not lead to any substantial changes in household food expenditures for program participants (MPR, 1985b). NAP households were generally using the cash benefits to purchase food at the same levels as under the coupon system.
Other concerns raised by both the public and Puerto Rico government officials focused on small food retailers (USDA, 1983). Small retailers feared the switch from coupons to checks would present a twofold disadvantage: first, small businesses might not have enough cash on hand to exchange for benefit checks, and second, any problems cashing checks might cause NAP participants to avoid small retailers altogether (USDA, 1983). Two separate surveys of NAP participants indicated that most did not change their shopping patterns with the shift to checks, rendering these concerns largely unfounded (USDA, 1983; MPR, 1985b).
C. TRANSITION TO EBT WITH 100-PERCENT CASH REDEMPTION: 1999–2000
Around the turn of the millennium, concern was growing that the system of delivering NAP benefits via mailing paper checks was costly, inefficient, and introduced program integrity concerns (Phoenix Planning & Evaluation, 1995a). In 1995, the GDB commissioned a feasibility study of implementing an EBT system in NAP to replace the paper checks.30 The study concluded that implementing EBT was feasible, would increase program efficiency, and despite a large initial investment, could result in administrative cost savings in the long term (Phoenix Planning & Evaluation, 1995a). However, the study described some notable challenges associated with EBT implementation, the foremost being Puerto 28 Provision of a Nutrition Assistance Grant for the Commonwealth Of Puerto Rico, 1982. 29 Eligible food is defined as any food or food product intended for human consumption except alcoholic beverages, tobacco, hot foods, and hot food products prepared for immediate consumption (ADSEF, 2015). 30 The interest in EBT in Puerto Rico tracked with developments in the States. Beginning in 1993, Congress began urging States to implement EBT in their FSPs. In 1996, Congress issued a mandate that all States have operational EBT systems by October 1, 2002.

Examination of Cash Nutrition Assistance Program Benefits in Puerto Rico
Page 28
Rico’s limited technological infrastructure in 1995. The study cited as evidence both the “limited deployment of POS (point-of-sale) and ATM terminals in Puerto Rico” and the fact that “an estimated 70 percent of the island’s retailers are small, independent merchants” unlikely to have the means to purchase new POS equipment (Phoenix Planning & Evaluation, 1995a, pp. IV-2 , IV-4). Furthermore, the study raised particular concern for implementing EBT in rural and underdeveloped parts of Puerto Rico, where the presence of banks, local financial institutions, and access to ATM-enabling connectivity were limited at the time (Phoenix Planning & Evaluation, 1995a). The study ultimately recommended EBT implementation to address administrative cost and program integrity concerns (Phoenix Planning & Evaluation, 1995a), but included the caveat that major infrastructure improvements would be needed.31
Prior to full EBT implementation, ADSEF conducted a pilot in Bayamón, a suburban municipality outside of Puerto Rico’s capital, San Juan, starting in November 1999. Under the pilot, NAP participants in Bayamón were issued EBT cards, which they could use to access 100 percent of their NAP benefits in cash via four different redemption mechanisms (ADSEF, 2001b):
Option 1: Receive cash by withdrawing benefits at a participating ATM
Option 2: Receive cash by withdrawing benefits as allowed by participating merchants at the retailer’s POS device (with no EBT food purchase)32
Option 3: Make an EBT food purchase and receive withdrawn cash at a participating retailer’s POS device
Option 4: Make an EBT food purchase with cash portion at a participating retailer’s POS device (receive no withdrawn cash)
After successfully implementing the pilot, Puerto Rico fully transitioned to an EBT card system in October 2000. Although ADSEF was committed to implementing EBT through a combination of cash and noncash redemption, the initial phase of EBT allowed NAP participants to withdraw up to 100 percent of their benefit dollars as cash (ADSEF, 2001a). There were no restrictions as to where the cash could be withdrawn.
The new benefit delivery approach resulted in some program efficiencies that benefited both the program and NAP recipients. For example, the electronic benefit distribution model enabled NAP recipients to access their monthly benefits in different ways. Benefits were delivered to participants sooner since the time to prepare, mail, and deliver checks was eliminated (ADSEF, 2000).
However, the new system also introduced some challenges, particularly for NAP participants. During the 1999 Bayamón pilot, limited literacy (both general and financial) within the NAP population created unexpected problems. For example, despite program EBT training for NAP participants, an evaluation of the pilot found that more than three-quarters of NAP participants in the pilot area did not understand the term or concept of debit, more than a third did not understand the term or concept of direct deposit, and a quarter did not understand the meaning of automatic teller (Macpherson de Sánchez et al., 2000)—all critical concepts for successful use of benefits under the EBT system.
31 It is important to note the 1995 study only looked at the cost, feasibility, and potential challenges to of EBT implementation, and did not consider potential impact on NAP recipients. 32 The Puerto Rico government did not provide EBT POS equipment to retailers in the pilot area. Thus, only retailers who already had commercial POS systems were able to accept benefits via EBT and participate in redemption mechanism options 2, 3, and 4.

Examination of Cash Nutrition Assistance Program Benefits in Puerto Rico
Page 29
A 2004 ADSEF report outlined the impact of the change on various stakeholders, including certified retailers. Survey data indicated 93 percent of the certified retailers said their sales either increased or stayed the same with the switch from checks to the EBT card. In addition, both large and small certified retailers reported positive experiences with the switch to the EBT system, despite a slight cost required for retailer certification (ADSEF, 2004).
D. TRANSITION TO 75-PERCENT NONCASH AND 25-PERCENT CASH REDEMPTION: 2001
In 2001, ADSEF restricted how and where NAP benefits could be redeemed. Beginning September 1, 2001, at least 75 percent of a participant’s NAP benefits could be redeemed only through purchases made via the EBT card at certified retailers’ POS devices. These “targeted benefits” could not be withdrawn as cash (ADSEF, 2001b). The remainder of a participant’s NAP benefits, up to 25 percent, was designated as “non-targeted benefits” that could be withdrawn as cash (ADSEF, 2001b). The purpose for this shift toward targeted benefits was to align NAP more closely with the regulations that governed SNAP; specifically, regulations on what and where benefits could be used (ADSEF, 2000). ADSEF indicated that the “75/25 initiative . . . encourages and enforces the utilization of the benefit as established in Federal law and regulations—only for the acquisition of food” (ADSEF, 2001b, p. 7). Furthermore, ADSEF expected this change to “dramatically reduce improper use of targeted funds,” “greatly enhance the program’s image,” and “promote better nutrition for . . . participants” (ADSEF, 2001b, p. 7).
1. Purpose of Maintaining 25-Percent Cash Portion of Benefit
When ADSEF was planning the shift to implement targeted NAP benefits in 2001, it was understood this would put certain stakeholders at a disadvantage. According to ADSEF officials, the decision to continue to make 25 percent of the NAP benefit available as cash was made for the following purposes:33
1. To ensure NAP recipients who lived in remote parts of Puerto Rico (or who faced other mobility or transportation barriers) could still purchase basic food items from the closest or most easily accessed retailers, regardless of whether the retailers were certified
2. To allow retailers in remote areas of Puerto Rico to serve NAP participants, even if they did not have access to the technological infrastructure necessary to operate EBT
The cash portion also enabled NAP participants to purchase staple food items, such as bread and milk, from small neighborhood retailers (many of whom were unlikely to be certified for participation in NAP). The purpose was to support existing food shopping patterns and preferences of residents in Puerto Rico.34
2. Initial Challenges and Benefits of Implementing the 75-Percent/ 25-Percent Redemption
Implementation of the new benefit structure had major implications for NAP participants, retailers, and ADSEF, the agency that administers NAP. For ADSEF, implementation brought both advantages and challenges. Designating targeted benefits introduced a new mechanism by which to monitor and 33 ADSEF, personal communication, June 17, 2014. 34 ADSEF, personal communication, June 17, 2014.

Examination of Cash Nutrition Assistance Program Benefits in Puerto Rico
Page 30
enforce benefits redeemed for eligible food items (ADSEF, 2001b). At the same time, ADSEF had to develop (1) a system to certify retailers and (2) criteria by which to monitor them and create enforcement mechanisms to ensure retailer compliance. For example, ADSEF could require authorized retailers to offer an adequate variety of eligible food items. This was the beginning of the distinction between NAP certified and uncertified retailers. These changes also required ADSEF to dedicate personnel to the ongoing management and monitoring of retailer authorization and compliance.
For NAP participants, the change meant they could redeem most of their benefits only at certified retailer locations. ADSEF had to implement new training for retailers on the difference between the cash and noncash benefit portions, what items were allowed for purchase with the noncash benefits, and where benefits could be redeemed.
Under the new NAP structure, retailers in Puerto Rico had to decide whether to become certified to accept EBT benefits. Retailers who chose not to obtain certification or who did not meet the certification requirements were excluded from sales equal to 75 percent of all NAP benefits. Retailers who decided to pursue certification had to apply and pay an initial $35 application fee plus an annual $35 for recertification. Once certified, retailers were also responsible for the costs associated with obtaining (via purchase or rental) the POS equipment needed to accept the noncash benefit. Operating the POS system also required analog or digital connectivity capabilities, adding additional costs for certified retailers. Finally, retailers were subject to pay a per-transaction fee to the POS vendor.
The initial application and recertification process required retailers to submit a form to ADSEF, provide documentation regarding any criminal records and outstanding debts, and document that their inventory included an adequate selection of eligible food items. Once certified, retailers became responsible for enforcing the benefit restrictions. This meant storeowners and managers became responsible for ongoing training and monitoring employees to ensure full compliance with NAP rules. Failure to do so could subject retailers to penalty or disqualification from NAP.
The NAP benefit structure has included the 75-percent targeted (noncash) and 25-percent non-targeted (cash) benefit formula since September 2001. It is one of the key differences between NAP and SNAP. In February 2014, Congress passed legislation that requires Puerto Rico to phase out the cash portion of the NAP benefit. Section 4025 of the Agricultural Act of 201435 requires the gradual discontinuation of the cash portion by FY 2021.
E. RECENT STUDIES ON USE OF 25-PERCENT CASH PORTION OF BENEFIT
Three recent studies have examined the use of the 25-percent cash portion of the benefit as well as its advantages and disadvantages. First, a 2004 ADSEF report assessed the participant and retailer satisfaction with the benefits. As part of the study, NAP participants were asked about their spending patterns, specifically their use of the cash portion. Nearly two-thirds of NAP recipients confirmed using the cash portion of the benefit to purchase cleaning supplies or hygiene products, or to complete a general purchase (ADSEF, 2004). A smaller proportion of respondents, approximately 30 percent, confirmed using the cash portion on medicine and electric bill payments (ADSEF, 2004). Overall, retailers were pleased with the shift from the check system to the EBT system: 60 percent of retailers polled reported they had not experienced any disadvantages from use of the EBT card. Among the disadvantages cited by the remaining retailers were the restrictions on the purchase of nonfood items 35 See Agricultural Act of 2014 (2014); the legislation included reauthorization of the Food and Nutrition Act of 2008.

Examination of Cash Nutrition Assistance Program Benefits in Puerto Rico
Page 31
(ADSEF, 2004). A second internal ADSEF study found relatively few (21.2 percent) of the 665 NAP participants interviewed were aware the cash portion of the benefit was intended only for purchase of eligible food items (Rosado-González, 2008).
A 2010 study that examined the feasibility of implementing SNAP (instead of NAP) in Puerto Rico further documented that at least some of the 25-percent cash portion of the benefit under the current NAP structure is used for nonfood expenditures such as medicine and hygiene products (Peterson et al., 2010). The study showed that in the absence of other Federal cash assistance programs, such as SSI, the cash portion of the NAP benefit has assumed an importance beyond nutrition assistance. Furthermore, when asked about the loss of the 25-percent cash portion of the NAP benefit if Puerto Rico transitioned to SNAP, NAP participants interviewed for the study opposed eliminating the cash portion of the benefit. The study also found the potential loss of the 25-percent cash portion of the benefit might affect retailers who are not certified or able to accept EBT cards, particularly small businesses and food markets in rural areas, as participants would be able to acquire food only from certified retailers.

Examination of Cash Nutrition Assistance Program Benefits in Puerto Rico
Page 32
IV. ACCESS TO RETAILERS AND NONCASH BENEFIT REDEMPTION PATTERNS AMONG NAP PARTICIPANTS
This chapter synthesizes data from extant administrative and EBT transaction data and primary NAP survey, focus group, and interview data to offer a comprehensive picture of whether NAP participants currently face barriers to the redemption of noncash NAP benefits.
Section A describes participants’ geographic access to certified NAP retailers using the residential addresses of program participants and retailer locations. Limited geographic access to certified retailers could suggest potential barriers to using the noncash portion of benefits.
Section B examines the noncash benefit redemption patterns of program participants using transaction-level administrative data, and compares them across different levels of geographic access to food stores. Differences in redemption patterns could also suggest barriers to redeeming noncash benefits. For example, differences in the average number and amount of noncash redemptions and amount of noncash benefits remaining at the end of a benefit month by geographic access could indicate barriers.
Sections C and D present participant and retailer perspectives on redeeming the noncash portion of NAP benefits based on NAP survey results, focus groups, and stakeholder interviews. Section C describes participants’ reported shopping practices and perceptions on the ease or difficulty of accessing certified retailers. Section D presents retailer perspectives on the NAP certification process and redemption of NAP benefits.
A. NAP PARTICIPANTS’ GEOGRAPHIC ACCESS TO CERTIFIED RETAILERS
This section characterizes geographic access to food using two distinct measures:
1. The distance from where a NAP participant lives to the nearest certified retailer
2. The number of certified retailers located within selected distances of participants’ homes
1. How far away are the nearest NAP retailers?
Most NAP participants36 lived near a certified retailer where they could redeem the noncash component of their benefits. At least three-quarters of NAP units lived within 0.5 mile of a certified retailer, and half lived within 0.2 mile of a certified retailer (see figure IV.1).
With respect to type of certified retailer, at least half of NAP units lived within 0.8 mile of a supermarket, superstore, or large grocery store (all hereafter referred to as a supermarket), and three-quarters lived within 1.5 miles of a supermarket. They lived farthest from convenience stores and small combination stores (median distance of 1.0 mile) and closest to small and medium grocery stores (median distance of 0.4 mile).
36 NAP participants include those certified and receiving benefits from July 2013 to June 2014.

Examination of Cash Nutrition Assistance Program Benefits in Puerto Rico
Page 33
Figure IV.1. Distribution of Distance (in Miles)To Nearest NAP Certified Retailer by Store Type
Source: SAIC and SDEC data
Geographic accessibility to certified retailers did not vary across subgroups of NAP participants (see table IV.1).
Table IV.1. Median Distance (in Miles) to Nearest NAP Retailer by Store Type and Unit Subgroup
Type of Store
Population Group
All Retailersa
Supermarkets, Superstores,
Large Grocery Stores
Small and Medium Grocery Stores
Large General Stores, Large Combination
Stores, Wholesalers
Convenience or Small
Combination Stores
Other Stores
All units 0.2 0.8 0.4 0.6 1.0 0.9 Units with children 0.2 0.8 0.4 0.6 1.0 0.9 Units without children 0.2 0.8 0.4 0.6 1.0 0.9 Units with elderly members 0.2 0.8 0.4 0.6 1.0 0.9 Units without elderly members 0.2 0.8 0.4 0.6 1.0 0.9

Examination of Cash Nutrition Assistance Program Benefits in Puerto Rico
Page 34
Type of Store
Population Group
All Retailersa
Supermarkets, Superstores,
Large Grocery Stores
Small and Medium Grocery Stores
Large General Stores, Large Combination
Stores, Wholesalers
Convenience or Small
Combination Stores
Other Stores
Units with nonelderly members with disabilities 0.2 0.8 0.4 0.7 1.0 0.9 Units without nonelderly members with disabilities 0.2 0.8 0.4 0.6 1.0 0.9 Units with income 0.2 0.8 0.4 0.7 1.0 0.9 Units without income 0.2 0.8 0.4 0.6 1.0 0.9 Source: SAIC and SDEC data Notes
The distances in this table represent the median of the distribution of distances between each unit’s home and the nearest store, for each type of store. At least half of all units live within the median distance to each store type. a The median distance to any nearest retailer can be less than the median distance to the nearest store for each store type. As an example, if there are three people and two types of stores, and the distances to the first store type are 0.2, 0.4, and 0.4 and the distances to the second store type are 0.4, 0.2, and 0.4, respectively, then the median distance to each type of store is 0.4 miles, but the median distance to any retailer is 0.2 miles. This reflects that units live close to at least one type of store, but units differ in the type of store that is closest to their home.
2. How many NAP retailers are located where NAP participants live?
This section presents the median number of certified retailers located within selected distances of participants’ homes. For consistency with other analyses of retailer access, we use the following distance measures:37
In urban areas, we use distance measures of “less than 0.5 miles,” “0.5 to less than 1 mile,” and “1 to less than 2 miles.”
In rural areas, we use areas of “less than 1 mile,” “1 to less than 2 miles,” and “2 to less than 5 miles.”
Many NAP units living in urban areas had access to multiple retailers near where they lived. At least half of units in urban areas lived within 0.5 miles of two retailers and within 1 mile of seven retailers (see table IV.2). In terms of store type, at least half had one supermarket within 0.5 to 1 mile, and three supermarkets within 1 to 2 miles, of where they lived. Small and medium grocery stores were the most common types of retailer near participants’ homes.
NAP units in rural areas also had access to multiple retailers near where they lived. At least half of units in rural areas lived within 1 mile of five retailers and within 2 miles of nine retailers (see table IV.2). Similar to urban households, distances to supermarkets for rural households were farther. At least half of all rural NAP units had no supermarket within 2 miles of where they lived, but had one supermarket
37 It is typical to assess geographic access using longer distances in rural areas than in urban areas (Mabli, 2014; Ver Ploeg et al., 2012).
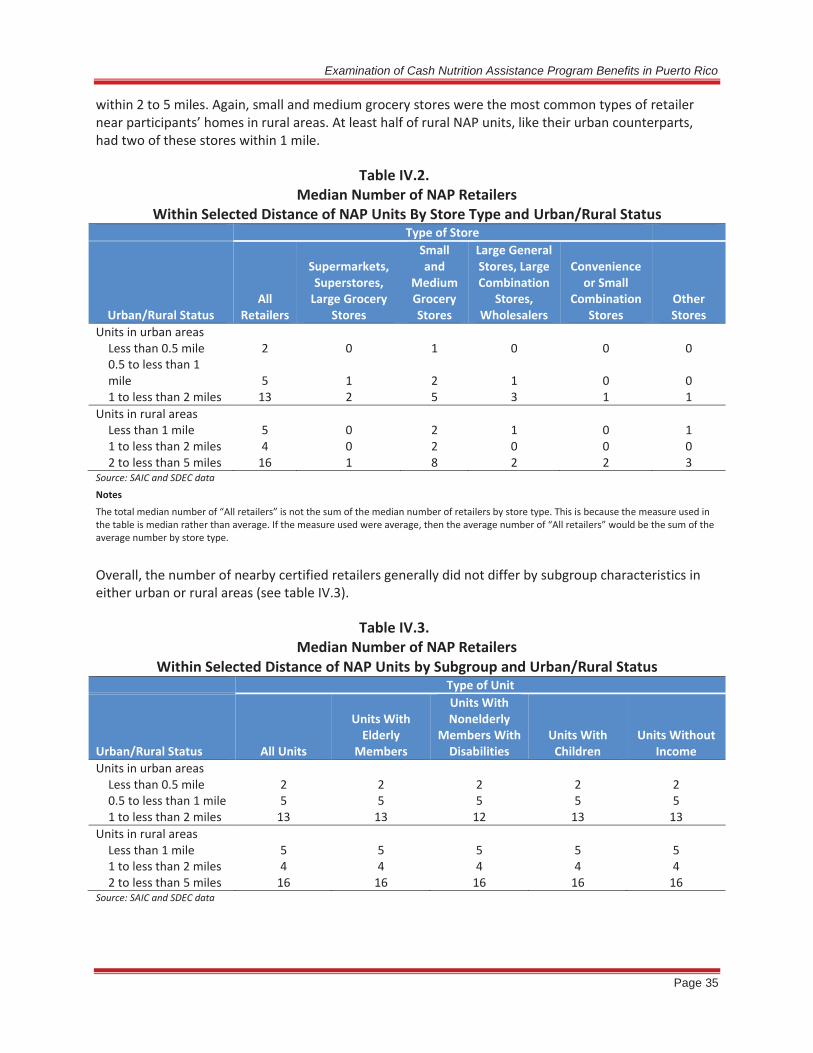
Examination of Cash Nutrition Assistance Program Benefits in Puerto Rico
Page 35
within 2 to 5 miles. Again, small and medium grocery stores were the most common types of retailer near participants’ homes in rural areas. At least half of rural NAP units, like their urban counterparts, had two of these stores within 1 mile.
Table IV.2. Median Number of NAP Retailers
Within Selected Distance of NAP Units By Store Type and Urban/Rural Status Type of Store
Urban/Rural Status All
Retailers
Supermarkets, Superstores,
Large Grocery Stores
Small and
Medium Grocery Stores
Large General Stores, Large Combination
Stores, Wholesalers
Convenience or Small
Combination Stores
Other Stores
Units in urban areas Less than 0.5 mile 2 0 1 0 0 0 0.5 to less than 1 mile 5 1 2 1 0 0 1 to less than 2 miles 13 2 5 3 1 1
Units in rural areas Less than 1 mile 5 0 2 1 0 1 1 to less than 2 miles 4 0 2 0 0 0 2 to less than 5 miles 16 1 8 2 2 3
Source: SAIC and SDEC data Notes
The total median number of “All retailers” is not the sum of the median number of retailers by store type. This is because the measure used in the table is median rather than average. If the measure used were average, then the average number of “All retailers” would be the sum of the average number by store type.
Overall, the number of nearby certified retailers generally did not differ by subgroup characteristics in either urban or rural areas (see table IV.3).
Table IV.3. Median Number of NAP Retailers
Within Selected Distance of NAP Units by Subgroup and Urban/Rural Status Type of Unit
Urban/Rural Status All Units
Units With Elderly
Members
Units With Nonelderly
Members With Disabilities
Units With Children
Units Without Income
Units in urban areas Less than 0.5 mile 2 2 2 2 2 0.5 to less than 1 mile 5 5 5 5 5 1 to less than 2 miles 13 13 12 13 13
Units in rural areas Less than 1 mile 5 5 5 5 5 1 to less than 2 miles 4 4 4 4 4 2 to less than 5 miles 16 16 16 16 16
Source: SAIC and SDEC data

Examination of Cash Nutrition Assistance Program Benefits in Puerto Rico
Page 36
B. NAP BENEFIT REDEMPTION PATTERNS BASED ON TRANSACTION ANALYSIS
This section analyzes EBT transaction data to describe where NAP participants actually shopped with their noncash NAP benefits as compared with the previous section, which describes where they could shop. In addition to describing NAP household benefit redemption patterns, the findings presented here compare spending patterns for units with greater and less geographic access to certified retailers. By examining differences in redemption patterns by geographic access, we are able to assess whether participants face potential barriers to using the noncash portion of benefits.
1. Do NAP participants shop at the certified retailer closest to home?
Only a small percentage (8.2 percent) of NAP units redeemed their noncash benefits at the certified NAP retailers closest to their homes (see figure IV.2).38 Among the other NAP units (91.8 percent), the additional distance they traveled to spend their benefits varied. More than a third of units (35.2 percent) traveled up to 1 mile farther than the nearest certified retailer to purchase food, and 13.9 percent traveled more than 5 miles.
Figure IV.2. Distribution of Distance (in Miles) to Nearest Retailer
Where Participants Redeem Benefits Versus Distance to Nearest Retailer
Source: SAIC and SDEC data Note
Distance of 0 miles indicates NAP units that redeem noncash benefits at nearest certified retailer. 38As described in chapter II and appendix A.1, the distribution of distances consists of unit-months and is based on the median distance to the nearest retailers where participants redeemed NAP benefits, by store type, compared with the median distance to the nearest retailer.

Examination of Cash Nutrition Assistance Program Benefits in Puerto Rico
Page 37
In addition, at least half of NAP units traveled 1.6 miles from their homes to purchase food with their EBT benefits, which is eight times farther than the median distance to the nearest retailer (0.2 miles) (see figure IV.3). The supermarkets where NAP units redeemed noncash benefits were about 2.5 times farther than the distance to the nearest supermarket (2.0 versus 0.8 miles).
These findings suggest that many participants not only have adequate access to certified retailers, but also have access to multiple retailers and are able to choose where to shop. The finding that participants tend to travel further than the nearest certified retailer to shop for food is also common among SNAP participants in the continental United States,39 and may reflect the importance of low prices and sales in determining where participants shop, as discussed in section C.2 and chapter VI.
Figure IV.3. Median Distance (in Miles) to Nearest Retailer Where Participants Redeem Benefits
Versus Median Distance to Nearest Retailer by Type of Retailer
Source: SAIC and SDEC data Note For each retailer category, the sample includes the monthly cycles of units only when units shop at that store type during that month.
These general findings apply to NAP units living in both urban and rural areas (see table IV.4). For some store types, however, the additional distance traveled was more sizable in rural areas than in urban ones. Specifically, rural participants traveled farther than the closest retailer compared with urban participants when shopping at large general stores, large combination stores, and wholesalers or other store types. Participants traveled 14 times as far in rural areas to shop at these stores compared with 8
39See, for example, Mabli and Worthington (2015).

Examination of Cash Nutrition Assistance Program Benefits in Puerto Rico
Page 38
times as far in urban areas. This is a sizable difference, though as described in chapter I, NAP units in rural areas make up less than 5 percent of all units.
Table IV.4. Median Distance (in Miles) to Nearest Retailer Where Participants Redeem Noncash Benefits
Versus Median Distance to Nearest Retailer by Type of Retailer and Urban/Rural Status Urban/Rural Status
Type of Retailer All Units Units in Urban Areas Units in Rural Areas All Retailers
Retailers where benefits are redeemed 1.6 1.6 2.3 Retailers closest to home 0.2 0.2 0.3
Supermarkets, Superstores, Large Grocery Stores Retailers where benefits are redeemed 2.0 1.9 3.7 Retailers closest to home 0.8 0.8 1.7
Small and Medium Grocery Stores Retailers where benefits are redeemed 1.8 1.8 1.6 Retailers closest to home 0.3 0.3 0.4
Large General Stores, Large Combination Stores, Wholesalers
Retailers where benefits are redeemed 3.2 3.2 8.3 Retailers closest to home 0.6 0.6 0.6
Convenience or Small Combination Stores Retailers where benefits are redeemed 1.8 1.9 1.2 Retailers closest to home 0.7 0.7 0.6
Other Stores Retailers where benefits are redeemed 3.9 3.6 16.5 Retailers closest to home 0.7 0.7 0.6
Source: SAIC and SDEC data and Centinela EBT transaction data
The amount of additional distance traveled varied little across unit subgroup types (see appendix table B.4.a).
2. What is the average number of transactions and the average purchase amount per transaction for the noncash benefit component?
NAP units averaged 4.2 purchase transactions per month with the noncash component of their benefits (data not shown). There is, however, a wide range in the number of monthly transactions across units: 18.8 percent of units made a single transaction per month, and 34.4 percent made two to three transactions (see figure IV.4). Nearly 13 percent made at least eight transactions per month.40 41
40 Note that 1.2 percent of units had no transactions. 41 As described in chapter II, the distribution of transactions is made up of unit-months.

Examination of Cash Nutrition Assistance Program Benefits in Puerto Rico
Page 39
Figure IV.4. Number of Transactions Made per Month
Source: SAIC and SDEC data and Centinela EBT transaction data Notes Data on which estimates are based exclude transactions from the month of June because data for the full cycle, which ended in July 2014, are not available. On average, 4.2 transactions were made per month.
Most transactions were relatively small. Nearly 10 percent of purchases were for less than $20, and close to 40 percent consisted of purchases less than $40 (see figure IV.5). The average amount spent per transaction was sizably larger, however, at $60.41, and 14.9 percent of transactions were more than $100. In a typical month, the average total noncash benefit redemption was $178.09.

Examination of Cash Nutrition Assistance Program Benefits in Puerto Rico
Page 40
Figure IV.5. Average Transaction Amount
Source: SAIC and SDEC data and Centinela EBT transaction data Notes
Data on which estimates are based exclude transactions from the month of June because data for the full cycle, which ended in July 2014, are not available. The average transaction amount per month was $60.41.
Types of certified stores where participants redeem noncash benefits
Most transactions took place at supermarkets; this category of stores also had the largest average purchase amount. Supermarket purchases accounted for two-thirds (66.8 percent) of noncash transactions (see figure IV.6) with a per-transaction average of $60.72 (see appendix table B.4.b).42 As a result, three-quarters (75.4 percent) of total noncash NAP benefits were redeemed at supermarkets (see figure IV.7).
Large general stores, combination stores, and wholesalers accounted for the next largest number (16.8 percent) of transactions, and 14.6 percent of total noncash benefits redeemed. NAP units used their benefits at convenience stores least frequently, making up only 1.7 percent of transactions and 1.2 percent of total benefits redeemed. The average transaction amount at a convenience store was $1.48 (see appendix table B.4.b).
42 To estimate the average transaction amounts presented in this chapter, we included units without any transactions. Appendix table B.4.d presents the average transaction amounts as well, but excludes units without transactions; for example, it shows the average amount spent at a supermarket among units that shop at a supermarket.

Examination of Cash Nutrition Assistance Program Benefits in Puerto Rico
Page 41
Figure IV.6. Percentage of Noncash Transactions Made at Different Types of Certified Retailers
Source: SAIC and SDEC data and Centinela EBT transaction data Notes Data on which estimates are based exclude transactions from the month of June because data for the full cycle, which ended in July 2014, are not available.

Examination of Cash Nutrition Assistance Program Benefits in Puerto Rico
Page 42
Figure IV.7. Percentage of Noncash Benefits Spent by Type of Certified Retailer
Source: SAIC and SDEC data and Centinela EBT transaction data Notes Data on which estimates are based exclude transactions from the month of June because data for the full cycle, which ended in July 2014, are not available.
Units with different characteristics varied somewhat in how frequently they redeemed noncash benefits and how much they spent, on average, for each purchase (see table IV.5). For example, units with children made an average of 5.7 purchases in a month, with an average value of $68.77 per transaction, while units without children made an average of 3.4 transactions, at $56.03 per transaction. Units with income made an average of 5.0 purchases in a month, with an average value of $63.46, and units without income made an average of 3.7 transactions, at $58.74 per transaction. Units without elderly members or nonelderly members with disabilities redeemed benefits more often than did units with members of those subgroups, although within each comparison group the per-transaction amounts were very similar.

Examination of Cash Nutrition Assistance Program Benefits in Puerto Rico
Page 43
Table IV.5. Average Number of Transactions And
Average Transaction Amount of Noncash Benefits by Unit Subgroup
Population Group Average Number of
Transactions per Unit Average Transaction
Amount ($) All units 4.2 60.41 Units with children 5.7 68.77 Units without children 3.4 56.03 Units with elderly members 3.5 59.64 Units without elderly members 4.5 60.81 Units with nonelderly members with disabilities 3.8 58.99 Units without nonelderly members with disabilities 4.2 60.70 Units with income 5.0 63.46 Units without income 3.7 58.74 Source: SAIC and SDEC data and Centinela EBT transaction data Notes
This table excludes transactions from the month of June because data for the full cycle, which ended in July 2014, are not available.
Proximity to certified stores showed little association with the number of transactions and average noncash purchase amount (see table IV.6). Units with greater geographic access (living less than the median distance to the nearest retailer) made an average of 4.2 purchases per month with the noncash portion of their benefits, compared with 4.1 times per month for units with less geographic access (living more than the median distance to the nearest retailer). The average transaction amounts for these two subgroups were $59.59 and $61.22, respectively.43
Similar results are found when access is measured in terms of a unit’s distance to the nearest certified supermarket.
Table IV.6. Average Number of Transactions And
Average Transaction Amount of Noncash Benefits By Degree of Geographic Access to Retailers
Degree of Access Average Number of
Transactions per Unit Average Transaction
Amount ($) All units 4.2 60.41 Defining access using distance to all certified retailers
Units with greater geographic access 4.2 59.59
Units with less geographic access 4.1 61.22
43 The lack of a difference by degree of geographic access in the number of transactions and the average transaction amount was robust to using alternative definitions of access. Units defined as having less access if they lived farther than the 75th percentile of distance to the nearest retailer and having greater access if they lived within the 25th percentile of distance to the nearest retailer resulted in 4.2 transactions in areas of greater access and 4.0 transactions in areas of less access. The average transaction amounts were $60.27 and $62.46, respectively.

Examination of Cash Nutrition Assistance Program Benefits in Puerto Rico
Page 44
Degree of Access Average Number of
Transactions per Unit Average Transaction
Amount ($) Defining access using distance to certified supermarkets
Units with greater geographic access 4.3 58.25
Units with less geographic access 4.0 62.56
Source: SAIC and SDEC data and Centinela EBT transaction data Note
This table excludes transactions from the month of June because data for the full cycle, which ended in July 2014, are not available.
Finally, differences in noncash redemption frequency and transaction amount were comparable between households in urban and rural areas (see table IV.7).
Table IV.7. Average Number of Transactions And
Average Transaction Amount of Noncash Benefits by Unit Location
Unit Location Average Number of
Transactions per Unit Average Transaction
Amount ($) Urban 4.2 60.12 Rural 4.0 66.16 Source: SAIC and SDEC data and Centinela EBT transaction data Note
This table excludes transactions from the month of June because we do not have data for the full cycle, which ended in July 2014.
These findings suggest that participants in areas with less geographic access to food or living in rural locations do not face more barriers to the redemption of their noncash benefit than do other participants.
3. How quickly do NAP participants spend the noncash portion of their benefits and what is the value of unspent benefits?
This section examines how quickly participants spend the noncash portion of their benefits and whether participants who live closer to retailers exhaust their benefits more quickly than do those who live farther away. In addition to looking at the average percentage of benefits spent at certain points in the issuance month, it examines benefit balances at the end of the monthly issuance cycle.44 Incomplete drawdown of noncash monthly benefits may suggest potential challenges to accessing certified retailers and using the noncash benefit.
On average, NAP units spent more than one-third of their noncash benefits (38.2 percent) on the first day of issuance and about four-fifths (79.5 percent) by the end of the first week after issuance (see table IV.8). By the end of the second week, units spent 91.4 percent of their noncash benefits, on average. 44Because the amount of benefits carried over each month was not available in the transaction data, the percentages of benefits spent at various points throughout the month were defined in relation to the benefit amount issued for a month (not out of the cumulative benefit amount at the start of the cycle).

Examination of Cash Nutrition Assistance Program Benefits in Puerto Rico
Page 45
Units redeemed 96.4 percent of their noncash benefits by the end of the third week and 99.0 percent by the last day of the monthly issuance cycle.
This pattern was similar across subgroups, by urban and rural location, and by geographic access to retailers (see tables IV.9 and IV.10).45
Table IV.8. Cumulative Percentage Noncash Benefits
Redeemed by Time Since Issuance Across Subgroups
Population Group Day 1 Day 7 Day 14 Day 21 End of Month
All units 38.2 79.5 91.4 96.4 99.0 Units with children 42.0 80.9 92.2 96.9 99.3 Units without children 36.2 78.8 91.1 96.1 98.9 Units with elderly members 32.9 76.7 90.3 96.0 99.2 Units without elderly members 40.9 81.0 92.1 96.6 98.9 Units with nonelderly members with disabilities 41.1 81.9 92.8 97.1 99.2 Units without nonelderly members with disabilities 37.6 79.0 91.2 96.2 99.0 Units with income 39.1 80.0 91.9 96.8 99.4 Units without income 37.6 79.2 91.2 96.1 98.8 Source: SAIC and SDEC data and Centinela EBT transaction data Note This table excludes data from August and September 2013 because NAP participants received benefit bonuses at the end of these months, increasing the proportions of benefits remaining for these units mid-month. June 2014 data are included in this table for the portion of the monthly cycle for which we have transaction information. The end-of-month cells exclude all June unit-cycles because these end in July, which is outside of the data extract period.
Table IV.9.
Cumulative Percentage of Benefits Redeemed by Week and Unit Location Unit Location Day 1 Day 7 Day 14 Day 21 End of Month Urban 38.1 79.4 91.4 96.4 99.0 Rural 39.9 80.8 92.0 96.6 99.1 Source: SAIC and SDEC data and Centinela EBT transaction data Note This table excludes data from August and September 2013 because NAP participants received benefit bonuses at the end of these months, increasing the proportions of benefits remaining for these units mid-month. June 2014 data are included in this table for the portion of the monthly cycle for which we have transaction information. The end-of-month cells exclude all June unit-cycles because these end in July, which is outside of the data extract period.
45 These findings were robust to defining geographic access using distance to supermarkets, rather than distance to all retailers.

Examination of Cash Nutrition Assistance Program Benefits in Puerto Rico
Page 46
Table IV.10. Cumulative Percentage of Benefits Redeemed by Week and Degree of Access
Unit Location Day 1 Day 7 Day 14 Day 21 End of Month
All units 38.2 79.5 91.4 96.4 99.0 Units with greater geographic access 38.5 79.6 91.5 96.4 99.0 Units with less geographic access 37.8 79.4 91.4 96.4 99.0 Source: SAIC and SDEC data and Centinela EBT transaction data Note This table excludes data from August and September 2013 because NAP participants received benefit bonuses at the end of these months, increasing the proportions of benefits remaining for these units mid-month. June 2014 data are included in this table for the portion of the monthly cycle for which we have transaction information. The end-of-month cells exclude all June unit-cycles because these end in July, which is outside of the data extract period.
The average value of the noncash benefit remaining at the end of the issuance month was $1.38 (see table IV.11). The amount carried over varied little by access to certified retailers. When defining geographic access in terms of distance to the nearest supermarket, the difference between those with more versus less access was also very small.
Table IV.11. Value of Unspent Noncash Benefit at End of Issuance Month
By Degree of Access to Certified Retailers Degree of Access Value of Unspent Issuance ($) All units 1.38 Defining access using distance to all retailers
Units with greater geographic access 1.36 Units with less geographic access 1.40
Defining access using distance to supermarkets Units with greater geographic access 1.42 Units with less geographic access 1.35
Source: SAIC and SDEC data and Centinela EBT transaction data Note
This table excludes August and September 2013 data because NAP participants received benefit bonuses at the end of these months, complicating the estimations of unspent issuance. June 2014 data also are excluded because we do not have data on the amount participants spent by the end of the month.
The findings that NAP participants exhaust almost all of their noncash benefits each month, regardless of geographic access to retailers, provides further evidence that participants do not face significant barriers to redeeming their noncash benefits.
C. NAP PARTICIPANT PERSPECTIVES ON ACCESS TO CERTIFIED RETAILERS
To provide context for understanding the extant data findings and potential barriers to redeeming noncash benefits, this section uses findings from participant surveys, focus groups, and stakeholder interviews to present NAP participant perspectives on access to NAP certified retailers. It includes participants’ reported shopping practices and perceived ease or difficulty of accessing retailers.
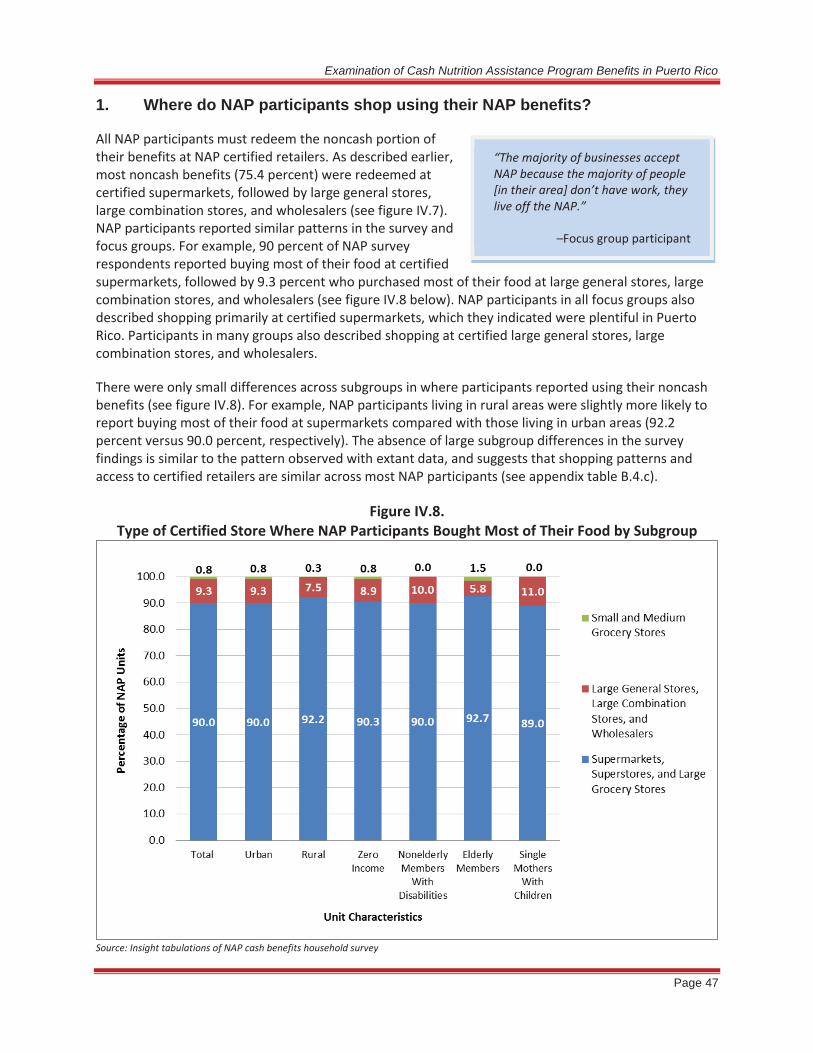
Examination of Cash Nutrition Assistance Program Benefits in Puerto Rico
Page 47
1. Where do NAP participants shop using their NAP benefits?
All NAP participants must redeem the noncash portion of their benefits at NAP certified retailers. As described earlier, most noncash benefits (75.4 percent) were redeemed at certified supermarkets, followed by large general stores, large combination stores, and wholesalers (see figure IV.7). NAP participants reported similar patterns in the survey and focus groups. For example, 90 percent of NAP survey respondents reported buying most of their food at certified supermarkets, followed by 9.3 percent who purchased most of their food at large general stores, large combination stores, and wholesalers (see figure IV.8 below). NAP participants in all focus groups also described shopping primarily at certified supermarkets, which they indicated were plentiful in Puerto Rico. Participants in many groups also described shopping at certified large general stores, large combination stores, and wholesalers.
There were only small differences across subgroups in where participants reported using their noncash benefits (see figure IV.8). For example, NAP participants living in rural areas were slightly more likely to report buying most of their food at supermarkets compared with those living in urban areas (92.2 percent versus 90.0 percent, respectively). The absence of large subgroup differences in the survey findings is similar to the pattern observed with extant data, and suggests that shopping patterns and access to certified retailers are similar across most NAP participants (see appendix table B.4.c).
Figure IV.8. Type of Certified Store Where NAP Participants Bought Most of Their Food by Subgroup
Source: Insight tabulations of NAP cash benefits household survey
“The majority of businesses accept NAP because the majority of people [in their area] don’t have work, they live off the NAP.”
–Focus group participant

Examination of Cash Nutrition Assistance Program Benefits in Puerto Rico
Page 48
NAP participants described several ways they identify which stores are certified. Participants in almost all focus groups said they identified certified stores by the NAP logo displayed prominently, such as in the store’s front door or window. Other ways included hearing by word of mouth the store accepted the EBT card, asking if the store accepted the EBT card, or seeing advertisements or publicity from the store informing customers that it accepts EBT benefits.
Among certified retailers visited for the study, signs to indicate they accepted NAP payments were displayed at about half of the NAP certified stores. The remaining stores had no signs to indicate they accepted NAP.
Another indication that NAP participants do not face barriers to redeeming their noncash benefits is that they seldom shop at uncertified retailers. One of the key reasons for maintaining the cash portion of benefits is to allow participants without access to certified retailers a way to purchase food at uncertified retailers. However, fewer than 1 in 10 NAP survey respondents (7.7 percent) reported ever shopping at uncertified retailers with their cash NAP benefits. In the few focus groups where any participants said they shopped at uncertified retailers, they said they shopped there only in emergencies or when they needed to supplement
their regular shopping trips. Prices were reportedly too high at uncertified retailers to shop there regularly.
NAP participants living in urban areas were more likely to shop at uncertified retailers than those in rural areas were (7.7 percent versus 4.6 percent, respectively; see figure IV.9). Thus, even in relatively remote areas, only a small fraction of NAP participants reported ever shopping at uncertified retailers with the cash portion of their benefits.
Figure IV.9. Percentage of NAP Participants Who Shopped at Uncertified Retailers
With the Cash Portion of Their NAP Benefits by Location
Source: Insight tabulations of NAP cash benefits household survey
NAP Logo
Source: http://www.metro.pr/locales/en-puerto-rico-se-bebe-ron-con-la-tarjeta-de-la-familia/pGXmie!D9d2WlcggZEE/

Examination of Cash Nutrition Assistance Program Benefits in Puerto Rico
Page 49
Among the NAP participants who used their cash benefits at uncertified retailers, more than a third (39.3 percent) indicated they mostly shopped at uncertified large general stores, large combination stores, and wholesalers, while the remainder shopped at relatively small uncertified stores (see figure IV.10).
Figure IV.10. Type of Uncertified Store Where NAP Participants Shopped
Using the Cash Portion of Their NAP Benefits
Source: Insight tabulations of NAP cash benefits household survey Note Universe for this figure is the 7.7 percent of NAP participants who reported ever shopping at uncertified retailers.
Chapter 5 discusses in more detail where and how participants spent the withdrawn cash portion of their benefits.
2. What factors influence where NAP participants shop?
Focus group participants identified several factors that influenced where they shopped; these factors were based largely on cost savings and accessibility. First, participants in all groups described the importance of low prices and sales in dictating where they shop; these participants mentioned shopping at different stores to find the cheapest prices and following the sales listed in the weekly coupon circulars. Some participants specifically mentioned shopping at stores that matched the sale prices of other stores. The importance of low prices in determining where participants shop may help
“We stretch the dollar. If I see that at [store 1] it’s $.99, sometimes at [store 2] they put it at $.69 and that’s when I go there because we have to stretch the dollar.”
–Focus group participant

Examination of Cash Nutrition Assistance Program Benefits in Puerto Rico
Page 50
explain the earlier finding that most participants travel farther than the nearest certified retailer to purchase food with the noncash portion of their benefits.
Second, accessibility was important in participants’ decisions on where to shop. In most groups, participants explained how the distance to the store, as well as the availability of transportation or whether they had money for transportation, affected the decision of where to shop. In a few groups, participants described choosing to shop at stores that offered delivery or transportation services.
Another factor cited in participant focus groups was the quality and variety of products. Finally, participants mentioned the importance of customer service. Specifically, these participants described avoiding stores where they were treated poorly by employees or were discriminated against for being NAP participants.
3. What factors influence when and how often NAP participants shop using the noncash component of their benefits?
According to focus group participants, two key factors dictated when and how often they shopped: (1) the monthly arrival of their NAP benefits and (2) the release of new sales or coupons.
Focus group participants indicated they usually do most of their shopping at a certified supermarket each month shortly after they receive their NAP benefits; they then shop two or three more times that month to replenish necessities or take advantage of new sales.46 Participants who were homeless or who had no proper food storage shopped more frequently (e.g., daily or every few days).
4. What types of food do NAP participants purchase using the noncash component of their benefits?
When asked whether they purchased perishable or nonperishable foods with their noncash benefits, almost all NAP survey respondents indicated they purchased both in the last 30 days. Overall, 98.7 percent of NAP participants purchased perishable food, and 95.2 percent purchased nonperishable food from a certified retailer (see appendix figure B.5.b.). Findings were similar for participants residing in urban and rural locations; they indicate participants were able to purchase perishable food as easily as nonperishable food from certified retailers.
46 Since benefit issuances are staggered throughout the month, the additional shopping trips referenced by focus group participants technically occur during the issuance period and do not necessarily fall within a single month.
“[I shop] once a month, when the benefits come. They come on the fourth, I go [shopping] on the fourth . . . I buy everything at once then.”
–Focus group participant
“A friend of mine takes us [grocery shopping]. We give her something for gas and she takes us.”
–Focus group participant “. . .I walk and they [store employees] deliver my shopping. It has to be a purchase of more than $50 for them to deliver it to your home.”
–Focus group participant “They walk. I have seen people walk kilometers with groceries in their hand, old people.”
–CBO administrator

Examination of Cash Nutrition Assistance Program Benefits in Puerto Rico
Page 51
5. How do NAP participants travel to certified versus uncertified stores?
Most NAP participants (89.2 percent) reported in the survey that they traveled by car to access the NAP certified retailers where they purchased most of their food (see figure IV.11). One out of every 10 participants (10.8 percent) indicated they walked, took public transportation, or traveled to the certified retailer some other way (e.g., rode a bike); these alternatives were more common among those living in urban areas (10.9 percent) than in rural areas (6.2 percent).
Overall, for participants in a majority of focus groups, it took less than 30 minutes to travel to the store. For those who got a ride to the store, some focus group participants reported they typically had to pay for the ride, even if it was from a friend or family member.
Figure IV.11. Mode of Travel to Certified Retailers
Where NAP Participants Bought Most of Their Food by Location
Source: Insight tabulations of NAP cash benefits household survey

Examination of Cash Nutrition Assistance Program Benefits in Puerto Rico
Page 52
Vieques Case Study
One exception to the travel modes described occurs in Vieques,47 a small rural island about 8 miles east of the main island of Puerto Rico. While there are certified stores on Vieques, participants there characterized them as having high prices and low quality. Among participants on Vieques, many opt to take the ferry to Fajardo, a city on the eastern shore of the main island of Puerto Rico, to do their monthly shopping. However, since it can take up to 12 hours round trip to do their shopping there, sometimes their perishable food spoils on the way back. As one participant in Vieques said, “we lose our food because a lot of it goes bad because of the time you wait . . .” Still, many perceived the trip to be worthwhile for higher quality food at lower prices.
Shopping support services for NAP participants
Focus group participants discussed several types of support services available to assist participants with their shopping. Some services were provided by the certified retailers, other services were provided by CBOs or group residential facilities, and additional assistance was often provided by family members. Participants in a few focus groups described how stores would deliver their groceries; this required either a minimum purchase amount or an additional fee (e.g., a $6 delivery charge). Other stores would provide transportation for participants after they finished shopping; in these instances, participants would travel to the store on their own, make a minimum purchase amount, and then would ride home with their groceries in a shared van provided by the store. Of the total retailers included in the study (certified and uncertified), approximately one-quarter offered some type of transportation assistance for their customers, including food delivery or providing a shuttle service to/from the store.
6. How easy or difficult is it to travel to certified versus uncertified retailers?
Almost all survey respondents (90.9 percent) reported it was easy to travel to the certified retailers where they bought most of their food (see figure IV.12).
Focus group participants also reported finding and traveling to certified stores was generally easy for them. When asked about any challenges in getting to or from stores, some focus group participants mentioned difficulties carrying their groceries, unreliable or lack of public transportation, high prices for transportation, and safety concerns (e.g., riding a bike across busy streets to the store).
47 As of the 2010 census, the population of Vieques was approximately 9,300.

Examination of Cash Nutrition Assistance Program Benefits in Puerto Rico
Page 53
Figure IV.12. Ease of Traveling to Retailers by Type
Source: Insight tabulations of NAP cash benefits household survey
Comparisons across participants living in urban and rural areas and other subgroups showed little variation in the degree of reported ease of traveling to certified retailers (see figure IV.13).
Figure IV.13. Reported Ease or Difficulty of NAP Participants
Traveling to Certified Retailers by Location and Unit Characteristics
Source: Insight tabulations of NAP cash benefits household survey

Examination of Cash Nutrition Assistance Program Benefits in Puerto Rico
Page 54
D. RETAILER PERSPECTIVES ON POTENTIAL BARRIERS TO REDEEMING NAP BENEFITS
This section provides retailer perspectives on potential barriers to becoming certified and redeeming NAP benefits, including NAP technology requirements, equipment costs, the certification process, transaction costs, and the advantages and disadvantages of being certified. Findings are based on interviews with 17 certified and 16 uncertified retailers across Puerto Rico. Chapter VI discusses retailer perspectives on the effect of discontinuing the cash portion of benefits.
1. Do retailers face technological or other barriers to redeeming NAP benefits?
Certified and uncertified retailers were asked about their existing infrastructure, the availability and cost of equipment needed to process EBT transactions, and their perceptions of fees associated with processing credit, debit, and NAP transactions. Retailers are required to have POS machines to process EBT cards in order to become NAP certified. Basic POS devices require an analog phone line, and more-sophisticated devices require an Internet connection. But battery-operated mobile POS devices are also available, and are currently used in the Family Market pilot program in Puerto Rico, which allows NAP participants to use their EBT cards to purchase food at farmers’ markets (see text box that follows).
Technology was not a barrier to becoming NAP certified. While almost all interviewed retailers had electricity and approximately two-thirds had a phone line, retailers without these services were still able to become certified and successfully process EBT transactions. For example, four retailers interviewed for this study were street vendors with neither electricity nor phone access; two of them were NAP certified and processed transactions using a battery-operated mobile POS device. In addition, two certified retailers had electricity but no phone line and were still able to process EBT transactions.
When uncertified retailers were asked why they were not certified, none, including small roadside vendors, reported technology as a barrier to NAP certification. Reasons for being uncertified included—
Lack of interest on the part of the retailer
Insufficient knowledge about NAP
Lack of demand from the customer base (i.e., high-income customer population)
Puerto Rico’s Family Market Pilot Program
The Family Market pilot program, approved by FNS in FY 2013, is a collaboration between the ADSEF and several Puerto Rico government agencies to promote the consumption of locally grown fresh food and agricultural products by allowing NAP participants to use their EBT cards to purchase food at participating farmers' markets. NAP participants receive an additional benefit amount on their Family Card each month that can be used exclusively at the Family Markets. The participating farmers are certified by ADSEF and use battery-operated mobile POS devices to process the EBT transactions. A farmer participating in the pilot program and interviewed by the study team described how there was no electricity, phone, or Internet at the market location; despite this, she was able to successfully process NAP transactions using the battery-operated mobile POS device.
Most retailers, both certified and uncertified, already accept credit and debit cards. Nearly all retailers (both certified and uncertified) who were interviewed currently accept and process credit/debit card transactions. Of the 33 retailers interviewed, only 4 uncertified retailers did not accept credit or debit
Examination of Cash Nutrition Assistance Program Benefits in Puerto Rico
Page 55
cards. Among these four, three were street vendors and one was a small bar/convenience store. Reasons for not accepting credit or debit cards varied: (1) the retailer had opened recently and was deciding whether to invest in credit/debit machines, (2) the retailer was a street vendor who chose to accept cash only, or (3) the retailer had accepted credit or debit cards in the past and chose not to accept these forms of payment any longer.
Transaction costs were not a significant barrier to becoming NAP certified. According to ADSEF officials, transaction fees for EBT cards are set by the retailers’ banks and range from 12–25 cents per transaction; fees for credit cards are higher. For interviewed retailers with POS machines (both certified and uncertified), these EBT transaction fees were not considered cost prohibitive.
POS devices were easy for retailers to operate. In general, both certified and uncertified retailers found no difficulty operating their POS devices. While most POS devices were not linked directly to the cash register and required the retailer to enter the transaction amount manually to process credit, debit, or EBT transactions, this was not a barrier to becoming certified.
Some retailers lease their POS device(s). Since retailers are required to have POS machines to become NAP certified, stores incurred fees to obtain a device. While retailers were typically unsure of the costs, ADSEF staff indicated a basic analog POS device costs about $20 per month, and a battery-operated mobile POS device costs up to $70 a month. No retailers—either certified or uncertified—with POS devices said they thought the costs were high, and no uncertified retailers said the cost of a POS device or inability to obtain one discouraged certification.
The benefits of having POS equipment outweighed the costs. Among certified retailers who cited increased customers as the primary benefit of being NAP certified, the increase in business offset the POS device costs. About half of the certified retailers reported NAP participants comprised a majority of their customer base and indicated their certification enabled them to serve areas with high unemployment.
2. How easy is it to become NAP certified?
Both certified and uncertified retailers described what factors facilitate or pose a barrier to becoming NAP certified. Overall, certified retailers perceived the process was easy and barriers to obtaining and maintaining NAP certification were minimal.
The NAP certification process is easy for retailers. Certified retailers were asked to describe the ease or difficulty of the NAP certification process and a majority responded they found the process to be an easy one, although several retailers noted they are required to submit more documentation now than in the past.
Certification costs were considered to be low. Costs reported by certified retailers included an initial $35 application fee and $30 to $45 legal fee, 48 and a $35 annual recertification fee, which these retailers considered reasonable.49
48 The $30 to $45 legal fee is to obtain a sworn statement certifying that the retailer has read and will comply with all requirements to be a certified NAP business. 49 Appendix D.1.a provides a list of all documents and associated costs required for NAP certification.

Examination of Cash Nutrition Assistance Program Benefits in Puerto Rico
Page 56
NAP certification offers benefits to retailers. All retailers were asked to describe the perceived benefits to being NAP certified. Almost all certified retailers said that the reason they were certified was to increase clients and sales. Most uncertified retailers viewed NAP certification as providing a positive benefit to stores. No retailers (certified or uncertified) identified disadvantages to being certified.

Examination of Cash Nutrition Assistance Program Benefits in Puerto Rico
Page 57
V. USE OF THE CASH PORTION OF BENEFITS AMONG NAP PARTICIPANTS
This chapter examines how NAP participants redeem and spend the cash portion of their NAP benefits. Section A presents findings from the analysis of EBT transaction data on cash benefit redemptions, including the percentage of cash transactions for EBT food purchases versus cash withdrawals and the pattern of cash benefit drawdowns over the issuance month. When participants redeem the cash portion as EBT food purchases at certified retailers, they are using the cash portion in the same way as the noncash portion. Thus, participants who redeem cash benefits for EBT food purchases rather than as cash withdrawals may not feel the effects of the discontinuation of cash benefits as much as others.
Sections B through D present NAP participants’ reported use of the withdrawn portion of benefits based on survey and focus group results. Topics cover participants’ reported methods for accessing the cash portion and where they spent it (section B), awareness of the rules on eligible purchases with the cash portion (section C), and types of purchases made with the cash portion (section D). If participants use their withdrawn cash to purchase items at certified rather than uncertified retailers, it would suggest that discontinuing the cash portion might not affect participants’ access to food from certified retailers. The types of purchases made with the withdrawn cash (food versus nonfood items) provide further information on how the change from cash to noncash benefits may affect participants.
A. CASH PORTION OF BENEFIT REDEMPTION PATTERNS: FINDINGS FROM THE EBT TRANSACTION DATA
1. How do NAP participants redeem the cash portion of their benefits and how much of the cash do they spend on EBT food purchases?
NAP participants can access the cash portion of the NAP benefit in three ways:
1. Option 1: Receive cash by withdrawing benefits at an ATM
2. Option 2: Receive cash by withdrawing benefits at a certified retailer’s POS device (with or without an EBT food purchase)50
3. Option 3: Make an EBT food purchase with the cash portion at a certified retailer’s POS device (receive no withdrawn cash)
All three types of cash benefit transactions were common, but the majority of NAP cash benefits were withdrawn as cash. According to the EBT transaction data, 39.9 percent of cash benefits were redeemed as cash withdrawals at ATMs, 30.9 percent were redeemed as withdrawals at certified retailers, and 29.2 percent were redeemed as EBT food purchases (see table V.1).51 Thus, cash withdrawals (at ATMs and retailers) accounted for 70.8 percent of the total cash benefits redeemed.
50This category includes both cash withdrawals at retailers and EBT food purchases with cash back. The EBT food purchases with cash back occurred infrequently, accounting for less than 0.01 percent of all NAP transactions. In addition, when participants redeemed benefits as EBT food purchases with cash back, the EBT data did not indicate which portion was used for EBT food purchases versus withdrawn as cash. Because of the small number of “EBT food purchases with cash back” transactions and the fact that participants withdrew at least some cash in each of these transactions, this transaction type was combined with “cash withdrawals at retailers.” 51 The EBT transaction data show only that participants withdrew the cash portion of their benefits and the amount withdrawn; they do not contain information on how or where participants spent the cash.

Examination of Cash Nutrition Assistance Program Benefits in Puerto Rico
Page 58
Although most of the cash benefits were withdrawn, a minimum of 82.4 percent of the total NAP benefits (cash and noncash) was spent on food. NAP participants exhausted their noncash benefit (75.1 percent of the total52) and redeemed an additional 7.3 percent of the total benefit (from the cash portion) on EBT food purchases. This represents the minimum amount of benefits spent on food because the EBT transaction data cannot provide information on how much of the withdrawn cash benefits were spent on food.53 54
Table V.1. Percentage of Total Benefits Redeemed by Transaction Type
Transaction Type Percentage of Benefit
Redeemed (cash and noncash) Percentage of Benefit Redeemed (cash only)
EBT food purchases with noncash portion of benefit 75.1 N/A
EBT food purchases with cash portion of benefit 7.3 29.2
Cash withdrawals at ATM 9.9 39.9 Cash withdrawals at certified retailer 7.7 30.9 Total 100.0 100.0
Source: Centinela EBT transaction data Notes
The percentages in this table exclude fees that are assessed for cash withdrawals at ATMs. The EBT food purchases with the noncash portion of the benefit comprise 75.1 percent of total redemption (even though 75 percent of the monthly benefit issuance is noncash) because this amount includes any carryover of benefits from previous months. Data on which estimates are based exclude transactions from the month of June because data for the full cycle, which ended in July 2014, are not available.
2. How do NAP cash benefit redemption patterns vary by subgroups and
geographic access to retailers?
Compared with NAP units overall, NAP units with children redeemed a smaller percentage of their cash benefit as EBT food purchases and a larger percentage as cash withdrawals, on average. For example, units with children redeemed only 23.0 percent of their cash benefit as EBT food purchases and 77.1 percent as cash withdrawals (see figure V.1.). Since units with children redeemed relatively less of their cash benefits as EBT food purchases and more as cash withdrawals as compared with other units, they may feel the effects of the discontinuation of the cash portion more than other units do.
52 The EBT food purchases with the noncash portion of the benefit comprise 75.1 percent of total redemption (even though 75 percent of the monthly benefit issuance is noncash) because this amount includes any carryover of benefits from previous months. 53 See appendix table B.4.g for the distribution of NAP units by the minimum percentage of their total (cash and noncash) benefit spent on food purchases. 54 The study relies on survey and focus group data to provide participant-reported information on the use of the withdrawn cash portion (see section D).

Examination of Cash Nutrition Assistance Program Benefits in Puerto Rico
Page 59
Figure V.1. Percentage of Cash Benefit Redeemed as EBT Food Purchases
Versus Cash Withdrawals by Unit Subgroup
Source: SAIC data and Centinela EBT transaction data Notes Data on which estimates are based exclude transactions from the month of June because data for the full cycle, which ended in July 2014, are not available. ATM fees are excluded from the calculations.
The average amounts and frequencies of all three types of EBT cash transactions were similar across NAP participants with relatively greater and less geographic access to certified food stores. For example, units with less geographic access (those that lived more than the median distance from certified stores) withdrew only $0.37 on average more per ATM withdrawal across all benefit months than units with relatively greater geographic access (those that lived less than the median distance from certified stores) (see table V.2). The two groups also made almost the same number of monthly cash transactions (0.5 and 0.4, respectively). 55 These findings suggest that living farther from retailers was not a barrier to redeeming NAP benefits.
55 The results held true when defining geographic access using distance to supermarkets rather than to all retailers. See appendix table B.4.e for the average number of transactions, average transaction amount, and average total monthly redemption of units with greater versus less access, as defined by the median distance to supermarkets, superstores, and large grocery stores.

Examination of Cash Nutrition Assistance Program Benefits in Puerto Rico
Page 60
Table V.2. Average Number and Amount of Cash Transactions And Average Total Monthly Redemption by Degree of Access
Degree of Access
Average Number of Cash
Transactions per Unit
Average Transaction Amount ($)
Total Monthly Redemption ($)
All Cash Transactions All units 1.4 46.40 59.17 Units with greater geographic access 1.4 46.16 59.04 Units with less geographic access 1.4 46.65 59.29
EBT Food Purchases With Cash Portion
All units 0.5 15.63 17.30 Units with greater geographic access 0.5 15.49 17.13 Units with less geographic access 0.6 15.76 17.47
Cash Withdrawals at ATM
All units 0.5 20.92 23.58 Units with greater geographic access 0.4 20.74 23.39 Units with less geographic access 0.5 21.11 23.77
Cash Withdrawals at Retailer
All units 0.4 17.18 18.29 Units with greater geographic access 0.4 17.39 18.53 Units with less geographic access 0.4 16.98 18.05
Source: SAIC and SDEC data and Centinela EBT transaction data Notes Data on which estimates are based exclude transactions from the month of June because data for the full cycle, which ended in July 2014, are not available.
There were also virtually no differences in the percentage of the cash portion redeemed on average across weeks of the month, or in the value of the unredeemed cash benefit at the end of the month for NAP units with greater or less geographic access or by subgroups (see tables V.3 and V.4, and appendix table B.4.h). For example, by the end of the first week, NAP units with greater geographic access had redeemed 88.1 percent of their cash benefits compared with 87.6 percent for those with less access. By the end of the month, the value of unredeemed cash benefits was $0.21 and $0.20, respectively. These findings suggest that the replacement of cash with noncash benefits would not affect NAP participants with less geographic access any more than those with greater geographic access.
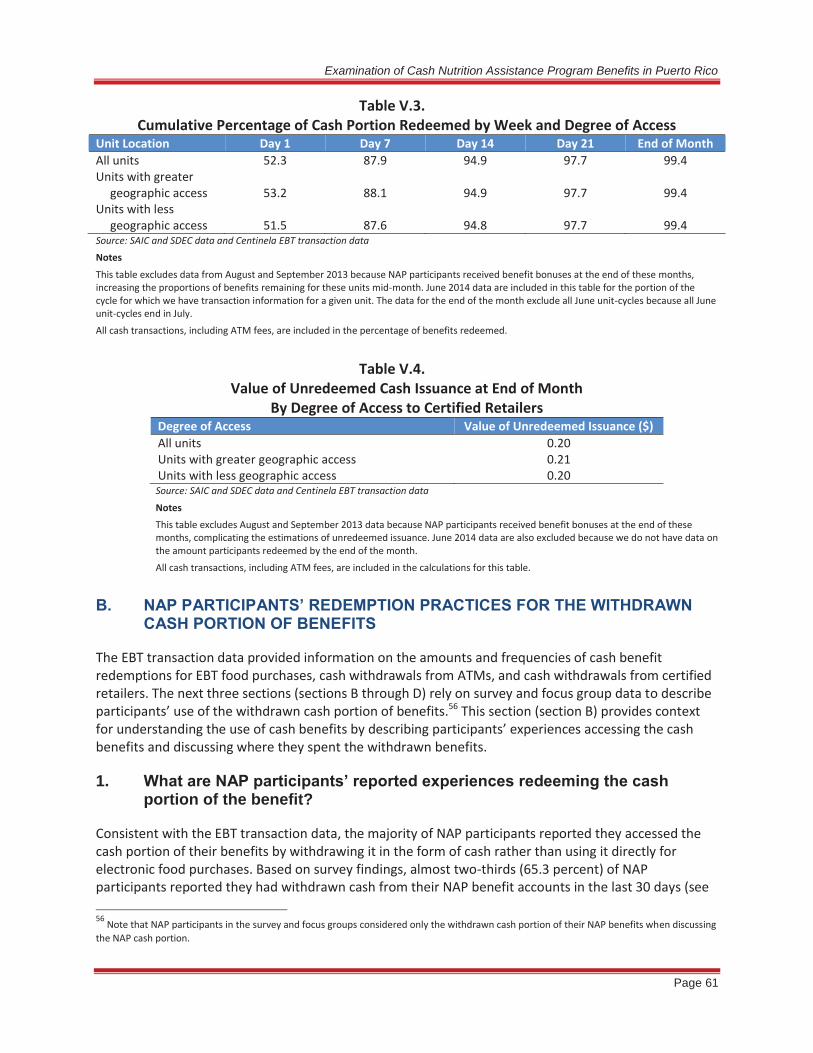
Examination of Cash Nutrition Assistance Program Benefits in Puerto Rico
Page 61
Table V.3. Cumulative Percentage of Cash Portion Redeemed by Week and Degree of Access
Unit Location Day 1 Day 7 Day 14 Day 21 End of Month All units 52.3 87.9 94.9 97.7 99.4 Units with greater
geographic access 53.2 88.1 94.9 97.7 99.4 Units with less
geographic access 51.5 87.6 94.8 97.7 99.4 Source: SAIC and SDEC data and Centinela EBT transaction data Notes
This table excludes data from August and September 2013 because NAP participants received benefit bonuses at the end of these months, increasing the proportions of benefits remaining for these units mid-month. June 2014 data are included in this table for the portion of the cycle for which we have transaction information for a given unit. The data for the end of the month exclude all June unit-cycles because all June unit-cycles end in July. All cash transactions, including ATM fees, are included in the percentage of benefits redeemed.
Table V.4.
Value of Unredeemed Cash Issuance at End of Month By Degree of Access to Certified Retailers
Degree of Access Value of Unredeemed Issuance ($) All units 0.20 Units with greater geographic access 0.21 Units with less geographic access 0.20 Source: SAIC and SDEC data and Centinela EBT transaction data Notes This table excludes August and September 2013 data because NAP participants received benefit bonuses at the end of these months, complicating the estimations of unredeemed issuance. June 2014 data are also excluded because we do not have data on the amount participants redeemed by the end of the month. All cash transactions, including ATM fees, are included in the calculations for this table.
B. NAP PARTICIPANTS’ REDEMPTION PRACTICES FOR THE WITHDRAWN
CASH PORTION OF BENEFITS
The EBT transaction data provided information on the amounts and frequencies of cash benefit redemptions for EBT food purchases, cash withdrawals from ATMs, and cash withdrawals from certified retailers. The next three sections (sections B through D) rely on survey and focus group data to describe participants’ use of the withdrawn cash portion of benefits.56 This section (section B) provides context for understanding the use of cash benefits by describing participants’ experiences accessing the cash benefits and discussing where they spent the withdrawn benefits.
1. What are NAP participants’ reported experiences redeeming the cash portion of the benefit?
Consistent with the EBT transaction data, the majority of NAP participants reported they accessed the cash portion of their benefits by withdrawing it in the form of cash rather than using it directly for electronic food purchases. Based on survey findings, almost two-thirds (65.3 percent) of NAP participants reported they had withdrawn cash from their NAP benefit accounts in the last 30 days (see 56 Note that NAP participants in the survey and focus groups considered only the withdrawn cash portion of their NAP benefits when discussing the NAP cash portion.

Examination of Cash Nutrition Assistance Program Benefits in Puerto Rico
Page 62
figure V.2). The remaining third (34.7 percent) indicated they had not withdrawn cash from their NAP benefit accounts, and thus used the cash portion of their benefits on EBT food purchases at certified retailers.
Figure V.2. Percentage of NAP Participants Who Said They
Withdrew Cash From Their NAP Benefit Accounts in Last 30 Days
Source: Insight tabulations of NAP cash benefits household survey data
Participants who withdrew their NAP cash benefits could do so through (1) an ATM or (2) a certified retailer by making the withdrawal through the customer service center or from a cashier. When asked about the ease or difficulty of withdrawing cash benefits, of the NAP participants who withdrew cash in the last 30 days, a large majority (82.2 percent) reported it was never difficult to withdraw cash using either of these two methods. About 13.4 percent said it was sometimes difficult, but only 4.5 percent said it was often or always difficult to withdraw cash benefits (see figure V.3).

Examination of Cash Nutrition Assistance Program Benefits in Puerto Rico
Page 63
Figure V.3. Percentage of Participants Who Reported Difficulty
Withdrawing NAP Cash Benefits at ATM or Certified Retailer
Source: Insight tabulations of NAP cash benefits household survey data
NAP participant experiences withdrawing the NAP cash portion are described below.
Withdrawing NAP cash from ATMs
Withdrawing cash through an ATM was the most frequently mentioned method by focus group participants for accessing the cash portion of their benefits. Participants in about a third of the groups explained there were many ATMs available near where they lived and that the machines were easy to use.
Although participants in most groups explained that it was easy to access ATMs and withdraw cash, they also described some challenges: ATM fees. In more than half of the focus groups, participants indicated they had to pay a fee to use an ATM.57 The fee varied between $1.50 and $3.50 per transaction for most of these participants. In about a third of the groups, participants said the fee affected their decision of whether to use an ATM, and it was viewed as an undesirable but necessary burden associated with accessing the cash benefit.
57 Privately owned (independent) ATMs, which are not regulated by Puerto Rico’s government, charge a fee for use.
“Those withdrawals . . . no matter where you go, there is always something you lose, $3 here, $3 there, and then you realize, it’s a lot and it hurts when you have a family that depends on you.”
–Focus group participant

Examination of Cash Nutrition Assistance Program Benefits in Puerto Rico
Page 64
Large bills only. In most groups, participants explained they could only withdraw cash in $10 or $20 increments. Participants said the size of the bills distributed by the ATM often prevents them from accessing the full amount of the cash portion of their benefits. For example, if a participant has $25 in cash available and the ATM only distributes $20 bills, the participant will not be able to access the remaining $5 at an ATM.
Service interruptions. In some groups, participants explained how the ATMs in their areas often would break down.
Difficulty operating ATM. Participants in a few groups, particularly elderly individuals, explained how they sometimes did not know how to use the ATM or needed help from their family members to do so.
Withdrawing NAP cash through cash back from certified retailers
Focus group participants in most groups explained how they access the cash portion of their benefits by withdrawing cash through the customer service desk or from the cashier at the certified retailer with no associated fee. Unlike ATMs, withdrawing cash through the retailer allows participants to access the full amount of the cash benefit, down to the cent.
While participants generally explained how withdrawing cash through a certified retailer was easy, they also expressed some challenges as described below:
In almost half of the groups, participants said some certified retailers in their areas do not give NAP participants cash back.
In some groups, participants described long lines to withdraw cash at the retailer’s customer service desk.
In other groups, participants said retailers require them to obtain their NAP cash balance before shopping to ensure there was sufficient cash available for their purchases.
Similarly, other participants indicated retailers would give them cash back only after they had shopped there.
Notably, neither of the two large supermarkets on the small rural island of Vieques gave participants cash back. These participants were therefore required to use an ATM.
2. Where did NAP participants spend their withdrawn NAP cash?
NAP participants reported in the survey that they usually spent their withdrawn cash benefits at a certified NAP retailer. Almost two-thirds (63.3 percent) of NAP participants who withdrew NAP cash in the last 30 days reported they always spent the cash at a certified retailer, 9.4 percent reported they often do, and 22.0 percent reported they sometimes do (see figure V.4). Only 5.3 percent reported they never spent the withdrawn cash portion at a certified retailer. For NAP participants who generally spend their withdrawn cash at certified retailers, the replacement of cash with noncash benefits will not affect their access to food but it will affect what they buy if they are using the cash for nonfood items.
“I go to [the store’s] customer service counter. I give them the card . . . and they give me a receipt for how much I have in cash and how much in coupons. And then they give me the cash and the card and then I buy [my products] with the cash.”
–Focus group participant

Examination of Cash Nutrition Assistance Program Benefits in Puerto Rico
Page 65
Figure V.4. Percentage of NAP Participants Who Withdrew NAP Cash in the Last 30 Days
By How Often They Spent It at a Certified Store
Source: Insight tabulations of NAP cash benefits household survey data
Similarly, NAP participants in more than half of the focus groups described spending the cash they withdrew at the same stores where they make their EBT purchases and doing all of their shopping at once. They tend to do this through two separate transactions at the register (i.e., an EBT transaction to purchase food and a cash transaction to purchase other goods with their withdrawn cash).
The likelihood of spending withdrawn NAP cash at a certified retailer was similarly high across all subgroups in the study, with those in units with elderly members being the most likely to always spend the cash at a certified retailer (73.6 percent), and those in units composed of single mothers with children being the least likely (54.0 percent). The relatively small percentage of single mothers with children who always spent their withdrawn cash at a certified retailer could indicate this subgroup might be affected more than others would be by the discontinuation of the cash benefit.
C. AWARENESS OF RESTRICTIONS ON ALLOWABLE NAP PURCHASES
This section describes NAP participants’ awareness of the purchase restrictions associated with benefit use. NAP regulations require that 100 percent of NAP benefits be used for eligible foods.58 Eligible food items are defined as “any food or food product intended for human consumption except alcoholic beverages, tobacco, hot foods, and hot food products prepared for immediate consumption.” The term 58 As stated in the NAP State Plan of Operations for FY 2015 (ADSEF, 2015), “100% of the NAP benefits are issued for food purchases. These benefits are distributed in a proportion of 75% for the purchase of eligible food items in certified retailers and the remaining 25% in cash for the purchase of eligible food items in certified retailers and non-certified retailers.”
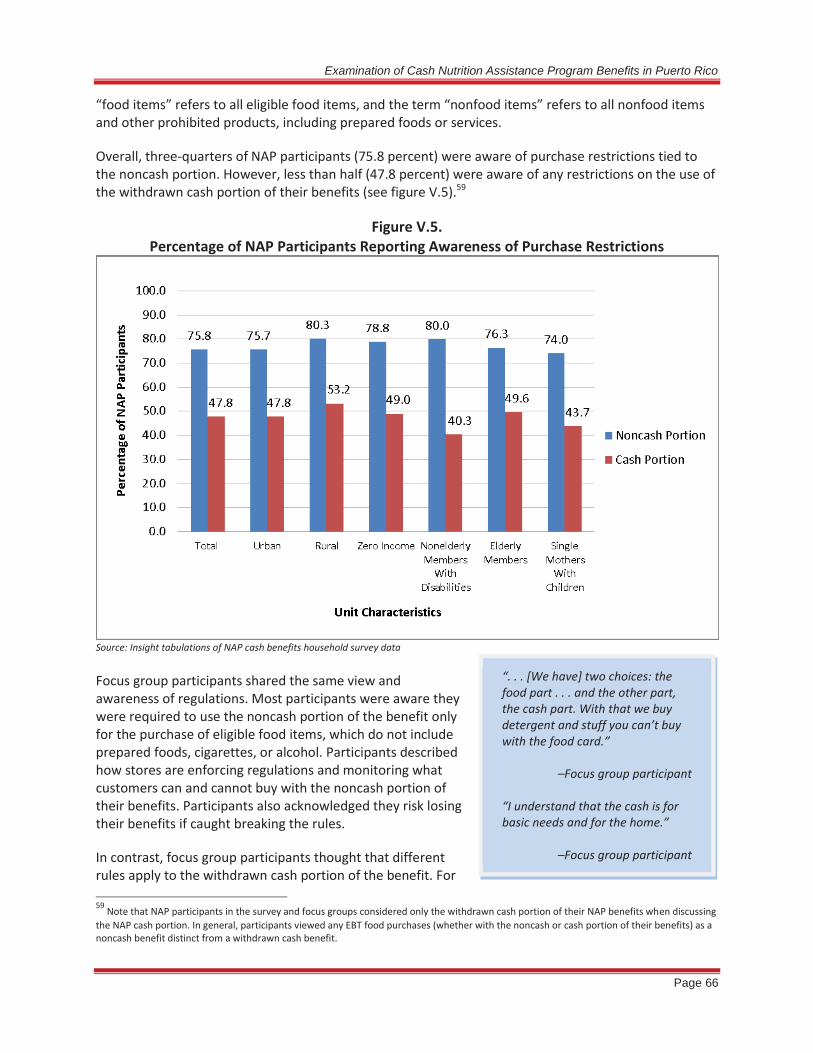
Examination of Cash Nutrition Assistance Program Benefits in Puerto Rico
Page 66
“food items” refers to all eligible food items, and the term “nonfood items” refers to all nonfood items and other prohibited products, including prepared foods or services.
Overall, three-quarters of NAP participants (75.8 percent) were aware of purchase restrictions tied to the noncash portion. However, less than half (47.8 percent) were aware of any restrictions on the use of the withdrawn cash portion of their benefits (see figure V.5).59
Figure V.5. Percentage of NAP Participants Reporting Awareness of Purchase Restrictions
Source: Insight tabulations of NAP cash benefits household survey data
Focus group participants shared the same view and awareness of regulations. Most participants were aware they were required to use the noncash portion of the benefit only for the purchase of eligible food items, which do not include prepared foods, cigarettes, or alcohol. Participants described how stores are enforcing regulations and monitoring what customers can and cannot buy with the noncash portion of their benefits. Participants also acknowledged they risk losing their benefits if caught breaking the rules.
In contrast, focus group participants thought that different rules apply to the withdrawn cash portion of the benefit. For 59 Note that NAP participants in the survey and focus groups considered only the withdrawn cash portion of their NAP benefits when discussing the NAP cash portion. In general, participants viewed any EBT food purchases (whether with the noncash or cash portion of their benefits) as a noncash benefit distinct from a withdrawn cash benefit.
“. . . [We have] two choices: the food part . . . and the other part, the cash part. With that we buy detergent and stuff you can’t buy with the food card.”
–Focus group participant “I understand that the cash is for basic needs and for the home.”
–Focus group participant

Examination of Cash Nutrition Assistance Program Benefits in Puerto Rico
Page 67
example, participants in most focus groups perceived there were two separate purposes for NAP benefits: noncash benefits were intended only for food and (withdrawn) cash could be used for food items or nonfood items. In some groups, participants believed the withdrawn cash could be used to purchase anything. In others, participants believed the withdrawn cash was specifically designated for purchasing household items (e.g., detergent) or other nonfood items like personal hygiene products. In a few groups, participants explained their belief that the cash portion of their benefits was intended for use in emergencies.
Retailers themselves were familiar with the types of eligible products. A majority of certified retailers reported they train their staff on the types of items that can be purchased with cash and noncash EBT benefits. Both participants and retailers pointed out, however, that stores are unable to monitor what customers buy with the withdrawn cash portion of NAP benefits because there is no way to identify the source of the cash.
D. REPORTED PURCHASES MADE WITH THE WITHDRAWN CASH PORTION OF NAP BENEFITS
This section presents results on purchases made with the withdrawn cash portion of NAP benefits. Because items purchased with the withdrawn cash cannot be monitored or tracked electronically, this information is available only from survey and focus group data. NAP participants who reported withdrawing NAP cash benefits in the last 30 days were asked whether they had used the cash to buy any of the food items, nonfood items, and services on a list that was read to them. Just as in the previous section, the term “food items” refers to eligible food items, and the term “nonfood items” refers to any ineligible items, including prepared foods or services. Focus group participants also were asked, through open-ended questions, about what they purchased with their withdrawn cash.
1. What types of items are purchased with withdrawn NAP cash?
As discussed previously, based on survey findings, almost two-thirds (65.3 percent) of NAP participants reported they had withdrawn NAP cash benefits in the last 30 days, and the remaining third (34.7 percent) indicated they had not withdrawn cash benefits. Those who did not withdraw their cash benefits made EBT food purchases with the cash portion at a certified retailer.
Figure V.6 shows the distribution of total NAP participants who withdrew cash by whether they used it to purchase food or nonfood items and the remaining 34.7 percent who did not withdraw cash but used it for EBT food purchases. Almost a third (31.2 percent) of all NAP participants used the withdrawn cash to purchase both food and nonfood items, 21.2 percent used the withdrawn cash to purchase only nonfood items, and 13.0 percent used the withdrawn cash to purchase only food items.
Moderator: When you go to the supermarkets . . . when you take out the money in cash . . . [the store is] aware that cash is from the card and you’re paying for detergent and diapers? Participant: I don’t know if they know it or not.

Examination of Cash Nutrition Assistance Program Benefits in Puerto Rico
Page 68
Figure V.6. Percentage of NAP Participants Using Cash Benefits to Buy Food and Nonfood Items
Source: Insight tabulations of NAP cash benefits household survey data Note Percentages do not sum to 100 due to rounding.
Overall, based on survey findings, 78.9 percent of all NAP participants reported purchasing at least some food items with their cash benefit (when including those who did not withdraw cash but used it for EBT food purchases), and 44.2 percent reported purchasing at least some food items with just their withdrawn cash (see figure V.7). Overall, 52.4 percent of NAP participants reported purchasing at least some nonfood items with their withdrawn cash.60
60 Of those who reported withdrawing NAP cash benefits, 80.1 percent reported purchasing at least some nonfood items with their withdrawn cash, and 67.9 percent reported purchasing at least some food items.

Examination of Cash Nutrition Assistance Program Benefits in Puerto Rico
Page 69
Figure V.7. Percentage of NAP Participants
Purchasing Any Food Items or Nonfood Items With Cash Portion of NAP Benefits
Source: Insight tabulations of NAP cash benefits household survey data
Food purchases
The percentage of total NAP participants using cash benefits to purchase food items was similar across subgroups. However, NAP participants living in units with zero income were somewhat less likely to purchase any food items with cash benefits than participants were overall (75.7 percent versus 78.9 percent, respectively). Participants in all subgroups were more likely to report buying perishable food than nonperishable food with their withdrawn cash benefits (see table V.5).

Examination of Cash Nutrition Assistance Program Benefits in Puerto Rico
Page 70
Table V.5. Percentage of NAP Participants Using Cash Benefits To Buy
Food Items by Subgroup
Total Urban Rural Zero
Income
Units With Elderly
Members
Units With Nonelderly Members
With Disabilities
Units With Single
Mothers With
Children Any Food Items (including EBT food purchases) 78.9% 78.8% 84.1% 75.7% 77.4% 82.5% 83.6%
Any Food Items (with withdrawn cash) 44.2% 44.2% 45.2% 40.9% 45.3% 38.7% 52.1%
Perishable food 41.0% 41.1% 41.9% 38.1% 42.3% 37.5% 46.6% Nonperishable food 33.4% 33.3% 38.4% 31.2% 34.3% 23.8% 41.1%
Source: Insight tabulations of NAP cash benefits household survey
Nonfood purchases
Most NAP participants who purchased nonfood items with their withdrawn cash benefits used it to purchase cleaning supplies (such as laundry detergent and dish soap) and personal hygiene products (such as soap and toilet paper; see figure V.8). Out of all NAP participants, almost five out of 10 purchased cleaning supplies with withdrawn NAP cash benefits, and over four out of 10 purchased personal hygiene products with withdrawn cash benefits. Only 1 out of 10 participants or fewer reported buying any other ineligible item or service with the withdrawn cash portion of their NAP benefits. Among the more frequently mentioned other purchases were medicine, housing costs (e.g., rent or utilities), and prepared food.

Examination of Cash Nutrition Assistance Program Benefits in Puerto Rico
Page 71
Figure V.8. Percentage of NAP Participants Using
Withdrawn Cash Benefits For Nonfood Items by Type of Product
Source: Insight tabulations of NAP cash benefits household survey data
Overall, the patterns of nonfood purchases were consistent across subgroups in the survey. For example, all subgroups were much more likely to purchase cleaning supplies and personal hygiene items than other nonfood items with their withdrawn cash benefits (see table V.6). However, participants in units with nonelderly members with disabilities were generally less likely than other groups to purchase any types of nonfood items, and those in units composed of single mothers with children or with elderly were generally more likely to purchase any types of nonfood items.61
61 NAP participants in units composed of single mothers with children were the only group that purchased both food and nonfood items with their withdrawn cash at a higher rate than participants in other subgroups did (separate tabulation not shown). This is because those in units with single mothers with children were more likely than other groups to withdraw cash benefits overall and to purchase both food and nonfood items with their withdrawn cash.

Examination of Cash Nutrition Assistance Program Benefits in Puerto Rico
Page 72
Table V.6. Reported Nonfood Items Purchased
With The Withdrawn Cash Portion of NAP Benefits by Subgroup
Total Urban Rural Zero
Income
Units With Elderly
Members
Units With Nonelderly Members
With Disabilities
Unit With Single
Mothers With
Children Any Nonfood Items 52.4% 52.4% 48.4% 53.8% 57.6% 40.0% 57.6%
Cleaning supplies 46.3% 46.3% 41.9% 46.9% 50.3% 32.5% 52.1% Personal hygiene 41.0% 41.0% 36.8% 42.9% 41.6% 28.8% 43.9% Medicine 10.1% 10.1% 10.8% 8.9% 7.3% — 15.1% Prepared food 7.7% 7.7% 7.5% 8.5% 9.5% — 9.6% Housing costs 8.2% 8.2% 8.9% 5.3% 6.6% — 12.0% Gasoline 5.0% 5.0% 4.0% 4.9% — — — Diapers 4.8% 4.8% 5.1% 3.6% — — 13.7% Services such as childcare, medical care
3.2% 3.2% 3.2% 2.8% — — —
Source: Insight tabulations of NAP cash benefits household survey data Note “—“ denotes cells with less than 10 responses.
Focus group participants reported similar purchasing patterns as the survey respondents. For example, focus group participants in most groups mentioned using their withdrawn cash benefits to buy food items such as fresh fruits and breakfast foods. In all groups, participants mentioned using the cash portion to buy household cleaning products (including detergents, bleach, laundry soap, dish soap, brooms, mops, and paper towels) and personal hygiene items (such as soap, toilet paper, toothpaste, deodorant, feminine hygiene products, shampoo, and razors).
In most groups, participants also described spending some of the cash portion of their benefits on medicine or medical expenses. Specific examples given included medicine for their children, over-the-counter medication (e.g., pain relievers, cold medicine), and medical bills, co-pays, or deductibles. Similarly, some focus group participants said they used some of the cash portion to pay utilities like water, electricity, or gas bills, as well as rent when needed.
Finally, while not as commonly mentioned as the other uses, participants in some groups, particularly those composed of single mothers, said they spent some of the cash portion for items for their children, such as clothing, school supplies, or diapers.
Participants in all focus groups indicated they believed the nonfood purchases they made were allowed, and described having no other way to purchase these essential nonfood items.
“[You use the cash to buy] whatever is most essential to you. If I need a medication, I need some detergents, and a pair of shoes, which are you going to buy?”
–Focus group participant

Examination of Cash Nutrition Assistance Program Benefits in Puerto Rico
Page 73
VI. POTENTIAL IMPACTS OF DISCONTINUING THE CASH PORTION OF NAP BENEFITS
This chapter integrates the information from other sections of the report and survey, focus group, and interview data on potential adverse effects on participants and retailers from discontinuing the cash portion of NAP benefits.
A. ACCESS TO FOOD ITEMS
1. Discontinuing the cash portion of the benefit would likely have little impact on participants’ access to food.
Participants live near certified retailers. Overall, NAP participants did not face significant barriers to the redemption of the noncash component of their NAP benefits. Most participants lived near a certified retailer where they could redeem the noncash component: at least half of units lived within 0.2 miles of a certified retailer and at least three-quarters lived within 0.5 miles. Participants in urban areas had access to certified supermarkets, with at least half of units having one supermarket between 0.5 and 1 mile from where they lived. In rural areas, participants had access to certified supermarkets as well, but not as closely located. At least half of units lived within 2 to 5 miles of at least one supermarket.
Based on these data, if the cash component of the benefit were discontinued and the population of certified retailers and their locations remained the same, participants would not face significant barriers to redeeming the noncash component of the benefit.
Participants tend to travel farther than the nearest certified retailer to shop for food. Nearly all NAP participants (91.8 percent) traveled farther than the distance to the nearest certified retailer to purchase food. More than a third of units (35.2 percent) traveled up to 1 mile farther than the distance to the nearest certified retailer, and 13.9 percent traveled more than 5 miles. This finding is common among SNAP participants in the continental United States as well.62 Focus groups with NAP participants indicated they often travel farther than the nearest retailer to purchase food because of lower prices or sales, which were the most important factors for determining where participants shopped with their NAP benefits. This finding suggests many NAP participants not only have adequate access to certified retailers, but also have access to multiple certified retailers and are able to choose where to shop.
Participants report it is easy to get to certified stores. Survey findings indicate NAP participants did not face difficulties redeeming the noncash portion of their NAP benefits. Almost all NAP participants (90.9 percent) indicated it was easy for them to get to the certified store where they bought most of their food, and there was no difference in these findings between those residing in urban and rural areas.
Participants exhaust almost all of their noncash and cash benefits each month. NAP units spent nearly all of the noncash benefit each month, with $1.38 left over on average, according to EBT data. There was a difference of only $0.04 in the average noncash balance at the end of a benefit month for units with relatively greater geographic access to food compared with those with less access. There were no 62 For example, using data from the SNAP Food Security study, Mabli and Worthington (2015) showed that newly entered SNAP households and households that had participated for about 6 months typically bypass nearby supermarkets to visit stores farther away. In urban areas, households lived 0.7 miles from a supermarket, but reported traveling 4 miles to the store at which they buy most of their food. These findings concur with Maryland administrative data in Cole (1997) (0.3 and 2.7 miles, respectively) and the 1996 National Food Stamp Participant survey data in Ohls, Ponza, Moreno, Zambrowski, and Cohen (1999) (1.8 and 4.9 miles, respectively).

Examination of Cash Nutrition Assistance Program Benefits in Puerto Rico
Page 74
differences across subgroups or by urban and rural location either. This complete drawdown of monthly noncash benefits suggests an absence of challenges to accessing certified retailers or using the noncash form of the NAP benefits. EBT data also showed participants redeemed almost the entire cash portion of their benefits each month, and there were virtually no differences in the value of unredeemed cash benefits by subgroup, urban and rural location, or relative geographic access.
Retailers do not face barriers to becoming certified or processing EBT purchases. NAP certified retailers reported the certification process was easy and barriers to obtaining and maintaining NAP certification were minimal. Retailers considered the certification costs low, and most viewed NAP certification as advantageous for increasing customers and sales. Certified retailers also indicated that processing noncash EBT purchases was easy, transaction costs were reasonable (EBT transaction costs were lower than credit card costs), and POS devices were easy to operate and affordable. Even small roadside vendors were certified if desired given the availability of mobile, battery-operated POS devices.
For those retailers who were not certified, reasons included a lack of interest, insufficient knowledge about NAP, or a lack of demand from their customer base. No uncertified retailers, including street vendors, mentioned technology issues (e.g., lack of connectivity or processing equipment) or the cost of POS devices as a reason for being uncertified.
2. Discontinuing the cash portion of the benefit would likely have little impact on NAP participant shopping patterns.
Fewer than 1 in 10 NAP participants ever shop at uncertified retailers. Even though NAP participants can withdraw cash benefits to purchase eligible food items anywhere, only7.7 percent reported they ever used them at uncertified retailers.
The primary reason is that the prices at uncertified retailers were too high, and cost is a major factor in determining where to shop. Participants in focus groups said they bought food at uncertified retailers only in emergencies or to supplement their regular shopping trips to certified retailers.
The vast majority of NAP participants (90.0 percent) reported they bought most of their food at certified supermarkets, and this finding held true for those residing in urban and rural areas and across all subgroups. Looking at the noncash transactions, supermarkets accounted for two-thirds of total monthly transactions and about three-quarters of total benefits redeemed. Most survey and focus group participants reported they usually spent their cash benefits at the same certified retailer where they spent the noncash portion of benefits, often in the same shopping trip.
Redemption patterns for NAP noncash benefits are similar for NAP units with both more and less proximity to stores. NAP units with greater geographic access, defined by living less than the median distance to the nearest retailer, had no real difference in the average number of transactions and purchase amounts per transaction compared with those with less geographic access. For example, units with greater geographic access to food redeemed the noncash component of their benefits in 4.2 transactions per month, compared with 4.1 transactions per month for units with less geographic access. The average transaction amounts were $59.59 and $61.22, respectively.

Examination of Cash Nutrition Assistance Program Benefits in Puerto Rico
Page 75
B. USE OF THE CASH PORTION OF NAP BENEFITS
1. Most NAP participants, particularly NAP units with children, withdraw most of the cash portion of their benefits at an ATM or through receiving cash back at a certified retailer.
NAP participants redeem most of their monthly cash benefits as cash withdrawals at an ATM or a certified retailer. Only NAP participants who redeem the cash portion of their NAP benefits as withdrawn cash from an ATM or a certified retailer potentially would be affected by the discontinuation of the cash portion of NAP benefits (because redemptions of cash benefits as an EBT food purchase at certified retailers are done essentially the same way as noncash EBT food redemptions). EBT transaction data showed that withdrawals of the cash portion of NAP benefits made up 70.8 percent of total monthly cash NAP benefits, while EBT food purchases with the cash portion made up only 29.2 percent. Survey data provide similar evidence: almost two-thirds of NAP participants reported they had withdrawn cash from their NAP benefit accounts in the last 30 days.
NAP units with children are more likely to redeem their monthly cash benefits as cash withdrawals (from ATMs or certified retailers), and less likely to redeem their benefits as EBT food purchases, compared with other subgroups. Units with children redeemed 77.1 percent of their total monthly cash benefits as cash withdrawals, compared with only 62.2 percent among units with elderly (see table VI.1). Similarly, units with children withdrew 50.7 percent of their cash benefits at ATMs, compared with 23.5 percent among units with elderly. Many ATMs charge a fee of $1.50 to $3.50 per transaction to withdraw cash benefits.
Table VI.1. Percentage of Cash Benefits Redeemed by Unit Subgroup
All
Units
Units With Elderly
Members
Units With Nonelderly Members
With Disabilities
Units With Children
Units Without Income
All Cash Transactions 100.0% 100.0% 100.0% 100.0% 100.0% EBT food purchases with cash benefit 29.2% 37.8% 30.9% 23.0% 32.3% Cash withdrawals at ATM 39.9% 23.5% 36.8% 50.7% 35.2% Cash withdrawals at retailer 30.9% 38.7% 32.3% 26.4% 32.4%
Source: SDEC data and Centinela EBT transaction data Note Data on which estimates are based exclude transactions from the month of June because data for the full cycle, which ended in July 2014, are not available.
2. NAP participants use the withdrawn cash portion of benefits for both food
and nonfood purchases.
Most NAP participants purchase both food and nonfood items with their withdrawn NAP cash benefits. Based on survey data, 52.4 percent of total NAP participants reported purchasing at least some nonfood items with withdrawn cash, and 44.2 percent reported purchasing at least some food items with withdrawn cash. When including those who did not withdraw cash but instead used the cash portion of their benefits for EBT food purchases, more than three-quarters (78.9 percent) of all NAP participants purchased at least some food items with the cash portion of their benefits.

Examination of Cash Nutrition Assistance Program Benefits in Puerto Rico
Page 76
The most common nonfood items purchased with the withdrawn NAP cash benefits are cleaning supplies and personal hygiene products Almost five out of 10 NAP participants withdrew cash and purchased cleaning supplies (such as laundry detergent and dish soap) and over four out of 10 withdrew cash and purchased personal hygiene products (such as soap and toilet paper). One out of 10 or fewer participants reported buying any other ineligible item or services with the withdrawn cash. There was little difference across subgroups or between those living in urban versus rural areas in the percentage of participants using their withdrawn cash to purchase nonfood items.
Most participants view these nonfood purchases with their cash benefits as essential. Most participants in focus groups indicated these nonfood purchases with the cash portion of benefits were critical to the health and hygiene of their families given the high levels of unemployment and lack of other sources of cash assistance in Puerto Rico.
C. EFFECTS OF THE DISCONTINUATION OF THE CASH PORTION OF NAP BENEFITS ON NAP PARTICIPANTS AND RETAILERS
1. Many NAP participants believe discontinuing the cash portion of the benefit would be devastating
Both survey respondents and focus group members believe discontinuing the cash portion of NAP benefits would have an overwhelmingly negative effect on them and their families. NAP participants in the survey were asked to rate on a scale of 1 (no impact) to 10 (high impact) how the discontinuation of the cash portion of benefits (with an equal increase in the noncash portion) would affect them (specifically, how it would affect their ability to provide for themselves). On average, participants (in total) and every subgroup in the survey rated the potential negative impact as a 7; a majority of NAP participants (55.6 percent) rated the impact as an 8 or higher. Almost half of participants (44.7 percent) rated the potential negative effect as a 10 (highest impact), and this percentage was similar for those in urban and rural areas (44.7 percent and 45.7 percent, respectively) and across most subgroups.
In focus groups, where the question on the impact of discontinuing the cash portion of benefits was asked more broadly, most participants said the impact would be devastating because they had no other source of cash other than the cash portion of their NAP benefits. In many groups, participants described how removing the cash portion of their benefits would severely affect their ability to maintain health and hygiene, both personal and at home. They expressed concerns about not being able to keep themselves, their children, or their homes clean without the cash since they rely on it to buy soap and cleaning products. Single mothers with children were particularly adamant about the necessity of keeping their children clean for health reasons. Some participants described how the removal of the cash portion of their benefits would be very detrimental to their mental health and sense of well-being.
If I get the stamps [NAP benefit] and at that moment one of my children gets sick I have to use the cash to buy the medication. Even if it makes me broke, I buy my children’s medicine first.”
—Focus group participant

Examination of Cash Nutrition Assistance Program Benefits in Puerto Rico
Page 77
CBO and group residential facility administrators cited few potentially positive effects; most have mixed opinions. Most CBO and group residential facility administrators shared many of the same concerns that participants had about discontinuing the cash portion of the benefit. They stated that losing the cash would be devastating to many families since many of their clients had no other source of cash. These administrators also described how discontinuing the cash portion of the benefit could affect their clients’ ability to maintain their health and hygiene, as many use the cash to purchase medications and soap. On the other hand, these administrators also felt that removing the cash portion of the benefit might improve their clients’ ability to meet nutritional needs since they would be required to spend all of their benefits on food.
Retailer perspectives are mixed about the impact on NAP participants. At the end of each retailer interview, retailers were asked to share their opinions about whether the cash portion of the benefit should be discontinued. Opinions were evenly divided between certified and uncertified retailers. About half of all retailers (both certified and uncertified) believed the cash should be discontinued; these individuals thought NAP participants should spend more of their benefits on food as intended and that the change would push people toward self-sufficiency. Retailers who thought the cash should not be discontinued described how important the cash was to NAP participants and that it helps them cover their basic needs, including hygiene. These retailers explained that discontinuing the cash would be
Focus Group Comments on Whether the Cash Portion of NAP Benefits Should or Should Not Be Discontinued
“That’s the only income we have. I depend on that money to cover my basic needs. If I can’t count on that money, I can’t work because of my condition.” “That would mean that during that month I would eat, but I wouldn´t bathe, I could not clean the house, my son wouldn´t wear diapers, I couldn´t clean him.” “I do not work, I am handicapped, nobody helps me, and I use [the cash portion] to pay for medicine, hospital, purchases of soap, toothpaste, toilet paper, shampoo, etc. Do not remove the 25% cash component, please.” “It would affect me because I only have this, I have no other income, I don’t have a job, my son is far away . . . ” “You don’t just eat, you also bathe, you have to do your laundry, stay clean, so we need that portion for all that, it’s not just about food.” “If they take that away from us we couldn’t buy laundry detergent, toilet paper, detergent to clean the floor.” “Well, for me it is important that the cash portion remains . . . since I am a single mother, I do not work and I do not receive any other help.”
As one CBO administrator said, “I know they [NAP participants] live in a state of constant desperation. They don’t know how to pay for electricity, water, and they lack food.”
–CBO administrator

Examination of Cash Nutrition Assistance Program Benefits in Puerto Rico
Page 78
unfair to people who really need it and that most NAP participants have no other resources or sources of cash. Overall, when speaking about the discontinuation of the cash benefits, only a few retailers mentioned the potential impact on their businesses; they were more concerned about the implications for the basic needs of the population.
NAP participants are most concerned about the loss of cash benefits for the purpose of buying essential nonfood items. NAP participants in the survey were asked if it would be easier, the same, or more difficult to buy the items they had purchased within the last 30 days with withdrawn cash if all of their NAP benefits (which would stay the same) had to be redeemed through EBT purchases and none could be withdrawn as cash.
Only 29.3 percent indicated that it would be more difficult to buy the food items they had bought with NAP cash; 81.8 percent thought it would be more difficult to buy the nonfood items they had bought (table VI.2). This finding reflects the lack of other sources of cash assistance and income for participants to buy nonfood necessities such as basic personal hygiene and cleaning products. It also reflects that NAP participants generally do not face barriers to redeeming the noncash portion of benefits. These findings were consistent across those residing in urban and rural areas and across most subgroups in the survey. However, compared with other subgroups in the survey, NAP participants in units composed of single mothers with children were more likely to report difficulties buying the nonfood items (and less likely to report difficulties buying the food items) in the absence of cash benefits.
Table VI.2. Percentage of NAP Participants Who Said It Would Be More Difficult To Purchase Food
Or Essential Nonfood Products if Cash Portion of Benefits Were Discontinued by Subgroup
Total Urban Rural Zero
Income
Units With Elderly
Members
Units With Nonelderly Members
With Disabilities
Units With Single
Mothers With
Children Food Items
More difficult to buy without cash portion 29.3% 29.3% 28.6% 31.7% 35.5% 32.2% 18.5%
Nonfood Items More difficult to buy without cash portion 81.8% 81.8% 80.6% 81.2% 74.7% 78.1% 83.4%
Source: Insight tabulations of NAP cash benefits household survey data Note Universe for table is as follows:
(1) Food Items: NAP participants who purchased any food items with withdrawn NAP cash benefits in previous 30 days. (2) Nonfood Items: NAP participants who purchased any nonfood items with withdrawn cash benefits in previous 30 days.
2. Retailer opinions are mixed about the impacts on their businesses.
Certified retailers (based on 17 interviews) were divided between those who believed the discontinuation of the cash portion of the benefit would have a positive impact on their business and those who felt it would have no impact. Certified retailers citing positive impacts described how their sales would increase since NAP customers would be required to spend 100 percent of their benefits at their store. These certified retailers estimated an increase in sales ranging from 10 percent to 30 percent. Certified retailers who felt the discontinuation of the cash benefit would have no impact on
Examination of Cash Nutrition Assistance Program Benefits in Puerto Rico
Page 79
their store indicated they would not lose any sales and one explained that his store does not distribute cash to NAP clients so this change would not impact their operations. A few certified retailers mentioned that if the cash were discontinued, they would like to see the list of eligible items expanded to include some of the nonfood necessities customers use the cash to buy.
Uncertified retailers (based on 16 interviews) were split into three groups: (1) those who thought the discontinuation of the cash benefits would have a negative impact on their business, (2) those who thought it would have no effect, and (3) those who were unsure of the potential effect. For those uncertified retailers anticipating a negative effect, they mentioned losing sales, customers not having cash to use in their stores, and NAP customers spending all of their benefits at certified supermarkets (instead of at their uncertified stores). Of the uncertified retailers who anticipated no impact, some mentioned that NAP participants were not shopping at their stores to begin with so the change would not be felt at their business. Others simply could not anticipate the impact.
3. Most NAP participants have no other sources of cash to purchase essential nonfood items.
Most NAP participants in both the survey and focus groups feel that without the cash portion of NAP benefits they have no other sources of income. To be eligible for NAP benefits, household income must be very low. The net income limit for NAP is only about a third of that for SNAP. When asked about the ways they would pay for the nonfood items for which they are using the cash portion of their benefits, only 13.8 percent of NAP participants in the survey mentioned access to any sort of work, including odd jobs. 14.6 percent mentioned financial help from family, friends, or community. Other NAP participants (28.2 percent) mentioned access to Social Security benefits, and a small percentage mentioned receipt of TANF (8.0 percent overall and 12.5 percent among those in units composed of single mothers with children). Still others were not sure how they would pay for those items.
In focus groups, most participants indicated they could not find a job to help pay for items they purchased with the cash benefits due to the poor state of the economy in Puerto Rico. In other groups, particularly those where a majority of participants had a disability or chronic health condition, participants described not being able to work at all. In addition, in a few groups, participants shared their belief that removing the cash portion of their benefits could increase crime and fraud, including the possibility of selling their EBT cards for cash, if necessary. Administrators at CBOs and group residential facilities echoed this possibility.
NAP participants with little or no other source of cash income (beyond the cash portion of their benefits) may experience more hardship than others would from the policy change. According to ADSEF’s NAP participant data for June 2014, 65.4 percent of all NAP units have zero income (either earned or unearned) (see table VI.3). A large proportion of units with elderly members or with nonelderly members with disabilities have zero income (89.4 percent and 80.6 percent, respectively). In contrast, units composed of single mothers with children and all units with children are more likely to have access to cash through both earned and unearned income. Nevertheless, these units with children still have very low incomes.63
63 Almost all NAP units with children (94.8 percent) and single mothers with children (95.7 percent) have income at or below 50 percent of the Federal poverty guideline.

Examination of Cash Nutrition Assistance Program Benefits in Puerto Rico
Page 80
The relatively large percentage of units with elderly members or nonelderly members with disabilities with no other cash income may indicate these groups will be particularly financially vulnerable without the cash portion of their NAP benefits. At the same time, while NAP participants in families with children are relatively more likely to have other sources of income to rely on, they also are more likely to withdraw their monthly cash benefits rather than use them for EBT food purchases.

Exa
min
atio
n of
Cas
h N
utrit
ion
Ass
ista
nce
Pro
gram
Ben
efits
in P
uerto
Ric
o
Pag
e 81
Tabl
e VI
.3.
Di
strib
utio
n of
Pue
rto
Rico
NAP
Uni
ts b
y Po
vert
y an
d So
urce
of I
ncom
e by
Sub
grou
p
To
tal U
nits
U
rban
Ru
ral
Uni
ts W
ith
Elde
rly
Mem
bers
Uni
ts W
ith
Non
elde
rly
Mem
bers
W
ith
Disa
bilit
ies
Uni
ts W
ith
Child
ren
Uni
ts W
ith
Sing
le
Mot
hers
W
ith
Child
ren
Tota
l Uni
ts
650,
944
620,
187
30,7
57
226,
633
109,
223
220,
395
113,
823
Mon
thly
gro
ss in
com
e as
a
perc
enta
ge o
f the
Fed
eral
po
vert
y gu
idel
ine
Eq
ual t
o or
bel
ow
100
perc
ent
99.8
99
.8
99.7
99
.9
99.8
99
.8
99.8
N
o in
com
e 65
.4
65.5
62
.7
89.4
80
.6
33.3
30
.4
Abov
e 10
0 pe
rcen
t 0.
2 0.
2 0.
3 0.
1 0.
2 0.
2 0.
2
U
nits
With
:
Posit
ive
gros
s inc
ome
34.6
34
.5
37.3
10
.6
19.4
66
.7
69.6
An
y ea
rned
inco
me
18.5
18
.3
21.3
5.
1 9.
5 30
.7
20.6
An
y un
earn
ed in
com
e 19
.7
19.7
19
.9
5.9
11.3
45
.2
59.2
So
urce
: SAI
C da
ta

Examination of Cash Nutrition Assistance Program Benefits in Puerto Rico
Page 82
4. There are no clear patterns of differences across subgroups in the effects of discontinuing the cash portion of NAP benefits.
Geographic access to certified retailers, use of cash benefits, and the anticipated effects of discontinuing the cash portion of benefits are generally similar across vulnerable subgroups of the study and by urban versus rural location. In cases where individual findings varied by subgroups, the findings were mixed, and no clear pattern emerged to identify specific subgroups that would be affected more than others. For example, based on EBT data, NAP units with children were somewhat more likely to redeem their monthly cash benefits as cash withdrawals (from ATMs or certified retailers) and less likely to redeem their benefits as EBT food purchases compared with other groups, which could indicate that they would feel the effects of discontinuing the cash benefit more than others. Similarly, in the survey data, participants in units composed of single mothers with children tended to rely on cash benefits to purchase nonfood essentials more than other groups. They were also more likely to indicate that it would be difficult to purchase nonfood essentials without the cash portion of benefits (but less likely to indicate it would be difficult to purchase food items without the cash). However, these same subgroups with children were also more likely than others to have additional sources of income to rely on that might help alleviate these difficulties. In another example, participants in units with elderly were more likely than other groups to indicate that buying food without the cash portion of benefits would be difficult. However, participants in units with elderly members were also more likely than other groups to redeem their cash benefits for EBT food purchases rather than as cash withdrawals, implying that they may depend on cash benefits for nonfood items less than other groups do.
D. CONCLUSIONS
Overall, findings from the complementary data sources used in this study indicate that NAP participants do not face current barriers to redeeming the noncash portion of the NAP benefit. Discontinuing the cash portion would likely have little impact on participants’ access to food. However, the data sources also indicate that NAP participants rely heavily on the cash portion of benefits to purchase basic nonfood products needed to maintain the personal hygiene and cleanliness of their families. Given the difficult economic situation and scarcity of jobs in Puerto Rico combined with the lack of other sources of cash assistance, discontinuing the cash portion would likely have a significant adverse effect on participants’ ability to meet their basic needs. These adverse effects would be similar across vulnerable subgroups and for those in urban and rural areas.
The findings also indicate that NAP retailers (both certified and uncertified) do not face barriers to being certified or to redeeming noncash benefits. Given the relative ease and low cost of becoming NAP certified, it is likely that uncertified retailers would be able to become certified after the discontinuation of the cash portion of benefits if they chose to do so. No uncertified retailers pointed to infrastructure, costs, or other technological reasons for not being certified; instead, they cited reasons such as a lack of interest, insufficient knowledge of NAP, and insufficient demand. In fact, some uncertified retailers described ongoing plans to become certified in the near future to gain business and sales for their stores. Certified retailers felt the effects of discontinuing the cash portion of benefits would be positive or neutral; uncertified retailers gave mixed predictions on the impact, with only a third anticipating negative effects due to a loss of business. Overall, when discussing the potential effects of discontinuing cash benefits most were concerned about the implications and the effects on low-income Puerto Rico residents rather than the effects on their businesses.

Examination of Cash Nutrition Assistance Program Benefits in Puerto Rico
Page AA-1
ABBREVIATIONS AND ACRONYMS
AABD Aid to the Aged, Blind, and Disabled
ACS American Community Survey
ADSEF Administración de Desarrollo Socioeconómico de la Familia
ATM automated teller machine
CBO community-based organization
CBO Congressional Budget Office
CFFR Consolidated Federal Funds Report
CHIP Children's Health Insurance Program
DOL U.S. Department of Labor
DOT U.S. Department of Transportation
EBT electronic benefit transfer
EITC Earned Income Tax Credit
ERS Economic Research Service
FCC Federal Communications Commission
FMAP Federal Medical Assistance Percentage
FNS Food and Nutrition Service
FSP Food Stamp Program
FY fiscal year
GAO Government Accountability Office
GDB Government Development Bank for Puerto Rico
HHS U.S. Department of Health and Human Services
MARO Mid-Atlantic Regional Office
MPR Mathematica Policy Research
NAP Nutrition Assistance Program
OMB U.S. Office of Management and Budget
PIN personal identification number
POS point of sale
PRCS Puerto Rico Community Survey
RRUC Rural-Urban Continuum Codes
SAIC Sistema de Administración e Información de Casos
SDEC Sistema de Determinación de Elegibilidad de Casos
SSA Social Security Administration

Examination of Cash Nutrition Assistance Program Benefits in Puerto Rico
Page AA-2
SSI Supplemental Security Income
TANF Temporary Assistance to Needy Families
UI Unemployment Insurance
USDA U.S. Department of Agriculture
WIC Special Supplemental Nutrition Program for Women, Infants, and Children

Examination of Cash Nutrition Assistance Program Benefits in Puerto Rico
Page R-1
REFERENCES
Administración de Desarrollo Socioeconómico de la Familia. (2000). Implementation plan for the requirement of NAP participants 75% targeted for food and 25% non-targeted. Internal document.
Administración de Desarrollo Socioeconómico de la Familia. (2001a). Attachment B: Revised EBT system – Pilot operations report. Prepared by the Government Development Bank of Puerto Rico. Internal document.
Administración de Desarrollo Socioeconómico de la Familia. (2001b). Revised implementation plan for the 75% targeted and 25% non-targeted NAP benefits. Internal document.
Administración de Desarrollo Socioeconómico de la Familia. (2004). Estudio sobre el nivel de satisfacción de las familias beneficiarias y comerciantes participantes con el sistema de transferencia electrónica de la tarjeta de la familia. Final report.
Administración de Desarrollo Socioeconómico de la Familia. (2014). State plan of operations for the administration of the Nutrition Assistance Program for the Commonwealth of Puerto Rico, fiscal year 2014. Internal document.
Administración de Desarrollo Socioeconómico de la Familia. (2015). State plan of operations for the administration of the Nutrition Assistance Program for the Commonwealth of Puerto Rico, fiscal year 2015. Internal document.
Agricultural Act of 2014, P. L. 113–79, § 4025 (2014).
Chromy, J. R. (1979). Sequential sample selection methods. In 1979 Proceedings of the American Statistical Association (pp. 401–406). Alexandria, VA: American Statistical Association.
Cole, N. (1997). Evaluation of the expanded EBT demonstration in Maryland: Patterns of food stamp and cash welfare benefit redemption. Cambridge, MA: Abt Associates.
Congressional Budget Office. (1977). The Food Stamp Program: Income or food supplementation? Retrieved from https://www.cbo.gov/sites/default/files/cbofiles/ftpdocs/111xx/doc11104/77doc696.pdf
Government Development Bank for Puerto Rico. (2015, June). Economic indicators – Time series [Web page]. Retrieved from http://www.gdb-pur.com/economy/pr-monthly-economic-indicators-time-series.html
Gray, K. F. (2014). Characteristics of Supplemental Nutrition Assistance Program households: Fiscal year 2013. Retrieved from http://www.fns.usda.gov/sites/default/files/ops/Characteristics2013.pdf
Mabli, J. (2014). SNAP participation, food security, and geographic access to food. Retrieved from http://www.fns.usda.gov/sites/default/files/SNAPFS_FoodAccess.pdf
Mabli, J., & Worthington, J. (2015). The food access environment and food purchase behavior of SNAP households. Journal of Hunger & Environmental Nutrition, 10(1), 132–149.

Examination of Cash Nutrition Assistance Program Benefits in Puerto Rico
Page R-2
Macpherson de Sánchez, A., Rodríguez, M., Rodríguez, R., Quiñones, J., Irizarry, M., & Rosa, P. (2000). Evaluation of the Electronic Benefit Transfer Pilot Study in Bayamon and Mayaguez, Puerto Rico. Prepared by the University of Puerto Rico for the Puerto Rico Department of the Family, Administration for Socioeconomic Development of the Family. Internal report.
Mathematica Policy Research. (1985a). Evaluation of the Nutrition Assistance Program in Puerto Rico. Volume I: Environment, participation, administrative costs, and program integrity. Retrieved from http://www.mathematica-mpr.com/~/media/publications/pdfs/nutrition/puerto_rico_nutritionassistprogram.pdf
Mathematica Policy Research. (1985b). Evaluation of the Nutrition Assistance Program in Puerto Rico. Volume II: Effects on food expenditures and diet quality. Retrieved from http://www.mathematica-mpr.com/~/media/publications/pdfs/nutrition/puertorico_dietquality.pdf
Ohls, J., Ponza, M., Moreno, L., Zambrowski, A., & Cohen, R. (1999). Food stamp participants’ access to food retailers: Final report. Retrieved from http://www.fns.usda.gov/sites/default/files/retailer.pdf
Peterson, A., Johnson, B., Moulton, B. E., Smith, E. O., Suchman, A., Wilson, C., Francisquini, S., Kauff, J., Ladinsky, J., & Castner, L. (2010). Implementing SNAP in Puerto Rico: A feasibility study. Retrieved from http://www.fns.usda.gov/sites/default/files/PuertoRico.pdf
Phoenix Planning & Evaluation, Ltd. (1995a). Electronic benefit transfer (EBT) feasibility study. Prepared for the Government Development Bank for Puerto Rico. Rockville, MD: Author.
Phoenix Planning & Evaluation, Ltd. (1995b). Electronic benefit transfer (EBT) feasibility study: Alternatives and cost benefit analysis. Prepared for the Government Development Bank for Puerto Rico. Rockville, MD: Author.
Provision of a Nutrition Assistance Grant for the Commonwealth of Puerto Rico, 7 U.S.C. 2011–2036, § 285 (1982).
Rosado-González, R. (2008). PANECO pregunta. Prepared for Puerto Rico’s Department of the Family, Administration for Socioeconomic Development of the Family. Trujillo Alto, Puerto Rico: RRG Universe and Associates Inc.
Social Security Administration. (n.d.). SSI Federal payment amounts for 2015 [Web page]. Retrieved from http://www.ssa.gov/OACT/COLA/SSI.html
Social Security Administration. (2013, June). 2013 annual report of the SSI program: Federal payments under SSI [Web page]. Retrieved from http://www.socialsecurity.gov/oact/ssir/SSI13/IV_C_Payments.html#426908GAO
U.S. Census Bureau. (2011). Consolidated Federal funds report for fiscal year 2010. Retrieved from https://www.census.gov/prod/2011pubs/cffr-10.pdf
U.S. Census Bureau. (2013). American Community Survey, 2013 1-year estimates [Dataset]. Retrieved from http://www.census.gov/acs/www/data_documentation/summary_file/

Examination of Cash Nutrition Assistance Program Benefits in Puerto Rico
Page R-3
U.S. Department of Agriculture. (2013a). Supplemental Nutrition Assistance Program benefits [Table]. Retrieved from http://www.fns.usda.gov/sites/default/files/pd/17SNAPfyBEN$.pdf
U.S. Department of Agriculture, Economic Research Service. (2013b). Rural-Urban Continuum Codes [Dataset]. Retrieved from http://www.ers.usda.gov/data-products/rural-urban-continuum-codes.aspx
U.S. Department of Agriculture, Food and Nutrition Service. (1983). Evaluation of the Puerto Rico Nutrition Assistance Program. Alexandria, VA: Author.
U.S. Department of Agriculture, Food and Nutrition Service. (2014, September). Supplemental Nutrition Assistance Program: cost of living adjustment (COLA) information [Web page]. Retrieved from http://www.fns.usda.gov/snap/cost-living-adjustment-cola-information
U.S. Government Accountability Office. (1992). Food assistance: Nutritional conditions and program alternatives in Puerto Rico. Washington, DC: Author.
U.S. Government Accountability Office. (2014). Information on how statehood would potentially affect selected Federal programs and revenue sources (GAO Publication No. 14-31). Retrieved from http://www.gao.gov/assets/670/661334.pdf
U.S. Office of Management and Budget. (2005). Program assessment: Nutrition assistance for Puerto Rico. (PART Review).
U.S. Office of Management and Budget. (2012). Analytical perspectives, budget of the U.S. Government, fiscal year 2013. Retrieved from http://www.gpo.gov/fdsys/pkg/BUDGET-2013-PER/pdf/BUDGET-2013-PER.pdf
U.S. Office of Management and Budget. (2014). Analytical perspectives, budget of the U.S. Government, fiscal year 2015. Retrieved from https://www.whitehouse.gov/sites/default/files/omb/budget/fy2015/assets/spec.pdf
Ver Ploeg, M., Breneman, V., Dutko, P., Williams, R., Snyder, S., Dicken, C., & Kaufman, P. (2012). Access to affordable and nutritious food: Updated estimates of distance to supermarkets using 2010 data (Economic Research Report No. 143). Retrieved from http://www.ers.usda.gov/media/956784/err143.pdf

Examination of Cash Nutrition Assistance Program Benefits in Puerto Rico
Page A-1
APPENDIX A: DETAILED DESCRIPTION OF STUDY METHODS
A.1. EXTANT DATA ANALYSIS METHODOLOGY
In this appendix, we provide detailed information about the data used in the analysis of NAP participants’ geographic access to food and benefit redemption patterns, the process we undertook to construct the analysis files, and the methodology we employed for the descriptive analyses presented above.
1. Data Sources and Cleaning
We used four data sources to construct the analysis files and conduct the extant data analyses: (1) NAP participant administrative data provided by SAIC, (2) NAP certified retailer data provided by SDEC, (3) EBT NAP transaction data provided by Centinela, and (4) U.S. Census Bureau data.
Participant data: SAIC
We obtained an extract of the NAP participant-level SAIC database from ADSEF. The dataset included all of the participants who received NAP benefits from July 1, 2013, to June 30, 2014. The participants appeared in the dataset every time they received their monthly benefits; for example, a NAP participant who was enrolled in the program for a full year would appear in the dataset 12 times, once for each month that he or she received benefits. A NAP participant newly certified or recertified in May 2014 would appear in the dataset only twice. Each beneficiary in the data had a unit head, the person who received the benefits loaded onto the EBT card on behalf of all beneficiaries in the unit. As we describe below, we created unit-level variables and aggregated the participant-level data file to a unit-month-level file. All of the extant data analyses were conducted at the unit-month level.
SDEC
We obtained retailer locations and store type information from the SDEC database of NAP certified retailers from ADSEF. The database was complete as of July 9, 2014, and included all 7,026 businesses that were certified NAP retailers at any point in time from May 2001 to July 2014.
The file contained many variables, including the following ones relevant to our analysis: retailer identification, certification number, name, physical and postal addresses, store type, NAP certification status, and NAP certification expiration date.
From the 7,026 retailers in the database, we restricted the data to retailers that were active at any time during the period of July 1, 2013, to June 30, 2014. The NAP certification status of retailers in our study sample fell into four groups: they were active for the entire 12-month period without interruption; they became active at some point during the year; they were active at the beginning of the year and became inactive; or they were active, became inactive, and then became active again. We determined whether retailers were active based on their certification activity during the study period. After restricting the data based on certification, we restricted the data further to eliminate all retailers with a certification expiration date prior to July 1, 2013, the beginning of the analysis period. In all, 3,127 retailers were eligible for inclusion in the analyses.

Examination of Cash Nutrition Assistance Program Benefits in Puerto Rico
Page A-2
We categorized retailers using store type information. We combined 24 original retailer categories from the SDEC data into 8 retailer categories, which we further reduced to 5 categories for the analysis. Although there was a variable in the data file that provided information about retailers’ total sales, we were not able to use this additional information to further refine retailer types due to a substantial number of observations with missing data. The list of 24 original and 8 new retailer categories are included in table A.1.a. The original categories from the dataset are featured in the first column and their English translations are provided in the second column. For the extant data analyses in this report, three of the categories presented here were combined into one “other retailer” category: bakery and specialty stores; farmers’ markets and fruit and vegetable stands; and nutrition, health food, and other stores. In addition, for the purposes of this study, we excluded all retailers from the “support center” category, which are group living and drug and alcohol treatment centers. Since the public cannot purchase food at these locations, they are not relevant to an analysis on food access.
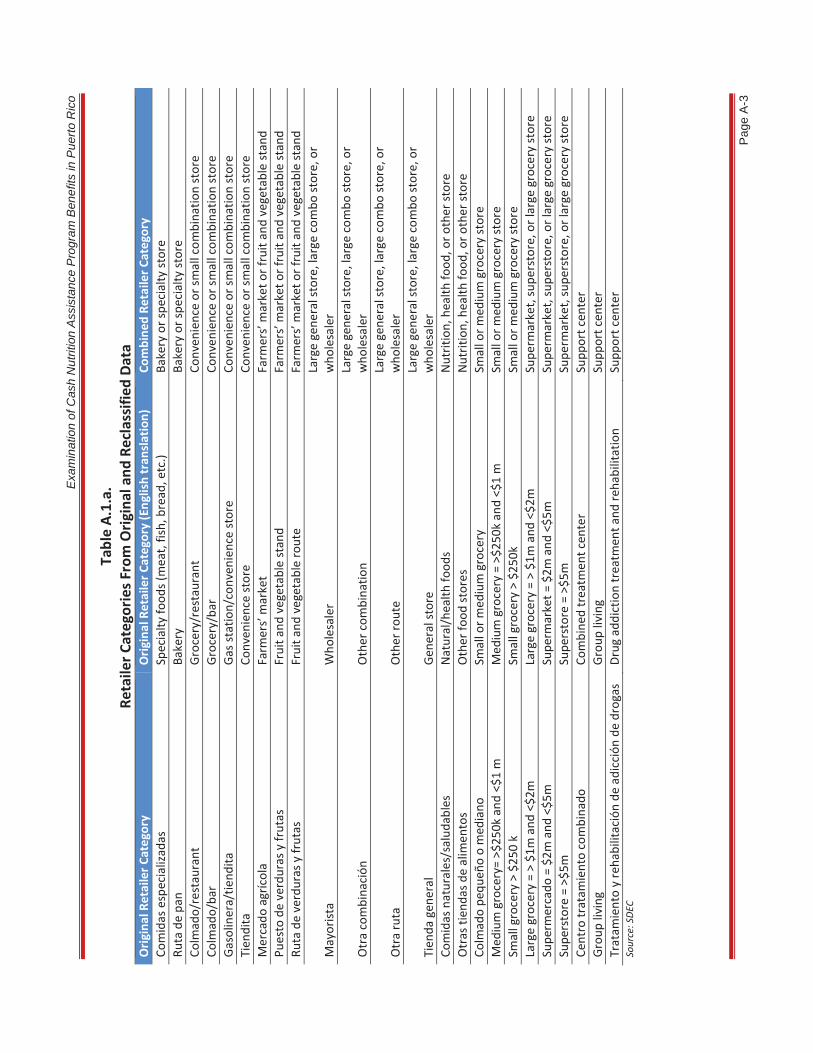
Exa
min
atio
n of
Cas
h N
utrit
ion
Ass
ista
nce
Pro
gram
Ben
efits
in P
uerto
Ric
o
Pag
e A
-3
Tabl
e A.
1.a.
Re
taile
r Cat
egor
ies F
rom
Orig
inal
and
Rec
lass
ified
Dat
a O
rigin
al R
etai
ler C
ateg
ory
Orig
inal
Ret
aile
r Cat
egor
y (E
nglis
h tr
ansl
atio
n)
Com
bine
d Re
taile
r Cat
egor
y Co
mid
as e
spec
ializ
adas
Sp
ecia
lty fo
ods (
mea
t, fis
h, b
read
, etc
.) Ba
kery
or s
peci
alty
stor
e Ru
ta d
e pa
n Ba
kery
Ba
kery
or s
peci
alty
stor
e Co
lmad
o/re
stau
rant
Gr
ocer
y/re
stau
rant
Co
nven
ienc
e or
smal
l com
bina
tion
stor
e Co
lmad
o/ba
r Gr
ocer
y/ba
r Co
nven
ienc
e or
smal
l com
bina
tion
stor
e Ga
solin
era/
tiend
ita
Gas s
tatio
n/co
nven
ienc
e st
ore
Conv
enie
nce
or sm
all c
ombi
natio
n st
ore
Tien
dita
Co
nven
ienc
e st
ore
Conv
enie
nce
or sm
all c
ombi
natio
n st
ore
Mer
cado
agr
ícol
a Fa
rmer
s’ m
arke
t Fa
rmer
s’ m
arke
t or f
ruit
and
vege
tabl
e st
and
Pues
to d
e ve
rdur
as y
frut
as
Frui
t and
veg
etab
le st
and
Farm
ers’
mar
ket o
r fru
it an
d ve
geta
ble
stan
d Ru
ta d
e ve
rdur
as y
frut
as
Frui
t and
veg
etab
le ro
ute
Farm
ers’
mar
ket o
r fru
it an
d ve
geta
ble
stan
d
May
orist
a W
hole
sale
r La
rge
gene
ral s
tore
, lar
ge c
ombo
stor
e, o
r w
hole
sale
r
Otr
a co
mbi
naci
ón
Oth
er c
ombi
natio
n La
rge
gene
ral s
tore
, lar
ge c
ombo
stor
e, o
r w
hole
sale
r
Otr
a ru
ta
Oth
er ro
ute
Larg
e ge
nera
l sto
re, l
arge
com
bo st
ore,
or
who
lesa
ler
Tien
da g
ener
al
Gene
ral s
tore
La
rge
gene
ral s
tore
, lar
ge c
ombo
stor
e, o
r w
hole
sale
r Co
mid
as n
atur
ales
/sal
udab
les
Nat
ural
/hea
lth fo
ods
Nut
ritio
n, h
ealth
food
, or o
ther
stor
e O
tras
tien
das d
e al
imen
tos
Oth
er fo
od st
ores
N
utrit
ion,
hea
lth fo
od, o
r oth
er st
ore
Colm
ado
pequ
eño
o m
edia
no
Smal
l or m
ediu
m g
roce
ry
Smal
l or m
ediu
m g
roce
ry st
ore
Med
ium
gro
cery
= >$
250k
and
<$1
m
Med
ium
gro
cery
= >
$250
k an
d <$
1 m
Sm
all o
r med
ium
gro
cery
stor
e Sm
all g
roce
ry >
$25
0 k
Smal
l gro
cery
> $
250k
Sm
all o
r med
ium
gro
cery
stor
e La
rge
groc
ery
= >
$1m
and
<$2
m
Larg
e gr
ocer
y =
> $1
m a
nd <
$2m
Su
perm
arke
t, su
pers
tore
, or l
arge
gro
cery
stor
e Su
perm
erca
do =
$2m
and
<$5
m
Supe
rmar
ket =
$2m
and
<$5
m
Supe
rmar
ket,
supe
rsto
re, o
r lar
ge g
roce
ry st
ore
Supe
rsto
re =
>$5
m
Supe
rsto
re =
>$5
m
Supe
rmar
ket,
supe
rsto
re, o
r lar
ge g
roce
ry st
ore
Cent
ro tr
atam
ient
o co
mbi
nado
Co
mbi
ned
trea
tmen
t cen
ter
Supp
ort c
ente
r Gr
oup
livin
g Gr
oup
livin
g Su
ppor
t cen
ter
Trat
amie
nto
y re
habi
litac
ión
de a
dicc
ión
de d
roga
s Dr
ug a
ddic
tion
trea
tmen
t and
reha
bilit
atio
n Su
ppor
t cen
ter
Sour
ce: S
DEC

Examination of Cash Nutrition Assistance Program Benefits in Puerto Rico
Page A-4
Figure A.1.a presents the distribution of types of NAP certified retailers. Small and medium grocery stores were the most common certified retailer in Puerto Rico, accounting for 45.3 percent of all NAP retailers. Many of the stores in this category—known as colmados in Puerto Rico—are small family-run stores. Large general stores, large combination stores, and wholesalers were the next largest category, comprising 19.1 percent of certified retailers. This category included stores like Walmart, Walgreens, CVS, and Sam’s Club.
Figure A.1.a. Distribution of Certified Retailers by Store Type
Source: SDEC
Electronic benefit transfer transaction data: Centinela
We obtained the Centinela EBT transaction data from EVERTEC,64 a vendor that contracts with ADSEF to collect and manage these data. The file contains complete data for monthly cash and electronic benefit transfers to each NAP unit, as well as these units’ benefit redemption transactions, for the period of July 1, 2013, to June 30, 2014.
In the dataset, there were 36 variables and 74,804,182 unique observations. Each observation in the data was a single transaction, either a benefit transfer to the EBT card (load) or one of several types of benefit redemptions. Each transaction also identified whether the load or redemption was from the cash or noncash component of the NAP benefit. Additional variables included the participant Social Security number, the retailer certification number where the benefit was redeemed (if applicable), the
64 EVERTEC is a subsidiary of Popular, Inc., the parent company of Banco Popular of Puerto Rico, the largest bank in Puerto Rico.
Examination of Cash Nutrition Assistance Program Benefits in Puerto Rico
Page A-5
transaction type (e.g., monthly load, noncash portion food purchase, cash portion food purchase, or cash withdrawal), the transaction amount, and date and time of the transaction.
Although the file was complete and not missing any data, we had to address a few issues before constructing the analysis file. In a small percentage of cases, there were two loads of the same amount made to the same participant a few days apart. For instance, the data for one participant indicated a monthly load of $112 on April 16 and another monthly load of $112 on April 18. We analyzed these cases; on average, the participants spent no more than the amount of one monthly load. In addition, ADSEF performed a manual verification of selected cases and confirmed the participants received only one load during those months. Therefore, we decided to remove the duplicate transactions for these selected cases. In addition, we removed all transactions with an amount of $0. Finally, we removed all transactions that were linked to support centers, such as group living or drug and alcohol treatment centers, which were deemed irrelevant for the food access analysis.
U.S. Census Bureau data
We classified NAP units as urban or rural based on ERS Rural-Urban Continuum Codes for metropolitan and nonmetropolitan Puerto Rico municipalities for 2013. These codes are based on the 2010 decennial census; they form a classification scheme that distinguishes metropolitan municipalities by the population size of their metro areas and nonmetropolitan municipalities by the degree of urbanization (population size) and adjacency to a metro area. There are nine codes: three for metropolitan counties and six for nonmetropolitan counties. We coded as rural those units whose addresses were in municipalities with metropolitan and nonmetropolitan codes four through nine.65 The rural population was small, representing only 4.7 percent of units in June 2014.
2. Constructing the Data Analysis Files
From the NAP participant, retailer, and transaction data we built several different analysis files, and we describe the creation of each one below. First, we describe how we created the NAP participant file at the unit level. Next, we detail the geocoding process to create measures of geographic access to food. Finally, we discuss the creation of the transaction files for the cash and noncash portions of the benefit.
Master participant file at the unit-month level
The SAIC data contained the demographic and economic information for all NAP units from July 1, 2013, to June 30, 2014. We used these data to create a series of variables to describe the characteristics of the NAP participants within each unit. These variables noted whether units included children, nonelderly members with disabilities, or elderly members, and whether units had income. In table A.1.b, we present the percentage of each unit subgroup during the most recent month for which we had data on file, June 2014.
65 The 2013 ERS descriptions of the codes that we used to define the “rural” municipalities are as follows: 4 = “Urban population of 20,000 or more, adjacent to a metropolitan area” 5 = “Urban population of 20,000 or more, not adjacent to a metropolitan area” 6 = “Urban population of 2,500 to 19,999, adjacent to a metropolitan area” 7 = “Urban population of 2,500 to 19,999, not adjacent to a metropolitan area” 8 = “Completely rural or less than 2,500 urban population, adjacent to a metropolitan area” 9 = “Completely rural or less than 2,500 urban population, not adjacent to a metropolitan area”

Examination of Cash Nutrition Assistance Program Benefits in Puerto Rico
Page A-6
Table A.1.b. Distribution of NAP Unit Subgroups, June 2014
Unit Subgroup Percentage of Units Units with children 34.0 Units with elderly members 34.7 Units with nonelderly members with disabilities 16.7 Units without income 65.3 Source: SAIC
After creating these variables, we collapsed the sample to include only the unit heads, identified as those participants for whom the Social Security number of the beneficiary matched the Social Security number of the unit head. An additional 2,988 units were identified and added to the sample because they did not have any unit head noted in the dataset. For these units, it is likely the unit head served as the administrator of the case, but was not eligible for and did not receive benefits. Each unit-month observation represents a month that a unit participated in the program. The file included 7,735,896 observations with 739,294 unique units.
Geographic access analysis
We geocoded participant and retailer addresses using ArcGIS map software, locating each address as a point on a map. Every point had an associated latitude and longitude, which we used to calculate the distances between units’ homes and retailer locations and the number of retailers within selected distances of units’ homes. In many cases, the latitudes and longitudes were the precise street address locations (such as Highway 100, KM 4.2, or 200 Calle Principal) within a town. When the precise street address was not available in either the data or the geocoding software, the assigned point was centered at the smallest identifiable location, such as a street, a housing development, a neighborhood, a district, etc.
To prepare the participant and retailer addresses for geocoding, we undertook several steps to clean the data to maximize the available information.
We obtained a list of ArcGIS address formats that are common in Puerto Rico and formatted the addresses according to these specifications. This was necessary because the geocoding software ArcGIS can recognize addresses only in specific formats.
We extracted from the addresses specific geographic locations that could be geocoded, including urbanización (housing development), sector (neighborhood), barrio (district or county subdivision), and municipio (municipality or county). In Puerto Rico, there are 78 municipios, 131 ZIP Codes, and 898 official barrios.
We cleaned and standardized barrio names to correct for misspellings and other errors. This was particularly important for the participant data because barrios are geographically small, with an average land area of about 3 square miles, and therefore are reasonably accurate approximations of addresses. Of the participant addresses, 19.7 percent were placed at this level (see table A.1.c).
We assigned postal ZIP Codes to NAP participants’ residential addresses when the residential ZIP Code was missing and the name of the city or municipality matched in the residential and postal addresses.

Examination of Cash Nutrition Assistance Program Benefits in Puerto Rico
Page A-7
We also created a file with the population-weighted centroid of every district or county subdivision and ZIP Code in Puerto Rico using Census Bureau data and Esri ArcMap software. We used these population-weighted centroids to assign locations when we did not have precise participant or retailer address information or when addresses failed to match at the street address or street level. First, we obtained shape files (maps) of the ZIP Codes, county subdivisions, and census blocks. These files contained population information. Next, we overlaid these shape files on a map of Puerto Rico in Esri ArcMap. Then, we used the population data of each block to obtain the population-weighted centroid of every district or county subdivision and ZIP Code in Puerto Rico. Finally, we obtained a latitude and longitude for each of these points. These latitudes and longitudes later were assigned to select addresses as described below.
Participant address geocoding. The participant address geocoding process included multiple steps.
First, we used the geocoding tool in version 10.2 of Esri ArcMap to locate the street addresses of participants. For each matched address, ArcGIS assigns a score of 0 to 100, where 100 is a perfect match. We accepted the geocoded addresses that were placed at the street address (exact location on the street) or street (midpoint of the street within the area) level with match scores of 85 or higher. We saved the accepted latitudes and longitudes in a separate file.
The addresses that failed to place, had match scores below 85, or were located at the geographic center of the ZIP Code or municipality were returned to the geocoding file for the next step.
Next, we used Google API geocoding software to try to locate the remaining addresses. Again, we accepted addresses that were placed at the street address or street level.
We then extracted addresses that contained housing development and neighborhood information and entered this information into ArcGIS. We accepted placements at the geographic centers of housing developments or neighborhoods with match scores of 85 or higher.
For participants without valid residential address data, we geocoded their postal addresses. We used the same acceptance criteria as for the residential street addresses.
Finally, we placed the remaining addresses that could not be located on the map at the population-weighted centroid of the county subdivision if available or at the population-weighted centroid of the physical ZIP Code or postal ZIP Code.
We present the participant geocoding results in table A.1.c. The results represent the geographic level of placement of all unit-months in the SAIC data. More than half (52.6 percent) of the addresses were located at a precise street or street address level; an additional 20.7 percent were placed at a small geographic location, at the district–or county-subdivision level or smaller. An additional 4 percent of addresses were placed at the postal street addresses, and the remaining addresses were placed at the population-weighted centroid of the ZIP Code as proxies for the residential addresses.

Examination of Cash Nutrition Assistance Program Benefits in Puerto Rico
Page A-8
Table A.1.c. Geocoding Results of NAP Unit Addresses
Geographic Level of Placement Number Percent Residential street, city 4,109,282 52.6 Geographic center of housing development 66,808 0.9 Geographic center of neighborhood 9,265 0.1 Population-weighted centroid of district or county subdivision 1,540,232 19.7 Postal street, city 312,570 4.0 Population-weighted centroid of residential ZIP Code 194,142 2.5 Population-weighted centroid of postal ZIP Code 1,576,453 20.2 Total 7,808,752 100.0
Retailer address geocoding. We followed the same approach for retailer address geocoding as for the residential addresses, with several exceptions. Prior to geocoding the postal addresses or assigning the population-weighted centroids of district or county subdivisions or ZIP Codes as address proxies, we geocoded retailer addresses manually. For addresses with highway and kilometer information, we used an ArcMap function that allowed us to move the cursor along the highway manually until reaching the correct kilometer within a specified city or municipality. When kilometer information was unavailable, either in the original address or in the ArcMap software, we placed the retailer at the center of the highway within a district or county subdivision or ZIP Code. We also verified addresses of retailers by performing online searches for more-precise determination of addresses and then locating the addresses using Google Maps or ArcGIS, depending on the address format found.
Table A.1.d presents the retailer geocoding results. Of the retailer addresses found, 90 percent were placed at a precise street, street address, or highway location, and an additional 6.6 percent were placed at the midpoint of a highway within a district or county subdivision or municipality. Only 2 percent of retailer addresses were placed at the population-weighted centroids of the district or county subdivisions or ZIP Codes.
Table A.1.d. Geocoding Results of NAP Retailer Addresses
Geographic Level of Placement Number Percent Physical street address using ArcGIS 2,089 64.9 Physical street address using Google API or Google Maps 527 16.4 Manual geocoding using highways and kilometer markers on map 280 8.7 Center of highway within district or county subdivision/municipality 213 6.6 Postal street address 44 1.4 Geographic center of urbanization 1 0.0 Population-weighted center of district or county subdivision 22 0.7 Population-weighted center of ZIP Code 41 1.3 Total 3,217 100.0
Distance between retailers and units. Once we had obtained a latitude and longitude for every unit and retailer address, we calculated the distances between retailers and units and created new variables to capture the information.
We calculated the distance between each unique unit address and every retailer in the data, resulting in more than 2 billion distances. The formula that we used returned the geodetic
Examination of Cash Nutrition Assistance Program Benefits in Puerto Rico
Page A-9
distance, or the distance that accounts for the curvature of the Earth’s surface (although the curvature has little effect on calculations of short distances).
For each unit in the data, we created new variables equal to the minimum distance between the unit’s home and each type of retailer.
We also counted the number of each type of retailer within selected distances of each unit’s home and stored this information in a series of variables.
Transaction Analysis
We undertook several steps to prepare the transaction data analysis file, which was used for both the noncash and cash analyses. The steps included creating separate files for the noncash and cash transactions, defining the issuance “cycles” (or months), establishing a protocol for missing June cycle data, accounting for voids and returns, establishing protocols for NAP bonuses and farmers’ market loads and purchases, and creating new variables for the analyses. The results of the transaction analyses are presented in chapter IV, section B and chapter V, section A.
Separate cash and noncash portion files. Because there were different research questions for the cash and noncash portion transactions, the first step was to split the transaction dataset into two separate files: one file containing the cash portion transactions and a separate file containing the noncash portion transactions. There are several tables where the two types of transactions were combined.
Cycle definition. We conducted the analysis based on benefit cycles rather than calendar months because units receive their benefits at different points during the month depending on the last digit of their Social Security numbers. Benefits are disbursed every 2 days from the 4th to the 22nd of the month. For example, for participants with a Social Security number ending in 0, the May 2014 cycle began on May 4 and ended on June 3. For participants with a Social Security number ending in 9, the benefit cycle began on May 22 and ended on June 21. If a unit’s benefit disbursement date coincides with a holiday, these participants generally receive their benefits 2 days earlier than they would have received them.
We defined the first and last day of each benefit cycle based on the date of the benefit disbursement as seen in the data. The first day of a cycle was set as the day that the unit received a monthly load. The last day of the cycle is the day prior to receipt of the following month’s load.
In some cases, NAP units did not appear in the data for 2 or more consecutive months. They either dropped out of the data altogether or reappeared in the data in later months. We could not define these units’ cycle end dates in the same way as the other cases. Thus, if we did not observe a participant in the data for 2 or more consecutive months, an artificial cutoff date was applied to the end of the participant’s cycle. This date was defined as the day prior to the date the participant was expected to receive the monthly benefit based on the last digit of his or her Social Security number.
June cycle. Since we had only 12 months of data (from July 1, 2013, to June 30, 2014), the June cycle, which ended in July for all units, had incomplete data. We maintained the June cycle in the analysis files, but all June cycles had missing cycle end dates. We removed June cycles from select tables noted in table and figure footnotes. In the next section, we discuss in detail the analyses performed and the sensitivity tests conducted in relation to the missing cycle end dates.

Examination of Cash Nutrition Assistance Program Benefits in Puerto Rico
Page A-10
Returns and voids. To avoid skewing the monthly transaction statistics and the spending patterns, we needed to account for the voided transactions and the food returns. We matched each voided transaction to a food purchase of the same amount, at the same retailer, and within 15 days of the original transaction. In some cases, the voids posted before the food purchases, so we allowed the match to occur if the void was up to 24 hours before or up to 15 days after the purchase. Each pair of observations was deleted from the data. This matching process accounted for all of the voids in the electronic benefit file. In the case of returns, we followed the same process, but the “matches” were often different amounts. If the amounts were identical, we deleted both transactions. If the return amount was less than the purchase amount, we subtracted the return amount from the original purchase amount and left the new purchase amount in the data. In the instances where there were no matching purchases, or the return amount exceeded the purchase amount (within the specified timeframe), we treated the returns as credits to the account. We followed the same process for the cash data. However, in some cases, we could not account for the voids; in those instances, we treated the voids as credits.
Bonus months. NAP participants received a proportion of their total benefits as a bonus during the last 2 months of the 2013 government fiscal year, at the end of August and the end of September. According to ADSEF administrators, the remaining funds from the annual NAP block grant are distributed to NAP participants as end-of-fiscal-year bonuses. The calendar date for these bonuses is the same for each participant, but the timing within the benefit cycle that we used for our analysis varies. Thus, we excluded August and September from analyses that are related to the timing of spending within the cycle, such as the proportion of benefits spent at various points in the issuance month and the value of unspent issuances at the end of the month.
Farmers’ markets. During the study period, four municipalities in Puerto Rico had pilot farmers’ market programs. As part of the pilot, participants received a small additional benefit based on the size of their regular NAP benefits, shown as a separate load in the data. In the majority of cases, the regular load and the farmers’ market load occurred on the same day, and we summed the two for the total monthly benefit amount. We eliminated unit cycles when units received only farmers’ market loads or when the two types of loads occurred at different times in the month. In the analysis, we did not distinguish between farmers’ market purchases and regular food purchases.
Variable creation. Prior to collapsing the transaction dataset to one observation per unit per cycle, we created a series of variables to characterize the units’ spending patterns: These variables included the benefit amount; the number of transactions (by transaction type); the average transaction amount; the proportion of benefits spent by day 1, day 7, day 14, day 21, and the last day of the cycle; the unspent issuance at the end of the month; and the IDs of the closest retailers (by type) where participants spent the noncash portion of their benefits. Once these variables were created, the cash and noncash portion files were each collapsed to the unit-month level so a unit had a separate record on the file for each month in which it participated.
Merging Datasets
Three of the datasets described above (NAP participant data provided by SAIC, NAP retailer data provided by SDEC, and EBT NAP transaction data provided by Centinela) were merged to construct the final analysis files. When merging the files, we lost some participants and some retailers because select Social Security numbers and retailer identification numbers failed to match.

Examination of Cash Nutrition Assistance Program Benefits in Puerto Rico
Page A-11
When merging the transaction file with the retailer file, we found 139,592 purchases (0.4 percent of all purchases) at 78 retailers for which the retailer identification number on the transaction did not match an active retailer on the SDEC file. We deleted these files from the analysis.
When merging the SAIC participation data with the transaction data, we found 43,413 unit-month records (0.5 percent of all unit-month records) in which the Social Security number from the transaction data did not match either a unit head or beneficiary in the SAIC data. We deleted these files from the analysis.
3. Methodology
In this section, we describe the analytic methods used to estimate each set of tables and figures presented in the extant data analyses above.
Geographic Access
The first set of analyses examined NAP participants’ geographic access to certified NAP retailers using both distance and density-based measures. Distance-based measures describe how far stores are from participants’ homes, whereas density-based measures describe how many stores there are in the area in which participants live.
For the distance measure, we calculated how far NAP certified retailers are from participants’ homes, as described in section 2 of this chapter. In the tables in the prior section, we present the distance between units’ homes and the nearest certified retailer by type of certified store (supermarkets, superstores, and large groceries stores; small and medium grocery stores; large general stores, large combination stores, pharmacies, and wholesalers; convenience and small combination stores; and other stores) and unit subgroup (whether units included children, nonelderly members with disabilities, or elderly members, and whether units had income).
We used these distance measures to categorize units as having high or low levels of geographic access to food. Units that lived within the median distance to the nearest retailer were defined as having a high level of access. Units that lived more than the median distance to the nearest retailer were defined as having a low level of access. As a robustness check, we redefined high and low access levels using distance to the nearest supermarket, superstore, and large grocery store instead of the distance to any retailer, and the results did not change.
For the density measure, we counted the number of retailers, by type, within selected distances of units’ homes. The distances differed for units in urban and rural areas. In urban areas, the distances used for the density measure were less than 0.5 miles, 0.5 to less than 1 mile, and 1 to less than 2 miles. In rural areas, the distances used were less than 1 mile, 1 to less than 2 miles, and 2 to less than 5 miles.66 We present the median number of retailers by unit subgroup and store type.
66 It is typical to assess geographic access using longer distances for rural areas than for urban areas (Mabli, 2014; Ver Ploeg et al., 2012).

Examination of Cash Nutrition Assistance Program Benefits in Puerto Rico
Page A-12
Spending Patterns
Noncash Portion of Benefit Spending Patterns
The second set of analyses examined where and how NAP units redeem their benefits. We used the transaction data from a full calendar year (July 1, 2013, to June 30, 2014) to account for variations in spending patterns from month to month. For example, when we examined the distribution of spending patterns on a monthly basis, we noticed that spending patterns were slightly different in August, September, and October, likely because many participants received a proportion of their NAP benefits as a bonus at the end of the government fiscal year in August and September 2013. To account for these variations, we considered a longer analysis period.
Distance to retailers where benefits are redeemed. We estimated the median distance by store type to the nearest retailers where participants redeemed NAP benefits and compared this to the median distance to the nearest certified retailer. We estimated this for each retailer type and by unit subgroup, rural/urban status, and geographic access level. We calculated the distance units traveled to redeem their benefits for each unit and for each store at which a transaction took place. Then, for each unit and store type, we took the minimum distance among the transactions at that store type. Next, we estimated the distribution of this distance and compared it to the distribution of the nearest retailers by store type.
Average number of transactions and benefit redemption amounts. We also estimated the average number of transactions, the average purchase amount, and the average total monthly redemption amount by greater and less geographic access, retailer type, unit subgroup, and rural and urban status. To do this, we first calculated each of these variables (number of transactions, average purchase amount, and total monthly redemption) for each unit-month. Then we computed the average across all unit-months. Therefore, units that participated in the program for 12 months contributed 12 observations to these analyses.
These analyses excluded June transactions because data for the full cycle, which ended in July 2014, was not available. We included transactions from August and September, however, which are the months when participants received bonuses. Our findings were robust to the inclusion of transactions from August and September; excluding August and September resulted in a slightly lower average number of monthly transactions and average total monthly redemption amount.
Percentage of benefits spent over time and the value of unspent issuance. Finally, we examined how quickly units spent their benefits. We calculated the proportion of benefits spent each week throughout each month. Like the previous analyses, the proportions were calculated at the unit-month level and then averaged across all unit-months. Similarly, the unspent issuance was averaged across all unit-months.
In these analyses, we included June transactions when feasible. June data contributed to the proportion of benefits spent tables for as long as they remained in the month. For example, if a participant first received his benefit on June 4, he would appear in day 1, day 7, day 14, and day 21 of the data. His observation for the last day of the cycle (July 3) would be missing. A beneficiary who received her benefit on June 22 would contribute only to day 1 and day 7 of the tables. June data also were removed from the value of unspent issuance at the end of the month because we did not have data for the last

Examination of Cash Nutrition Assistance Program Benefits in Puerto Rico
Page A-13
day of the June issuance month. As a sensitivity check, we calculated these tables with and without June, and the results were similar.
We excluded August and September from both the proportion of benefits spent and the unspent issuance because participants receive bonuses at the end of the months. If we included the bonuses, the proportion of benefits would increase at some point in the cycle. Therefore, we decided to exclude these transactions from these select analyses.
Cash Portion of Benefit Spending Patterns
The cash portion analyses are almost identical to the ones we described above for the noncash portion. The methodology to calculate the average number of transactions, the average benefit redemption amount, and the average total monthly redemption was similar. The only difference is that there are several types of cash portion transactions because participants can redeem the cash benefits in different ways. Participants can purchase food with their EBT cards at a certified retailer; request cash back with a cash purchase; withdraw their cash from a certified retailer; or withdraw their cash from an ATM. The cash back from certified retailers with purchase represented less than 0.01 percent of transactions, so we combined it with the cash withdrawal at a certified retailer. Cash withdrawals at many ATMs incur fees. We did not include these fees in the count of the number of transactions or the average transaction amounts. We did include them in the proportion of benefits spent and the unspent issuance at the end of the month.
In addition to the analyses of the number of cash transactions, average cash transaction amount, percentage of the cash portion of the benefit spent, and the value of unspent cash issuance, we estimated a lower bound on the percentage of the total NAP benefit (noncash and cash portions) spent on food. Participants must redeem the entire noncash portion of the benefit for food at certified retailers. Although the cash portion of the benefit is to be spent only on eligible food items, the data can tell us only the amount of cash spent on food through an EBT “cash purchase.” This means the participant paid for food electronically using the cash component of the benefit rather than physically handing over cash. However, the data do not tell us anything about whether units that receive cash as a withdrawal from an ATM or a retailer spend the cash on food. To obtain a lower bound on the percentage of the total NAP benefit spent on food, we summed the total monthly amount redeemed for food using the noncash portion transactions and the “cash purchases” from the cash portion and divided by the total monthly benefit (cash plus noncash portions). We present the distribution of this percentage across all unit-months.

Examination of Cash Nutrition Assistance Program Benefits in Puerto Rico
Page A-14
A.2. NAP CASH BENEFITS HOUSEHOLD SURVEY METHODOLOGY
This appendix provides an overview of the statistical methodology used to conduct the Puerto Rico NAP cash benefits household survey. Sections 1 through 3 describe the target population, the sampling frame, and the overall sample design. Section 4 provides an overview of the survey instrument and Section 5 presents the data collection methods, results and response rates. Sections 6 and 7 describe the weighting procedures and the levels of sampling errors respectively.
The NAP cash benefit household survey was designed to assess NAP participants’ access to certified retailers, identify items purchased with the cash portion of their benefits, and explore potential impacts of discontinuing the cash portion of the benefit for individuals residing in urban versus rural locations and for key subgroups. The survey was conducted using CATI between October and December 2014; participants received a $10 gift card for participating in the study. The goal of the sample design was to permit accurate estimates regarding the overall access and cash use of NAP units in urban areas as compared with NAP units in rural areas.
1. Target Population
The target population for this survey included all NAP units actively receiving NAP benefits as of June 2014.
2. Sampling Frame
The sampling frame for the NAP cash benefit household survey was based on a list of NAP units provided by ADSEF, which is the agency that administers NAP in Puerto Rico. ADSEF extracted a list of current NAP units 1 month prior to sampling (e.g., in July of 2014). The unit of analysis for the survey was a NAP unit as opposed to a NAP participant to eliminate duplicate responses for the same unit.
The sampling frame was restricted to NAP units actively receiving benefits in June 2014 to minimize recall bias during the survey. During the administration of the survey, responses were requested from the individual in the NAP household who performed the majority of the food shopping in order to elicit the most accurate information regarding redemption of NAP benefits.
To make comparisons between NAP units located in urban and rural areas of Puerto Rico, an indicator was added to the initial list of NAP units to identify where the unit members lived. Urban and rural status was based on the ERS RRUC for metropolitan (metro) and nonmetropolitan (nonmetro) Puerto Rico counties (municipalities) for 2013.67 The codes are based on 2010 census data and form a classification scheme that distinguishes metro counties by the population size of their metro areas and nonmetro counties by the degree of urbanization (population size) and adjacency to a metro area. There are nine codes: three for metro counties and six for nonmetro counties. The urban and rural status was mapped to the list of NAP units using the county (called municipality in Puerto Rico) provided for each unit using the RRUCs.
The final sampling frame consisted of 650,151 records, including 619,451 units residing in urban areas and 30,700 units residing in rural areas (see table A.2.a).
67 See USDA, 2013b.

Examination of Cash Nutrition Assistance Program Benefits in Puerto Rico
Page A-15
3. Sample Design
The sampling procedures were designed so study findings could be used to make statistically defensible inferences about the entire population of NAP units. Goals of the sample design included (1) the ability to produce accurate estimates of the true NAP unit population and (2) the ability to make comparisons between various subgroups: urban and rural, zero and non-zero income, units with nonelderly members with disabilities, units with elderly members, and units composed of single mothers with children. The sample design was a stratified random sample of 3,600 NAP units throughout Puerto Rico. This sample size was selected to measure the overall access to retailers with—at most—a 3.6-percentage-point error rate and a 95-percent confidence level. As such, estimates of percentages for the entire sample (such as the percentage of NAP households who use their cash benefits for nonfood items) will have 95-percent, two-tailed confidence intervals with error rates between 1.2 and 3.6 percentage points.
Stratification and sample allocation. Prior to sample selection, Insight stratified the data based on urban and rural location. Substrata were created within each of the strata based on (1) household income (e.g., no income versus positive income) and (2) household composition68 (i.e., units with elderly members, units with nonelderly members with disabilities, or units composed of single mothers with children at the time of sampling). Sixteen substrata resulted, and Chromy’s (1979) sampling procedure was used to allocate the sample cases at the same rate as they occurred proportionally within the substratum. Utilizing this procedure allowed for both proportional sample allocation and randomized rounding of the sample sizes.
Sample selection. To select a random sample of NAP units within each substrata, we first assigned each record a random number from uniform (0, 1) distribution and sorted each record within substrata by the random number, thereby ordering each unit randomly. A nonzero random seed for each substrata was selected at random, and NAP units following this seed were chosen for the sample according to the sampling allocations obtained using Chromy’s (1979) procedure. This method was chosen such that additional sample could be selected if necessary. In this way, each unit in the sampling frame was given a known nonzero probability of selection so weighted inferences could be made about the entire population of NAP units.
Sample size. We aimed to complete interviews with NAP participants in 750 NAP units, including 325 rural units and 325 urban units. To achieve this goal, a sample size of 3,600 cases was necessary. Thus, the sample size was selected to measure estimates of percentages for the entire sample (such as the percentage of NAP units who use their cash benefits for nonfood items) with–at most–a 3.6 percentage-point error rate and a 95-percent confidence level. The rural (and urban) estimates were selected to have at most a 5.1-percentage-point error rate and a 95-percent confidence level. Note that, although not designed for this purpose, the survey also would be used to compute estimates for various subgroups; these standard errors depend on the sample size resulting from the representation in the population.
The 3,600 sampled records were released for data collection in four waves; 3 waves of 1,000 units and 1 wave of 600 units. Of these records, 1,800 were from urban areas and 1,800 were from rural areas. Table A.2.a shows the detailed distribution of the sampling frame and released sample by substrata. 68 Household composition substrata were designed to be mutually exclusive and were coded using a hierarchical scheme so only one unit would be included in each group: (1) any units with nonelderly members with disabilities were selected first, (2) any units with children and single mothers (and not included in the first group) were selected second, (3) units with elderly members (and not included in the previous two groups) were selected third, and (4) all remaining units were selected fourth.

Examination of Cash Nutrition Assistance Program Benefits in Puerto Rico
Page A-16
Table A.2.a. Sampling Frame Count Versus Sample Sizes by Substrata
Substrata Total Population Total Sample Size Urban Rural
619,451 30,700
1,800 1,800
Zero income Non-zero income
425,034 225,117
2,308 1,292
Nonelderly members with disabilities Elderly members Single mothers Other
109,110 211,319 106,367 223,355
606 1,156 554
1,284 Total 650,151 3,600
4. Survey Instrument
The survey instrument was divided into eight main sections. Section one included descriptive questions about respondents’ decisions on where to shop for food (using their noncash and cash benefits), while sections two and three asked about respondents’ access to NAP retailers, including how frequently they shop for food, how they get to stores, and how easy or difficult it is to get there. The fourth section asked questions specific to experiences accessing the cash portion of their NAP benefits. In section five, respondents were asked about items purchased with the cash portion of their NAP benefits. Sections six and seven included questions regarding the potential impact of discontinuing the cash portion of NAP benefits and awareness of regulations. The last section asked descriptive questions about the respondent.
Pretest. Insight conducted pretesting of the survey instrument during a site visit to Puerto Rico in June 2014. Insight obtained the assistance of Bill’s Kitchen, a local CBO in San Juan, to identify and schedule testing sessions with NAP participants at the CBO office. Pretest participants completed the survey in person with the interviewer, and following survey completion, were given an opportunity to ask questions about or comment on the instrument and questions. Following feedback from the pretest, survey questions were updated to provide more clarity on the intent of specific questions, and to alter language to make some questions easier to understand.
5. Data Collection Methods and Results
The survey was conducted by local survey research firm Ipsos in Puerto Rico using CATI technology to maximize efficiency and consistency among interviews. Upon Insight’s finalization and translation of the survey instrument, Ipsos programmed the survey document into a CATI instrument and conducted several rounds of testing to ensure accuracy in conduct and flow patterns. All survey interviewers received a daylong training that included instructions on asking the survey questions, how to respond to questions and concerns about the survey and the research project as a whole, and strategies to maximize response rates and decrease the likelihood of refusal.
Advance letter mailing. Approximately 2 weeks prior to survey commencement, presurvey notification letters and a fact sheet about the study were sent via mail to the first wave of sampled respondents.69 69 The second, third, and fourth waves of respondent samples did not receive the introductory letter and fact sheet via mail due to the brief data collection period.

Examination of Cash Nutrition Assistance Program Benefits in Puerto Rico
Page A-17
These advance materials contained a brief description of the study and telephone survey, the Office of Management and Budget (OMB) clearance information, and an assurance that participation in the survey was voluntary and would not affect their NAP benefit in any way. The materials also informed recipients that those who completed the telephone survey would receive a $10 gift card. Finally, the advance materials provided the telephone number of the study’s project director and a separate phone number that sampled respondents could call 24 hours a day to leave a message with any questions or comments regarding the advance materials or participation in the study.
The survey was conducted between October 22 and December 9, 2014, within 3 months following sample selection. All surveys were conducted in Spanish by Ipsos interviewers who are local to Puerto Rico and speak with a familiar dialect.70
CATI data collection and results. The survey employed a dialing protocol that consisted of up to seven call attempts per sample case; the calls were made on different days and at different times of day to maximize likelihood of response. The CATI system also allowed interviewers the option to schedule an appointment for a particular date and time more convenient to the respondent, further increasing the likelihood of response. If a participant could not be reached after seven attempts, the interviewer moved on to an alternate number, if provided.
When a NAP participant was contacted successfully, the interviewer introduced himself or herself, explained the purpose of the study, and offered the participant a $10 gift card to be mailed to the participant’s home following survey completion. The interviewer also explained the study’s privacy policy and obtained verbal consent for participation. The interviewer then asked a series of screener questions to confirm the respondent was a NAP recipient and conducted the food shopping for the unit.
Following completion of all survey questions, the interviewer asked the respondent to provide the most current and accurate mailing address to ensure delivery of the gift card. We provided a telephone number for respondents to contact study managers with any additional questions or concerns regarding the survey or the gift card.
Of the 3,600 sampled NAP units, 750 completed the survey. Table A.2.b shows the detailed distribution of the final sample and completed surveys by substrata.
70 Multiple studies have found use of local interviewers increases participant trust and minimizes miscommunication during telephone survey conduct.

Examination of Cash Nutrition Assistance Program Benefits in Puerto Rico
Page A-18
Table A.2.b. Sample Size Versus Final Respondents by Substrata
Substrata Total Sample Size Number of Respondents Urban Rural
1,800 1,800
378 372
Zero income Non-zero income
2,308 1,292
471 279
Nonelderly members with disabilities Elderly members Single mothers Other
606 1,156 554
1,284
139 254 121 236
Total 3,600 750
Response rates. The response rate measures the percent of individuals who completed the survey as a function of all who are eligible to complete the survey, including those who were contacted and refused to participate and those who could not be contacted. Noncontact includes those for whom telephone numbers were nonworking, never answered, or answered only by a telephone-answering device. The response rate was calculated using the formula below:71
I=complete interview
R=refusal and breakoff (e.g., eligible nonrespondents)
NC=noncontact (e.g., not located, eligibility not determined)
O=other (e.g., located, eligibility not determined)
The cooperation rate measures the percent of individuals who completed the survey as a function of all who were contacted, including those who refused. This was calculated as shown below.
I=complete interview
R=refusal and breakoff (e.g., eligible nonrespondents)
Table A.2.c summarizes the data collection results, and table A.2.d. presents the response and cooperation rates. Overall, 26 units were found to be ineligible; 324 were either unavailable or refused to participate; and for 2,500 individuals, we were unable to determine eligibility, either because they were not located or they disconnected from the call during the introduction. The overall response rate
71 The procedure for response rate calculation is based on the standard guidelines established by the Council of American Survey Research Organizations and specified by the American Association for Public Opinion Research.

Examination of Cash Nutrition Assistance Program Benefits in Puerto Rico
Page A-19
was 21.0 percent. This response rate includes all eligible cases in the population, regardless of the quality of contact information, such as telephone number. The cooperation rate was 69.8 percent.
Table A.2.c. Summary of Data Collection Results by Final Status
Final Status Number a. Eligible respondents (I) 750 b. Eligible nonrespondents (R) 324 c. Ineligible nonrespondents (IE) 26 d. Located/eligibility not determined (O) 527 e. Not located/eligibility not determined (NC) 1,973 f. Total number of sampled SNAP applicants 3,600
Table A.2.d. Response and Cooperation Rates
Result Percent Response Rate: (a / (a + b + d + e)) * 100 21.0% Cooperation Rate: (a / (a + b)) * 100 69.8%
6. Estimation
Several sources of error could cause sample estimates to differ from the corresponding true population values. These sources of error are commonly classified into two major categories: sampling errors and nonsampling errors. To compensate for sampling error, weights were constructed and prepared following data collection based on adjusting the initial probability of selection to (1) compensate for records with unknown eligibility and (2) compensate for eligible nonrespondents. The end products were final analysis weights suitable for use in analysis. This weighting scheme inflates the respondents' data to represent the entire universe of eligible NAP units across Puerto Rico.
Base weights. Two sampling weights were created, one for each of the two primary strata: urban and rural. The sampling base weight for the sampled provider from stratum is calculated as the inverse of the probability of selection or:
( )
( )sa m p
N h(h i) = B W
n h
where N(h) is the total number of units within stratum h and n(h) is the total number of units sampled within stratum h.
Nonresponse adjustment factors. Next, we calculated nonresponse adjustment factors to adjust for the various levels of nonresponse occurring during the survey interview. Complete response for a recipient means that we (1) determined whether the recipient was eligible for the interview and (2) obtained interview data from eligible recipients. The nonresponse adjustment factors were computed within each strata.
Screening nonresponse adjustment factor. The first step in data collection for this survey was to identify whether the household was eligible for interview. For the adjustment, response was considered

Examination of Cash Nutrition Assistance Program Benefits in Puerto Rico
Page A-20
to have been obtained for the household when it was determined that the household was either eligible or ineligible. The eligibility factor adjusts the sampling base weights to account for data loss from household from whom we could not determine eligibility. The first nonresponse adjusted weight is then calculated as the product of the initial sampling base weight and the nonresponse adjustment factor as follows:
Questionnaire completion nonresponse adjustment factor. The second step in data collection was to adjust for nonresponse to the questionnaire. A household was considered to be a respondent when the eligible household completed the full questionnaire. Nonresponse at this stage means the selected household did not complete the full questionnaire. The nonresponse adjustment adjusts the sampling base weights to account for data loss from households from whom we could not obtain interview data. The final analysis weight is then calculated as the product of the first nonresponse adjusted weight and the questionnaire completion nonresponse adjustment factor as follows:
7. Standard Errors
Some sources of error—such as unusable responses to vague or sensitive questions; no responses from some providers; and errors in coding, scoring, and processing the data—are called “nonsampling errors;” these also occur in cases where there is a complete enumeration of a target population. Nonresponse to the survey is one of the largest sources of nonsampling error because a characteristic being estimated may differ, on average, between respondents and nonrespondents. If nonsampling errors are random, in the sense that they are independent and tend to compensate from one respondent to another, then they do not cause bias in estimates of simple statistics such as totals, percents, or averages. Furthermore, the contribution from such nonsampling errors will automatically be included in the sampling errors that are estimated from the sample data. However, correlations or relationships in cross-tabulations are often decreased by such errors, sometimes substantially. Thus, random errors (that tend to be compensated for) in estimates of simple aggregates or averages may introduce systematic errors or biases in measures of relationships or cross-tabulations.
Nonsampling errors that are systematic (rather than random and compensating) are a source of bias for sample estimates. Such errors are not reduced by increasing the size of the sample, and the sample data do not provide an assessment of the magnitude of these errors. Systematic errors were reduced in this study by tactics such as careful wording of questionnaire items, strong respondent motivation due to the saliency of the topic for affected households, and well-designed data-collection and data-management procedures. However, such errors sometimes occur in subtle ways and are less subject to design control than is the case for sampling errors.
Data management and simple summaries were conducted using SAS statistical software. Various descriptive statistical techniques were used to analyze the data. Table A.2.e presents the size of the 95-percent confidence interval half-width to represent sampling error for various situations. For example, a 95-percent confidence interval width of ±4 percent means that in 95 out of 100 samples like the one used here, the results should be no more than 4 percentage points greater or less than the figure that would be obtained by surveying all NAP units in Puerto Rico. Because of refusal to participate and other
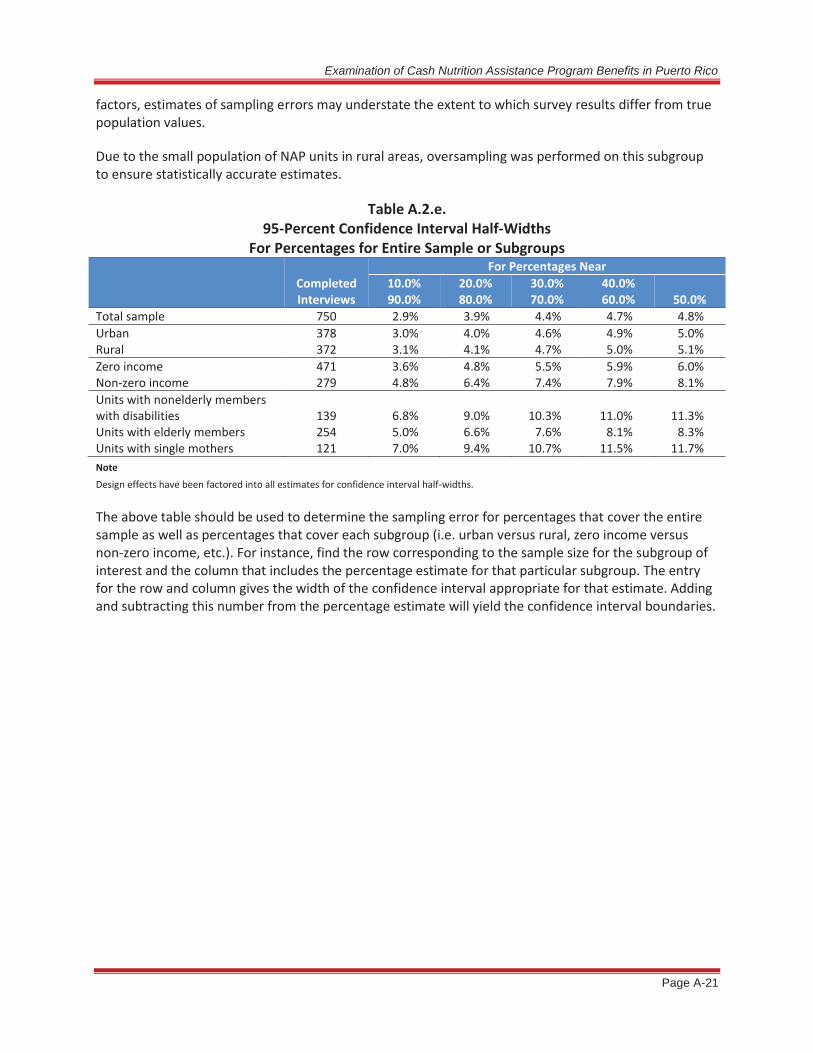
Examination of Cash Nutrition Assistance Program Benefits in Puerto Rico
Page A-21
factors, estimates of sampling errors may understate the extent to which survey results differ from true population values.
Due to the small population of NAP units in rural areas, oversampling was performed on this subgroup to ensure statistically accurate estimates.
Table A.2.e. 95-Percent Confidence Interval Half-Widths
For Percentages for Entire Sample or Subgroups
Completed Interviews
For Percentages Near 10.0% 90.0%
20.0% 80.0%
30.0% 70.0%
40.0% 60.0% 50.0%
Total sample 750 2.9% 3.9% 4.4% 4.7% 4.8% Urban 378 3.0% 4.0% 4.6% 4.9% 5.0% Rural 372 3.1% 4.1% 4.7% 5.0% 5.1% Zero income 471 3.6% 4.8% 5.5% 5.9% 6.0% Non-zero income 279 4.8% 6.4% 7.4% 7.9% 8.1% Units with nonelderly members with disabilities 139 6.8% 9.0% 10.3% 11.0% 11.3% Units with elderly members 254 5.0% 6.6% 7.6% 8.1% 8.3% Units with single mothers 121 7.0% 9.4% 10.7% 11.5% 11.7% Note Design effects have been factored into all estimates for confidence interval half-widths. The above table should be used to determine the sampling error for percentages that cover the entire sample as well as percentages that cover each subgroup (i.e. urban versus rural, zero income versus non-zero income, etc.). For instance, find the row corresponding to the sample size for the subgroup of interest and the column that includes the percentage estimate for that particular subgroup. The entry for the row and column gives the width of the confidence interval appropriate for that estimate. Adding and subtracting this number from the percentage estimate will yield the confidence interval boundaries.

Examination of Cash Nutrition Assistance Program Benefits in Puerto Rico
Page A-22
A.3. STAKEHOLDER ANALYSIS METHODOLOGY
1. Stakeholder Groups
Obtaining descriptive input from the various stakeholders of the cash portion of the NAP benefit is crucial to assess the impact and potential effects of discontinuing the cash portion. Insight collected information for the stakeholder analysis through (1) focus groups with NAP participants, (2) semistructured in-person interviews with NAP certified and uncertified retailers, and (3) semistructured in-person interviews with directors of CBOs and group residential facilities.
To ensure a representation of stakeholders from all areas of Puerto Rico, we divided Puerto Rico into five study regions and recruited stakeholders from all five regions. These regions also allow for representation of retailers and participants in both urban and rural areas. Figure A.3.a illustrates the 5 geographic regions for the study; we created the map using ADSEF’s 10 regions as a basis.
Figure A.3.a. Study Regions
We describe each of the stakeholder groups and the data collection mode used for each below.
NAP participant focus groups. The bulk of the data for the stakeholder analyses were collected through focus groups with NAP participants. We conducted 18 focus groups across Puerto Rico with 9 to 11 NAP participants in each group. From the 2010 feasibility study that Insight conducted (Peterson et al., 2010) and discussions with NAP administrators, Insight identified key subgroups that comprise a large and vulnerable proportion of the NAP population. We ensured our focus groups included representatives from each of these subgroups. Below, we list the subgroups and the number of focus groups that included a majority of each population:72
Individuals living in rural areas (4 groups)
72 When a group had a majority of participants who identified with a particular subgroup, the focus group was given that designation. The subgroups are not mutually exclusive (i.e., one group could have both a majority of participants who were older than age 60 and a majority of participants who lived in a rural area). There also were five focus groups comprised of general NAP participants with no subgroup categorization.

Examination of Cash Nutrition Assistance Program Benefits in Puerto Rico
Page A-23
Individuals with zero income (8 groups)
Elderly individuals aged 60 or older (2 groups)
Individuals with a disability or chronic health condition (4 groups)
Single mothers with children (4 groups)
Individuals who are homeless (2 groups)
Unemployed individuals (18 groups)73
Overall, there were 176 NAP participants who participated in the focus groups. Table A.3.a provides a profile of the demographic characteristics of all focus group members.
Table A.3.a. Focus Group Member Demographic Characteristics
Demographic Characteristic Number of
Participantsa Percent Age
18–35 47 27% 36–59 89 51% 60+ 39 22%
Gender Male 45 26% Female 128 73%
Number of people in NAP household 1 81 47% 2–3 58 34% 4+ 33 19%
Number of people in residence (including participant) 1 73 43% 2–3 58 34% 4+ 38 22%
Worked for pay in the past 12 months 12 7% Single mother caring for a child aged 18 or younger 65 38% Grandparent caring for a child aged 18 or younger 29 17% Living without a permanent place to stay 27 16% Living with a disability or chronic health condition 58 33% Have any additional source of income 94 53% Consider the area they live in to be rural 48 28% Total focus group participants 176 100% Note a A total of 176 participants completed the demographic questionnaire, but not all participants answered every question.
Retailer interviews. The purpose of including retailers in the stakeholder analysis is to (1) examine barriers and facilitators to NAP certification and (2) assess the perceived impacts of discontinuing the cash portion of the NAP benefit on retailers. We hypothesized that NAP certified and uncertified retailers would have varying perceptions of the NAP certification process and the role of the cash portion of the benefit, so we interviewed them separately to allow for comparisons. We also anticipated differences among urban, suburban, and rural retailers and among various types of retailers (large
73 We did not target unemployed participants, but a majority of participants in all 18 groups identified as unemployed.
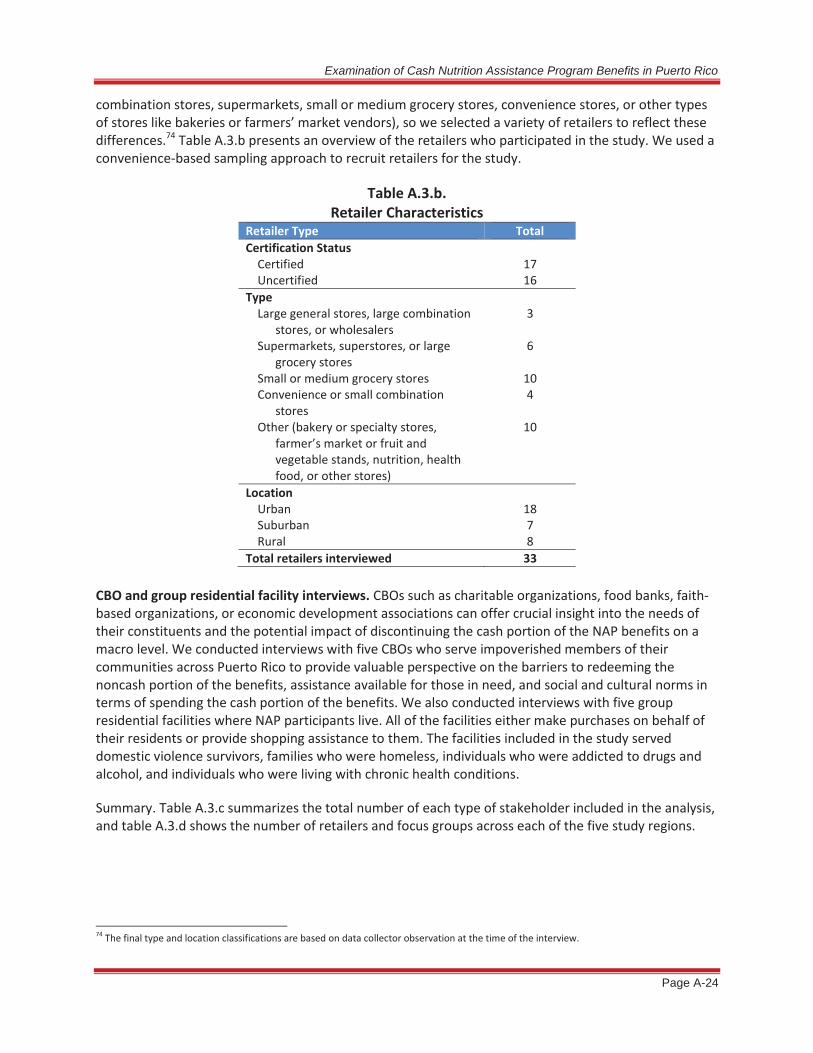
Examination of Cash Nutrition Assistance Program Benefits in Puerto Rico
Page A-24
combination stores, supermarkets, small or medium grocery stores, convenience stores, or other types of stores like bakeries or farmers’ market vendors), so we selected a variety of retailers to reflect these differences.74 Table A.3.b presents an overview of the retailers who participated in the study. We used a convenience-based sampling approach to recruit retailers for the study.
Table A.3.b. Retailer Characteristics
Retailer Type Total Certification Status
Certified 17 Uncertified 16
Type Large general stores, large combination
stores, or wholesalers 3
Supermarkets, superstores, or large grocery stores
6
Small or medium grocery stores 10 Convenience or small combination
stores 4
Other (bakery or specialty stores, farmer’s market or fruit and vegetable stands, nutrition, health food, or other stores)
10
Location Urban 18 Suburban 7 Rural 8
Total retailers interviewed 33
CBO and group residential facility interviews. CBOs such as charitable organizations, food banks, faith-based organizations, or economic development associations can offer crucial insight into the needs of their constituents and the potential impact of discontinuing the cash portion of the NAP benefits on a macro level. We conducted interviews with five CBOs who serve impoverished members of their communities across Puerto Rico to provide valuable perspective on the barriers to redeeming the noncash portion of the benefits, assistance available for those in need, and social and cultural norms in terms of spending the cash portion of the benefits. We also conducted interviews with five group residential facilities where NAP participants live. All of the facilities either make purchases on behalf of their residents or provide shopping assistance to them. The facilities included in the study served domestic violence survivors, families who were homeless, individuals who were addicted to drugs and alcohol, and individuals who were living with chronic health conditions.
Summary. Table A.3.c summarizes the total number of each type of stakeholder included in the analysis, and table A.3.d shows the number of retailers and focus groups across each of the five study regions.
74 The final type and location classifications are based on data collector observation at the time of the interview.

Examination of Cash Nutrition Assistance Program Benefits in Puerto Rico
Page A-25
Table A.3.c. Stakeholder Data Collected
Type Total NAP participant focus groups 18 groups (176 members) Retailers 33 CBOs 5 Group residential facilities 5
Table A.3.d.
Number of Retailers and NAP Participant Focus Groups by Study Region Region 1 Region 2 Region 3 Region 4 Region 5 Total Number of focus groups 4 4 3 3 4 18 Number of retailers 4 7 10 5 7 33
2. Instrument Development
Using the research questions as a guide, Insight developed separate instruments for each of the four stakeholder groups to facilitate the stakeholder data collection. Each of the instruments is described briefly below:
NAP participant focus group guide. One detailed focus group guide was used for all focus groups to ensure the opportunity to compare among and between groups. The open-ended protocol included 22 questions and covered the following topics: awareness of NAP and cash/noncash portions of benefits, purchasing practices, access, use of benefits, awareness of regulations, and effects of discontinuing the cash portion of benefits. There were two other protocols used for the focus groups, as described below.
NAP participant focus group screeners. These closed-ended questionnaires were designed to ensure only eligible participants were recruited to the focus groups. Questions assessed whether potential members received NAP benefits within the last 6 months, did some or most of the food shopping for their households, were aged 18 or older, or belonged to any of the subgroups (e.g., single mothers, seniors, homeless, unemployed, living with a disability or chronic health condition).
Focus group member demographic questionnaire. This closed-ended questionnaire was designed to collect demographic information from focus group members (e.g., age, gender, number of people in NAP household, etc.).
Retailer interview protocols. Two protocols were developed and used: one for certified and one for uncertified retailers. The NAP certified retailer questionnaire included open-ended questions covering the following topics: background on the store; the NAP certification process and requirements; facilitators, barriers, advantages, and disadvantages to becoming NAP certified; effects of discontinuing the cash portion of benefits; and customers’ use of the NAP cash and noncash portions of the benefit. The uncertified retailer questionnaire covered the same topics as the certified questionnaire did, except the NAP certification process and requirements section was not included and we did not ask uncertified retailers about EBT redemption processes. There was an additional tool used for the retailer interviews, as described below.
Retailer observational checklist. This worksheet is used in the field by data collectors to capture specific characteristics about each certified retailer. The checklist included closed-

Examination of Cash Nutrition Assistance Program Benefits in Puerto Rico
Page A-26
ended questions about store type; location; features (e.g., NAP certification sign visible, store near public transportation, accessibility); number of checkout lanes/areas; and whether the store sold perishable, nonperishable, and/or prepared foods.
CBO interview protocol. This open-ended questionnaire covered the background of the organization, barriers to clients’ redemption of their NAP benefits, clients’ purchasing practices, effects of discontinuing the cash portion of benefits, and clients’ other sources of income and assistance.
Group residential facility interview protocol. This open-ended questionnaire covered the background of the facility, how the facility redeemed NAP benefits for its residents, the facility’s purchasing practices, residents’ purchasing practices, effects of discontinuing the cash portion of benefits, and residents’ other sources of income and assistance.
The stakeholder protocols were developed in English and reviewed by several members of the research team, including a qualitative research expert. Once the English documents were finalized, they were translated into Spanish by two research team members local to Puerto Rico to ensure the dialect was appropriate and colloquial. Intertranslator consensus was obtained between the two translators of each document.
Pretesting
Members of the research team pretested the draft focus group screeners and protocols as well as the retailer interview guides during a June 2014 site visit to Puerto Rico. The purpose of the stakeholder pretest was to assess how long the discussions would take, how well the questionnaire was structured and organized, how easily the questions were understood by participants, and whether the questions were culturally appropriate. In partnership with a CBO in Puerto Rico, the focus group instruments were pretested with a group of five participants. The retailer instruments for both NAP certified and uncertified stores were tested with three retailers in San Juan. The results of the pretest led the research team to adjust the protocols concerning whether to reorder the questions to improve clarity. The protocols were then submitted and cleared by OMB.
3. Recruitment
Staff and caseworkers at the five CBOs recruited NAP participants for focus group members. We used CBOs for recruitment because we found NAP participants are more likely to participate in a group discussion if recruited by someone they already know. In September, Insight staff visited each of the five CBOs to train their staff on how to recruit focus group participants for the study. We also provided each CBO with a comprehensive Spanish training manual. In October 2014, once we obtained OMB clearance, we mailed a full set of recruiting materials to the CBOs. We assembled packets to facilitate recruitment for the focus groups; these packets included screeners, Frequently Asked Questions flyers for recruiting, reminder flyers, and recruitment tracking sheets. Instructions were included to remind the CBO recruiters about the purpose of each document. Using the screeners described above, the CBOs recruited individuals who met the eligibility criteria and were members of the various subgroups. Once members were recruited, screened, and selected, CBO staff reminded members of the scheduled focus groups and token of appreciation to increase participation. We compensated the CBOs $50 per focus group for their efforts recruiting NAP participants. Each CBO recruited between one and nine focus groups depending on the geographic reach of their clients, the subgroups they served, and its capacity to assist with this task.

Examination of Cash Nutrition Assistance Program Benefits in Puerto Rico
Page A-27
We recruited retailers using a variety of approaches. Overall, our recruitment goal was a mix of NAP certified and uncertified retailers with representation from all five geographic study regions; urban and rural locations; and small, medium, and large stores. For certified retailers, we obtained a list from ADSEF that included the store name, type, location, and contact information for each retailer. Insight selected NAP certified retailers from this group to reflect a mix of store types and locations as described in Section A. Two consultants in Puerto Rico made outreach phone calls and visits to NAP certified retailers in early October 2014 to schedule interviews for later that month. For uncertified retailers, there is no list or database to facilitate advanced outreach. Therefore, while in the field conducting site visits, Insight staff and consultants identified and reached out to uncertified retailers in person to schedule interviews. Using a snowball sampling approach, staff also asked certified retailers to identify uncertified retailers in their area. Insight’s researchers provided all retailers with a Frequently Asked Questions flyer to inform them about the study. As the dates of their interviews approached, we also sent a reminder letter to retailers.
The study team recruited CBOs and group residential facilities through contacts established during the SNAP feasibility study conducted by Insight in 2010, and through our two local consultants who work with social service organizations around Puerto Rico. We sent each CBO and group residential facility a formal invitation to participate in the study via email and made follow-up calls to confirm and schedule interviews. In advance of the interviews, during the June 2014 site visit, Insight staff made in-person visits to several of the participating CBOs to discuss the study and answer any questions they had about participating.
4. Data Collection Methods
We conducted the stakeholder data collection activities over the course of several site visits in summer and fall 2014 as outlined in table A.3.e.
Table A.3.e. Site Visit Activities
Site Visit Date Activities 1 June 2014 Meeting with ADSEF and MARO
Focus group, survey, and retailer instrument pretesting CBO recruitment
2 September 2014 CBO and group residential facility interviews CBO recruitment training Retailer recruitment
3 October–November 2014 Retailer interviews NAP participant focus groups
NAP participant focus groups were held on site at the CBOs that facilitated NAP participant recruitment. We selected these locations specifically as places that were accessible and familiar to participants in order to increase participation. Professional Spanish-speaking moderators from local research firm Ipsos moderated the focus groups. Insight staff provided detailed training for the moderators on the protocols, expectations, and potential challenges and mitigation strategies. Each focus group member signed a consent form; each discussion was recorded, transcribed verbatim in Spanish, and then translated into English. Focus group members were compensated $50 for their time; in each focus group, we gave an additional $10 gift card to one randomly selected member who arrived at least 15 minutes before the focus group session was scheduled to begin.
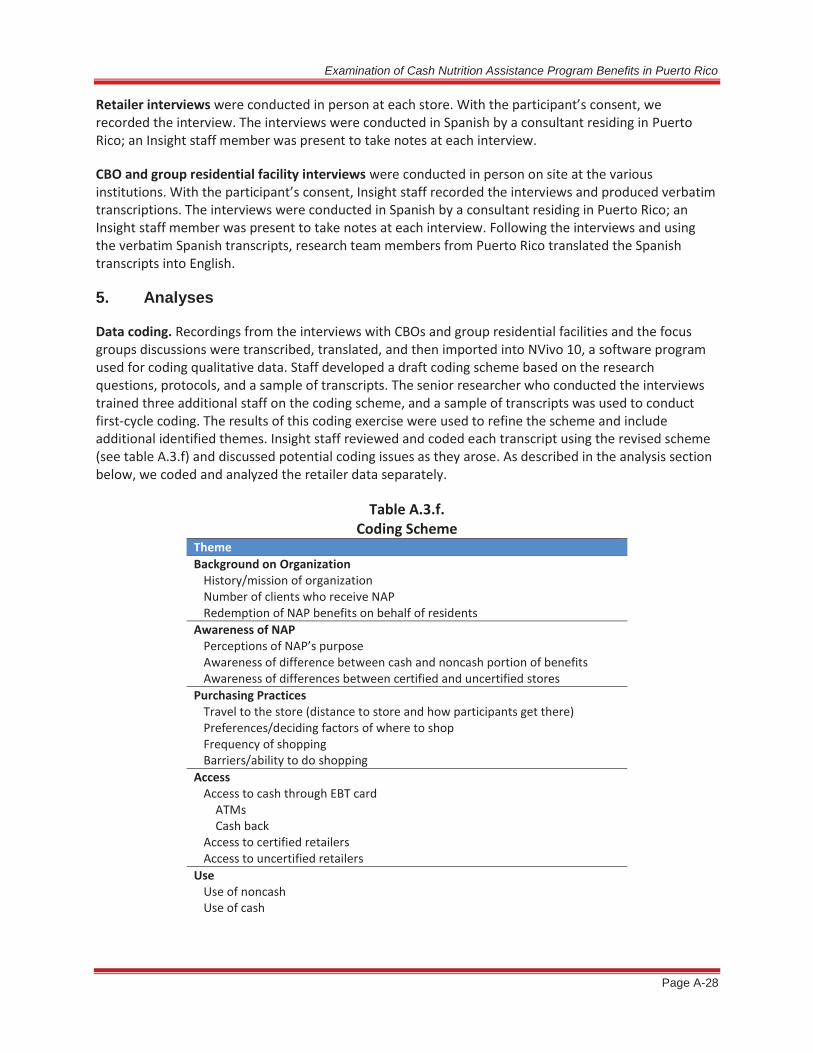
Examination of Cash Nutrition Assistance Program Benefits in Puerto Rico
Page A-28
Retailer interviews were conducted in person at each store. With the participant’s consent, we recorded the interview. The interviews were conducted in Spanish by a consultant residing in Puerto Rico; an Insight staff member was present to take notes at each interview.
CBO and group residential facility interviews were conducted in person on site at the various institutions. With the participant’s consent, Insight staff recorded the interviews and produced verbatim transcriptions. The interviews were conducted in Spanish by a consultant residing in Puerto Rico; an Insight staff member was present to take notes at each interview. Following the interviews and using the verbatim Spanish transcripts, research team members from Puerto Rico translated the Spanish transcripts into English.
5. Analyses
Data coding. Recordings from the interviews with CBOs and group residential facilities and the focus groups discussions were transcribed, translated, and then imported into NVivo 10, a software program used for coding qualitative data. Staff developed a draft coding scheme based on the research questions, protocols, and a sample of transcripts. The senior researcher who conducted the interviews trained three additional staff on the coding scheme, and a sample of transcripts was used to conduct first-cycle coding. The results of this coding exercise were used to refine the scheme and include additional identified themes. Insight staff reviewed and coded each transcript using the revised scheme (see table A.3.f) and discussed potential coding issues as they arose. As described in the analysis section below, we coded and analyzed the retailer data separately.
Table A.3.f. Coding Scheme
Theme Background on Organization
History/mission of organization Number of clients who receive NAP Redemption of NAP benefits on behalf of residents
Awareness of NAP Perceptions of NAP’s purpose Awareness of difference between cash and noncash portion of benefits Awareness of differences between certified and uncertified stores
Purchasing Practices Travel to the store (distance to store and how participants get there) Preferences/deciding factors of where to shop Frequency of shopping Barriers/ability to do shopping
Access Access to cash through EBT card
ATMs Cash back
Access to certified retailers Access to uncertified retailers
Use Use of noncash Use of cash
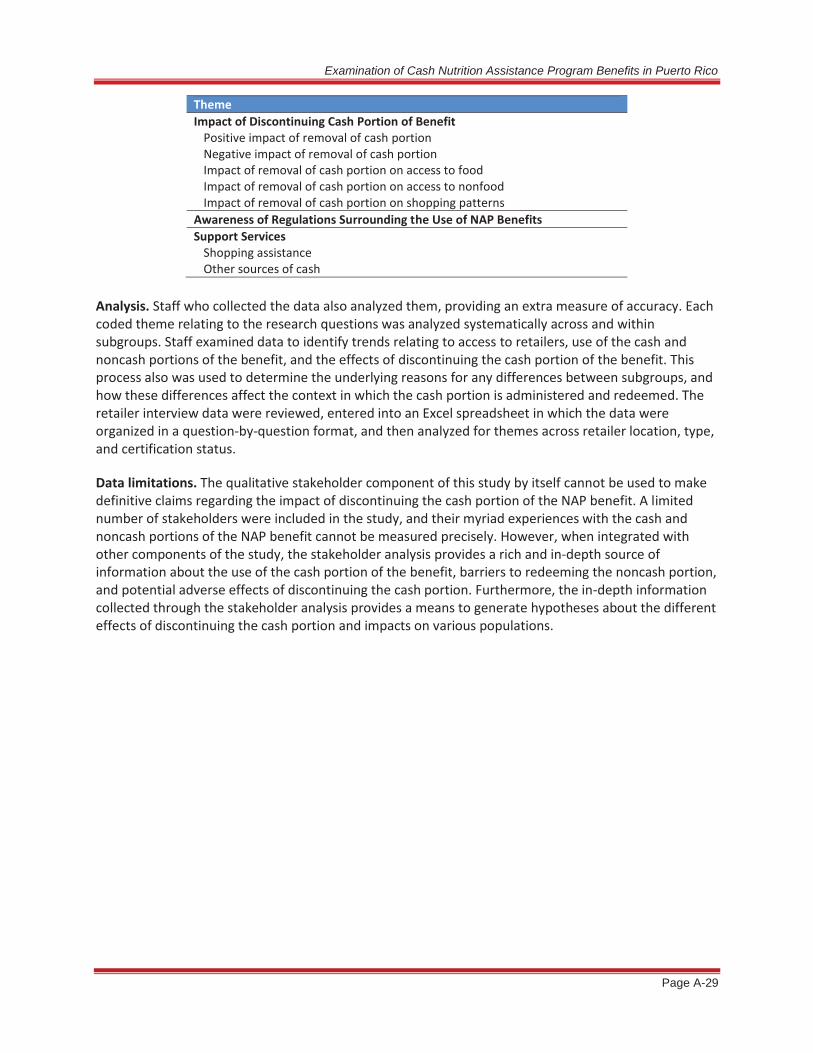
Examination of Cash Nutrition Assistance Program Benefits in Puerto Rico
Page A-29
Theme Impact of Discontinuing Cash Portion of Benefit
Positive impact of removal of cash portion Negative impact of removal of cash portion Impact of removal of cash portion on access to food Impact of removal of cash portion on access to nonfood Impact of removal of cash portion on shopping patterns
Awareness of Regulations Surrounding the Use of NAP Benefits Support Services
Shopping assistance Other sources of cash
Analysis. Staff who collected the data also analyzed them, providing an extra measure of accuracy. Each coded theme relating to the research questions was analyzed systematically across and within subgroups. Staff examined data to identify trends relating to access to retailers, use of the cash and noncash portions of the benefit, and the effects of discontinuing the cash portion of the benefit. This process also was used to determine the underlying reasons for any differences between subgroups, and how these differences affect the context in which the cash portion is administered and redeemed. The retailer interview data were reviewed, entered into an Excel spreadsheet in which the data were organized in a question-by-question format, and then analyzed for themes across retailer location, type, and certification status.
Data limitations. The qualitative stakeholder component of this study by itself cannot be used to make definitive claims regarding the impact of discontinuing the cash portion of the NAP benefit. A limited number of stakeholders were included in the study, and their myriad experiences with the cash and noncash portions of the NAP benefit cannot be measured precisely. However, when integrated with other components of the study, the stakeholder analysis provides a rich and in-depth source of information about the use of the cash portion of the benefit, barriers to redeeming the noncash portion, and potential adverse effects of discontinuing the cash portion. Furthermore, the in-depth information collected through the stakeholder analysis provides a means to generate hypotheses about the different effects of discontinuing the cash portion and impacts on various populations.

Exa
min
atio
n of
Cas
h N
utrit
ion
Ass
ista
nce
Pro
gram
Ben
efits
in P
uerto
Ric
o
Pag
e B
-1
APP
END
IX B
: SU
PPLE
MEN
TAL
TAB
LES
B.1
. PU
ERTO
RIC
O P
OPU
LATI
ON
: DEM
OG
RAP
HIC
AN
D IN
CO
ME
CH
AR
AC
TER
ISTI
CS
Tabl
e B.
1.a.
De
mog
raph
ic, L
abor
For
ce, I
ncom
e, a
nd P
over
ty C
hara
cter
istic
s O
f Ind
ivid
uals
in P
uert
o Ri
co, M
issis
sipp
i, an
d th
e U
nite
d St
ates
, 201
3 (In
Per
cent
Unl
ess O
ther
wis
e N
oted
) Pu
erto
Ric
o M
issi
ssip
pi
Uni
ted
Stat
es
Tota
l Ind
ivid
uals
3,
615,
086
2,99
1,20
7 31
6,12
8,83
9
Age Pr
esch
ool (
<5)
5.5
6.6
6.3
Scho
ol a
ge (5
–17)
17
.0
18.0
17
.0
18–5
9 55
.0
55.7
56
.8
60+
22.5
19
.6
19.9
M
edia
n ag
e 38
.6
36.6
37
.5
Sex
(age
18+
)a M
ale
36
.2
35.9
37
.3
Fem
ale
41
.2
39.4
39
.4
Race
/Eth
nici
ty
Whi
te, n
on-H
ispan
ic
0.6
57.4
62
.4
Blac
k, n
on-H
ispan
ic
0.1
37.6
12
.3
Oth
er ra
ce, n
on-H
ispan
ic
0.1
1.4
6.0
Mul
tirac
e, n
on-H
ispan
ic
0.2
0.9
2.2
Hisp
anic
or L
atin
o (o
f any
race
) 99
.1
2.7
17.1
Mar
ital S
tatu
s (ag
e 15
+)
2,95
5,17
2 2,
375,
554
255,
017,
166
Mar
ried
38.1
44
.7
47.9
Se
para
ted
or d
ivor
ced
16.1
15
.0
13.2
W
idow
ed
7.2
6.9
5.9
Nev
er m
arrie
d 38
.5
33.5
33
.1
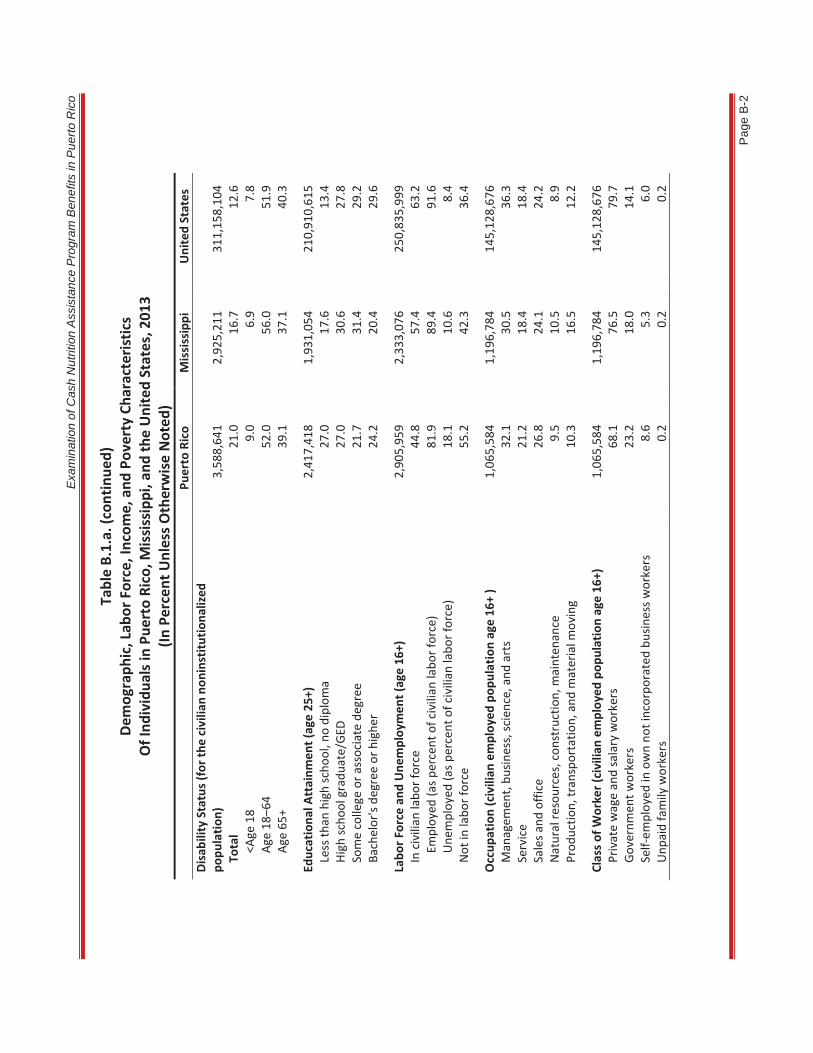
Exa
min
atio
n of
Cas
h N
utrit
ion
Ass
ista
nce
Pro
gram
Ben
efits
in P
uerto
Ric
o
Pag
e B
-2
Tabl
e B.
1.a.
(con
tinue
d)
Dem
ogra
phic
, Lab
or F
orce
, Inc
ome,
and
Pov
erty
Cha
ract
erist
ics
Of I
ndiv
idua
ls in
Pue
rto
Rico
, Mis
sissi
ppi,
and
the
Uni
ted
Stat
es, 2
013
(In P
erce
nt U
nles
s Oth
erw
ise
Not
ed)
Puer
to R
ico
Mis
siss
ippi
U
nite
d St
ates
Di
sabi
lity
Stat
us (f
or th
e ci
vilia
n no
nins
titut
iona
lized
po
pula
tion)
3,
588,
641
2,92
5,21
1 31
1,15
8,10
4 To
tal
21.0
16
.7
12.6
<A
ge 1
8 9.
0 6.
9 7.
8 Ag
e 18
–64
52.0
56
.0
51.9
Ag
e 65
+ 39
.1
37.1
40
.3
Educ
atio
nal A
ttai
nmen
t (ag
e 25
+)
2,41
7,41
8 1,
931,
054
210,
910,
615
Less
than
hig
h sc
hool
, no
dipl
oma
27.0
17
.6
13.4
Hi
gh sc
hool
gra
duat
e/GE
D
27.0
30
.6
27.8
So
me
colle
ge o
r ass
ocia
te d
egre
e 21
.7
31.4
29
.2
Bach
elor
's de
gree
or h
ighe
r 24
.2
20.4
29
.6
Labo
r For
ce a
nd U
nem
ploy
men
t (ag
e 16
+)
2,90
5,95
9 2,
333,
076
250,
835,
999
In c
ivili
an la
bor f
orce
44
.8
57.4
63
.2
Empl
oyed
(as p
erce
nt o
f civ
ilian
labo
r for
ce)
81.9
89
.4
91.6
U
nem
ploy
ed (a
s per
cent
of c
ivili
an la
bor f
orce
) 18
.1
10.6
8.
4 N
ot in
labo
r for
ce
55.2
42
.3
36.4
Occ
upat
ion
(civ
ilian
em
ploy
ed p
opul
atio
n ag
e 16
+ )
1,06
5,58
4 1,
196,
784
145,
128,
676
Man
agem
ent,
busin
ess,
scie
nce,
and
art
s 32
.1
30.5
36
.3
Serv
ice
21.2
18
.4
18.4
Sa
les a
nd o
ffice
26
.8
24.1
24
.2
Nat
ural
reso
urce
s, c
onst
ruct
ion,
mai
nten
ance
9.
5 10
.5
8.9
Prod
uctio
n, tr
ansp
orta
tion,
and
mat
eria
l mov
ing
10.3
16
.5
12.2
Clas
s of W
orke
r (ci
vilia
n em
ploy
ed p
opul
atio
n ag
e 16
+)
1,06
5,58
4 1,
196,
784
145,
128,
676
Priv
ate
wag
e an
d sa
lary
wor
kers
68
.1
76.5
79
.7
Gove
rnm
ent w
orke
rs
23.2
18
.0
14.1
Se
lf-em
ploy
ed in
ow
n no
t inc
orpo
rate
d bu
sines
s wor
kers
8.
6 5.
3 6.
0 U
npai
d fa
mily
wor
kers
0.
2 0.
2 0.
2

Exa
min
atio
n of
Cas
h N
utrit
ion
Ass
ista
nce
Pro
gram
Ben
efits
in P
uerto
Ric
o
Pag
e B
-3
Tabl
e B.
1.a.
(con
tinue
d)
Dem
ogra
phic
, Lab
or F
orce
, Inc
ome,
and
Pov
erty
Cha
ract
erist
ics
Of I
ndiv
idua
ls In
Pue
rto
Rico
, Mis
siss
ippi
, and
the
Uni
ted
Stat
es, 2
013
(In P
erce
nt U
nles
s Oth
erw
ise
Not
ed)
Puer
to R
ico
Mis
siss
ippi
U
nite
d St
ates
Po
vert
y St
atus
To
tal W
ith In
com
es B
elow
the
Pove
rty
Leve
l 1,
626,
879
695,
915
48,8
10,8
68
Tota
l ind
ivid
uals
45.4
24.0
15.8
Re
late
d ch
ildre
n <a
ge 1
8 28
.4
34.9
32
.3
Age
18–6
4 56
.8
56.2
58
.5
Age
65+
14.7
8.
4 8.
5
Annu
al In
com
e (a
ge 1
5+)
2,95
5,17
2 2,
375,
554
255,
017,
166
Tota
l with
inco
me
72.3
83
.5
85.9
N
o in
com
e 27
.7
16.5
14
.1
$1–$
9,99
9 41
.3
25.8
20
.7
$10–
14,9
99
17.3
13
.4
10.6
$1
5–24
,999
20
.3
17.7
16
.7
$25–
34,9
99
8.7
13.4
12
.6
$35–
49,9
99
6.2
13.2
13
.5
$50–
64,9
99
2.7
7.1
9.1
$65–
74,9
99
1.1
2.7
3.7
$75,
000+
2.
5 6.
6 12
.9
Sour
ce: 2
013
ACS
and
PRCS
(1-y
ear e
stim
ates
) N
otes
a Th
e pe
rcen
ts d
o no
t sum
to 1
00 b
ecau
se th
ey a
re b
ased
on
the
num
ber o
f ind
ivid
uals
olde
r tha
n 18
as a
per
cent
age
of th
e to
tal p
opul
atio
n.
b Disa
bilit
y st
atus
by
age
is fo
r the
civ
ilian
non
inst
itutio
naliz
ed p
opul
atio
n on
ly.

Examination of Cash Nutrition Assistance Program Benefits in Puerto Rico
Page B-4
Table B.1.b. Household Composition and Income of Households and Families
In Puerto Rico, Mississippi, and the United States, 2013 (In Percent Unless Otherwise Noted)
Puerto Rico Mississippi United States Total Households 1,253,690 1,091,002 116,291,033
Household Size 1 24.9 27.2 27.7 2 31.5 34.4 33.7 3 19.8 16.2 15.7 4+ 23.8 22.1 22.8 Mean size 2.9 2.7 2.7
Household Composition Family Households 895,080 745,079 76,680,463
Family households with children 47.1 49.1 48.0 Married husband-wife family 47.5 54.32 64.7 Male householder, no wife present 9.4 7.23 8.4 Female householder, no male present 43.2 38.45 26.8
Family households without children 52.9 50.9 52.0 Nonfamily households 28.6 31.7 34.1
Householder living alone 87.1 85.80 81.40
Households With Children (<age 18) 33.8 34.0 32.1
Households With Elderly (age 60+) 43.8 37.3 36.4
Household Income (e.g., wages, salary) <$10,000 29.3 12.0 7.6 $10–14,999 11.9 8.6 5.4 $15–24,999 18.8 13.8 10.8 $25–34,999 12.3 12.0 10.3 $35–49,999 11.3 14.4 13.6 $50,000+ 16.6 39.2 52.4 Mean income $30,247 $52,780 $73,767 Median income $19,183 $37,963 $52,250
Households With Earnings 57.0 72.7 77.8 Mean earnings $36,530 $55,756 $75,498
Households With Social Security 41.66 33.3 29.8 Mean Social Security income $11,785 $15,647 $17,389
Households With Cash Public Assistance Income 7.0 3.1 2.8 Mean cash public assistance income $2,167 $2,853 $3,324
Family Median Income (dollars) $22,698 $47,615 $64,030
Family per Capita Income (dollars) $11,208 $20,156 $28,184
Median Earnings for Workers (dollars) $16,609 $25,610 $30,454 Source: 2013 ACS and PRCS (1-year estimates)

Examination of Cash Nutrition Assistance Program Benefits in Puerto Rico
Page B-5
Table B.1.c. Characteristics of Individuals With Incomes Below 100 Percent
Of the Federal Poverty Level in Puerto Rico, Mississippi, and the United States, 2013 (In Percent Unless Otherwise Noted)
Puerto Rico Mississippi United States Total Individuals 3,581,841 2,893,768 308,196,783
Total Families 895,080 745,079 76,680,463
Total Households 1,253,690 1,091,002 116,291,033
Individuals With Incomes Below Selected Percentages of the Federal Poverty Level <50% 25.9% 10.7 7.0 125% 54.0% 30.3 20.6 150% 62.0% 36.0 25.4 185% 70.9% 44.0 32.1 200% 74.2% 46.8 34.8
Individuals With Incomes Below 100% of the Federal Poverty Level 1,626,879 695,915 48,810,868
Total Individuals 45.4 24.0 15.8
Age <18 28.5 35.4 33.0 18–64 56.8 56.2 58.5 65+ 14.7 8.4 8.5
Gender Male 45.8 42.7 44.9 Female 54.2 57.3 55.1
Education (age 25+) 965,515 354,399 25,525,263 Less than high school; no diploma 41.7 32.1 29.5 High school graduate/GED 31.5 34.6 32.8 Some college or associate degree 18.2 26.0 26.0 Bachelor's degree or higher 8.5 7.4 11.6
Employment Status Civilian labor force (age 16+) 386,334 200,612 15,311,333 Employed 59.8 68.1 71.0 Unemployed 40.2 31.9 29.0
Disability Status With disability 23.1 19.7 17.9 Without disability 76.9 80.3 82.1
Families With Incomes Below 100% of the Federal Poverty Level All family households with income below 100% of the Federal
poverty level 371,967 141,333 8,905,145 With related children <age 18 59.1 76.0 76.3
Married-couple families 40.4 28.8 36.4 Families with female householder, no husband present 48.5 63.9 52.8
With related children <age 18 70.5 85.1 86.0 Source: 2013 ACS and PRCS (1-year estimates)

Exa
min
atio
n of
Cas
h N
utrit
ion
Ass
ista
nce
Pro
gram
Ben
efits
in P
uerto
Ric
o
Pag
e B
-6
Tabl
e B.
1.d.
Pe
rcen
tage
of K
ey P
opul
atio
n Su
bgro
ups i
n Po
vert
y in
Pue
rto
Rico
, Mis
sissi
ppi,
and
the
Uni
ted
Stat
es, 2
013
(Row
Per
cent
s)
Puer
to R
ico
Mis
siss
ippi
U
nite
d St
ates
Char
acte
ristic
Tota
l %
in
Pove
rty
To
tal
% in
Po
vert
y
Tota
l %
in
Pove
rty
Tota
l Ind
ivid
uals
3,58
1,84
1 45
.4
2,89
3,76
8 24
.0
308,
196,
783
15.8
Age <1
8 80
8,40
7 57
.3
724,
578
34.0
72
,382
,173
22
.2
18–6
4 2,
181,
278
42.4
1,
768,
800
22.1
19
2,46
1,04
3 14
.8
65+
592,
156
40.4
40
0,39
0 14
.7
43,3
53,5
67
9.6
Gen
der
Mal
e 1,
705,
411
43.7
1,
391,
511
21.3
15
0,91
8,83
7 14
.5
Fem
ale
1,87
6,43
0 47
.0
1,50
2,25
7 26
.6
157,
277,
946
17.1
Educ
atio
n (a
ge 2
5+)
Less
than
hig
h sc
hool
; no
dipl
oma
642,
024
62.8
32
2,74
7 35
.2
27,2
03,1
51
27.7
Hi
gh sc
hool
gra
duat
e/GE
D 64
8,74
6 46
.9
572,
230
21.4
57
,281
,001
14
.6
Som
e co
llege
or a
ssoc
iate
deg
ree
522,
004
33.6
59
7,10
7 15
.4
60,7
39,0
33
10.9
Ba
chel
or's
degr
ee o
r hig
her
582,
929
14.1
39
0,39
7 6.
7 62
,162
,431
4.
8
Empl
oym
ent S
tatu
s Em
ploy
ed
1,06
4,24
7 21
.7
1,19
1,79
8 11
.5
144,
257,
520
7.5
Une
mpl
oyed
23
5,28
5 66
.1
138,
918
46.0
13
,216
,897
33
.6
Disa
bilit
y St
atus
W
ith d
isabi
lity
754,
357
49.7
48
5,93
4 28
.2
38,9
64,6
84
22.4
W
ithou
t disa
bilit
y 2,
826,
365
44.3
2,
402,
378
23.3
26
8,55
2,29
8 14
.9
Fam
ily H
ouse
hold
s Al
l fam
ilies
8
95,0
80
41.6
7
45,0
79
19.0
7
6,68
0,46
3
11.6
W
ith re
late
d ch
ildre
n <a
ge 1
8 4
21,6
05
52.1
3
65,5
94
29.4
3
6,80
0,12
8
18.5
M
arrie
d co
uple
fam
ilies
5
08,8
56
29.5
4
87,6
48
8.3
55,
858,
808
5.
8 Fa
mili
es w
ith fe
mal
e ho
useh
olde
r, no
hus
band
pre
sent
3
07,0
03
58.7
2
03,7
90
44.3
1
5,20
1,75
6
30.9
W
ith re
late
d ch
ildre
n <a
ge 1
8 1
81,9
33
69.9
1
40,5
64
54.7
9
,871
,786
41
.0
Sour
ce: 2
013
ACS
and
PRCS
(1-y
ear e
stim
ates
)

Exa
min
atio
n of
Cas
h N
utrit
ion
Ass
ista
nce
Pro
gram
Ben
efits
in P
uerto
Ric
o
Pag
e B
-7
Tabl
e B.
1.e.
U
nem
ploy
men
t Rat
e by
Age
and
Oth
er C
hara
cter
istic
s of I
ndiv
idua
ls in
Pue
rto
Rico
, Mis
siss
ippi
, and
the
Uni
ted
Stat
es, 2
013
Pu
erto
Ric
o M
issis
sipp
i
Uni
ted
Stat
es
Char
acte
ristic
Ci
vilia
n La
bor F
orce
Pe
rcen
t Em
ploy
ed
Perc
ent
Une
mpl
oyed
Civi
lian
Labo
r For
ce
Perc
ent
Empl
oyed
Pe
rcen
t U
nem
ploy
ed
Ci
vilia
n La
bor F
orce
Pe
rcen
t Em
ploy
ed
Perc
ent
Une
mpl
oyed
Po
pula
tion
(age
d 16
+)
1,30
0,92
2 81
.9
18.1
1,
338,
290
89.4
10
.6
158,
498,
347
91.6
8.
4 16
–19
year
s 36
,735
34
.3
65.7
56
,202
65
.3
34.7
6,
385,
412
74.6
25
.4
20–2
4 ye
ars
136,
385
68.7
31
.3
146,
373
79.7
20
.3
16,4
63,7
24
85.4
14
.6
25–4
4 ye
ars
654,
928
83.1
16
.9
590,
407
89.8
10
.2
67,7
85,7
48
92.3
7.
7 45
–54
year
s 28
7,63
5 86
.5
13.5
27
9,29
7 94
.0
6.0
34,9
22,4
91
93.7
6.
3 55
–64
year
s 14
4,81
1 88
.6
11.4
19
9,75
5 93
.9
6.1
25,2
64,4
68
94.1
5.
9 65
–74
year
s 33
,104
94
.4
5.6
56
,528
95
.1
4.9
6,45
9,28
9 94
.7
5.3
75+
7,32
4 93
.3
6.7
9,
728
94.4
5.
6 1,
217,
215
94.9
5.
1
Popu
latio
n (a
ged
20–6
4)
1,22
3,75
9 82
.9
17.1
1,
215,
832
90.2
9.
8 14
4,43
6,43
1 92
.1
7.9
Sex M
ale
641,
868
82.6
17
.4
615,
612
90.2
9.
8 75
,982
,708
92
.0
8.0
Fem
ale
581,
891
83.3
16
.7
600,
220
90.3
9.
7 68
,453
,723
92
.3
7.7
Pove
rty
Stat
us in
the
Past
12
Mon
ths (
aged
20–
64,
pove
rty
univ
erse
) 1,
222,
496
82.9
17
.1
1,21
1,86
1 90
.3
9.7
143,
943,
553
92.2
7.
8 In
com
e be
low
Fed
eral
po
vert
y le
vel
363,
235
61.0
39
.0
183,
089
69.9
30
.1
14,0
20,0
85
71.8
28
.2
Disa
bilit
y St
atus
(a
ged
18-6
4)
1,25
4,65
1 81
.8
18.2
1,
258,
173
89.4
10
.6
148,
891,
200
91.7
8.
3 W
ith a
ny d
isabi
lity
113,
122
77.0
23
.0
90,9
61
78.8
21
.2
8,40
0,00
5 82
.7
17.3
Educ
atio
nal A
ttai
nmen
t Po
pula
tion
(age
d 25
–64)
1,
087,
374
84.7
15
.3
1,06
9,45
9 91
.7
8.3
127,
972,
707
93.0
7.
0 Le
ss th
an h
igh
scho
ol
grad
uate
11
6,22
8 68
.8
31.2
11
1,16
4 82
.9
17.1
12
,009
,559
87
.4
12.6
Hi
gh sc
hool
gra
duat
e (in
clud
es e
quiv
alen
cy)
275,
762
79.4
20
.6
305,
760
89.3
10
.7
31,8
34,9
98
91.0
9.
0 So
me
colle
ge o
r as
soci
ate'
s deg
ree
303,
945
85.4
14
.6
389,
046
93.1
6.
9 39
,888
,965
92
.8
7.2
Bach
elor
's de
gree
or
high
er
391,
439
92.6
7.
4
263,
489
96.0
4.
0 44
,239
,185
96
.2
3.8
Sour
ce: 2
013
ACS
and
PRCS
(1-y
ear e
stim
ates
)

Exa
min
atio
n of
Cas
h N
utrit
ion
Ass
ista
nce
Pro
gram
Ben
efits
in P
uerto
Ric
o
Pag
e B
-8
Tabl
e B.
1.f.
An
nual
Con
sum
er E
xpen
ditu
res i
n Pu
erto
Ric
o an
d th
e U
nite
d St
ates
For
Fiv
e M
ajor
Cat
egor
ies,
201
3 Pu
erto
Ri
co
Uni
ted
Stat
es
Diff
eren
ce
N
umbe
r Pe
rcen
t To
tal H
ouse
hold
s 1,
253,
690
116,
291,
033
NA
NA
Annu
al C
onsu
mer
Exp
endi
ture
s (Pe
r Hou
seho
ld)
To
tal E
xpen
ditu
res (
in d
olla
rs)
33,6
01
37,9
89
-4,3
88
-11.
5 Fo
od
7,18
7
6,60
2
585
8.9
Clot
hing
3,
148
1,
604
1,
544
96.3
Ho
usin
g 7,
824
17
,148
-9
,324
-5
4.4
Med
ical
Car
e 9,
114
3,
631
5,
483
151.
0 Tr
ansp
orta
tion
6,32
9
9,0
04
-2,6
75
-29.
7 So
urce
: Gov
ernm
ent D
evel
opm
ent B
ank
of P
uert
o Ri
co, S
tatis
tical
App
endi
x fo
r 201
4, h
ttp:
//w
ww
.gdb
-pur
.com
/eco
nom
y/st
atist
ical-a
ppen
dix.
htm
l U.
S. B
urea
u of
Lab
or S
tatis
tics,
Bure
au o
f Lab
or S
tatis
tics R
epor
ts, F
ebru
ary
2015
, htt
p://
ww
w.b
ls.go
v/ce
x/cs
xann
13.p
df

Examination of Cash Nutrition Assistance Program Benefits in Puerto Rico
Page B-9
B.2. FEDERAL PAYMENTS RECEIVED BY PUERTO RICO COMPARED WITH THE UNITED STATES
Table B.2.a. Federal Government Expenditures for Direct Payments To Individuals in Puerto Rico and the United States, FY 2010
(Annual Federal Expenditures in Thousands of Dollars, per Capita Amounts in Actual Dollars)a Puerto Rico United States
Total
(in thousands $) Per Capita
($) Total
(in thousands $) Per Capita
($) Payments for Retirement and Disability
Social Security Payment 7,149,623 1,919 695,821,573 2,254 Retirement insurance 3,439,821 923 439,520,354 1,424 Survivors insurance 1,501,662 403 134,385,878 435 Disability insurance 2,208,140 593 121,915,341 395
SSIb* N/A N/A 49,038,000 459
Federal Retirement and Disability Benefits Civilian 299,200 80 71,298,307 231 Military 22,873 6 38,938,539 126
Veterans Benefits Service connected 314,132 84 33,504,791 109 Other 131,627 35 5,787,890 19
Other 33,846 9 22,183,796 72
Payments Other Than Retirement and Disability Medicare 3,003,791 806 511,629,096 1,657
Hospital Insurance 914,968 246 246,104,816 797 Supplementary medical insurance 1,676,897 450 205,150,069 664 Medical prescription drug coverage 411,926 111 60,374,211 196
Unemployment compensation 371,510 100 67,805,206 220 SNAPc* N/A N/A 76,066,319 710 EITC* 3,916 1 51,987,860 501 Student financial assistance* 966,682 260 50,036,521 482 Federal employees life and health insurance 95,051 26 26,931,571 87 Agricultural assistance 31,729 9 17,319,993 56 Housing assistance 343,891 92 14,174,051 46 Other 142,981 38 13,945,876 45
Total 12,910,852 N/A 1,746,469,389 N/A Source: U.S. Census Bureau (2011), tables 2, 3, and 10; for AABD data, see GAO (2014); for SSI data, see SSA (2013), table IV.C1; for SNAP data, see USDA (2013a). Notes N/A (not applicable) is shown for Federal programs that are not in Puerto Rico (i.e., SSI and SNAP).
Federal expenditures are for FY 2010 for all programs except as noted for SSI and SNAP. SSI expenditures are for FY 2011 for consistency with AABD grant totals (see appendix table B.2.b); SNAP expenditures are for FY 2013 for consistency with NAP grant totals (see appendix table B.2.b).
Per capita spending for each program is calculated as the amount of Federal spending divided by the total resident population in Puerto Rico and the United States for the relevant year.
Federal programs that make direct payments to individuals have Federal eligibility and benefit rules and usually are administered by the Federal Government. * Low-income programs are indicated in the table with an asterisk. a Per capita amounts for programs aimed at assisting low-income individuals are calculated over the population of low-income individuals only. These per capita amounts are calculated as the amount of Federal spending divided by the number of individuals with income below 200 percent of the Federal poverty level. Low-income programs are indicated in the table with an asterisk. b SSI totals are for FY 2011 for consistency with AABD grant totals (see appendix table B.2.b). c SNAP totals are for FY 2013 for consistency with NAP grant totals (see appendix table B.2.b)

Exa
min
atio
n of
Cas
h N
utrit
ion
Ass
ista
nce
Pro
gram
Ben
efits
in P
uerto
Ric
o
Pag
e B
-10
Tabl
e B.
2.b.
Fe
dera
l Gov
ernm
ent G
rant
s-in
-Aid
to P
uert
o Ri
co a
nd th
e U
nite
d St
ates
, FY
2013
(A
nnua
l Fed
eral
Obl
igat
ions
in T
hous
ands
of D
olla
rs, p
er C
apita
Am
ount
s in
Actu
al D
olla
rs)a
Pu
erto
Ric
o
Uni
ted
Stat
es
To
tal
(tho
usan
ds $
) Pe
r Cap
ita
($)
To
tal
(tho
usan
ds $
) Pe
r Cap
ita
($)
USD
A, F
NS
N
atio
nal S
choo
l Lun
ch P
rogr
am*
128,
283
48
11
,052
,821
10
3 W
IC*
243,
701
92
6,
829,
686
64
Scho
ol B
reak
fast
Pro
gram
* 33
,958
13
3,61
0,15
0 34
Ch
ildre
n an
d Ad
ult C
are
Food
Pro
gram
* 26
,393
10
3,08
3,00
0 29
N
AP in
Pue
rto
Rico
* 1,
902,
771
716
N
/A
N/A
ED
, Off
ice
of E
lem
enta
ry a
nd S
econ
dary
Edu
catio
n
Title
I Co
llege
-And
-Car
eer-
Read
y St
uden
ts
453,
904
171
13
,760
,219
12
8 Im
prov
ing
Teac
her Q
ualit
y St
ate
Gran
ts
70,8
76
20
2,
337,
830
7
ED
, Off
ice
of S
peci
al E
duca
tion
and
Reha
bilit
ativ
e Se
rvic
es
Sp
ecia
l Edu
catio
n-–G
rant
s to
Stat
es
108,
460
30
10
,974
,682
35
Vo
catio
nal R
ehab
ilita
tion
Gran
ts
69,7
64
19
3,
066,
192
10
HHS,
CM
S
Med
icai
d*
973,
694
367
28
6,92
0,49
6 26
77
CHIP
* 13
2,65
9 50
8,93
9,37
2 83
Af
ford
able
Insu
ranc
e Ex
chan
ge G
rant
s N
/A
N/A
2,17
4,66
2 20
HH
S, A
dmin
istr
atio
n fo
r Chi
ldre
n an
d Fa
mili
es
TA
NF—
Fam
ily A
ssist
ance
Gra
nts*
71
,563
27
16,7
21,8
97
154
Head
Sta
rt*
263,
475
99
7,
573,
080
71
Child
Sup
port
Enf
orce
men
t—Fe
dera
l Sha
re o
f Sta
te &
Loc
al A
dmin
istra
tive
Cost
s and
Ince
ntiv
es*
31,0
10
12
4,
233,
896
40
Fost
er C
are—
Title
IV-E
* N
/A
N/A
4,13
5,28
9 39
Lo
w In
com
e Ho
me
Ener
gy A
ssist
ance
Pro
gram
* 3,
966
1
3,25
5,43
6 30
Ad
optio
n As
sista
nce*
N
/A
N/A
2,27
8,13
5 21
Ch
ild C
are
and
Deve
lopm
ent B
lock
Gra
nt*
2,18
5 1
2,
205,
549
21

Exa
min
atio
n of
Cas
h N
utrit
ion
Ass
ista
nce
Pro
gram
Ben
efits
in P
uerto
Ric
o
Pag
e B
-11
Tabl
e B.
2.b
(con
tinue
d)
Fede
ral G
over
nmen
t Gra
nts-
in-A
id to
Pue
rto
Rico
and
the
Uni
ted
Stat
es, F
Y 20
13
(Ann
ual F
eder
al O
blig
atio
ns in
Tho
usan
ds o
f Dol
lars
, per
Cap
ita A
mou
nts i
n Ac
tual
Dol
lars
)
Puer
to R
ico
U
nite
d St
ates
To
tal
(tho
usan
ds $
) Pe
r Cap
ita
($)
To
tal
(tho
usan
ds $
) Pe
r Cap
ita
($)
HHS,
Adm
inis
trat
ion
for C
hild
ren
and
Fam
ilies
(con
tinue
d)
Ch
ild C
are
And
Deve
lopm
ent F
und-
Mat
chin
g*
N/A
N
/A
1,
678,
038
16
Soci
al S
ervi
ces B
lock
Gra
nt*
8,34
5 3
1,
613,
300
15
Child
Car
e An
d De
velo
pmen
t Fun
d-M
anda
tory
* N
/A
N/A
1,23
8,96
2 12
Ai
d to
the
Aged
, Blin
d, a
nd D
isabl
edb (A
ABD)
* 24
,000
9
N
A N
A
HH
S, H
RSA
Ryan
Whi
te H
IV/A
IDS
Trea
tmen
t Mod
erni
zatio
n Ac
t—Pa
rt B
HIV
Car
e Gr
ants
33
,120
9
1,
239,
221
4
HU
D, P
ublic
and
Indi
an H
ousi
ng P
rogr
ams
Sect
ion
8 Ho
usin
g Ch
oice
Vou
cher
s*
186,
434
70
17
,897
,161
16
7 Pu
blic
Hou
sing
Ope
ratin
g Fu
nd*
195,
401
74
4,
058,
141
38
Publ
ic H
ousin
g Ca
pita
l Fun
d*
103,
999
39
1,
775,
856
17
HUD,
Com
mun
ity P
lann
ing
and
Deve
lopm
ent
Com
mun
ity D
evel
opm
ent B
lock
Gra
nt
36,7
08
10
2,
959,
272
9 Co
mm
unity
Dev
elop
men
t Blo
ck G
rant
—Di
sast
er R
ecov
ery
N/A
N
/A
2,
204,
854
7
DO
L,c E
mpl
oym
ent &
Tra
inin
g Ad
min
U
nem
ploy
men
t Ins
uran
ce
18,4
33
5
2,94
9,68
2 9
DOT,
d FA
A
Airp
ort I
mpr
ovem
ent P
rogr
am
2,12
7 1
3,
047,
483
10
DOT,
Fed
eral
Hig
hway
Adm
inis
trat
ion
High
way
Pla
nnin
g an
d Co
nstr
uctio
n 13
4,52
2 37
40,0
66,2
21
127
DOT,
Fed
eral
Tra
nsit
Adm
inis
trat
ion
Tran
sit F
orm
ula
Gran
t Pro
gram
s 42
,102
12
9,07
0,00
8 29

Exa
min
atio
n of
Cas
h N
utrit
ion
Ass
ista
nce
Pro
gram
Ben
efits
in P
uerto
Ric
o
Pag
e B
-12
Tabl
e B.
2.b
(con
tinue
d)
Fede
ral G
over
nmen
t Gra
nts-
in-A
id to
Pue
rto
Rico
and
the
Uni
ted
Stat
es, F
Y 20
13
(Ann
ual F
eder
al O
blig
atio
ns in
Tho
usan
ds o
f Dol
lars
, per
Cap
ita A
mou
nts i
n Ac
tual
Dol
lars
)
Puer
to R
ico
U
nite
d St
ates
To
tal
(tho
usan
ds $
) Pe
r Cap
ita
($)
To
tal
(tho
usan
ds $
) Pe
r Cap
ita
($)
EPA,
Offi
ce o
f Wat
er
Capi
taliz
atio
n Gr
ants
for C
lean
Wat
er S
tate
Rev
olvi
ng F
und
17,1
90
5
1,42
2,33
0 4
Capi
taliz
atio
n Gr
ants
for D
rinki
ng W
ater
Sta
te R
evol
ving
Fun
d 8,
421
2
926,
699
3
FC
Ce
U
nive
rsal
Ser
vice
Fun
d E-
Rate
22
,212
6
1,
750,
553
6
To
tal
5,34
9,16
0 N
/A
48
7,05
0,17
3 N
/A
Sour
ce: O
MB,
201
2; ta
bles
15–
5 an
d 15
–40.
Unp
ublis
hed
tabl
es fr
om F
NS M
ARO
(for
NAP
gra
nt);
GAO
, 201
4 (fo
r AAB
D).T
ANF
per c
apita
am
ount
s fro
m A
dmin
istra
tion
for C
hild
ren
and
Fam
ilies
. N
otes
N
/A (n
ot a
pplic
able
) is s
how
n fo
r pro
gram
s tha
t are
not
in (o
r for
whi
ch in
form
atio
n is
not a
vaila
ble
for)
Pue
rto
Rico
(NAP
) or t
he U
nite
d St
ates
.
Fede
ral g
rant
s-in
-aid
are
for F
Y 20
13 fo
r all
prog
ram
s exc
ept f
or A
ABD.
AAB
D gr
ant a
mou
nt is
for F
Y 20
11.
Fede
ral g
rant
s-in
-aid
are
pro
vide
d to
Sta
te a
nd lo
cal g
over
nmen
ts, U
.S. t
errit
orie
s, a
nd A
mer
ican
Indi
an T
ribal
gov
ernm
ents
to su
ppor
t gov
ernm
ent o
pera
tions
or p
rovi
sion
of se
rvic
es to
the
publ
ic.
Fede
ral g
rant
s gen
eral
ly fa
ll in
to o
ne o
f tw
o br
oad
cate
gorie
s: (1
) cat
egor
ical
gra
nts h
ave
a na
rrow
ly d
efin
ed p
urpo
se a
nd m
ay b
e aw
arde
d on
a fo
rmul
a ba
sis o
r pro
ject
gra
nt (e
.g.,
WIC
); (2
) blo
ck
gran
ts p
rovi
de th
e St
ate
or lo
cal g
over
nmen
t mor
e fle
xibi
lity
in d
eter
min
ing
how
the
fund
s are
use
d an
d th
e el
igib
ility
requ
irem
ents
for r
ecei
ving
ben
efits
, and
are
aw
arde
d on
a fo
rmul
a ba
sis (e
.g.,
TAN
F).
a Per
cap
ita a
mou
nts f
or p
rogr
ams a
imed
at a
ssist
ing
low
-inco
me
indi
vidu
als a
re c
alcu
late
d ov
er th
e po
pula
tion
of lo
w-in
com
e in
divi
dual
s onl
y. T
hese
per
cap
ita a
mou
nts a
re c
alcu
late
d as
the
amou
nt
of F
eder
al sp
endi
ng d
ivid
ed b
y th
e nu
mbe
r of i
ndiv
idua
ls w
ith in
com
e be
low
200
per
cent
of t
he F
eder
al p
over
ty le
vel.
Low
-inco
me
prog
ram
s are
indi
cate
d in
the
tabl
e w
ith a
n as
teris
k.
b AAB
D to
tals
are
for F
Y 20
11.
c DO
L =
U.S
. Dep
artm
ent o
f Lab
or
d DO
T =
U.S
. Dep
artm
ent o
f Tra
nspo
rtat
ion
e FCC
= F
eder
al C
omm
unic
atio
ns C
omm
issio
n

Examination of Cash Nutrition Assistance Program Benefits in Puerto Rico
Page B-13
B.3. NAP PARTICIPANT POPULATION: DEMOGRAPHIC AND INCOME CHARACTERISTICS
Table B.3.a. Distribution of NAP and SNAP Units by Demographic Characteristics and Locality
(In Percent Unless Otherwise Noted)
Unit Characteristic Puerto Rico
NAP Federal SNAP
Total Number of Units 650,944 22,802,036
Units with Children 33.9 44.8 Single-Adult Unit 18.3 25.5
Single-mother unit 17.5 23.5 Single-father unit 0.8 2.0
Multiple-Adult Unit 15.1 13.3 Children-Only Unit 0.4 6.0
Units Without Children 66.1 55.2
Units With Elderly Members (age 60+) 34.8 17.4 Living alone 22.7 13.9 Living with others 12.1 3.5
Units Without Elderly Members 65.2 82.6
Units With Nonelderly Members With Disabilities 16.8 20.3 Living alone 7.9 12.2 Living with others 8.9 8.1
Units Without Nonelderly Members With Disabilities 83.2 79.7
Unit Size 1 person 46.3 50.5 2–3 persons 39.1 33.7 4+ persons 14.6 15.7
Living in Urban Areasa 95.3 91.6 Living in Rural Areasb 4.7 6.8
Source: SAIC data; USDA, 2014. Notes a Urban (metropolitan) areas include central counties with at least one urbanized area of 50,000 or more people and outlying counties economically tied to the core counties. b Rural (nonmetropolitan) counties are outside the boundaries of metropolitan areas and divided into micropolitan areas with urban clusters of 10,000 to 49,999 persons, and remaining counties that are not part of any core-based metropolitan or micropolitan areas.

Examination of Cash Nutrition Assistance Program Benefits in Puerto Rico
Page B-14
Table B.3.b. Distribution of NAP and SNAP Units by Poverty, Income, and Employment Characteristics
(In Percent Unless Otherwise Noted)
Puerto Rico
NAP
Federal SNAP
Total Number of Units 650,944 22,802,036
Monthly Gross Income as a Percentage of Federal Poverty Guideline
At or Below 100% 99.8 82.8 No income 65.4 21.5 > 0–50% 31.6 21.1 51–100% 2.8 40.2 100%+ 0.2 17.1
Households With Positive Gross Income 34.6 78.5
Any earned Income 18.5 31.2 Any unearned Income 19.7 56.9
Employment Status of Head Employed 8.7 22.8 Not employed, status unknown, or head not participating 91.3 77.3
Source: SAIC data; USDA, 2014. Note NAP percentages are for June 2014, and SNAP percentages are for FY 2013 (most recent data available).

Exa
min
atio
n of
Cas
h N
utrit
ion
Ass
ista
nce
Pro
gram
Ben
efits
in P
uerto
Ric
o
Pag
e B
-15
Tabl
e B.
3.c.
Di
strib
utio
n of
NAP
Uni
ts b
y Po
vert
y an
d In
com
e Ch
arac
teris
tics b
y Su
bgro
up (C
olum
n Pe
rcen
ts)
Tot
al U
nits
Uni
ts W
ith
Child
ren
Uni
ts W
ith
Elde
rly
U
nits
With
N
onel
derly
M
embe
rs
With
Di
sabi
litie
s
U
nits
With
Si
ngle
M
othe
rs
With
Ch
ildre
n
Uni
ts in
U
rban
Ar
eas
Uni
ts in
Ru
ral A
reas
To
tal N
umbe
r of U
nits
65
0,94
4
220,
395
226,
633
10
9,22
3 11
3,82
3
620,
187
30
,757
Tota
l Per
cent
10
0.0
10
0.0
10
0.0
100.
0
100.
0
10
0.0
100.
0 M
onth
ly G
ross
Inco
me
as a
Per
cent
age
of F
eder
al P
over
ty
Guid
elin
e
At
or B
elow
100
%
99.8
99.8
99
.9
99
.8
99.8
99.8
99.7
No
inco
me
65.4
33.3
89
.4
80
.6
30.4
65.5
62.7
> 0–
50%
31
.6
61
.5
9.5
16
.7
65.4
31.5
33.5
51–1
00%
2.
8
5.0
1.0
2.
5 4.
1
2.8
3.
5Ab
ove
100%
0.
2
0.2
0.1
0.
2 0.
2
0.2
0.
310
1–13
0%
0.1
0.
1 0.
1
0.1
0.1
0.
1
0.2
131%
+ 0.
1
0.1
0.0
0.
0 0.
1 0.
1
0.1
Hous
ehol
ds W
ith
Po
sitiv
e Gr
oss I
ncom
e 34
.6
66
.7
10.6
19.4
69
.6
34.5
37.3
Any
earn
ed in
com
e 18
.5
30
.7
5.1
9.
5 20
.6
18.3
21.3
Any
unea
rned
inco
me
19.7
45.2
5.
9
11.3
59
.2
19.7
19.9
Av
erag
e Ca
sh P
ortio
n of
NAP
Ben
efit
as a
Per
cent
age
of
Tota
l Cas
h In
com
ea
0–25
%
16.2
27.6
5.
4
10.7
27
.3
16.0
18.6
26–5
0%
12.0
24.2
3.
7
5.9
26.2
11
.9
12
.851
–75%
5.
6
12.7
1.
3
2.4
14.2
5.7
5.
276
–99%
0.
9
2.1
0.2
0.
5 2.
0
0.9
0.
710
0%
65.4
33.3
89
.4
80
.6
30.4
65
.5
62
.7 S
ourc
e: S
AIC
data
.

Exa
min
atio
n of
Cas
h N
utrit
ion
Ass
ista
nce
Pro
gram
Ben
efits
in P
uerto
Ric
o
Pag
e B
-16
Tabl
e B.
3.d.
Di
strib
utio
n of
NAP
Uni
ts b
y Po
vert
y, In
com
e, a
nd E
mpl
oym
ent C
hara
cter
istic
s by
Subg
roup
(Row
Per
cent
s)
To
tal U
nits
To
tal
Perc
ent
Uni
ts
With
Ch
ildre
n
Uni
ts
With
El
derly
U
nits
With
N
onel
derly
M
embe
rs
With
Di
sabi
litie
s
U
nits
With
Si
ngle
M
othe
rs
With
Ch
ildre
n
Uni
ts in
U
rban
Ar
eas
Uni
ts in
Ru
ral
Area
s To
tal N
umbe
r of U
nits
65
0,94
4 10
0.0
33
.9
34
.8
16
.8
17
.5
95
.3
4.
7
Mon
thly
Gro
ss In
com
e as
a P
erce
ntag
e of
Pov
erty
G
uide
line
At
or B
elow
100
%
649,
672
100.
0
33.9
34.8
16.8
17.5
95.3
4.7
No
inco
me
425,
482
100.
0
17.3
47.6
20.7
8.1
95
.5
4.
5 >
0–50
%
205,
696
100.
0
65.9
10.5
8.9
36
.2
95
.0
5.
0 51
–100
%
18,4
94
100.
0
59.4
12.0
14.9
24.9
94.2
5.8
Abov
e 10
0%
1,27
2 10
0.0
34
.4
21
.1
15
.5
19
.6
92
.3
7.
7 10
1–13
0%
809
100.
0
34.9
28.6
19.2
20.1
91.1
8.9
131%
+ 46
3 10
0.0
33
.5
8.
0
9.1
18
.6
94
.4
5.
6
Hous
ehol
ds W
ith:
Po
sitiv
e Gr
oss I
ncom
e 22
5,46
2 10
0.0
65
.2
10
.6
9.
4
35.1
94.9
5.1
Any
earn
ed in
com
e 12
0,16
4 10
0.0
56
.4
9.
7
8.7
19
.5
94
.6
5.
4 An
y un
earn
ed in
com
e 12
8,24
6 10
0.0
77
.6
10
.4
9.
6
52.6
95.2
4.8
Em
ploy
men
t Sta
tus o
f Hea
d
Empl
oyed
56
,653
10
0.0
62
.7
4.
9
6.9
32
.3
94
.7
5.
3 N
ot e
mpl
oyed
30
0,57
0 10
0.0
35
.5
16
.7
17
.6
16
.8
94
.8
5.
2 St
atus
unk
now
n 29
3,72
1 10
0.0
26
.7
59
.1
17
.9
15
.4
95
.9
4.
1
Aver
age
Cash
Por
tion
of N
AP B
enef
it as
a
Perc
enta
ge o
f Tot
al C
ash
Inco
mea
0–
25%
10
5,22
1 10
0.0
57
.9
11
.6
11
.1
29
.5
94
.6
5.
4 26
–50%
77
,972
10
0.0
68
.4
10
.8
8.
2
38.2
95.0
5.0
51–7
5%
36,7
08
100.
0
76.4
7.9
7.
2
43.9
95.6
4.4
76–9
9%
5,56
0 10
0.0
84
.9
8.
0
9.1
40
.5
96
.0
4.
0 10
0%
425,
483
100.
0
17.3
47.6
20.7
8.1
95
.5
4.
5 So
urce
: SAI
C da
ta
Not
e a P
erce
nts a
re c
alcu
late
d as
the
cash
por
tion
of N
AP b
enef
it di
vide
d by
tota
l cas
h in
com
e pl
us c
ash
port
ion
of N
AP b
enef
it.
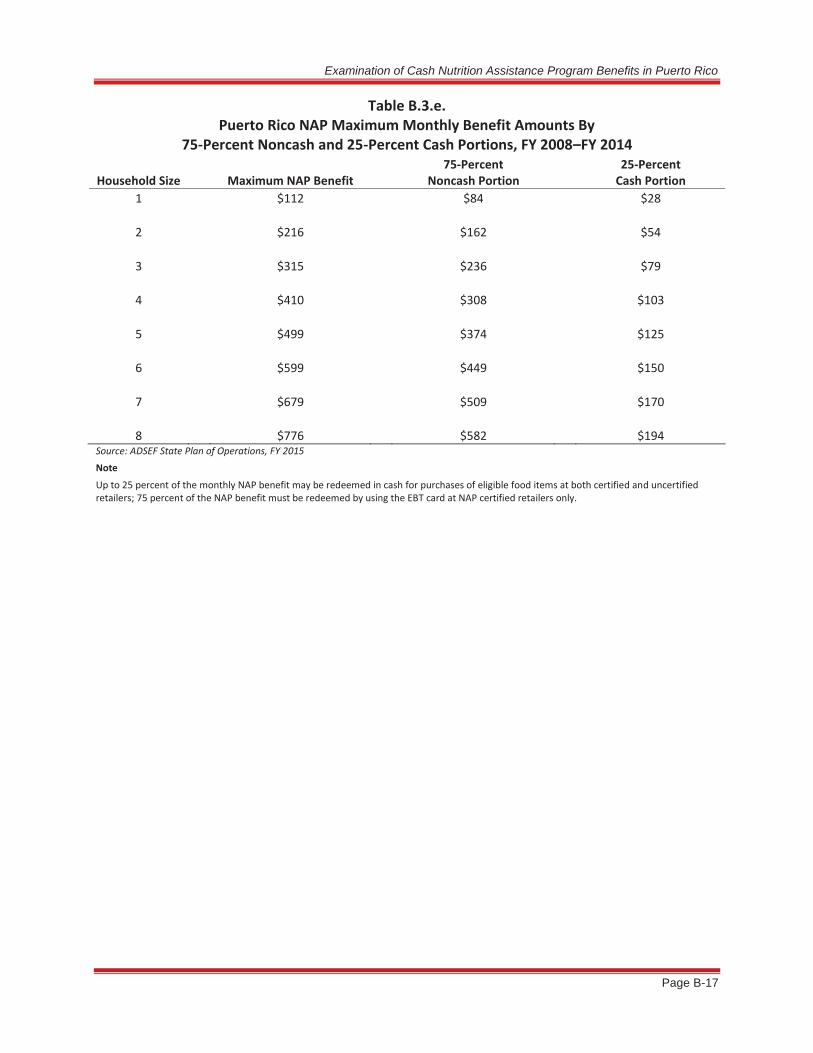
Examination of Cash Nutrition Assistance Program Benefits in Puerto Rico
Page B-17
Table B.3.e. Puerto Rico NAP Maximum Monthly Benefit Amounts By
75-Percent Noncash and 25-Percent Cash Portions, FY 2008–FY 2014
Household Size Maximum NAP Benefit 75-Percent
Noncash Portion 25-Percent
Cash Portion 1 $112 $84 $28
2 $216 $162 $54
3 $315 $236 $79
4 $410 $308 $103
5 $499 $374 $125
6 $599 $449 $150
7 $679 $509 $170
8 $776 $582 $194 Source: ADSEF State Plan of Operations, FY 2015 Note
Up to 25 percent of the monthly NAP benefit may be redeemed in cash for purchases of eligible food items at both certified and uncertified retailers; 75 percent of the NAP benefit must be redeemed by using the EBT card at NAP certified retailers only.

Exa
min
atio
n of
Cas
h N
utrit
ion
Ass
ista
nce
Pro
gram
Ben
efits
in P
uerto
Ric
o
Pag
e B
-18
B.4
. EX
TAN
T D
ATA
AN
ALY
SIS
TAB
LES
Tabl
e B.
4.a.
M
edia
n Di
stan
ce (i
n M
iles)
to N
eare
st R
etai
ler W
here
Par
ticip
ants
Red
eem
Ben
efits
Ve
rsus
Med
ian
Dist
ance
to N
eare
st R
etai
ler B
y Ty
pe o
f Ret
aile
r and
Uni
t Sub
grou
p
Type
of U
nit
Type
of R
etai
ler
All U
nits
Uni
ts W
ith
Elde
rly
Mem
bers
Uni
ts W
ith
Non
elde
rly
Mem
bers
W
ith
Disa
bilit
ies
Uni
ts W
ith
Child
ren
Uni
ts W
ithou
t In
com
e Al
l Ret
aile
rs
Re
taile
rs w
here
ben
efits
are
rede
emed
1.
6 1.
6 1.
7 1.
4 1.
6 Re
taile
rs c
lose
st to
hom
e 0.
2 0.
2 0.
2 0.
2 0.
2
Su
perm
arke
ts, S
uper
stor
es, L
arge
Gro
cery
Sto
res
Re
taile
rs w
here
ben
efits
are
rede
emed
2.
0 1.
9 2.
0 1.
9 2.
0 Re
taile
rs c
lose
st to
hom
e 0.
8 0.
8 0.
8 0.
8 0.
8
Sm
all a
nd M
ediu
m G
roce
ry S
tore
s
Reta
ilers
whe
re b
enef
its a
re re
deem
ed
1.8
1.6
1.7
1.8
1.7
Reta
ilers
clo
sest
to h
ome
0.3
0.3
0.3
0.3
0.3
Larg
e Ge
nera
l Sto
res,
Lar
ge C
ombi
natio
n St
ores
, Who
lesa
lers
Reta
ilers
whe
re b
enef
its a
re re
deem
ed
3.2
3.0
3.3
3.2
3.1
Reta
ilers
clo
sest
to h
ome
0.6
0.6
0.7
0.6
0.6
Conv
enie
nce
or S
mal
l Com
bina
tion
Stor
es
Re
taile
rs w
here
ben
efits
are
rede
emed
1.
8 1.
7 1.
7 1.
9 1.
8 Re
taile
rs c
lose
st to
hom
e 0.
7 0.
7 0.
7 0.
7 0.
7
O
ther
Sto
res
Re
taile
rs w
here
ben
efits
are
rede
emed
3.
9 6.
6 4.
7 3.
1 4.
5 Re
taile
rs c
lose
st to
hom
e 0.
7 0.
7 0.
7 0.
7 0.
7 So
urce
: SAI
C an
d SD
EC d
ata
and
Cent
inel
a EB
T tr
ansa
ctio
n da
ta
Not
e Fo
r eac
h re
taile
r cat
egor
y, th
e sa
mpl
e in
clud
es th
e m
onth
ly c
ycle
s of u
nits
onl
y w
hen
units
shop
at t
hat s
tore
type
dur
ing
that
mon
th. T
he m
inim
um d
istan
ces r
efle
ct th
e av
erag
e m
inim
um d
istan
ce
acro
ss a
ll un
it-cy
cles
that
con
trib
uted
to th
e sa
mpl
e. T
here
fore
, alth
ough
a u
nit m
ay h
ave
12 u
nit-
cycl
es in
the
data
, the
uni
t may
con
trib
ute
few
er (o
r no)
obs
erva
tions
to sp
ecifi
c re
taile
r su
bcat
egor
ies.
As a
resu
lt, th
e sa
mpl
e siz
e an
d co
mpo
sitio
n ar
e di
ffere
nt fo
r eac
h re
taile
r sub
cate
gory
. The
figu
res i
n th
e “a
ll re
taile
r” c
ateg
ory
vary
slig
htly
from
figu
re IV
.1 b
ecau
se th
is ta
ble
incl
udes
on
ly u
nits
that
mad
e pu
rcha
ses e
ach
mon
th.

Exa
min
atio
n of
Cas
h N
utrit
ion
Ass
ista
nce
Pro
gram
Ben
efits
in P
uerto
Ric
o
Pag
e B
-19
Tabl
e B.
4.b.
Av
erag
e Tr
ansa
ctio
n Am
ount
and
Ave
rage
Tot
al M
onth
ly R
edem
ptio
n by
Sto
re T
ype
Stor
e Ty
pe
Aver
age
Tran
sact
ion
Amou
nt ($
) To
tal M
onth
ly
Rede
mpt
ion
($)
Aver
age
Tran
sact
ion
Amou
nt
Am
ong
Uni
ts W
ith P
ositi
ve
Num
ber o
f Tra
nsac
tions
($)
Tota
l Mon
thly
Re
dem
ptio
n
Amon
g U
nits
With
Po
sitiv
e N
umbe
r of
Tran
sact
ions
($)
All r
etai
lers
60
.41
178.
04
61.1
1 18
0.12
Su
perm
arke
ts, s
uper
stor
es, l
arge
gro
cery
stor
es
60.7
2 13
4.24
61
.43
146.
78
Smal
l and
med
ium
gro
cery
stor
es
8.63
13
.27
8.73
64
.68
Larg
e ge
nera
l sto
res,
larg
e co
mbo
stor
es, w
hole
sale
rs
16.0
3 25
.93
16.2
2 76
.12
Conv
enie
nce
or sm
all c
ombo
stor
es
1.48
2.
08
1.49
58
.17
Oth
er st
ores
1.
62
2.52
1.
64
25.5
0 So
urce
: SAI
C an
d SD
EC d
ata
and
Cent
inel
a EB
T tr
ansa
ctio
n da
ta
Not
e Da
ta o
n w
hich
est
imat
es a
re b
ased
exc
lude
tran
sact
ions
from
the
mon
th o
f Jun
e be
caus
e da
ta fo
r the
full
cycl
e, w
hich
end
ed in
July
201
4, a
re n
ot a
vaila
ble.

Exa
min
atio
n of
Cas
h N
utrit
ion
Ass
ista
nce
Pro
gram
Ben
efits
in P
uerto
Ric
o
Pag
e B
-20
Tabl
e B.
4.c.
Av
erag
e N
umbe
r of C
ash
Tran
sact
ions
, Ave
rage
Cas
h Tr
ansa
ctio
n Am
ount
, And
Av
erag
e To
tal M
onth
ly C
ash
Rede
mpt
ion
by U
nit S
ubgr
oup
and
Tran
sact
ion
Type
Perc
enta
ge o
f Uni
ts (a
vera
ge a
cros
s all
mon
ths)
Perc
enta
ge o
f Ben
efit
All U
nits
Uni
ts W
ith
Elde
rly
Mem
bers
Uni
ts W
ith
Non
elde
rly
Mem
bers
W
ith
Disa
bilit
ies
Uni
ts W
ith
Chi
ldre
n U
nits
With
out
Inco
me
Aver
age
Num
ber o
f Tra
nsac
tions
per
Uni
t
All c
ash
tran
sact
ions
1.
4 1.
3 1.
4 1.
6 1.
4 EB
T fo
od p
urch
ases
with
cas
h po
rtio
n 0.
5 0.
6 0.
6 0.
5 0.
6 Ca
sh w
ithdr
awal
s at A
TM
0.5
0.3
0.4
0.7
0.4
Cash
with
draw
als a
t ret
aile
r 0.
4 0.
4 0.
4 0.
4 0.
4
Av
erag
e Tr
ansa
ctio
n Am
ount
($)
Al
l cas
h tr
ansa
ctio
ns
46.4
0 40
.07
42.3
4 65
.38
41.4
3 EB
T fo
od p
urch
ases
with
cas
h po
rtio
n 15
.63
15.9
2 14
.77
18.6
2 14
.94
Cash
with
draw
als a
t ATM
20
.92
10.1
4 17
.65
39.8
3 16
.09
Cash
with
draw
als a
t ret
aile
r 17
.18
17.0
2 16
.07
22.1
5 15
.61
Tota
l Mon
thly
Red
empt
ion
($)
Al
l cas
h tr
ansa
ctio
ns
59.1
7 46
.25
53.1
7 90
.72
50.8
9 EB
T fo
od p
urch
ases
with
cas
h po
rtio
n 17
.30
17.4
9 16
.43
20.8
3 16
.45
Cash
with
draw
als a
t ATM
23
.58
10.8
5 19
.59
45.9
7 17
.93
Cash
with
draw
als a
t ret
aile
r 18
.29
17.9
1 17
.15
23.9
3 16
.51
Sour
ce: S
AIC
data
and
Cen
tinel
a EB
T tr
ansa
ctio
n da
ta
Not
es
Data
on
whi
ch e
stim
ates
are
bas
ed e
xclu
de tr
ansa
ctio
ns fr
om th
e m
onth
of J
une
beca
use
data
for t
he fu
ll cy
cle,
whi
ch e
nded
in Ju
ly 2
014,
is n
ot a
vaila
ble.
The
aver
age
tran
sact
ion
amou
nts w
ere
calc
ulat
ed fi
rst a
t the
uni
t-cy
cle
leve
l. Th
e av
erag
e tr
ansa
ctio
n am
ount
s in
this
tabl
e re
pres
ent t
he m
ean
acro
ss a
ll un
it cy
cles
.

Exa
min
atio
n of
Cas
h N
utrit
ion
Ass
ista
nce
Pro
gram
Ben
efits
in P
uerto
Ric
o
Pag
e B
-21
Tabl
e B.
4.d.
Av
erag
e Ca
sh T
rans
actio
n Am
ount
by
Uni
t Sub
grou
ps a
nd T
rans
actio
n Ty
pe In
clud
ing
and
Excl
udin
g U
nits
With
Zer
o Tr
ansa
ctio
ns
U
nit S
ubgr
oups
(ave
rage
acr
oss a
ll m
onth
s)
Type
of T
rans
actio
n Al
l Uni
ts
Uni
ts W
ith
Elde
rly
Mem
bers
Uni
ts W
ith
Non
elde
rly
Mem
bers
W
ith
Disa
bilit
ies
Uni
ts W
ith
Child
ren
Uni
ts W
ithou
t In
com
e Al
l Cas
h Tr
ansa
ctio
ns ($
)
Incl
udin
g un
its w
ith ze
ro tr
ansa
ctio
ns in
m
onth
46
.40
40.0
7 42
.34
65.3
8 41
.43
Excl
udin
g un
its w
ith ze
ro tr
ansa
ctio
ns in
m
onth
46
.40
40.0
7 42
.34
65.3
8 41
.43
EBT
Food
Pur
chas
es W
ith C
ash
Port
ion
($)
In
clud
ing
units
with
zero
tran
sact
ions
in
mon
th
15.6
3 15
.92
14.7
7 18
.62
14.9
4 Ex
clud
ing
units
with
zero
tran
sact
ions
in
mon
th
33.4
5 33
.06
30.9
0 42
.08
31.5
0
Ca
sh W
ithdr
awal
s at A
TM ($
)
Incl
udin
g un
its w
ith ze
ro tr
ansa
ctio
ns in
m
onth
20
.92
10.1
4 17
.65
39.8
3 16
.09
Excl
udin
g un
its w
ith ze
ro tr
ansa
ctio
ns in
m
onth
55
.57
42.3
7 49
.74
74.0
6 48
.37
Cash
With
draw
als a
t Ret
aile
r ($)
Incl
udin
g un
its w
ith ze
ro tr
ansa
ctio
ns in
m
onth
17
.18
17.0
2 16
.07
22.1
5 15
.61
Excl
udin
g un
its w
ith ze
ro tr
ansa
ctio
ns in
m
onth
44
.94
41.5
8 42
.62
59.6
6 41
.00
Sour
ce: S
AIC
data
and
Cen
tinel
a EB
T tr
ansa
ctio
n da
ta
Not
es
Data
on
whi
ch e
stim
ates
are
bas
ed e
xclu
de tr
ansa
ctio
ns fr
om th
e m
onth
of J
une
beca
use
data
for t
he fu
ll cy
cle,
whi
ch e
nded
in Ju
ly 2
014,
are
not
ava
ilabl
e.
The
aver
age
tran
sact
ion
amou
nts w
ere
calc
ulat
ed fi
rst a
t the
uni
t-cy
cle
leve
l. Th
e av
erag
e tr
ansa
ctio
n am
ount
s in
this
tabl
e re
pres
ent t
he m
ean
acro
ss a
ll un
it cy
cles
.

Examination of Cash Nutrition Assistance Program Benefits in Puerto Rico
Page B-22
Table B.4.e. Average Number of Transactions, Average Transaction Amount,
And Average Total Monthly Redemption by Level of Access (Defined by the Median Distance to Supermarkets, Superstores, and Large Grocery Stores)
Level of Access
Average Number of Transactions
Per Unit
Average Transaction Amount ($)
Total Monthly Redemption ($)
All Cash Purchases All units 1.4 46.40 59.17 Units with greater geographic access 1.4 46.27 59.09 Units with less geographic access 1.4 47.66 59.95
EBT Food Purchases With Cash Portion
All units 0.5 15.63 17.30 Units with greater geographic access 0.6 15.76 17.44 Units with less geographic access 0.5 14.38 15.94
Cash Withdrawals at ATM
All units 0.5 20.92 23.58 Units with greater geographic access 0.5 20.92 23.60 Units with less geographic access 0.4 20.93 23.37
Cash Withdrawals at Retailer
All units 0.4 17.18 18.29 Units with greater geographic access 0.4 16.96 18.04 Units with less geographic access 0.4 19.34 20.64
Source: SAIC and SDEC data and Centinela EBT transaction data. Notes Data on which estimates are based exclude transactions from the month of June because data for the full cycle, which ended in July 2014, are not available. Average transaction amounts were calculated first at the unit-cycle level. The average transaction amounts in this table represent the mean across all unit cycles.

Exa
min
atio
n of
Cas
h N
utrit
ion
Ass
ista
nce
Pro
gram
Ben
efits
in P
uerto
Ric
o
Pag
e B
-23
Tabl
e B.
4.f.
Dist
ribut
ion
of A
vera
ge N
umbe
r of M
onth
ly T
rans
actio
ns p
er U
nit b
y Tr
ansa
ctio
n Ty
pe
All T
rans
actio
ns
Non
cash
Por
tion
Tran
sact
ions
Tot
al
Cash
Por
tion
Tran
sact
ions
Tot
al
Cash
Por
tion
Rede
mpt
ion
EB
T Fo
od P
urch
ases
W
ith C
ash
Port
ion
Cash
With
draw
als
at R
etai
ler
Cash
With
draw
als
at A
TM
Mea
n
5.58
4.
16
1.42
0.
55
0.42
0.
45
Stan
dard
Dev
iatio
n
3.65
3.
39
0.74
0.
68
0.56
0.
66
10th
Per
cent
ile
2 1
1 0
0 0
25th
Per
cent
ile
3 2
1 0
0 0
50th
Per
cent
ile
5 3
1 0
0 0
75th
Per
cent
ile
7 5
2 1
1 1
90th
Per
cent
ile
10
8 2
1 1
1 So
urce
: Cen
tinel
a EB
T tr
ansa
ctio
n da
ta
Not
e
Data
on
whi
ch e
stim
ates
are
bas
ed e
xclu
de tr
ansa
ctio
ns fr
om th
e m
onth
of J
une
beca
use
data
for t
he fu
ll cy
cle,
whi
ch e
nded
in Ju
ly 2
014,
are
not
ava
ilabl
e.

Examination of Cash Nutrition Assistance Program Benefits in Puerto Rico
Page B-24
Table B.4.g. Minimum Percentage of Total NAP Monthly Benefit (Cash and Noncash) Redeemed For EBT Food Purchases at a Certified Retailer by Unit-Month
Minimum Percentage of Benefit Spent on Food Purchases Percentage of Units Cumulative Percentage of Units 100 percent 30.3 30.3 95–<100 percent 0.9 31.2 90–95 percent 0.6 31.8 85–90 percent 1.1 32.9 80–85 percent 3.2 36.1 75–80 percent 44.4 80.5 70–75 percent 18.0 98.6 0–70 percent 1.4 100.0 Source: Centinela EBT transaction data Notes This table excludes transactions from the month of June because data for the full cycle, which ended in July 2014, are not available. The calculations in this table are based on the total benefit amount each unit redeemed each month. The monthly redemption amount excludes any unspent issuance and includes the spending of carryover benefits from previous months.

Examination of Cash Nutrition Assistance Program Benefits in Puerto Rico
Page B-25
Figure B.4.a. Average Cash Transaction Amount
Source: SAIC data and Centinela EBT transaction data Note Data on which these estimates exclude transactions from the month of June because data for the full cycle, which ended in July 2014, are not available. ATM fees are excluded from the average transaction amount.

Examination of Cash Nutrition Assistance Program Benefits in Puerto Rico
Page B-26
Figure B.4.b. Number of Cash Transactions Made per Month by Unit-Month
Source: Centinela EBT transaction data Note ATM fees are not counted as transactions in this figure.

Examination of Cash Nutrition Assistance Program Benefits in Puerto Rico
Page B-27
Table B.4.h. Cumulative Percentage of Cash Portion Redeemed by Week and by Unit Subgroups
Unit Subgroup Day 1 Day 7 Day 14 Day 21 End of Month All units 52.3 87.9 94.9 97.7 99.4 Units with children 61.9 91.4 96.4 98.4 99.7 Units without children 47.4 86.0 94.1 97.3 99.2 Units with elderly
members 43.5 85.0 93.8 97.4 99.5 Units without elderly
members 57.0 89.4 95.4 97.8 99.4 Units with nonelderly
members with disabilities 53.8 88.6 95.4 98.0 99.6
Units without nonelderly members with disabilities 52.0 87.7 94.8 97.6 99.4
Units with income 55.8 89.4 95.6 98.2 99.8 Units without income 50.5 87.0 94.5 97.4 99.2 Source: SAIC and SDEC data and Centinela EBT transaction data Notes
This table excludes data from August and September 2013 because NAP participants received benefit bonuses at the end of these months, increasing the proportions of benefits remaining for these units mid-month. June 2014 data are included in this table for the portion of the cycle that we have transaction information for a given unit. The data for the end of the month exclude all June unit-cycles because all June unit-cycles end in July. All cash transactions, including ATM fees, are included in the percentage of benefits redeemed.

Exa
min
atio
n of
Cas
h N
utrit
ion
Ass
ista
nce
Pro
gram
Ben
efits
in P
uerto
Ric
o
Pag
e B
-28
B.5
. N
AP
CA
SH B
ENEF
ITS
HO
USE
HO
LD S
UR
VEY
TAB
LES
Tabl
e B.
5.a.
Pa
rtic
ipan
t Dec
isio
ns o
n W
here
To
Shop
U
nit L
ocat
ion
U
nit C
hara
cter
istic
Tota
l U
rban
Ru
ral
Uni
ts
With
Ze
ro
Inco
me
Uni
ts
With
N
on-
Zero
In
com
e
Uni
ts W
ith
Non
elde
rly
Mem
bers
W
ith
Disa
bilit
ies
Uni
ts
With
El
derly
M
embe
rs
Uni
ts
With
Si
ngle
M
othe
rs
With
Ch
ildre
n N
umbe
r of R
espo
nden
ts (N
) 63
0,48
7 60
0,26
0 30
,228
41
0,43
5 22
0,05
3 13
1,83
3 22
9,33
7 12
0,63
6
At w
hat k
ind
of st
ore
do y
ou b
uy m
ost o
f you
r foo
d?
Supe
rmar
kets
, sup
erst
ore,
or l
arge
gro
cery
90
.0
90.0
92
.2
90.3
89
.3
90.0
92
.7
89.0
La
rge
com
bina
tion
stor
e, w
hole
sale
r, or
larg
e ge
nera
l sto
re
9.3
9.3
7.5
8.9
9.9
10.0
5.
8 11
.0
Smal
l or m
ediu
m g
roce
ry
0.8
0.8
0.3
0.8
0.8
0.0
1.5
0.0
Does
this
stor
e ac
cept
you
r Fam
ily C
ard?
Ye
s 10
0.0
100.
0 10
0.0
100.
0 10
0.0
100.
0 10
0.0
100.
0 N
o 0.
0 0.
0 0.
0 0.
0 0.
0 0.
0 0.
0 0.
0
Do y
ou sh
op a
t sto
res t
hat d
o no
t acc
ept y
our F
amily
Car
d us
ing
your
25-
perc
ent c
ash
port
ion
of y
our b
enef
it?
Yes
7.7
7.7
4.6
8.5
6.1
3.7
8.0
8.2
No
92.3
92
.3
95.4
91
.5
93.9
96
.3
92.0
91
.8
[If Y
es:]
At w
hat k
ind
of st
ore
(tha
t doe
s not
acc
ept y
our
Fam
ily C
ard)
do
you
use
your
25-
perc
ent c
ash
port
ion?
La
rge
com
bina
tion
stor
e, w
hole
sale
r, or
larg
e ge
nera
l sto
re
39.3
39
.3
25.0
38
.1
42.8
33
.3
36.3
60
.0
Smal
l or m
ediu
m g
roce
ry
17.9
17
.9
25.0
23
.8
0.1
0.0
18.2
0.
0 Co
nven
ienc
e or
smal
l com
bina
tion
stor
e (e
.g.,
gas
stat
ion/
conv
enie
nce)
14
.3
14.3
18
.8
14.3
14
.3
0.0
27.3
20
.0
Oth
er sm
all v
endo
r (fa
rmer
s' m
arke
t, ba
kery
, hea
lth fo
od,
frui
t and
veg
etab
le st
and,
or s
peci
alty
food
s)
28.6
28
.6
31.3
23
.8
42.8
66
.7
18.2
20
.0

Exa
min
atio
n of
Cas
h N
utrit
ion
Ass
ista
nce
Pro
gram
Ben
efits
in P
uerto
Ric
o
Pag
e B
-29
Tabl
e B.
5.a.
(con
tinue
d)
Part
icip
ant D
ecis
ions
on
Whe
re T
o Sh
op
U
nit L
ocat
ion
U
nit C
hara
cter
istic
Tota
l U
rban
Ru
ral
Uni
ts
With
Ze
ro
Inco
me
Uni
ts
With
N
on-Z
ero
Inco
me
Uni
ts W
ith
Non
elde
rly
Mem
bers
W
ith
Disa
bilit
ies
Uni
ts
With
El
derly
M
embe
rs
Uni
ts
With
Si
ngle
M
othe
rs
With
Ch
ildre
n U
sing
a sc
ale
of 1
to 5
, how
impo
rtan
t are
the
follo
win
g fa
ctor
s in
you
r dec
isio
n of
whe
re to
shop
for f
ood?
(1–n
ot a
t all
impo
rtan
t, 5–
very
impo
rtan
t) (v
alue
s sho
wn
are
aver
age
ratin
gs)
The
stor
e m
ust a
ccep
t you
r Fam
ily C
ard
5
5 5
5
5
5 5
5 Th
e st
ore
carr
ies e
noug
h fo
od a
nd a
var
iety
of p
rodu
cts f
or
your
nee
ds
5
5 5
5
5
5 5
5 Th
e st
ore
has l
ow p
rices
5
5
5
5 5
5
5 5
The
stor
e ha
s hig
h-qu
ality
food
5
5
5
5 5
5
5 5
The
stor
e is
easy
to g
et to
5
5
5
5 5
5
5 5
The
stor
e ca
n ac
com
mod
ate
any
spec
ial n
eeds
you
hav
e su
ch
as w
heel
chai
r ram
ps a
nd w
ide
aisle
s 5
5
5
5 5
5
5 5
Have
you
eve
r bee
n un
able
to s
pend
all
of y
our N
AP b
enef
its?
Yes
7.1
7.1
7.3
9.3
3.1
6.2
6.6
5.5
No
92.9
92.9
92
.7
90
.7
96.9
93.8
93
.4
94.5
Not
e Sa
mpl
e siz
es v
ary
due
to n
onre
spon
se a
nd lo
gica
l ski
ps.

Exa
min
atio
n of
Cas
h N
utrit
ion
Ass
ista
nce
Pro
gram
Ben
efits
in P
uerto
Ric
o
Pag
e B
-30
Tabl
e B.
5.b.
Ac
cess
to C
ertif
ied
Reta
ilers
and
Use
of E
BT B
enef
its
Uni
t Loc
atio
n
Uni
t Cha
ract
eris
tic
To
tal
Urb
an
Rura
l
Uni
ts
With
Ze
ro
Inco
me
Uni
ts
With
N
on-Z
ero
Inco
me
Uni
ts W
ith
Non
elde
rly
Mem
bers
W
ith
Disa
bilit
ies
Uni
ts
With
El
derly
M
embe
rs
Uni
ts
With
Si
ngle
M
othe
rs
With
Ch
ildre
n N
umbe
r of R
espo
nden
ts (N
) 63
0,48
7
600,
260
30,2
28
41
0,43
5 22
0,05
3
131,
833
229,
337
120,
636
How
freq
uent
ly d
o yo
u sh
op fo
r foo
d at
the
stor
e w
here
you
use
you
r Fam
ily C
ard?
O
nce
a w
eek
or m
ore
14.1
14
.1
5.9
13.5
15
.2
15.2
16
.8
5.5
Abou
t onc
e ev
ery
2–3
wee
ks
34.0
34
.0
33.9
33
.9
34.4
25
.3
35.8
43
.8
Abou
t onc
e a
mon
th
51.9
51
.9
60.2
52
.7
50.4
59
.5
47.5
50
.7
How
do
you
usua
lly g
et to
the
stor
e w
here
you
use
yo
ur F
amily
Car
d?
Driv
e to
the
stor
e 45
.0
45.0
47
.9
37.3
59
.5
37.5
35
.0
50.7
Ge
t a ri
de w
ith so
meo
ne
44.2
44
.2
46.0
50
.2
32.8
51
.3
51.8
41
.1
Publ
ic tr
ansp
orta
tion/
Wal
k/So
me
othe
r way
10
.8
10.9
6.
2 12
.5
7.6
11.2
13
.1
8.2
How
eas
y or
diff
icul
t wou
ld y
ou sa
y it
is fo
r you
to g
et
ther
e?
Very
/Som
ewha
t eas
y 90
.9
90.9
90
.0
90.2
92
.3
89.9
93
.4
90.4
Ve
ry/S
omew
hat d
iffic
ult
9.1
9.1
10.0
9.
8 7.
7 10
.1
6.6
9.6
Wha
t ite
ms d
id y
ou b
uy in
the
last
30
days
usi
ng y
our
Fam
ily C
ard?
Pe
risha
ble
food
(e.g
., fr
esh
frui
ts o
r veg
etab
les)
98
.7
98.7
99
.2
99.2
97
.7
98.8
10
0 97
.3
Prep
ared
food
(e.g
., sa
ndw
iche
s, sa
lad
bar)
4.
5 4.
5 5.
1 4.
1 5.
3 3.
8 2.
2 6.
9 N
onpe
risha
ble
food
(e.g
., ca
nned
food
, drie
d be
ans)
95
.2
95
.2
96.8
94.3
97
.0
96
.3
92.7
96
N
ote
Sam
ple
sizes
var
y du
e to
non
resp
onse
and
logi
cal s
kips
.

Exa
min
atio
n of
Cas
h N
utrit
ion
Ass
ista
nce
Pro
gram
Ben
efits
in P
uerto
Ric
o
Pag
e B
-31
Tabl
e B.
5.c.
Ac
cess
to N
once
rtifi
ed R
etai
lers
U
nit L
ocat
ion
U
nit C
hara
cter
istic
To
tal
Resp
onde
nts
U
rban
Ru
ral
Uni
ts
With
Ze
ro
Inco
me
Uni
ts
With
N
on-
Zero
In
com
e
Uni
ts W
ith
Non
elde
rly
Mem
bers
W
ith
Disa
bilit
ies
Uni
ts
With
El
derly
M
embe
rs
Uni
ts
With
Si
ngle
M
othe
rs
With
Ch
ildre
n N
umbe
r of R
espo
nden
ts (N
) 63
0,48
7
600,
260
30,2
28
41
0,43
5 22
0,05
3
131,
833
229,
337
120,
636
Of t
hose
indi
vidu
als w
ho in
dica
ted
they
use
the
cash
po
rtio
n of
the
bene
fits a
t non
cert
ified
stor
es .
. .
How
freq
uent
ly d
o yo
u sh
op a
t thi
s sto
re?
Onc
e a
wee
k or
mor
e 14
.8
14.8
11
.8
21.1
0.
0 66
.7
0.0
16.7
Ab
out o
nce
ever
y 2–
3 w
eeks
37
.0
37.0
23
.5
26.3
62
.5
33.3
30
.0
50.0
Ab
out o
nce
a m
onth
48
.2
48.2
64
.7
52.7
37
.5
0.0
70.0
33
.3
How
do
you
usua
lly g
et to
this
stor
e?
Dr
ive
to th
e st
ore
41.4
41
.4
41.2
33
.3
62.5
0.
0 36
.4
50.0
Ge
t a ri
de w
ith so
meo
ne
31.1
31
.0
47.1
33
.4
25.0
33
.3
27.3
50
.0
Publ
ic tr
ansp
orta
tion/
Wal
k/So
me
othe
r way
27
.6
27.6
11
.8
33.3
12
.5
66.7
36
.3
0.0
How
eas
y or
diff
icul
t wou
ld y
ou sa
y it
is fo
r you
to
get t
here
?
Very
/Som
ewha
t eas
y 93
.1
93.1
94
.1
90.5
10
0.0
66.7
10
0.0
66.7
Ve
ry/S
omew
hat d
iffic
ult
6.9
6.
9 5.
9
9.5
0.0
33
.3
0.0
33.3
N
ote
Sam
ple
sizes
var
y du
e to
non
resp
onse
and
logi
cal s
kips
.

Exa
min
atio
n of
Cas
h N
utrit
ion
Ass
ista
nce
Pro
gram
Ben
efits
in P
uerto
Ric
o
Pag
e B
-32
Tabl
e B.
5.d.
Ac
cess
to C
ash
Port
ion
of B
enef
its
U
nit L
ocat
ion
U
nit C
hara
cter
istic
To
tal
Resp
onde
nts
U
rban
Ru
ral
Uni
ts
With
Ze
ro
Inco
me
Uni
ts
With
N
on-
Zero
In
com
e
Uni
ts W
ith
Non
elde
rly
Mem
bers
W
ith
Disa
bilit
ies
Uni
ts
With
El
derly
M
embe
rs
Uni
ts
With
Si
ngle
M
othe
rs
With
Ch
ildre
n N
umbe
r of R
espo
nden
ts (N
) 63
0,48
7
600,
260
30,2
28
41
0,43
5 22
0,05
3 13
1,83
3 22
9,33
7 12
0,63
6
In th
e pa
st 3
0 da
ys, d
id y
ou g
et c
ash
back
from
a
stor
e w
hen
you
used
you
r Fam
ily C
ard?
Ye
s 51
.5
51.5
53
.5
53.7
47
.3
49.4
61
.5
47.3
N
o 48
.5
48.5
46
.5
46.3
52
.7
50.6
38
.5
52.8
In th
e pa
st 3
0 da
ys, d
id y
ou g
et c
ash
back
from
an
ATM
whe
n yo
u us
ed y
our F
amily
Car
d?
Yes
22.2
22
.2
18.1
19
.2
27.9
16
.5
14.7
37
.5
No
77.8
77
.8
81.9
80
.8
72.1
83
.5
85.3
62
.5
In th
e pa
st 3
0 da
ys, d
id y
ou g
et c
ash
back
from
ei
ther
an
ATM
or a
stor
e us
ing
your
Fam
ily C
ard?
Ye
s 65
.3
65.3
61
.3
65.2
65
.7
56.3
67
.9
68.5
N
o 34
.7
34.7
38
.7
34.8
34
.4
43.7
32
.1
31.5
[Yes
to Q
15 o
r Q16
:] Ea
ch m
onth
, how
muc
h of
th
e av
aila
ble
cash
por
tion
of y
our b
enef
it do
yo
u ty
pica
lly w
ithdr
aw a
s cas
h?
All
76.6
76
.6
77.9
78
.7
72.6
74
.4
80.4
68
.0
Som
e 23
.4
23.4
22
.1
21.3
27
.4
25.6
19
.6
32.0

Exa
min
atio
n of
Cas
h N
utrit
ion
Ass
ista
nce
Pro
gram
Ben
efits
in P
uerto
Ric
o
Pag
e B
-33
Tabl
e B.
5.d.
(con
tinue
d)
Acce
ss to
Cas
h Po
rtio
n of
Ben
efits
Uni
t Loc
atio
n
Uni
t Cha
ract
eris
tic
To
tal
Resp
onde
nts
U
rban
Ru
ral
Uni
ts
With
Ze
ro
Inco
me
Uni
ts
With
N
on-Z
ero
Inco
me
Uni
ts W
ith
Non
elde
rly
Mem
bers
W
ith
Disa
bilit
ies
Uni
ts
With
El
derly
M
embe
rs
Uni
ts
With
Si
ngle
M
othe
rs
With
Ch
ildre
n Is
it d
iffic
ult f
or y
ou to
get
cas
h us
ing
your
Fam
ily
Card
? Al
way
s/O
ften
4.
5 4.
5 3.
5 3.
7 5.
8 0.
0 4.
3 8.
0 So
met
imes
13
.4
13.4
12
.4
14.9
10
.5
17.8
8.
6 16
.0
Nev
er
82.2
82
.2
84.1
81
.4
83.7
82
.2
87.1
76
.0
Do y
ou sp
end
the
cash
por
tion
of y
our c
ard
at a
stor
e th
at a
ccep
ts y
our F
amily
Car
d?
Alw
ays
63.3
63
.3
66.2
61
.7
66.3
66
.7
73.6
54
.0
Oft
en
9.4
9.4
7.9
9.4
9.3
11.1
5.
5 16
.0
Som
etim
es
22.0
22
.0
18.9
23
.3
19.8
17
.8
17.6
28
.0
Nev
er
5.3
5.
3 7.
0
5.7
4.7
4.
5 3.
3 2.
0 N
ote
Sam
ple
sizes
var
y du
e to
non
resp
onse
and
logi
cal s
kips
.

Exa
min
atio
n of
Cas
h N
utrit
ion
Ass
ista
nce
Pro
gram
Ben
efits
in P
uerto
Ric
o
Pag
e B
-34
Tabl
e B.
5.e.
U
se o
f Cas
h Po
rtio
n of
Ben
efits
U
nit L
ocat
ion
U
nit C
hara
cter
istic
To
tal
Resp
onde
nts
U
rban
Ru
ral
Uni
ts
With
Ze
ro
Inco
me
Uni
ts
With
N
on-
Zero
In
com
e
Uni
ts W
ith
Non
elde
rly
Mem
bers
W
ith
Disa
bilit
ies
Uni
ts
With
El
derly
M
embe
rs
Uni
ts
With
Si
ngle
M
othe
rs
With
Ch
ildre
n N
umbe
r of R
espo
nden
ts (N
) 63
0,48
7
600,
260
30,2
28
41
0,43
5 22
0,05
3
131,
833
229,
337
120,
636
Of t
hose
indi
vidu
als w
ho g
ot c
ash
back
from
a st
ore
or a
n AT
M w
hen
usin
g th
eir F
amily
Car
d . .
.
In th
e la
st 3
0 da
ys w
hat i
tem
s or s
ervi
ces d
id y
ou
purc
hase
with
the
cash
you
with
drew
? Di
d yo
u pu
rcha
se
. . .
(sel
ect a
ll th
at a
pply
) . .
. pe
risha
ble
food
(e.g
., fr
esh
frui
ts o
r veg
etab
les,
m
eat,
brea
d)
62.0
62
.0
68.4
57
.6
70.2
65
.1
61.1
67
.4
. . .
pre
pare
d fo
od (e
.g.,
sand
wic
hes,
sala
d ba
r)
11.2
11
.2
12.3
12
.7
8.4
4.7
12.2
14
.3
. . .
non
peris
habl
e fo
od (e
.g.,
cann
ed fo
od, d
ried
bean
s)
51.7
51
.7
62.7
48
.8
57.2
44
.2
50.0
61
.2
. . .
med
icin
e 15
.3
15.3
17
.5
13.3
19
.1
9.3
10.0
22
.5
. . .
dia
pers
7.
0 7.
0 8.
3 5.
7 9.
5 0.
0 3.
3 18
.4
. . .
clo
thin
g 2.
9 2.
9 0.
9 3.
8 1.
2 2.
3 2.
2 0.
0 .
. . h
ousin
g co
sts
12.4
12
.4
14.5
8.
2 20
.2
4.7
10.0
16
.4
. . .
gas
olin
e 7.
4 7.
4 6.
6 7.
0 8.
3 4.
7 6.
7 4.
1 .
. . se
rvic
es su
ch a
s chi
ldca
re, m
edic
al c
are
5.0
5.0
5.3
4.4
6.0
0.0
5.6
8.2
. . .
alc
ohol
or c
igar
ette
s 0.
0 0.
0 0.
0 0.
0 0.
0 0.
0 0.
0 0.
0 .
. . c
lean
ing
supp
lies
70.2
70
.3
68.4
71
.5
67.9
55
.8
73.3
75
.5
. . .
per
sona
l hyg
iene
item
s (sh
ampo
o an
d de
odor
ant)
62
.4
62.4
60
.1
65.2
57
.2
48.9
61
.1
63.3
In th
e la
st 3
0 da
ys, h
ow m
uch
of th
e ca
sh th
at y
ou
with
drew
did
you
spen
d on
food
? Al
l 49
.4
49.4
51
.1
52.3
44
.1
64.3
58
.0
36.7
So
me
31.8
31
.8
29.1
29
.0
36.9
21
.4
22.7
51
.0
Non
e 18
.8
18
.8
19.8
18.7
19
.1
14
.3
19.3
12
.3
Not
e Sa
mpl
e siz
es v
ary
due
to n
onre
spon
se a
nd lo
gica
l ski
ps.

Exa
min
atio
n of
Cas
h N
utrit
ion
Ass
ista
nce
Pro
gram
Ben
efits
in P
uerto
Ric
o
Pag
e B
-35
Tabl
e B.
5.e.
1 U
se o
f Cas
h Po
rtio
n of
Ben
efits
by
Perc
ent o
f Tot
al N
AP P
artic
ipan
ts
Uni
t Loc
atio
n
Uni
t Cha
ract
eris
tic
To
tal
Resp
onde
nts
U
rban
Ru
ral
Uni
ts
With
Ze
ro
Inco
me
Uni
ts
With
N
on-
Zero
In
com
e
Uni
ts W
ith
Non
elde
rly
Mem
bers
W
ith
Disa
bilit
ies
Uni
ts
With
El
derly
M
embe
rs
Uni
ts
With
Si
ngle
M
othe
rs
With
Ch
ildre
n N
umbe
r of R
espo
nden
ts (N
) 63
0,48
7
600,
260
30,2
28
41
0,43
5 22
0,05
3
131,
833
229,
337
120,
636
(Per
cent
s of t
otal
NAP
par
ticip
ants
) In
the
last
30
days
wha
t ite
ms o
r ser
vice
s did
you
pu
rcha
se w
ith th
e ca
sh y
ou w
ithdr
ew?
Did
you
purc
hase
. .
. (s
elec
t all
that
app
ly)
. . .
per
ishab
le fo
od (e
.g.,
fres
h fr
uits
or v
eget
able
s,
mea
t, br
ead)
41
.0
41.0
41
.9
38.0
46
.6
37.5
42
.3
46.6
.
. . p
repa
red
food
(e.g
., sa
ndw
iche
s, sa
lad
bar)
7.
7 7.
7 7.
5 8.
5 6.
1 2.
5 9.
5 9.
6 .
. . n
onpe
risha
ble
food
(e.g
., ca
nned
food
, drie
d be
ans)
33
.4
33.3
38
.4
31.2
37
.4
23.8
33
.6
41.1
.
. . m
edic
ine
10.1
10
.1
10.8
8.
9 12
.2
6.3
7.3
15.1
.
. . d
iape
rs
4.8
4.8
5.1
3.6
6.9
0.0
2.2
13.7
.
. . c
loth
ing
1.9
1.9
0.5
2.4
0.8
1.3
1.5
0.0
. . .
hou
sing
cost
s 8.
2 8.
2 8.
9 5.
3 13
.7
2.5
6.6
12.4
.
. . g
asol
ine
5.0
5.0
4.0
4.9
5.4
3.8
4.4
2.8
. . .
serv
ices
such
as c
hild
care
, med
ical
car
e 3.
2 3.
2 3.
2 2.
8 3.
8 0.
0 3.
7 5.
5 .
. . a
lcoh
ol o
r cig
aret
tes
0.0
0.0
0.0
0.0
0.0
0.0
0.0
0.0
. . .
cle
anin
g su
pplie
s 46
.3
46.3
41
.9
46.9
45
.0
32.5
50
.3
52.1
.
. . p
erso
nal h
ygie
ne it
ems (
sham
poo
and
deod
oran
t)
41.0
41
.0
36.8
42
.9
37.4
28
.8
41.6
43
.9
In th
e la
st 3
0 da
ys, h
ow m
uch
of th
e ca
sh th
at y
ou
with
drew
did
you
spen
d on
food
? Al
l 32
.3
32.3
31
.2
33.6
29
.8
35.0
38
.7
26.0
So
me
20.9
20
.9
18.0
19
.4
23.7
13
.7
16.1
34
.3
Non
e 12
.2
12
.2
12.1
12.2
12
.2
7.
5 13
.1
8.2
Part
icip
ants
did
not
with
draw
cas
h 34
.7
34
.7
38.7
34.8
34
.4
43
.7
32.1
31
.5
Not
e Sa
mpl
e siz
es v
ary
due
to n
onre
spon
se a
nd lo
gica
l ski
ps.

Exa
min
atio
n of
Cas
h N
utrit
ion
Ass
ista
nce
Pro
gram
Ben
efits
in P
uerto
Ric
o
Pag
e B
-36
Tabl
e B.
5.f.
Impa
ct o
f Rem
ovin
g Ca
sh P
ortio
n of
Ben
efits
U
nit L
ocat
ion
U
nit C
hara
cter
istic
To
tal
Resp
onde
nts
U
rban
Ru
ral
Uni
ts
With
Ze
ro
Inco
me
Uni
ts
With
N
on-Z
ero
Inco
me
Uni
ts W
ith
Non
elde
rly
Mem
bers
W
ith
Disa
bilit
ies
Uni
ts
With
El
derly
M
embe
rs
Uni
ts
With
Si
ngle
M
othe
rs
With
Ch
ildre
n N
umbe
r of R
espo
nden
ts (N
) 63
0,48
7
600,
260
30,2
28
41
0,43
5 22
0,05
3
131,
833
229,
337
120,
636
On
a sc
ale
of 1
to 1
0, h
ow w
ould
you
be
affe
cted
if y
our
bene
fits n
ext m
onth
cou
ld o
nly
be u
sed
to m
ake
purc
hase
s usi
ng y
our F
amily
Car
d, a
nd n
one
was
av
aila
ble
as a
cas
h po
rtio
n? (1
= n
o im
pact
, 10
= th
e m
ost i
mpa
ct)
22.5
22
.5
23.4
19
.8
27.5
25
.0
21.9
16
.5
1 =
No
impa
ct
2 2.
1 2.
1 1.
1 1.
2 3.
8 1.
3 1.
5 4.
1 3
2.6
2.7
2.4
2.8
2.3
3.7
0.7
2.7
4 1.
3 1.
3 1.
3 1.
2 1.
5 0.
0 0.
0 2.
7 5
= M
ediu
m im
pact
9.
8 9.
8 8.
3 10
.1
9.2
7.5
10.9
8.
2 6
2.1
2.1
3.8
1.2
3.8
1.3
1.5
4.1
7 4.
0 4.
0 2.
2 2.
8 6.
1 1.
3 2.
2 9.
6 8
6.9
6.9
7.5
7.3
6.1
6.3
7.3
11.0
9
4.0
4.0
4.3
3.7
4.6
1.3
2.9
5.5
10 =
Hig
h im
pact
44
.7
44.7
45
.7
49.8
35
.1
52.5
51
.1
35.6
Av
erag
e ra
ting
(from
1 to
10)
7
7
7
7 7
7
7 7
In w
hat w
ays w
ould
this
impa
ct y
ou?
Wou
ld y
ou sa
y . .
. .
. . y
ou w
ould
n't b
e ab
le to
buy
cer
tain
item
s Ag
ree
44.7
44
.7
48.5
45
.5
43.1
44
.3
46.3
44
.5
Disa
gree
55
.3
55.4
51
.5
54.5
56
.9
55.7
53
.7
55.5
.
. . it
wou
ld a
ffect
the
type
s of s
tore
s you
vis
it Ag
ree
48.7
48
.6
50.7
47
.3
51.2
53
.4
50.0
45
.2
Disa
gree
51
.4
51.4
49
.3
52.7
48
.9
46.6
50
.0
54.8

Exa
min
atio
n of
Cas
h N
utrit
ion
Ass
ista
nce
Pro
gram
Ben
efits
in P
uerto
Ric
o
Pag
e B
-37
Tabl
e B.
5.f.
(con
tinue
d)
Impa
ct o
f Rem
ovin
g Ca
sh P
ortio
n of
Ben
efits
Uni
t Loc
atio
n
Uni
t Cha
ract
eris
tic
To
tal
Resp
onde
nts
U
rban
Ru
ral
Uni
ts
With
Ze
ro
Inco
me
Uni
ts
With
N
on-Z
ero
Inco
me
Uni
ts W
ith
Non
elde
rly
Mem
bers
W
ith
Disa
bilit
ies
Uni
ts
With
El
derly
M
embe
rs
Uni
ts
With
Si
ngle
M
othe
rs
With
Ch
ildre
n In
wha
t way
s wou
ld th
is im
pact
you
? W
ould
you
say
. . .
(con
tinue
d)
.
. . y
ou c
ould
no
long
er sh
op a
t sto
res t
hat d
on't
acce
pt y
our F
amily
Car
d Ag
ree
38.5
38
.5
48.1
38
.6
38.3
40
.3
35.1
38
.6
Disa
gree
61
.5
61.5
51
.9
61.4
61
.7
59.7
64
.9
61.4
.
. . It
wou
ld b
e ha
rder
to b
uy fo
od
Agre
e 43
.6
43.6
43
.2
47.8
35
.7
43.6
48
.9
34.7
Di
sagr
ee
56.4
56
.4
56.8
52
.3
64.3
56
.4
51.1
65
.3
. . .
it w
ould
affe
ct h
ow o
ften
you
go
to th
e st
ore
Agre
e 45
.2
45.2
43
.9
46.7
42
.3
47.5
48
.1
42.5
Di
sagr
ee
54.8
54
.8
56.1
53
.3
57.7
52
.6
51.9
57
.5
. . .
it w
ould
be
hard
er to
buy
non
food
item
s or
serv
ices
that
you
cur
rent
ly u
se th
e ca
sh fo
r Ag
ree
52.2
52
.1
56.4
51
.0
54.2
51
.3
44.9
58
.4
Disa
gree
47
.9
47.9
43
.6
49.0
45
.8
48.7
55
.1
41.7
Of t
hose
indi
vidu
als w
ho p
urch
ased
eac
h of
the
follo
win
g ite
ms .
. .
Com
pare
d to
righ
t now
, how
wou
ld y
ou d
escr
ibe
your
ab
ility
to b
uy e
ach
of th
e fo
llow
ing
item
s if a
ll of
you
r be
nefit
s had
to b
e re
deem
ed u
sing
you
r Fam
ily C
ard
and
none
cou
ld b
e w
ithdr
awn
as c
ash?
Pe
risha
ble
Food
(e.g
., fr
esh
frui
t, da
iry, b
read
) Ea
sier/
Sam
e 72
.7
72.7
73
.6
71.0
75
.4
70.0
70
.2
82.3
M
ore
diffi
cult
27.3
27
.3
26.5
29
.0
24.6
30
.0
29.8
17
.7

Exa
min
atio
n of
Cas
h N
utrit
ion
Ass
ista
nce
Pro
gram
Ben
efits
in P
uerto
Ric
o
Pag
e B
-38
Tabl
e B.
5.f.
(con
tinue
d)
Impa
ct o
f Rem
ovin
g Ca
sh P
ortio
n of
Ben
efits
Uni
t Loc
atio
n
Uni
t Cha
ract
eris
tic
To
tal
Resp
onde
nts
U
rban
Ru
ral
Uni
ts
With
Ze
ro
Inco
me
Uni
ts
With
N
on-Z
ero
Inco
me
Uni
ts W
ith
Non
elde
rly
Mem
bers
W
ith
Disa
bilit
ies
Uni
ts
With
El
derly
M
embe
rs
Uni
ts
With
Si
ngle
M
othe
rs
With
Ch
ildre
n Co
mpa
red
to ri
ght n
ow, h
ow w
ould
you
des
crib
e yo
ur
abili
ty to
buy
eac
h of
the
follo
win
g ite
ms i
f all
of y
our
bene
fits h
ad to
be
rede
emed
usi
ng y
our F
amily
Car
d an
d no
ne c
ould
be
with
draw
n as
cas
h? (c
ontin
ued)
Prep
ared
Foo
d (e
.g.,
sand
wic
hes,
sal
ad b
ar)
Easie
r/Sa
me
46.2
46
.2
51.9
44
.5
50.0
49
.9
70.0
42
.8
Mor
e di
fficu
lt 53
.8
53.9
48
.2
55.5
50
.0
50.1
30
.0
57.2
N
onpe
risha
ble
Food
(e.g
., ca
nned
food
, tom
ato
sauc
e)
Easie
r/Sa
me
81.7
81
.8
79.0
77
.9
87.7
79
.0
76.1
89
.9
Mor
e di
fficu
lt 18
.3
18.3
21
.0
22.1
12
.3
21.0
23
.9
10.1
M
edic
ine
Easie
r/Sa
me
16.7
16
.7
13.2
19
.1
13.3
20
.0
20.0
10
.0
Mor
e di
fficu
lt 83
.3
83.3
86
.8
81.0
86
.7
80.0
80
.0
90.0
Di
aper
s Ea
sier/
Sam
e 11
.1
11.1
15
.8
11.1
11
.1
0.0
0.0
10.0
M
ore
diffi
cult
88.9
88
.9
84.2
88
.9
88.9
10
0.0
100.
0 90
.0
Clot
hing
Ea
sier/
Sam
e 28
.6
28.6
0.
0 33
.3
0.0
100.
0 49
.9
0.0
Mor
e di
fficu
lt 71
.5
71.4
10
0.0
66.7
10
0.0
0.0
50.1
0.
0
Ho
usin
g co
sts (
e.g.
, pay
util
ity b
ills o
r ren
t)
Easie
r/Sa
me
22.6
22
.6
12.1
23
.0
22.2
0.
0 44
.3
33.3
M
ore
diffi
cult
77.5
77
.4
87.9
77
.0
77.8
10
0.0
55.7
66
.7

Exa
min
atio
n of
Cas
h N
utrit
ion
Ass
ista
nce
Pro
gram
Ben
efits
in P
uerto
Ric
o
Pag
e B
-39
Tabl
e B.
5.f.
(con
tinue
d)
Impa
ct o
f Rem
ovin
g Ca
sh P
ortio
n of
Ben
efits
Uni
t Loc
atio
n
Uni
t Cha
ract
eris
tic
To
tal
Resp
onde
nts
U
rban
Ru
ral
Uni
ts
With
Ze
ro
Inco
me
Uni
ts
With
N
on-Z
ero
Inco
me
Uni
ts W
ith
Non
elde
rly
Mem
bers
W
ith
Disa
bilit
ies
Uni
ts
With
El
derly
M
embe
rs
Uni
ts
With
Si
ngle
M
othe
rs
With
Ch
ildre
n Co
mpa
red
to ri
ght n
ow, h
ow w
ould
you
des
crib
e yo
ur
abili
ty to
buy
eac
h of
the
follo
win
g ite
ms i
f all
of y
our
bene
fits h
ad to
be
rede
emed
usi
ng y
our F
amily
Car
d an
d no
ne c
ould
be
with
draw
n as
cas
h? (c
ontin
ued)
Gaso
line
Easie
r/Sa
me
21.1
21
.1
20.0
25
.0
14.3
33
.3
33.3
0.
1 M
ore
diffi
cult
79.0
79
.0
80.0
75
.0
85.7
66
.7
66.7
99
.9
Serv
ices
such
as c
hild
care
, med
ical
car
e, e
tc.
Easie
r/Sa
me
25.0
25
.0
9.1
14.3
39
.9
0.0
20.0
25
.0
Mor
e di
fficu
lt 75
.0
75.0
90
.9
85.7
60
.1
100.
0 80
.0
75.0
Cl
eani
ng su
pplie
s (e.
g., l
aund
ry d
eter
gent
) Ea
sier/
Sam
e 17
.3
17.3
18
.1
15.8
20
.3
19.2
23
.9
15.8
M
ore
diffi
cult
82.7
82
.7
81.9
84
.2
79.7
80
.8
76.1
84
.2
Pers
onal
hyg
iene
item
s (e.
g., s
ham
poo,
deo
dora
nt)
Easie
r/Sa
me
20.1
20
.1
17.5
17
.2
26.5
21
.7
25.0
18
.7
Mor
e di
fficu
lt 79
.9
79.9
82
.5
82.9
73
.5
78.3
75
.0
81.3

Exa
min
atio
n of
Cas
h N
utrit
ion
Ass
ista
nce
Pro
gram
Ben
efits
in P
uerto
Ric
o
Pag
e B
-40
Tabl
e B.
5.f.
(con
tinue
d)
Impa
ct o
f Rem
ovin
g Ca
sh P
ortio
n of
Ben
efits
Uni
t Loc
atio
n
Uni
t Cha
ract
eris
tic
To
tal
Resp
onde
nts
U
rban
Ru
ral
Uni
ts
With
Ze
ro
Inco
me
Uni
ts
With
N
on-Z
ero
Inco
me
Uni
ts W
ith
Non
elde
rly
Mem
bers
W
ith
Disa
bilit
ies
Uni
ts
With
El
derly
M
embe
rs
Uni
ts
With
Si
ngle
M
othe
rs
With
Ch
ildre
n Fo
r tho
se it
ems t
hat a
re m
ore
diffi
cult
to p
urch
ase
with
out t
he c
ash
port
ion
of y
our N
AP b
enef
it, th
e re
ason
is .
. .
. . .
you
do
not h
ave
othe
r sou
rces
to p
ay fo
r the
se
item
s or s
ervi
ces
47.8
47
.8
48.1
49
.6
44.3
55
.6
62.1
47
.4
. . .
it is
diff
icul
t to
get t
o st
ores
that
acc
ept y
our
Fam
ily C
ard
30.7
30
.7
25.3
31
.3
29.5
34
.6
24.6
34
.2
. . .
oth
er re
ason
s 15
.8
15
.8
8.9
18
.7
12.0
49.8
10
.0
16.7
N
ote
Sam
ple
sizes
var
y du
e to
non
resp
onse
and
logi
cal s
kips
.

Exa
min
atio
n of
Cas
h N
utrit
ion
Ass
ista
nce
Pro
gram
Ben
efits
in P
uerto
Ric
o
Pag
e B
-41
Tabl
e B.
5.g.
Aw
aren
ess o
f Reg
ulat
ions
U
nit L
ocat
ion
U
nit C
hara
cter
istic
To
tal
Resp
onde
nts
U
rban
Ru
ral
Uni
ts
With
Zer
o In
com
e
Uni
ts
With
N
on-
Zero
In
com
e
Uni
ts W
ith
Non
elde
rly
Mem
bers
W
ith
Disa
bilit
ies
Uni
ts
With
El
derly
M
embe
rs
Uni
ts
With
Si
ngle
M
othe
rs
With
Ch
ildre
n N
umbe
r of R
espo
nden
ts (N
) 63
0,48
7
600,
260
30,2
28
41
0,43
5 22
0,05
3
131,
833
229,
337
120,
636
Are
ther
e ce
rtai
n th
ings
you
are
not
allo
wed
to
buy
with
you
r Fam
ily C
ard?
Ye
s 75
.8
75.7
80
.3
78.8
70
.0
80.0
76
.3
74.0
N
o 24
.3
24.3
19
.7
21.2
30
.0
20.0
23
.7
26.0
Are
ther
e ce
rtai
n th
ings
you
are
not
allo
wed
to
buy
with
you
r cas
h be
nefit
s fro
m y
our F
amily
Ca
rd?
Yes
47.8
47
.8
53.2
49
.0
45.8
40
.3
49.6
43
.7
No
52.2
52
.2
46.8
51
.1
54.2
59
.7
50.4
56
.3
Not
e Sa
mpl
e siz
es v
ary
due
to n
onre
spon
se a
nd lo
gica
l ski
ps.

Examination of Cash Nutrition Assistance Program Benefits in Puerto Rico
Page B-42
Figure B.5.a. Types of Food Purchased in Last 30 Days at Certified Retailers
Source: Insight tabulations of NAP cash benefits household survey data
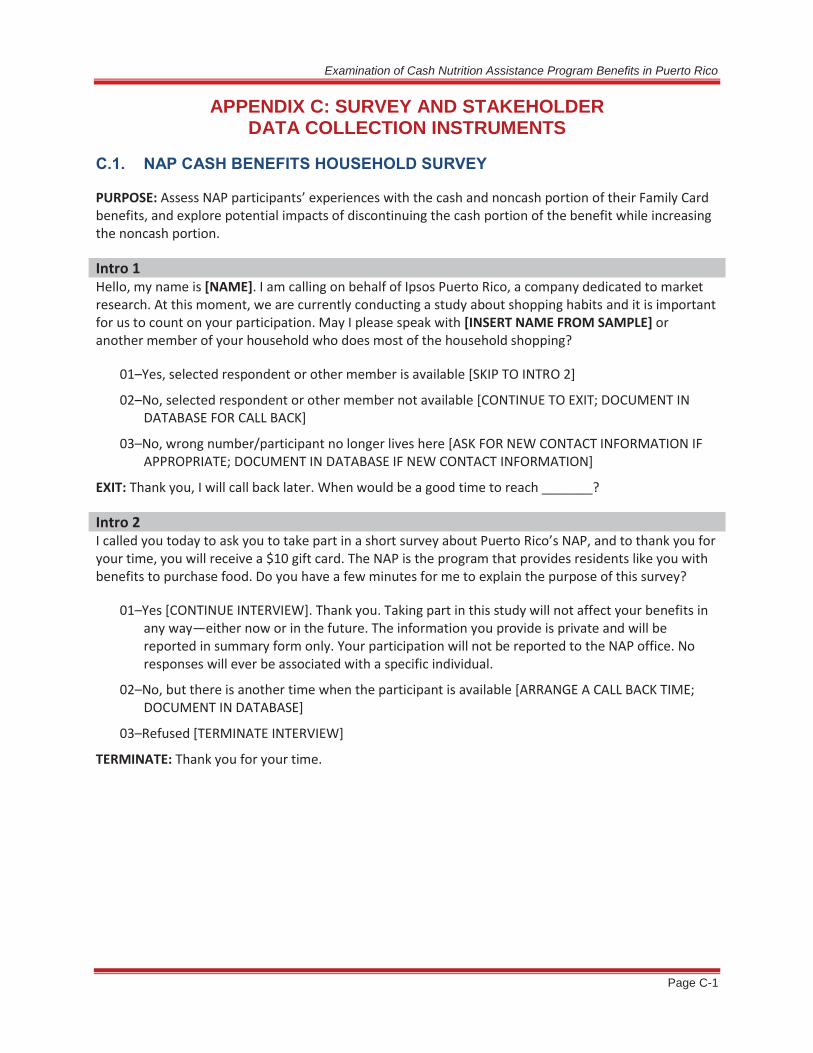
Examination of Cash Nutrition Assistance Program Benefits in Puerto Rico
Page C-1
APPENDIX C: SURVEY AND STAKEHOLDER DATA COLLECTION INSTRUMENTS
C.1. NAP CASH BENEFITS HOUSEHOLD SURVEY
PURPOSE: Assess NAP participants’ experiences with the cash and noncash portion of their Family Card benefits, and explore potential impacts of discontinuing the cash portion of the benefit while increasing the noncash portion.
Intro 1 Hello, my name is [NAME]. I am calling on behalf of Ipsos Puerto Rico, a company dedicated to market research. At this moment, we are currently conducting a study about shopping habits and it is important for us to count on your participation. May I please speak with [INSERT NAME FROM SAMPLE] or another member of your household who does most of the household shopping?
01–Yes, selected respondent or other member is available [SKIP TO INTRO 2]
02–No, selected respondent or other member not available [CONTINUE TO EXIT; DOCUMENT IN DATABASE FOR CALL BACK]
03–No, wrong number/participant no longer lives here [ASK FOR NEW CONTACT INFORMATION IF APPROPRIATE; DOCUMENT IN DATABASE IF NEW CONTACT INFORMATION]
EXIT: Thank you, I will call back later. When would be a good time to reach _______?
Intro 2 I called you today to ask you to take part in a short survey about Puerto Rico’s NAP, and to thank you for your time, you will receive a $10 gift card. The NAP is the program that provides residents like you with benefits to purchase food. Do you have a few minutes for me to explain the purpose of this survey?
01–Yes [CONTINUE INTERVIEW]. Thank you. Taking part in this study will not affect your benefits in any way—either now or in the future. The information you provide is private and will be reported in summary form only. Your participation will not be reported to the NAP office. No responses will ever be associated with a specific individual.
02–No, but there is another time when the participant is available [ARRANGE A CALL BACK TIME; DOCUMENT IN DATABASE]
03–Refused [TERMINATE INTERVIEW]
TERMINATE: Thank you for your time.

Examination of Cash Nutrition Assistance Program Benefits in Puerto Rico
Page C-2
Screener S1. Do you currently receive NAP benefits or have you received benefits within the last 6 months?
01–Yes [CONTINUE TO S3]
02–No [CONTINUE TO S2]
S2. Our records indicate that your household received NAP benefits during June 2014. Is this correct?
01–Yes [CONTINUE INTERVIEW]
02–No: We must have incorrect information. Thank you for your assistance! [END OF SURVEY]
S3. Do you do the food shopping for your household?
01–Yes
02–Sometimes
03–No, someone else does this for me [ASK S3A]
S3a. May I speak to the person in your NAP household who does the majority of your food shopping?
01–Yes, this person is currently available [START AGAIN FROM INTRO 1 WITH NEW RESPONDENT]
02–Yes, but this person is not currently available [DOCUMENT NAME AND PHONE NUMBER OF PERSON IN HOUSEHOLD, AND MAKE AN APPOINTMENT TO CALL BACK. TERMINATE CURRENT INTERVIEW]
03–No: Thank you for your assistance! [END OF SURVEY]
04–No, the person who shops for me is not in my NAP household [END OF SURVEY]
I. Decisions on Where To Shop The first few questions ask about where you purchase food for your household. In most cases, I will ask you a question and read you some answers for you to choose.
Q1. What is the name of the store where you buy most of your food? [ENTER STORE 1]
Q1a. What kind of store is it?
01–Superstore, large combination store, or large pharmacy (e.g., Sam’s Club, Costco, Walmart, Walgreens, Kmart, CVS, PITUSA)
02–Supermarket (e.g., Pueblo, Econo, Amigo, Plaza Loiza, Super Ahorros, Cash and Carry, Supermax, Mr. Special)
03–Small grocery, convenience store (e.g., mom-and-pop store, gas station food store, bakery, specialty store, small pharmacy)
04–Small vendor (e.g., farmers’ market or street vendors)

Examination of Cash Nutrition Assistance Program Benefits in Puerto Rico
Page C-3
Q2. Does this store accept your Family Card?
01–Yes [SKIP Q3]
02–No [SKIP Q4, Q5]
Q3. What is the name of the store where you use your Family Card the most? [ENTER STORE 2]
Q3a What kind of store is it?
01–Superstore, large combination store, or large pharmacy (e.g., Sam’s Club, Costco, Walmart, Walgreens, Kmart, CVS, PITUSA)
02–Supermarket (e.g., Pueblo, Econo, Amigo, Plaza Loiza, Super Ahorros, Cash and Carry, Supermax, Mr. Special)
03–Small grocery, convenience store, (e.g., mom-and-pop store, gas station food store, bakery, specialty store, small pharmacy)
04–Small vendor (e.g., farmers’ market or street vendors)
Q4. Do you shop at stores that do NOT accept your Family Card using your 25-percent cash portion of your benefit?
01–Yes
02–No [SKIP Q5, Q12–14]
Q5. What is the name of the store (that does NOT accept your Family Card) where you use your 25-percent cash portion? [ENTER STORE 3]
Q5a. What kind of store is it?
01–Superstore, large combination store, or large pharmacy (e.g., SAMS, Costco, Walmart, Walgreens, Kmart, CVS, PITUSA)
02–Supermarket (e.g., Pueblo, Econo, Amigo, Plaza Loiza, Super Ahorros, Cash and Carry, Supermax, Mr. Special)
03–Small grocery, convenience store (e.g., mom-and-pop store, gas station food store, bakery, specialty store, small pharmacy)
04–Small vendor (e.g., Farmer’s Market or street vendors)
Q6. Using a scale from 1 to 5 with 1 being not at all important and 5 being very important, how important are the following factors in your decision of where to shop for food?
a. How important is it that the store accepts your Family Card?
b. How important is it that the store carries enough food and a variety of products for your needs?
c. How important is it that the store has low prices?
d. How important is it that the store has high-quality food?
e. How important is it that the store is easy to get to?
f. How important is it that the store can accommodate any special needs you have such as wheelchair ramps and wide aisles?

Examination of Cash Nutrition Assistance Program Benefits in Puerto Rico
Page C-4
Q7. Have you ever been unable to spend all your NAP benefits?
01–Yes
02–No [SKIP Q7A]
Q7a. Please tell me the reason or reasons why you were unable to spend all your benefits [ENTER TEXT]
II. Access to Certified Retailers and Use of EBT Benefits You mentioned earlier that you use your Family Card at [STORE2, STORE1 IF STORE2 IS BLANK]. The following questions ask about how you use your NAP benefits there.
Q8. How frequently do you shop for food at this store?
01–Once a week or more
02–About once every 2–3 weeks
03–About once a month
Q9. How do you usually get to this store?
01–Walk
02–Drive to the store
03–Get a ride with someone
04–Take public transportation
05–Some other way
Q10. How easy or difficult would you say it is for you to get there?
01–Very easy
02–Somewhat easy
03–Somewhat difficult
04–Very difficult
Q11. When you used your Family Card there in the last 30 days, did you buy . . .
a. Perishable food (e.g., fresh fruits or vegetables, dairy products, bread, meat, poultry)?
01–Yes
02–No
b. Prepared food (e.g., sandwiches, salad bar)?
01–Yes
02–No

Examination of Cash Nutrition Assistance Program Benefits in Puerto Rico
Page C-5
c. Nonperishable food (e.g., canned foods, tomato sauce, dried beans)?
01–Yes
02–No
III. Access to Noncertified Retailers [THIS SECTION IS ONLY FOR RESPONDENTS WHO INDICATED THEY USE CASH BENEFITS AT NONCERTIFIED STORES: ONLY ASK Q12–14 IF ANSWERED “YES” TO Q4.]
Earlier, you mentioned that you use your cash benefits at [STORE3], which does not accept your Family Card. The following questions ask about using your cash benefits at this store.
Q12. How frequently do you shop at this store?
01–Once a week or more
02–About once every 2–3 weeks
03–About once a month
Q13. How do you usually get to this store?
01–Walk
02–Drive to the store
03–Get a ride with someone
04–Take public transportation
05–Some other way
Q14. How easy or difficult would you say it is for you to get there?
01–Very easy
02–Somewhat easy
03–Somewhat difficult
04–Very difficult
IV. Access to Cash Portion of Benefits The following questions ask about your shopping experiences accessing the cash portion of your Family Card.
Q15. In the last 30 days, did you get cash back from a store when you used your Family Card?
01–Yes
02–No

Examination of Cash Nutrition Assistance Program Benefits in Puerto Rico
Page C-6
Q16. In the last 30 days, did you get cash back from an ATM when you used your Family Card?
01–Yes
02–No [PROGRAMMER, IF RESPONDENT ANSWERS “NO” TO BOTH Q15 AND Q16, SKIP TO Q21]
Q17. Each month, how much of the available cash portion of your benefit do you typically withdraw as cash?
01–All
02–Some
03–None
Q18. For the next few statements, please tell me how frequently this applies to you by answering Always, Often, Sometimes, or Never.
a. It is difficult for you to get cash using your Family Card.
01–Always
02–Often
03–Sometimes
04–Never
b. You spend the cash portion of your card at a store that accepts your Family Card.
01–Always
02–Often
03–Sometimes
04–Never
V. Use of Cash Portion of Benefits Q 19. In the last 30 days, did you use the cash that you withdrew to buy any of the following items or
services? Please tell me yes or no for each:
a. You used your cash benefit to buy perishable food (e.g., fresh fruits or vegetables, dairy products, bread, meat, poultry)
01–Yes
02–No
b. You used cash to buy prepared food (e.g., sandwiches, salad bar)
01–Yes
02–No
c. You used cash to buy nonperishable food (e.g., canned food, tomato sauce, dried beans)
01–Yes
02–No

Examination of Cash Nutrition Assistance Program Benefits in Puerto Rico
Page C-7
d. You used cash to buy medicine
01–Yes
02–No
e. You used cash to buy diapers
01–Yes
02–No
f. You used cash to buy clothing
01–Yes
02–No
g. You used cash to pay for housing costs (e.g., pay utility bills or rent)
01–Yes
02–No
h. You used cash to buy gasoline
01–Yes
02–No
i. You used cash to pay for services such as childcare, medical care (e.g., to see a doctor)
01–Yes
02–No
j. You used cash to buy alcohol or cigarettes
01–Yes
02–No
k. You used cash to buy cleaning supplies (e.g., laundry detergent)
01–Yes
02–No
l. You used cash to buy personal hygiene items (e.g., shampoo and deodorant)
01–Yes
02–No
Q20. In the last 30 days, how much of the cash that you withdrew did you spend on food? Would you say:
01–All
02–Some
03–None

Examination of Cash Nutrition Assistance Program Benefits in Puerto Rico
Page C-8
VI. Impact of Removing Cash Portion of Benefits Q21. Now I want to give you a scenario to think about. Imagine that next month, your benefit is the
same amount it normally is, but there is no longer a portion that you could spend as cash. In other words, your benefit amount would be the same, but it would all have to be used to make purchases using your Family Card at NAP certified retailers, and none could be used as cash. On a scale from 1 to 10, please rate how this would affect your ability to provide for yourself with 1 (no impact) to 10 (indicating the most impact)?
1 No impact
2
3
4
5 Medium Impact
6
7
8
9
10 High Impact
Q22. The next few questions include some general statements about how this may impact you. [CLARIFY IF NEEDED: That is, the impact of having the same total amount of NAP benefits, but none could be withdrawn in cash]. After each statement, please tell me whether you agree or disagree with the statement.
a. You wouldn’t be able to buy certain items
01–Agree
02–Disagree
b. It would affect the types of stores you visit
01–Agree
02–Disagree
c. You could no longer shop at stores that don’t accept your Family Card
01–Agree
02–Disagree
d. It would be harder to buy food
01–Agree
02–Disagree
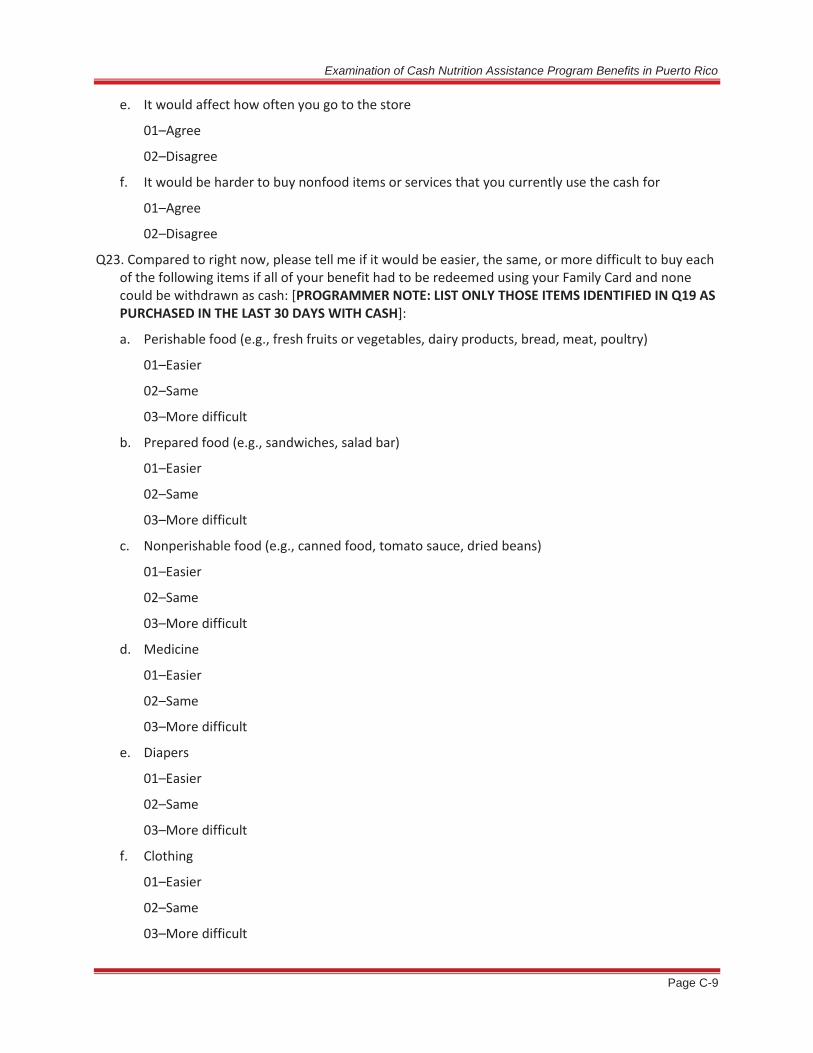
Examination of Cash Nutrition Assistance Program Benefits in Puerto Rico
Page C-9
e. It would affect how often you go to the store
01–Agree
02–Disagree
f. It would be harder to buy nonfood items or services that you currently use the cash for
01–Agree
02–Disagree
Q23. Compared to right now, please tell me if it would be easier, the same, or more difficult to buy each of the following items if all of your benefit had to be redeemed using your Family Card and none could be withdrawn as cash: [PROGRAMMER NOTE: LIST ONLY THOSE ITEMS IDENTIFIED IN Q19 AS PURCHASED IN THE LAST 30 DAYS WITH CASH]:
a. Perishable food (e.g., fresh fruits or vegetables, dairy products, bread, meat, poultry)
01–Easier
02–Same
03–More difficult
b. Prepared food (e.g., sandwiches, salad bar)
01–Easier
02–Same
03–More difficult
c. Nonperishable food (e.g., canned food, tomato sauce, dried beans)
01–Easier
02–Same
03–More difficult
d. Medicine
01–Easier
02–Same
03–More difficult
e. Diapers
01–Easier
02–Same
03–More difficult
f. Clothing
01–Easier
02–Same
03–More difficult

Examination of Cash Nutrition Assistance Program Benefits in Puerto Rico
Page C-10
g. Housing costs (e.g., pay utility bills or rent)
01–Easier
02–Same
03–More difficult
h. Gasoline
01–Easier
02–Same
03–More difficult
i. Services such as childcare, medical care, etc.
01–Easier
02–Same
03–More difficult
j. Alcohol or cigarettes
01–Easier
02–Same
03–More difficult
k. Cleaning supplies (e.g., laundry detergent)
01–Easier
02–Same
03–More difficult
l. Personal hygiene items (e.g., shampoo and deodorant)
01–Easier
02–Same
03–More difficult
Q24. You mentioned that [FILL ABOVE ANSWER FOR ITEMS IDENTIFIED AS MORE DIFFICULT] would be more difficult to purchase without the cash portion. Which of the following reasons apply: [PROGRAMMER NOTE: ASK FOR OVERALL ITEMS INDICATED AS MORE DIFFICULT IN Q23, DO NOT ASK FOR INDIVIDUAL ITEMS]
a. You do not have other sources to pay for these items or services
01–Yes
02–No
b. It is difficult to get to stores that accept your Family Card
01–Yes
02–No

Examination of Cash Nutrition Assistance Program Benefits in Puerto Rico
Page C-11
c. Are there any other reasons?
01–Yes: If yes, specify: [TEXT]
02–No
VII. Awareness of Regulations Now, we are going to ask you a few questions about items you are allowed to purchase with your Family Card.
Q25. Are there certain things you are not allowed to buy with your Family Card?
01–Yes
02–No
Q26. What about the cash benefit portion, are there certain things you are not allowed to buy with your cash benefits from your Family Card?
01–Yes
02–No
VIII. About the Respondent In this final section, we would like to ask you some questions about you.
Q27. Are you a single mother with children under age 18?
01–Yes
02–No
Q28. Do you have a permanent place to stay?
01–Yes
02–Sometimes
03–No
Q29. Do you have a disability or a chronic health condition?
01–Yes
02–No
Q30. Thinking of the area where you live, would you consider it to be urban, suburban, or rural?
01–Urban
02–Suburban
03–Rural
Q31. Next, I’d like to ask you about some other sources of money you have access to. In addition to your NAP benefits, do you receive cash from any of the following sources? Please tell me yes or no for each.

Examination of Cash Nutrition Assistance Program Benefits in Puerto Rico
Page C-12
a. Working, includes “odd jobs” that may not supply consistent payment
01–Yes
02–No
b. TANF or other general assistance
01–Yes
02–No
c. Financial help in the form of cash from a community organization such as a church
01–Yes
02–No
d. Financial help in the form of cash from family or friends
01–Yes
02–No
e. Retirement pension (private or government agency)
01–Yes
02–No
f. Unemployment insurance
01–Yes
02–No
g. Child support
01–Yes
02–No
h. Social Security benefits (NOT including disability) (i.e., old age and survivor’s benefits)
01–Yes
02–No
i. Social Security for disability (i.e., disability insurance)
01–Yes
02–No
j. Any other source
01–Yes
02–No

Examination of Cash Nutrition Assistance Program Benefits in Puerto Rico
Page C-13
Conclusion Thank you, [INSERT NAME]. I want you to know how much we appreciate the time you took to help us with this research. As a token of our appreciation, we will send you a $10 gift card in the mail. Can you please let me know the best address where I can mail this to you?
[ENTER MAILING ADDRESS]
Thank you. I will put this in the mail and you can expect it shortly. In the meantime, if you have any questions about this study, I will give you a phone number to a voicemail box where you can leave a message with the researcher in charge. That number is +1 (786) 505-8949.
Thanks again for all of your help. [END INTERVIEW]

Examination of Cash Nutrition Assistance Program Benefits in Puerto Rico
Page C-14
C.2. NAP FOCUS GROUP GUIDE
PURPOSE: Assess NAP participants’ experiences with the cash and noncash portion of their Family Card benefit, and explore potential impacts of discontinuing the cash portion of the benefit while increasing the noncash portion.
I. Introduction a. Ground Rules
Please speak one at a time.
We are recording this session to be sure we can accurately remember what everyone says. Only people working on the project will have access to the recordings. The Department of the Family will not have access to the recordings, nor the identity of the participants.
o Since we are recording, please speak in a voice as loud as mine and avoid side conversations.
I’d like to introduce my colleague _____ who will be taking notes today in the event that the recordings are not clear. Again, these notes will be kept private and will not identify anyone by name. We need to hear from everyone today, but you don’t have to answer every question.
There may be times in the discussion where you feel differently from other people and we want to hear about that. There are no wrong answers.
Please turn off your cell phones or turn to silent.
If you need to leave the room for some reason, please leave so that only one person is up and out of the room at one time–this will keep our group from getting too small.
I have a lot of questions to cover and therefore may need to interrupt you to keep conversation moving.
This session is confidential; your names will not be associated with anything you say.
Do you have any questions before we get started? [TURN ON RECORDER]
b. Icebreaker
Let’s start by getting to know each other a little bit. Please go around the table and tell us:
Your first name
Your favorite food
[MODERATOR INTRODUCE SELF AT END]
I want to tell you why we are all here today and why you were selected to participate in this discussion. Everyone here is a beneficiary of Puerto Rico’s NAP. This is the program that provides residents like you with benefits to purchase food [SHOW FAMILY CARD]. Today we want to talk to you about how you typically use your NAP benefit (Family Card) each month. I want to reiterate that I do not work for the

Examination of Cash Nutrition Assistance Program Benefits in Puerto Rico
Page C-15
government, and I am not involved in running the NAP program. We are doing a lot of group discussions like this across Puerto Rico and your input will help the government understand how real people, like you, use NAP. I also want to make it clear that while we will be sharing a summary of the feedback from all of the people we talk to with the government, we will in no way tell the government who said what and your name will not be connected to any of the information that you share with us.
II. Awareness of NAP and of Cash Versus Noncash Benefit Let’s start today by talking about NAP in general.
1. In your mind, what is the purpose of NAP?
PROBE: What is the goal of the program? Why does the government run this program?
2. Are there different types of benefits within NAP?
PROBE: When you go to the store, are there different types of payment options using your Family Card?
3. How do you know which stores in your area accept NAP?
PROBE: Is there a sign? Word of mouth?
4. Is there any way to use your benefits at a store that does not accept NAP?
PROBE: Would you have to withdraw money at an ATM? Have you ever had to get cash back from a retailer that accepts your Family Card to buy things at a store that does not accept your Family Card?
5. At this point, I want to make sure we all understand the difference between the different types of benefit portions that NAP recipients receive each month. Each NAP recipient or family receives a certain amount of money each month, and this amount is different for different people and different size families. Despite the amount that you get, everyone can access 25 percent of their benefits in cash–either from an ATM or from “cash back” from a retailer. The other 75 percent can only be used by presenting your Family Card. So to make it simple, if you get $100 in benefits each month, you can access up to $25 each month as cash. Does this sound familiar to you? [SHOW OF HANDS]
6. [IF APPLICABLE] Some of you mentioned before that you get cash back from a retailer or use an ATM to get cash from your Family Card. Can you tell me a little bit more about how you get your cash?
a. How easy or hard is this transaction for you? [SHOW OF HANDS FOR EASY VERSIS DIFFICULT]
b. Do you usually go to an ATM or get cash back from a store? [SHOW OF HANDS ATM VERSUS CASH BACK]
c. Are there ATMs near where you live? [SHOW OF HANDS]
d. Do you ever have trouble getting cash back at a retailer using your Family Card?
e. Do you have to pay a fee to get cash from an ATM using your Family Card? PROBE: How much? Does that impact your decision about using an ATM to access your cash benefit?

Examination of Cash Nutrition Assistance Program Benefits in Puerto Rico
Page C-16
III. Current Purchasing Practices Now let’s talk about when, where, and how you purchase food for yourself and your families.
7. Walk me through your typical food shopping experience.
PROBE: Do you do all your shopping at once? Do you get everything from the same store? How frequently do you go food shopping (daily, weekly, biweekly, once a month)?
a. How far do you have to travel (can you walk to the store; do you have to drive or use public transportation; do you have to ask someone for a ride)?
b. For how many people are you typically shopping to feed?
c. Do you usually go to superstores (e.g., Sam’s Club, Costco, Walmart), supermarkets (e.g., Amigo, Pueblo, Econo, Plaza Loiza), small grocery or convenience stores (e.g., gas station food store, mom-and-pop store), specialty stores (e.g., baker, butcher) or farmers’ markets?
d. During your regular food shopping, how frequently are you using your Family Card (rarely, sometimes, always [SHOW OF HANDS])?
8. What are some things that factor into your decision of where to shop?
PROBE: Stores that accept my Family Card? Prices? Accessibility? Easy to get to?
9. How easy or difficult would you say it is to get to stores that accept your Family Card? PROBE: Would you say it is easy or difficult?
a. What are some of the factors that make it easy or difficult (e.g., number of stores in neighborhood that accept the Family Card, transportation)?
b. Have you ever had benefits you wanted to use but couldn’t because of the difficulty getting to a store that accepts your Family Card?
10. How far do you have to travel to get to stores that accept your Family Card?
PROBE: Minutes/ miles? Do you rely on public transportation?
PROBE FOR THOSE WHO TRAVEL FAR: Does this impact how you do your shopping (e.g. frequency of shopping, where you go)?
a. Do you rely on other people for help getting to the store (e.g., from friends, neighbors family, retailers, community agencies)?
11. Do you ever shop for food at stores that do not accept your Family Card? How easy or difficult it is for you to get to them?
a. How often do you shop at stores that do not accept your Family Card?
b. How far do you have to travel to stores that do not accept your Family Card?
12. Now let’s think about the two different portions of your NAP benefit: the 75-percent noncash portion and the 25-percent cash portion. Do you make purchases differently for each of these segments?
PROBE IF NEEDED: Do you have certain things you purchase with the cash and certain things you purchase with the noncash portion?

Examination of Cash Nutrition Assistance Program Benefits in Puerto Rico
Page C-17
13. Let’s start with talking about your noncash benefit (i.e., your Family Card). What are some of the things you use it for?
a. Perishable food (e.g., fresh fruits and vegetables, dairy products, bread, meat, poultry)?
b. Prepared food (e.g., sandwiches, salad bar)
c. Nonperishable food (e.g., canned foods, tomato sauce, dried beans)
d. Anything else?
14. And what about your cash benefit –where do you usually spend your cash portion?
PROBE: What types of stores?
a. Do you usually spend your cash portion at stores that do not accept the Family Card, or stores that do accept the Family Card?
15. What are some of the things you use the cash to pay for?
a. Perishable food (e.g., fresh fruits and vegetables, dairy products, bread, meat, poultry)?
b. Prepared food (e.g., sandwiches, salad bar)
c. Nonperishable food (e.g., canned foods, dried beans)
d. Items other than food? PROBE FOR ITEMS OTHER THAN FOOD: What are some of the nonfood items you use the cash to pay for? (e.g., detergent, medicine, diapers, gasoline, rent, utility bills, alcohol, cigarettes, personal hygiene items)
e. Anything else?
16. What amount of your cash benefit do you spend on food?
PROBE: All on food, some on food, none on food?
17. Do other people you know use their cash benefit for things other than food?
PROBE IF YES: What types of things do they use their cash benefit to pay for? (e.g., detergent, medicine, diapers, gasoline, rent, utility bills, alcohol, cigarettes, personal hygiene items)
IV. Impact of Removal of Cash Benefit Now I want to give you a scenario to think about. Imagine that next month, your benefit is the same amount it is normally is, but that there is no longer a portion that you could use as cash. In other words, it would all have to be used to purchase food from NAP certified retailers, and none could be redeemed in cash.
18. What are some of the ways that would impact you?
PROBE: No impact? It would have an impact on you? [SHOW OF HANDS]
a. How would it affect you?
PROBE: Wouldn’t be able to purchase certain items? Could no longer shop at stores that don’t accept your Family Card?
b. Would it be harder to get food?
c. Would your regular shopping patterns change? (e.g., types of stores visited and frequency)

Examination of Cash Nutrition Assistance Program Benefits in Puerto Rico
Page C-18
19. What about other people you know who receive NAP benefits, do you think removing the cash portion would impact them?
PROBE: In what ways?
20. [IF PARTICIPANTS DESCRIBED PURCHASING NONFOOD ITEMS WITH CASH EARLIER]: For those of you who said that you use the cash portion of your benefit to pay for nonfood items or services (give examples), would you have a way to pay for those if there was no longer a way to get cash from your Family Card?
PROBE: Tell me how you would handle that situation.
V. Awareness of Regulations 21. Are there certain things you are allowed and not allowed to buy with your NAP benefits?
PROBE: What about the cash portion compared to the noncash portion? Are different things allowed for those two segments?
VI. Conclusion 22. Overall, what are some reasons you think the cash portion of the benefit should or should not be
removed?
To wrap up, we have one final activity. [DISTRIBUTE BLANK POSTCARDS]. Please write a few sentences explaining why you believe the cash portion of the NAP benefit should or should not be removed. Remember that you would still get the same amount of benefit each month. Please only put your first name on the card.
Thank you for your time today. Your participation is greatly appreciated.

Examination of Cash Nutrition Assistance Program Benefits in Puerto Rico
Page C-19
C.3. RETAILER INTERVIEW GUIDES
Uncertified Retailer Interview Guide
PURPOSE: Assess retailer experience with the certification, recertification, and EBT transaction process, redemption of the cash and noncash portion of the Family Card, participants’ use of the cash portion, and potential effects of eliminating the cash portion of the benefit.
I. Introduction As you reviewed in the consent form, we are conducting a research study to better understand how Family Card holders spend their benefits in food stores and how retailers view the benefits and barriers to accepting the Family Card in their stores. For this study, we will be talking with retailers like you–both certified and uncertified––across Puerto Rico. If you need to stop at any time to tend to your customers or other store business, please feel free to do so. I can wait for you to tend to your business and we can continue the interview.
Since we are talking to many retailers across Puerto Rico, audio recordings help us remember who said what so I don’t need to worry about taking notes and can listen to what you have to say. Only people working on this study will have access to the recordings. Would it be ok if I record our discussion?
First, let’s start with some background about your store.
II. Background 1. How long has this store been here?
a. Is your store part of a chain/franchise?
2. What is your role at the store? PROBE: Owner? Manager? Other?
a. How long have you managed/operated this store?
3. How far do most customers travel to get to your store? PROBE: Are most local/ from the neighborhood?
a. How do your customers usually get to your store? PROBE: Walk, drive, public transportation, other?
b. Approximately what portion of your customers are elderly, would you say all, most, some or none? PROBE: Please tell me more about that.
c. Approximately what portion of your customers have disabilities, would you say all, most, some or none? PROBE: Please tell me more about that.
d. How easy or difficult do you think it is for customers to get to your store?
4. Approximately what portion of your inventory is food versus nonfood items? PROBE: Percentage of food versus nonfood? All food, some food, little food, no food?
5. Approximately what portion of your shoppers are NAP participants, would you say all, most, some or none? PROBE: Please tell me more about that.
6. Approximately what portion of your sales are to NAP participants, would you say all, most, some or none? PROBE: Please tell me more about that.

Examination of Cash Nutrition Assistance Program Benefits in Puerto Rico
Page C-20
7. CONFIRM THAT RETAILER IS NOT CERTIFIED: Is your store certified to redeem Family Cards? [SHOW FAMILY CARD IF NECESSARY]. These are EBT cards that allow NAP participants to purchase food. The cards are used like a debit card, and can only be redeemed at stores that are certified to accept them.
a. Is this something you’ve heard about?
b. Has your store ever been certified to accept the Family Card?
i. IF YES TO B: What was the reason you stopped being certified? PROBE: Was it the cost of the equipment, bank charges or transaction costs, not enough customers that use the Family Card, etc.?
8. Do you currently accept credit or debit cards?
a. IF YES, ACCEPTS CREDIT/DEBIT: Who provides your credit/debit services?
b. IF YES, ACCEPTS CREDIT/DEBIT: Do you use your cash register or a separate device to run the transaction? PROBE: Can you tell me about the type of device or manufacturer?
c. IF YES, ACCEPTS DEBIT: What are the transaction fees for each debit transaction?
d. IF YES, ACCEPTS CREDIT: What are the transaction fees for each credit transaction?
e. IF YES, ACCEPTS CREDIT/DEBIT: What other forms of government assistance do you accept, like TANF or WIC?
f. IF NO, DOES NOT CURRENTLY ACCEPT CREDIT/DEBIT CARDS: What are some reasons you do not accept credit/debit cards? PROBE IF RETAILER MENTIONS FEES: what do you think the fees involve?
9. Do you use an electronic cash register system?
a. IF NO, DOES NOT USE ELECTRONIC CASH REGISTER SYSTEM: What are some of the reasons you do not use one?
10. Do you use an electronic reporting system for reporting your Puerto Rico sales tax or IVU? IF YES: Could you use the same system for processing Family Card transactions?
11. Do you have an ATM in your store?
a. IF YES: Do you know if NAP participants use your ATM to get cash from their Family Card?
b. IF NO: Is there an ATM nearby? PROBE: How far?
12. Do you have internet service at your store?
a. IF YES: Do you ever experience internet service outages?
i. If so, how long do they typically last?
ii. How frequently do they occur?
iii. What causes them?

Examination of Cash Nutrition Assistance Program Benefits in Puerto Rico
Page C-21
III. Facilitators, Barriers, Advantages, and Disadvantages To Becoming NAP Certified 13. What are some reasons that your store is not certified to accept Family Cards? PROBE: Not eligible
(e.g., not enough annual food sales, or do not meet retailer criteria), no point-of-sale (POS) equipment, cost of POS equipment, transaction costs, application fee, difficulties with connectivity (e.g., telephone line), other technology issues, electricity outages, too small, not worth the effort, not interested, no client interest/need, etc.
14. Do you think certified retailers have advantages over retailers like you that are not certified? PROBE: Increased customer base, increased revenue, serve community?
15. Do you think there are any disadvantages to accepting the Family Card? PROBE: Cost? Extra work? Other?
16. Do you know whether other stores in your area are certified to accept the Family card?
a. Do you think there has been a change in the number of certified retailers in your area in the last few years? PROBE: More or less certified stores? More large or small stores becoming certified?
IV. Effects of Discontinuing the Cash Portion of NAP Benefits NAP beneficiaries receive a benefit every month. Seventy-five percent of the benefit is to be spent at certified retailers by using their Family Card. Twenty-five percent can be used as cash. So, if a NAP participant got $100 in benefits each month, he/she would be allowed to access up to $25 each month as cash.
17. Does this sound familiar to you?
18. If the 25-percent cash portion of the NAP benefit were eliminated, and 100 percent of the benefit had to be redeemed through noncash purchases using the Family Card at certified retailers, how would it affect your store? (CLARIFY IF NEEDED: The total amount of the benefit would remain the same, but there would no longer be a portion that customers could spend as cash)
a. Would you say the effect would be:
i. Good. PROBE: Why?
ii. Bad. PROBE: Why? As a certified retailer would you expect to lose any business?
iii. No impact. PROBE: Would it be different in any way?
iv. Other [describe]
b. IF EFFECT WOULD BE BAD: How much business would you lose? PROBE: For example, if you had 100 sales in one day, how many sales would you lose?
c. IF EFFECT WOULD BE GOOD: How much business would you gain? PROBE: For example. If you had 100 sales in one day how many more sales do you think you would gain?
19. If the 25 percent cash portion of the NAP benefit were eliminated, how would it affect your customers?
a. Would you say the effect would be:
i. Good. PROBE: Why?
ii. Bad. PROBE: Why?
iii. No impact. PROBE: Would it be different in any way?

Examination of Cash Nutrition Assistance Program Benefits in Puerto Rico
Page C-22
iv. Other [describe]
V. Participants’ Use of Cash and Noncash Benefits 20. Do you know if your customers use the 25 percent cash portion of their Family Card benefit in your
store?
a. IF YES: How do they access the cash?
i. ATM?
ii. Cash back?
iii. Combined with a Family Card purchase?
b. IF NO/ DON’T KNOW: SKIP TO Q. 32
21. Using the cash obtained from their Family Card, how frequently do NAP customers buy perishable foods (e.g., fresh fruits or vegetables, dairy products, bread, meat, poultry), would you say often, sometimes or never? PROBE: Tell me more about that.
22. Using the cash obtained from their Family Card, how frequently do NAP customers buy nonperishable foods (e.g., canned foods, tomato sauce, dried beans), would you say often, sometimes, or never? PROBE: Tell me more about that.
23. Using the cash obtained from their Family Card, how frequently do NAP customers buy prepared foods (e.g., sandwiches, salad bar), would you say often, sometimes, or never? PROBE: Tell me more about that.
24. Using the cash obtained from their Family Card, how rare or common is it for participants to purchase nonfood items?
25. How frequently do NAP participants use the cash portion of their benefit to purchase medicine, would you say often, sometimes, or never?
26. How frequently do NAP participants use the cash portion of their benefit to purchase diapers, would you say often, sometimes, or never?
27. How frequently do NAP participants use the cash portion of their benefit to purchase clothing, would you say often, sometimes, or never?
28. How frequently do NAP participants use the cash portion of their benefit to purchase alcohol or cigarettes, would you say often, sometimes, or never?
29. How frequently do NAP participants use the cash portion of their benefit to purchase cleaning supplies (e.g., detergent), would you say often, sometimes, or never?
30. How frequently do NAP participants use the cash portion of their benefit to purchase personal hygiene items (e.g., shampoo or deodorant), would you say often, sometimes, or never?
31. Do NAP participants use the cash portion of their benefit to purchase any other nonfood items, would you say often, sometimes, or never? PROBE: What types of items? How frequently (often, sometimes?)
VI. Conclusion and Wrap Up 32. In conclusion, what are some reasons you think the cash portion of the NAP benefit should or should
not be removed?
33. Is there anything else you’d like to tell us?

Examination of Cash Nutrition Assistance Program Benefits in Puerto Rico
Page C-23
Those are all of the questions we have for you today. Thank you for your time, your assistance is greatly appreciated.

Examination of Cash Nutrition Assistance Program Benefits in Puerto Rico
Page C-24
Certified Retailer Interview Guide
PURPOSE: Assess retailer experience with the certification, recertification, and EBT transaction process, redemption of the cash and noncash portion of the Family Card, participants’ use of the cash portion, and potential effects of eliminating the cash portion of the benefit.
I. Introduction As you reviewed in the consent form, we are conducting a research study to better understand how Family Card holders spend their benefits in food stores and how retailers view the benefits and barriers to accepting the Family Card in their stores. For this study, we will be talking with retailers like you–both certified and uncertified––across Puerto Rico. If you need to stop at any time to tend to your customers or other store business, please feel free to do so. I can wait for you to tend to your business and we can continue the interview.
Since we are talking to many retailers across Puerto Rico, audio recordings help us remember who said what so I don’t need to worry about taking notes and can listen to what you have to say. Only people working on this study will have access to the recordings. Would it be ok if I record our discussion?
First, let’s start with some background about your store.
II. Background 1. How long has this store been here?
a. Is your store part of a chain/franchise?
2. What is your role at the store? PROBE: Owner? Manager? Other?
a. How long have you managed/operated this store?
3. How far do most customers travel to get to your store? PROBE: Are most local/ from the neighborhood?
a. How do your customers usually get to your store? PROBE: Walk, drive, public transportation, other?
b. Approximately, what portion of your customers are elderly, would you say all, most, some or none? PROBE: Please tell me more about that.
c. Approximately what portion of your customers have disabilities, would you say all, most, some or none? PROBE: Please tell me more about that.
d. How easy or difficult do you think it is for customers to get to your store?
4. Approximately portion of your inventory is food versus nonfood items? PROBE: Percentage of food versus nonfood? All food, some food, little food, no food?
5. Approximately what portion of your shoppers use NAP benefits, would you say all, most, some or none? PROBE: Please tell me more about that.
6. Approximately what portion of your sales are made using NAP benefits, would you say all, most, some or none? PROBE: Please tell me more about that.
7. CONFIRM THAT RETAILER IS CERTIFIED: Is your store certified to redeem Family Cards? [SHOW FAMILY CARD IF NECESSARY]

Examination of Cash Nutrition Assistance Program Benefits in Puerto Rico
Page C-25
8. How long have you been certified to accept the Family Card?
a. How easy or difficult was the certification process? PROBE: Costly, time consuming, quick, affordable?
9. Do you currently accept credit or debit cards?
a. IF YES, ACCEPTS CREDIT/DEBIT: Who provides your credit/debit services?
b. IF YES, ACCEPTS CREDIT/DEBIT: Do you use your cash register or a separate device to run the transaction? PROBE: Can you tell me about the type of device or manufacturer?
c. IF YES, ACCEPTS DEBIT: What are the transaction fees for each debit transaction?
d. IF YES, ACCEPTS CREDIT: What are the transaction fees for each credit transaction?
e. IF YES, ACCEPTS CREDIT/DEBIT: What other forms of government assistance do you accept, like TANF or WIC?
f. IF NO, DOES NOT CURRENTLY ACCEPT CREDIT/DEBIT CARDS: What are some reasons you do not accept credit/debit cards? PROBE IF RETAILER MENTIONS FEES: What do you think the fees involve?
10. Do you use an electronic cash register system?
a. IF NO, DOES NOT USE ELECTRONIC CASH REGISTER SYSTEM: What are some of the reasons you do not use one?
11. Do you use an electronic reporting system for reporting your Puerto Rico sales tax or IVU? IF YES: Do you use the same system for processing Family Card transactions?
12. Do you have an ATM in your store?
a. IF YES: Do you know if NAP participants use your ATM to get cash from their Family Card?
b. IF NO: Is there an ATM nearby? PROBE: How far?
13. Do you have internet service at your store?
a. IF YES: Do you ever experience Internet service outages?
i. If so, how long do they typically last?
ii. How frequently do they occur?
iii. What causes them?
III. NAP Certification Process and Requirements Now I’d like to talk about the process of becoming certified for accepting Family Card. Are you familiar with the certification process? [IF NO, ADD: let’s talk about what you do know about the process, it is okay if you are not familiar with all of the details]
14. What are some reasons your store decided to become certified?
15. How easy or difficult was it to become certified to accept Family Cards? PROBE: What are some things that made it easy or difficult? (e.g., paperwork, regulations, etc.)
16. IF ACCEPTS CREDIT OR DEBIT CARDS: Do you use the same system for processing Family Card transactions as you do for processing credit/debit card transactions?
Examination of Cash Nutrition Assistance Program Benefits in Puerto Rico
Page C-26
17. What were the costs associated with becoming certified?
a. Did you already have a point-of-sale (POS) system in place? IF YES: how much did the upgrades cost?
b. How much did the equipment cost? PROBE: A lot, not much?
c. How much did the software/ installation cost? PROBE: A lot, not much?
d. How long did it take to set up? PROBE: A long time? Not much time?
e. Are there transaction fees for using the Family Card? PROBE: A lot, not much?
f. Are there regular equipment fees? PROBE: A lot, not much?
g. How did these costs factor into your decision about becoming certified?
18. How easy or difficult is the recertification process? PROBE: What are some reasons it is easy or difficult?
19. What are the regular responsibilities of being a certified retailer? PROBE: Regular reporting?
a. How much of a burden are the regular responsibilities of being a certified retailer PROBE: Difficult/expensive/a lot of work? Easy/affordable/not too much work?
IV. Facilitators, Barriers, Advantages, and Disadvantages To Becoming NAP Certified 20. What do you see as the main advantages to being NAP certified to accept Family Cards? PROBE:
Increased customer base? Increased revenue? Serve community? Other?
21. What do you see as the main disadvantages, if any, to being NAP certified? PROBE: Cost? Extra work? Other?
22. Do you know if other stores in your area are certified to accept the Family Card?
a. Do you think there has been a change in the number of certified retailers in your area in the last few years? PROBE: More or less certified stores? More large or small stores becoming certified?
23. Do you ever provide assistance, such as transportation or deliveries, to help customers get to your store or do their shopping?
V. Effects of Discontinuing the Cash Portion of NAP Benefits NAP beneficiaries receive a benefit every month. Seventy-five percent of the benefit is to be spent at certified retailers by using their Family Card. Twenty-five percent can be used as cash. So, if a NAP participant got $100 in benefits each month, he/she would be allowed to access up to $25 each month as cash.
24. Does this sound familiar to you?
25. If the 25-percent cash portion of the NAP benefit were eliminated, and 100 percent of the benefit had to be redeemed through noncash purchases using the Family Card at certified retailers, how would it affect your store? [CLARIFY IF NEEDED: The total amount of the benefit would remain the same, but there would no longer be a portion that customers could spend as cash]

Examination of Cash Nutrition Assistance Program Benefits in Puerto Rico
Page C-27
a. Would you say the effect would be:
i. Good. PROBE: Why?
ii. Bad. PROBE: Why? As a certified retailer, would you expect to lose any business?
iii. No impact. PROBE: Would it be different in any way?
iv. Other [describe]
b. IF EFFECT WOULD BE BAD: How much business would you lose? PROBE: For example, if you had 100 sales in one day, how many sales would you lose?
c. IF EFFECT WOULD BE GOOD: How much business would you gain? PROBE: For example, if you had 100 sales in one day how many more sales do you think you would gain?
26. If the 25-percent cash portion of the NAP benefit were eliminated, how would it affect your customers?
a. Would you say the effect would be:
i. Good. PROBE: Why?
ii. Bad. PROBE: Why?
iii. No impact. PROBE: Would it be different in any way?
iv. Other [describe]
VI. Participants’ Use of Cash and Noncash Benefits 27. When NAP customers want to purchase both food and nonfood items in a single purchase with their
Family Card, how is that transaction processed?
a. How often does that occur?
b. Does your processing system sort items into food and nonfood?
I’m going to ask you a few questions about the main items that NAP participants’ purchase with their benefits. First, I’ll ask about using the Family Card by itself, and then I’ll ask about using cash obtained with the card.
28. Using their Family Card, how frequently do customers buy perishable foods (e.g., fresh fruits or vegetables, dairy products, bread, meat, poultry), would you say often, sometimes or never? PROBE: Tell me more about that. Are there specific types of perishable foods NAP customers buy more often than others?
29. Using their Family Card, how frequently do customers buy nonperishable foods (e.g., canned foods, tomato sauce, dried beans), would you say often, sometimes, or never? PROBE: Tell me more about that. Are there specific types of nonperishable foods NAP customers buy more often than others?
30. What about prepared foods, (e.g., sandwiches, salad bar)? How frequently do customers buy those items using their Family Card, would you say often, sometimes, or never? PROBE: Tell me more about that. Are there specific types of prepared foods NAP customers buy more often than others?

Examination of Cash Nutrition Assistance Program Benefits in Puerto Rico
Page C-28
31. Do you know if your customers use the 25-percent cash portion of their Family Card benefit in your store?
a. IF YES: How do they access the cash?
i. ATM?
ii. Cash back?
iii. Combined with a Family Card purchase?
b. IF NO/ DON’T KNOW: SKIP TO Q43
32. Using the cash obtained from their Family Card, how frequently do NAP customers buy perishable foods (e.g., fresh fruits or vegetables, dairy products, bread, meat, poultry), would you say often, sometimes or never? PROBE: Tell me more about that.
33. Using the cash obtained from their Family Card, how frequently do NAP customers buy nonperishable foods (e.g., canned foods, tomato sauce, dried beans), would you say often, sometimes, or never? PROBE: Tell me more about that.
34. Using the cash obtained from their Family Card, how frequently do NAP customers buy prepared foods (e.g., sandwiches, salad bar), would you say often, sometimes, or never? PROBE: Tell me more about that.
35. Using the cash obtained from their Family Card, how rare or common is it for participants to purchase nonfood items with their NAP benefits?
36. How frequently do NAP participants use the cash portion of their benefit to purchase medicine, would you say often, sometimes, or never?
37. How frequently do NAP participants use the cash portion of their benefit to purchase diapers, would you say often, sometimes, or never?
38. How frequently do NAP participants use the cash portion of their benefit to purchase clothing, would you say often, sometimes, or never?
39. How frequently do NAP participants use the cash portion of their benefit to purchase alcohol or cigarettes, would you say often, sometimes, or never?
40. How frequently do NAP participants use the cash portion of their benefit to purchase cleaning supplies (e.g., detergent), would you say often, sometimes, or never?
41. How frequently do NAP participants use the cash portion of their benefit to purchase personal hygiene items (e.g., shampoo or deodorant), would you say often, sometimes, or never?
42. Do NAP participants use the cash portion of their benefit to purchase any other nonfood items, would you say often, sometimes, or never? PROBE: What types of items? How frequently (often, sometimes?)
43. As we were discussing earlier, if the 25-percent cash portion of the benefit were removed, do you think this would impact how your NAP customers purchase nonfood items? IF YES: How?
44. Have you or your staff ever had to tell a NAP customer that they could not buy a particular item with their Family Card?
a. Do you train your workers on eligible Family Card purchases? IF YES: How often?

Examination of Cash Nutrition Assistance Program Benefits in Puerto Rico
Page C-29
VII. Concluding Comments 45. In conclusion, what are some reasons you think the cash portion of the NAP benefit should or should
not be removed?
46. Is there anything else you’d like to tell us?
Those are all of the questions we have for you today. Thank you for your time, your assistance is greatly appreciated.

Examination of Cash Nutrition Assistance Program Benefits in Puerto Rico
Page C-30
C.4. CBO INTERVIEW GUIDE
I. Introduction As you reviewed in the consent form, we are conducting a research study to better understand some of the unique challenges and characteristics of the low–income population in Puerto Rico, specifically individuals receiving NAP benefits. As a community based organization, we are hoping you can provide some insight on the populations you serve.
Since we are talking to several community-based organization across Puerto Rico, audio recordings help us remember who said what so I don’t need to worry about taking notes. Only people working on this study will have access to the recordings.
Would it be ok if I record our discussion?
First, let’s start with some background about your organization.
II. Background on Organization 1. Please tell me about your role at [ORGANIZATION NAME] and how long you’ve been here.
2. Can you tell me about the history and mission of your organization?
a. When was it founded?
b. What are your primary funding sources?
c. Are there multiple sites/locations?
d. What are some of the key programs you offer?
3. Can you tell me about the population(s) you serve?
a. How large (geographically) is your service area? PROBE: Do you serve people from across Puerto Rico or only your specific municipality?
b. How many people do you serve? PROBE: Each year? Each month? By program?
III. Background on Population 4. Thinking of the population(s) you serve, what are some of the things that make it difficult for them
to have their basic needs met (e.g., accessing healthy food, medical care, housing, etc.)? PROBE: Low or lack of income, disabilities—mental, physical, emotional—lack of transportation, substance abuse, health conditions, etc.?
5. Are your clients primarily living in urban, suburban, or rural areas?
a. What are some of the specific challenges clients face that relate to where they live? PROBE: Access to services, economic factors?
IV. Barriers to Redemption of NAP Benefits Now let’s talk about your clients’ use of NAP benefits.
6. What proportion of your clients are NAP beneficiaries? PROBE: All, most, some, none?
7. Are your NAP clients generally able to do their own food shopping?
a. IF NO: What are some of the things that make it hard for them to shop for themselves?

Examination of Cash Nutrition Assistance Program Benefits in Puerto Rico
Page C-31
8. How easy or difficult is it for your clients to redeem their NAP benefits?
a. What barriers do they face?
b. Which subgroups of the populations you serve experience more barriers to redeeming their benefits than others?
9. Do you know where your clients typically redeem their NAP benefits?
a. IF YES: What types of stores do they usually go to? PROBE: Superstores (e.g., Sam’s Club, Costco, Walmart), supermarkets (e.g., Amigo, Pueblo, Econo, Plaza Loiza), small grocery or convenience stores (e.g., gas station food store, mom-and-pop store), specialty stores (e.g., baker, butcher) or farmers' markets?
b. IF YES: how frequently do they shop to redeem their NAP benefits?
c. IF YES: How far do clients typically have to travel to redeem their NAP benefits?
10. Have you ever heard about clients delaying getting food because of difficulty accessing a store where they can redeem their benefit?
11. Does your organization provide assistance to help your NAP clients do their food shopping?
a. IF YES: Please describe.
b. Are you aware of any such services available in your area to help people do their food shopping?
V. Current Purchasing Practices 12. How familiar are you with your clients’ food purchasing practices?
NAP beneficiaries receive a benefit every month, as you know. Seventy-five percent of the benefit is to be spent at certified retailers by using their Family Card and 25 percent can be spent on cash. Given what you know/understand about your client’s food shopping:
13. What types of things do you think your clients use the cash portion of their benefit to buy?
a. Food? PROBE: Any specific types of food?
b. Nonfood items? PROBE: What types of nonfood items?
14. Do you think your clients are aware of the regulations regarding what can and cannot be purchased with their Family Card?
VI. Impact of Removal of Cash Benefit Now I want to give you a scenario to think about. Imagine that next month, NAP benefits were the same amount they normally are, but there was no longer a portion that could be used as cash. In other words, it would all need to be used to purchase food from certified retailers and none could be redeemed as cash.
15. What are some of the ways that would impact your clients?
a. Would it change where they shop?
b. Would any of your clients have difficulty purchasing certain items without the cash benefit? IF YES: What items in particular?

Examination of Cash Nutrition Assistance Program Benefits in Puerto Rico
Page C-32
c. Would any subgroups be impacted more than others? PROBE: Female heads of household? Grandparent heads of household? People who are homeless? People with disabilities or other health conditions?
16. For clients who use the cash portion to purchase food items, would this impact their ability to access food?
17. For clients who use the cash portion to purchase nonfood items, would this impact their ability to purchase these items?
a. How do you think your clients will obtain these items? PROBE: Help from community organizations? Friends? Family? Other government assistance?
VII. Other Sources of Assistance/Income 18. What are some of the other places your clients get cash (such as a retirement pension, child
support, or assistance programs)?
a. Do they participate in any other Federal or local assistance programs? (PROBE IF YES: Which ones?)
VIII. Conclusion and Wrap Up 19. In conclusion, what are some reasons you think the cash portion should or should not be removed?
20. Is there anything else you’d like to tell us?
Those are all of the questions we have for you today. Thank you for your time, your assistance is greatly appreciated.

Examination of Cash Nutrition Assistance Program Benefits in Puerto Rico
Page C-33
C.5. GROUP RESIDENTIAL FACILITY INTERVIEW GUIDE
PURPOSE: Assess group home administrators’ experiences with the cash and noncash portion of their residents’ Family Card75 benefit, and explore potential impacts of eliminating the cash portion of the benefit.
As you reviewed in the consent form, we are conducting a research study to better understand how Family Card holders spend their NAP benefits. For this study, we will be talking with NAP beneficiaries, retailers, community organizations and group residential facilities like yours all across Puerto Rico.
Since we are talking to many organizations across Puerto Rico, audio recordings help us remember who said what so I don’t need to worry about taking notes. Only people working on this study will have access to the recordings.
Would it be ok if I record our discussion?
I. Background on Group Residential Facility 1. Please tell me about your role at [FACILITY NAME] and how long you’ve been here.
2. Can you tell me about the history and mission of your facility?
a. When was it founded?
b. How is the facility funded? PROBE: Government? Private? Resident contributions?
c. Who operates the facility? PROBE: Government? Private?
d. Are there multiple sites/ locations?
e. Can you describe the services that you offer?
3. Can you tell me about the population(s) you serve?
a. How many residents live here?
b. Are they all from a similar demographic? PROBE: Age, gender, health condition, other commonalities?
c. What amount of your residents receives NAP benefits? PROBE: All, some none?
II. Background on Redemption of NAP Benefits 4. Can you walk me through how your residents’ NAP benefits are redeemed?
5. Which of the following approaches describes how your residents’ NAP benefits are redeemed:
a. Do you/your facility redeem 100 percent of the individual residents’ benefits (that is, both the 75-percent noncash and 25-percent cash portion) to buy food?
b. Do you/your facility redeem only the 75-percent (noncash) portion of the individual residents’ benefits to buy food? And the remaining 25-percent portion is used directly by the residents to make cash purchases as they like?
c. Do you/your facility not redeem any of your residents’ benefits? So all residents are responsible for redeeming all 100 percent of their card? [IF YES, PROCEED TO SECTION IV]
75 Note that for OMB review, the Family Card is the EBT card referred to in Puerto Rico as the Tarjeta de la Familia.

Examination of Cash Nutrition Assistance Program Benefits in Puerto Rico
Page C-34
d. Or is there a mix of options based on the resident? PROBE: How is the mix defined?
III. Facility’s NAP Purchasing Practices [Only for Facilities That Redeem Some or All of Residents’ NAP Benefits] 6. Thinking of all of the food purchases you make for your facility, what proportion is made using NAP
benefits? PROBE: All, some, none?
7. Let’s focus on the purchases you make using your residents’ NAP benefits, where do you make those purchases? PROBE: Do you usually go to superstores (e.g., Sam’s Club, Costco, Walmart), supermarkets (e.g., Amigo, Pueblo, Econo, Plaza Loiza), small grocery or convenience stores (e.g., gas station food store, mom-and-pop store), specialty stores (e.g., baker, butcher) or farmers’ markets?
a. How far do you travel to make these purchases?
b. How frequently do you shop for food/have it delivered?
8. Logistically, how do the purchases work? PROBE: Do you have one Family Card for each resident that you bring to the store?
9. What are the things you typically purchase with the noncash NAP benefits? How often do you purchase each of the following items using the noncash NAP benefits:
a. Perishable food (e.g., fresh fruits and vegetables, dairy products, bread, meat, poultry)?
b. Prepared food (e.g., sandwiches, salad bar)
c. Nonperishable food (e.g., canned foods, tomato sauce, dried beans)
10. [IF FACILITY ALSO REDEEMS RESIDENTS’ CASH PORTION] What about the cash portion of the benefit?
a. Where do you usually spend that? PROBE: Stores that accept the Family Card? Other stores?
b. How do you usually access the cash portion of the benefit?? ATM? Cash–back? Bank? Using entire benefit (100 percent, cash and noncash) on food purchases at stores that accept the Family Card? Other?
c. What are the things you typically purchase with the cash benefit? How often do you purchase each of the following items
i. Perishable food (e.g., fresh fruits and vegetables, dairy products, bread, meat, poultry)?
ii. Prepared food (e.g., sandwiches, salad bar)
iii. Nonperishable food (e.g., canned foods, tomato sauce, dried beans)
iv. Items other than food? PROBE: For items other than food, what are some nonfood items you use the cash benefit to pay for? (e.g., detergent, medicine, diapers, supplies for the facility)?
11. Have you experienced any challenges or difficulties redeeming NAP benefits on behalf of your residents? PROBE: Difficulty accessing certified retailers? Difficulty accessing cash? Logistical challenges associated with redeeming benefits for multiple people? Other? [GO TO PART V]

Examination of Cash Nutrition Assistance Program Benefits in Puerto Rico
Page C-35
IV. Resident’s NAP Purchasing Practices [Only for Facilities Whose Residents Redeem 100 Percent of Their Own NAP Benefits] 12. Are your clients generally able to do their own food shopping?
a. IF NO: What are some of the things that make it hard for them to shop for themselves?
13. How easy or difficult is it for your clients do redeem their NAP benefits?
a. What barriers do they face?
14. Do you know where your residents typically redeem their NAP benefits?
a. IF YES: what types of stores do they usually go to? PROBE: Superstores (e.g., Sam’s Club, Costco, Walmart), supermarkets (e.g., Amigo, Pueblo, Econo, Plaza Loiza), small grocery or convenience stores (e.g., gas station food store, mom-and-pop store), specialty stores (e.g., baker, butcher) or farmers’ markets?
b. IF YES: How frequently do they shop to redeem their NAP benefits?
c. IF YES: How far do clients typically have to travel to redeem their NAP benefits?
15. Have you ever heard about clients delaying getting food because of difficulty accessing a store where they can redeem their benefits?
16. Does your facility provide assistance to help your clients do their food shopping?
a. IF YES: Please describe.
b. Are you aware of any such services available in your area to help people do their food shopping?
17. How familiar are you with your clients’ food purchasing practices?
NAP beneficiaries receive a benefit every month, as you know. Seventy-five percent of the benefit is to be spent at certified retailers by using their Family Card and 25 percent can be spent on food or redeemed for cash. Given what you know/understand about your client’s food shopping:
18. What types of things do you think your clients use the noncash Family Card portion of their benefit to buy?
a. Food? PROBE: Any specific types of food? Where/how do they store the food?
19. What types of things do you think your clients use the cash portion of their benefit to buy?
a. Food? PROBE: Any specific types of food?
b. Nonfood items? PROBE: What types of nonfood items?
20. Do you think your clients are aware of the regulations regarding what can and cannot be purchased with their Family Card?
V. Effect of Removal of Cash Benefit Now I want to give you a scenario to think about. Imagine that next month, your residents’ benefit was the same amount it normally is, but that there was no longer a portion that could be used as cash. In other words, it would all have to be used to purchase food from NAP certified retailers, and none could be redeemed in cash.
21. What are some of the ways that would impact your residents?
a. Would it change where they shop?

Examination of Cash Nutrition Assistance Program Benefits in Puerto Rico
Page C-36
b. Would it be harder for them to get food?
c. Could they continue to buy items they are currently using the cash benefit for? IF YES: What specific items?
d. Any other impacts?
22. What are some ways that would impact your facility? PROBE: No impact? Would impact facility?
a. Would it change where you shop?
b. Would it be harder for you to get food?
c. Could you continue to buy items you are currently using the cash benefits for?
d. Any other impacts?
VI. Other Sources of Assistance/Income 23. What are some of the other places your residents get cash (such as a retirement pension, child
support, or assistance programs)?
a. Do they participate in any other Federal or local assistance programs? (PROBE IF YES: Which ones?)
VII. Conclusion 24. To wrap up, what are some reasons you think the cash portion of the NAP benefit should or should
not be eliminated?
Thank you for your time today. Your participation is greatly appreciated.
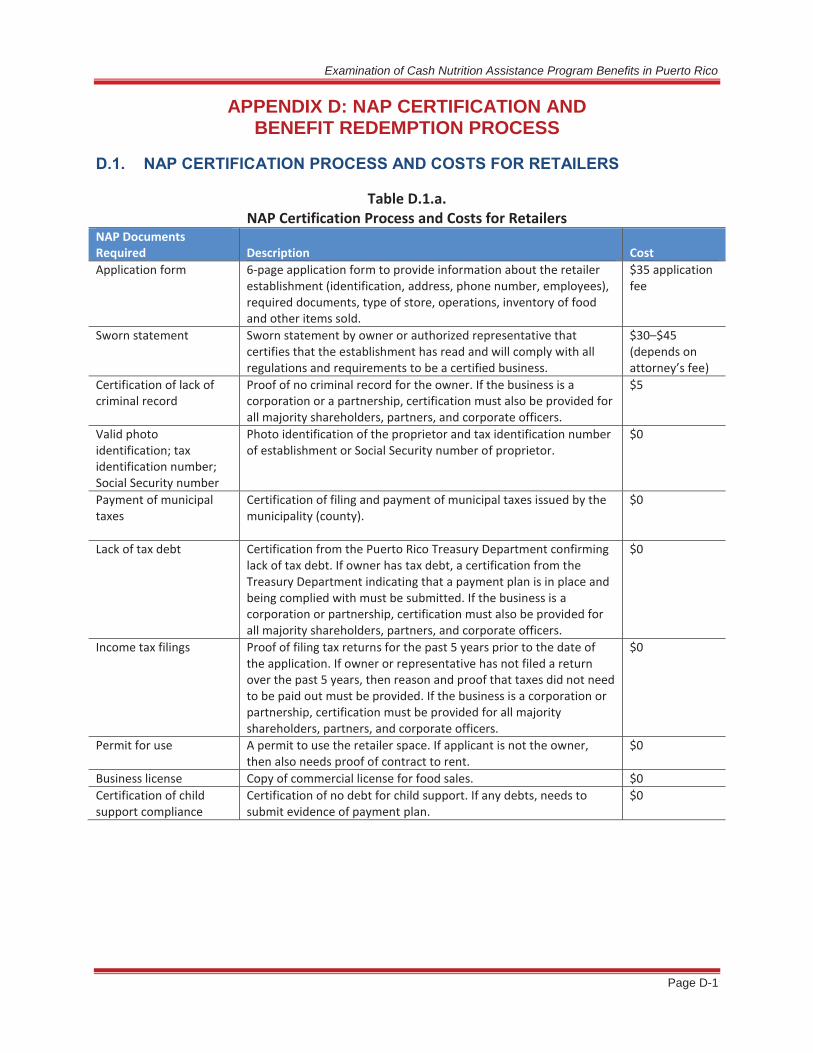
Examination of Cash Nutrition Assistance Program Benefits in Puerto Rico
Page D-1
APPENDIX D: NAP CERTIFICATION AND BENEFIT REDEMPTION PROCESS
D.1. NAP CERTIFICATION PROCESS AND COSTS FOR RETAILERS
Table D.1.a. NAP Certification Process and Costs for Retailers
NAP Documents Required Description Cost Application form 6-page application form to provide information about the retailer
establishment (identification, address, phone number, employees), required documents, type of store, operations, inventory of food and other items sold.
$35 application fee
Sworn statement Sworn statement by owner or authorized representative that certifies that the establishment has read and will comply with all regulations and requirements to be a certified business.
$30–$45 (depends on attorney’s fee)
Certification of lack of criminal record
Proof of no criminal record for the owner. If the business is a corporation or a partnership, certification must also be provided for all majority shareholders, partners, and corporate officers.
$5
Valid photo identification; tax identification number; Social Security number
Photo identification of the proprietor and tax identification number of establishment or Social Security number of proprietor.
$0
Payment of municipal taxes
Certification of filing and payment of municipal taxes issued by the municipality (county).
$0
Lack of tax debt Certification from the Puerto Rico Treasury Department confirming lack of tax debt. If owner has tax debt, a certification from the Treasury Department indicating that a payment plan is in place and being complied with must be submitted. If the business is a corporation or partnership, certification must also be provided for all majority shareholders, partners, and corporate officers.
$0
Income tax filings Proof of filing tax returns for the past 5 years prior to the date of the application. If owner or representative has not filed a return over the past 5 years, then reason and proof that taxes did not need to be paid out must be provided. If the business is a corporation or partnership, certification must be provided for all majority shareholders, partners, and corporate officers.
$0
Permit for use A permit to use the retailer space. If applicant is not the owner, then also needs proof of contract to rent.
$0
Business license Copy of commercial license for food sales. $0 Certification of child support compliance
Certification of no debt for child support. If any debts, needs to submit evidence of payment plan.
$0

Examination of Cash Nutrition Assistance Program Benefits in Puerto Rico
Page D-2
Additional NAP documents required if a corporation:
Table D.1.b. NAP Certification Process and Costs for Retail Stores That Are Corporations
NAP Documents Required Description Cost Certification of payroll Certification of payroll filings in the last 5 years. $0 Certification of no contributory debt
Certification of no debt relating to a business insurance plan or pension.
$0
Corporative resolution Indicating the company representative who is authorized as manager, or if the corporation wants to have only one owner representing the company at ADSEF.
$0
State incorporated certification
Legal document relating to the formation of a company or corporation. It is a license to form a corporation issued by State government.
$0
NAP Certification Process
Retailers complete and submit an application along with supporting documents to ADSEF. ADSEF enters data and visits retailers to confirm that the establishment is eligible for certification. During the onsite investigation, the ADSEF inspector verifies the information provided by the retailer is accurate; reviews the store inventory in order to confirm the availability of NAP eligible goods; verifies there is an adequate technical infrastructure (e.g., POS machines) to support redeeming NAP benefits; provides orientation on the regulations (e.g., fines and eligible/ineligible goods). If recertifying, ADSEF compares the retailer’s inventory with EBT transaction reports and verifies the certification and the Anti–Fraud Hotline posters are exhibited in a visible area. ADSEF personnel will approve or deny the application and/or request additional information within 30 days after receipt of the original application.
NAP Certification Equipment Costs and Transaction Fees
Certified retailers must obtain POS equipment to process EBT transactions. Puerto Rico does not assume the cost of these machines. Retailers may rent POS machines from their respective banks (at approximately $25 per month) or purchase them. The retailer and bank negotiate costs associated with the POS machine. Banks are responsible for programming the POS machine to be compatible with EBT. The POS system requires a dedicated telephone line, a personal identification number (PIN) pad, a printer, and a processor. Transaction fees average $0.25–$0.35 per transaction and vary by the retailer’s banking institution.

Examination of Cash Nutrition Assistance Program Benefits in Puerto Rico
Page D-3
D.2. NAP BENEFIT REDEMPTION PROCESS
Source: Retailer interviews; observations of certified retailer POS devices

Insight Policy Research, Inc.1901 North Moore Street
Suite 1100Arlington, VA 22209
www.insightpolicyresearch.com