exam pack - gimmenotes
TRANSCRIPT

1
EXAM PACK
MODULE
ECS 1601

2
DATE
2017

3
ECS 1601
OCTOBER/NOVEMBER 2016 SOLUTIONS.
SECTION A COMPULSORY ESSAY QUESTIONS
QUESTION 1:
1(a) BRIEFLY EXPLAIN DEMAND MANAGEMENT POLICIESAND HOW THEY CAN BE USED IN THE ECONOMY (3)
There are two policies that can be used to manage the demand for goods andservices
(i) The Fiscal policy (Government): The two main instruments that the governmentcan use to manage the demand for goods and services are government spendingthe taxes
Expansionary/Stimulatory policy: Increase Government spending and/ordecrease taxes
Restrictive/contractionary policy: Decrease government spending and/orincrease taxes.
(ii) The monetary policy (SARB): The main instrument used by the Reserve bank isthe interest rate. Expansionary/Stimulatory policy: Decrease the interest rate.
Restrictive/contractionary policy: Increase the interest rate.
1(b) DISTINGUISH BETWEEN A FLOW VARIABLE AND ASTOCK VARIABLE. GIVE ONE EXAMPLE OF EACH (4)
Flow variable: This type of variable is measured over a period. E.gOn 25th April 2014 the inflow into Gariep dam was measured at88cubic meters per second.
Stock variable: This particular variable can only be measuredexactly at a particular point in time. At 0.00 on 25th April 2014 thelevel at the Gariep dam was at 95.8%
4
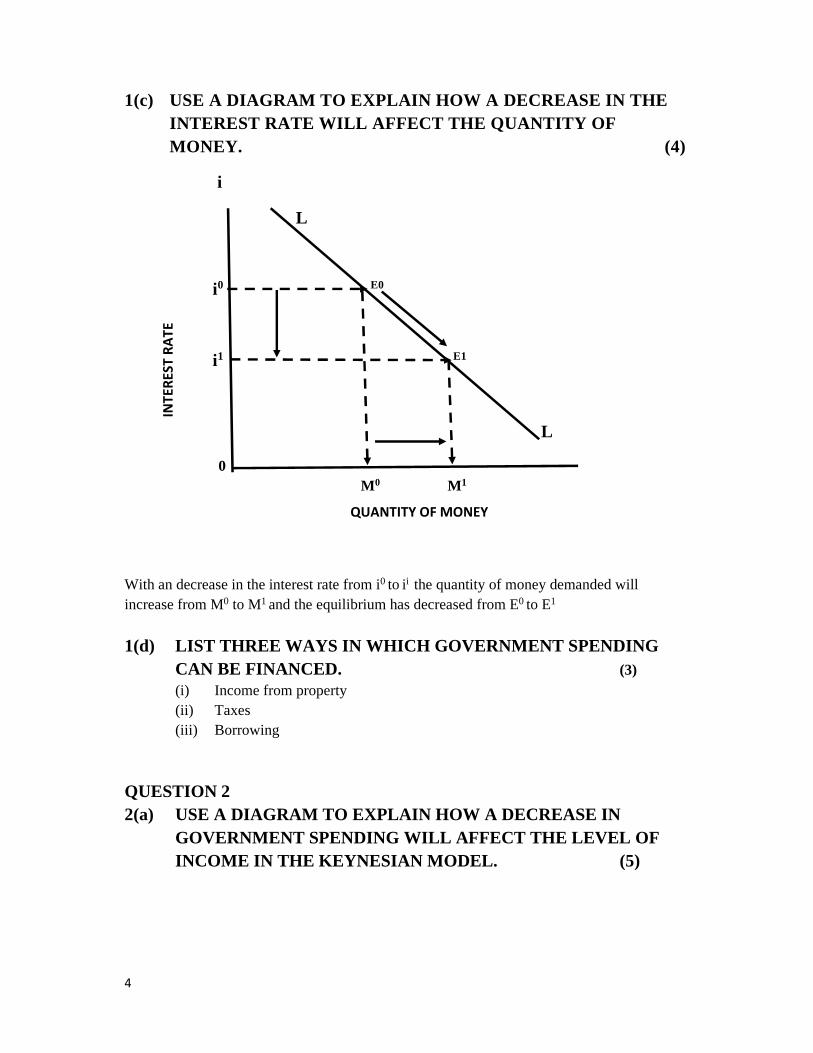
1(c) USE A DIAGRAM TO EXPLAIN HOW A DECREASE IN THEINTEREST RATE WILL AFFECT THE QUANTITY OFMONEY. (4)
i
L
i0 E0
i1 E1
L
0M0 M1
With an decrease in the interest rate from i0 to ii the quantity of money demanded willincrease from M0 to M1 and the equilibrium has decreased from E0 to E1
1(d) LIST THREE WAYS IN WHICH GOVERNMENT SPENDINGCAN BE FINANCED. (3)(i) Income from property(ii) Taxes(iii) Borrowing
QUESTION 22(a) USE A DIAGRAM TO EXPLAIN HOW A DECREASE IN
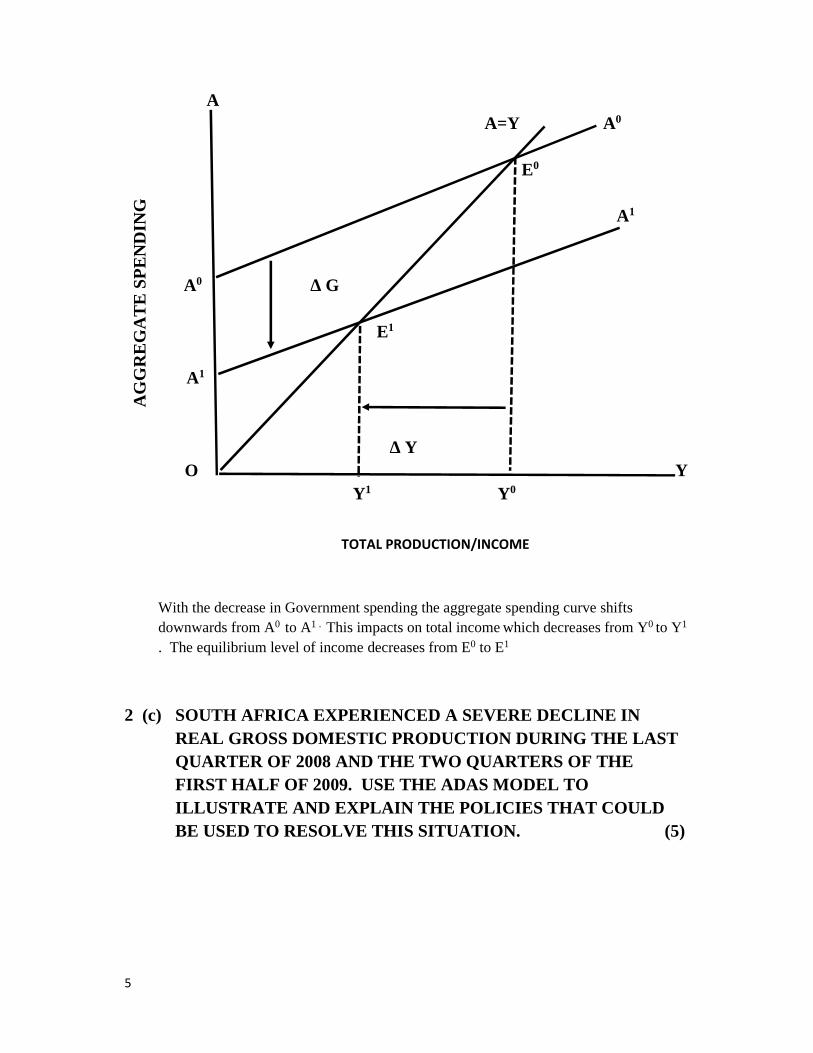
GOVERNMENT SPENDING WILL AFFECT THE LEVEL OFINCOME IN THE KEYNESIAN MODEL. (5)
INTE
REST
RAT
E
QUANTITY OF MONEY
5
AA=Y A0
E0
A1
A0 ∆ G
E1
A1
∆ YO Y
Y1 Y0
With the decrease in Government spending the aggregate spending curve shiftsdownwards from A0 to A1 . This impacts on total income which decreases from Y0 to Y1
. The equilibrium level of income decreases from E0 to E1
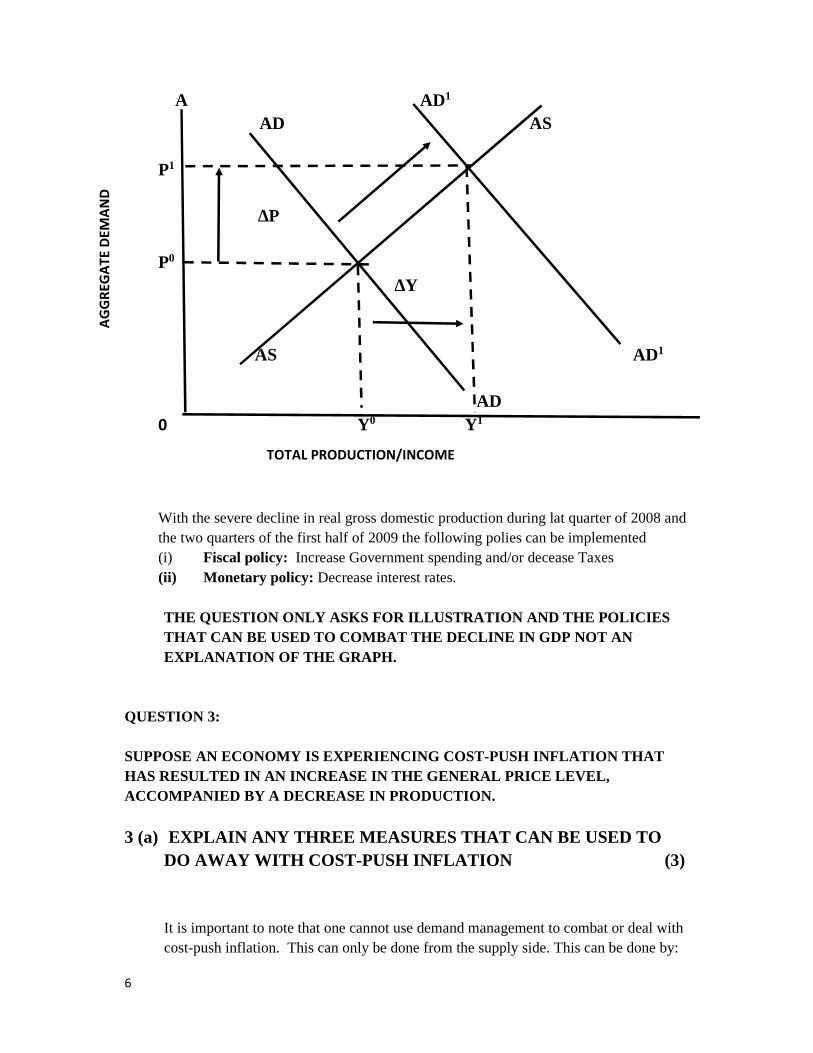
2 (c) SOUTH AFRICA EXPERIENCED A SEVERE DECLINE INREAL GROSS DOMESTIC PRODUCTION DURING THE LASTQUARTER OF 2008 AND THE TWO QUARTERS OF THEFIRST HALF OF 2009. USE THE ADAS MODEL TOILLUSTRATE AND EXPLAIN THE POLICIES THAT COULDBE USED TO RESOLVE THIS SITUATION. (5)
TOTAL PRODUCTION/INCOME
AG
GR
EG
AT
E S
PE
ND
ING
AGGR
EGAT
ESP
ENDI
NG
6
A AD1
AD AS
P1
∆P
P0
∆Y
AS AD1
AD0 Y0 Y1
Y
With the severe decline in real gross domestic production during lat quarter of 2008 andthe two quarters of the first half of 2009 the following polies can be implemented(i) Fiscal policy: Increase Government spending and/or decease Taxes(ii) Monetary policy: Decrease interest rates.
THE QUESTION ONLY ASKS FOR ILLUSTRATION AND THE POLICIESTHAT CAN BE USED TO COMBAT THE DECLINE IN GDP NOT ANEXPLANATION OF THE GRAPH.
QUESTION 3:
SUPPOSE AN ECONOMY IS EXPERIENCING COST-PUSH INFLATION THATHAS RESULTED IN AN INCREASE IN THE GENERAL PRICE LEVEL,ACCOMPANIED BY A DECREASE IN PRODUCTION.
3 (a) EXPLAIN ANY THREE MEASURES THAT CAN BE USED TODO AWAY WITH COST-PUSH INFLATION (3)
It is important to note that one cannot use demand management to combat or deal withcost-push inflation. This can only be done from the supply side. This can be done by:
AGGR
EGAT
E DE
MAN
D
TOTAL PRODUCTION/INCOME

7
(i) Decrease wage and salaries: This is very difficult to do since it will bringabout both economic and psychological consequences which will lead to loss ofjobs and frustration and anger from the population. (Shift of the AS curve to theright)
(ii) Decrease profits: Again difficult to do since capitalism is driven by self-interest and profit and most companies will be very reluctant to reduce theirprofits to the detriment of their shareholders. (Shift of AS curve to the right)
(iii) Increase productivity: This is probably the best solution because with anincrease in productivity inflation will decrease and GDP will increase andhence employment will also increase. (Shift of the AS curve to the right)
3(b) EXPLAIN WHY POLICY MAKERS REGARD INFLATION AS APROBLEM. REFER TO THE EFFECTS OF INFLATION IN YOUREXPLANATION (5)
There is a relationship between high inflation and unemployment (the higher theinflation the lower the unemployment and the lower the inflation rate the higher heunemployment rate). Higher inflation leads to higher prices which consumers cannotafford to pay for so unemployment results. If the authorities want to reduceunemployment by increasing spending the result is an increase in inflation. There arethree sets of effects on inflation:(i) Distribution effects: Inflation affects the distribution of income and wealth
among the various participants in the economy.
Inflation benefits debtors (borrowers) at the expense of creditors(lenders). If Joe lends R1000.00 to Jack and the inflation rate is 10%then Jack effectively only has to pay R900 back to Joe (R1000 – 100=R900 (real income)). The same problem applies to interest rate. If thenominal interest rate is lower than inflation then the interest rate will benegative.
Redistribute income and wealth from the elderly (lenders) to the young(borrowers).
Since the Government is always a borrower so there is redistribution ofincome and wealth form the private sector to the government.
(ii) Economic effects: if decision makes in the private sector anticipate inflationthey will look for other ways to divert their efforts. They will indulge in speculative practices such as investing in classic
cars, shares property etc. and not in new innovative production methodsor products and services.
Discourage savings Balance of payments problems
8
(iii) Social and political effects: Inflation forces prices up and this effect largesegments of the population, especially the poor, because they now have to payincreased taxi fares, rents, services, etc. Inflation I public enemy no 1.
3 (c)BRIEFLY EXPLAIN THE CONFLICT APPROACH TOINFLATION. (5)Mohr et al 2015 states that inflation I a symptom of a fundamental disharmony insociety which results in a continuous imbalance between the rate of growth of the totaleffective claims on this income. The different economic and social groups togetherclaim more income than is produced. As the rival groups (trade unions, employerorganisations, large firms, business organisations, professional associations etc.) eachtry to claim more than their share in “the pie” inflation results.
QUESTION 4:
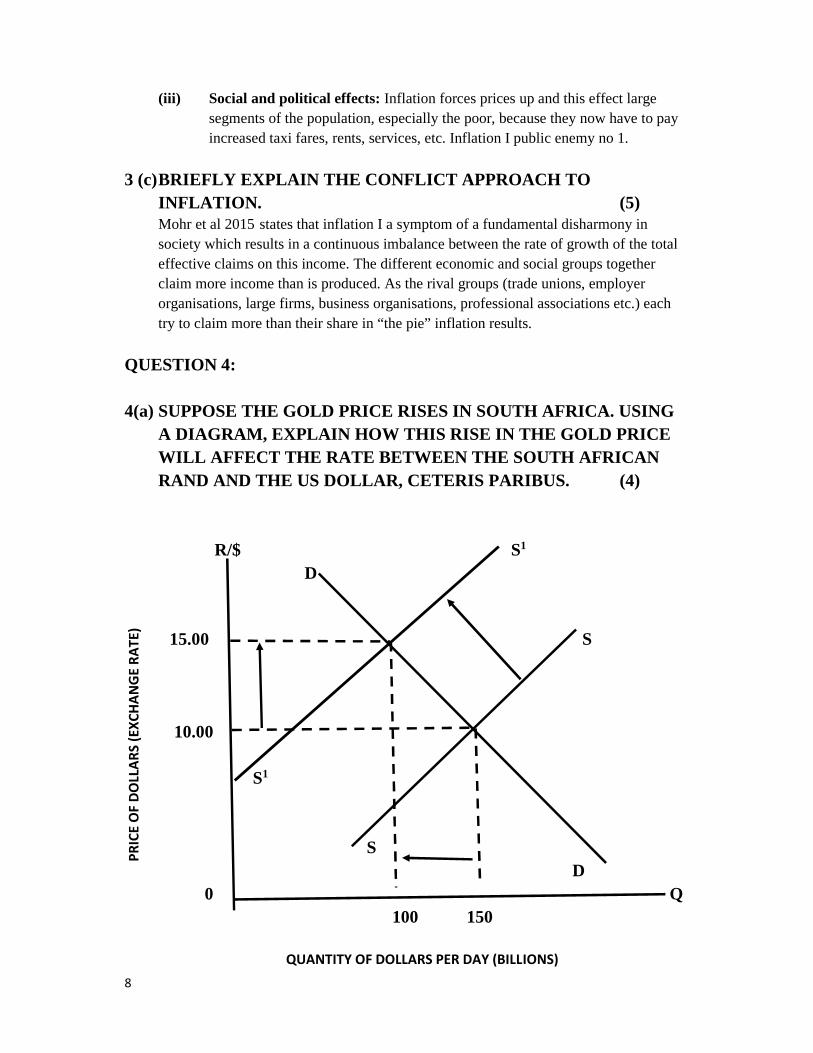
4(a) SUPPOSE THE GOLD PRICE RISES IN SOUTH AFRICA. USINGA DIAGRAM, EXPLAIN HOW THIS RISE IN THE GOLD PRICEWILL AFFECT THE RATE BETWEEN THE SOUTH AFRICANRAND AND THE US DOLLAR, CETERIS PARIBUS. (4)
R/$ S1
D
15.00 S
10.00
S1
SD
0 Q100 150
PRIC
E OF
DOL
LARS
(EXC
HANG
E RA
TE)
QUANTITY OF DOLLARS PER DAY (BILLIONS)

9
With the increase in the price of gold in South Africa there will be less exports since gold isone of SA’s main exports. This means hat dollars will come into South Africa with this dropin exports. This results in the supply curve for dollars shifting to the left from SS to S1S1.The quantity of dollars will decrease from 150 billion to 100 billion per day. The rand hasdepreciated from R10 per dollar to R15.00 per dollar.
4(b) MENTION AND EXPLAIN TWO FACTORS THAT INFLUENCETHE EFFECTIVENESS OF THE MONETARY TRANSMISSIONMECHANISM (4)
The key element of the transmission mechanism is in the relationship between theinterest rate (i) and investment spending (I) which is an important component of bothaggregate spending and aggregate demand. There is an inverse relationship betweeninterest rates and investment spending. The higher the interest rate the less demandfor investment spending. The lower the interest rate the higher the demand forinvestment spending. Unless investment spending has an inelastic demand to interest
rates. ∆i ∆I ∆A ∆Y
A change in the interest rate leads to a change in investment spending, a change inaggregate spending and a change in chnge in total production or income. This appliesto the Keynesian model which assumes that prices and wages are fixed.We drop this assumption when we move to the AD-AS model, we get the following
formula ∆Y∆i ∆I ∆A ∆AD
∆PA change in the interest rate leads to a change in investment spending, a change in
aggregate spending and a change in aggregate demand. The change in aggregatedemand results in a change in total production or income and a change in the price.
SECTION BQUESTION ANSWERB1 1B2 2B3 3B4 3B5 2B6 2B7 3B8 1B9 2B10 4B11 1B12 3
10
B13 5B14 5B15 2B16 1B17 4B18 3B19 4B20 3B21 2B22 2B23 1B24 1B25 5B26 4B27 4B28 1B29 1B30 3
ECS 1601 EXAM PAPER MAY/JUNE 2016
SECTION A – COMPULSORY ESSAY QUESTIONSAnswer ALL the following questions in the space provided. Section Acounts 50 marks in total.
Question 1 (13)
(1a) Define money. (2)
Money is anything that is generally accepted as payment for goods and services or that isaccepted in settlement of debt (page 256 text book)
(1b) (1b) Distinguish between the three broad functions of government. (3)
11
(i) Allocative function: This refers to the role of government in correcting marketfailure and achieving a more efficient allocation of resources
(ii) The distributive function: This refers to steps taken by the government to achieve amore equitable or socially acceptable distribution of money ta that generated bymarket forces
(iii) The stabilisation function: This refers to the measures taken by government topromote macroeconomic stability (full employment, price stability and balance ofpayments stability) (page 286 text book)
(1c) Define the South African balance of payments. (2)Each country keeps a record of its transactions with the rest of the world. Hs accountingrecord is called the balance of payments. (page 249 text book)
(1d) Differentiate between nominal and real prices. (2)Nominal prices include inflation and real prices exclude inflation. It would be senseless tojust calculate monetary values between different years, allowances have to be made for thefact that prices increase. (page 239 text book)
(1e) List four problems associated with GDP as a measure of totalproduction in the economy. (4)
What are the problems with using GDP?
• Goods and services not sold in the market are not counted in GDP – Non marketproduction.
• Some activities or transactions in the economy are never recorded in the informalsector. An example is illegal activities.
• Data used is not always as accurate as it could be, so values are often revised andadjusted.
• GDP has no indicator of economic welfare. This means that R100 million spent onmilitary goods and hardware is measured in the same way that R100 millionwould be measured when spent on education.
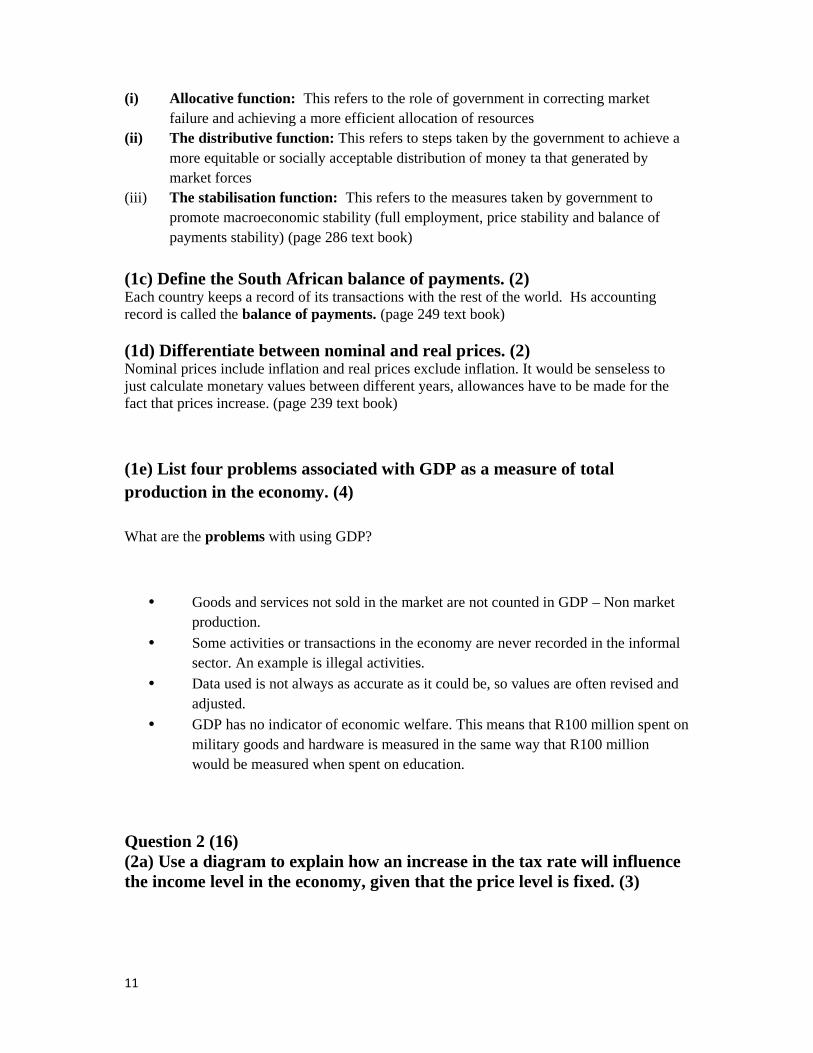
Question 2 (16)(2a) Use a diagram to explain how an increase in the tax rate will influencethe income level in the economy, given that the price level is fixed. (3)
12
A A = Y
A0
∆t A1
A0
0 YY1 Y0
Explanation:With an increase in the tax rate the aggregate spending curve swivels downwards from A0 toA1. The income level will decrease from Y0 to Y1.
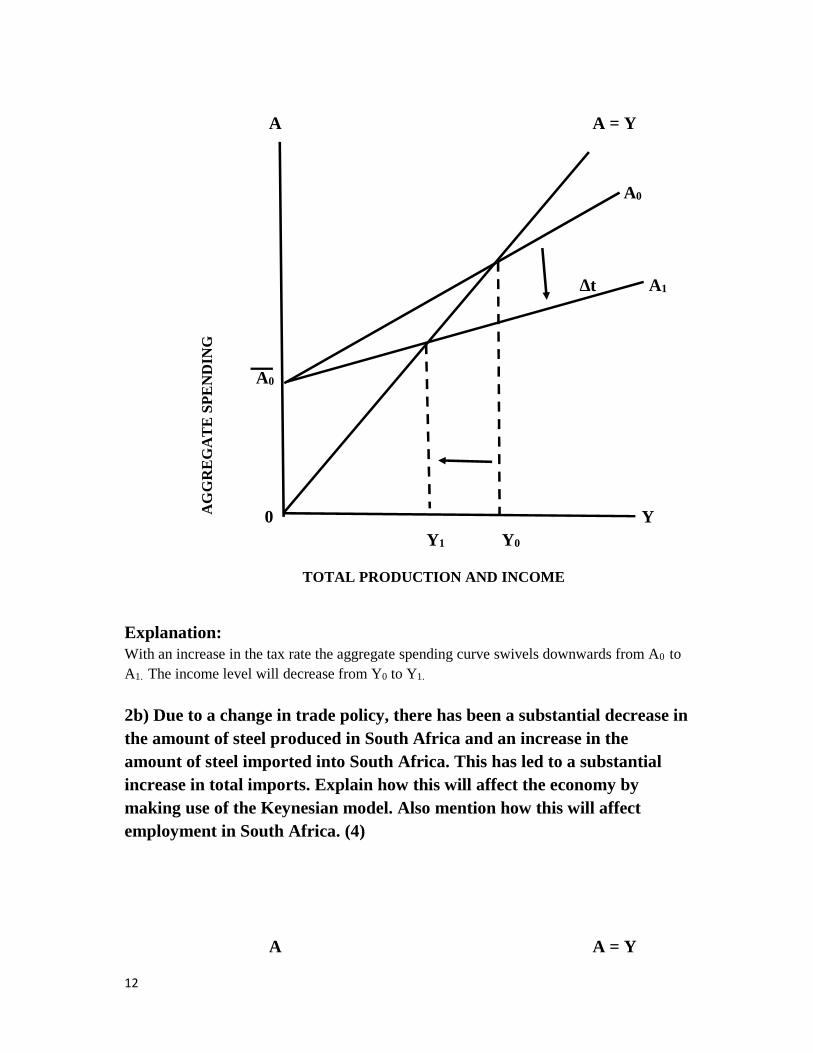
2b) Due to a change in trade policy, there has been a substantial decrease inthe amount of steel produced in South Africa and an increase in theamount of steel imported into South Africa. This has led to a substantialincrease in total imports. Explain how this will affect the economy bymaking use of the Keynesian model. Also mention how this will affectemployment in South Africa. (4)
A A = Y
AG
GR
EG
AT
E S
PE
ND
ING
TOTAL PRODUCTION AND INCOME
13
A0
∆ x-zA1
A0
A1
0 YY1 Y0
Explanation:With an increase in imports the aggregate spending curve shifts downwards from A0 to A1.
The income level will decrease from Y0 to Y1. With the decrease in total production/incomeunemployment will increase
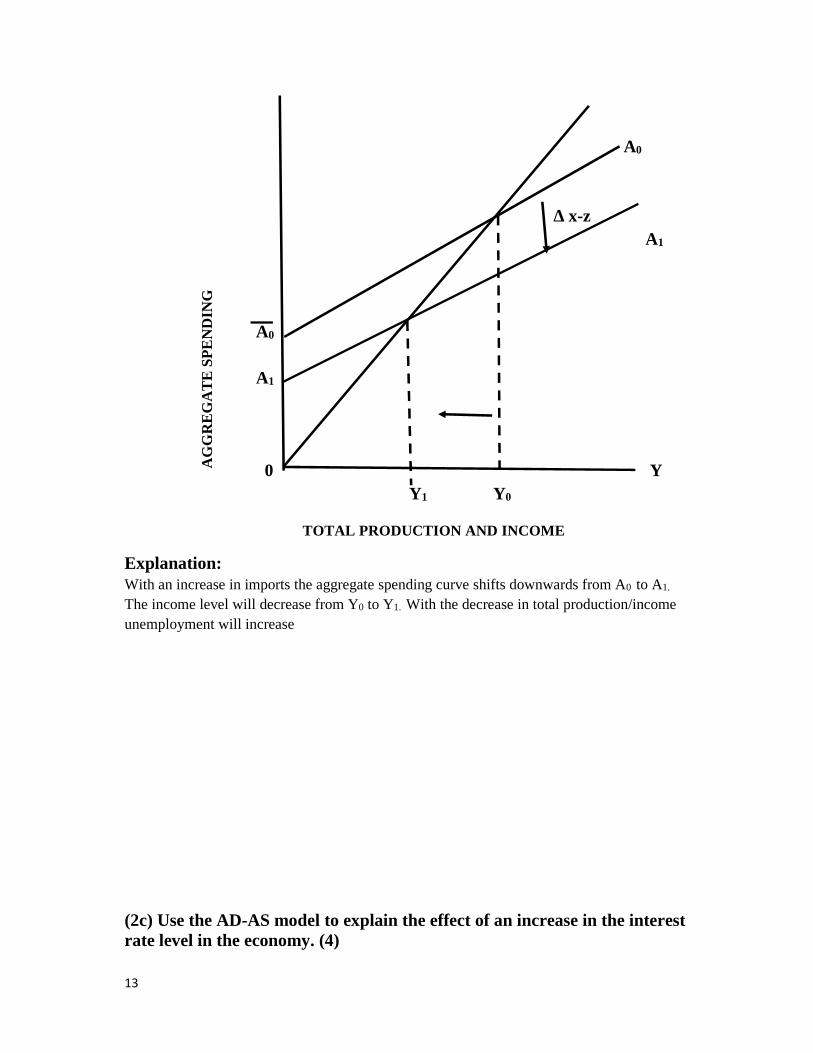
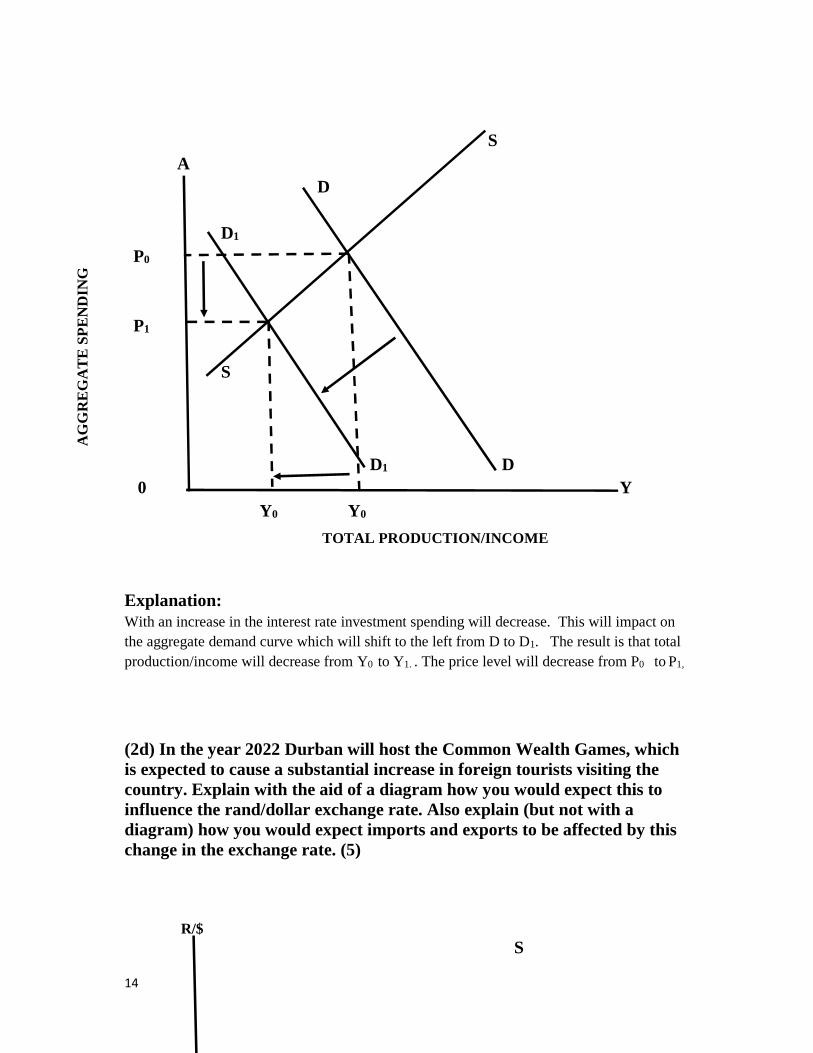
(2c) Use the AD-AS model to explain the effect of an increase in the interestrate level in the economy. (4)
AG
GR
EG
AT
E S
PE
ND
ING
TOTAL PRODUCTION AND INCOME
14
SA
D
D1
P0
P1
S
D1 D0 Y
Y0 Y0
Explanation:With an increase in the interest rate investment spending will decrease. This will impact onthe aggregate demand curve which will shift to the left from D to D1. The result is that totalproduction/income will decrease from Y0 to Y1. . The price level will decrease from P0 to P1,
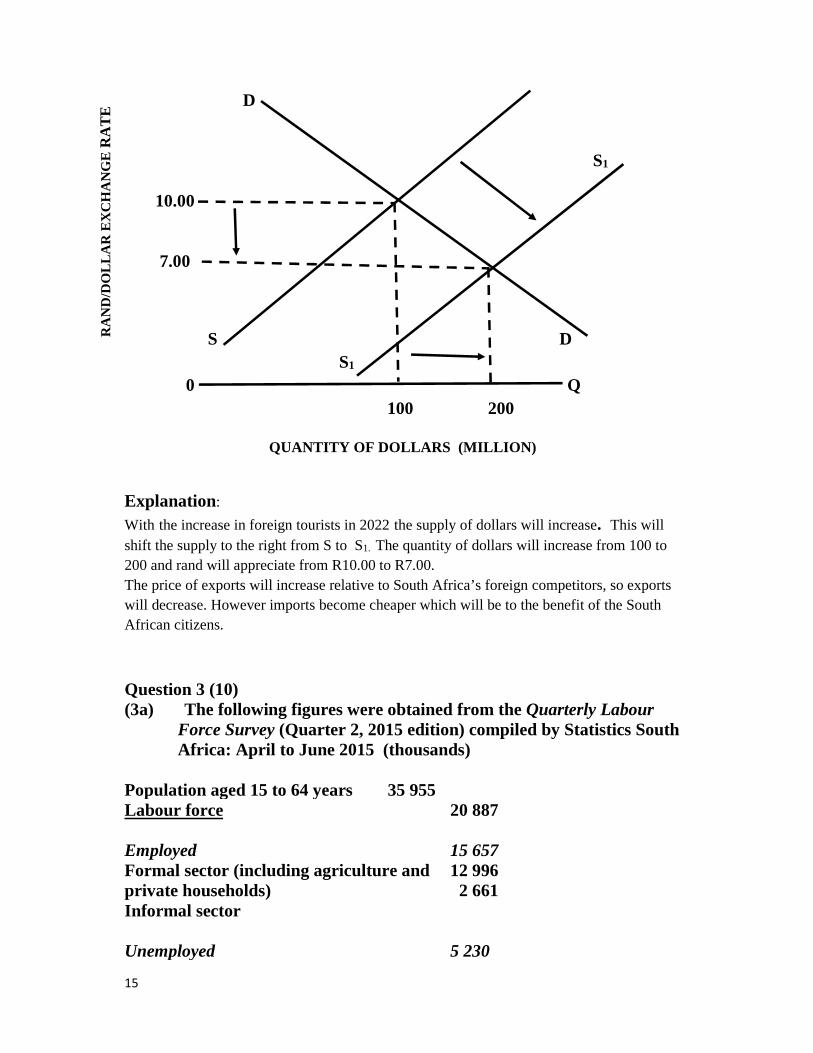
(2d) In the year 2022 Durban will host the Common Wealth Games, whichis expected to cause a substantial increase in foreign tourists visiting thecountry. Explain with the aid of a diagram how you would expect this toinfluence the rand/dollar exchange rate. Also explain (but not with adiagram) how you would expect imports and exports to be affected by thischange in the exchange rate. (5)
R/$S
AG
GR
EG
AT
E S
PE
ND
ING
TOTAL PRODUCTION/INCOME
15
D
S1
10.00
7.00
S DS1
0 Q100 200
Explanation:
With the increase in foreign tourists in 2022 the supply of dollars will increase. This willshift the supply to the right from S to S1. The quantity of dollars will increase from 100 to200 and rand will appreciate from R10.00 to R7.00.The price of exports will increase relative to South Africa’s foreign competitors, so exportswill decrease. However imports become cheaper which will be to the benefit of the SouthAfrican citizens.
Question 3 (10)(3a) The following figures were obtained from the Quarterly Labour
Force Survey (Quarter 2, 2015 edition) compiled by Statistics SouthAfrica: April to June 2015 (thousands)
Population aged 15 to 64 years 35 955Labour force
EmployedFormal sector (including agriculture andprivate households)Informal sector
Unemployed
20 887
15 65712 996
2 661
5 230
RA
ND
/DO
LL
AR
EX
CH
AN
GE
RA
TE
QUANTITY OF DOLLARS (MILLION)

16
Not economically active
Discouraged work-seekersOther (not economically active)
15 068
2 43412 633
(i) Calculate the unemployment rate according to the strict definition ofunemployment. (2)
According to the strict definition, unemployed persons are those persons who, being 15 yearsand older,
a. are not in paid employment or self-employment,b. were available for paid employment or self-employment during the seven days
preceding the interview, andc. took specific steps to during the four weeks preceding the interview to find paid
employment or self-employment.
20 887(Labour force) plus 2434 (discouraged workers) = 23321
Unemployment rate = Number of unemployedEconomically active population (People willing and able to work)
Unemployment rate = 5230 X 10023321
= 22.43%
(ii) Calculate the unemployment rate according to the expanded definitionof unemployment. (2)
The expanded definition omits requirement (c). In other words, the expanded definitionrequires only a desire to find employment. (discouraged workers)
Unemployment rate = 5230 X 10020887
= 25.04%
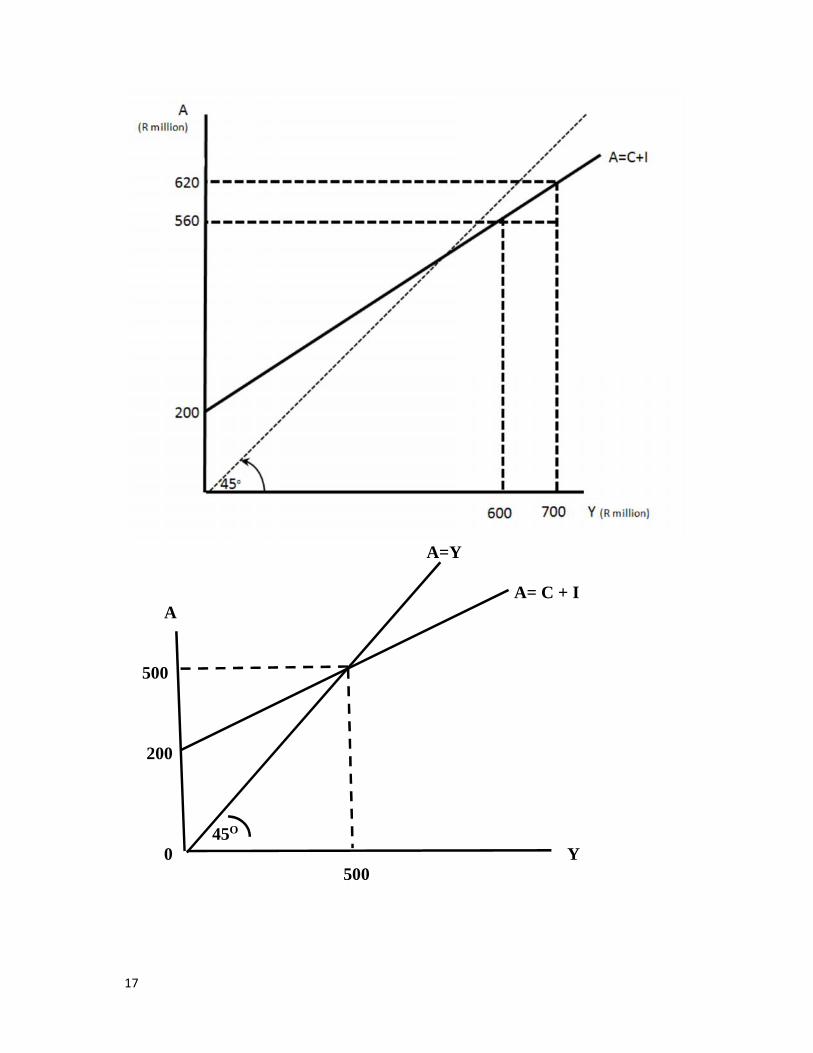
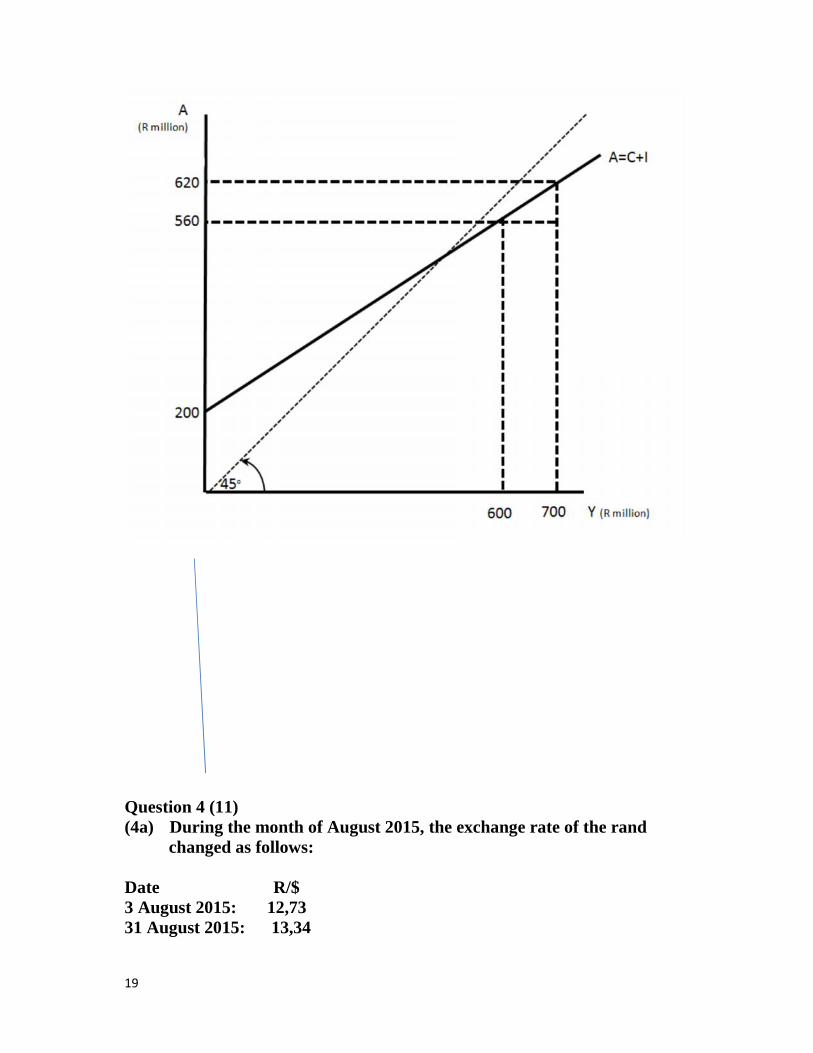
(3b) Use the information in the following diagram of the Keynesian modelto answer the questions that follow:
17
A=Y
A= C + IA
500
200
45O
0 Y500

18
(i) Calculate the marginal propensity to consume. (2)
MPC = ∆ A∆ Y
A2 – A1
Y2 – Y1
500 – 200500 - 0
300500
35
0.60
(ii) Calculate the multiplier. (2)
α = 11 – c
α = 11 – 0.60
α = 10.40
α = 2.50
(iii) Calculate the new equilibrium income level if investment increases byR100 million. (2)
Y0 = α A A = 200 + 100 =300
Y0 = 2.50 x 300
Y0 = 750
19
Question 4 (11)(4a) During the month of August 2015, the exchange rate of the rand
changed as follows:
Date R/$3 August 2015: 12,7331 August 2015: 13,34
20
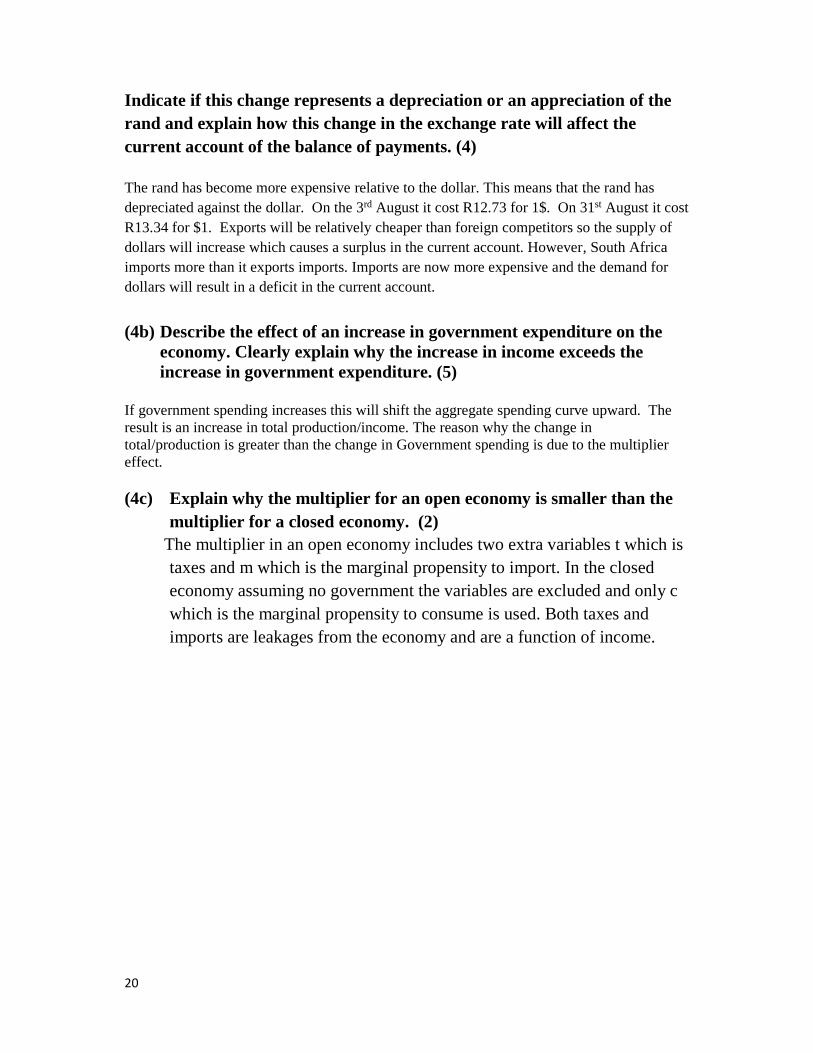
Indicate if this change represents a depreciation or an appreciation of therand and explain how this change in the exchange rate will affect thecurrent account of the balance of payments. (4)
The rand has become more expensive relative to the dollar. This means that the rand hasdepreciated against the dollar. On the 3rd August it cost R12.73 for 1$. On 31st August it costR13.34 for $1. Exports will be relatively cheaper than foreign competitors so the supply ofdollars will increase which causes a surplus in the current account. However, South Africaimports more than it exports imports. Imports are now more expensive and the demand fordollars will result in a deficit in the current account.
(4b) Describe the effect of an increase in government expenditure on theeconomy. Clearly explain why the increase in income exceeds theincrease in government expenditure. (5)
If government spending increases this will shift the aggregate spending curve upward. Theresult is an increase in total production/income. The reason why the change intotal/production is greater than the change in Government spending is due to the multipliereffect.
(4c) Explain why the multiplier for an open economy is smaller than themultiplier for a closed economy. (2)
The multiplier in an open economy includes two extra variables t which istaxes and m which is the marginal propensity to import. In the closedeconomy assuming no government the variables are excluded and only cwhich is the marginal propensity to consume is used. Both taxes andimports are leakages from the economy and are a function of income.
21
ECOS 1601 EXAM PAPER OCTOBER/NOVEMBER 2015
Policies to combat unemployment
Demand side steps:
• Additional employment opportunities can be created by raising the aggregatedemand for goods and services, and increasing the labour intensity of production.
• Increased government spending (expansionary fiscal policy)
• Stimulate consumption and investment spending by lowering taxes or interest rates.• Raise the demand for domestically produced goods and services by increasing the
demand for exports• Promoting labour intensive industries and labour-intensive production methods.
• Special employment programmes such as building dams, sports stadiums, etc.• Promoting small businesses and the informal sector.• Offering tax incentives or subsidies to firms to stimulate employment.
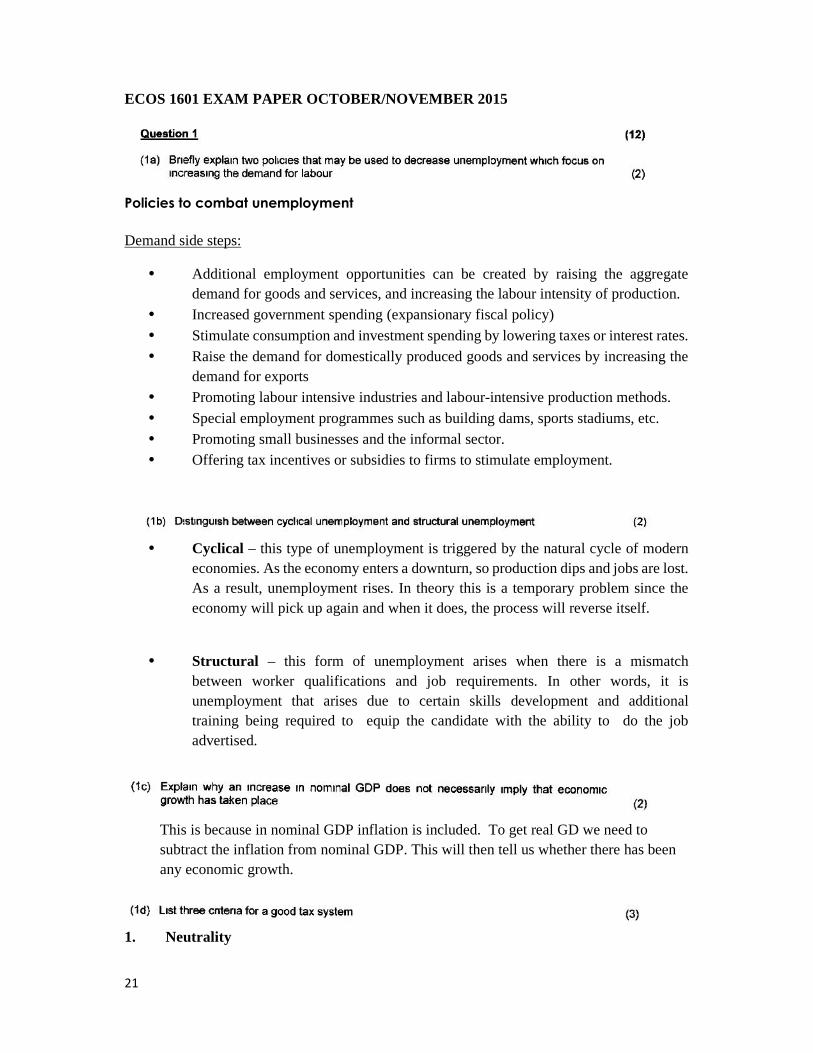
• Cyclical – this type of unemployment is triggered by the natural cycle of moderneconomies. As the economy enters a downturn, so production dips and jobs are lost.As a result, unemployment rises. In theory this is a temporary problem since theeconomy will pick up again and when it does, the process will reverse itself.
• Structural – this form of unemployment arises when there is a mismatchbetween worker qualifications and job requirements. In other words, it isunemployment that arises due to certain skills development and additionaltraining being required to equip the candidate with the ability to do the jobadvertised.
This is because in nominal GDP inflation is included. To get real GD we need tosubtract the inflation from nominal GDP. This will then tell us whether there has beenany economic growth.
1. Neutrality
22
2. Equity
3. Administrative simplicity
1. Formulation and implementation of monetary policy.
2. Service to the government.
3. Provision of economic and statistical services.
4. Maintaining financial stability
A A=YAo
Eo
A1
AO ∆ I E1∆
∆ YA1
0 YY1 Yo
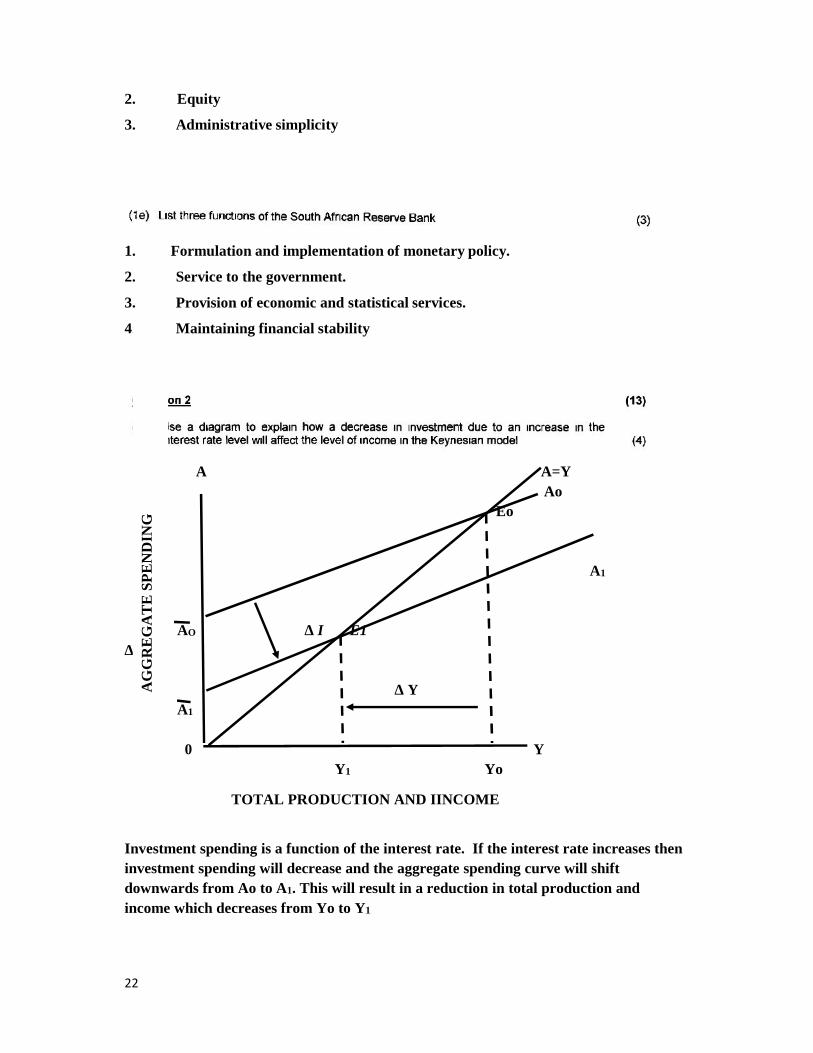
Investment spending is a function of the interest rate. If the interest rate increases theninvestment spending will decrease and the aggregate spending curve will shiftdownwards from Ao to A1. This will result in a reduction in total production andincome which decreases from Yo to Y1
AG
GR
EG
AT
E S
PE
ND
ING
TOTAL PRODUCTION AND IINCOME

23
AA
E
Eo
A
45o
0 YY Y1
The A curve shows the components of aggregate spending (C,I,G) before theintroduction of the foreign sector. . With the marginal propensity to import decreases itwill impact on the slope of the A curve and it will swivel upwards to A1. Total
production/Income will increase from Y to Y1
AG
GR
EG
AT
E S
PE
ND
ING
Total production/income
24
PAD AS
Eo
X > Z Z > XSurplus Deficit
AS AD
0 YYB YO Yf
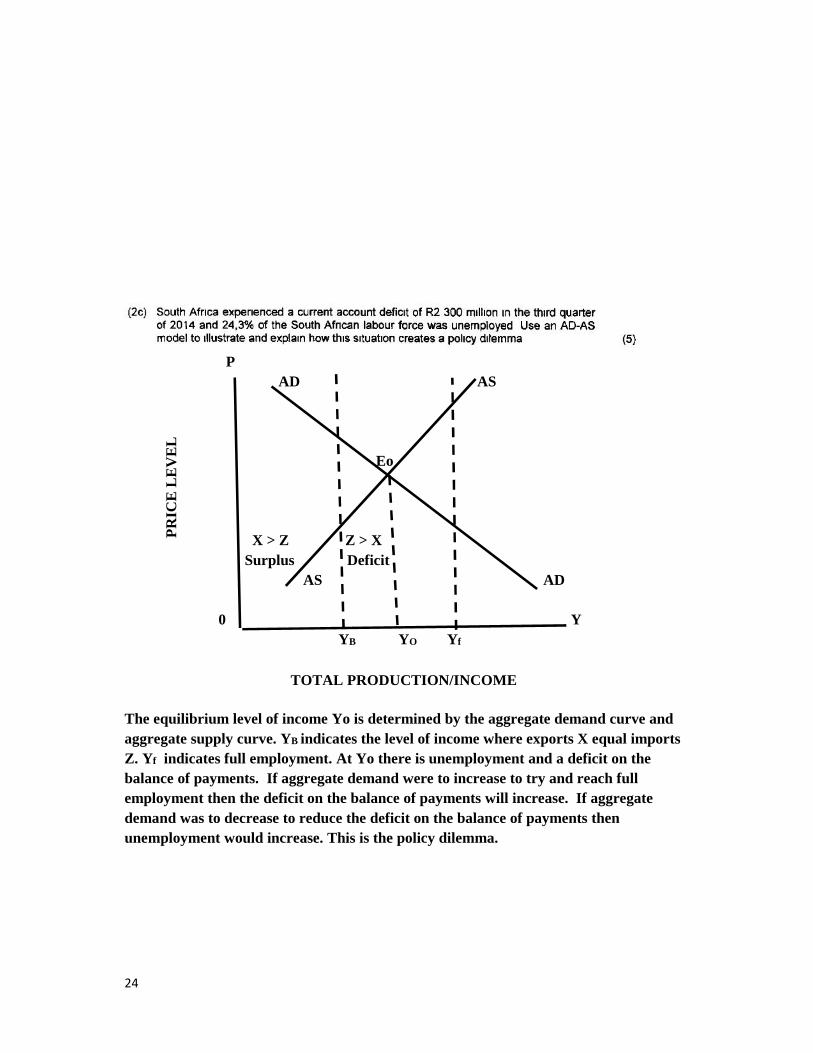
The equilibrium level of income Yo is determined by the aggregate demand curve andaggregate supply curve. YB indicates the level of income where exports X equal importsZ. Yf indicates full employment. At Yo there is unemployment and a deficit on thebalance of payments. If aggregate demand were to increase to try and reach fullemployment then the deficit on the balance of payments will increase. If aggregatedemand was to decrease to reduce the deficit on the balance of payments thenunemployment would increase. This is the policy dilemma.
PR
ICE
LE
VE
L
TOTAL PRODUCTION/INCOME
25
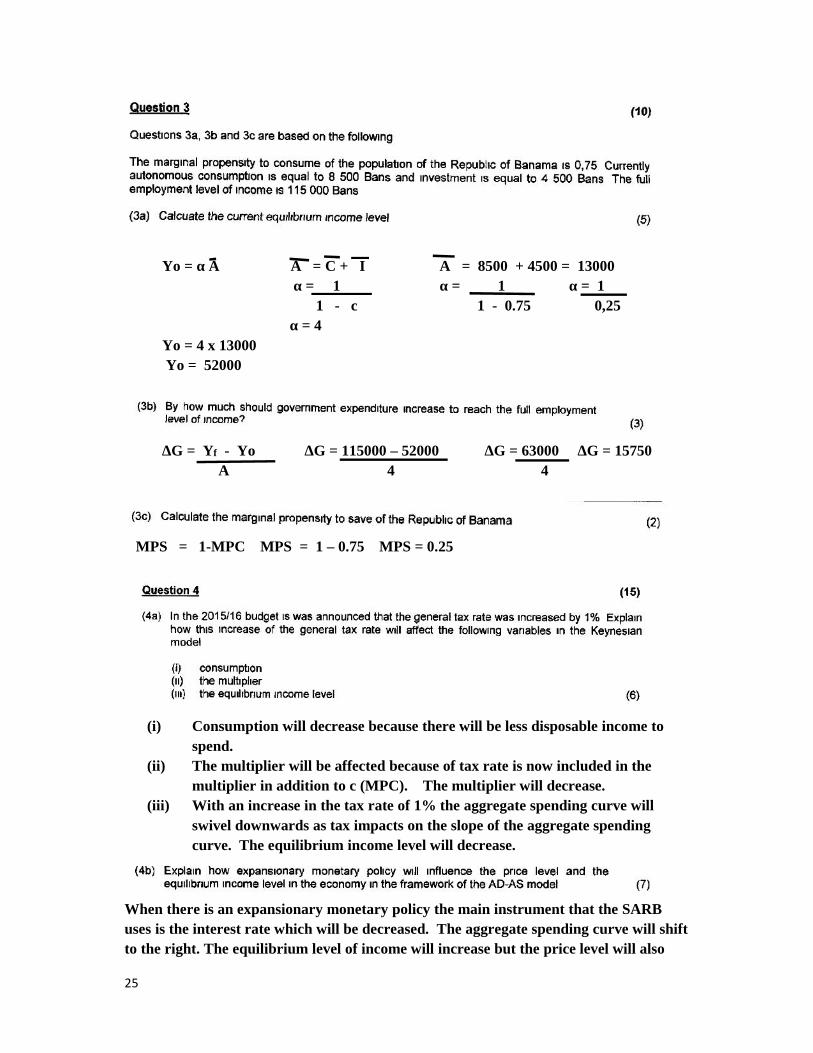
Yo = α A A = C + I A = 8500 + 4500 = 13000α = 1 α = 1 α = 1
1 - c 1 - 0.75 0,25α = 4
Yo = 4 x 13000Yo = 52000
∆G = Yf - Yo ∆G = 115000 – 52000 ∆G = 63000 ∆G = 15750Α 4 4
MPS = 1-MPC MPS = 1 – 0.75 MPS = 0.25
(i) Consumption will decrease because there will be less disposable income tospend.
(ii) The multiplier will be affected because of tax rate is now included in themultiplier in addition to c (MPC). The multiplier will decrease.
(iii) With an increase in the tax rate of 1% the aggregate spending curve willswivel downwards as tax impacts on the slope of the aggregate spendingcurve. The equilibrium income level will decrease.
When there is an expansionary monetary policy the main instrument that the SARBuses is the interest rate which will be decreased. The aggregate spending curve will shiftto the right. The equilibrium level of income will increase but the price level will also
26
increase. This means the total production/income and employment have increased butat the expense of inflation.
No. Investment spending is a function of the interest rate. The monetary transmissionmechanism is triggered off by a change in the interest rate which impacts on investmentspending, which is autonomous and not dependent on income.
SECTION BMCQS OCTOBER/NOVEMBER 2015
QUESTION ANSWER1 32 33 24 15 36 47 58 29 210 411 412 113 414 115 216 117 418 219 220 321 122 223 324 225 32627 228 229 230 331 232 1

27
33 434 235 336 137 538 239 340 3

28
ECOS 1601 EXAM PAPER MAY/JUNE 2015QUESTION 1 (10)
(i) Briefly explain the difference between gross domestic expenditure(GDE) and expenditure on (GDP). (4)
GDP measures the total value of all goods and services produced within the borders ofa country doing a specific period.
GDE measure to the total value of spending within the borders of a country during aspecific period. It includes imports (Z) and excludes exports (X)
(ii) Name two measures that are used to measure inequality (2)
(i) Lorenz curve(ii) The Gini Coefficient(iii) Quantile ratio
(iii) Give two reasons for the growth in government spending in SouthAfrica since 1960 (2)Old text bookNew text book 1990/1991 and 2012/2013 (general services, Protection services likedefence and Police, Social services like education and health)
(iv) Name two market oriented monetary policy instruments. (2)(i) Buy or sell government bonds or other securities to banks(ii) Interventions in the foreign exchange markets(iii) Public debt management.
29
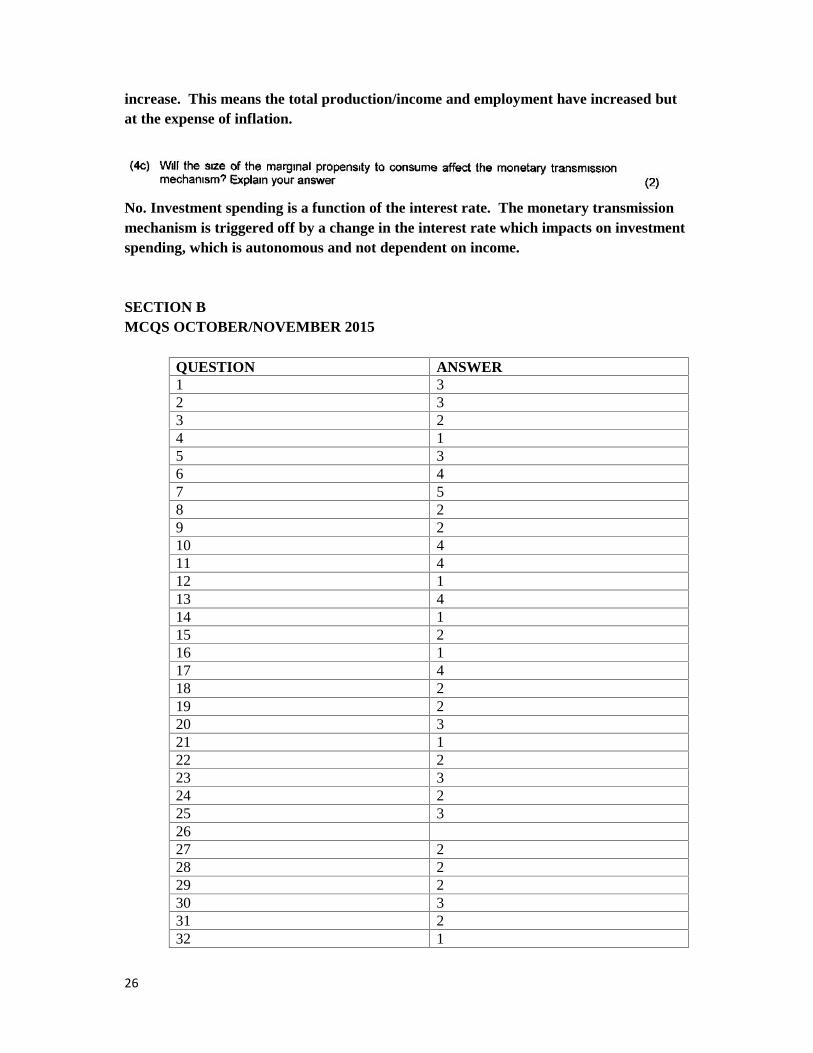
QUESTION 2(i) Use the following diagram to show what happens with the demand for
money if the South African economy experiences a recession.Remember to label your diagram (3)
P LP L1
R
ICE
LL1
0 QQUANTITY
(ii) Use the following diagram to show what happens with the demand formoney is monetary authorities increase the repo rate. Remember tolabel your diagram (3)
iI LNT i1 E 1
R io EO
E1
EST L
0 II1 Io
INVESTMENT SPENDING

30
(iii) Illustrate on the following diagram the impact of an economicrecession in the economies of South Africa’s trading partners on therand/dollar exchange rate. Remember to label your graph (3)
R/$ S1
D S
10.00
5.00
S1 DS
0 Q8 10
(iv) Given the Keynesian model of an open economy, illustrate on thefollowing diagram the impact of an increase in the marginalpropensity to import on the equilibrium level of income. Remember tolabel your graph. (3)
SAME AS OCTOBER/NOVEMBER. 2015
PR
ICE
OF
DO
LL
AR
S (E
XC
HN
AG
E R
AT
E)
QUANTITY OF DOLLARS PER DAY (BILLIONS)
31
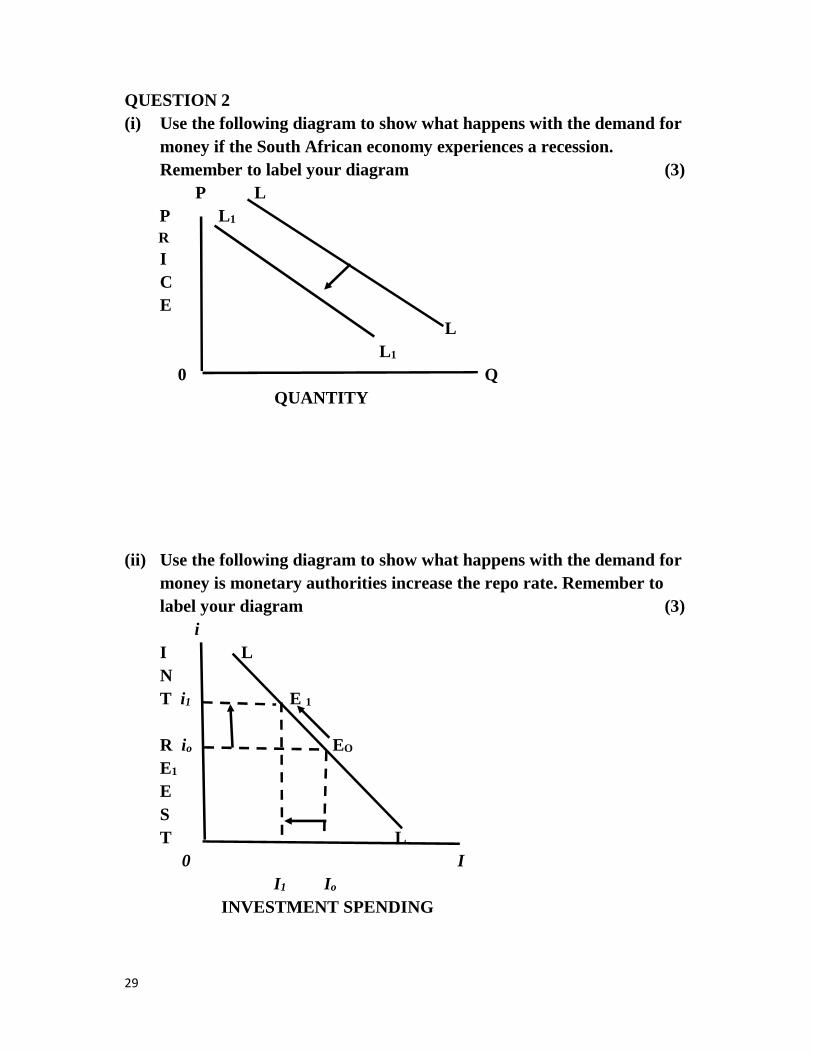
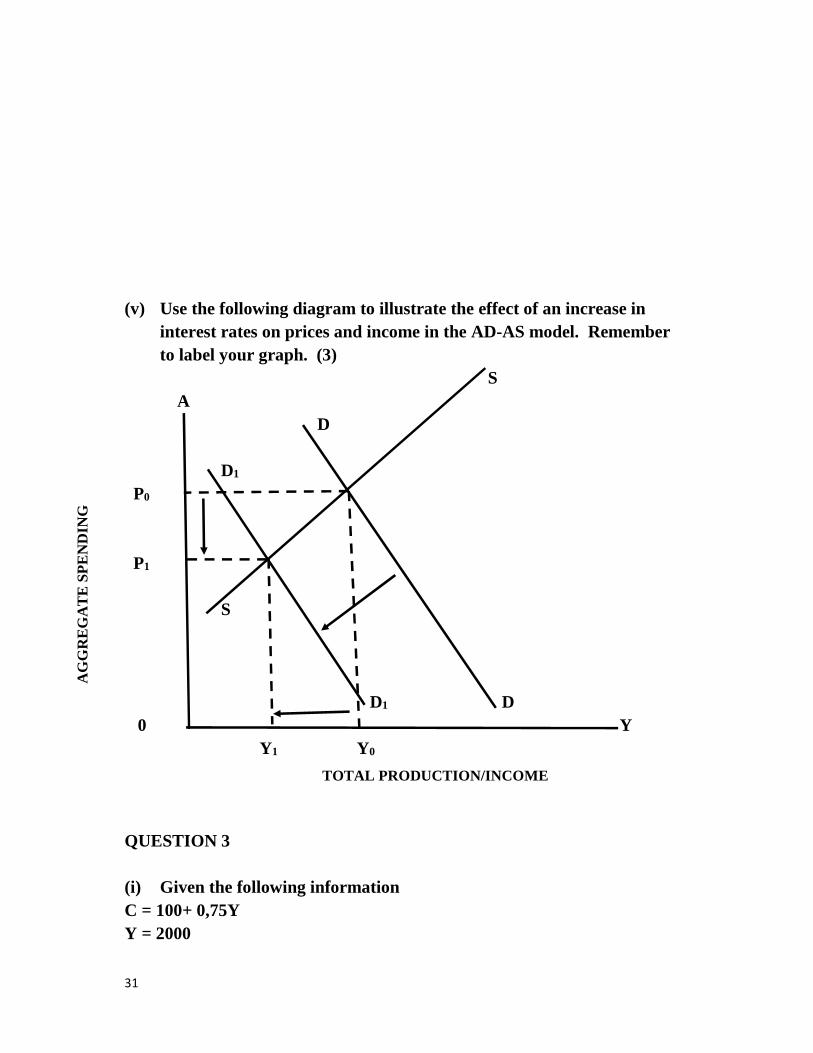
(v) Use the following diagram to illustrate the effect of an increase ininterest rates on prices and income in the AD-AS model. Rememberto label your graph. (3)
SA
D
D1
P0
P1
S
D1 D0 Y
Y1 Y0
QUESTION 3
(i) Given the following informationC = 100+ 0,75YY = 2000
AG
GR
EG
AT
E S
PE
ND
ING
TOTAL PRODUCTION/INCOME

32
Calculate (Show all your formulas and calculations)(i) Induced consumption If Y = 2000 (2)
Formula for induced consumption = cY c = 0,75 Y = 2000
cY = 0.75 x 2000 = 1500
(ii) Savings if Y = 2000
Formula for savings = S+ sY s = 0.25 Y = 2000sY = - 100 (0.25 x 2000)sY = 400
(iii)The following information about a Keynesian model is given
Autonomous consumption spending R250 millInvestment spending R150 millMarginal propensity to consume 4/5 (0.80)Full level of employment R1 500
Calculate (Show all your formulas and calculations
The autonomous spending (2)A = C + I A = 250 + 150 = 400
The multiplier (2)Formula for multiplier in an economy without government.α = 1 = 1 = 1 = 5
1 - c 1 – 0.80 0.20
The equilibrium level of income (2)Yo = α A = 5 x 400 = 2000
By how much must investment spending increase to bring about fullemployment (2)
33
∆ I = Yf - Yo = 1500 - 2000 ??????α
QUESTION 4(i) Briefly explain the possible impact of appreciation in the rand/dollar
exchange rate on the balance of payments in South Africa (4)
If the rand appreciates against the dollar it would mean that South African goods andservices will become relatively more expensive in relation to their foreign competitors soexports will decrease. On the other hand imports will increase because of theappreciation of the rand. The final result is that there will be an increase of the deficit onthe balance of payments because Z >X.
(ii) Explain why it is that in the simple Keynesian model an increase ingovernment spending has a multiplier effect on the level of income (4)
Suppose government increases its spending to build a dam in Limpopo. Whengovernment spends this amount say R1billion the amount spent goes to the workers andowners of the construction companies and in turn to companies that supply materialsand equipment to the construction industry. They receive this income in the form ofsalaries, wages and profit. A process begins whereby the owners and workers of thesefirm involved in the construction do not put this money in the bank but spend most ofit. The amount that they spend will depend on the marginal propensity to consume (c)(0.80). Total spending in the economy will therefore increase by R800 mill (0.8 x R1billion) (Total spending and income has increased by R1.8 billion (original R1 billionplus R800 spent by those who received the original R1 billion) These households thenspend this income which raises the income of the workers and owners of the shops andother firms that sell the goods and services to them. Then there will the next round.Where these households spend 0.80 of their new income on goods and service. Theratio between the eventual change in income and initial investment is called themultiplier. (
(iii)Explain how money policy can be used to combat demand-pull inflation(5)
If there is demand – pull inflation in an economy the South African Reserve bank canimplement a monetary policy of increasing the interest rates (repo rate). The increase inthe interest rate will result in the AD curve shifting to the left. The impact of this shiftwill be that the price will decrease which means that inflation decreases but this will be

34
at the expense of total/production and income which will decrease. This will result in anincrease in unemployment.
SECTION BMCQS MAY/JUNE 2015
QUESTION ANSWER1 42 33 44 15 26 17 38 39 310 211 112 113 214 315 216 117 418 119 420 221 122 323 124 325 126 327 328 429 230 431 232 133 434 435 336 337 438 139 140 2
35
ESCOS 1601 EXAM PAPER OCTOBER/NOVEMBER 2014
SECTION AQUESTION 1
(i) Define the Gross Domestic product (GDP) (4)Gross domestic product is the total value of all the final goods and services producedwithin the boundaries of a country in a particular time period (usually one year)
(ii) Define fiscal policy (3)Fiscal policy which is controlled by the refers to the use of government spending,taxation and borrowing to affect economic activity.
(iii) What are the two main sub-accounts of the balance of payments? (2)The current account and the financial account
(iv) What are the main sources of economic growth viewed from the demand side?(3)
Domestic demand (C, I, G) Export demand (X) Import substitution (reduce Z)
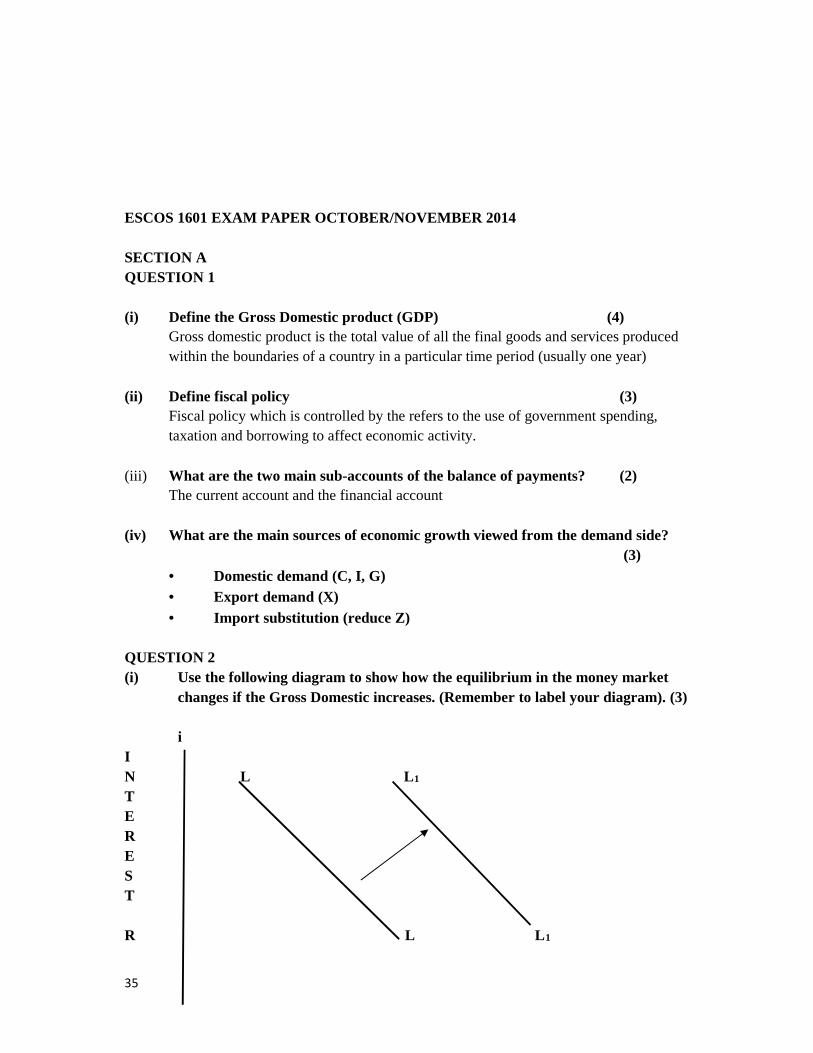
QUESTION 2(i) Use the following diagram to show how the equilibrium in the money market
changes if the Gross Domestic increases. (Remember to label your diagram). (3)
iIN L L1
TEREST
R L L1
36
ATE
0 L,M
QUANTITY OF MONEY
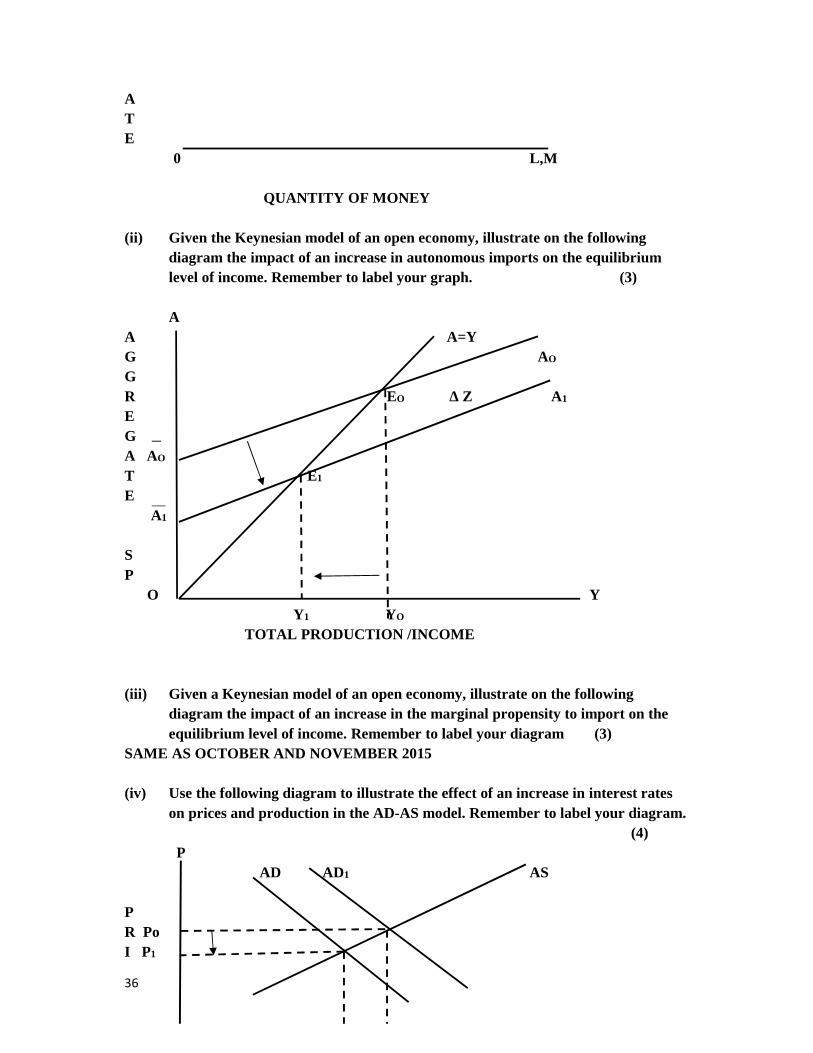
(ii) Given the Keynesian model of an open economy, illustrate on the followingdiagram the impact of an increase in autonomous imports on the equilibriumlevel of income. Remember to label your graph. (3)
AA A=YG AO
GR EO ∆ Z A1
EGA AO
T E1
EA1
SP
O YY1 YO
TOTAL PRODUCTION /INCOME
(iii) Given a Keynesian model of an open economy, illustrate on the followingdiagram the impact of an increase in the marginal propensity to import on theequilibrium level of income. Remember to label your diagram (3)
SAME AS OCTOBER AND NOVEMBER 2015
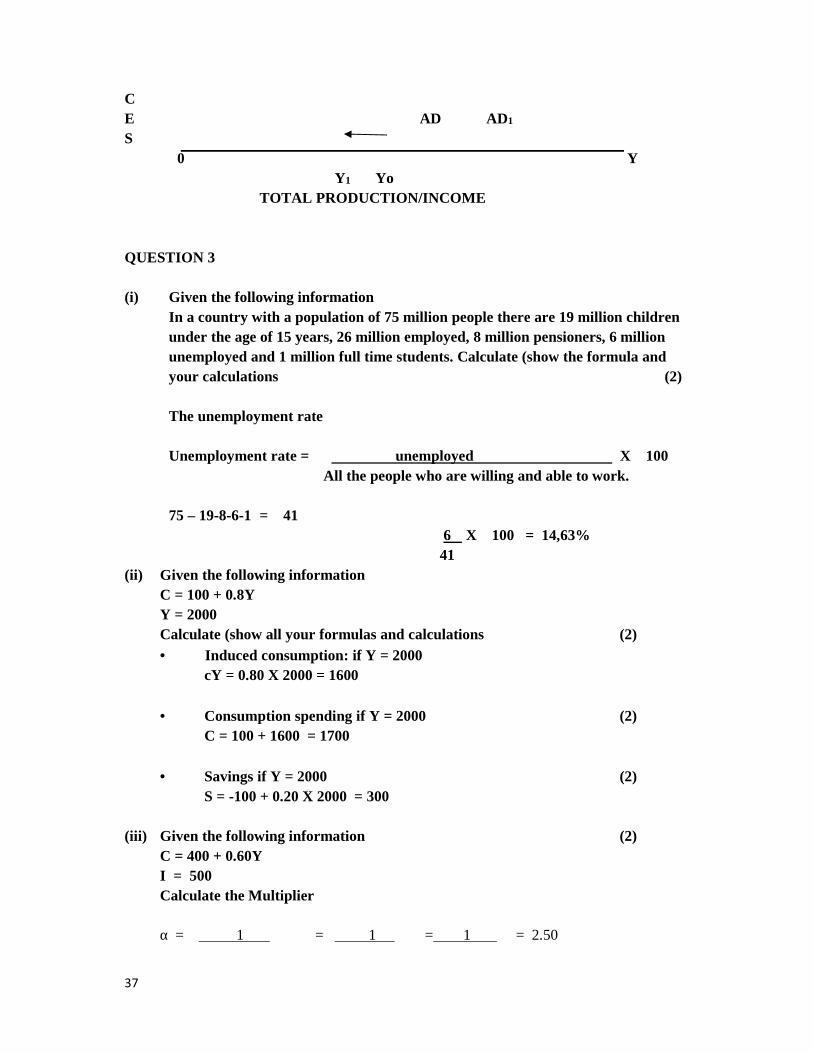
(iv) Use the following diagram to illustrate the effect of an increase in interest rateson prices and production in the AD-AS model. Remember to label your diagram.
(4)P
AD AD1 AS
PR PoI P1
37
CE AD AD1
S0 Y
Y1 YoTOTAL PRODUCTION/INCOME
QUESTION 3
(i) Given the following informationIn a country with a population of 75 million people there are 19 million childrenunder the age of 15 years, 26 million employed, 8 million pensioners, 6 millionunemployed and 1 million full time students. Calculate (show the formula andyour calculations (2)
The unemployment rate
Unemployment rate = unemployed X 100All the people who are willing and able to work.
75 – 19-8-6-1 = 416 X 100 = 14,63%
41(ii) Given the following information
C = 100 + 0.8YY = 2000Calculate (show all your formulas and calculations (2) Induced consumption: if Y = 2000
cY = 0.80 X 2000 = 1600
Consumption spending if Y = 2000 (2)C = 100 + 1600 = 1700
Savings if Y = 2000 (2)S = -100 + 0.20 X 2000 = 300
(iii) Given the following information (2)C = 400 + 0.60YI = 500Calculate the Multiplier
α = 1 = 1 = 1 = 2.50

38
1 - c 1 - 0.60 0.40
(iv) The equilibrium level of income (2)Yo = α A A = C+I A = 400 + 500 = 900Yo = 2.50 X 900 = 2250
QUESTION 4(i) Explain the impact of an increase in the tax rate on the equilibrium level of
income in a Keynesian model of an economy. (4)If there is an increase in the tax rate this will result in the aggregate spending curveswivelling downwards. The equilibrium level of income will decrease. This means thatspending will decrease and this will impact on unemployment which will increase.
(ii) Explain using a Keynesian model of the economy why the decrease in economicactivity in Europe had a negative effect on the level of employment in SouthAfrica (5)If there is a decrease in the economy in Europe who is one of South Africa’s majortrading parties there will a decrease in spending in Europe. The impact is that theywill not import goods from South Africa which means exports decrease. This willcause a downturn in the South African economy and unemployment will rise.
(iii) Explain how monetary policy can be used to combat inflation (5)The SARB formulates and implements the monetary policy. Their main instrument tocombat inflation is the interest rate. To dampen spending which is causing the highinflation rate the SARB will increase the interest rate. This means that there will beless money to spend so inflation will drop. However it will be at the expense ofreduced total production and income and unemployment will rise.
SECTION BMCQS 0CTOBER/NOVEMBER 2014
QUESTION ANSWER1 12 23 34 25 36 3
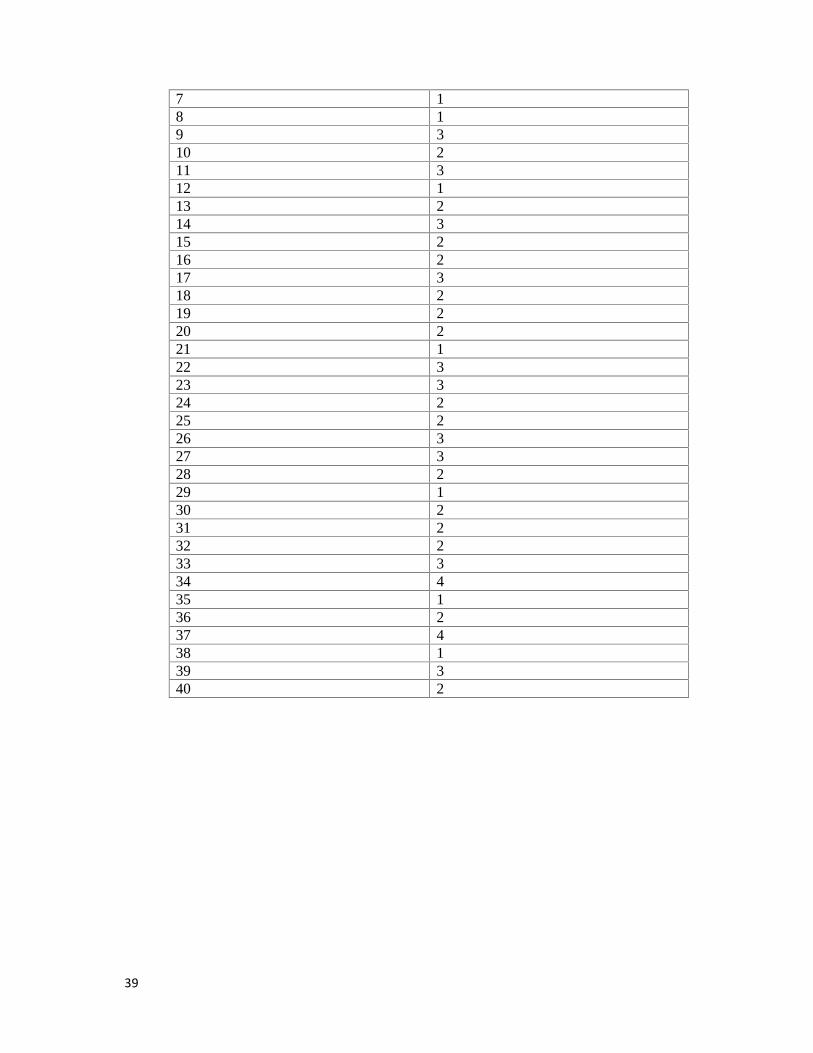
39
7 18 19 310 211 312 113 214 315 216 217 318 219 220 221 122 323 324 225 226 327 328 229 130 231 232 233 334 435 136 237 438 139 340 2

40
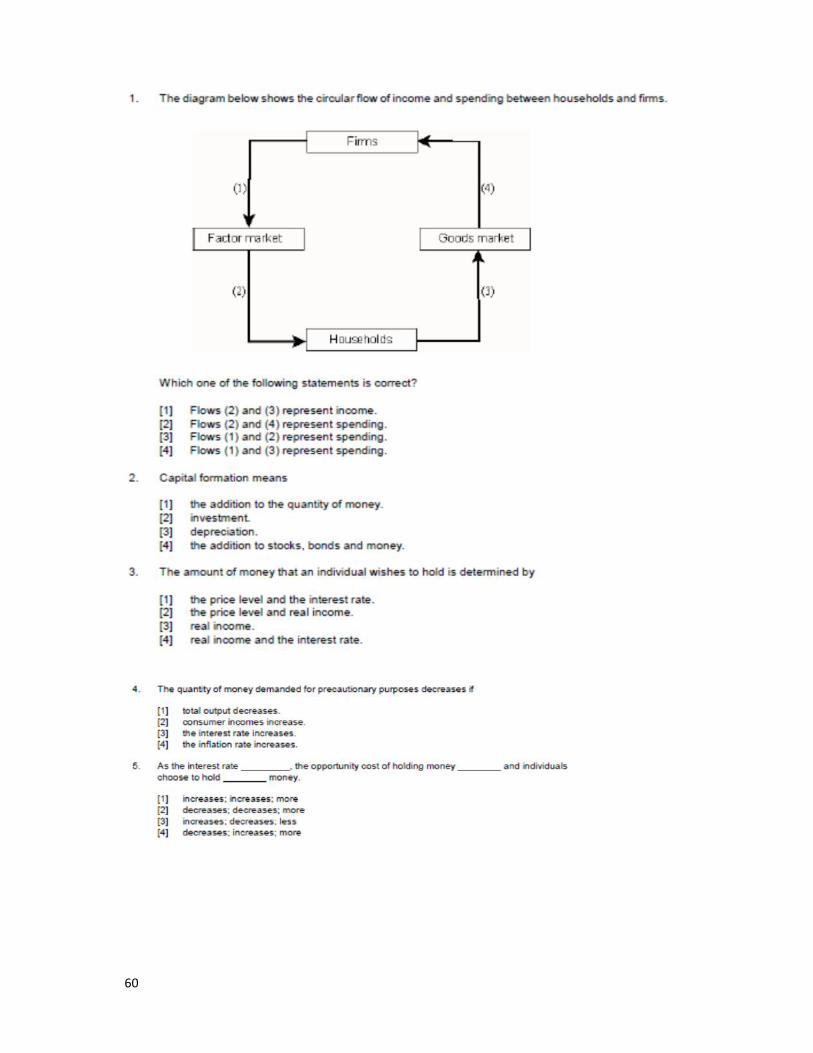
ECS1601 EXAM PAPER MAY/JUNE 2014SECTION AQuestion 1In the circular flow of income and spending between firms and households there arethree leakages or withdrawals, imports are one such leakage. Name the other two. (2)i) Savingsii) Taxes
Question 2Name two market-oriented policy instruments. (2)(i) Accommodation policy (refinancing of liquidity requirement)(ii) Open-market policy(iii) Public debt management(iv) Intervention in foreign exchange markets.
Question 3What are the criteria for a good tax? Name three criteria’s and explain one briefly (4)(i) Neutrality: Taxation should have the minimum possible effect on relative prices.
There should be no disincentive to change the owners of the factors of production tochange their behaviour due to high taxes.
(ii) Equity: To determine what is equitable or fair or who should pay taxes, twoprinciples can be used:1) Ability to pay principle: People should pay according to their ability (level
of income). There are two notions of equity horizontal equity (people in thesame position should pay the same tax) and vertical equity (people ndifferent positions should be taxed differently)
2) Benefit principle: The people who use the government products and servicesshould pay for this use. These are also called user charges, (toll roads,hospital services, university educations and electricity and water)
3) Administrative simplicity: Taxes cost taxpayers. Compliance costs:taxpayers have to fill out forms and pay accountants to do this for them.Administrative costs: People have to be employed by government to writeup tax laws, design tax forms, and collect taxes and asses tax returns. Also note: tax avoidance: This is the practice of avoiding paying
taxes (it is legal but lowers the tax revenue for the government)
Tax evasion: This occurs when people do not pay taxes when theyshould (vendors at flea markets or people who run their businessesfrom home e.g. hairdressers’ or dressmakers)

41
Question 4There are two countries. Alfa and Beta. They can only produce cars and bicycles. Thefollowing tables show their production of these two goods
Opportunity cost/comparativeadvantage
Alfa 200 cars or 1200 bicycles: 1 : 6 1/6Beta 200 cars or 1400 bicycles 1 : 7 1/7
The president of Alfa wants to trade cars with Beta and asks you if Alfa has an absoluteor comparative advantage in the production of cars? (1)Beta has the absolute advantage in the production of bicycles but equal advantage with Alphain cars.From a comparative point of view the opportunity costs for Beta to make 1 car is 7 bicycles,(1/7) (relatively more efficient in producing bicycles or lower cost) and for Alpha to makeone car the opportunity cost is 6 bicycles (1/6) therefore Beta has the comparative advantagein bicycles and should produce bicycles and Alfa then has the comparative advantage of cars.
5. Name two types of lags that slow down the impact of monetary and fiscal policy:(i) The recognition lag(ii) The decision lag(iii) The implementation lag(iv) The impact lag (2)
6. Shortly describe the main difference between the consumer price index (CPI)and production price index (PPI)
(i) CPI: measures the cost of a representative basket of goods and services tothe consumer
(ii) PPI: measure the prices at the level of the first significant commercialtransaction. Imported goods are measured at the point that they enter thecountry and not when they are sold to consumers. Manufacturing goods arepriced when they leave the factory not when they are sold to consumers.
7. In a country with a population of 75 million people there are 19 million childrenunder the age of 15 years. 26 million employed, 8 million pensioners, 6 millionunemployed and 1 million full time students. What is the employment rate? (2)
People who cannot be considered as part of the working force are as follows:(i) Children under the age of 15 years: 19 million(ii) Pensioners: 8 million(iii) Full time students: 1 million
28 million
Definition for total labour force: All individuals who ae willing and able to work
42
(i) Number presently employed: 26 million(ii) Number presently unemployed: 6 million
32 million
Formula for unemployment rate: number of unemployed X 100% = 6 millionTotal workforce 26 million= 23%
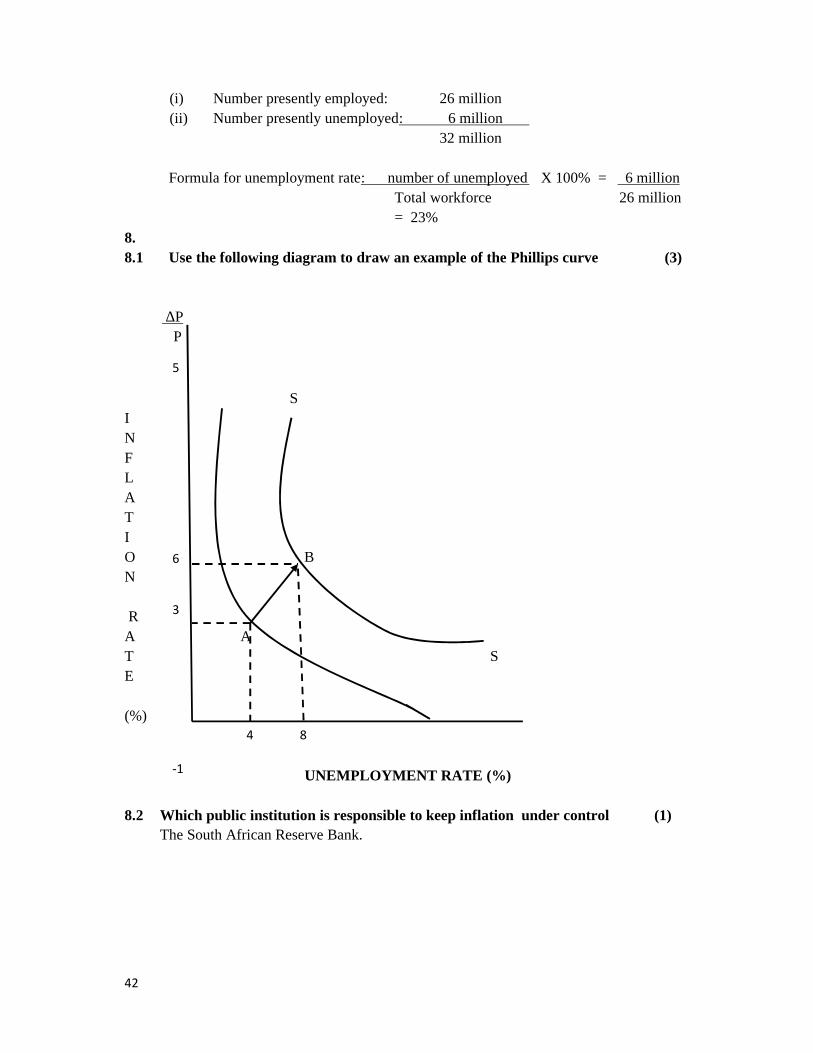
8.8.1 Use the following diagram to draw an example of the Phillips curve (3)
∆PP
SINFLATIO BN
R 3A AT SE
(%)
UNEMPLOYMENT RATE (%)
8.2 Which public institution is responsible to keep inflation under control (1)The South African Reserve Bank.
5
6
3
-1
4 8

43
9.1 Calculate the multiplier for the economy of Neverland. Give the answer in twodecimals (2)
α = 11- 0.80( 1 -0.25)
α = 11 - 0.80 x 0.75
α = 11 - 0.60
α = 10.40
α = 2.50
9.2 Calculate the equilibrium income of Neverland (3)
Yo = αA A = C+I +G= 900 + 300 + 400 = 1600
Yo = αA 2.50 x 1600 = 4000
9.3 Calculate the fiscal surplus or deficit of Neverland. (2)
G - T T = tY T = 0.25 x 4000 T = 1000400 - 1000
Surplus = 600
44
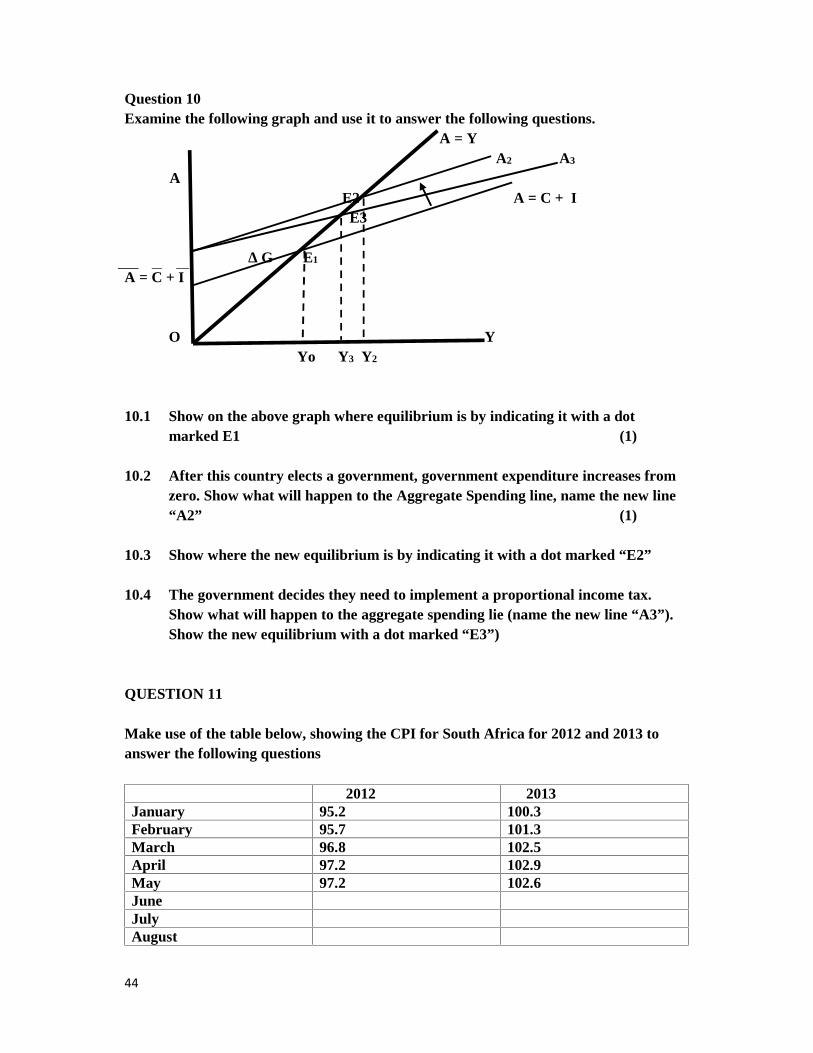
Question 10Examine the following graph and use it to answer the following questions.
A = YA2 A3
AE2 A = C + IE3
∆ G E1
A = C + I
O YYo Y3 Y2
10.1 Show on the above graph where equilibrium is by indicating it with a dotmarked E1 (1)
10.2 After this country elects a government, government expenditure increases fromzero. Show what will happen to the Aggregate Spending line, name the new line“A2” (1)
10.3 Show where the new equilibrium is by indicating it with a dot marked “E2”
10.4 The government decides they need to implement a proportional income tax.Show what will happen to the aggregate spending lie (name the new line “A3”).Show the new equilibrium with a dot marked “E3”)
QUESTION 11
Make use of the table below, showing the CPI for South Africa for 2012 and 2013 toanswer the following questions
2012 2013January 95.2 100.3February 95.7 101.3March 96.8 102.5April 97.2 102.9May 97.2 102.6JuneJulyAugust

45
SeptemberOctoberNovemberDecemberAverage for the year
11.1 Sandi had an income of R10 206 per month in April 2012, in April 2013 she hasan income of R11 320 per month. Did Sandi’s nominal income increase? And ifso how much? (1)Yes nominal income will increase
11 320 – 10 206 = 1 1141 114 x 100 = 10.92% = 11%
10 206
11.2 Did ‘Sandi‘s real income increase? And if so by how much? Only give the randvalue, do not round the cents up? (2)
QUESTION 12Suppose that an economy produces 3 goods. Their quantities produced for 2000, 2007and 2012 are shown in the table below.
2000 (base year) 2007 2012
Product Quantity Price Quantity Price Quantity PriceHotdogs 100 R5 150 R10 170 R17Pizzas 50 R15 100 R25 95 R30Hamburgers 230 R10 250 R15 260 R22
12.1 Calculate the nominal gross domestic product (GDP) for 2007 and 2012 (2)2007 2012
Hotdogs 150 x 10 = 1500 170 x 17 = 2890Pizzas 100 x 25 = 2500 95 x 30 = 2850Hamburgers 250 x 15 = 3750 260 x 22 = 5720
7750 11 460
12.2 Calculate real GDP for 2007 and 2012 (2)
Hotdogs 150 x 5 = 750 170 x 5 = 850Pizzas 100 x 15 = 1500 95 x 15 = 1425Hamburgers 250 x10 = 2500 260 x 10 = 2600
4750 4875
46
12.3 Will there be a difference in the real and nominal GDP for the year 2000?Explain (2)2000 is the base year so the nominal and real values will be the same.
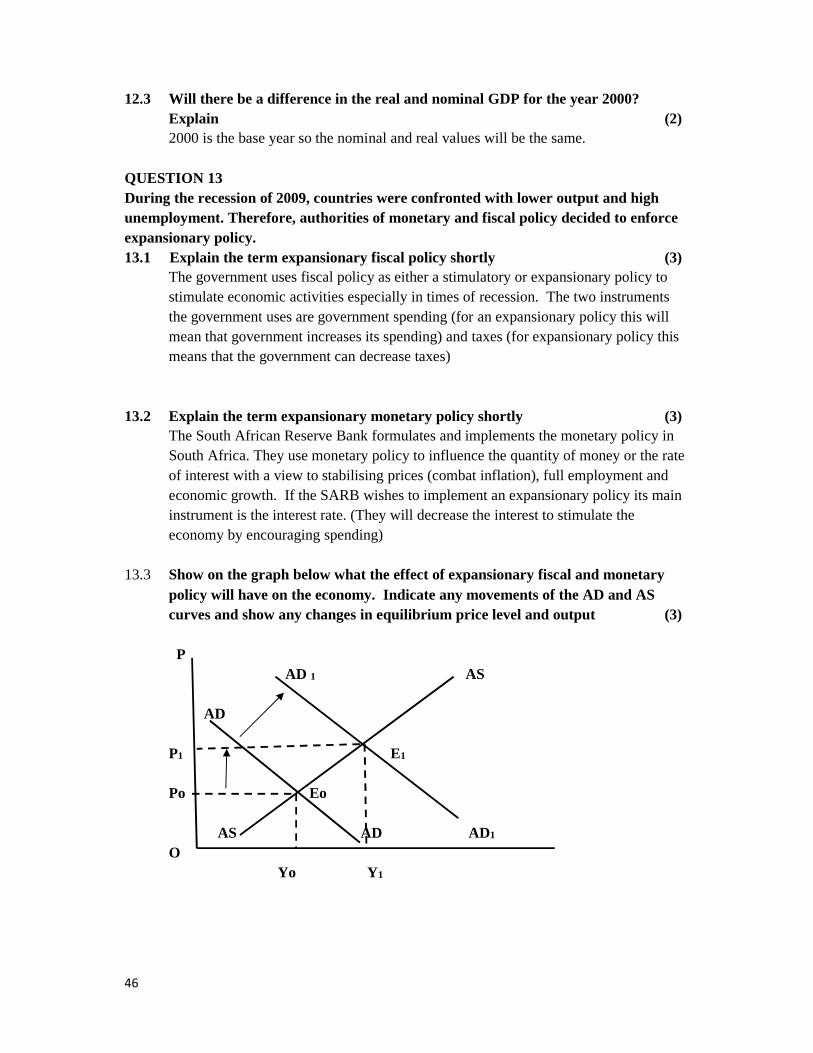
QUESTION 13During the recession of 2009, countries were confronted with lower output and highunemployment. Therefore, authorities of monetary and fiscal policy decided to enforceexpansionary policy.13.1 Explain the term expansionary fiscal policy shortly (3)
The government uses fiscal policy as either a stimulatory or expansionary policy tostimulate economic activities especially in times of recession. The two instrumentsthe government uses are government spending (for an expansionary policy this willmean that government increases its spending) and taxes (for expansionary policy thismeans that the government can decrease taxes)
13.2 Explain the term expansionary monetary policy shortly (3)The South African Reserve Bank formulates and implements the monetary policy inSouth Africa. They use monetary policy to influence the quantity of money or the rateof interest with a view to stabilising prices (combat inflation), full employment andeconomic growth. If the SARB wishes to implement an expansionary policy its maininstrument is the interest rate. (They will decrease the interest to stimulate theeconomy by encouraging spending)
13.3 Show on the graph below what the effect of expansionary fiscal and monetarypolicy will have on the economy. Indicate any movements of the AD and AScurves and show any changes in equilibrium price level and output (3)
PAD 1 AS
AD
P1 E1
Po Eo
AS AD AD1
OYo Y1
47
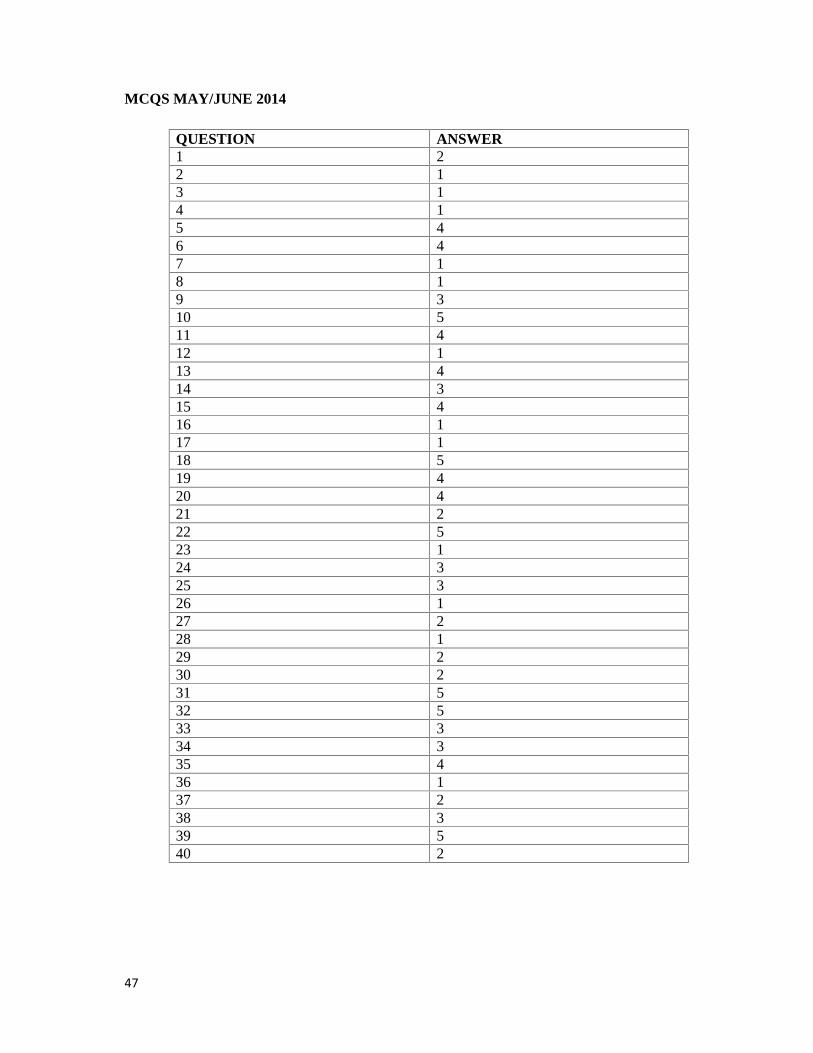
MCQS MAY/JUNE 2014
QUESTION ANSWER1 22 13 14 15 46 47 18 19 310 511 412 113 414 315 416 117 118 519 420 421 222 523 124 325 326 127 228 129 230 231 532 533 334 335 436 137 238 339 540 2
48
ECOS 1601 OCTOBER/NOVEMBER 2013 (50 marks A section and 40 MCQs (1 ¼MARKS EACH = 50 MARKS) in B section): NOTE IN 2014 MCQS WILL BE 50
QUESTION 1 (9)
1.1 Name the main components of fiscal policy (3) Government spending Taxation
Borrowing
1.2 Name the four functions of the South African Bank (4) Formulation and implementation of monetary policy Service to the government Provision of economic and statistical services
Maintaining financial stability
1.3 What is the purpose of an import tariff? (2) Protection of domestic firms against foreign competition (protective tariffs) Raise government revenue (Revenue tariffs)
QUESTION 2
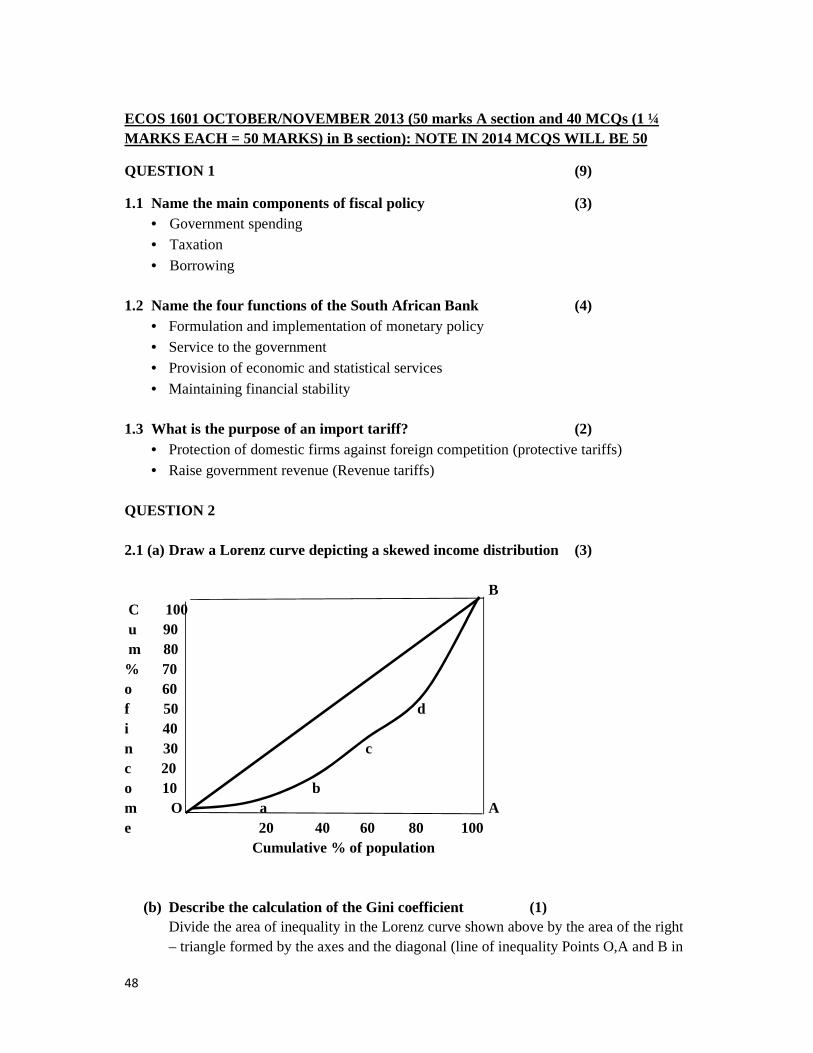
2.1 (a) Draw a Lorenz curve depicting a skewed income distribution (3)
BC 100u 90m 80
% 70o 60f 50 di 40n 30 cc 20o 10 bm O a Ae 20 40 60 80 100
Cumulative % of population
(b) Describe the calculation of the Gini coefficient (1)Divide the area of inequality in the Lorenz curve shown above by the area of the right– triangle formed by the axes and the diagonal (line of inequality Points O,A and B in
49
graph above). The Gini coefficient can vary between 0 and 1. If incomes aredistributed equally the Gini coefficient will be zero. If the coefficient is 1 then there isperfect inequality. The Gini coefficient in practice usually varies between about 0.30(highly equal) and about 0.70 (highly unequal).
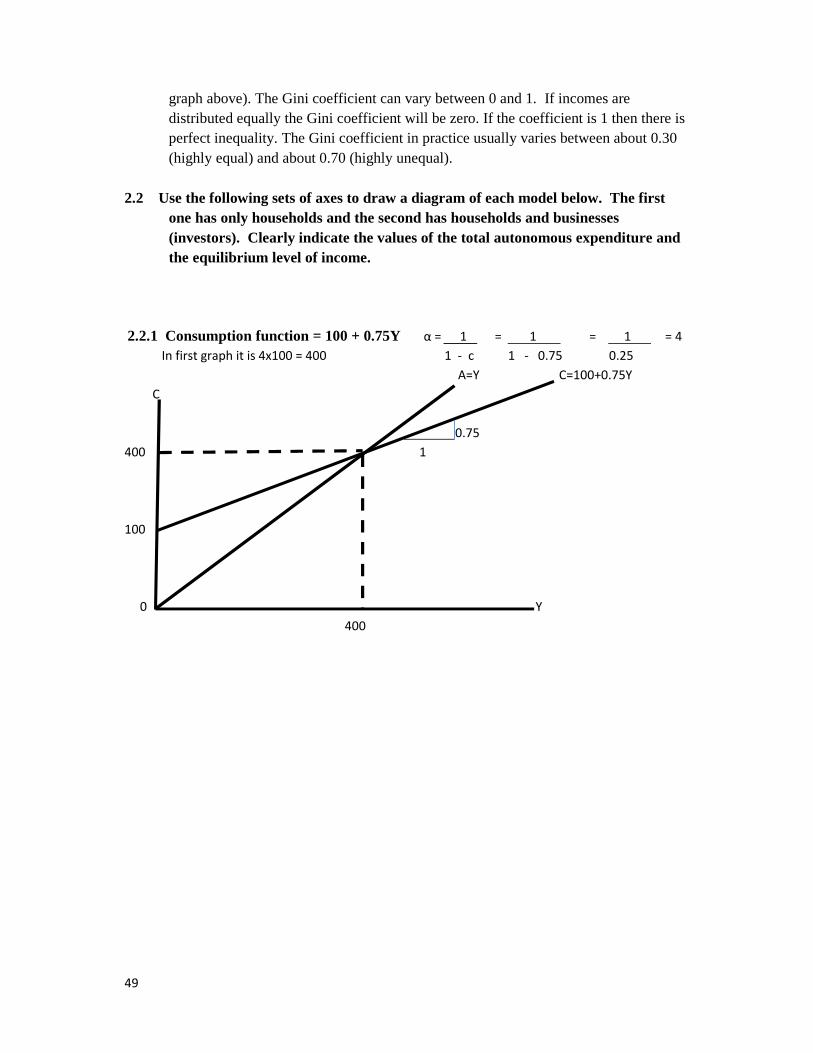
2.2 Use the following sets of axes to draw a diagram of each model below. The firstone has only households and the second has households and businesses(investors). Clearly indicate the values of the total autonomous expenditure andthe equilibrium level of income.
2.2.1 Consumption function = 100 + 0.75Y α = 1 = 1 = 1 = 4In first graph it is 4x100 = 400 1 - c 1 - 0.75 0.25
A=Y C=100+0.75YC
0.75400 1
100
0 Y400
50
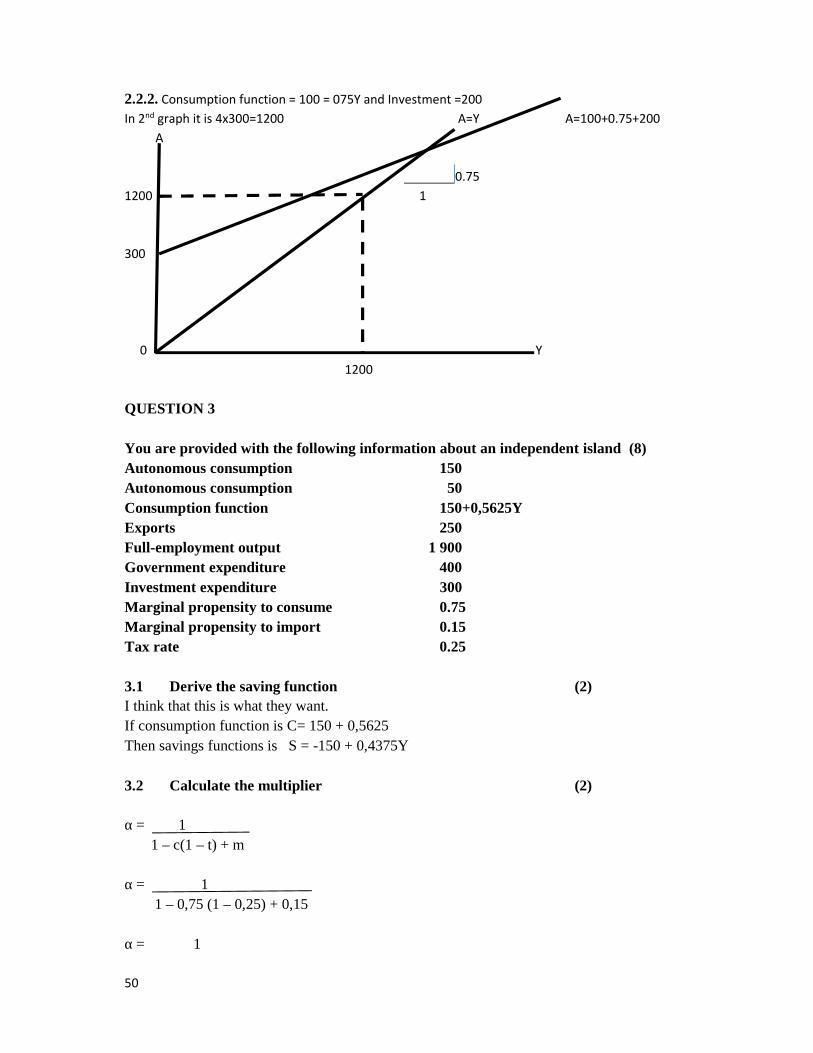
2.2.2. Consumption function = 100 = 075Y and Investment =200In 2nd graph it is 4x300=1200 A=Y A=100+0.75+200
A
0.751200 1
300
0 Y1200
QUESTION 3
You are provided with the following information about an independent island (8)Autonomous consumption 150Autonomous consumption 50Consumption function 150+0,5625YExports 250Full-employment output 1 900Government expenditure 400Investment expenditure 300Marginal propensity to consume 0.75Marginal propensity to import 0.15Tax rate 0.25
3.1 Derive the saving function (2)I think that this is what they want.If consumption function is C= 150 + 0,5625Then savings functions is S = -150 + 0,4375Y
3.2 Calculate the multiplier (2)
α = 11 – c(1 – t) + m
α = 11 – 0,75 (1 – 0,25) + 0,15
α = 1
51
1 – 0,75 x 0,75 + 0,15
α = 11 – 05625 + 0,15
α = 10,5875
α = 1,70
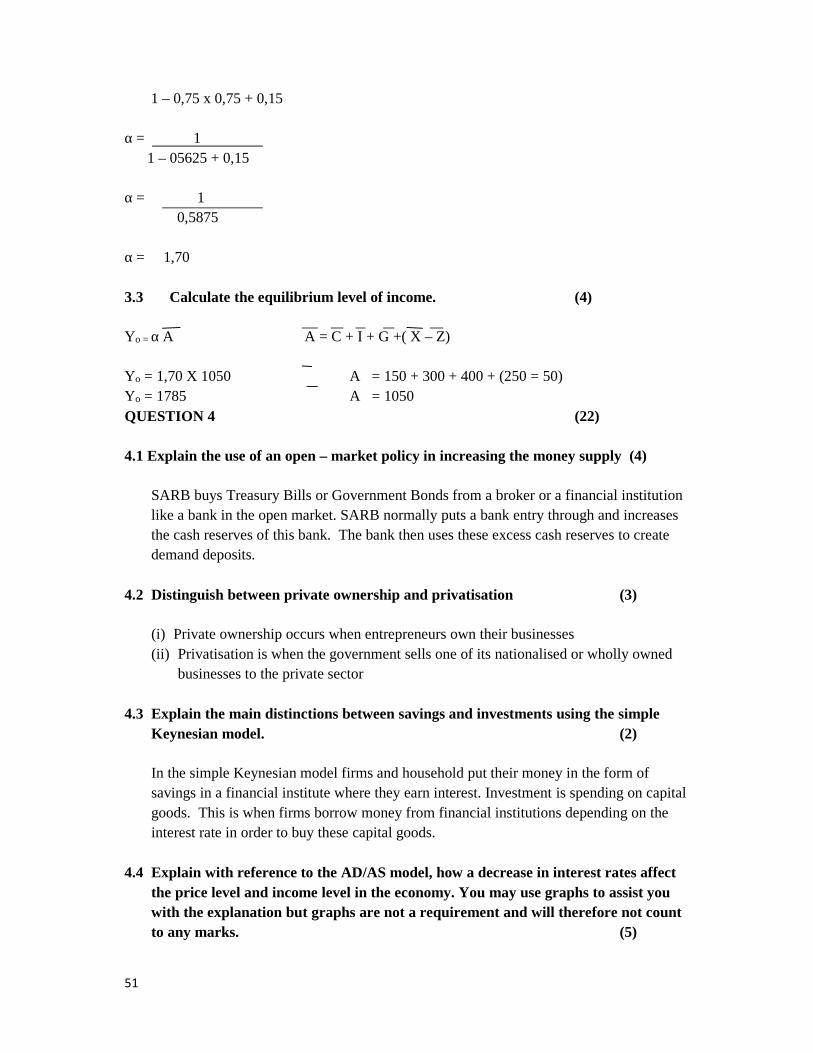
3.3 Calculate the equilibrium level of income. (4)
Yo = α A A = C + I + G +( X – Z)
Yo = 1,70 X 1050 A = 150 + 300 + 400 + (250 = 50)Yo = 1785 A = 1050QUESTION 4 (22)
4.1 Explain the use of an open – market policy in increasing the money supply (4)
SARB buys Treasury Bills or Government Bonds from a broker or a financial institutionlike a bank in the open market. SARB normally puts a bank entry through and increasesthe cash reserves of this bank. The bank then uses these excess cash reserves to createdemand deposits.
4.2 Distinguish between private ownership and privatisation (3)
(i) Private ownership occurs when entrepreneurs own their businesses(ii) Privatisation is when the government sells one of its nationalised or wholly owned
businesses to the private sector
4.3 Explain the main distinctions between savings and investments using the simpleKeynesian model. (2)
In the simple Keynesian model firms and household put their money in the form ofsavings in a financial institute where they earn interest. Investment is spending on capitalgoods. This is when firms borrow money from financial institutions depending on theinterest rate in order to buy these capital goods.
4.4 Explain with reference to the AD/AS model, how a decrease in interest rates affectthe price level and income level in the economy. You may use graphs to assist youwith the explanation but graphs are not a requirement and will therefore not countto any marks. (5)
52
When interest rates decrease the demand for investment spending increases. Thisimpacts on aggregate spending and the AD curves shifts to the right. The result is thatTotal Production/Income increases which means that employment also increases.However prices increase so now inflation will be experienced in the economy.
4.5
4.5.1 Name and describe four types of unemployment (4)(i) Frictional unemployment: This is when people are between jobs (looking for
employment). This type of unemployment is not considered too serious becausethese people should eventually find employment
(ii) Structural unemployment: This happens when skills are no longer required andjobs become redundant for example ATMs replaced bank tellers or jobs on themines or in factories are replaced by machines or technology. This is consideredvery serious because these people do not have other skills that they can use tofind current work.
(iii) Seasonal unemployment: Examples would be fruit pickers or fishermen wherework is available in season. Another example would be Father Christmases.
(iv) Cyclical unemployment: This refers to employment that rises and fallsdepending on the business cycles. When there are upswings or booms in theeconomy then employment is higher than during downswings and recessions.
4.5.2 Which type of employment do you think is dominant in South Africa?Substantiate your answer. (1)
Structural unemployment because SA labour force is mostly semi-skilled or unskilledso the jobs that are available cannot be done by these people, as their skills are notcompatible.
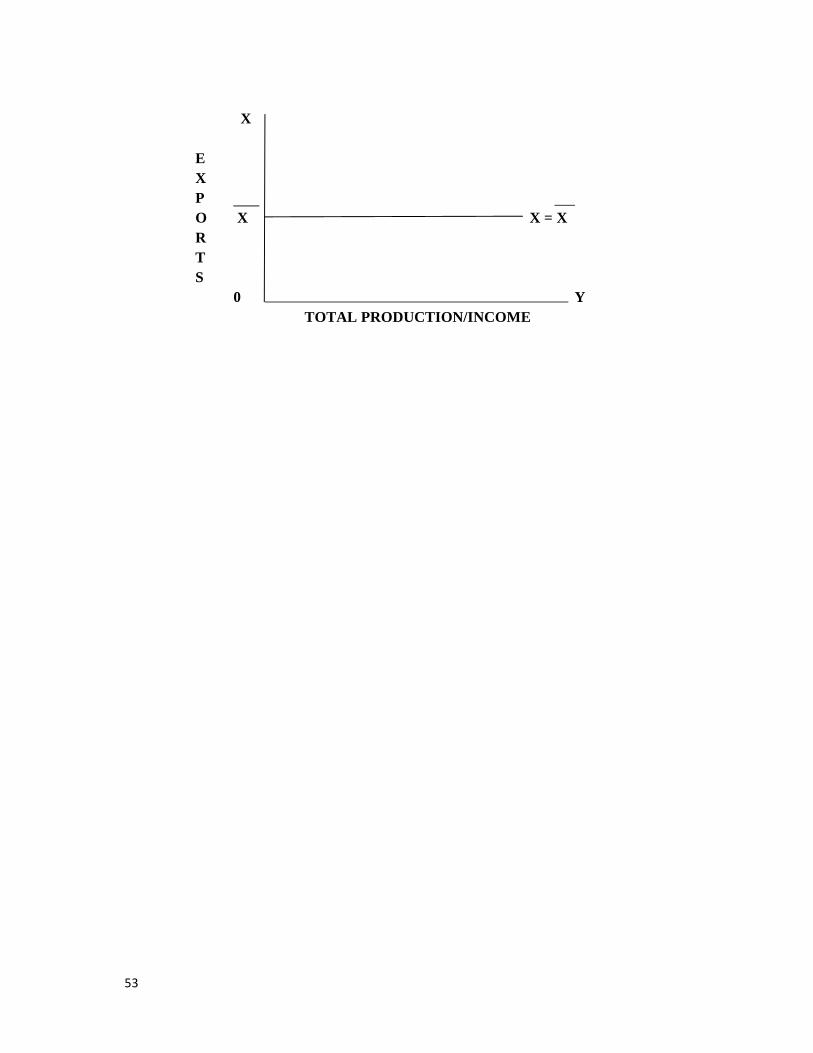
4.6 Explain why exports are viewed as autonomous in the simple Keynesian model ofan open economy with a foreign sector and how it is treated in the model. (3)
Exports are autonomous because they are not dependent on income. X Graphically the relationship between exports and income is illustrated by a
horizontal line.
53
X
EXPO X X = XRTS
0 YTOTAL PRODUCTION/INCOME
54
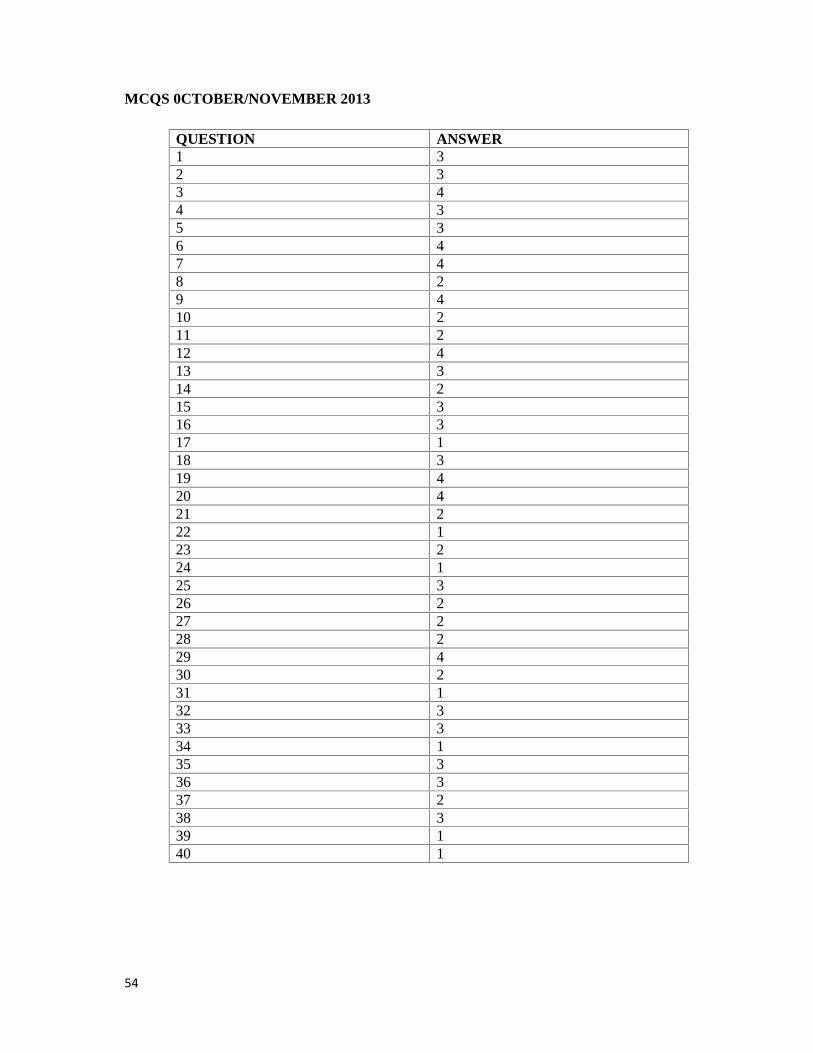
MCQS 0CTOBER/NOVEMBER 2013
QUESTION ANSWER1 32 33 44 35 36 47 48 29 410 211 212 413 314 215 316 317 118 319 420 421 222 123 224 125 326 227 228 229 430 231 132 333 334 135 336 337 238 339 140 1
55
ECS1601 MAY/JUNE 2013 EXAM SOLUTIONS
SECTION A
Question 1
i. Define the Gross Domestic Product (GDP)Total value of all final goods and services produced within the borders of a country ina specific period of time.
ii. Name the three criteria for a good taxNeutralityEquityAdministrative simplicity
iii. What are the two main sub-accounts of the balance of paymentsCurrent accountFinancial account
Question2
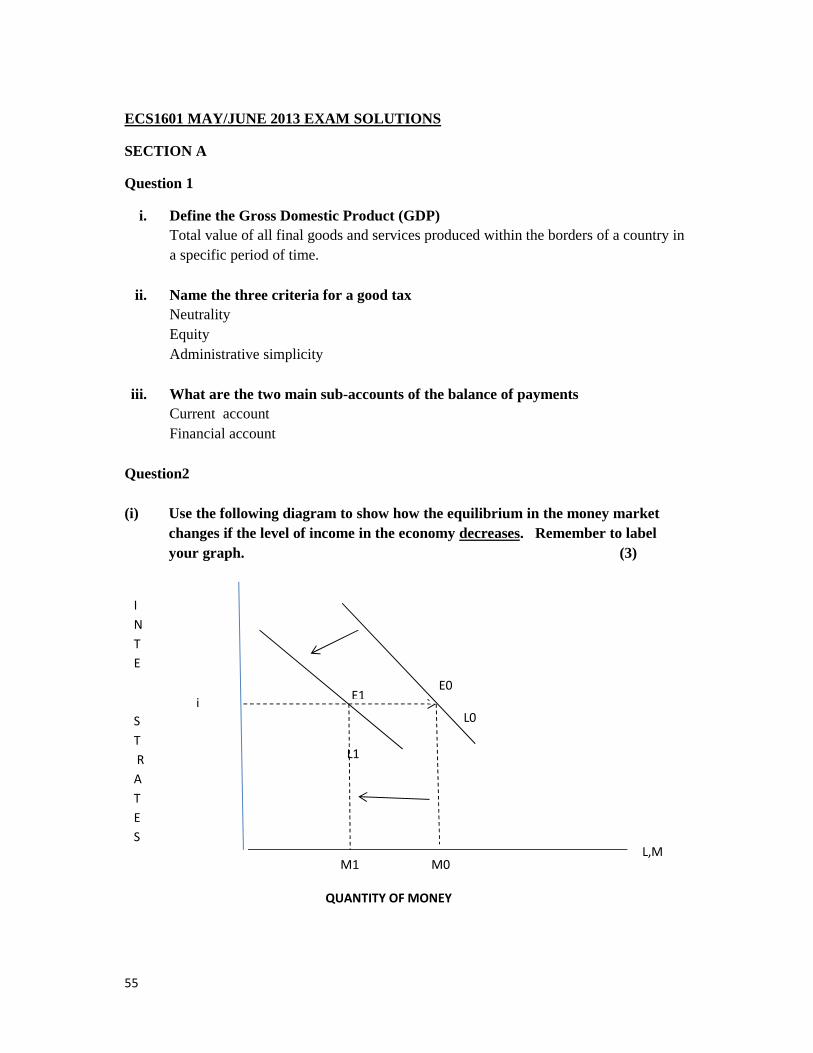
(i) Use the following diagram to show how the equilibrium in the money marketchanges if the level of income in the economy decreases. Remember to labelyour graph. (3)
L1
L0
INTERESTRATES
M1 M0
i E1E0
QUANTITY OF MONEY
L,M
56
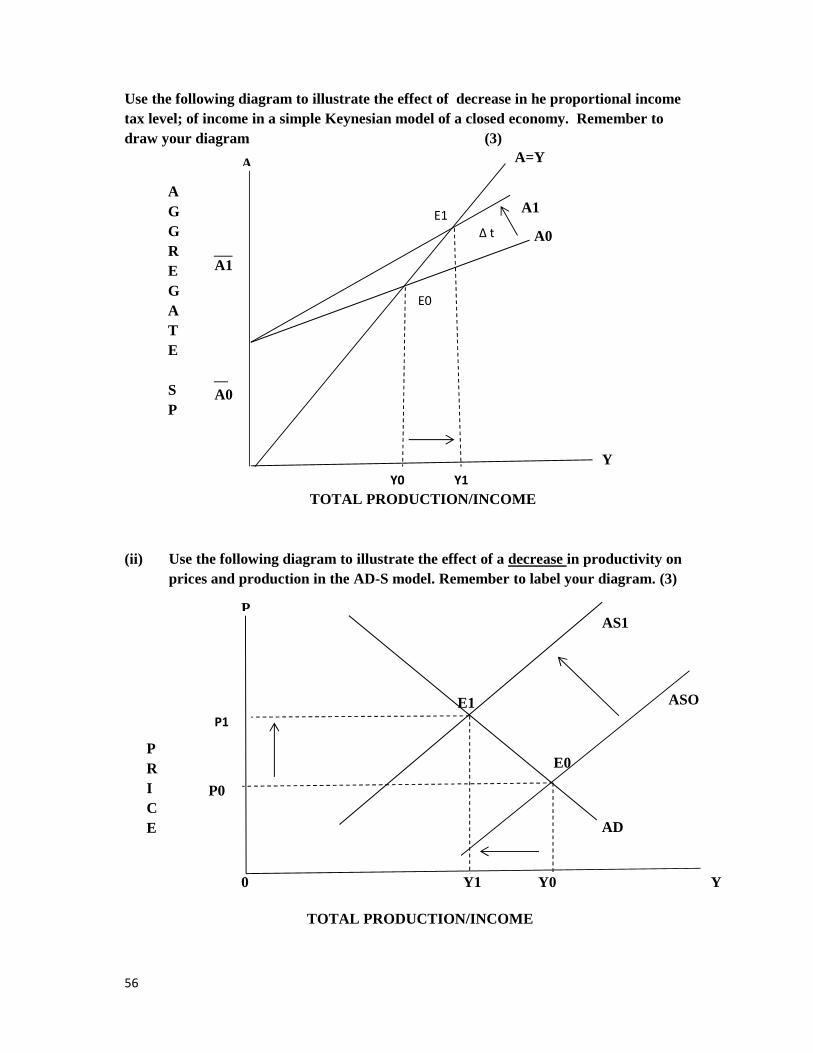
Use the following diagram to illustrate the effect of decrease in he proportional incometax level; of income in a simple Keynesian model of a closed economy. Remember todraw your diagram (3)
(ii) Use the following diagram to illustrate the effect of a decrease in productivity onprices and production in the AD-S model. Remember to label your diagram. (3)
AGGREGATE
SP
A1
A0
Y0 Y1TOTAL PRODUCTION/INCOME
A1
A0
Y
A A=Y
E0
E1Δ t
PRICE
P
P0
0
TOTAL PRODUCTION/INCOME
E1
E0
AS1
ASO
AD
Y1 Y0 Y
P1
57
QUESTION 3
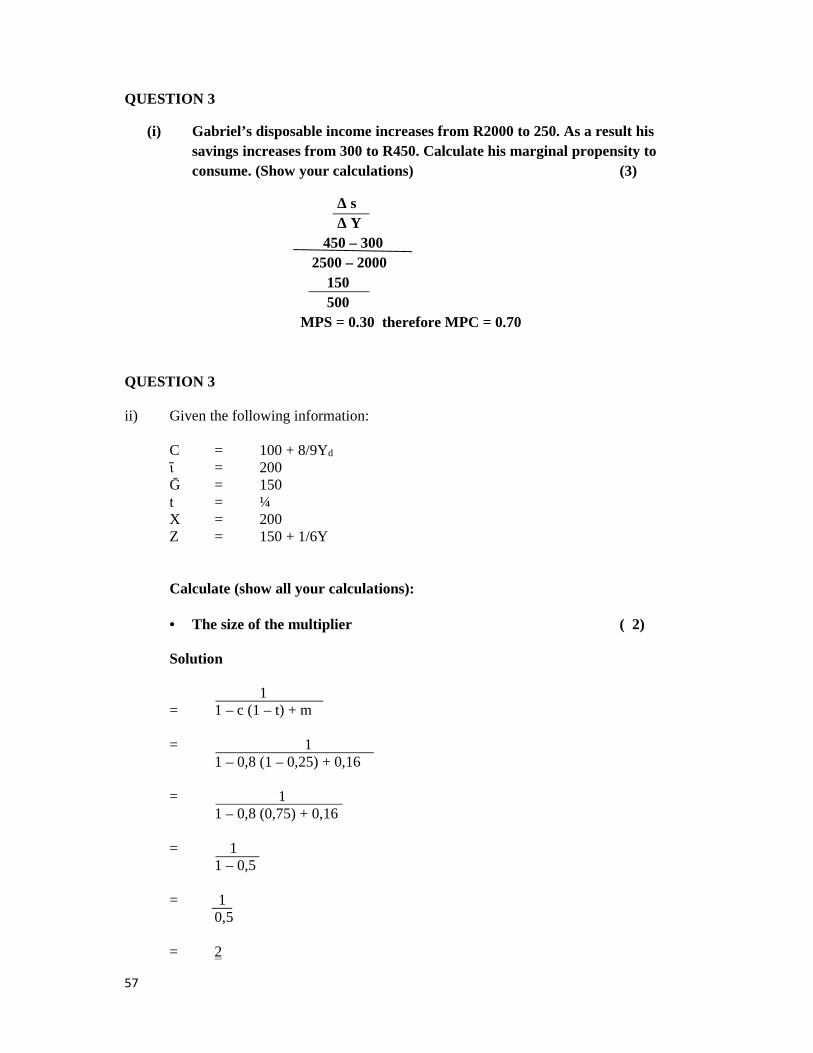
(i) Gabriel’s disposable income increases from R2000 to 250. As a result hissavings increases from 300 to R450. Calculate his marginal propensity toconsume. (Show your calculations) (3)
Δ sΔ Y
450 – 3002500 – 2000
150500
MPS = 0.30 therefore MPC = 0.70
QUESTION 3
ii) Given the following information:
C = 100 + 8/9Yd
ῑ = 200Ḡ = 150t = ¼X = 200Z = 150 + 1/6Y
Calculate (show all your calculations):
The size of the multiplier ( 2)
Solution
1= 1 – c (1 – t) + m
= 11 – 0,8 (1 – 0,25) + 0,16
= 11 – 0,8 (0,75) + 0,16
= 11 – 0,5
= 10,5
= 2
58
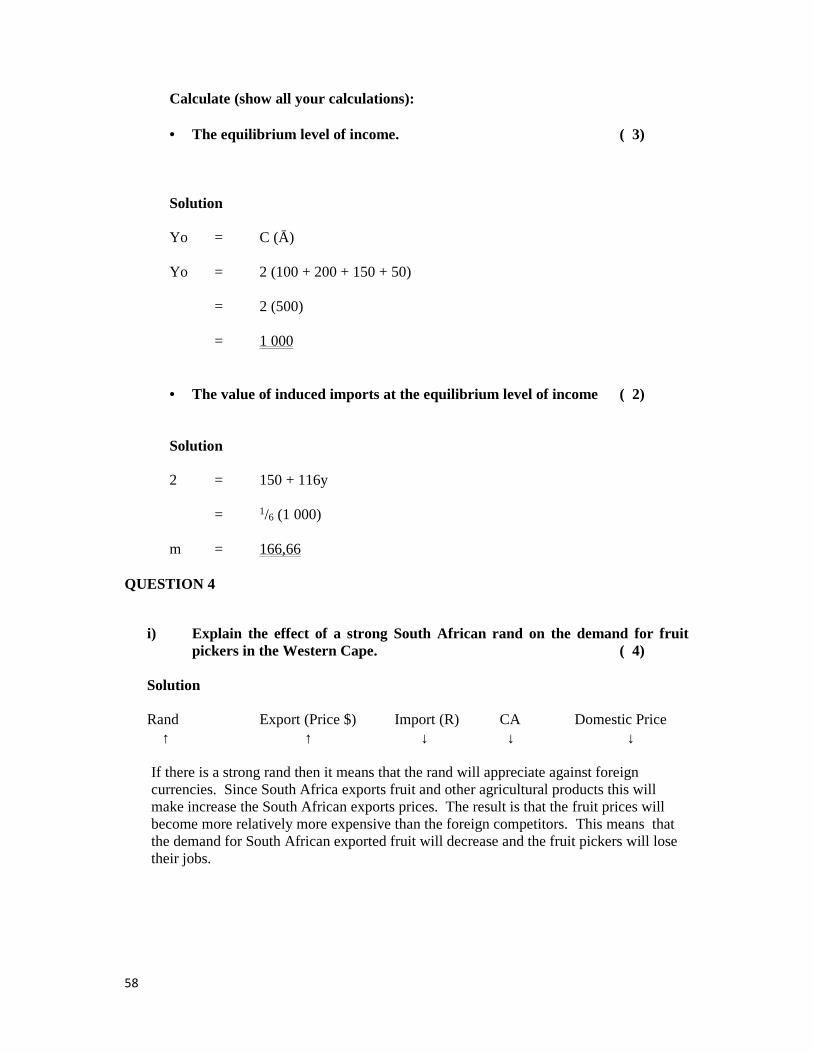
Calculate (show all your calculations):
The equilibrium level of income. ( 3)
Solution
Yo = C (Ā)
Yo = 2 (100 + 200 + 150 + 50)
= 2 (500)
= 1 000
The value of induced imports at the equilibrium level of income ( 2)
Solution
2 = 150 + 116y
= 1/6 (1 000)
m = 166,66
QUESTION 4
i) Explain the effect of a strong South African rand on the demand for fruitpickers in the Western Cape. ( 4)
Solution
Rand Export (Price $) Import (R) CA Domestic Price
If there is a strong rand then it means that the rand will appreciate against foreigncurrencies. Since South Africa exports fruit and other agricultural products this willmake increase the South African exports prices. The result is that the fruit prices willbecome more relatively more expensive than the foreign competitors. This means thatthe demand for South African exported fruit will decrease and the fruit pickers will losetheir jobs.

59
ii) The table below shows the GDP at current prices of country A for the years 1and 2.
Year GDP at current prices1 1002 110
Given the information in the table, explain why it is impossible to tellwhether the 10% increase in GDP from year 1 to year 2 representseconomic growth. ( 3)
Solution
An increase in current (nominal) GDP from one year to another does not necessarily meanthat economic growth has taken place the change in GDP could be attributed to prices(inflation) we need to cater for price changes thus converting current to constant.
iii) Explain the effect of a decrease in the marginal propensity to import on thesize of the multiplier. ( 3)
Solution
A decrease in m will increase the size of the multiplier. As the m creases so does theleakage of income from the economy thus an increase the multiplier.
iv) Explain the impact of an increase in the tax rate on the equilibrium level ofincome in a Keynesian model of an economy. ( 4)
Solution
Increase in the income tax will increase the leakage of income in the economy, thus thiswill decrease the level of output / income in the economy.
v) Define monetary policy and explain how it can be used to combat demand-pullinflation. ( 8)
Solution
Monetary policies measures taken by monetary authorities to influence the quantities ofmoney or the interest rates, with the vein at achieving stable prices, full employment andeconomic growth. (SARB in SA), MPC.
Demand Pull-Inflation occurs when aggregate demand increases. To combat this,authorities have to keep the aggregate demand for goods and service in check. This can bedone by applying a restrictive monetary policy. Restrictive monetary policy entails raisinginterest rates and limits in the increase in MS.
SECTION B
60

61

62
63
64

65
Solutions to MCQ
1) 4 2) 2 3) 2 4) 1 5) 26) 4 7) 1 8) 2 9) 3 10) 211) 1 12) 3 13) 1 14) 2 15) 216) 2 17) 1 18) 4 19) 2 20) 421) 2 22) 3 23) 4 24) 2 25) 326) 4 27) 4 28) 2 29) 4 30) 431) 1 32) 2 33) 3 34) 3 35) 236) 2 37) 4 38) 3 39) 1 40) 4