ewis monitoring tool · alongside ewis risk, and periodically adjust student supports. this is a...
TRANSCRIPT

1
EWIS Monitoring Tool For Monitoring Student Risk throughout the Year Massachusetts Department of Elementary and Secondary Education 75 Pleasant Street, Malden, MA 02148-4906 Phone 781-338-3000 TTY: N.E.T. Relay 800-439-2370 www.doe.mass.edu

2
Table of Contents Monitoring Student Risk .............................................................................................................................. 3
Purpose of this tool .................................................................................................................................. 3
Timeline for Monitoring Students’ Risk using this Tool .......................................................................... 5
How to use the Tool ................................................................................................................................. 6
Terms used in this Tool ............................................................................................................................ 9
Preparing and Loading Data Files .......................................................................................................... 10
Student file ......................................................................................................................................... 11
EWIS file .............................................................................................................................................. 12
ABCs file .............................................................................................................................................. 13
Appendix ..................................................................................................................................................... 15
Web resources ........................................................................................................................................ 15
Early Warning Implementation Cycle Timeline ..................................................................................... 16
Data File Templates ................................................................................................................................ 18
Intervention Inventory Example ............................................................................................................ 19
Acknowledgements The development of this tool was influenced National High School Center EWS High School Tool and EWS Middle School Tool developed by American Institutes for Research (AIR), and by discussions with educators. We would like to acknowledge the contributions made by educators in districts across Massachusetts and at DESE, and thank them for sharing their insights. Conversations with many educators about their monitoring strategies influenced the development of this tool, and district and DESE staff tested and provided feedback for this Tool and this Guide. This document accompanies Monitoring Tool version 1.0.
Version: Changes: Date:
1.0 Initial document 9/21/18
1.1 Minor changes 10/11/18
The Monitoring Tool and accompanying Monitoring Tool Guidance Document is for districts and schools in Massachusetts that are using EWIS and other sources of local data to identify students with academic risk; diagnose students’ needs; and support and monitor students, in accordance with the Massachusetts Early Warning Implementation Cycle. The Monitoring Tool Guidance Document accompanies and supports the use of the Monitoring Tool. The tool is not configured to be run on a chrome book. This document, the Monitoring Tool and other resources are at DESE’s EWIS website (http://www.doe.mass.edu/ccr/ewi/ ).

3
Monitoring Student Risk Schools collect a vast array of student data on a regular basis. At times, though, it can be difficult to cut through the volume of data and understand who is at risk and for what reason, and track what is being done about it. This is challenging on the individual level (exactly who is at risk, and what are their signs of risk?) and on the grade, school or district level (how many students are at risk, and how many show similar signs of risk?). In fact, educators can hone in on key metrics to identify which students are showing signs of academic risk early in the school year, and throughout the school year. This practice of periodic data review is ‘monitoring student risk’. Research shows that ABC’s – attendance, behavior & course performance – are particularly powerful indicators of students’ academic risk. Examining these at regular intervals (two, three or four times a year) and comparing them to thresholds allow educators to identify students if they begin to go off track. In some cases – if data review is new, if it is challenging to access data from an SIS or if teams choose to start small for strategic reasons – attendance alone is a valuable indicator of risk. In other cases, educators may choose to add one or two more indicators emerging from locally validated efforts or reflecting local initiatives. Catching changes in student risk right away and assigning programmatic supports as needed can bring students back on track quickly. In addition to using monitoring indicators to observe the progress of individual students, districts and schools may use these to identify trends in student needs, and make recommendations for school-wide improvements such as changes in schedules, curriculum, or instructional approaches.
Purpose of this tool This a tool for educators to use when monitoring and responding to students' academic risk throughout the school year. With this tool, educators can combine several data pieces; understand students’ ongoing risk; assign students to interventions; and develop skill in monitoring student risk throughout the year. This tool is not a ‘silver bullet’ or comprehensive solution to address systemic data challenges, programmatic challenges or other challenges. The tool does not ‘talk to’ or link directly to a Student Information System (SIS), and does not provide real-time alerts. Through using this tool, educators may develop ideas for a subsequent and more comprehensive monitoring strategy for the future. With this, educators can combine students’ EWIS risk levels with data from other sources and make assignments to appropriate interventions at the beginning of the year. And throughout the year, educators can incorporate students' updated attendance, behavior and course performance for review alongside EWIS risk, and periodically adjust student supports. This is a complement to EWIS reports in Edwin, which snapshot students’ risk of missing academic milestones at the beginning of the school year. This tool is part of the Massachusetts Early Warning System, or EWIS. With EWIS, the state provides reports to identify students who are at risk of not meeting important academic goals, and tools for educators to help students get back on track in time to meet those goals. This tool is oriented around the Massachusetts Early Warning Implementation Cycle, a systematic approach to identify students at

4
risk of missing an academic milestone, explore underlying factors leading to academic risk and assign supports based on the unique strengths and needs of their students, then monitor progress to ensure that students stay on track and are responding to interventions. This data-driven approach may lead to interventions at the individual, small group, and whole school or district-wide levels. For more information on using EWIS as part of an ongoing cycle of inquiry, see the EWIS website for an Early Warning e-learning tutorial and the Early Warning Implementation Guide.
5
Timeline for Monitoring Students’ Risk using this Tool While students’ academic risk may fluctuate and the task of monitoring and adapting to students’ risk may be seen as continuous, discrete steps can occur at defined points in the school year aligned with the academic calendar. Prior to and at the beginning of the school year Teams can organize their monitoring strategies prior to or at the start of the school year (Step 1). This can include:
Enlisting colleagues to collaborate on monitoring student risk
Examining this tool to become familiar with it
Completing Step 1 in the Monitoring Tool; this includes preparing the Student file
Previewing Steps 2-5 in the Monitoring Tool Typically, teams will implement several steps during the first weeks of the school year. This means –
Completing Step 2, 3 and 4 in the Monitoring Tool; this includes preparing the EWIS file
Examining EWIS data (Step 2) more deeply outside of tool use
Exploring underlying causes of risk (Step 3) more deeply outside of tool use
Assigning students to interventions (Step 4) based on results of previous steps During the School Year After student interventions and supports have been assigned (Step 4), teams review monitoring indicators periodically to ensure that support strategies and interventions are responsive to student needs and that all students remain on-track (Step 5). It is recommended that teams monitor students at the end of each grading period (or as frequently as the team can conduct a thoughtful and actionable review), then repeat Steps 3-5. Teams may conduct Step 5 preliminary monitoring or an early check of students’ academic risk after the first 20-30 days of school. Teams are –
Completing Step 5 in the Monitoring Tool; this includes preparing an Early Check ABCs file
Repeating Steps 3-5 to adjust interventions and assignments as necessary Each marking period, teams are –
Completing Step 5 in the Monitoring Tool; this includes preparing an ABCs file
Repeating Steps 3-5 to adjust interventions and assignments as necessary In the spring, teams use monitoring to inform the planning of summer supports for students. Finally, at the conclusion of the school year, teams refine their monitoring strategies; reflect on intervention results; and consider improvements for the following year (Step 6).

6
How to use the Tool Navigation This tool opens to a picture of the Early Warning Implementation Cycle. Click on the ‘Get Organized’ button to get started on Step 1, or select another step of the Cycle.
Most pages have a navigation bar across the top. Use this to advance through the cycle or refer to earlier steps.
Most pages have a More Info button in the upper right. Click on More Info to see pop-up boxes with guidance; click a second time and they disappear.
On each page, look for boxes in pale yellow. These are ones where the user may make a selection or add text or numbers. When the curser is in a yellow box, if choices are available, a small triangle appears.

7
Click on the triangle to select an option.
If no choices are available, information can be entered by typing a number or text.
In many cases, the selections are used with buttons (gray boxes) to filter student data. Use Show all to clear filters before navigating away from the page. (This is especially important in Step 5.3.)
Each gray box is a button for taking action; the specific actions are described in pop-up boxes.
S
For the most part, there is very little typing. Exceptions are noted.

8

9
Terms used in this Tool
EWIS Risk Level: Consistent with the MA EWIS, in this tool, EWIS Risk Level refers to the risk of a student missing a key academic milestone, such as graduation from high school, passing all grade 9 classes, enrolling in college or others. Students’ EWIS Risk Level may be High, Moderate or Low. (See link.)
The EWIS Risk Flag notes whether students are ‘at risk’ based on the EWIS Risk Levels. o An EWIS Risk Flag may be Yes (at risk based on EWIS) or No (not at risk based on EWIS). o In Step 1.2 Get Organized – Set up, users can decide whether the EWIS Risk Flag should
refer only to students whose EWIS Risk Levels are High, or to students whose risk is High and students whose risk level is Moderate.
Indicators are measures that are predictive of high school graduation and postsecondary readiness. They reflect student engagement and academic performance, and early signs of disengagement or lagging performance. The ABCs – attendance, behavior and course performance (or number of failing courses) – are particularly reliable indicators as they predict high school graduation and postsecondary preparation. Additional indicators may include number of tardies, interim assessment scores, FAFSA completion or other local measures of engagement, participation or performance.
Thresholds or cut points are the values or scores at which indicators begin to show signs of risk. Users can establish a threshold for each indicator; they may be locally derived or based on research.
Indicators are flagged and students are considered at risk or off track when any indicator meets the threshold or cut point.
Interventions are sustained programmatic experiences conducted over time, designed to address students’ underlying causes of risk.
Marking periods or grading periods such as semesters, trimesters and quarters are times when grades close. These are opportunities to compile students’ indicator data (the ABCs), load them into the tool and use color-coded flags to see which students are at risk for each indicator.
Depending on the school context, an educator may want to focus on students whose EWIS Risk is High, or focus on students whose risk is High and students whose risk level is Moderate. In Step 1.2 Get Organized – Set up, decide which EWIS Risk Levels you will focus on (High Risk, or High and Moderate Risk).

10
Preparing and Loading Data Files This tool operates using several files of student-level information, which come from various sources at different times in the school year. Several files come from information in local Student Information Systems (SIS’s). Files should follow particular formats, described below. SIS’s operate differently, have different reports, and familiarity with SIS may vary. Users of this tool may choose to partner with someone in their district or building who is familiar with using the SIS to generate these files. There are three types of files:
Student file includes enrollment data, and comes from a local Student Information System; these are included to build context about students, and many fields are used in filters for analyzing students’ risk. This file can be made and loaded into the tool at the beginning of the year. New students may be added after the beginning of the year.
EWIS file includes information from EWIS reports. These are included to show students’ risk of missing an academic milestone based on their previous year’s information. This file can be made and loaded into the tool at the beginning of the year.
ABC files include indicators of academic risk, specifically attendance, behavior and course performance, at each marking period. These are used to monitor students’ ongoing risk through the school year, enhance understandings of causes and use in intervention assignments. These come from local information and may be housed in an SIS, and may be generated every marking period or as frequently as the team wishes to review students’ ongoing risk. Users may also select two additional custom indicators.
Other tips:
Store the file as a txt (tab-delimited) or csv (comma-separated variable) file.
Use the column order shown. If you chose to omit any data, leave a blank column.
After loading student data, save the tool.
You may make several versions of the tool throughout the year as you add students or load new information along the way. As you get started, consider how to name it and where you will store it. Save your work as you go, in case you need to refer to an earlier version.

11
Student file The Student file reflects student enrollment at the start of the school year and includes basic student details (i.e., from a Student Information System). Basics may include students’ SASID and LASID, first & last names, Grade, DOB, Gender, Race/Ethnicity, Disability status, Disadvantaged status, ELL status, a custom group and Enrollment Status. These are recommended, as they are useful in building context and supporting students, however users may choose to skip some. Leave blank any columns the user wishes to ignore or leave out. The file should have 14 columns, include at least the fields in bold, and up to all the fields listed, in the order shown. This file is loaded into the tool in Step 1.1 – Get Organized: Students. List of columns in Student file:
Column Description Format
SASID Student’s State Assigned Student Identification Text
LASID Student’s Locally Assigned Student Identification Text
First Name Student’s first name Number
Last Name Student’s last name Number
Grade Student’s grade Number
Date of birth Student’s date of birth Date
Gender Student’s Gender (categories) Text
Race/Ethnicity Student’s Race/Ethnicity (categories) Text
Disability Student’s Disability status (categories) Text
Disadvantaged Student’s Disadvantaged status (categories) Text
English Learner Student’s English Learner status (categories) Text
Custom group (optional)
Custom group, as defined by user; up to 20 categories (for example, Homeroom, Team, or School Counselor)
Text
Enrollment status Student’s Enrollment Status (Enrolled, Dropped out, Transferred in, Transferred out, Graduated)
Text
1. These may be locally defined, as reported in SIMS or other categories useful to users. 2. The column name for Custom group can be made in Step 1.2 Get Organized – Set up. 3. Columns in bold are required.
As this tool will contain identifiable student data, follow local data guidelines established for your district and use secure local data transfer tools.

12
EWIS file The EWIS file reflects EWIS risk, or the risk of missing important academic milestones, at the start of the school year. Prepare a file with EWIS Risk Levels from an EWIS student-level report (Early Warning Indicator System Student List/EW601 or Early Warning Indicator System Student List-Postsecondary/EW602 in Edwin). This file can include SASID, Risk Level, Suspension, Retained, School Move, Overage, Economically Disadvantaged, and up to four other columns of data from the student list report. Leave blank any columns the user wishes to ignore or leave out. The file should have 11 columns, include at least the fields in bold, and up to all the fields listed, in the order shown. This file is loaded into the tool in Step 2 – Review EWIS. List of columns in EWIS file:
Column Description Format
SASID Student’s State Assigned Student Identification Number
EWIS Risk Level High, Moderate or Low Risk (of missing an academic milestone)
Text
Suspension (previous year) # of suspensions the previous school year Number
Retained (previous year) Whether a student was retained (Yes, No) Text
School Move (previous year) Whether a student had a school move within the school year (Yes, No)
Text
Overage (previous year) Whether a student is over a typical age for their grade (Yes, No)
Text
Economically Disadvantaged (previous year)
Whether a student is Economically Disadvantaged, as calculated by DESE (link) (Y, N)
Text
Other6 As defined by user Number or text
Other7 As defined by user Number or text
Other8 As defined by user Number or text
Other9 As defined by user Number or text
1. Columns in bold are required.

13
ABCs file The ABCs file reflects students’ ongoing risk as the school year progresses. At each marking period, prepare a file with monitoring indicators (i.e., from a Student Information System). Data can include SASID, attendance rate, number of behavior incidents, number of courses failed and up to two other indicators defined by the user; they must be numerical (not text). Leave blank any columns the user wishes to skip or leave out. New users may wish to use attendance only to build this habit, and add additional indicators of academic risk over time. Marking Period 1 is unique, with an Early Check of risk. For an Early Check of who is at risk, prepare and load a file with SASID and early attendance rate only early in the marking period (in the first 20-30 days). For more on this early check opportunity, see Step 1 Get Organized – Set Up. Data can include SASID and early check attendance rate only. The file should have two columns in the order shown. This file is loaded into the tool in Step 5.1 Monitor: Bring in ABCs. ABCs file for Early Check in Marking Period 1:
Column Description Format
SASID Student’s State Assigned Student Identification Number
LASID Student’s Locally Assigned Student Identification Number
Early Attendance Attendance rate after the first 20-30 days, as a percentage or ratio
Number
At the end of Marking Period 1, prepare and load a file with SASID, early attendance rate, attendance rate, number of behavior incidents, number of courses failed and up to two other indicators defined by the user; they must be numerical (not text). Leave blank any columns the user wishes to skip or leave out. The file should have seven columns, include at least the fields in bold, and up to all the fields listed, in the order shown. This file is loaded into the tool in Step 5.1 Monitor: Bring in ABCs. ABCs file at the end of Marking Period 1
Column Description Format
SASID Student’s State Assigned Student Identification Number
Early Attendance Attendance rate after the first 20-30 days, as a percentage or ratio
Number
Attendance Attendance rate for the marking period, as a percentage or ratio
Number
Behavior Number of behavior incidents, as defined by user (referrals, suspensions or other)
Number
Courses Number of courses failed User may choose to focus on number of courses failed out of all enrolled courses or out of core courses only.
Number
Custom Indicator 1 As defined by user Number

14
Custom Indicator 2 As defined by user Number
1. The names for Custom Indicators 1 and 2 can be made in Step 1.2 Get Organized – Set up. 2. Columns in bold are required. 3. If users prepared an Early Check (above), keep Early Attendance in the Marking Period 1 file. If users did not prepare an Early Check, this column may be blank. For subsequent Marking Periods, the process is similar, without Early Attendance: prepare and load a file with SASID, attendance rate, number of behavior incidents, number of courses failed and up to two other indicators defined by the user; they must be numerical (not text). Leave blank any columns the user wishes to ignore or leave out. The file should have six columns, include at least the fields in bold, and up to all the fields listed, in the order shown. This file is loaded into the tool in Step 5.1 Monitor: Bring in ABCs. ABCs file at the end of Marking Periods 2, 3 or 4
Column Description Format
SASID Student’s State Assigned Student Identification Number
Attendance Attendance rate for the marking period, as a percentage or ratio
Number
Behavior Number of behavior incidents, as defined by user (referrals, suspensions or other)
Number
Courses Number of courses failed User may choose to focus on number of courses failed out of all enrolled courses or out of core courses only.
Number
Custom Indicator 1 As defined by user Number
Custom Indicator 2 As defined by user Number
1. The names for Custom Indicators 1 and 2 can be made in Step 1.2 Get Organized – Set up. 2. Columns in bold are required.
I sent the data templates to my Data Specialist, and asked her to send me student data at four dates throughout the school year. Before our Student Support Team meetings, I loaded the tool and previewed the results. In team meetings, we talked about the students and what else we could try. -EWIS User

15
Appendices
Web resources EWIS website http://www.doe.mass.edu/ccr/ewi/ Early Warning Implementation Cycle Guide http://www.doe.mass.edu/edwin/analytics/implementation-guide.pdf Early Warning Implementation Cycle e-learning tutorial http://www.doe.mass.edu/ccr/videos/ewis/story.html

16
Early Warning Implementation Cycle Timeline The Early Warning Implementation Cycle is carried out during the course of a school year and is aligned with the academic calendar. Specific steps are undertaken at defined periods of the year, many in a recurring or a continuous manner. As the timeline below illustrates, teams begin to organize their work prior to the start of the school year (Step 1). Typically, teams will implement Steps 2, 3, and 4 during the first six weeks of the school year. After student interventions and supports have been assigned (Step 4), teams periodically review monitoring indicators to ensure that support strategies and interventions are responsive to student needs and use monitoring indicators to ensure that all students remain on-track (Step 5). As shown, it is recommended that teams monitor students at the end of each grading period, and then repeat Steps 3-5. In the spring, teams use monitoring indicators data to inform the planning of summer supports for students. Finally, at the conclusion of the school year, teams refine their approach to using early warning data (Step 6). At the start of the school year:
Within the first six weeks of school:

17
Each marking period:
In spring:
At the end of the school year:

18
Data File Templates Data file templates may be downloaded at DESE’s EWIS Monitoring website (http://www.doe.mass.edu/ccr/ewismonitoring/ ).
19
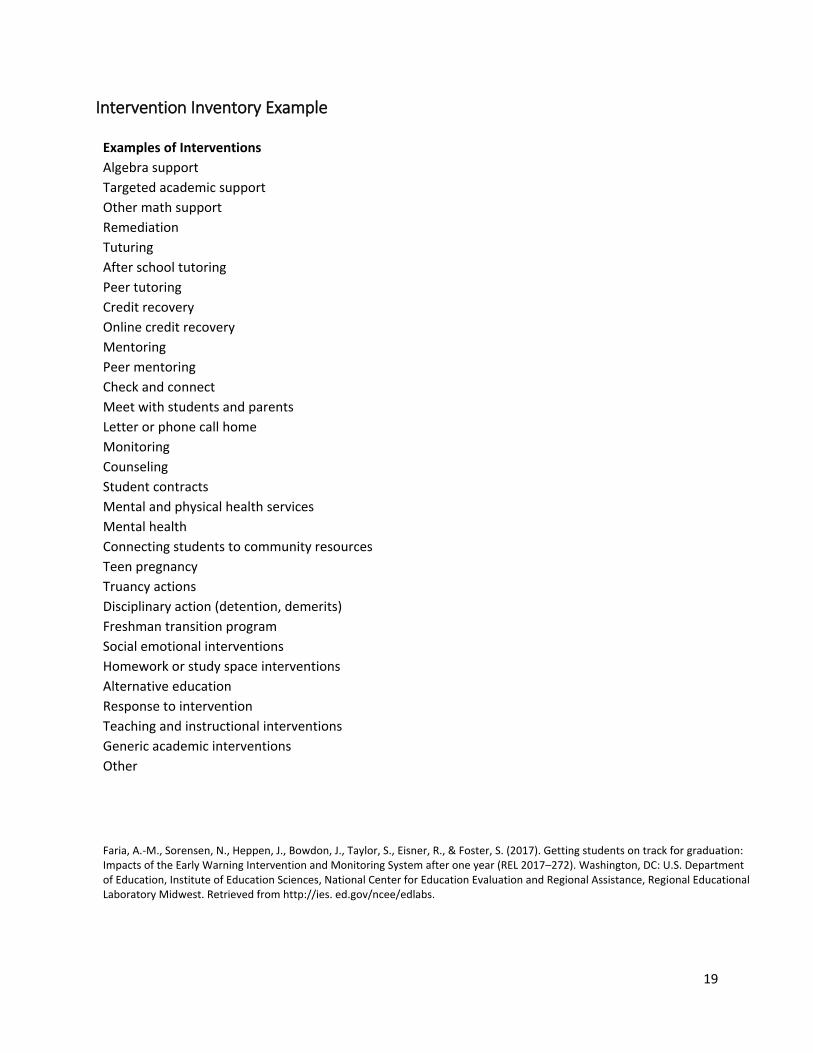
Intervention Inventory Example
Examples of Interventions
Algebra support
Targeted academic support
Other math support
Remediation
Tuturing
After school tutoring
Peer tutoring
Credit recovery
Online credit recovery
Mentoring
Peer mentoring
Check and connect
Meet with students and parents
Letter or phone call home
Monitoring
Counseling
Student contracts
Mental and physical health services
Mental health
Connecting students to community resources
Teen pregnancy
Truancy actions
Disciplinary action (detention, demerits)
Freshman transition program
Social emotional interventions
Homework or study space interventions
Alternative education
Response to intervention
Teaching and instructional interventions
Generic academic interventions
Other
Faria, A.-M., Sorensen, N., Heppen, J., Bowdon, J., Taylor, S., Eisner, R., & Foster, S. (2017). Getting students on track for graduation: Impacts of the Early Warning Intervention and Monitoring System after one year (REL 2017–272). Washington, DC: U.S. Department of Education, Institute of Education Sciences, National Center for Education Evaluation and Regional Assistance, Regional Educational Laboratory Midwest. Retrieved from http://ies. ed.gov/ncee/edlabs.