ewa talik, ludwika lipińska, adam guzik, paweł zajdel ... · title: formation of fe and ni...
TRANSCRIPT

Title: Formation of Fe and Ni substituted LiMn2-XMXO4 nanopowders and their crystaland electronic structure and magnetic properties Author: Ewa Talik, Ludwika Lipińska, Adam Guzik, Paweł Zajdel, Monika Michalska, Magdalena Szubka, Mariola Kądziołka-Gaweł, Rick L. Paul
Citation style: Talik Ewa, Lipińska Ludwika, Guzik Adam, Zajdel Paweł, Michalska Monika, Szubka Magdalena, Kądziołka-Gaweł Mariola, Paul Rick L. (2017). Formation of Fe and Ni substituted LiMn2-XMXO4 nanopowders and their crystal and electronic structure and magnetic properties. "Materials Science Poland" (2017, iss. 1, s. 159-172). doi 10.1515/msp-2017-0014

Materials Science-Poland, 35(1), 2017, pp. 159-172http://www.materialsscience.pwr.wroc.pl/DOI: 10.1515/msp-2017-0014
Formation of Fe and Ni substituted LiMn2−xMxO4
nanopowders and their crystaland electronic structure and magnetic properties
E. TALIK1,∗, L. LIPINSKA2 , A. GUZIK1 , P. ZAJDEL1 , M. MICHALSKA2 , M. SZUBKA1 ,M. KADZIOŁKA-GAWEŁ1 , R.L. PAUL3
1Institute of Physics, University of Silesia, Uniwersytecka 4, 40-007 Katowice, Poland2Institute of Electronic Materials Technology, Wólczynska 133, 01-919 Warszawa, Poland
3Analytical Chemistry Division, National Institute of Standards and Technology, Gaithersburg, MD 20899, USA
The Pechini sol-gel method was applied to obtain LiMn2−xTxO4 (T = Ni, Fe; x = 0.1 to 0.5) nanopowders. Crystal andelectronic structures, chemical composition and magnetic properties of the materials were characterized by X-ray diffraction,XPS, SEM/EDX microscopy, prompt gamma-ray activation analysis (PGAA), Mössbauer spectroscopy and magnetic suscepti-bility, respectively. XRD measurements showed that the LiMn2−xNixO4 were single phase for x = 0.1 and 0.2. Three sampleswith higher Ni content contained some addition of a second phase. Analysis of the oxidation state of the dopants by XPSrevealed ionic Ni2+ and Fe3+. Mössbauer spectroscopy also confirmed 3+ oxidation state of iron and its location in octahe-dral sites, which excluded the inverse spinel configuration. XPS examinations showed that Mn3+ ions dominated in the ironsubstituted series whereas the Mn4+ was dominant in the nickel series.
Keywords: nanomaterials; lithium manganese nickel oxides; spinel
© Wroclaw University of Science and Technology.
1. IntroductionLithium manganese oxide (LiMn2O4) spinel
has been extensively studied as a cathode materialfor Li-ion batteries, as an alternative to LiCoO2,LiNiO2 or LiFePO4 used today. Initially, LiMn2O4spinel has been synthesized mainly using conven-tional solid state methods [1, 2]. Nowadays, othersynthetic routes are applied too. One of them is amodified sol-gel (Pechini) technique, which seemsto be appropriate for preparation of nanocrystallinecathode materials. Being a solution-based route, itoffers a possibility of molecular level mixing of thestarting materials. As a consequence, one can attaina high degree of homogeneity with small particlesize and high surface area [3–6].
Application of LiMn2O4 offers several ad-vantages, like low cost, easy preparation, non-toxicity, high potential (∼4 V vs. lithium metal),
∗E-mail: [email protected]
satisfactory capacity, high energy density, low self-discharge and high thermal stability [7–10].
In spite of these advantages, LiMn2O4 suf-fers from a serious capacity fading during charge-discharge cycles, which is unacceptable for com-mercial applications. This problem can be causedby several factors: manganese dissolution, elec-trolyte decomposition at high potentials, theJahn-Teller (J-T) distortion at the state of a deepdischarge and lattice instability [11, 12]. The lastfactor seems to be crucial for high cycling capac-ity of lithium manganese oxide [13]. There are var-ious strategies to improve the structural stabilityof LiMn2O4. One of them is a partial substitutionof manganese ions by other divalent or trivalentmetal elements in the 16d octahedral sites in thespinel structure [1] in order to block the propaga-tion of the J-T distortion. The doping elements aremetals: either non-transition, e.g. Al, Mg [14–19],or transition metals Ni [20–31], Fe [14, 32–41].
Brought to you by | Uniwersytet Slaski - University of Silesia - Silesian UniversityAuthenticated
Download Date | 11/9/17 10:38 PM

160 E. TALIK et al.
The substitution range is indeed wide: from 0.5 %up to 25 % of atomic fraction.
In our previous work [42], we synthesizedlithium manganese oxide spinels with Mn substi-tuted by transition metals (Fe and Ni) and non-transition metals (Mg and Al). The degree of Bspinel site substitution was 25 % for all metal atoms(M), based on general formula of the substitutedspinel LiMn2−xMxO4, where x = 0.5. The sam-ples were characterized by the following methods:X-ray diffraction (XRD), scanning electron mi-croscopy (SEM/EDX), X-ray photoelectron spec-troscopy (XPS) and SQUID magnetometry. XPSwas used to examine the chemical compositionand oxidation state of the manganese, in particu-lar the Mn3+:Mn4+ ratio, from the deconvolutionof the complex Mn3p lines. The size of the grainsand crystallites were independently obtained fromSEM images and XRD patterns, respectively.
In this work, we continue examination ofLiMn2O4 substituted by transition metals Fe andNi, expanding the substitution range from 0.1 upto 0.5. We studied how the degree of substitutionaffects the structural and magnetic properties oflithium manganese spinels.
2. ExperimentalThe spinel structured lithium manganese ox-
ide nanomaterials: LiMn2−xMxO4, where M = Ni,Fe and 0.1 6 x 6 0.5 (corresponding to nomi-nal Mn:Fe or Mn:Ni composition ratios of 1.9:0.1,1.8:0.2, 1.7:0.3, 1.6:0.4 and 1.5:0.5, respectively)were synthesized by a simple, low cost, modifiedsol-gel method [5, 6, 42–45].
First, stoichiometric amounts of metal pre-cursors: manganese acetate (C4H6O4)Mn·4H2O,(pure p.a. 99 % CHEMPUR) lithium acetate(C2H3O2)Li·2H2O (> 97 %, Sigma-Aldrich) andnickel acetate (C4H6O4)Ni·4H2O (98 %, Sigma-Aldrich) or iron citrate (C6H5FeO7·H2O) (purep.a., 18 % to 20 % Fe basis, Sigma-Aldrich) wereseparately dissolved in deionized water under con-tinuous stirring. In the second step, the solutionswere mixed together and stirred. The molar ratioof total metal ions and citric acid was 1:1. For
example to obtain LiMn1.9Ni0.1O4, 1.9 mole ofmanganese acetate tetrahydrate 0.1 mole of nickelacetate tetrahydrate and 1 mole of lithium acetatedehydrate were used.
Next, for the Ni doped series, citric(C6H8O7·H2O, pure p.a., 99.5 %, AvantorPerformance Materials Poland S.A.) and acetic(C2H4O2, 99.5 % CHEMPUR) acids were addedas complexing agents. Finally, the solution wasevaporated until a gel was formed, which was fur-ther dried for a few hours at 150 °C. The preparedxerogels were ground in an agate mortar to obtainfine powders. The powders were heated in air flowfrom room temperature to 300 °C with the heatingrate of 10 °C/min and maintained at this temper-ature for 3 hours. Then, the samples were heatedat the same rate to 700 °C and maintained at thistemperature for next 5 hours. After completion ofthe calcination stage the nanocrystalline powderswere cooled down freely.
For the iron doped series, the chelating agent:citric acid monohydrate (C6H8O7·H2O) with ethy-lene glycol (99 % CHEMPUR) were added to thesolution. The solutions were dried for several hoursat 150 °C. The obtained powders were ground in anagate mortar and heated for several hours in air inthe temperature range of 300 °C up to 700 °C.
Powder diffraction studies were carried out ona PANalytical PW1050 diffractometer in Bragg-Brentano geometry. A nickel filtered CuKα1,2source operating at 30 kV/30 mA was used to col-lect patterns with step size 0.02° and within angularrange from 10° to 135°. The Rietveld method [46]was applied to refine collected patterns using theFullprof software [47].
Example patterns are shown in Fig. 1. The in-strumental resolution file was obtained from the in-ternal silicon standard (a = 5.4306 Å). As the widthof the diffraction peaks was larger than the machinebroadening, size and strain models appropriate forLaue class m3m (size = 15, strain = 14) were usedwith the Thompson-Cox-Hastings profile [48]. Theanisotropic strain broadening was introduced in thequartic form [49]. The anisotropic Lorentzian sizebroadening was modelled using the spherical har-monic approach proposed by Jarvinen [50].
Brought to you by | Uniwersytet Slaski - University of Silesia - Silesian UniversityAuthenticated
Download Date | 11/9/17 10:38 PM

Formation of Fe and Ni substituted LiMn2−xMxO4 nanopowders. . . 161
Fig. 1. Example XRD patterns for LiMn1.7Ni0.3O4 and LiMn1.7Fe0.3O4.
For all refinements, ionic form factors Li+,Mn4+, Mn3+, Ni2+, Fe3+ and O2− were used. Thepresence of nickel in the 2+ rather than 3+ state inspinel oxides has been previously justified on thebasis of higher stability in both LiMn2O4 [30, 51,52] and prototypical MgAl2O4 [53] doped with Ni.Moreover, a similar conclusion has been drawn forselenide spinel ZnCr2−xNixSe4 series [54] usingX-ray absorption spectroscopy at the Ni K edge.Soft X-ray Absorption Spectroscopy (XAS) studiesof a similar compound LiMn0.5Ni0.5O4 [55] alsofound signatures of Ni2+ on the octahedral site.Due to the a priori unknown Mn4+:Mn3+ ratio, twotest refinements were performed in order to esti-mate its influence on the structural parameters. Thefirst refinement was done only with the Mn3+ andthe second one with Mn4+ ionic form factors. Theobtained structural parameters were equal withinone standard uncertainty, therefore only Mn3+ wasused in all further refinements.
Parameters used in Rietveld refinement in-cluded: lattice parameters, displacement and trans-parency corrections, up to two size (K00, K41) andstrain coefficients (S400, S220), one asymmetry pa-rameter, 3 individual isotropic atomic displacementparameters (ADPs), where ADPs of atoms on thesame crystallographic site were constrained to beequal. The background was treated as a linear inter-polation between selected points. The refined size
parameter K00 (Y00 spherical harmonic) describedisotropic domain size [50] and K41 a fourth orderdeformation. The strain parameter S400 was used toquantify correlations along the main principal di-rections [49] and S220 between each of these direc-tions. In two of the samples: LiMn1.5Ni0.5O4 andLiMn1.9Ni0.1O4, refinement of the higher terms ofshape and strain was unstable, therefore only theK00 and S400 parameters were used. An attempt torefine site occupation factors of lithium and man-ganese vs. the dopant was also unsuccessful aslithium is very weakly seen by XRD and there isonly small contrast between Mn and Fe/Ni. Wher-ever available, statistical uncertainties at 1σ levelare reported in parentheses.
The microstructural observations of thenanopowders as well as the microcomposi-tional analyses were conducted using the JOELJSM-7600F Scanning Electron Microscope.
The XPS spectra were obtained using a PHI5700/660 Physical Electronics Photoelectron Spec-trometer with monochromatized AlKα X-ray radi-ation (1486.6 eV). A hemispherical mirror analyzermeasured the energy of electrons with an energyresolution of about 0.3 eV. The photoelectron emis-sion from a surface area of 800 µm × 2000 µm wasrecorded. All measurements were performed in theconditions of 10−8 Pa. In every case, a charge neu-tralizer was used because of the charge effect which
Brought to you by | Uniwersytet Slaski - University of Silesia - Silesian UniversityAuthenticated
Download Date | 11/9/17 10:38 PM

162 E. TALIK et al.
occurs for non-conducting samples. The bindingenergy was determined with reference to the C 1scomponent set at 285 eV. Each peak of the recordedspectrum is characteristic of a certain electron en-ergy level of the measured elements. However, themeasured binding energies are not absolutely con-stant but depend on the chemical environments,where functional groups are located due to modi-fication of the valence electron distribution. Thesedifferences in electron binding energies in relationto pure element are called chemical shifts. The an-gle between the X-ray source and the sample sur-face was 45°.
For XPS investigations, it is important to de-termine the relative concentrations of various con-stituents. The Multipak Physical Electronics pro-gram [56] enables quantification of the XPS spectrautilizing peak area and sensitivity factor. The stan-dard atomic concentration calculation provides aratio of each component to the sum of all elementstaken into account in the data. Identification of allelements, except H and He, is detectable within alimit of the order 0.1 at.% for good quality spectra.Only those elements are considered for which thespecific line is clearly visible in the spectrum. Forthese lines, the background individually selectedin the region limited to the particular line is sub-tracted and after that integration of the peak areais performed [56]. The Gaussian-Lorentzian func-tions were used to fit the XPS core level spectra.
Magnetic susceptibility was measured using theSQUID Magnetometer MPMS-XL-7AC (QuantumDesign) in the temperature range of 2 K to 400 K.
The 57Fe Mössbauer spectrum was recordedat room temperature using a constant accelerationspectrometer with 57Co:Cr source. The spectrome-ter velocity was calibrated with a high purity α-Fefoil. The values of isomer shifts (IS) for all iden-tified subspectra were determined relatively to theα-Fe standard.
Determination of Mn:Li and Mn:Ni ratios inLi, Mn, Ni oxides was performed by cold neutronprompt gamma-ray activation analysis (PGAA).The five analyzed samples were in the form ofpowders, weighing between 30 mg and 60 mg. Allwere derivatives of LiMn2O4, with a fraction of
the Mn replaced by Ni. The samples were sealedin Teflon® Bags and analyzed using the NG7 coldneutron PGAA instrument located at the NISTCenter for Neutron Research [57–59]. Irradiationtimes for samples ranged from 18 h to 24 h.
Standards for measurement of Mn:Li ratioswere prepared from mixtures of Li2CO3 with (1)Mn3O4; (2) MnO2, previously prepared for mea-surement of Li:Mn ratios in Li:Mn oxides. Thesewere prepared by weighing components of the mix-ture in a mixing vial and shaking for 20 + 20 min-utes using a SPEX Mixer/Mill. A 0.3 g to 1 g por-tion of each powdered mixture was pressed into apellet, sealed in a Teflon® Bag, and irradiated forseveral hours in the prompt gamma beam. Addi-tional standards for measurement of Mn:Ni ratioswere prepared from a mixture of Ni powder, MnO2,and graphite, mixed similarly. Two pellets, weigh-ing 0.3 g and 0.6 g were prepared from the mixtureas described above.
Calculations were performed using the 7Li cap-ture gamma ray at 2032 keV, Mn gamma rays at5015 keV and 7244 keV, and the Ni capture lineat 8998 keV. The peaks were integrated using theSUM4 algorithm [60]. Sensitivities ratios calcu-lated for the mixtures of Li2CO3 with Mn com-pounds were used to determine mass content of Liand Mn. A mass ratio of Li:Mn was first obtained,which was then converted to moles Li/mol Mn.Molar ratios for Mn:Ni were similarly calculatedusing the ratios calculated from Ni:MnO2/graphitestandards.
3. Results and discussion3.1. X-ray diffraction
It is well established that LiMn2O4 undergoesa charge ordering transition accompanied by an or-thorhombic distortion due to the J-T cooperative ef-fect, close to room temperature [61]. The observed3 × 3 × 1 superstructure is one of the factors limit-ing cycling performance of Li-ion batteries.
Substitution of manganese with nickel in spinellithium manganates has been reported earlier innanosized form for x = 0.5 [30, 42] as well as poly-crystalline phases for x = 0.05, 0.07 and 0.5 [21,
Brought to you by | Uniwersytet Slaski - University of Silesia - Silesian UniversityAuthenticated
Download Date | 11/9/17 10:38 PM

Formation of Fe and Ni substituted LiMn2−xMxO4 nanopowders. . . 163
51, 52] and it was sufficient to block the long rangeJ-T transition in favor of the cubic spinel structure.At the same time, a study of the local environmentusing Raman spectroscopy [30] revealed line split-ting characteristic of a lower symmetry space group(P4332), which could indicate structural distortiondue to cation ordering, similar to the one observedin Mg doped compounds [52]. However, in the lat-ter paper the authors did not find any signature oflong range cation ordering in the neutron diffrac-tion pattern of the LiMn1.5Ni0.5O4 [52].
The lack of long range cation ordering in nano-sized LiMn1.5Ni0.5O4 was also corroborated in ourearlier paper [42]. In the current study, the observa-tion was extended to the whole substitution rangex = 0.1 to 0.5.
In all cases, lattice parameters of the Nidoped samples were shorter than for the undopedLiMn2O4, although they differed on absolute scale(Table 1). It must be noted that the lattice parame-ters of LiMn2O4 depend on conditions of synthesis,which was reported earlier [62].
The decrease of the lattice parameter with in-creased level of nickel doping in the octahedralcation site might be at first surprising as the ionicradius of Ni2+ (0.69 Å) is larger than the radii ofMn3+ 0.58 Å in low spin (LS) and 0.65 Å in highspin (HS) forms [63].
The increase of the lattice parameter by a largersize of Ni2+ is compensated by the simultaneousconversion of the Mn3+ into Mn4+ which is ex-pected to maintain the charge neutrality. The ionicradius of Mn4+ is the smallest of all of the radiiand equal to 0.53 Å. Roughly estimating, on aver-age and assuming that Mn3+ is only in HS form,substitution of x = 0.5 of Ni2+ should eliminateMn3+ and produce a net decrease of lattice param-eter of (0.69 – 0.65) – (0.65 – 0.53) = – 0.08 Å.The observed shortening of the lattice from 8.22 Åto 8.17 Å, i.e. only 0.05 Å might be explained bypossible lithium overstoichiometry which was re-ported earlier by Strobel et al. [64]. The location ofLi+ in the octahedral site would shift the chargebalance for the undoped sample into the Mn4+
side, therefore the effect of doping would be lower.The large spread of lattice parameters caused by
the nonstoichiometric lithium has already beenshown [42] for LiMn2O4 synthesized by a sol-gelmethod, similar to the route used in this paper.However, as it has been already pointed out by Berget al. [21], the decrease in lattice parameters mightbe also caused by stronger Ni–O bonding.
Fig. 2. Lattice parameter dependence (a) on nickelconcentration for LiMn2−xNixO4 (the realconcentrations were obtained by XPS andPGAA methods); (b) on iron concentration forLiMn2−xFexO4 (the real concentrations wereobtained by XPS method).
The lattice parameters in the Ni doped series de-creases monotonically up to x = 0.3 where a sec-ond phase starts to appear, which indicates that thesolid solution is close to the solubility limit. Thesecond phase with reflections at d = 2.40 Å, 2.07 Åand 1.47 Å is visible up to x = 0.5 and cannot beindexed by lowering of the symmetry of the spinelphase. The limit is also visible in the lattice param-eter plot (Fig. 2a), where the dependence flattens
Brought to you by | Uniwersytet Slaski - University of Silesia - Silesian UniversityAuthenticated
Download Date | 11/9/17 10:38 PM

164 E. TALIK et al.
Table 1. Profile parameters obtained from the Rietveld refinement of the Ni doped series (CDS is Coherent DomainSize; estimated shape anisotropy is reported in curly brackets).
Nominal composition a [Å] V [Å3 ] CDS [nm] Strain [%] SG Comment
LiMn1.9Ni0.1O4 8.222(1) 555.9(2) 91{1} 0.25(5) Fd3m pureLiMn1.8Ni0.2O4 8.203(2) 552.0(2) 36{7} 0.25(2) Fd3m pureLiMn1.7Ni0.3O4 8.190(1) 549.4(2) 58{32} 0.40(6) Fd3m +2nd phaseLiMn1.6Ni0.4O4 8.190(1) 549.3(2) 107{78} 0.52(5) Fd3m +2nd phaseLiMn1.5Ni0.5O4 8.172(2) 545.8(2) 43{1} 0.12(2) Fd3m +2nd phaseLiMn1.5Ni0.5O4 8.167(1) 544.7(2) 51{10} 0.0800(1) Fd3m [43]LiMn2O4 8.207(1) 552.8(1) 80{7} 0.3101(1) Fd3m [43]Li1.12Mn1.88O4 8.2232(4) 556.1 Fd3m [64]Undoped 8.2228(4) Fd3m [52] NPDNi(II) 0.07 8.2156(1) Fd3m [52] NPDLiMn1.5Ni0.5O4 8.16594(3) [53] XRDLiMn1.5Ni0.5O4 8.1690 36.9 Fd3m/P4332 [31] XRD
out for x = 0.3 and 0.4 proving that no more mate-rial is incorporated into the lattice. The last samplewith Ni content x = 0.5 regains the trend but with asmaller slope which can be again explained by theappearance of the second phase. The restoration ofthe structural quality for x = 0.5 can be explainedon the basis of the argument given already by Bran-ford et al. [52]. The authors in question noted thatthe cation structural unit (Fig. 8 therein) was builtof 4 cations which stabilized the configurations of1:3 or 2:2 (1:1). In our case, the x = 0.5 sample isan example of 1:3 ratio (0.5 Ni:1.5 Mn).
The onset of phase separation is also reflectedin the increasing lattice strains and growing sizeanisotropy (Table 6: rapid increase of the S220 coef-ficient and K41 parameter). In all cases, the sizes ofthe coherent scattering domains are under 100 nm.The refinement of the oxygen position was also per-formed, but the results reported in Table 6 and Ta-ble 7, because of its smaller reliability as oxygenatoms, are poorly seen by X-ray diffraction (Ta-ble 6) and depend on other elements in the unit cell.For the same reason, isotropic atomic displacementparameters (ADPs) are also reported in Table 6 andTable 7.
All samples in the iron doped series were ob-tained as single phase cubic materials with thespinel space group Fd3m. Lattice parameters were
found to increase with an increasing Fe concentra-tion (Table 2) and for the x = 0.5 sample were sim-ilar to those reported earlier in the literature, likesample L16A [42].
The lattice parameter increase with higher ironcontent (Fig. 2b) is only possible if Fe3+ substitutesMn4+ or Mn3+ but in a low spin state (LS). It is ev-ident if one notices the ionic radii series (all valuesin Å) Mn4+ (0.53) < Fe3+ (LS 0.55) < Mn3+ (LS0.58) < Fe3+ HS (0.645) < Mn3+ (HS 0.65) [63].
Despite the monotonic changes in lattice andanion parameters, the samples with the highest ironcontent stand out from the rest. It is reflected in sev-eral of their properties:(a) the lattice parameters deviate from the trend setout by x = 0.1 to 0.3 (Fig. 2b),(b) the coherent domain size as well as the respec-tive strain are twice as much (Table 2 and Table 7).
The above facts suggest that there is a quali-tative difference between samples x = 0.1 to 0.3and x = 0.4, 0.5, although the XRD analysis doesnot indicate any presence of a phase transition. Itmight be just a mere consequence of a preference toform better crystallized domains or an effect of ironclustering.
The oxygen position for the iron doped series(Table 7) was refined using nominal iron contentand octahedral position, which was corroborated by
Brought to you by | Uniwersytet Slaski - University of Silesia - Silesian UniversityAuthenticated
Download Date | 11/9/17 10:38 PM

Formation of Fe and Ni substituted LiMn2−xMxO4 nanopowders. . . 165
Table 2. Profile parameters obtained from the Rietveld refinement of the Fe doped series (CDS is Coherent DomainSize; estimated shape anisotropy is reported in curly brackets).
Nominal composition a [Å] V [Å3] CDS [nm] Strain [%] SG Comment
LiMn1.9Fe0.1O4 8.241(1) 559.7(1) 64{1} 0.15(3) Fd3m pureLiMn1.8Fe0.2O4 8.241(1) 559.7(1) 43{1} 0.14(2) Fd3m pureLiMn1.7Fe0.3O4 8.2454(8) 560.54(9) 50{1} 0.15(2) Fd3m pureLiMn1.6Fe0.4O4 8.2546(6) 562.46(7) 250{1} 0.22(4) Fd3m pureLiMn1.5Fe0.5O4 8.2547(6) 562.47(7) 113{1} 0.24(4) Fd3m pureLiMn2O4 8.207(1) 552.8(1) 80{7} 0.3101(1) Fd3m [43]Li1.12Mn1.88O4 8.2232(4) 556.1 Fd3m [64]Undoped 8.2228(4) Fd3m [52] NPDLiMn1.5Fe0.5O4 8.258(1) 563.1(2) 51{3} 0.2444(1) Fd3m [43]
Mössbauer spectroscopy and is also reported in Ta-ble 6 and Table 7.
3.2. SEM imaging
SEM images show the morphologies of grainsin the examined compounds at magnification of50000× (Fig. 3). The obtained powders can be con-sidered as nanocrystalline materials because a largenumber of the grains are close to 100 nm. Theexceptions are the samples doped with Ni and Fewith x = 0.4.
3.3. PGAA
Ratios obtained using the data from each stan-dard were averaged. Table 3 gives the final valuesof moles Mn/mol Li and moles Mn/mol Ni for eachsample. Expanded uncertainties were determinedby adding uncertainties from counting statistics, re-producibility of Mn (from the standard deviation oftwo values from each gamma-ray line/sqrt(2)), andthe standard uncertainty: standard deviation of val-ues obtained from the two standard pellets/sqrt(2),and multiplying by a coverage factor of 2. Mn:Niratios for all samples are in agreement with thevalues calculated from the nominal stoichiometry.Mn:Li ratios are lower than stoichiometric valuesfor all samples, however this may be due in part topoor counting statistics for Li due to the low neu-tron capture cross section and small sample size.
3.4. Mössbauer spectroscopy
The fitting parameters of the Mössbauer spec-trum of LiMn1.5Fe0.5O4 (Fig. 4) are listed in Ta-ble 4. The data displayed give clear evidencethat Fe3+ ions occupy two different octahedralsites (D1, D2) that differ in values of QS andabundances. As the origin of the difference is notrecognizable from Mössbauer measurement, we as-sume that the Fe3+ ions occupy two sites withslightly different symmetry because they have dif-ferent QS values.
3.5. XPSFig. 5 shows the examples of the XPS
spectra for the samples LiMn2−xNixO4 andLiMn2−xFexO4 in a wide energy range up to1400 eV. Besides the lines of elements Li, Mn, Fe,Ni and O forming the compounds, there are extralines visible from other impurities, coming fromthe technological process. The C1s lines are espe-cially intense due to the presence of organic tech-nological remains of precursors, as was observedin the literature [62]. The chemical formulas of themeasured samples were estimated from the XPSanalysis (Table 3 and Table 5). They were used forthe calculation of the magnetic moments. Fig. 4presents deconvolutions of the XPS Mn3p linesinto two doublets corresponding to the Mn3+ andMn4+ contributions and the Li line. In Table 3 andTable 5, the ratios of Li:Mn and Mn3+:Mn4+ arecollected.
Brought to you by | Uniwersytet Slaski - University of Silesia - Silesian UniversityAuthenticated
Download Date | 11/9/17 10:38 PM

166 E. TALIK et al.
Fig. 3. SEM micrographs of the Ni series: (a) LiMn1.9Ni0.1O4, (b) LiMn1.8Ni0.2O4, (c) LiMn1.7Ni0.3O4,(d) LiMn1.6Ni0.4O4, (e) LiMn1.5Ni0.5O4, and Fe series: (f) LiMn1.9Fe0.1O4, (g) LiMn1.8Fe0.2O4, (h)LiMn1.7Fe0.3O4, (i) LiMn1.6Fe0.4O4, (j) LiMn1.5Fe0.5O4. Magnification 50000×, except (i) where it is20000×.
Table 3. Chemical compositions and magnetic properties of the Ni series.
XPS Li/(Mn+Ni) PGAA Mn3+/Mn4+ Theta µeff (µB) µeff (µB)
composition 0.5: nominal composition [K] exp. calc.
Li1.16Mn1.82Ni0.13O3.89 0.60 LiMn1.64Ni0.09 Oy 0.61 16 6.1 5.9 Mn3+(HS), Mn4+, Ni2+
Li1.36Mn1.93Ni0.2703.46 0.62 LiMn1.44Ni0.16 Oy 0.59 40 5.9 6.1 Mn3+(HS), Mn4+, Ni2+
*Li1.16Mn1.65Ni0.2803.92 0.60 LiMn1.54Ni0.28 Oy 0.67 51 4.3 4.6 Mn3+(LS), Mn4+, Ni2+
*Li1.01Mn1.73Ni0.41O3.82 0.47 LiMn1.33Ni0.34 Oy 0.64 110 3.7 5.0 Mn3+(LS), Mn4+, Ni2+
*Li1.17Mn1.59Ni0.67O3.58 0.52 LiMn1.29Ni0.44 Oy 0.95 169 2.5 4.9 Mn3+(LS), Mn4+, Ni2+
Brought to you by | Uniwersytet Slaski - University of Silesia - Silesian UniversityAuthenticated
Download Date | 11/9/17 10:38 PM

Formation of Fe and Ni substituted LiMn2−xMxO4 nanopowders. . . 167
Fig. 4. 57Fe Mössbauer hyperfine parameters ofLiMn1.5Fe0.5O4. The fitted subspectra are pre-sented on the spectrum.
Table 4. 57Fe Mössbauer hyperfine parameters ofLiMn1.5Fe0.5O4 where A is abundance, IS –isomer shift, QS – quadrupole splitting.
Component IS [mm/s] QS [mm/s] A [%]
D1 0.347±0.003 0.643±0.040 65.17D2 0.354±0.003 0.846±0.032 34.83
From XRD measurements the decrease of thelattice parameter with increasing Ni amount wasobserved. The radius of Ni2+ (0.69 Å) is larger thanthat of Mn3+LS (0.58 Å) and similar to Mn3+HS(0.65 Å). Therefore, a transformation of Mn3+ intoMn4+ (0.53 Å) would explain the decrease of thelattice parameter and the charge balance in thecompounds. Such decreased ratios Mn3+/Mn4+ areshown in Fig. 6a and Table 3.
For the Fe series, the opposite behavior isobserved: the lattice parameters weakly increasewith increasing x and Mn3+ dominates (Fig. 6band Table 5). The ionic radii form two groups.The first group contains Fe3+ (LS 0.55 Å), Mn4+
(0.53 Å), and Mn3+ (LS 0.58 Å), whereas Fe3+
(HS 0.645 Å) and Mn3+ (HS 0.65 Å) make thesecond one. It is less probable that Fe3+ replacesMn4+ due to the charge and radius mismatch. Themagnetic measurements indicate that for the sam-ples with x = 0.1 and 0.2, Mn3+LS is substituted byFe3+LS. For the samples with x = 0.3, Mn3+ HS is
Fig. 5. XPS overview spectra of the samples withx = 0.5 for the Ni and Fe series.
replaced by Fe3+ HS, while for x = 0.4 a mixtureof the above states is present. Such separation canexplain the nearly constant lattice parameter withincreasing x.
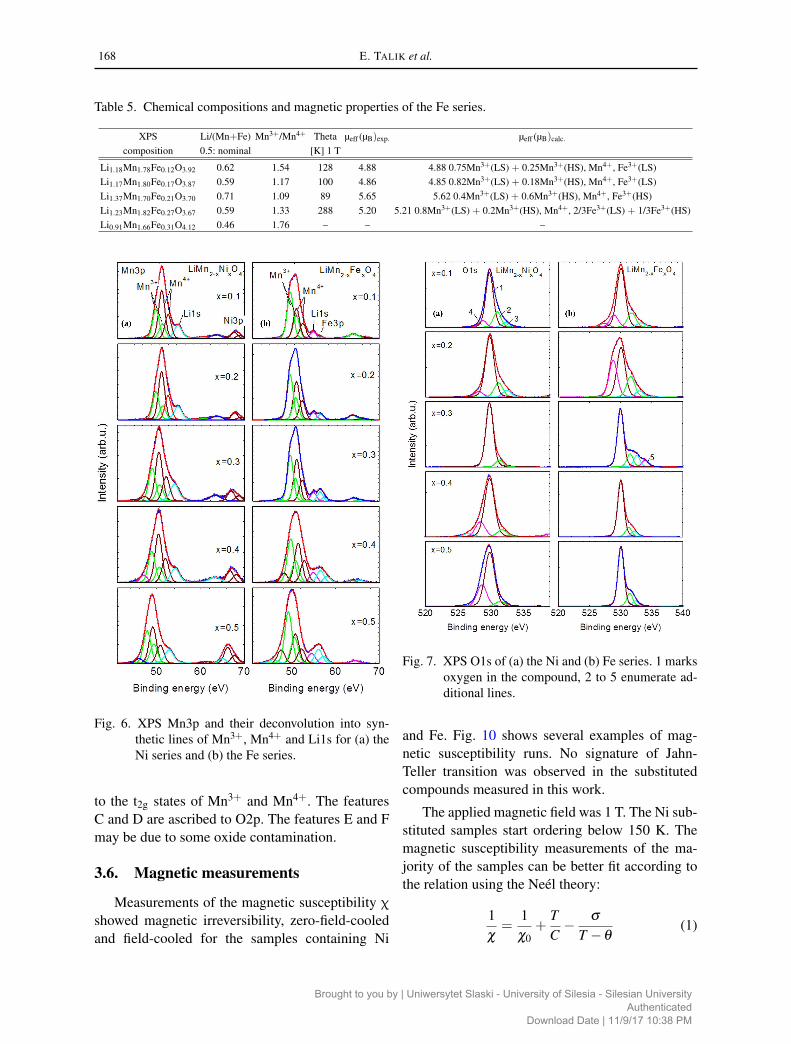
The XPS O1s spectra, besides the line (1) re-lated to the compounds (Fig. 7), exhibit someextra lines which can be ascribed to oxygencontamination, defects, etc. Extra lines at lowerbinding energy are also observed.
The XPS lines of the Fe2p and Ni2p, for thesamples with x = 0.5, visible in Fig. 8a and Fig. 8bare related to the Fe3+ (in accordance to Mössbauerresults) and Ni2+ states.
The XPS valence bands exhibit characteristicfeatures of the Mn3d and O2p (Fig. 9). Both va-lence bands include a mixture of Ni3d or Fe3dstates. These results are similar to the results con-cerning LMO [42, 62] and presented by Wu etal. [65]. The features A and B are related to Mn3dstates. The peak A is due to the presence of egstates of Mn3+ HS, while the peak B is attributed
Brought to you by | Uniwersytet Slaski - University of Silesia - Silesian UniversityAuthenticated
Download Date | 11/9/17 10:38 PM
168 E. TALIK et al.
Table 5. Chemical compositions and magnetic properties of the Fe series.
XPS Li/(Mn+Fe) Mn3+/Mn4+ Theta µeff (µB)exp. µeff (µB)calc.
composition 0.5: nominal [K] 1 T
Li1.18Mn1.78Fe0.12O3.92 0.62 1.54 128 4.88 4.88 0.75Mn3+(LS) + 0.25Mn3+(HS), Mn4+, Fe3+(LS)Li1.17Mn1.80Fe0.17O3.87 0.59 1.17 100 4.86 4.85 0.82Mn3+(LS) + 0.18Mn3+(HS), Mn4+, Fe3+(LS)Li1.37Mn1.70Fe0.21O3.70 0.71 1.09 89 5.65 5.62 0.4Mn3+(LS) + 0.6Mn3+(HS), Mn4+, Fe3+(HS)Li1.23Mn1.82Fe0.27O3.67 0.59 1.33 288 5.20 5.21 0.8Mn3+(LS) + 0.2Mn3+(HS), Mn4+, 2/3Fe3+(LS) + 1/3Fe3+(HS)Li0.91Mn1.66Fe0.31O4.12 0.46 1.76 – – –
Fig. 6. XPS Mn3p and their deconvolution into syn-thetic lines of Mn3+, Mn4+ and Li1s for (a) theNi series and (b) the Fe series.
to the t2g states of Mn3+ and Mn4+. The featuresC and D are ascribed to O2p. The features E and Fmay be due to some oxide contamination.
3.6. Magnetic measurements
Measurements of the magnetic susceptibility χ
showed magnetic irreversibility, zero-field-cooledand field-cooled for the samples containing Ni
Fig. 7. XPS O1s of (a) the Ni and (b) Fe series. 1 marksoxygen in the compound, 2 to 5 enumerate ad-ditional lines.
and Fe. Fig. 10 shows several examples of mag-netic susceptibility runs. No signature of Jahn-Teller transition was observed in the substitutedcompounds measured in this work.
The applied magnetic field was 1 T. The Ni sub-stituted samples start ordering below 150 K. Themagnetic susceptibility measurements of the ma-jority of the samples can be better fit according tothe relation using the Neél theory:
1χ=
1χ0
+TC− σ
T −θ(1)
Brought to you by | Uniwersytet Slaski - University of Silesia - Silesian UniversityAuthenticated
Download Date | 11/9/17 10:38 PM

Formation of Fe and Ni substituted LiMn2−xMxO4 nanopowders. . . 169
Fig. 8. XPS of the Ni2p (a) and Fe2p (b) lines.
where C is the Curie constant, θ is the paramag-netic Curie temperature, χ0 and σ are parametersevaluated from the fit, and T is the temperaturein Kelvin. This indicates uncompensated antiferro-magnetic character. For the samples with x = 0.4and 0.5 the inverse of the susceptibility was fittedaccording to the Curie-Weiss law:
1χ=
1χ0 +
CT−θ
(2)
The effective magnetic moment depends on theamount of manganese and the ratio Mn3+:Mn4+
and Ni2+ amount (Table 3). Mn(3d4)3+ withHS (high spin) has a magnetic moment of4.90 µB, while Mn(3d4)3+ with LS (low spin) andMn(3d3)4+ have magnetic moments of 2.83 µB and3.87 µB, respectively. According to the XPS re-sults, the Ni magnetic contribution is Ni(3d8)2+
equal to 2.83 µB.
Fig. 9. The XPS spectrum of valence bands.
For the samples doped with Fe, measurementsat magnetic field of 1 T allow fitting the curvesfor x = 0.1 – 0.4 using the Neél theory (Fig. 10).The calculations of the effective magnetic momentsfor the mixture of Mn3+ LS and HS and Fe3+ LS(1.75 µB) and HS (5.92 µB), gave good agreementwith experimental values (Table 5).
The XPS valence band characters for the Ni andFe substituted samples reflect magnetic states ofthe samples (Fig. 9). For the samples containing Fefor x from 0.1 to 0.3 the features A, B, C and D (de-scribed in Fig. 9b) are well separated. These sam-ples measured at room temperature are in the para-magnetic state. The samples with x = 0.4 and 0.5are in ordered state. They have the highest admix-ture of Fe3d states in the valence band. However,the features A to D are difficult to distinguish. Bothabove mentioned reasons can be responsible for thechange of the shape of the valence band states.
For Ni containing samples, the shapes of thevalence bands are similar, blurred (not visible
Brought to you by | Uniwersytet Slaski - University of Silesia - Silesian UniversityAuthenticated
Download Date | 11/9/17 10:38 PM

170 E. TALIK et al.
Fig. 10. Magnetic susceptibility of (a) the Ni series and (b) the Fe series measured under 1 T.
Table 6. Structural parameters for the LiMn2−xNixO4 series.
x Anion parameter Size K00 Size K41 Strain S400 Strain S220ADP [Å2]
Li Mn/Ni O
0.1 0.2697(3) 1.10(2) – 0.62(2) – 3.3(7) 3.87(7) 3.7(1)0.2 0.2686(4) 3.00(9) 1.3(2) 0.22(5) 1.0(2) 12(1) 3.67(9) 3.3(1)0.3 0.2587(3) 2.56(7) 2.6(2) 0.36(6) 3.3(2) 3.0(fix) 2.04(6) 2.8(1)0.4 0.2594(3) 1.60(7) 1.8(1) 0.98(7) 4.7(2) 3.0(fix) 1.70(5) 2.7(1)0.5 0.2710(3) 2.34(4) – 0.15(2) – 9.0(1.0) 4.4(1) 3.3(2)
Table 7. Structural parameters for the LiMn2−xFexO4 series.
x Anion parameter Size K00 Size K41 Strain S400 Strain S220ADP [Å2]
Li Mn/Fe O
0.1 0.2704(3) 1.55(2) – 0.23(1) – 6.3(9) 4.68(8) 5.5(2)0.2 0.2695(3) 2.3(3) – 0.19(2) – 2.8(7) 3.82(8) 4.7(2)0.3 0.2697(3) 2.00(3) – 0.25(2) – 3.7(8) 4.2(1) 5.1(1)0.4 0.2663(2) 0.40(1) – 0.48(1) – 1.0(4) 3.22(5) 4.2(1)0.5 0.2646(2) 0.88(2) – 0.60(1) – –0.1(3) 2.66(5) 3.8(1)
Brought to you by | Uniwersytet Slaski - University of Silesia - Silesian UniversityAuthenticated
Download Date | 11/9/17 10:38 PM

Formation of Fe and Ni substituted LiMn2−xMxO4 nanopowders. . . 171
Mn3deg states (feature A). This may reflect notonly the paramagnetic state but the admixture ofthe second phase, as well.
There are some theoretical papers claiming thatexistence of Mn3+ LS is possible under high pres-sure for cubic spinel structure [66]. However, incase of the examined samples the primitive cell vol-umes for LiMn2O4 (138.2 Å3) and LiMn1.5Ni0.5O4(136.2 Å3) are located in the region where the en-ergies of the Mn3+ LS and HS are comparable.
4. ConclusionsThe Jahn-Teller distortion was eliminated in the
examined samples. The XPS Fe2p and Ni2p linesconfirmed the ionic states of Fe3+ and Ni2+. TheMössbauer spectroscopy restricted the Fe3+ ion po-sitions only to the octahedral sites. The valencebands measured in ordered and paramagnetic statesdiffered due to broadening caused by the molecu-lar magnetic field. The Mn3+ ions dominated in theiron substituted series, whereas Mn4+ dominatedin the nickel one. The Pechini sol-gel method didnot fully control the dopant concentration withinthe substitution range.
AcknowledgementsSQUID magnetometer was financed by the European Re-
gional Development Fund, whereas SEM/EDS JEOL was fi-nanced by the Regional Fund for Environmental Protection inKatowice.
References[1] MARZEC J., SWIERCZEK K., PRZEWOZNIK J.,
MOLENDA J., SIMON D.R., KELDER E.M., SCHOON-MAN J., Solid State Ionics, 146 (2002), 225.
[2] KITAMURA N., IWATSUKI H., IDEMOTO Y.J., J. PowerSources, 189 (2009), 114.
[3] WANG X., CHEN X., GAO L., ZHENG H., JI M.,SHEN T., ZHANG Z., J. Cryst. Growth, 256 (2003), 123.
[4] HE X., WANG L., PU W., ZHANG G., JIANG C.,WAN C., Int. J. Electrochem. Sc., 1 (2006), 12.
[5] MICHALSKA M., LIPINSKA L., MIRKOWSKA M., AK-SIENIONEK M., DIDUSZKO R., WASIUCIONEK M.,Solid State Ionics, 188 (2011), 160.
[6] MICHALSKA M., LIPINSKA L., DIDUSZKO R.,MAZURKIEWICZ M., MAŁOLEPSZY A., STOBIN-SKI L., KURZYDŁOWSKI K.J., Phys. Status Solidi C,8 (2011), 2538.
[7] FU Y.-P., SU Y.-H., LIN C.-H., WU S.-H., Ceram.Int., 35 (2009), 3463.
[8] WHITTINGHAM M.S., Chem. Rev., 104 (2004), 4271.[9] JULIEN C.M., Mater. Sci. Eng., R 40 (2003), 47.
[10] WAN C., WU M., WU D., Powder Technol., 199 (2010),154.
[11] SCROSATI B., GARCHE J., J. Power Sources, 195(2010), 2419.
[12] THACKERAY M.M., Prog. Solid State Ch., 25 (1997), 1.[13] FERGUS J.W., J. Power Sources, 195 (2010), 939.[14] SINGH P., SIL A., NATH M., RAY S., Physica B, 405
(2010), 649–654.[15] SURYAKALA K., PARUTHIMAL KALAIGNAN G., VA-
SUDEVAN T., Int. J. Electrochem. Sc., 1 (2006), 372.[16] THIRUNAKARAN R., SIVASHANMUGAM A.,
GOPUKUMAR S., DUNNILL C.W., GREGORY D.H., J.Mater. Process. Tech., 208 (2008), 520.
[17] THIRUNAKARAN R., SIVASHANMUGAM A.,GOPUKUMAR S., DUNNILL C.W., GREGORY D.H., J.Phys. Chem. Solids, 69 (2008), 2082.
[18] SHAO-HORN Y., MIDDAUGH R.L., Solid State Ionics,139 (2001), 13.
[19] YI T., HU X., GAO K., J. Power Sources, 162 (2006),636.
[20] YI T.-F., ZHU Y.-R., ZHU R.-S., Solid State Ionics,179 (2008), 2132.
[21] BERG H., THOMAS J.O., LIU W., FARRINGTON G.C.,Solid State Ionics, 112 (1998), 165.
[22] CHEN Z., QIU S., CAO Y., AI X., XIE K., HONG X.,YANG H., J. Mater. Chem., 22 (2012), 17768.
[23] DONG Y., WANG Z., QIN H., SUI X., RSC Adv., 2(2012), 11988.
[24] WANG F.X., XIAO S.Y., SHI Y., LIU L.L., ZHU Y.S.,WU Y.P., WANG J.Z., HOLZE R., Electrochim. Acta,93 (2013), 301.
[25] XU Y., CHEN G., FU E., ZHOU M., DUNWELL M.,FEI L., DENG S., ANDERSEN P., WANG Y., JIA Q.,LUO H., RSC Adv., 3 (2013), 18441.
[26] HAI B., SHUKLA A.K., DUNCAN H., CHEN G., J.Mater. Chem. A, 1 (2013), 759.
[27] WEI Q., WANG X., YANG X., JU B., HU B., SHU H.,WEN W., ZHOU M., SONG Y., WU H., HU H., J.Mater. Chem. A, 1 (2013), 4010.
[28] CHEN Z., ZHAO R., DU P., HU H., WANG T., ZHU L.,CHEN H., J. Mater. Chem. A, 2 (2014), 12835.
[29] MANTHIRAM A., CHEMELEWSKI K., LEE E.-S., En-ergy Environ. Sci., 7 (2014), 1339.
[30] WANG J., YU Y., WU B., LIN W., LI J., ZHAO J., J.Mater. Chem. A, 3 (2015), 2353.
[31] WU Q., YIN Y., SUN S., ZHANG X., WAN N., BAI Y.,Electrochim. Acta, 158 (2015), 73.
[32] SONG M., AHN D., Solid State Ionics, 112 (1998), 245.[33] TSUJI T., NAGAO M., YAMAMURA Y., TAI N.T., Solid
State Ionics, 154–155 (2002), 381.[34] MALYOVANYI S.M., ANDRIIKO A.A., MONKO A.P.,
J. Solid State Electr., 8 (2003), 7.[35] KIM B.-H., CHOI Y.-K., CHOA Y.-H., Solid State Ion-
ics, 158 (2003), 281.
Brought to you by | Uniwersytet Slaski - University of Silesia - Silesian UniversityAuthenticated
Download Date | 11/9/17 10:38 PM

172 E. TALIK et al.
[36] TANIGUCHI I., BAKENOV Z., Powder Technol., 159(2005), 55.
[37] WOLSKA E., PISZORA P., STEMPIN K., CATLOW
C.R.A., J. Alloy. Compd., 286 (1999), 203.[38] WOLSKA E., TOVAR M., ANDRZEJEWSKI B., NOW-
ICKI W., DARUL J., PISZORA P., KNAPP M., SolidState Sci., 8 (2006), 31.
[39] MATEYSHINA YU G., LAFONT U., UVAROV N.F.,KELDER E.M., Solid State Ionics, 179 (2008), 192.
[40] PICO M.P., ALVAREZ-SERRANO L., LOPEZ M.L.,VEIGA M.L., Dalton Trans., 43 (2014), 14787.
[41] SHI Y., ZHU S., ZHU C., LI Y., CHEN Z., ZHANG D.,Electrochim. Acta, 154 (2015), 17.
[42] TALIK E., LIPINSKA L., ZAJDEL P., ZAŁÓG A.,MICHALSKA M., GUZIK A., J. Solid State Chem., 206(2013), 257.
[43] MICHALSKA M., HAMANKIEWICZ B.,ZIÓŁKOWSKA D., KRAJEWSKI M., LIPINSKA L.,ANDRZEJCZUK M., CZERWINSKI A., Electrochim.Acta, 136 (2014), 286.
[44] HAMANKIEWICZ B., MICHALSKA M., KRA-JEWSKI M., ZIÓŁKOWSKA D., LIPINSKA L.,KAMINSKA M., CZERWINSKI A., Solid State Ionics,262 (2014), 9.
[45] MICHALSKA M., LIPINSKA L., SIKORA A.,ZIÓŁKOWSKA D., KORONA K.P., ANDRZEJCZUK M.,J. Alloy. Compd., 632 (2015), 256.
[46] RIETVELD H.M., J. Appl. Crystallogr., 2 (1969), 65.[47] RODRIGUEZ-CARVAJAL J., Commission on Powder
Diffraction Newsletters, 26 (2011), 12-19.[48] THOMPSON P., COX D.E., HASTINGS J.B., J. Appl.
Crystallogr., 20 (1987), 20.[49] STEPHENS P.W., J. Appl. Crystallogr., 32 (1999), 281.[50] JARVINEN M., J. Appl. Crystallogr., 26 (1993), 527.[51] BELLITTO C., BAUER E.M., RIGHINI G.,
GREEN M.A., BRANFORD W.R., ANTONINI A.,PASQUALI M., J. Phys. Chem. Solids, 65 (2004), 29.
[52] BRANFORD W., GREEN M.A., NEUMANN D.A.,Chem. Mater., 14 (2002), 1649.
[53] BRIK M.G., AVRAM N.M., AVRAM C.N., RUDOW-ICZ C., YEUNG Y.Y., GNUTEK P., J. Alloy. Compd.,432 (2007), 61.
[54] ZAJDEL P., JENDRZEJEWSKA I., GORAUS J.,DUDA H., GORYCZKA T., KITA A., Radiat. Phys.Chem., 80(10) (2011), 1008.
[55] YOON W.-S., BALASUBRAMANIAN M., YANG X.-Q.,FU Z., FISCHER D.A., MCBREENA J., J. Electrochem.Soc., 151(2) (2004), A246.
[56] Multipak Software Version 6, Physical Electronics, Min-nesota, 1998.
[57] PAUL R.L., LINDSTROM R.M., HEALD A.E., J. Ra-dioanal. Nucl. Ch., 215(1) (1997), 63.
[58] PAUL R.L., LINDSTROM R.M., J. Radioanal. Nucl.Ch., 243 (2000), 181.
[59] PAUL R.L., Am. Lab., 34(3) (2002), 15.[60] LINDSTROM R.M., Biol. Trace Elem. Res., 43-45
(1994), 597.[61] RODRIGUEZ-CARVAJAL J., ROUSSE G., MASQUE-
LIER C., HERVIEU M., Phys. Rev. Lett., 81 (21) (1998),4660.
[62] TALIK E., ZAŁÓG A., SKRZYPEK D., GUZIK A., ZA-JDEL P., MICHALSKA M., LIPINSKA L., Cryst. Res.Technol., 47 (3) (2012), 351.
[63] SHANNON R.D., Acta Crystallogr. A, 32 (1976), 751.[64] STROBEL P., CRAS LE F., SEGUIN L., ANNE M.,
TARASCON J.M., J. Solid State Chem., 135 (1998), 132.[65] WU Q.H., THISSEN A., JAEGERMANN W., Chinese
Phys. Lett., 23 (2006), 2202.[66] VEN VAN DER A., MARIANETTI C., MORGAN D.,
CEDER G., Solid State Ionics, 135 (2000), 21.
Received 2016-02-08Accepted 2016-12-12
Brought to you by | Uniwersytet Slaski - University of Silesia - Silesian UniversityAuthenticated
Download Date | 11/9/17 10:38 PM