evry asa...the group had total long- term interest -bearing debt of nok 6 693 million at the end of...
TRANSCRIPT

EVRY ASAQ2 2019 PRESENTATION
CEO PER HOVECFO HENRIK SCHIBLER

Group highlights
Business update
Financial highlights
Concluding remarks
Q&A
Agenda

FINANCIALS
REVENUE (NOKm)
3 178
EBITA2 (NOKm)
354
BACKLOG (NOKbn)
18.1
ORGANIC GROWTH1
-3.4%
EBITA MARGIN2
11.2%
BUSINESS UPDATE
Tieto and EVRY to create one of the most competitive digital services and software companies in the Nordics Revenue down y-on-y due to seasonality and Fulfilment services Growth in Consulting and Application Services drives favourable revenue mix and supports the strategic direction Financial Services experiences high activity driven by demand across geographies, solutions and services areas Data-driven services across the Nordic Continuing our journey towards becoming a Nordic Consulting Powerhouse Reduced margin due to seasonality (2 working days less in Q2) and performance in Sweden
3
Group highlights Q2 2019
1) ADJUSTED FOR CURRENCY EFFECTS, ACQUISITIONS AND DIVESTMENTS 2) BEFORE OTHER INCOME AND EXPENSES

Great positions in the recent Universum rankings
EVRY awarded as one of the most attractive IT consultancy firms to work for amongst Norwegian students!
EVRY fastest growing employer in the Universum ranking in Sweden climbed to no. 87, up 67 positions
UNIVERSUM RANKING FOR EVRY IN NORWAY

Business updateFocus on key growth areas 1. Continuing our journey towards a Nordic Consulting Powerhouse
2. Data-driven services across the Nordic
3. Financial Services

Sustaining performance
Realizing potential
Enabling value creation
Clarity of direction
Understandingof possibilities
A NORDIC CONSULTING ORGANISATION WITH APPROXIMATELY 2 150 CONSULTANTS IN OUR 7 PRACTICES5 (EXCLUDING GLOBAL DELIVERY)6
A strong mix of deliveries and sales motions also in the second quarterContinuing our journey towards a Nordic Consulting Powerhouse
Business Applications (~ 450 FTEs)
Digital Experience (~ 300 FTEs)
Business Consulting (~ 300 FTEs)
Application Innovation (~ 700 FTEs)
Security & Risk (~ 140 FTEs)
Cloud & Infrastructure (~ 160 FTEs)
AI, Analytics & Insight (~ 100 FTEs)

7
New Nordic Constellation EVRY Data-driven services across the Nordic
Q1 | INITIATION
• Data-Driven Sevices with over 200 experts across the Nordics.
Q2-Q3 | EXECUTION
• EnterCard TCV 65mSEK.
• Launch of Gjeldsregisteret AS.
Q4 | INNOVATION
• Open API & Analytics community, creating a data eco-system for customers and partners.
Data-Driven Services announced
Q1 Q2 Q3 Q4
Organisationoperationalised
Data Eco-System
EXAMPLE OF DATA SOURCES
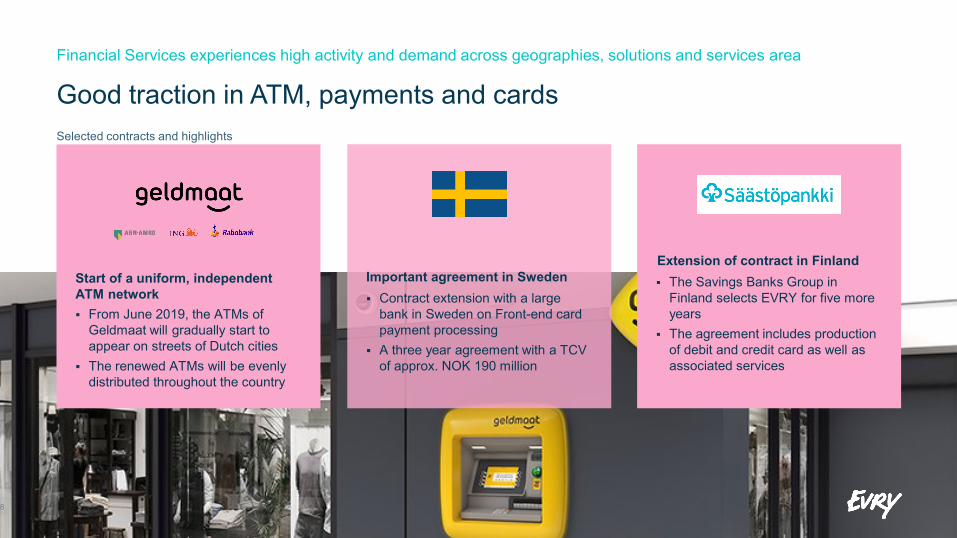
Financial Services experiences high activity and demand across geographies, solutions and services area
Good traction in ATM, payments and cards
Start of a uniform, independent ATM network From June 2019, the ATMs of
Geldmaat will gradually start to appear on streets of Dutch cities
The renewed ATMs will be evenly distributed throughout the country
Extension of contract in Finland The Savings Banks Group in
Finland selects EVRY for five more years
The agreement includes production of debit and credit card as well as associated services
Important agreement in Sweden Contract extension with a large
bank in Sweden on Front-end card payment processing
A three year agreement with a TCV of approx. NOK 190 million
8
Selected contracts and highlights

Financial highlights

EVRY GROUP NORWAY SWEDEN FINANCIAL SERVICES
Q2 2019 H1 2019 Q2 2019 H1 2019 Q2 2019 H1 2019 Q2 2019 H1 2019
REVENUE NOKm 3 178 6 507 1 419 2 921 767 1 584 862 1 749
ORGANIC GROWTH1 -3.4 % 0.1 % -5.2 % -1.4 % -7.1 % -4.7 % 1.9 % 5.2 %
EBITA2
NOKm 354 686 129 286 37 68 119 213
EBITA MARGIN2 11.2 % 10.5 % 9.1 % 9.8 % 4.9 % 4.3 % 13.8 % 12.2 %
CASH CONVERSION FREE CASH FLOW (FCF) EPS2 BACKLOG
85.7% LTM Jun’19 NOK 48 m Q2’19 NOK 0.56 Q2’19 NOK 18.1bn 30 Jun’19
1) ADJUSTED FOR CURRENCY EFFECTS, ACQUISITIONS AND DIVESTMENTS 2) BEFORE OTHER INCOME AND EXPENSES* ALL FIGURES INCLUDING CASH CONVERSION, FCF, EPS AND BACKLOG ARE COMPARED YEAR-ON-YEAR10
Group financial highlights
Application Services
6.0%
Digital PlatformServices
-2.0%
Fulfilment Services-41.9%
ConsultingServices
1.9 %
Organic growthQ2 2019

Organicgrowth1
Revenue NOKm
Period
1) ORGANIC GROWTH: ADJUSTED FOR CURRENCY EFFECTS, ACQUISITIONS AND DIVESTMENTS 11
Soft results in the quarter, but the first six months are driven by favourable product mix in line with strategy
12 9126 507
FY’18
3 178
Q2’18
3 286 3 0053 413
12 925
H1’19Q4’18
3 330
Q1’19 Q2’19
6 494
H1’18 LTM’19Q3’18
7.5% 4.0% 0.4% 3.6%-3.4% 0.1%
3.9%0.1% 3.0%
Organicgrowth1
Revenue split
NOKm
First six months
1) ORGANIC GROWTH: ADJUSTED FOR CURRENCY EFFECTS, ACQUISITIONS AND DIVESTMENTS 12
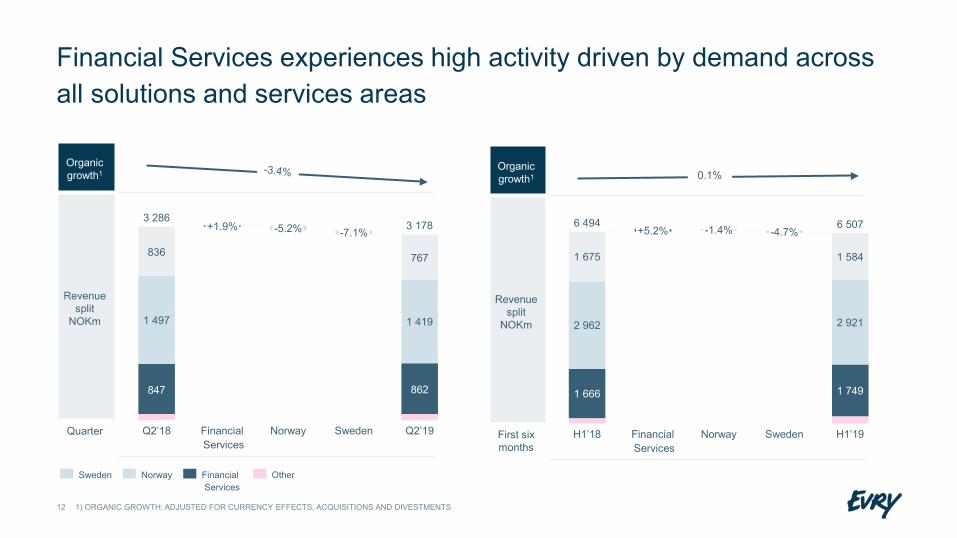
Financial Services experiences high activity driven by demand across all solutions and services areas
Sweden
1 675
-1.4%
2 962
FinancialServices
1 666
H1’18
6 494+5.2% 6 507
Norway
-4.7%
1 584
2 921
1 749
H1’19
0.1%Organicgrowth1
Revenue split
NOKm
Quarter
847 862
836 767
1 497
Q2’18
+1.9%
NorwayFinancialServices
-5.2% -7.1%
Sweden
1 419
Q2’19
3 2863 178
OtherFinancialServices
Sweden Norway

Application Services
6.0%
Digital PlatformServices
-2.0%
Fulfilment Services-41.9%
ConsultingServices
1.9%
13
Growth in Consulting Services and Application Services underlines a positive shift in revenue mix as higher margin services are delivered
32%
28%
33% 35%
30%
28%
10%
Q2 20186%
Q2 2019
Consulting Services Application Services Fulfilment ServicesDigital Platform Services
7% 12%
33%30%
28%
62%
24%27%
5%
39%32%
Financial ServicesQ2 2019
NorwayQ2 2019
Sweden Q2 2019
Organic growth Q2’19

Application Services
7.3%
Digital PlatformServices
-0.1%
Fulfilment Services-32.6%
ConsultingServices
4.8%
14
Reduced revenue from infrastructure services and fulfilment is in line with corporate strategy – to sell services higher up in the value stack
7% 12%
32%30%
28%
63%
23%27%
5%
40%33%
NorwayH1 2019
Sweden H1 2019
Financial ServicesH1 2019
Organic growth H1’19
31%
33%
32%
9%
27%
35%
28%
H1 20186%
H1 2019
Consulting Services Digital Platform Services Fulfilment ServicesApplication Services

EBITA margin1
EBITA1
NOKm
Quarter/YTD
Sweden continues to impact the margin performance in Q2
374 413 475332 354
686 694
H1 ’19Q3’18Q2’18 Q4’18 Q2’19Q1’19 H1 ’18
1 574
LTM’19
1 582
FY ’18
-0.2p.p.
-0.2p.p.
15 1) EBITA: BEFORE OTHER INCOME AND EXPENSES
11.4% 13.7% 13.9%10.0% 11.2% 10.5% 10.7% 12.2% 12.3%

EBITA margin development (%) - quarter
Financial Services
Group
Norway
Sweden
EBITA margin1
EBITA1
NOKm
Quarter/YTD
Margin softened by less working days in Q2 and Sweden
374 413475
332 354
686 694
H1 ’18Q2’19Q2’18 Q4’18Q3’18 Q1’19 H1 ’19
-0.2p.p.
-0.2p.p.
11.3%
9.1%
8.5%7.4%
4.9%
11.1%
12.5%
13.8%
10.4%
11.4% 11.2%
Q2’18Q2’17 Q2’19
10.0%
16 1) EBITA: BEFORE OTHER INCOME AND EXPENSES
11.4% 13.7% 13.9%10.0% 11.2% 10.5% 10.7%

EBITA margin1
EBITA1
NOKm
Quarter/YTD
Margin softened by less working days in Q2 and Sweden
374 413475
332 354
686 694
Q2’18 Q2’19Q3’18 Q4’18 Q1’19 H1 ’19 H1 ’18
-0.2p.p.
-0.2p.p.
17 1) EBITA: BEFORE OTHER INCOME AND EXPENSES
11.4% 13.7% 13.9%10.0% 11.2% 10.5% 10.7% EBITA margin development (%) – first six months
Financial Services
GroupNorway
Sweden
10.0% 9.8%
7.6%
4.3%
11.0%
11.9% 12.2%
10.6%10.7%
10.5%
H1’18
9.1%
H1’19H1’17
9.7%

OIE with P&L effect (NOKm)
Year
Other income and expenses according to plan significantly lower in relation to IBM
OIE with cash flow effect (NOKm)
250
941
545
160
241
78
FY 2016
33
FY 2017
186
26
21
15
FY 2018
719
H1 2019
375
1 215
560
595 557
97
343
368
195
82
24
FY 2017
15
51
FY 2016
1 229 22
1 767
FY 2018 H1 2019
1 014
661
136
18
Other
Sharebased options (STIP)
Provisions to former CEO
Transaction costs,IPO and refinancing
Restructuring
IBM partner agreement
Transaction costs, IPOand refinancing
Payments related torestructuring processes
Payments related toIBM partner agreement
Payment related to former CEO

LTM Cash conversion as of June 2019 ended at 85.7%, compared to 78.3% as of LTM June 2018
The increased cash conversion was explained by reduced working capital outflow and increased operational cash flow before paid interests relative to adjusted EBITDA for the last twelve months ended 30 June 2019
As of 30 June 2019, the LTM DSO was 38.3 days, compared to 36.5 days for LTM June 2018, an increase of 1.8 days.
Cash conversion1
LTMFCF2
Quarter end on
weekend/holiday
Increased cash conversion of 85.7%, up from 78.3% in Q2 2018
78.3% 85.7%97.0%82.8%
YesNoYesYes Yes
887 950 997
Q3’18Q2’18 Q4’18 Q1’19
1 256
Q2’19
1 015
86.2%
19
1) CASH CONVERSION: MEASURES HOW EBITDA IS CONVERTED INTO CASH AND IS DEFINED AS ADJUSTED OPERATIONAL CASH FLOW BEFORE PAID INTERESTS DIVIDED BY ADJUSTED EBITDA. IN ADDITION, CASH CONVERSION IS ALSO CALCULATED AFTER INVESTMENTS IN TANGIBLE OPERATING ASSETS AND IN-HOUSE DEVELOPED SOFTWARE AND SALE OF TANGIBLE ASSETS. 2) FREE CASH FLOW (FCF): IS DEFINED AS OPERATIONAL CASH FLOW ADJUSTED FOR CASH EFFECT OF OTHER INCOME AND EXPENSES LESS NET OPERATIONAL INVESTMENTS

Net leverage of 3.47x in Q2 2019
Net leverage multiples1
4 5894 807 5 017
Q2’18
4 689
1 714
Q3’18 Q4’18
4 104
Q1’19
1 697
Q2’19
2.56x 2.63x
2.26x
3.19x3.47x
20 1) NET INTEREST BEARING DEBT/ ADJUSTED LTM EBITDA
Non-current and current lease liability
NIBD The Group had total long-term interest-bearing debt of
NOK 6 693 million at the end of June 2019, where of NOK 1 392 million was related to non-current lease liabilities (due to the implementation of IFRS 16)
The cash balance was NOK 341 million as of 30 June 2019 and current lease liabilities and other current interest-bearing liabilities amounted to NOK 322 million
This implies a net interest-bearing debt (NIBD) of NOK 6 713 million and a net leverage of 3.47x LTM Adjusted EBITDA

Concluding remarks

Ambitions for 20192019 ambitions Comments
Revenue1
2 4%
organic growth
EVRY Sweden stabilizing topline Application Services remains a key area for growth Focus on growth within Consulting
EBITA margin1
12 13%
Continue to increase Application and Consulting Renewed focus on Sweden will drive improvements Margin pressure remains within infrastructure
P&L effect
OIE2
NOK 200 250m
NOK 70 120m
P&L seasonality Linear over the year, but somewhat front loaded in H1 2019
Cash effect Cash flow seasonality Q1 some higher than remaining quarters
Capex
+/- 2.5%
Mainly related to IP within Financial Services and other key verticals Limited infrastructure Capex
Dividend: ~60% Dividend payout ratio of around 60% of Adjusted Net Profit
221) ADJUSTED FOR CURRENCY EFFECTS, ACQUISITIONS AND DIVESTMENTS2) EXCLUDING MERGER COST

Q&A
Upcoming events 31 Oct 2019: Q3 2019 earnings release
6 Feb 2020: Q4/FY 2019 earnings release

Appendix

Appendix: Business area performance
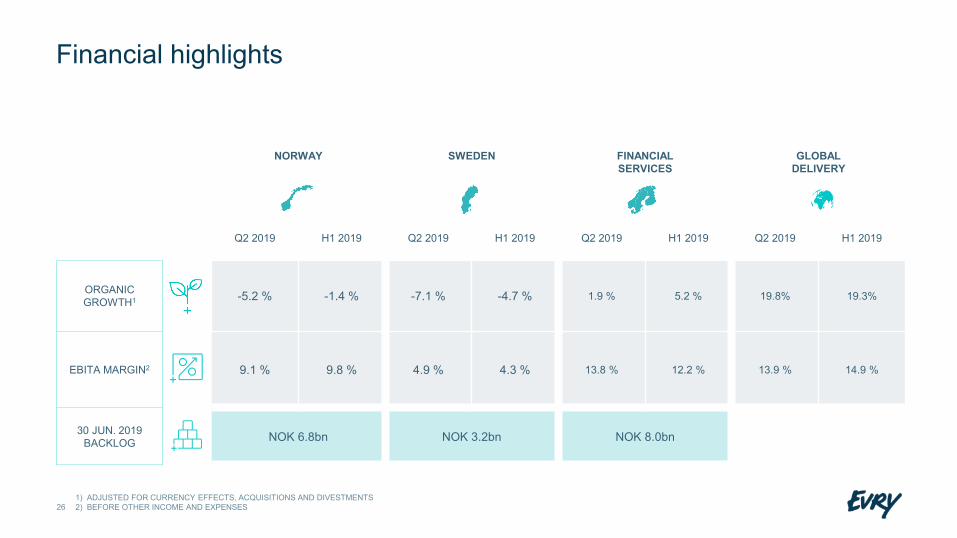
NORWAY SWEDEN FINANCIAL SERVICES
GLOBAL DELIVERY
Q2 2019 H1 2019 Q2 2019 H1 2019 Q2 2019 H1 2019 Q2 2019 H1 2019
ORGANIC GROWTH1 -5.2 % -1.4 % -7.1 % -4.7 % 1.9 % 5.2 % 19.8% 19.3%
EBITA MARGIN2 9.1 % 9.8 % 4.9 % 4.3 % 13.8 % 12.2 % 13.9 % 14.9 %
30 JUN. 2019BACKLOG NOK 6.8bn NOK 3.2bn NOK 8.0bn
Financial highlights
261) ADJUSTED FOR CURRENCY EFFECTS, ACQUISITIONS AND DIVESTMENTS 2) BEFORE OTHER INCOME AND EXPENSES

27
Support the Norwegian Labour Inspection Authority in improving safety in workplaces
Sustaining performance
Realizing potential
Enabling value creation
Clarity of direction
Understandingof possibilities
A future-oriented, flexible
and secure solution that
easily adopt to future needs
Improve the current solution
with new functionality automated
enrolment and a digital version of
the card
More easy-to-use, stable and
cost-efficient solution
Automation to increase
efficiency by the use of AI1 and
machine learning
Support the customer in
protecting HSE2
in Norwegian workplaces
1) AI = ARTIFICIAL INTELLIGENCE2) HSE = HEALTH, SAFETY AND THE WORKING ENVIRONMENT

28
Linköping is the latest municipality to embrace the hottest trends in digital transformation
Sustaining performance
Realizing potential
Enabling value creation
Clarity of direction
Understandingof possibilities
Collaborative process
mapping and design
Methodology for continuous
process improvement
Governance, design and
framework for RPA
Automation of standardized
processes with Robotics (RPA)
Knowledge transfer and training for a
customer CoE

29
Unite Derome group business process through common ERP platform
Sustaining performance
Realizing potential
Enabling value creation
Clarity of direction
Understandingof possibilities
One common digital platform
for visual business
processes
Implement a new ERP
system IFS Applications
Visualization of common business
process and enabling
sustainable growth
Cost control & group visual
ability
Build strong practices across
geography during the
project time period

Appendix: Financials

Profit & loss (NOKm) Q22019
Q2 2018
H12019
H12018
FY 2018
Revenue 3 178 3 286 6 507 6 494 12 912
Cost of goods sold 1 052 1 136 2 174 2 234 4 354
Salaries and personnel costs 1 489 1 405 3 034 2 835 5 612
Other operating costs 160 316 372 622 1 133
Adjusted EBITDA 477 429 927 802 1 812
Depreciation and write-down of tangible assets and in-house developed software 122 55 241 108 230
Adjusted EBITA 354 374 686 694 1 582
Other income and expenses 98 123 186 248 560
EBITA 257 251 500 446 1 022
Amortisation of customer contracts - 1 - 2 1
EBIT 257 250 500 444 1 021
Net financial items -87 -76 -181 -144 -231
Profit/-loss before tax 170 174 318 300 791
Taxes 39 61 69 88 151
Profit/-loss 131 113 250 213 640
31
Profit & Loss
Adjusted for currency impact and acquisitions, the organic growth was -3.4% in Q2 2019 and 0.1% in H1 2019 Consulting Services: Total revenue of NOK 1 163m in Q2 2109 (34.6% of total group revenues), up from
NOK 1 130m in Q2 2018 (32.9% of total group revenues). Organically this implies an increase of 1.9% in the Q2 2019.The utilization in Q2 2019 (Norway and Sweden combined) was 78.0%. The decrease was impacted by two less working days in Q2 2019 and lower activity level in Sweden.
Application Services: Total revenue of NOK 1 083m (32.2% of total group revenues), an improvement from NOK 1 024m in Q2 2018. Organically this implies a growth of 6.0% in Q2 2019 and is a result of the Group’s focus on increasing sales of higher value-added services. Of the revenues within Application Services, Financial Services amounted to NOK 534m (49.3% of the Application Services revenues), and the business area reported an organic growth of 5.7% within application services in Q2 2019.
Digital Platform Services (Infrastructure Services): Total revenue of NOK 928m in Q2 2019 (27.6% of total group revenues), declined from NOK 949m in Q2 2018. This is a result of the ongoing process with focus on changing in business mix, where infrastructure services become a relatively lower part of total revenues. Revenues within Fulfilment Services was NOK 190 m, equal to 5.6% of total group revenues in Q2 2019. In Q2 2018 Fulfilment Services revenues amounted to NOK 328m (9.6% of total group revenues). Q2 2018 was positively impacted by a license sale within the Public and Health division in Norway
Reduced margin in Q2 2019 was due to two less working days than in the Q2 2018 and to the continuance of lower activity level and performance experienced in EVRY Sweden.
Financial expenses in Q2 2019 increased by NOK 19m compared to Q2 2018 as a result of the implementation of IFRS 16 and were negatively impacted by an exchange rate effect of. NOK 13m
Tax expenses in Q2 2018 includes withholding tax of NOK 21 million related to dividend from foreign subsidiary.

Cash flow (NOKm) Q22019
Q2 2018
H12019
H1 2018
FY 2018
Profit/-loss before tax 170 174 318 300 790
Depreciation, write-down and amortization 122 55 241 110 231
Tax paid -9 -10 -11 -13 -69
Net financial items 37 32 85 54 42
Change in net working capital -167 -14 -510 -605 -265
Other changes 44 137 110 297 644
Adjusted net cash flow from operations 198 374 234 142 1 374
Cash effect from other income and expenses -61 -159 -136 -339 -661
Net cash flow from operations 136 215 98 -196 713
Net cash flow from investments -139 -214 -237 -302 -534
Net cash flow from financing -127 -237 -155 -239 -414
Changes in foreign exchange rates -4 11 -11 - 1
Net change in cash flow -134 -224 -305 -737 -234
Free Cash flow 48 290 -14 -31 997
32
Cash flow
Net cash flow from operations for H1 2019 was NOK 98m as compared to negative NOK 196m for H1 2018.
Adjusted operational cash flow for H1 2019 was NOK 234m, compared to NOK 142m in H1 2018. The increase in net cash flow from operations was mainly due increased EBITDA and reduced working capital outflow. H1 of 2019 was also less negatively impacted by transition and transformation expenses related to the IBM partner agreement, as these were reduced from NOK 261m in H1 2018, to NOK 97m in H1 2019.
The change in net working capital was negative in H1 of both 2018 and 2019, and was driven by the H1 ending on a weekend (in both 2018 and 2019), which had a negative effect, as a large number of accounts receivable were due on the last calendar day in the month, with the result that a significant amount of customer payments fell into July.
Net operational investments for H1 2019 totalled NOK 247m, compared to NOK 173m for H1 2018. Investment in tangible operating assets amounted to NOK 53m for H1 2019, while investment in in-house developed software amounted to NOK 195m in H1 2018. The increase in investments related to in-house developed software was within Financial Services and investments in the core and payment platform. Investment in group companies amounted to negative NOK 11m in H1 2019 and was related to dividend from a joint venture company.
Net cash flow from financing for H1 2019 was negative NOK 155m, where of payments related to lease liabilities amounted to NOK 159m in H1 2019.
The company paid out dividend to the shareholders of NOK 646m in May 2019, where temporary draw downs on the Revolving Credit Facility has been done to bridge the pay out.
FCF for H1 2019 was negative NOK 14m compared to negative NOK 31m for H1 2018.
OIE – OTHER INCOME AND EXPENSES33
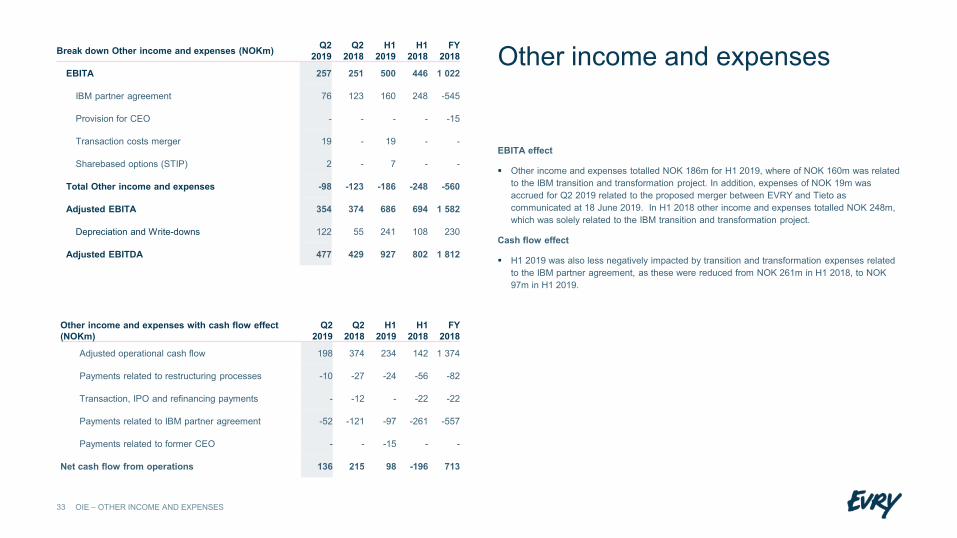
Other income and expenses
EBITA effect
Other income and expenses totalled NOK 186m for H1 2019, where of NOK 160m was related to the IBM transition and transformation project. In addition, expenses of NOK 19m was accrued for Q2 2019 related to the proposed merger between EVRY and Tieto as communicated at 18 June 2019. In H1 2018 other income and expenses totalled NOK 248m, which was solely related to the IBM transition and transformation project.
Cash flow effect
H1 2019 was also less negatively impacted by transition and transformation expenses related to the IBM partner agreement, as these were reduced from NOK 261m in H1 2018, to NOK 97m in H1 2019.
Break down Other income and expenses (NOKm) Q22019
Q2 2018
H12019
H12018
FY 2018
EBITA 257 251 500 446 1 022
IBM partner agreement 76 123 160 248 -545
Provision for CEO - - - - -15
Transaction costs merger 19 - 19 - -
Sharebased options (STIP) 2 - 7 - -
Total Other income and expenses -98 -123 -186 -248 -560
Adjusted EBITA 354 374 686 694 1 582
Depreciation and Write-downs 122 55 241 108 230
Adjusted EBITDA 477 429 927 802 1 812
Other income and expenses with cash flow effect (NOKm)
Q22019
Q2 2018
H12019
H12018
FY 2018
Adjusted operational cash flow 198 374 234 142 1 374
Payments related to restructuring processes -10 -27 -24 -56 -82
Transaction, IPO and refinancing payments - -12 - -22 -22
Payments related to IBM partner agreement -52 -121 -97 -261 -557
Payments related to former CEO - - -15 - -
Net cash flow from operations 136 215 98 -196 713

34
IFRS 16 implementation: implications
The major asset groups for EVRY are IT equipment, Office buildings and Datacenter (over 90%) The outsourcing/service agreement with IBM will not be treated as a lease liability under IFRS 16
The Group's assessment has identified an increase on the Group's balance sheet (assets and liabilities) of NOK 1.7 billion, with no effect on the book value of total equity (Right of Use Asset equal to Lease Liability). This implies an reduction of the equity ratio as of 31 December 2018 of 3.3pp (i.e. equity ratio of 22.4%)
In the Consolidated Statement of Comprehensive Income, operating lease costs (in other operating costs) will be replaced by depreciation and interest expenses. As a result, the group expects the EBITDA to increase in the range of NOK 250 - 350 million. The group expects no significant impact on profit for the year as a result of the implementation of IFRS 16.
In the cash flow statement, the part of lease payments that relates to repayment of the lease liability will be reclassified from cash flows from operations to cash flows from financing.
See note 4 to the Q1’19 interim report for further information about the implementation effect of IFRS 16

Disclaimer
These materials may contain statements about future events and expectations that are forward-looking statements. Any statement in these materials that is not a statement of historical fact including, withoutlimitation, those regarding the Company’s financial position, business strategy, plans and objectives of management for future operations is a forward-looking statement that involves known and unknown risks,uncertainties and other factors which may cause our actual results, performance or achievements of the Company to be materially different from any future results, performance or achievements expressed orimplied by such forward-looking statements. Such forward-looking statements are based on numerous assumptions regarding the Company’s present and future business strategies and the environment in whichthe Company will operate in the future. Although management believes that the expectations reflected in these forward-looking statements are reasonable, it can give no assurances that they will materialise orprove to be correct. Because these statements are based on assumptions or estimates and are subject to risks and uncertainties, the actual results or outcome could differ materially from those set out in theforward-looking statements as a result of many factors, including, among others competition from Nordic and international companies in the markets in which the Company operates, changes in the demand for ITservices, in particular in the Nordic market, changes in international, national and local economic, political, business, industry and tax conditions, the Company's ability to realise backlog as operating revenue, theCompany's ability to correctly assess costs, pricing and other terms of its contracts, the Company's ability to manage an increasingly complex business, political and administrative decisions that may affect theCompany's public customer group contracts, the Company's ability to retain or replace key personnel and manage employee turnover and other labour costs, unplanned events affecting the Group's operations orequipment, the Company's ability to grow the business organically, changes regarding the Company's brand reputation and brand image, fluctuations in the price of goods, the value of the NOK and exchange andinterest rates, the Company's ability to manage its international operations, changes in the legal and regulatory environment and in the Company's compliance with laws and regulations, increases to theCompany's effective tax rate or other harm to its business as a result of changes in tax laws, changes in the Company's business strategy, development and investment plans, other factors referenced in this reportand the Company's success in identifying other risks to its business and managing the risks of the aforementioned factors. Should one or more of these risks or uncertainties materialise, or should any underlyingestimates or assumptions prove to be inappropriate or incorrect, our actual financial condition, cash flows or results of operations could differ materially from what is expressed or implied herein. The Companyassumes no obligations to update the forward-looking statements contained herein to reflect actual results, changes in assumptions or changes in factors affecting these statements.
This presentation does not constitute or form part of, and is not prepared or made in connection with, an offer or invitation to sell, or any solicitation of any offer to subscribe for or purchase any securities andnothing contained herein shall form the basis of any contract or commitment whatsoever. No reliance may be placed for any purposes whatsoever on the information contained in this presentation or on itscompleteness, accuracy or fairness. The information in this presentation is subject to verification, completion and change. The contents of this presentation have not been independently verified. The Company'ssecurities have not been and will not be registered under the US Securities Act of 1933, as amended (the "US Securities Act”), and are offered and sold only outside the United States in accordance with anexemption from registration provided by Regulation S of the US Securities Act. This presentation should not form the basis of any investment decision. Investors and prospective investors in securities of any issuermentioned herein are required to make their own independent investigation and appraisal of the business and financial condition of such company and the nature of the securities.
35

EVRY Investor Relations [email protected]