evraz announces preliminary audited financial results … · evraz announces preliminary audited...
TRANSCRIPT
1
EVRAZ ANNOUNCES PRELIMINARY AUDITED FINANCIAL RESULTS FOR 2013
9 April 2014 – EVRAZ plc (“EVRAZ” or “the Company”) (LSE: EVR) today announces its preliminary audited results for the year ended 31 December 2013 (“the Period”).
The financial information contained in this document for the year ended 31 December 2013 does
not constitute statutory accounts as defined in section 435 of the Companies Act 2006. The
audited statutory accounts for the year ended 31 December 2012 have been delivered to the
Registrar of Companies and those for 2013 will be delivered following the Company's annual
general meeting convened for 12 June 2014.
The auditor has reported on the statutory accounts for year ended 31 December 2013. The
auditor's report was unqualified.
2013 HIGHLIGHTS Commenting on the financial results in respect of 2013, Alexander Frolov, Chief Executive of EVRAZ, stated: “2013 was another challenging year for the global steel and coal mining industries, characterised by strong cyclical headwinds, which EVRAZ was not immune to. Although we managed to increase external steel sales by 1% to 15.5 million tonnes and substantially grew the output of coking coal by 22% to 18.9 million tonnes, our EBITDA was US$1,821 million in 2013, 10% less than in 2012.
Whereas many factors are beyond our control, EVRAZ possesses certain fundamental value drivers that we believe will define the Company’s future performance and ultimately create value for our shareholders. Management’s response to the current market situation has encompassed a thorough review of EVRAZ’s balance sheet, strategic options and business portfolio.
In terms of the financial strategy, our priority was to address the debt leverage by focusing on the generation of positive free cash flow, which reached US$458 million in 2013. Important contributors to the free cash flow in 2013 were the positive effects of the operating efficiency and cost cutting programmes which we initiated during the year – all of which yielded total savings of approximately US$303 million.”
Full year to 31 December
(US$ million) 2013 2012 Change
Consolidated revenue 14,411 14,726 (2.1)%
Consolidated EBITDA* 1,821 2,027 (10.2)%
Net loss (572) (425) 34.6%
Loss per share, (US$) (0.35) (0.30) 16.7%
Net cash flows from operating
activities 1,900 2,143 (11.3)%
CAPEX 902 1,261 (28.5)%
31 December 2013 31 December 2012
Net debt** 6,534 6,376 2.5%
Total assets 17,704 17,732 (0.2)%
* Please refer to Appendix 1 for reconciliation of profit/(loss) from operations to EBITDA
** Hereinafter debt and cash balances include the amounts held at operations that were classified
as assets/liabilities held for sale, which were separately presented in the statement of financial
position as of 31 December 2013, and include US$35 million of cash and cash equivalents and
US$78 million of debt (including US$76 million of short-term debt). Please refer to Appendices 4
and 5

2
Steel:
Steel segment revenue of US$12,541 million (-7% vs. 2012)
Crude steel production of 16.1 million tonnes (+1%)
Total external sales of steel products of 15.5 million tonnes (+1%)
Decline in steel and steel products prices led to a US$798 million decrease in consolidated
revenue
Mining:
Mining segment revenue of US$3,120 million (+18% vs. 2012)
Raw coking coal production of 18.9 million tonnes (+22%) including 7.8 million tonnes from
Raspadskaya
Production of saleable iron ore products was 20.4 million tonnes (-1%) on the back of lower
output by the Russian operations largely driven by the disposal of high cost operation EVRAZ
VGOK
Decline in prices for mining products led to a US$182 million decrease in consolidated revenue
Vanadium:
Vanadium segment revenue of US$550 million (+6% vs. 2012)
The vanadium division produced 21,077 tonnes (+0.1%) of vanadium slag and sold
23,287 tonnes (+10%) of vanadium products
Investments:
Capital expenditure of US$902 million (vs. US$1,261 million in 2012) following the thorough
revision of investment plans
Rail mill modernisation at EVRAZ ZSMK completed in January 2013 with ramp-up mostly
finished
PCI project at EVRAZ NTMK fully reached design parameters in May 2013, while construction
work on PCI at EVRAZ ZSMK continued
Yerunakovskaya VIII coking coal mine launched in February 2013 and fully ramped up by
February 2014
Development of Mezhegey coking coal deposit continued
Hot tests at Vostochny rolling mill in Kazakhstan commenced
M&A developments:
Completion of acquisition of an indirect controlling interest in OJSC Raspadskaya bringing
effective interest to 81.95% for US$964 million in equity and cash
Acquisition of the 51% stake in Timir iron ore project for a US$159 million cash consideration
Disposal of structurally high costs assets in iron ore and coal mining – EVRAZ VGOK, Abakan
and Teya mines of Evrazruda and the Gramoteinskaya steam coal mine for cash consideration
of ca.US$20 million
Disposal of EVRAZ Vitkovice Steel based on the enterprise value of US$287 million
Debt and liquidity:
Net debt of US$6,534 million vs. US$6,376 million as at 31 December 2012 including
additional US$400 million of net debt contributed in 2013 from the consolidation of
Raspadskaya
Cash and short-term deposits of US$1,611 million (see Appendix 2 for calculation)

3
Placed US$1,000 million Eurobonds due in 2020 with the lowest ever coupon rate achieved by
EVRAZ of 6.50% p.a.
Prepaid US$950 million structured credit facility due 2015 with certain covenants on net
leverage
Dividends:
The directors recommend a dividend of 6 cents per share to be consistent with their intention of distributing, where appropriate, a proportion of the margin on disposals as dividends, and as an indication of confidence in the Company’s position. The US$90.4 million represents the approximate cash portion of the proceeds from the sale of EVRAZ Vitkovice Steel, leaving US$196.6 million for the reduction of debt
Revised dividend policy set out (see below)
CHIEF EXECUTIVE OFFICER’S REPORT Through the sound fundamentals of our business and our vision we endeavour to deliver sustainable ongoing growth and value. However, 2013 was another challenging year for the global steel and coal mining industries, characterised by strong cyclical headwinds, which EVRAZ was not immune to. Although we managed to increase external steel sales by 1% to 15.5 million tonnes and substantially grew the output of coking coal by 22% to 18.9 million tonnes, our EBITDA was US$1,821 million in 2013, 10% less than in 2012. Due to the relatively high financial leverage of the Company, shareholder value also came under pressure during the course of 2013. Whereas many factors are beyond our control, such as the cyclicality of the broad commodity market, EVRAZ possesses certain fundamental value drivers that we believe will define the Company’s future performance and ultimately create value for our shareholders. Overview of Health, Safety and Environmental performance The safety of our employees remained the key priority in 2013. Although the number of fatalities decreased compared to 2012, the fact that 18 employees lost their lives at work is deeply regrettable. All of the incidents have been meticulously investigated and analysed in order to mitigate against recurrence and identify other workplace risks. We remain committed to our strategic goal of zero fatality incidents. We have been focusing on sustained training to underline the importance of adherence to our improved operating standards as we endeavour to progress towards a zero-harm environment. We have also adopted a proactive approach to the promotion of more disciplined behaviour at the workplace, accompanied by continual engagement, on the part of workers and managers, in appropriate training courses. In line with this, we have engaged a significant number of mid-level managers from various business areas to impart their appreciation of the importance of safety awareness across all key production sites. Balance sheet deleverage strategy, cost cutting and capex revision Management’s response to the current market situation has encompassed a thorough review of EVRAZ’s balance sheet, strategic options and business portfolio. In terms of the financial strategy, our priority was to address the debt leverage by focusing on the generation of positive free cash flow, which reached US$458 million in 2013. The ratio of net debt to EBITDA amounted to 3.6x, which we consider as being high. The current target, through organic deleveraging and disposals, is to reduce the net debt to EBITDA ratio to below 3.0x by 2016 year-end. Important contributors to the free cash flow in 2013 were the positive effects of the operating efficiency and cost cutting programmes which we initiated during the year. The plan provided for staff optimisation, including a headcount reduction and the implementation of more efficient work
4
shifts; reduced maintenance downtime at our steel mills and the efficient repositioning of longwalls in coking coal mines; enhanced extraction yields and reduced conversion costs – all of which yielded total savings of approximately US$303 million. In 2014, we will extend our operating costs’ reduction programme to save US$350-400 million and, post a comprehensive review of general and administrative costs, we are aiming to reduce costs by an additional US$100 million on an annualised basis from 2015 compared to 2013 level, including a reduction of US$50 million to be achieved in 2014. In addition, we significantly revised our investment plans and doubled the Internal Rate of Return threshold with regard to the suspension of projects below 40% compared with 20% we used to have previously. As a result, capex in 2013 was reduced by approximately US$400 million from the originally budgeted US$1.3 billion to US$902 million. Deferred projects included the construction of the Yuzhny rolling mill and expenditures on certain higher cost coal mines. In 2014, we expect to achieve a further reduction in capital spending and end up with less than US$900 million. Disposals and closure of high cost and other assets In the current market reality, certain aspects of our steel and mining asset base have become economically inefficient and structurally high cost. During 2013 management refined and commenced implementation of an action programme focused on the divestment or closure of specific high cost and/or loss making assets. Key developments included the shutdown of the Irba mine, the sale of the Abakan and Teya mines at Evrazruda, the disposal of EVRAZ VGOK, preparations for the shutdown of the Abashevskaya coal mine, the closure of the plate rolling mill at EVRAZ ZSMK and the suspension of EVRAZ Claymont Steel. In addition we temporarily suspended EVRAZ Palini e Bertoli, our Italian plate rolling mill, in order to release significant working capital. We have continued to negotiate with an expanded list of potential purchasers of EVRAZ Highveld Steel and Vanadium in South Africa and we will update the market on developments in due course. On 3 April 2014, we successfully completed the sale of EVRAZ Vitkovice Steel, our Czech
subsidiary, based on the enterprise value of US$287 million, including US$89 million for equity.
The sale reflected management’s belief that strategic options for the development of the operation
within EVRAZ were limited.
Value drivers We believe that our value drivers are our fundamental low cost positions with access to proprietary raw materials, which enables us to secure the required quantities and quality of iron ore and coking coal at costs which are below the market’s conservative estimates of long run pricing. Iron ore Our core iron ore business, EVRAZ KGOK, has historically been an important contributor to the Company’s free cash flow with cash costs for iron ore products (58% Fe) of US$46 per tonne before credits from a vanadium by-product. The mining volumes of EVRAZ KGOK fully cover the requirements of EVRAZ NTMK. It is anticipated that the low cost position of EVRAZ KGOK will be sustained throughout the current operations and during the development of the new Sobstvenno-Kachkanarskoye iron ore deposit, located in close proximity to the current open pits, with an estimated mine life of more than 100 years. In addition, the successful implementation of cost savings and operational improvements at all of the Company’s iron ore mining assets, together with the sale and shutdown of high cost operations, resulted in a reduction of blended cash costs (58% Fe) from US$69/tonne in 2012 to US$61/tonne in 2013 with potential further savings in 2014 and beyond. EVRAZ has also entered the Timir iron ore joint venture arrangement focused on the development of iron ore deposits in Southern Yakutia. The rationale behind our acquisition of a

5
51% interest in the project is the prospect of securing adequately priced supplies of iron ore for EVRAZ ZSMK, our major Russian steel mill situated in Western Siberia, post the depletion of Evrazruda’s reserves in 5-7 years. Timir’s substantial iron ore resources and proximity to the existing infrastructure provide for the efficient development of the project as a low cost operation. Coking coal With regard to coking coal the Company took a major step forward in 2013 with the acquisition of Raspadskaya, a transaction designed to harden the competitive advantage of being the market leader in the Russian coking coal market; primary attractions include the long life of the mineral resources and a broad customer base. Raspadskaya, even at its current relatively low levels of raw coal production, is one of Russia’s lowest cost coking coal companies, with an average cash cost of concentrate of $54.9/t in 2013. The Raspadskaya mine possesses exceptional assets of high quality semi-hard coking coal with proven and probable reserves extending to upwards of 100 years; production, however, has yet to return to the levels achieved prior to the tragic accident in 2010. Our investment to date has been largely focused on mine restoration and the implementation of measures designed to ensure safe working conditions. The underground mine is now operating with two longwalls and the production plan envisages the commissioning of two additional longwalls in 2014. Overall, Raspadskaya expects to increase its output of raw coking coal by up to 40% to 11 million tonnes in 2014. We commissioned the new coking coal mine Yerunakovskaya VIII in February 2013 ahead of schedule and on budget with nameplate capacity of 3 million tonnes of semi-hard coking coal at mined raw coal cash costs of less than US$40/t -- one of the lowest among CIS coal mines. The mine, with an estimated life span of approximately 63 years, was fully ramped up with effect from February 2014. Looking to the future and given the current tough coking coal market, our mine portfolio optimisation programme will result in the growth of capacity at low cost mines which will replace the high cost operations, thereby enabling a further decrease in blended cash costs. We have undertaken to execute only the first stage of our greenfield Mezhegey project involving a limited cash commitment. However, Mezhegey is one of the key drivers of our long-term plan to develop EVRAZ’s coking coal base and possesses the potential to become a reliable, quality coal, export-oriented operation. Steel In the steel segment we enjoy the benefit of owning high quality steel assets with strong market positions in multiple geographies and product lines. As the market leader in the Russian construction long product market and the leading manufacturer of rails in Russia and North America we are intent on continuing to improve our product mix through selective investments. For example, the successful launch of the rail mill at EVRAZ ZSMK in 2013 following a major modernisation programme allows us to produce premium head hardened rails, including 100 metre rails suitable for high speed railways. In order to strengthen our global leadership in rail production, we are also progressing a rail mill project in EVRAZ North America which will allow us to improve rail quality, increase the mill’s capacity and expand technical customer support and product development. The modernisation programme is proceeding as planned with project completion expected in mid-2014. EVRAZ NTMK sustainably improved its profitability in 2013 as a result of the implementation of Pulverised Coal Injection (PCI) technology which led to reductions in the consumption of natural gas and coke of 42% and 22% respectively, accompanied by an increase in pig iron production capacity of 100,000 tonnes per annum. Based on this positive experience we have been adopting PCI technology at our second steelmaking plant in Russia, EVRAZ ZSMK, despite some delays. The fundamental advantage enjoyed by EVRAZ North America is the geographical location of the facilities in the western part of the USA and Canada, regions that are light in steel production but well exposed to demand from the oil and gas industry and premium rail infrastructure customers.
6
EVRAZ’s focus on research and development strengthens the portfolio of high value-added rail and tubular products, thereby safeguarding our dominant market positions. Vanadium The processing operations of EVRAZ NTMK benefit from its ability to utilise the proprietary technology and vanadium rich iron ore produced by EVRAZ KGOK located nearby. Due to the nature of EVRAZ’s iron ore assets and its ownership of vanadium processing facilities we will continue to be a major player in the global vanadium market. Dividends and dividend policy The directors recommend a dividend of 6 cents per share to be consistent with their intention of distributing, where appropriate, a proportion of the margin on disposals as dividends, and as an indication of confidence in the Company’s position. The US$90.4 million represents the approximate cash portion of the proceeds from the sale of EVRAZ Vitkovice Steel, leaving US$196.6 million for the reduction of debt. Going forward, the dividend policy has been revised to support the financial strategy of deleveraging and envisages that the regular dividends will be paid only when the net leverage (net debt/EBITDA) target of below 3.0x is achieved. The Board reserves the right to propose special dividends in the event of asset disposals. Update on Ukrainian situation The geopolitical developments around Ukraine could have an impact on our operations, as we have assets both in Ukraine and Russia. However, to date our operations have not been adversely affected. We will update the market as appropriate. Outlook 2014 has started mildly positively in most regional steel markets – long steel volumes in Russia are picking up fuelled by the start of the construction season, prices for railway products are stable, while the severe winter in North America is pushing prices higher. There have been also growth in prices for our semi-finished products in Asian markets. However, certain risks remain, in particular the growth of seaborne supply of steelmaking raw materials over the medium term and geopolitical risks. Management’s response to potential continued volatility in markets consists of comprehensive cost cutting programmes, deleveraging and the disciplined development of growth options in order to be well prepared for the next upturn of the cycle. Overall, taking into account market conditions and management’s initiatives, the Board is comfortable with expectations for the year. Alexander Frolov Chief Executive Officer EVRAZ plc FINANCIAL REVIEW Giacomo Baizini, Chief Financial Officer, commented: “Management’s focus on the cost optimisation, disposal and closure of structurally unprofitable assets and free cash flow generation to achieve the debt reduction started to bear the fruits in 2013. Despite challenging market environment, we managed to decrease the cost of revenue, achieve solid positive free cash flow and demonstrate healthy debt management results.” Overview As a result of the challenging conditions in the market for steel and steelmaking raw materials, the Company recorded a net loss of US$572 million for 2013, compared to a net loss of
7
US$425 million in 2012. Falling prices in 2013 caused revenue to decline by 2.1% to US$14,411 million; consequently EBITDA decreased by 10% to US$1,821 million. Free cash flow for the period was positive at US$458 million, however net debt increased by 2.5% to $6,534 million, as a result of the consolidation of Raspadskaya’s debt. As of today we have no debt with maintenance covenants that require testing prior to 30 June 2014. As of 31 December 2013, the Company’s cash and short-term deposits amounted to US$1,611 million, compared to short-term debt of US$1,893 million. The Company has already started to work on refinancing the major maturities due in the second half of 2014. Corporate developments In January 2013, we completed the acquisition of a controlling interest in the Raspadskaya coal company for US$964 million, a transaction which was primarily financed by equity accompanied by a US$202 million cash component payable in equal quarterly instalments ending on 15 January 2014. In addition, in April 2013 we acquired a 51% stake in Timir, a joint-venture with Alrosa (the shareholder agreement gives joint control), created for the development of major iron ore deposits in Yakutia, Russia, for RUB4,950 million (ca. US$159 million) payable in quarterly instalments until 15 July 2014. In 2013, in line with our mining asset optimisation programme, we disposed of EVRAZ VGOK iron ore and processing plant for a US$20 million cash consideration; of a number of Evrazruda’s iron ore assets and utilities companies for a total cash consideration of approximately US$306,000; and of the Gramoteinskaya thermal coal mine for a RUB10,000 cash consideration. As part of a strategic realignment of our asset base, the Group was proceeding with disposals of EVRAZ Highveld Steel and Vanadium and the EVRAZ Vitkovice Steel operations initiated at the end of 2012. Accordingly these assets were accounted for as assets held for sale at the end of the period. The Company completed the sale of EVRAZ Vitkovice Steel on 3 April 2014 for a consideration of US$89 million adjustable for the actual level of the working capital. In addition the buyers assumed US$198 million of debt liabilities, including the repayment of US$128 million of EVRAZ’s inter-company debt. The sale of EVRAZ Highveld Steel and Vanadium is expected to be completed in 2014. In addition, in 2013 the Company suspended operations at EVRAZ Claymont Steel and EVRAZ Palini e Bertoli, which had a certain impact on our financial results. Statement of Operations
Revenues
(US$ million)
Segment 2013 2012 Change Relative change
Steel 12,541 13,543 (1,002) (7.4)%
Mining 3,120 2,650 470 17.7%
Vanadium 550 520 30 5.8%
Other operations 928 1,046 (118) (11.3)%
Eliminations (2,728) (3,033) 305 (10.1)%
Total 14,411 14,726 (315) (2.1)%
Group revenues for 2013 decreased by 2.1% to US$14,411 million, with revenues from the Group’s steel segment amounting to US$12,541 million or 87% of total Group‘s revenue. Steel sales volumes slightly increased to 15.5 million tones compared to 15.3 million tonnes in 2012. The decline in revenues was largely due to a decrease in prices, in line with the general

8
negative trend in steel pricing. Average Steel segment revenue per tonne decreased by 8.6% in 2013 compared to 2012 reflecting weak market environment. Steel revenues were also impacted by changes in the Group’s product mix during 2013 due to the suspension of operations of EVRAZ Claymont Steel and EVRAZ Palini e Bertoli and closure of EVRAZ ZSMK plate rolling mill. While sales volumes of flat-rolled steel products declined, a part of semi-finished production was switched from internal consumption to external sales. Mining revenues increased by 17.7% to US$3,120 million in the period, compared to US$2,650 million in 2012. The growth in revenues was primarily the result of the consolidation of Raspadskaya.
Revenue by region
(US$ million)
Region 2013 2012 Change Relative change
Russia 6,136 6,191 (55) (0.9)%
Americas 3,242 3,571 (329) (9.2)%
Asia 2,062 2,115 (53) (2.5)%
Europe 1,385 1,450 (65) (4.5)%
CIS 1,175 996 179 18.0%
Africa 404 397 7 1.8%
Rest of the world 7 6 1 16.7%
Total 14,411 14,726 (315) (2.1)%
EBITDA
(US$ million)
Segment 2013 2012 Change Relative change
Steel 1,329 1,338 (9) (0.7%)
Mining 646 625 21 3.4%
Vanadium 19 (19) 38 (200.0%)
Other operations 110 189 (79) (41.8%)
Unallocated (226) (199) (27) 13.6%
Eliminations (57) 93 (150) (161.3%)
Total 1,821 2,027 (206) (10.2%)
Steel segment EBITDA in 2013 is slightly lower than in 2012 as a result of declining prices for all steel products all over the world, partly offset by lower raw material prices. Mining EBITDA was positively impacted by additional coking coal sales volumes, contributed by the consolidation of Raspadskaya. This factor was partly offset by falling prices for coal and iron ore products. The increase in Vanadium EBITDA largely reflected the recovery in prices of vanadium in alloys and chemicals. The decrease in the Other operations segment EBITDA is mainly attributable to the disposal of our transportation subsidiary Evraztrans at the end of 2012. Eliminations mostly reflect unrealised profits or losses of the Mining segment in transactions with the subsidiaries relating to the Steel segment. In 2012, the amounts were positive due to high

9
levels of intersegment inventory at the end of 2011 which were realised during the year. In 2013, there was an increase in the balances of steel products, which included higher margins of mining subsidiaries, and this led to a deduction from the sum total of all segments EBITDA to arrive at the realised consolidated EBITDA.
Cost of revenues, expenses and results
(US$ million)
Item 2013 2012 Change Relative change
Cost of revenue (11,468) (11,803) 335 (2.8%)
Gross profit 2,943 2,923 20 0.7%
Selling and distribution costs (1,183) (1,211) 28 (2.3%)
General and administrative expenses (877) (839) (38) 4.5%
Impairment of assets (446) (413) (33) 8.0%
Foreign exchange gains/(losses), net (258) (41) (217) 529.3%
Other operating income and expenses,
net (160) (161) 1 (0.6%)
Profit from operations 19 258 (239) (92.6%)
Interest expense, net (676) (631) (45) 7.1%
Gain/(loss) on financial assets and
liabilities, net (43) 164 (207) (126.2%)
Gain on disposal group classified as held
for sale, net (25) 18 (43) (238.9%)
Other non-operating gains/(losses), net 112 (5) 117 n/a
Loss before tax (613) (196) (417) 212.8%
Income tax benefit/(expense) 41 (229) 270 n/a
Net loss (572) (425) (147) 34.6%
The Group’s cost of revenue decreased by 2.8% to US$11,468 million in 2013 compared with US$11,803 million in 2012. This was mostly due to a 12% fall in raw material costs and a 16% reduction in depreciation charges which, in turn, were partially offset by higher staff costs and services purchased. The consolidation of Raspadskaya in 2013 added US$463 million to cost of revenues, while decreasing the expense on coking coal by US$93 million. A detailed breakdown of the cost of revenue as as follows:
(US$ million)
Item 2013
% of
revenue 2012*
% of
revenue Change Relative change
Revenue 14,411 14,726 (315) (2)%
Cost of revenue 11,468 80% 11,803 80% (335) (3%)
Raw materials, incl. 3,539 25% 4,026 27% (487) (12%)
Iron ore 787 6% 681 5% 106 16%
Coking coal 640 4% 1,028 7% (388) (38%)
Scrap 1,333 9% 1,570 11% (237) (15%)
Other raw materials 779 6% 747 4% 32 4%
Semi-finished products 456 3% 485 3% (29) (6%)
Auxiliary materials 1,027 7% 983 7% 44 4%

10
(US$ million)
Item 2013
% of
revenue 2012*
% of
revenue Change Relative change
Services 736 5% 666 5% 70 11%
Goods for resale 678 5% 652 4% 26 4%
Transportation 836 6% 787 5% 49 6%
Staff costs 1,940 13% 1,743 12% 197 11%
Depreciation 919 6% 1,100 7% (181) (16%)
Electricity 633 4% 574 4% 59 10%
Natural gas 405 3% 416 3% (11) (3%)
Other costs 299 3% 371 3% (72) (19%)
*There are some diffrences in figures for 2012 published in the previous annual report due to
adjustments in pension liability accruals and minor corrections of intersegment eliminations
between cost items
The cost of raw materials, the largest single cost item, decreased by US$487 million in 2013 driven mostly by lower coking coal and scrap costs which fell by US$388 million and US$237 million respectively. This decrease was partially offset by an increase in iron ore costs by US$106 million mainly due to lower intragroup sales resulting from the EVRAZ VGOK disposal in September 2013 and closure of the Irba mine at Evrazruda. The reduction in coking coal costs in 2013 was attributable to reduction in the price of purchased coking coal, consolidation of Raspadskaya (US$93 million) and lower volumes of coking coal purchased from the market following the disposal of the Ukrainian coking plant DKHZ in 2012 (US$84 million). A decrease in scrap costs was primarily due to lower volumes of purchases from third parties in North America, in addition to lower prices in Russia and North America. EVRAZ has also implemented operational improvement plans that resulted in optimisation of yields at the Russian steel mills. The costs for semi-finished products fell by 6% primarily due to lower prices and lower consumption of pig iron by EVRAZ Vitkovice Steel as a result of lower production volumes. Auxiliary material costs increased by 4%, or US$44 million, due to the consolidation of Raspadskaya, which accounted for US$115 million of additional costs, which was offset primarily by the effect from cost optimisation programmes. Expenditure on services increased by 11%, or US$70 million, primarily as a result of the consolidation of Raspadskaya which added US$38 million and higher volumes of coal processed at third party coal washing facilities which increased costs by US$33 million. The cost of goods for resale increased by 4%, or by US$26 million. The increase of US$36 million is due to the purchase by EVRAZ Metal Inprom, the Company’s retail trading arm, of more third party products to meet customer demand. Transportation costs increased by 6%, or by US$49 million, due to the consolidation of Raspadskaya which added US$45 million in costs. Staff costs increased by 11%, or by US$197 million, due to the consolidation of Raspadskaya, which was responsible for US$133 million of the rise, and higher wages at the Group’s ongoing operations, which rose in accordance with collective bargaining agreements. The increase in staff costs was partially offset by the personnel optimisation programme. Total depreciation, depletion and amortisation in cost of goods sold amounted to US$919 million in 2013 compared to US$1,100 million in 2012. The depletion charge was significantly reduced in 2013 compared to 2012, from US$467 million to US$194 million despite a US$32 million charge due to the Raspadskaya acquisition in January 2013. The decrease in the depletion expense was caused by the revision and detailing of mining plans as part of the independent JORC valuations performed during the year. The overall mining plans for ore bodies with extraction plans going

11
beyond 40-100 years were disaggregated into separate components of proved and probable reserves that are excluded from the calculation of the depletion charge until actual production begins. This resulted in a better matching of the current depletion charge with the estimated costs of extraction. The decrease was partially offset by consolidation of Raspadskaya (US$109 million). Electricity costs increased by 10%, or by US$59 million, due to higher electricity prices across all regions and higher consumption of electricity by Russian operations, partially compensated by implementation of operational improvements. Natural gas expenditure, on the contrary, decreased by 3%, or by US$11 million due to operational improvements resulting in reduced consumption of gas by the Russian and Ukrainian operations, including lower consumption at EVRAZ NTMK following the implementation of the PCI technology. Other costs include taxes, change in WIP and finished goods, and minor items of energy costs. The decrease in other costs in 2013 by 19% is mostly driven by increase in stock of WIP and finished goods. Selling and distribution expenses were 2.3% lower than in 2012 mainly due to suspension of amortisation of intangibles for assets classified as held for sale and the lower volumes of long distance sales that were partially offset by Raspadskaya consolidation.
General and administrative expenses were 4.5% higher than in 2012 mainly due to Raspadskaya consolidation (which accounted for 6.6% of total general and administrative expenses for 2013) that was partially offset by disposal of EVRAZ VGOK in October 2013 and reduction of expenses at Evrazruda and EVRAZ Highveld Steel and Vanadium as a result of significant cost saving initiatives.
Impairment loss of US$(446) million consisted mostly of a US$(326) million impairment of assets of EVRAZ Claymont Steel suspended due to soft demand in the market and US$(96) million relating to several mines of Yuzhkuzbassugol, where the production plans were revised, and other mines of Yuzhkuzbassugol (Kusheyakovskaya, Abashevskaya and Gramoteinskaya) standing idle. Foreign exchange losses increased from a US$(41) million loss in 2012 to a US$(258) million loss in 2013. This, in large part, is due to the currency fluctuations in respect of intra-group debts between subsidiaries with different functional currencies. Since there is no IFRS concept of a Group’s functional currency, gains/(losses) of one subsidiary recognised in the Statement of Operations are not offset with the exchange differences of another subsidiary with a different functional currency and thus these amounts cannot be eliminated on a consolidated level. Interest expenses incurred by the Group have fallen steadily over the last two years as a result of the refinancing of debt at lower interest rates on a comparative basis. The increase in interest expenses from US$654 million in 2012 to US$699 million in 2013 is mostly caused by the consolidation of Raspadskaya (US$42 million). In accordance with IFRS 3 “Business Combinations” with regard to a business combination achieved in stages, the acquirer shall remeasure its previously held equity interest in the acquiree at its acquisition-date fair value and recognise the resulting gain or loss in the income statement. In 2013 the Group recorded a US$89 million gain on derecognition of the equity interest related to equity interest in Raspadskaya ($94 million) and MediaHolding Provincia ($(5) million loss) held before the business combinations. Losses on financial assets and liabilities amounted to US$(43) million and comprised mostly unrealised losses of US$(106) million and realised gains of $51 million on the change in the fair value of derivatives – currency and interest rate swaps for the rouble-denominated bonds. The Company had an income tax benefit of only US$41 million, notwithstanding a loss before tax of US$(613) million. This was mostly due to losses at certain subsidiaries that could not be offset against profits of other subsidiaries, as well as the fact that some expenses are not deductible for tax purposes.

12
Cash flow
Cash Flow
(US$ million)
Item 2013 2012 Change Relative change
Cash flows from operating activities
before change in working capital 1,535 1,733 (198) (11.4)%
Changes in working capital 365 410 (45) (11.0)
Net cash flows from operating
activities 1,900 2,143 (243) (11.3)%
Short-term deposits at banks, including
interest 677 (656) 1,333 n/m
Purchases of property, plant and
equipment and intangible assets (902) (1,261) 359 (28.5)%
Other investing activities (39) 373 (412) n/m
Net cash flows from / (used in)
investing activities (264) (1,544) 1,280 (82.9)%
Net cash flows from / (used in)
financing activities (1,367) (42) (1,325) 3,154.8%
Effect of foreign exchange rate changes
on cash and cash equivalents (48) 32 (80) n/m
Net increase in cash and cash
equivalents 221 589 (368) (62.5)%
Cash flows from operating activities before changes in working capital fell by 11.4% in 2013 to US$1,535 million reflecting lower product prices compared to 2012. In 2013, US$365 million were released from working capital reflecting lower prices of the Company’s products, better inventory management and debts collection efforts. Free cash flow for the period was a positive US$458 million.
Calculation of Free Cash Flow
(US$ million)
Item 2013
EBITDA 1,821
Non-cash items (37)
EBITDA (excluding non-cash items) 1,784
Changes in working capital 365
Income tax paid (249)
Net Cash flows from operating activities 1,900
Interest and similar payments (501)
Capital expenditure (902)
Purchases of subsidiaries (net of cash acquired) and interests in
associates/joint ventures (30)
Proceeds from sale of disposal groups classified as held for sale, net of
transaction costs 1
Other cash flows from investing activities (10)
Free Cash Flow* 458
* Please refer to Appendix 3
13
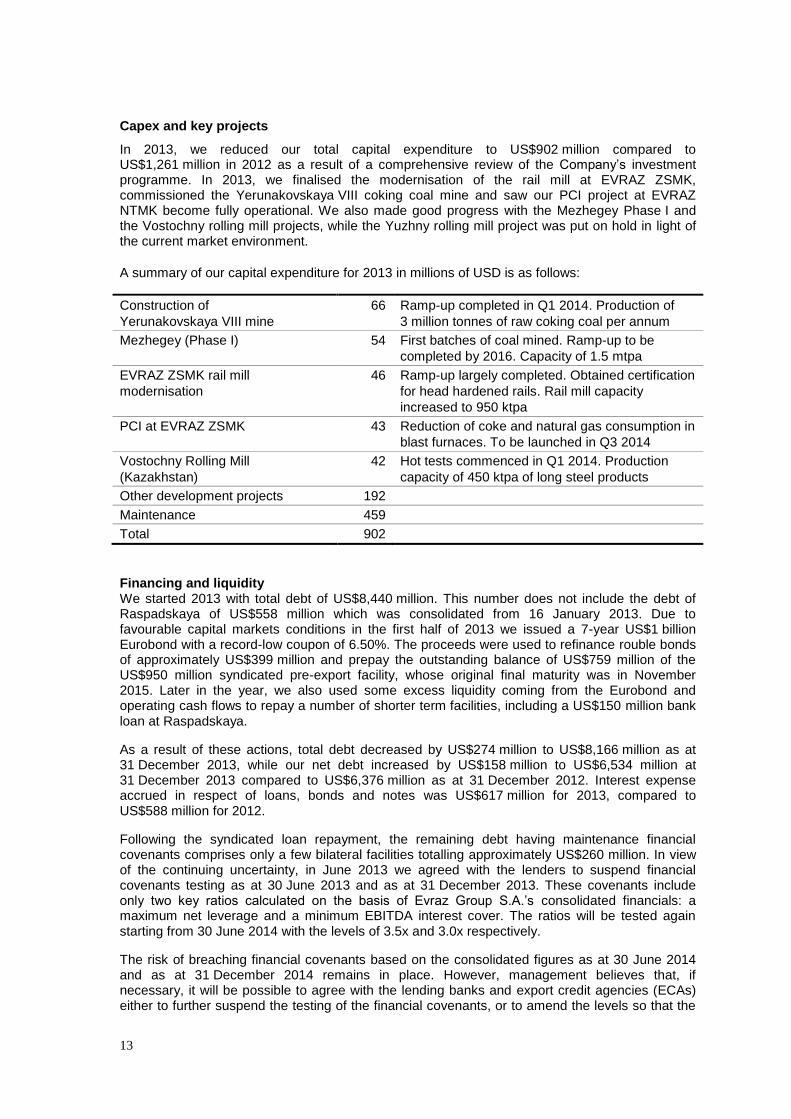
Capex and key projects
In 2013, we reduced our total capital expenditure to US$902 million compared to US$1,261 million in 2012 as a result of a comprehensive review of the Company’s investment programme. In 2013, we finalised the modernisation of the rail mill at EVRAZ ZSMK, commissioned the Yerunakovskaya VIII coking coal mine and saw our PCI project at EVRAZ NTMK become fully operational. We also made good progress with the Mezhegey Phase I and the Vostochny rolling mill projects, while the Yuzhny rolling mill project was put on hold in light of the current market environment.
A summary of our capital expenditure for 2013 in millions of USD is as follows:
Construction of
Yerunakovskaya VIII mine
66 Ramp-up completed in Q1 2014. Production of
3 million tonnes of raw coking coal per annum
Mezhegey (Phase I) 54 First batches of coal mined. Ramp-up to be
completed by 2016. Capacity of 1.5 mtpa
EVRAZ ZSMK rail mill
modernisation
46 Ramp-up largely completed. Obtained certification
for head hardened rails. Rail mill capacity
increased to 950 ktpa
PCI at EVRAZ ZSMK 43 Reduction of coke and natural gas consumption in
blast furnaces. To be launched in Q3 2014
Vostochny Rolling Mill
(Kazakhstan)
42 Hot tests commenced in Q1 2014. Production
capacity of 450 ktpa of long steel products
Other development projects 192
Maintenance 459
Total 902
Financing and liquidity We started 2013 with total debt of US$8,440 million. This number does not include the debt of Raspadskaya of US$558 million which was consolidated from 16 January 2013. Due to favourable capital markets conditions in the first half of 2013 we issued a 7-year US$1 billion Eurobond with a record-low coupon of 6.50%. The proceeds were used to refinance rouble bonds of approximately US$399 million and prepay the outstanding balance of US$759 million of the US$950 million syndicated pre-export facility, whose original final maturity was in November 2015. Later in the year, we also used some excess liquidity coming from the Eurobond and operating cash flows to repay a number of shorter term facilities, including a US$150 million bank loan at Raspadskaya.
As a result of these actions, total debt decreased by US$274 million to US$8,166 million as at 31 December 2013, while our net debt increased by US$158 million to US$6,534 million at 31 December 2013 compared to US$6,376 million as at 31 December 2012. Interest expense accrued in respect of loans, bonds and notes was US$617 million for 2013, compared to US$588 million for 2012.
Following the syndicated loan repayment, the remaining debt having maintenance financial covenants comprises only a few bilateral facilities totalling approximately US$260 million. In view of the continuing uncertainty, in June 2013 we agreed with the lenders to suspend financial covenants testing as at 30 June 2013 and as at 31 December 2013. These covenants include only two key ratios calculated on the basis of Evraz Group S.A.’s consolidated financials: a maximum net leverage and a minimum EBITDA interest cover. The ratios will be tested again starting from 30 June 2014 with the levels of 3.5x and 3.0x respectively.
The risk of breaching financial covenants based on the consolidated figures as at 30 June 2014 and as at 31 December 2014 remains in place. However, management believes that, if necessary, it will be possible to agree with the lending banks and export credit agencies (ECAs) either to further suspend the testing of the financial covenants, or to amend the levels so that the
14
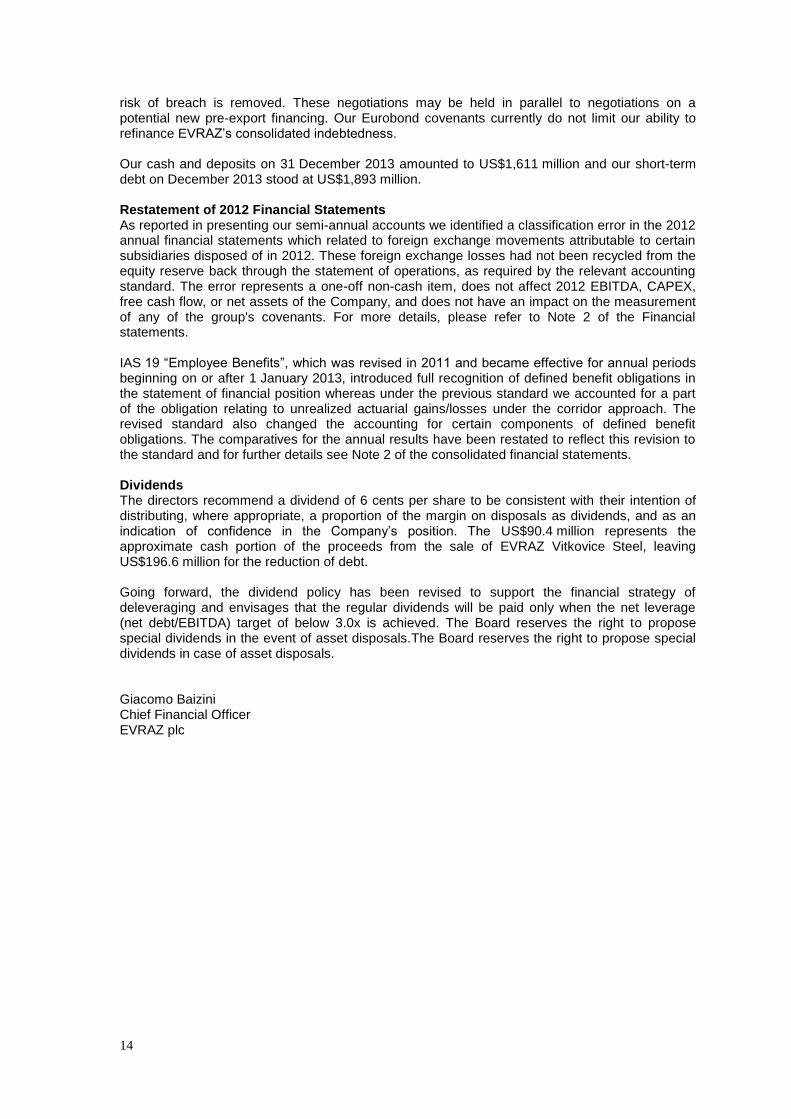
risk of breach is removed. These negotiations may be held in parallel to negotiations on a potential new pre-export financing. Our Eurobond covenants currently do not limit our ability to refinance EVRAZ’s consolidated indebtedness. Our cash and deposits on 31 December 2013 amounted to US$1,611 million and our short-term debt on December 2013 stood at US$1,893 million.
Restatement of 2012 Financial Statements As reported in presenting our semi-annual accounts we identified a classification error in the 2012 annual financial statements which related to foreign exchange movements attributable to certain subsidiaries disposed of in 2012. These foreign exchange losses had not been recycled from the equity reserve back through the statement of operations, as required by the relevant accounting standard. The error represents a one-off non-cash item, does not affect 2012 EBITDA, CAPEX, free cash flow, or net assets of the Company, and does not have an impact on the measurement of any of the group's covenants. For more details, please refer to Note 2 of the Financial statements. IAS 19 “Employee Benefits”, which was revised in 2011 and became effective for annual periods beginning on or after 1 January 2013, introduced full recognition of defined benefit obligations in the statement of financial position whereas under the previous standard we accounted for a part of the obligation relating to unrealized actuarial gains/losses under the corridor approach. The revised standard also changed the accounting for certain components of defined benefit obligations. The comparatives for the annual results have been restated to reflect this revision to the standard and for further details see Note 2 of the consolidated financial statements. Dividends The directors recommend a dividend of 6 cents per share to be consistent with their intention of distributing, where appropriate, a proportion of the margin on disposals as dividends, and as an indication of confidence in the Company’s position. The US$90.4 million represents the approximate cash portion of the proceeds from the sale of EVRAZ Vitkovice Steel, leaving US$196.6 million for the reduction of debt. Going forward, the dividend policy has been revised to support the financial strategy of deleveraging and envisages that the regular dividends will be paid only when the net leverage (net debt/EBITDA) target of below 3.0x is achieved. The Board reserves the right to propose special dividends in the event of asset disposals.The Board reserves the right to propose special dividends in case of asset disposals. Giacomo Baizini Chief Financial Officer EVRAZ plc

15
REVIEW OF OPERATIONS BY SEGMENT STEEL Sales review
Steel Segment Revenues
Year ended 31 December
2013 2012 Change
To third parties 12,432 13,333 (6.8)%
To mining segment 80 129 (38.0)%
To vanadium segment 3 2 50.0%
To other operations 26 79 (67.1)%
Total Steel segment 12,541 13,543 (7.4)%
Steel Segment Revenues by Products
Year ended 31 December
2013 2012*
2013 v
2012
US$
million
% of
total
segment
revenue
US$
million
% of total
segment
revenue
%
change
Steel products, external sales 11,476 91.5% 12,298 90.8% (6.7)%
Semi-finished products1 2,028 16.2% 2,066 15.3% (1.8)%
Construction products2 4,157 33.0% 4,335 32.0% (4.1)%
Railway products3 1,791 14.3% 1,751 12.9% 2.3%
Flat-rolled products4 1,776 14.2% 2,321 17.1% (23.5)%
Tubular products5 1,299 10.4% 1,364 10.1% (4.8)%
Other steel products6 425 3.4% 461 3.4% (7.8)%
Steel products, intersegment sales 46 0.4% 51 0.4% (9.8)%
Other revenues7 1,019 8.1% 1,194 8.8% (14.7)%
Total 12,541 100.0% 13,543 100.0% (7.4)%
* The figures for 2012 differ from those published in FY2012 press release due to reclassification
of sales by EVRAZ North America 1 Includes billets, slabs, pig iron, pipe blanks and other semi-finished products
2 Includes rebars, wire rods, wire, beams, channels and angles
3 Includes rail, wheels, tyres and other railway products
4 Includes commodity plate, specialty plate and other flat-rolled products
5 Includes large diameter line pipes, ERW pipes and casing, seamless pipes, casing and tubing,
other tubular products 6 Includes rounds, grinding balls, mine uprights and strips
7 Includes coke and coking products, refractory products, ferroalloys, scrap, energy, services and
Mapochs mine’s iron ore fines
16
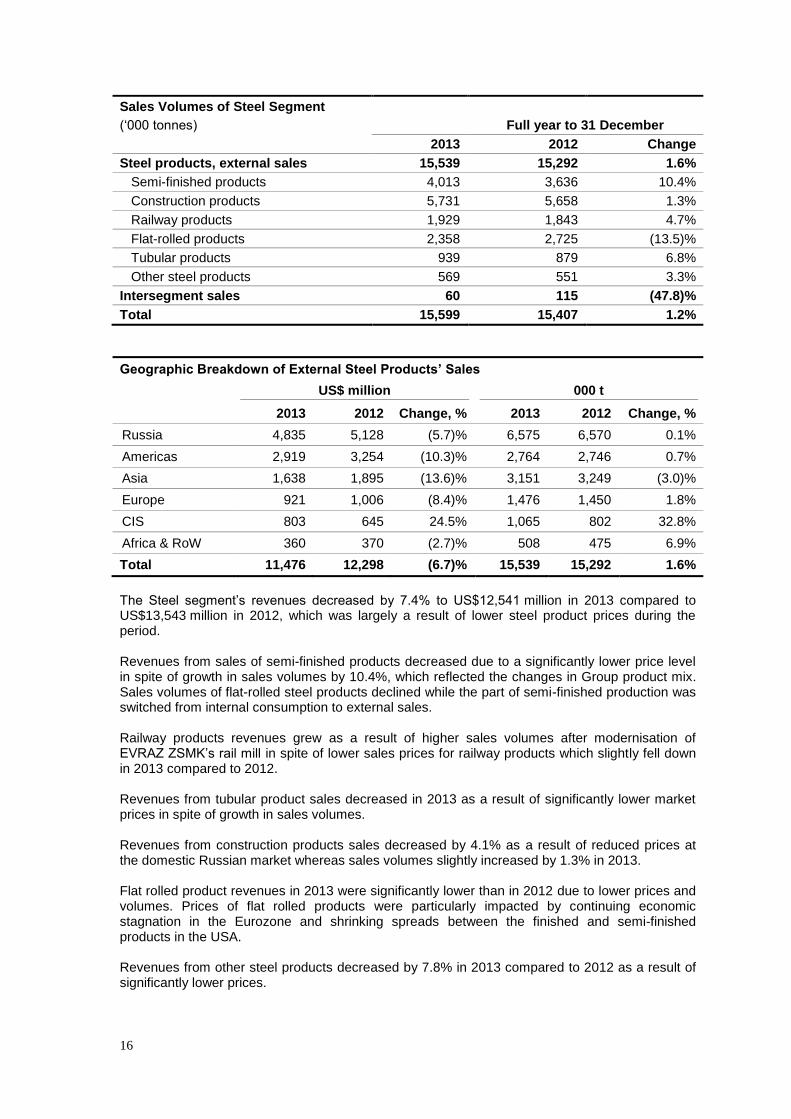
Sales Volumes of Steel Segment
(‘000 tonnes) Full year to 31 December
2013 2012 Change
Steel products, external sales 15,539 15,292 1.6%
Semi-finished products 4,013 3,636 10.4%
Construction products 5,731 5,658 1.3%
Railway products 1,929 1,843 4.7%
Flat-rolled products 2,358 2,725 (13.5)%
Tubular products 939 879 6.8%
Other steel products 569 551 3.3%
Intersegment sales 60 115 (47.8)%
Total 15,599 15,407 1.2%
Geographic Breakdown of External Steel Products’ Sales
US$ million 000 t
2013 2012 Change, % 2013 2012 Change, %
Russia 4,835 5,128 (5.7)% 6,575 6,570 0.1%
Americas 2,919 3,254 (10.3)% 2,764 2,746 0.7%
Asia 1,638 1,895 (13.6)% 3,151 3,249 (3.0)%
Europe 921 1,006 (8.4)% 1,476 1,450 1.8%
CIS 803 645 24.5% 1,065 802 32.8%
Africa & RoW 360 370 (2.7)% 508 475 6.9%
Total 11,476 12,298 (6.7)% 15,539 15,292 1.6%
The Steel segment’s revenues decreased by 7.4% to US$12,541 million in 2013 compared to US$13,543 million in 2012, which was largely a result of lower steel product prices during the period. Revenues from sales of semi-finished products decreased due to a significantly lower price level in spite of growth in sales volumes by 10.4%, which reflected the changes in Group product mix. Sales volumes of flat-rolled steel products declined while the part of semi-finished production was switched from internal consumption to external sales. Railway products revenues grew as a result of higher sales volumes after modernisation of EVRAZ ZSMK’s rail mill in spite of lower sales prices for railway products which slightly fell down in 2013 compared to 2012. Revenues from tubular product sales decreased in 2013 as a result of significantly lower market prices in spite of growth in sales volumes. Revenues from construction products sales decreased by 4.1% as a result of reduced prices at the domestic Russian market whereas sales volumes slightly increased by 1.3% in 2013. Flat rolled product revenues in 2013 were significantly lower than in 2012 due to lower prices and volumes. Prices of flat rolled products were particularly impacted by continuing economic stagnation in the Eurozone and shrinking spreads between the finished and semi-finished products in the USA. Revenues from other steel products decreased by 7.8% in 2013 compared to 2012 as a result of significantly lower prices.
17
Lower revenues from sales in Russia, which accounted for 42% of external steel sales, were mainly attributable to lower prices, whereas sales volumes were stable compared year to year. MINING Sales review
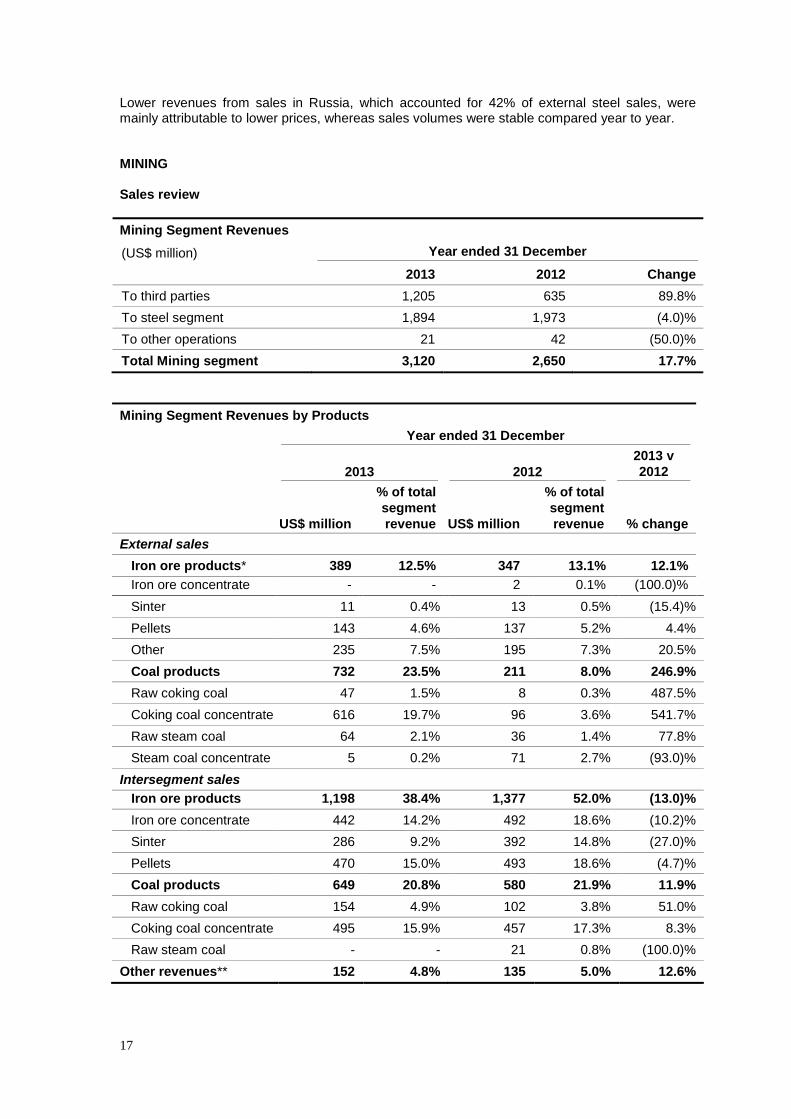
Mining Segment Revenues
(US$ million) Year ended 31 December
2013 2012 Change
To third parties 1,205 635 89.8%
To steel segment 1,894 1,973 (4.0)%
To other operations 21 42 (50.0)%
Total Mining segment 3,120 2,650 17.7%
Mining Segment Revenues by Products
Year ended 31 December
2013 2012
2013 v
2012
US$ million
% of total
segment
revenue US$ million
% of total
segment
revenue % change
External sales
Iron ore products* 389 12.5% 347 13.1% 12.1%
Iron ore concentrate - - 2 0.1% (100.0)%
Sinter 11 0.4% 13 0.5% (15.4)%
Pellets 143 4.6% 137 5.2% 4.4%
Other 235 7.5% 195 7.3% 20.5%
Coal products 732 23.5% 211 8.0% 246.9%
Raw coking coal 47 1.5% 8 0.3% 487.5%
Coking coal concentrate 616 19.7% 96 3.6% 541.7%
Raw steam coal 64 2.1% 36 1.4% 77.8%
Steam coal concentrate 5 0.2% 71 2.7% (93.0)%
Intersegment sales
Iron ore products 1,198 38.4% 1,377 52.0% (13.0)%
Iron ore concentrate 442 14.2% 492 18.6% (10.2)%
Sinter 286 9.2% 392 14.8% (27.0)%
Pellets 470 15.0% 493 18.6% (4.7)%
Coal products 649 20.8% 580 21.9% 11.9%
Raw coking coal 154 4.9% 102 3.8% 51.0%
Coking coal concentrate 495 15.9% 457 17.3% 8.3%
Raw steam coal - - 21 0.8% (100.0)%
Other revenues** 152 4.8% 135 5.0% 12.6%

18
Mining Segment Revenues by Products
Year ended 31 December
2013 2012
2013 v
2012
US$ million
% of total
segment
revenue US$ million
% of total
segment
revenue % change
Total 3,120 100.0% 2,650 100.0% 17.7% * External sales of iron ore produced at the Mapochs mine, part of EVRAZ Highveld, are
accounted for in the Steel segment ** Includes crushed stone
Sales Volumes of Mining Segment
(‘000 tonnes)
2013 2012 Change
External sales
Iron ore products 4,371 3,900 12.1%
Iron ore concentrate 2 22 (90.9)%
Sinter 108 111 (2.7)%
Pellets 1,257 1,201 4.7%
Other 3,004 2,566 17.1%
Coal products 8,189 2,189 274.1%
Raw coking coal 784 162 384.0%
Coking coal concentrate 6,133 701 774.9%
Raw steam coal 1,220 729 67.4%
Steam coal concentrate 52 597 (91.3)%
Intersegment sales
Iron ore products* 13,463 14,737 (8.6)%
Iron ore concentrate 4,701 5,565 (15.5)%
Sinter 3,724 4,295 (13.3)%
Pellets 5,038 4,872 3.4%
Other - 5 (100.0)%
Coal products 7,185 5,376 33.6%
Raw coking coal 2,602 1,439 80.8%
Coking coal concentrate 4,579 3,285 39.4%
Raw steam coal - 652 (100.0)%
Steam coal concentrate 4 - n/a
Total, iron ore products* 17,834 18,637 (4.3)%
Total, coal products 15,374 7,565 103.2%
* External sales of iron ore produced at the Mapochs mine, part of EVRAZ Highveld, are
accounted for in the Steel segment
Total mining segment revenues increased by 17.7% to US$3,120 million in 2013 compared to US$2,650 million in 2012, primarily as a result of additional volumes from the consolidation of Raspadskaya in January 2013, which offset the decrease in iron ore and coking coal prices. External sales volumes of iron ore products increased by 12.1% in 2013 compared to 2012, driven by higher volumes from EVRAZ Sukha Balka. Intersegment sales volumes decreased by 8.6% as a result of disposal of EVRAZ VGOK in October 2013. The closure of the Irba mine at Evrazruda also contributed to lower iron ore volumes being supplied to the Steel segment.
19
External sales volumes of coal products increased in 2013 by 274.1% due to an additional 4 million tonnes of coking coal concentrate from Raspadskaya and higher sales of coking coal concentrate after involvement of the second longwalls at Alardinskaya and start of production from Yerunakovskaya VIII. Steam coal volumes decreased by 4% as a result of stem coal production optimisation in 2013. In 2013, Mining segment sales to the Steel segment amounted to US$1,894 million and 60.7% of sales, compared to US$1,973 million and 74.5% of sales in 2012. The lower share of sales to the Steel segment reflects the additional coal volumes sold to market from Raspadskaya. During the period, approximately 68% and 80% of EVRAZ’s respective iron ore and coking consumption were satisfied by the Group’s own operations compared with 74% and 70% (including coal from Raspadskaya) in 2012. Third party sales of coal products by the Mining segment to customers in Russia in 2013 increased to approximately 53% of total external sales of coal products compared to 2012. The increase is primarily attributable to the consolidation of Raspadskaya in 2013. Approximately 55% of external sales of Raspadskaya in 2013 were to customers in Russia. VANADIUM Sales review
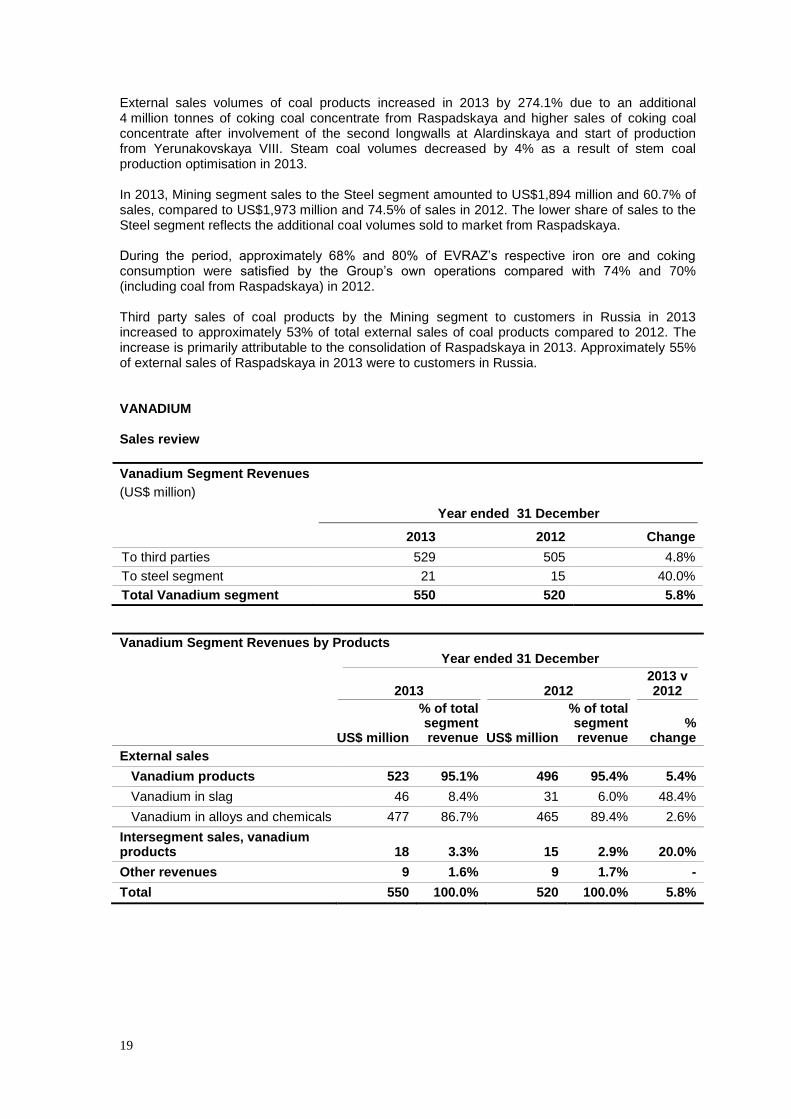
Vanadium Segment Revenues
(US$ million)
Year ended 31 December
2013 2012 Change
To third parties 529 505 4.8%
To steel segment 21 15 40.0%
Total Vanadium segment 550 520 5.8%
Vanadium Segment Revenues by Products
Year ended 31 December
2013 2012 2013 v 2012
US$ million
% of total segment revenue US$ million
% of total segment revenue
% change
External sales
Vanadium products 523 95.1% 496 95.4% 5.4%
Vanadium in slag 46 8.4% 31 6.0% 48.4%
Vanadium in alloys and chemicals 477 86.7% 465 89.4% 2.6%
Intersegment sales, vanadium products 18 3.3% 15 2.9% 20.0%
Other revenues 9 1.6% 9 1.7% -
Total 550 100.0% 520 100.0% 5.8%

20
Sales volumes of vanadium segment
(tonnes of pure Vanadium)
2013 2012 Change
External sales
Vanadium products 23,287 21,100 10.4%
Vanadium in slag 6,264 3,253 92.6%
Vanadium in alloys and chemicals 17,023 17,847 (4.6)%
Intersegment sales 215 438 (50.9)%
Total 23,502 21,538 9.1%
Vanadium segment revenues increased by 5.8% to US$550 million in 2013 compared to US$520 million in 2012 reflecting increase in sales prices of vanadium products. Sales of vanadium slag by EVRAZ NTMK to China and Austria increased significantly in 2013. Sales volumes in 2012 were relatively low due to the time that was required to receive an export license and difficult market conditions. OTHER BUSINESSES EVRAZ’s other operations include trading, logistics, port services, electricity and heat generation and other auxiliary activities. Sales review
(US$ million) Year ended 31 December
2013 2012 Change
To third parties 246 253 (2.8)%
To steel segment 444 568 (21.8)%
To mining segment 238 225 5.8%
Total Other operations segment 928 1,046 (11.3)%
Revenues from other operations decreased by 11.3% to US$928 million in 2013 as compared to US$1,046 million in 2012, principally driven by the disposal of Evraztrans. Revenue of other operations segment includes the following (sales figures shown below include sales within the same segment):
Sales of EVRAZ Nakhodka Trade Sea Port, which provides various sea port services to the Company, totaled US$93 million in 2013 and US$92 million in 2012.
Metallenergofinance (“MEF”) supplies electricity to EVRAZ’s steel and mining segments as well as third parties. MEF’s sales amounted to US$469 million in 2013 compared to US$381 million in 2012. Intersegment sales accounted for 77% and 87% of MEF’s revenue in 2013 and 2012 respectively. ZabSibTets generates electricity and heating. Most sales are classified as intersegment for purpose to supply internal energy requirements of EVRAZ ZSMK. Sales were US$124 million in 2013, compared to US$187 million in 2012.
Evraztrans acted as a railway transport provider for EVRAZ’s steel segment. Sales of Evraztrans (including Russian and Ukrainian operations) amounted to US$145 million in 2012.
21
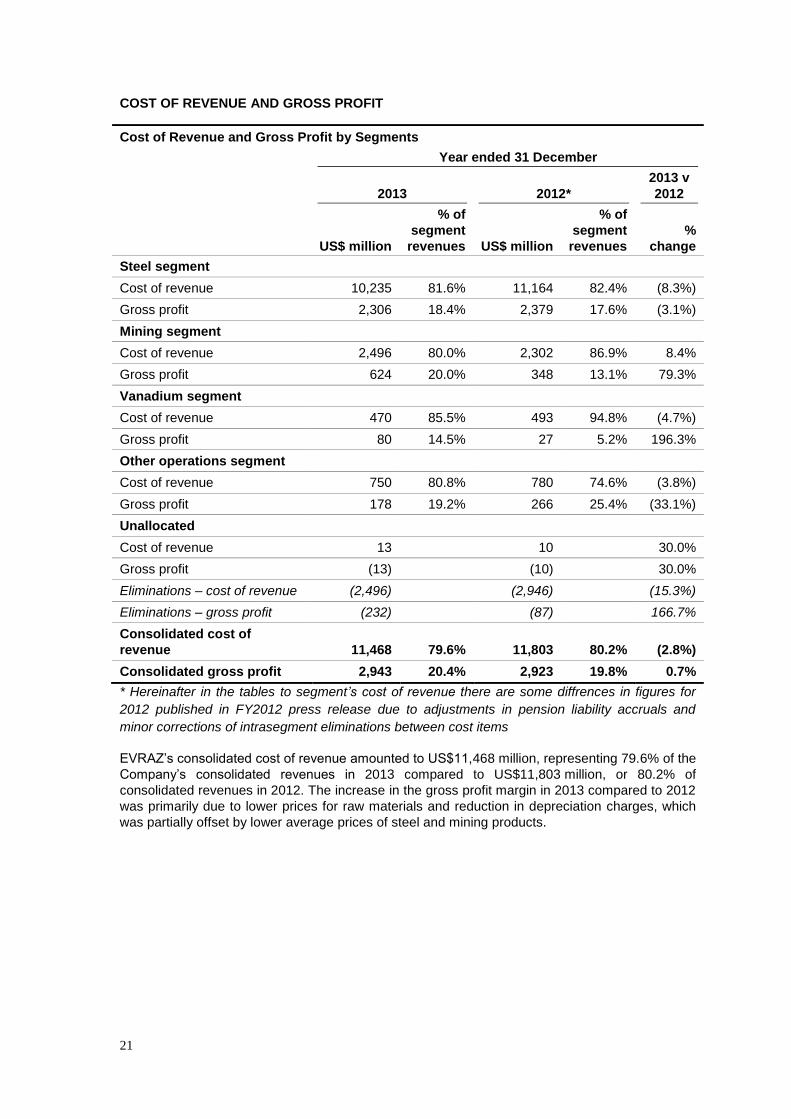
COST OF REVENUE AND GROSS PROFIT
Cost of Revenue and Gross Profit by Segments
Year ended 31 December
2013 2012*
2013 v
2012
US$ million
% of
segment
revenues US$ million
% of
segment
revenues
%
change
Steel segment
Cost of revenue 10,235 81.6% 11,164 82.4% (8.3%)
Gross profit 2,306 18.4% 2,379 17.6% (3.1%)
Mining segment
Cost of revenue 2,496 80.0% 2,302 86.9% 8.4%
Gross profit 624 20.0% 348 13.1% 79.3%
Vanadium segment
Cost of revenue 470 85.5% 493 94.8% (4.7%)
Gross profit 80 14.5% 27 5.2% 196.3%
Other operations segment
Cost of revenue 750 80.8% 780 74.6% (3.8%)
Gross profit 178 19.2% 266 25.4% (33.1%)
Unallocated
Cost of revenue 13 10 30.0%
Gross profit (13) (10) 30.0%
Eliminations – cost of revenue (2,496) (2,946) (15.3%)
Eliminations – gross profit (232) (87) 166.7%
Consolidated cost of
revenue 11,468 79.6% 11,803 80.2% (2.8%)
Consolidated gross profit 2,943 20.4% 2,923 19.8% 0.7%
* Hereinafter in the tables to segment’s cost of revenue there are some diffrences in figures for
2012 published in FY2012 press release due to adjustments in pension liability accruals and
minor corrections of intrasegment eliminations between cost items
EVRAZ’s consolidated cost of revenue amounted to US$11,468 million, representing 79.6% of the
Company’s consolidated revenues in 2013 compared to US$11,803 million, or 80.2% of
consolidated revenues in 2012. The increase in the gross profit margin in 2013 compared to 2012
was primarily due to lower prices for raw materials and reduction in depreciation charges, which
was partially offset by lower average prices of steel and mining products.

22
Steel Segment Cost of Revenue
Year ended 31 December
2013 2012
2013 v
2012
US$ million
% of
segment
revenue
US$ million
% of
segment
revenue
% change
Cost of revenue 10,235 81.6% 11,164 82.4% (8.3%)
Raw materials 5,205 41.5% 5,757 42.5% (9.6%)
Iron ore 1,941 15.5% 1,992 14.7% (2.6%)
Coking coal 1,220 9.7% 1,508 11.1% (19.1%)
Scrap 1,332 10.6% 1,569 11.6% (15.1%)
Other raw materials 712 5.7% 688 5.1% 3.5%
Semi-finished products 450 3.5% 478 3.5% (5.9%)
Transportation 496 4.0% 551 4.1% (10.0%)
Staff costs 1,083 8.6% 1,062 7.8% 2.0%
Depreciation 451 3.6% 452 3.3% (0.2%)
Energy 911 7.3% 909 6.7% 0.2%
Other* 1,639 13.1% 1,955 14.5% (16.2%)
* Includes repairs and maintenance, industrial services, auxiliary materials, goods for resale, taxes
in cost of revenue, and effect of changes in work-in-progress and finished goods inventories.
EVRAZ’s steel segment cost of revenue decreased to US$10,235 million or 81.6% of steel segment revenue in 2013, compared to US$11,164 million or 82.4% of steel segment revenue in 2012. The principal factors affecting the change in the steel segment cost of revenue, in absolute terms, in 2013 compared to 2012 were as follows:
Raw material costs decreased by 9.6% due to a decline in prices for all main raw materials (particularly coking coal and scrap). Other factor influencing this decrease was the disposal of DKHZ (consumption of coal in 2012 of US$84 million).
Costs of semi-finished products decreased by 5.9% primarily due to lower prices and lower consumption of pig iron by EVRAZ Vitkovice Steel as result of lower production volumes.
Transportation costs decreased by 10.0%. This decrease was partially attributable to lower intrasegment sales and related transportation costs.
Staff costs increased by 2.0% largely due to higher wages and salaries of production staff in accordance with the trade union agreements.
Depreciation and depletion costs are in line with 2012. Increased depreciation costs at EVRAZ ZSMK due to cessation of capitalisation of expenses following the completion of EVRAZ ZSMK rail mill modernisation investment project offset stoppage of depreciation cost accrual at the assets classified as held for sale (EVRAZ Highveld Steel and Vanadium Limited and EVRAZ Vitkovice Steel).
Energy costs increased by 0.2%. The increase of electricity and natural gas prices was almost offset by reduced consumption volume of natural gas at NTMK (US$(21) million) as a result of PCI implementation and consumption of own produced coke gas at DMZ due to technological changes.

23
Other costs decreased by 16.2% primarily due to an increase in stock of WIP and finished goods.
Steel segment gross profit decreased by 3.1% to US$2,306 million in 2013 from US$2,379 million in 2012. Gross profit margin amounted to 18.4% of steel segment revenue in 2013 compared with 17.6% in the corresponding period last year, reflecting the decline in steel segment revenues by 7.4%, while cost of revenues decrease by 8.3%.
Mining Segment Cost of Revenue and Gross Profit
Year ended 31 December
2013 2012 2013 v 2012
US$ million
% of
segment
revenue US$ million
% of
segment
revenue % change
Cost of revenue 2,496 80.0% 2,302 86.9% 8.4%
Raw materials 92 2.9% 127 4.8% (27.6%)
Transportation 337 10.8% 267 10.1% 26.2%
Staff costs 717 23.0% 548 20.7% 30.8%
Depreciation 426 13.7% 593 22.4% (28.2%)
Energy 300 9.6% 260 9.8% 15.4%
Other* 624 20.0% 507 19.1% 23.1%
* Includes primarily contractor services and materials for maintenance and repairs and certain
taxes
The mining segment cost of revenue increased to US$2,496 million or 80.0% of mining segment revenue in 2013 compared with US$2,302 million or 86.9% of mining segment revenue in 2012. The principal factors affecting the change in mining segment cost of revenue, in absolute terms, in 2013 compared to 2012 were:
Raw material costs decreased by 27.6% primarily due to switch to a tolling scheme of sinter production by EVRAZ VGOK instead of purchasing the raw material from EVRAZ NTMK (-US$26 million), and decrease of coke consumption by EVRAZ VGOK (-US$6 million) due to disposal in October 2013.
Transportation costs increased by 26.2% due to the consolidation of Raspadskaya (+US$45 million), higher intercompany sales and related transportation costs.
Staff costs increased by 30.8%. The increase was largely attributable to consolidation of Raspadskaya (US$133 million) and the increase in wages and salaries in accordance with trade union agreements.
Depreciation and depletion costs decreased by 28.2% mainly due to a lower depreciation and depletion expense at Yuzhkuzbassugol caused by the revision and detailing of mining plans as part of the independent JORC valuations performed during the year (net effect of US$189 million) and a significant reduction in depreciaton at Evrazruda due to impairment of assets (net effect of US$43 million). This decrease was partially offset by an increase of depreciation due to consolidation of Raspadskaya (US$109 million).
Energy costs increased by 15.4% primarily due to higher electricity and natural gas prices, the consolidation of Raspadskaya (US$16 million) and higher production volumes at Yuzhkuzbassugol and EVRAZ KGOK.
Other costs increased by 23.1%, primarily due to an increase of auxiliary material costs and expenditure on services as result of consolidating Raspadskaya (US$153 million) and higher processed volumes of concentrate at third party facilities by Yuzhkuzbassugol (US$33 million).

24
This increase was partially offset by lower repairs and maintenance costs as well as decrease of other costs due to disposal of EVRAZ VGOK and closure of the Irba mine.
The Mining segment’s gross profit increased to US$624 million in 2013 from US$348 million in 2012. The increase in the gross profit margin was primarily attributable to lower depreciation and depletion at Yuzhkuzbassugol, and additional gross profit from consolidation of Raspadskaya (US$38 million).
Vanadium Segment Cost of Revenue and Gross Profit
Year ended 31 December
2013 2012 2013 v 2012
US$ million
% of
segment
revenue
US$ million
% of
segment
revenue
% change
Cost of revenue 470 85.5% 493 94.8% (4.7%)
Raw materials 180 32.7% 189 36.3% (4.8%)
Staff costs 71 12.9% 65 12.5% 9.2%
Depreciation 12 2.2% 22 4.2% (45.5%)
Energy 73 13.3% 68 13.1% 7.4%
Other 134 24.4% 149 28.7% (10.1%)
The vanadium segment cost of revenue decreased by 4.7% to US$470 million, or 85.5% of vanadium segment revenue in 2013 from US$493 million, or 94.8% of vanadium segment revenue in 2012. The decrease in EVRAZ’s vanadium segment’s cost of revenue in 2013 as compared to 2012, in absolute terms, was attributable to a decrease in sales volumes of vanadium in alloys and chemicals and the depreciation of the South African Rand against the U.S. dollar (-18%), a large part of the costs was denominated in this currency. In 2013, gross profit of EVRAZ’s vanadium segment increased to US$80 million compared with US$27 million in 2012 primarily due to higher prices for final vanadium products and depreciation of the South African Rand. Other operations segment Cost of Revenue and Gross Profit The other operations segment’s cost of revenue amounted to 80.8% of other operations revenue, or US$750 million in 2013 compared to 74.6%, or US$780 million in 2012. The major components of cost of revenue at EVRAZ Nakhodka Trade Sea Port are staff and inventory costs. The major component of MEF’s cost of revenue is the purchase of electricity from power generating companies. The major components of ZapSib Power Plant’s and Central Heat and Power Plant’s cost of revenue are steam coal for power generation, depreciation and staff costs, while the major component of Sinano’s cost of revenue is ship hire fees. PRINCIPAL RISKS AND UNCERTAINTIES
Like all businesses, EVRAZ is affected by, and must manage, risks and uncertainties that can impact its ability to deliver its strategy. While the risks can be numerous, the principal risks faced by the Group as identified by the Board are described below along with the corresponding mitigating actions and changes in the risk level during the year. To date the Group has not been significantly impacted by recent geopolitical developments relating to Ukraine. There is a risk, however, that, if these events were to escalate, there could be

25
an impact on EVRAZ's operations in the country (EVRAZ generated 7% of consolidated revenue from its Ukrainian business). In addition, EVRAZ may be affected by government sanctions if they are broadened from the current level.
Risk Risk description Risk level 2012 – 2013 and
Mitigating actions
Global economic
factors, industry
conditions and cost
effectiveness
EVRAZ Steel, Mining and Vanadium operations are highly dependent and sensitive to the global macroeconomic environment, economic and industry conditions, eg global supply/demand balance for steel and particularly for iron ore and coking coal which has the potential to significantly affect both product prices and volumes across domestic and export markets. As EVRAZ’s operations have a high level of fixed costs, global economic and industry conditions can impact the Company’s operational performance and liquidity.
Risk direction:
EVRAZ has a focused
investment policy aimed at
reducing and managing the
cost base with the objective
of being among the sector’s
lowest cost producers.
Health, safety and
environmental (HSE)
issues
Safety and environmental risks are inherent to the Company’s principal business activities of steelmaking and mining. Furthermore, EVRAZ operations are subject to a wide range of HSE laws, regulations and standards, the breach of any of which may result in fines, penalties or other sanctions. Such actions could have a material adverse effect on the Company’s business, financial condition and business prospects.
Risk direction:
HSE issues have direct
oversight at Board level and
HSE procedures and
material issues are given top
priority at all internal
management level meetings.
Management KPIs include a
material factor for safety
performance. EVRAZ has
instigated a programme to
improve the management of
safety risks across all
business units with the
objective of embedding a
new safety, harm-free
culture at all management
and operational levels.
Safety training has been
reviewed and strengthened
and an operational safety
assessment is undertaken
for all new projects.

26
Risk Risk description Risk level 2012 – 2013 and
Mitigating actions
Dependency on certain
key markets
The Company’s profitability is highly dependent on limited geographical markets, i.e. 43% of EVRAZ revenues are derived from Russia, and 22% from North America; and also dependent on the mix between semi-finished and finished steel products.
Risk direction:
The strategic risks and
opportunities within these
regions are regularly
reviewed, including
consideration of the quality
and nature of the
Company’s product portfolio,
relative cost effectiveness
and the sustainability of
industry sector market
positioning together with
effective in-house (EVRAZ
Metall Inprom) and external
distribution networks.
Capital projects and
expenditure
EVRAZ’s maintenance and development capital expenditure, in addition to capital expenditure focused on improving the Company’s cost effectiveness, is aligned to the Company’s and external market expectations for each particular project and to maximise levels of investment returns. Economic issues outside those factored into the Company’s business plans including regulatory approvals, may negatively impact the Company’s anticipated free cash flow and cause certain elements of the planned capital expenditure to be re-phased, deferred or abandoned with consequential impact on the Company’s planned future performance.
Risk direction:
Project delivery is closely
monitored against project
plans resulting in high level
action to manage project
investment both for timely
delivery and for planned
project expenditure.
In the course of 2013 the
Company revisited key
assumptions of the main
investment projects and
performed scenario analysis,
which resulted in the
suspension and/or
postponement of certain
projects.
Human Resources The principal HR risk is the quality and availability of critical operational and business skills of EVRAZ management and employees, particularly in certain regions and for particular business units, eg mining professionals including engineers, mining experts and project managers. Associated risks involve selection, recruitment, training and retention of employees and qualified executives.
Risk direction:
Succession planning is a
key feature of EVRAZ’s
human resources
management. EVRAZ seeks
to meet its leadership and
skill needs through retention
of its employees, internal
promotion, structured
professional internal

27
Risk Risk description Risk level 2012 – 2013 and
Mitigating actions
There is also a risk of employee union action. Union relations are largely stable, although the Company had a short-lived labour action at its vanadium operations in South Africa in 2013, and an extended period of negotiations with certain labour unions in Russia. As a result of HR risks, the Company’s growth plans might be jeopardised.
mentoring and external
development programmes.
Potential Actions by
Governments
EVRAZ operates in a number of countries and there is a risk that governments or government agencies could adopt new laws and regulations, or otherwise impact the Company’s operations. New laws, regulations or other
requirements could have the effect
of limiting the Company’s ability to
obtain financing in international
markets, or selling its products.
Risk direction:
Although these risks are
mostly not within the
Company’s control, EVRAZ
and its executive teams are
members of various national
industry bodies and, as a
result, contribute to the
thinking of such bodies and,
when appropriate,
participate in relevant
discussions with political and
regulatory authorities.
Business Interruption Prolonged outages or production
delays, especially in coal mining,
could have a material adverse
effect on the Company’s operating
performance, production, financial
condition and future prospects. In
addition, long term business
interruption may result in loss of
customers, competitive advantage
being compromised and damage to
the Company’s reputation.
Risk direction:
The Company has defined
and established business
continuity plans, procedures
and protocols which are
subject to regular review and
audit of their
appropriateness and
effectiveness. The Company
carries certain business
interruption insurance,
except for particular mining
events.
Business interruptions in
mining mainly relate to
production safety. Measures
to mitigate these risks
include methane monitoring
and degasing systems,
timely mining equipment

28
Risk Risk description Risk level 2012 – 2013 and
Mitigating actions
maintenance, employee
safety training.
In 2013 EVRAZ had to
suspend mining works at the
Raspadskaya underground
mine in May-July due to
increased levels of carbon
monoxide. A set of safety
measures was undertaken in
order to alleviate the causes
of hazards.
Treasury EVRAZ, as with many other large and multi-national corporates, faces various treasury risks including liquidity, credit access, currency fluctuations, and interest rate and tax compliance risks.
Risk direction:
EVRAZ employs skilled
specialists to manage and
mitigate such risks and the
management of such risks is
embedded in internal
controls. Oversight of the
key risks is reported within
the monthly Board reports
and by the review of
compliance of such internal
controls by a management
independent internal audit
function, which reports to the
Audit Committee on a
monthly basis.
In 2013 EVRAZ undertook
certain actions in order to
extend the debt maturity
profile and lower short term
external funding needs, i.e.
through issuing US$1,000
million Eurobonds due in
2020, as well as. proactively
managing the remaining
portion of debt subject to
maintenance covenants.
The EVRAZ Treasury
management team and the
directors regularly and pro-
actively review all funding
requirements and
exposures.
29
Risk Risk description Risk level 2012 – 2013 and
Mitigating actions
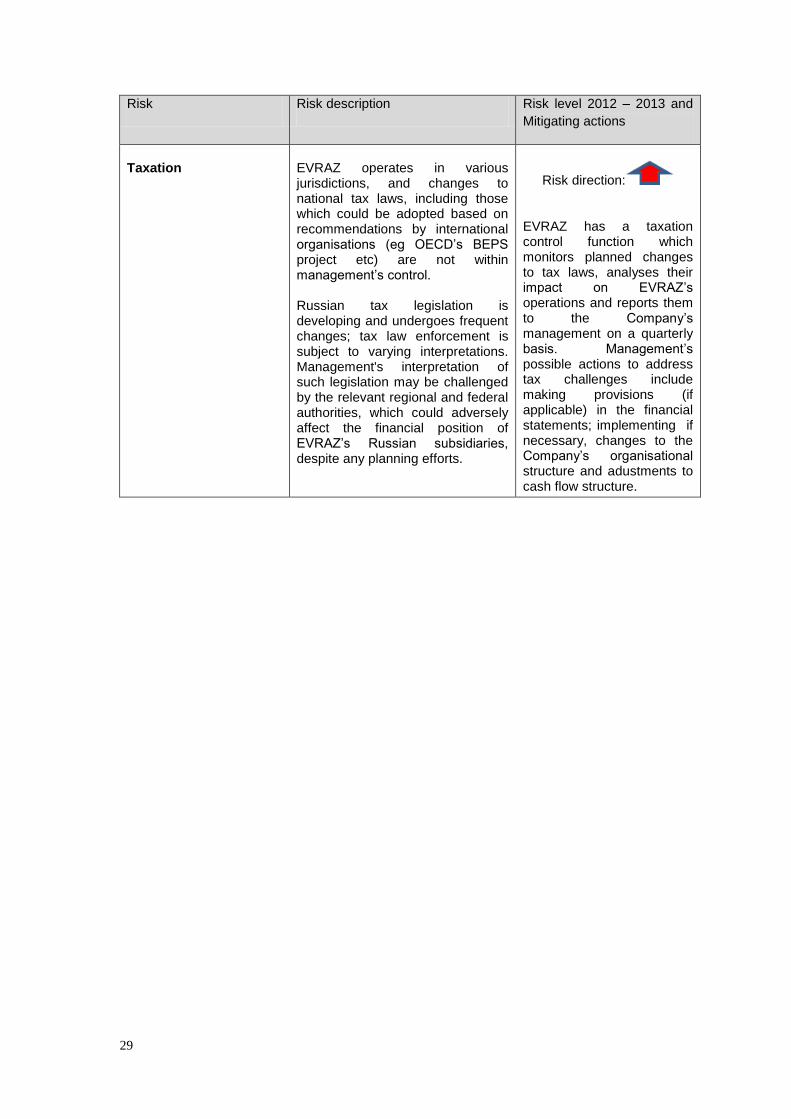
Taxation
EVRAZ operates in various jurisdictions, and changes to national tax laws, including those which could be adopted based on recommendations by international organisations (eg OECD’s BEPS project etc) are not within management’s control. Russian tax legislation is developing and undergoes frequent changes; tax law enforcement is subject to varying interpretations. Management's interpretation of such legislation may be challenged by the relevant regional and federal authorities, which could adversely affect the financial position of EVRAZ’s Russian subsidiaries, despite any planning efforts.
Risk direction:
EVRAZ has a taxation control function which monitors planned changes to tax laws, analyses their impact on EVRAZ’s operations and reports them to the Company’s management on a quarterly basis. Management’s possible actions to address tax challenges include making provisions (if applicable) in the financial statements; implementing if necessary, changes to the Company’s organisational structure and adustments to cash flow structure.
30
STATEMENT OF DIRECTORS’ RESPONSIBILITIES
Each of the directors listed in the Governance section of the Annual report confirm that to the best
of their knowledge:
the consolidated financial statements of EVRAZ plc, prepared in accordance with International
Financial Reporting Standards as adopted by the European Union, give a true and fair view of
the assets, liabilities, financial position and profit or loss of the Company and the undertakings
included in the consolidation taken as a whole (the ‘Group’);
the Annual Report and Accounts, including the Strategic Report include a fair review of the
development and performance of the business and the position of the Company and the
Group, together with a description of the principal risks and uncertainties that they face.
By order of the Board
Alexander Frolov
Chief Executive Officer
EVRAZ
31
Appendix 1
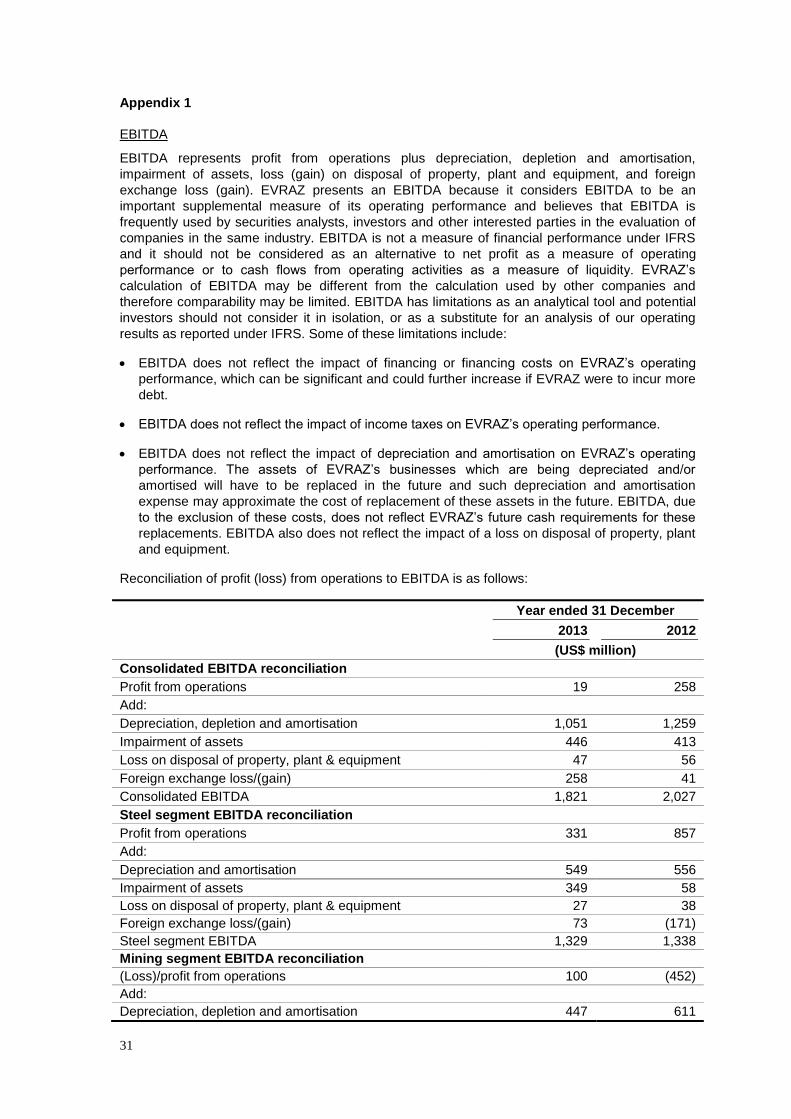
EBITDA
EBITDA represents profit from operations plus depreciation, depletion and amortisation,
impairment of assets, loss (gain) on disposal of property, plant and equipment, and foreign
exchange loss (gain). EVRAZ presents an EBITDA because it considers EBITDA to be an
important supplemental measure of its operating performance and believes that EBITDA is
frequently used by securities analysts, investors and other interested parties in the evaluation of
companies in the same industry. EBITDA is not a measure of financial performance under IFRS
and it should not be considered as an alternative to net profit as a measure of operating
performance or to cash flows from operating activities as a measure of liquidity. EVRAZ’s
calculation of EBITDA may be different from the calculation used by other companies and
therefore comparability may be limited. EBITDA has limitations as an analytical tool and potential
investors should not consider it in isolation, or as a substitute for an analysis of our operating
results as reported under IFRS. Some of these limitations include:
EBITDA does not reflect the impact of financing or financing costs on EVRAZ’s operating
performance, which can be significant and could further increase if EVRAZ were to incur more
debt.
EBITDA does not reflect the impact of income taxes on EVRAZ’s operating performance.
EBITDA does not reflect the impact of depreciation and amortisation on EVRAZ’s operating
performance. The assets of EVRAZ’s businesses which are being depreciated and/or
amortised will have to be replaced in the future and such depreciation and amortisation
expense may approximate the cost of replacement of these assets in the future. EBITDA, due
to the exclusion of these costs, does not reflect EVRAZ’s future cash requirements for these
replacements. EBITDA also does not reflect the impact of a loss on disposal of property, plant
and equipment.
Reconciliation of profit (loss) from operations to EBITDA is as follows:
Year ended 31 December
2013 2012
(US$ million)
Consolidated EBITDA reconciliation
Profit from operations 19 258
Add:
Depreciation, depletion and amortisation 1,051 1,259
Impairment of assets 446 413
Loss on disposal of property, plant & equipment 47 56
Foreign exchange loss/(gain) 258 41
Consolidated EBITDA 1,821 2,027
Steel segment EBITDA reconciliation
Profit from operations 331 857
Add:
Depreciation and amortisation 549 556
Impairment of assets 349 58
Loss on disposal of property, plant & equipment 27 38
Foreign exchange loss/(gain) 73 (171)
Steel segment EBITDA 1,329 1,338
Mining segment EBITDA reconciliation
(Loss)/profit from operations 100 (452)
Add:
Depreciation, depletion and amortisation 447 611

32
Year ended 31 December
2013 2012
(US$ million)
Impairment of assets 86 354
Loss on disposal of property, plant & equipment 19 17
Foreign exchange loss/(gain) (6) 95
Mining segment EBITDA 646 625
Vanadium segment EBITDA reconciliation
(Loss)/profit from operations 3 (67)
Add:
Depreciation and amortisation 14 47
Loss on disposal of property, plant & equipment 1 1
Foreign exchange (gain)/loss 1 -
Vanadium segment EBITDA 19 (19)
Other operations EBITDA reconciliation
Profit from operations 64 150
Add:
Depreciation and amortisation 35 38
Impairment of assets 11 1
Other operations EBITDA 110 189
Unallocated EBITDA reconciliation
Loss from operations (422) (323)
Add:
Depreciation and amortisation 6 7
Foreign exchange (gain)/loss 190 117
Unallocated EBITDA (226) (199)
Intersegment eliminations
Eliminations of intersegment EBITDA (57) 93
Appendix 2
Cash and short-term bank deposits
Cash and short-term bank deposits is not a measure under IFRS and it should not be considered
as an alternative to other measures of financial position. EVRAZ’s calculation of Cash and short-
term bank deposits may be different from the calculation used by other companies and therefore
comparability may be limited.
31 December 2013 31 December 2012
(US$ million)
Cash and short-term bank deposits
Calculation
Cash and cash equivalents 1,576 1,320
Cash of disposal groups classified as held for sale 35 70
Short-term bank deposits - 674
Cash and short-term bank deposits 1,611 2,064

33
Appendix 3
Free Cash Flow
Free Cash Flow represents EBITDA, net of non-cash items, less changes in working capital,
income tax paid, interest paid and covenant reset charges, conversion premiums, premiums on
early repurchase of bonds and realised gain on swaps, interest income and debt issue costs, less
capital expenditure, short-term deposits of acquiree (at the date of business combination),
purchases of subsidiaries, net of cash acquired, proceeds from sale of disposal groups classified
as held for sale, net of transaction costs, plus other cash flows from investing activities. Free
Cash Flow is not a measure under IFRS and it should not be considered as an alternative to other
measures of financial position. EVRAZ’s calculation of Free Cash Flow may be different from the
calculation used by other companies and therefore comparability may be limited.
Free Cash Flow has been calculated as follows:
Calculation of Free Cash Flow
(US$ million)
Item 2013
EBITDA 1,821
Non-cash items (37)
EBITDA (excluding non-cash items) 1,784
Changes in working capital 365
Income tax paid (249)
Net Cash flows from operating activities 1,900
Net interest and similar payments (501)
Capital expenditure (902)
Purchases of subsidiaries (net of cash acquired) and interests in
associates/joint ventures (30)
Proceeds from sale of disposal groups classified as held for sale, net of
transaction costs 1
Other cash flows from investing activities (10)
Free Cash Flow 458
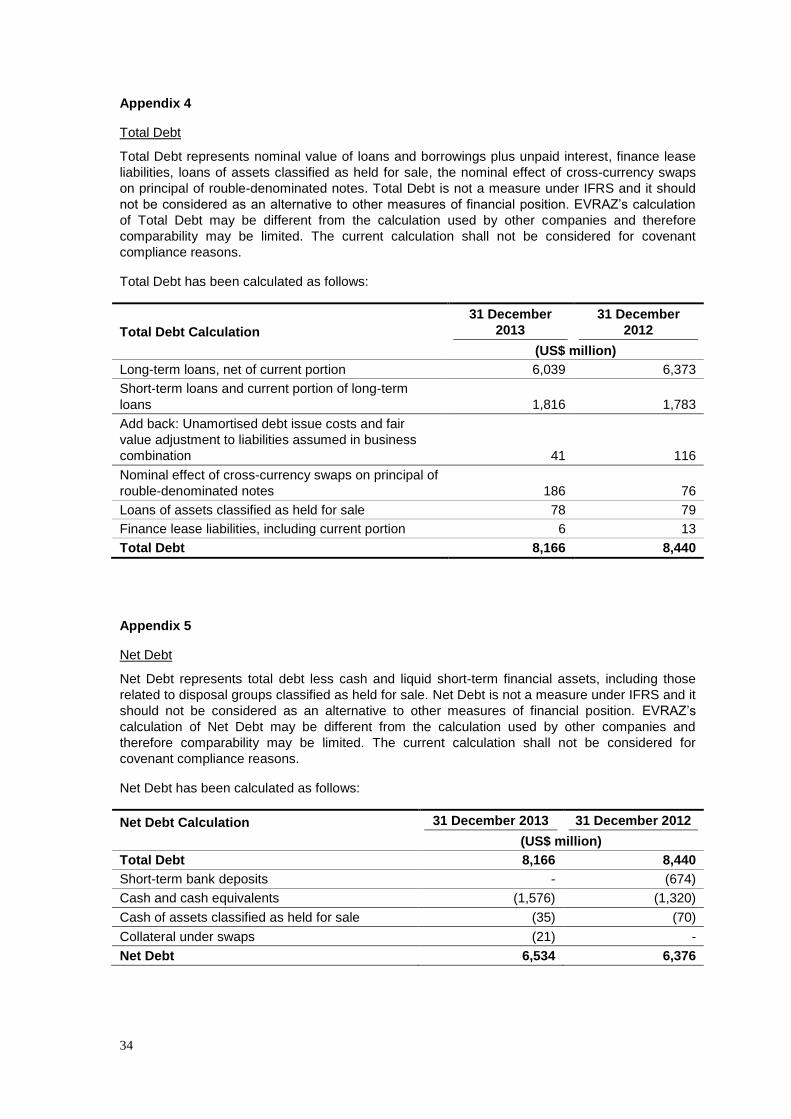
34
Appendix 4
Total Debt
Total Debt represents nominal value of loans and borrowings plus unpaid interest, finance lease
liabilities, loans of assets classified as held for sale, the nominal effect of cross-currency swaps
on principal of rouble-denominated notes. Total Debt is not a measure under IFRS and it should
not be considered as an alternative to other measures of financial position. EVRAZ’s calculation
of Total Debt may be different from the calculation used by other companies and therefore
comparability may be limited. The current calculation shall not be considered for covenant
compliance reasons.
Total Debt has been calculated as follows:
Total Debt Calculation
31 December
2013
31 December
2012
(US$ million)
Long-term loans, net of current portion 6,039 6,373
Short-term loans and current portion of long-term
loans 1,816 1,783
Add back: Unamortised debt issue costs and fair
value adjustment to liabilities assumed in business
combination 41 116
Nominal effect of cross-currency swaps on principal of
rouble-denominated notes 186 76
Loans of assets classified as held for sale 78 79
Finance lease liabilities, including current portion 6 13
Total Debt 8,166 8,440
Appendix 5
Net Debt
Net Debt represents total debt less cash and liquid short-term financial assets, including those
related to disposal groups classified as held for sale. Net Debt is not a measure under IFRS and it
should not be considered as an alternative to other measures of financial position. EVRAZ’s
calculation of Net Debt may be different from the calculation used by other companies and
therefore comparability may be limited. The current calculation shall not be considered for
covenant compliance reasons.
Net Debt has been calculated as follows:
Net Debt Calculation 31 December 2013 31 December 2012
(US$ million)
Total Debt 8,166 8,440
Short-term bank deposits - (674)
Cash and cash equivalents (1,576) (1,320)
Cash of assets classified as held for sale (35) (70)
Collateral under swaps (21) -
Net Debt 6,534 6,376
35
###
The 2013 Annual Report will shortly be available to view or download in a pdf format from the Company’s website at www.evraz.com. A copy of the 2013 Annual Report will be submitted to the National Storage Mechanism and will shortly be available for inspection at http://www.morningstar.co.uk/uk/NSM. For further information: Media Relations: Vsevolod Sementsov VP, Corporate Communications London: +44 207 832 8998 Moscow: +7 495 937 6871 [email protected] Investor Relations: Sergey Belyakov Director, Investor Relations London: +44 207 832 8990 Moscow: +7 495 232 1370 [email protected]
The financial statements of EVRAZ plc (registered number 7784342) on pages 116-200 of the
Annual Report were approved by the Board of Directors on 8 April 2014 and signed on its behalf
by Alexander Frolov, Chief Executive Officer.

36
EVRAZ plc Consolidated Statement of Operations
(in millions of US dollars, except for per share information) Year ended 31 December 2013 2012 2011 restated* restated* Continuing operations Revenue
Sale of goods $ 14,071 $ 14,367 $ 16,077 Rendering of services 340 359 323
14,411 14,726 16,400 Cost of revenue (11,468) (11,803) (12,480) Gross profit 2,943 2,923 3,920 Selling and distribution costs (1,183) (1,211) (1,154) General and administrative expenses (877) (839) (903) Social and social infrastructure maintenance
expenses (50) (51) (61) Loss on disposal of property, plant and equipment (47) (56) (50) Impairment of assets (446) (413) (104) Foreign exchange gains/(losses), net (258) (41) 269 Other operating income 53 75 50 Other operating expenses (116) (129) (96) Profit from operations 19 258 1,871 Interest income 23 23 17 Interest expense (699) (654) (715) Share of profits/(losses) of joint ventures and
associates 8 1 55 Gain/(loss) on derecognition of equity
investments, net 89 – – Gain/(loss) on financial assets and liabilities, net (43) 164 (355) Gain/(loss) on disposal groups classified as held
for sale, net (25) 18 8 Other non-operating gains/(losses), net 15 (6) (4) Profit/(loss) before tax (613) (196) 877 Income tax benefit/(expense) 41 (229) (420)
Net profit/(loss) $ (572) $ (425) $ 457 Attributable to:
Equity holders of the parent entity $ (522) $ (398) $ 465 Non-controlling interests (50) (27) (8)
$ (572) $ (425) $ 457 Earnings/(losses) per share:
basic, for profit/(loss) attributable to equity holders of the parent entity, US dollars $ (0.35) $ (0.30) $ 0.36
diluted, for profit/(loss) attributable to equity holders of the parent entity, US dollars $ (0.35) $ (0.30) $ 0.36
* The amounts shown here do not correspond to the 2012 and 2011 financial statements and reflect
adjustments made in connection with the obligatory change in the accounting policies and a correction of a prior period error.
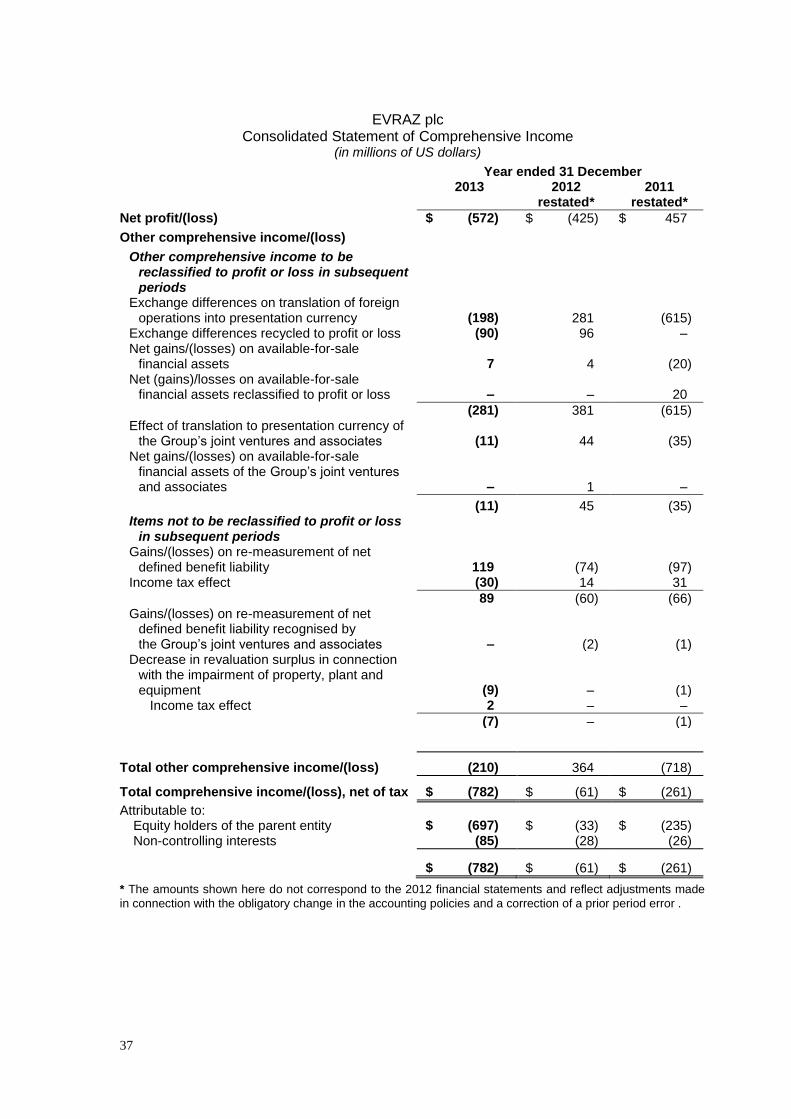
37
EVRAZ plc
Consolidated Statement of Comprehensive Income (in millions of US dollars)
Year ended 31 December 2013 2012 2011 restated* restated* Net profit/(loss) $ (572) $ (425) $ 457
Other comprehensive income/(loss)
Other comprehensive income to be reclassified to profit or loss in subsequent periods
Exchange differences on translation of foreign operations into presentation currency (198) 281 (615)
Exchange differences recycled to profit or loss (90) 96 – Net gains/(losses) on available-for-sale
financial assets 7 4 (20) Net (gains)/losses on available-for-sale
financial assets reclassified to profit or loss – – 20 (281) 381 (615) Effect of translation to presentation currency of
the Group’s joint ventures and associates (11) 44 (35) Net gains/(losses) on available-for-sale
financial assets of the Group’s joint ventures and associates – 1 –
(11) 45 (35) Items not to be reclassified to profit or loss
in subsequent periods Gains/(losses) on re-measurement of net
defined benefit liability 119 (74) (97) Income tax effect (30) 14 31 89 (60) (66) Gains/(losses) on re-measurement of net
defined benefit liability recognised by the Group’s joint ventures and associates – (2) (1)
Decrease in revaluation surplus in connection with the impairment of property, plant and equipment (9) – (1)
Income tax effect 2 – – (7) – (1)
Total other comprehensive income/(loss) (210) 364 (718)
Total comprehensive income/(loss), net of tax $ (782) $ (61) $ (261) Attributable to:
Equity holders of the parent entity $ (697) $ (33) $ (235) Non-controlling interests (85) (28) (26)
$ (782) $ (61) $ (261)
* The amounts shown here do not correspond to the 2012 financial statements and reflect adjustments made
in connection with the obligatory change in the accounting policies and a correction of a prior period error .
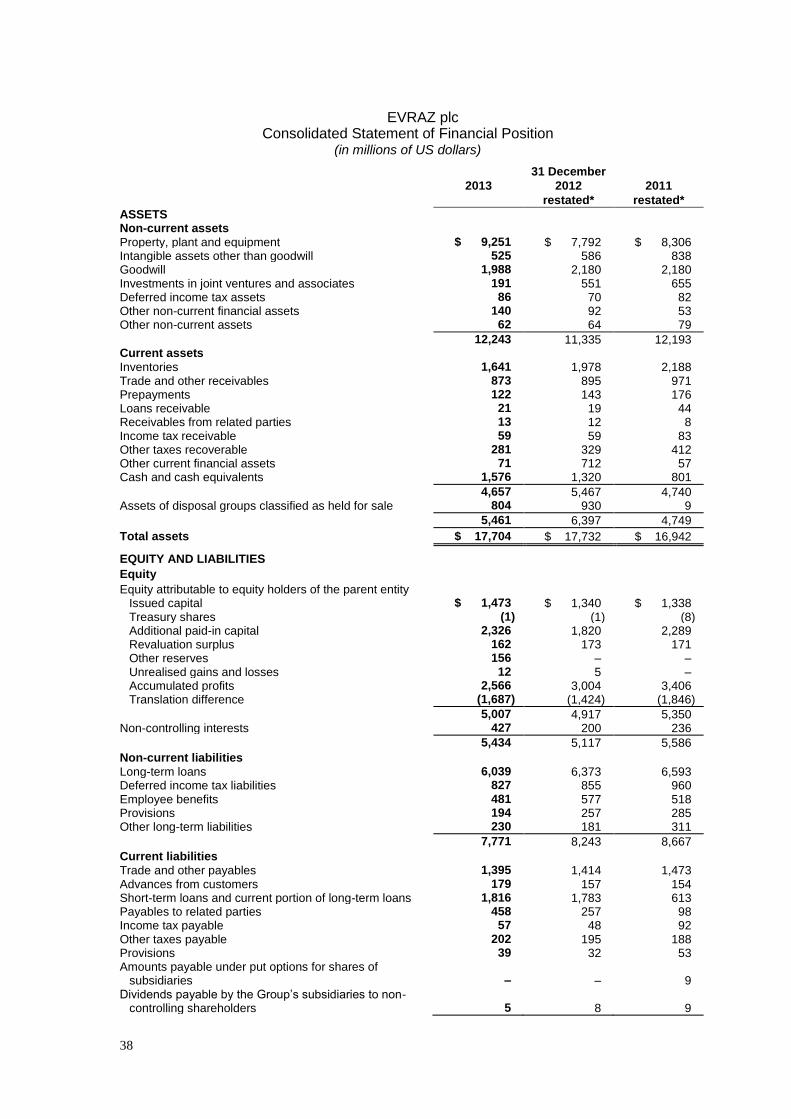
38
EVRAZ plc Consolidated Statement of Financial Position
(in millions of US dollars)
31 December
2013 2012 2011
restated* restated*
ASSETS Non-current assets Property, plant and equipment $ 9,251 $ 7,792 $ 8,306 Intangible assets other than goodwill 525 586 838 Goodwill 1,988 2,180 2,180 Investments in joint ventures and associates 191 551 655 Deferred income tax assets 86 70 82 Other non-current financial assets 140 92 53 Other non-current assets 62 64 79
12,243 11,335 12,193 Current assets Inventories 1,641 1,978 2,188 Trade and other receivables 873 895 971 Prepayments 122 143 176 Loans receivable 21 19 44 Receivables from related parties 13 12 8 Income tax receivable 59 59 83 Other taxes recoverable 281 329 412 Other current financial assets 71 712 57 Cash and cash equivalents 1,576 1,320 801
4,657 5,467 4,740 Assets of disposal groups classified as held for sale 804 930 9
5,461 6,397 4,749
Total assets $ 17,704 $ 17,732 $ 16,942
EQUITY AND LIABILITIES
Equity
Equity attributable to equity holders of the parent entity Issued capital $ 1,473 $ 1,340 $ 1,338 Treasury shares (1) (1) (8) Additional paid-in capital 2,326 1,820 2,289 Revaluation surplus 162 173 171 Other reserves 156 – – Unrealised gains and losses 12 5 – Accumulated profits 2,566 3,004 3,406 Translation difference (1,687) (1,424) (1,846)
5,007 4,917 5,350 Non-controlling interests 427 200 236
5,434 5,117 5,586
Non-current liabilities Long-term loans 6,039 6,373 6,593 Deferred income tax liabilities 827 855 960 Employee benefits 481 577 518 Provisions 194 257 285 Other long-term liabilities 230 181 311
7,771 8,243 8,667
Current liabilities Trade and other payables 1,395 1,414 1,473 Advances from customers 179 157 154 Short-term loans and current portion of long-term loans 1,816 1,783 613 Payables to related parties 458 257 98 Income tax payable 57 48 92 Other taxes payable 202 195 188 Provisions 39 32 53 Amounts payable under put options for shares of
subsidiaries – – 9 Dividends payable by the Group’s subsidiaries to non-
controlling shareholders 5 8 9

39
31 December
2013 2012 2011
restated* restated*
4,151 3,894 2,689 Liabilities directly associated with disposal groups classified
as held for sale 348 478 –
4,499 4,372 2,689
Total equity and liabilities $ 17,704 $ 17,732 $ 16,942 * The amounts shown here do not correspond to the 2012 financial statements and reflect adjustments made in connection with the obligatory change in the accounting policies and a correction of a prior period error.
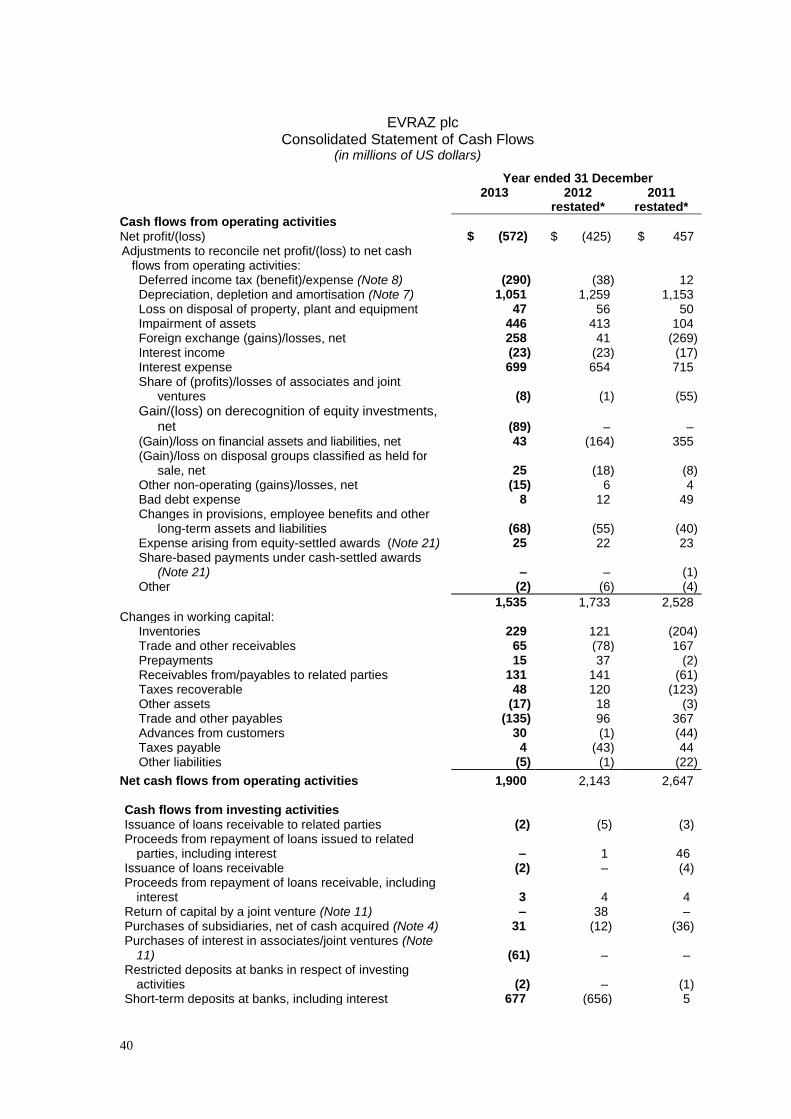
40
EVRAZ plc Consolidated Statement of Cash Flows
(in millions of US dollars)
Year ended 31 December 2013 2012 2011 restated* restated*
Cash flows from operating activities Net profit/(loss) $ (572) $ (425) $ 457 Adjustments to reconcile net profit/(loss) to net cash
flows from operating activities: Deferred income tax (benefit)/expense (Note 8) (290) (38) 12 Depreciation, depletion and amortisation (Note 7) 1,051 1,259 1,153 Loss on disposal of property, plant and equipment 47 56 50 Impairment of assets 446 413 104 Foreign exchange (gains)/losses, net 258 41 (269) Interest income (23) (23) (17) Interest expense 699 654 715 Share of (profits)/losses of associates and joint
ventures (8) (1) (55)
Gain/(loss) on derecognition of equity investments, net (89) – –
(Gain)/loss on financial assets and liabilities, net 43 (164) 355 (Gain)/loss on disposal groups classified as held for
sale, net 25 (18) (8) Other non-operating (gains)/losses, net (15) 6 4 Bad debt expense 8 12 49 Changes in provisions, employee benefits and other
long-term assets and liabilities (68) (55) (40) Expense arising from equity-settled awards (Note 21) 25 22 23 Share-based payments under cash-settled awards
(Note 21) – – (1) Other (2) (6) (4)
1,535 1,733 2,528 Changes in working capital:
Inventories 229 121 (204) Trade and other receivables 65 (78) 167 Prepayments 15 37 (2) Receivables from/payables to related parties 131 141 (61) Taxes recoverable 48 120 (123) Other assets (17) 18 (3) Trade and other payables (135) 96 367 Advances from customers 30 (1) (44) Taxes payable 4 (43) 44 Other liabilities (5) (1) (22)
Net cash flows from operating activities 1,900 2,143 2,647 Cash flows from investing activities Issuance of loans receivable to related parties (2) (5) (3) Proceeds from repayment of loans issued to related
parties, including interest – 1 46 Issuance of loans receivable (2) – (4) Proceeds from repayment of loans receivable, including
interest 3 4 4 Return of capital by a joint venture (Note 11) – 38 – Purchases of subsidiaries, net of cash acquired (Note 4) 31 (12) (36) Purchases of interest in associates/joint ventures (Note
11) (61) – – Restricted deposits at banks in respect of investing
activities (2) – (1) Short-term deposits at banks, including interest 677 (656) 5
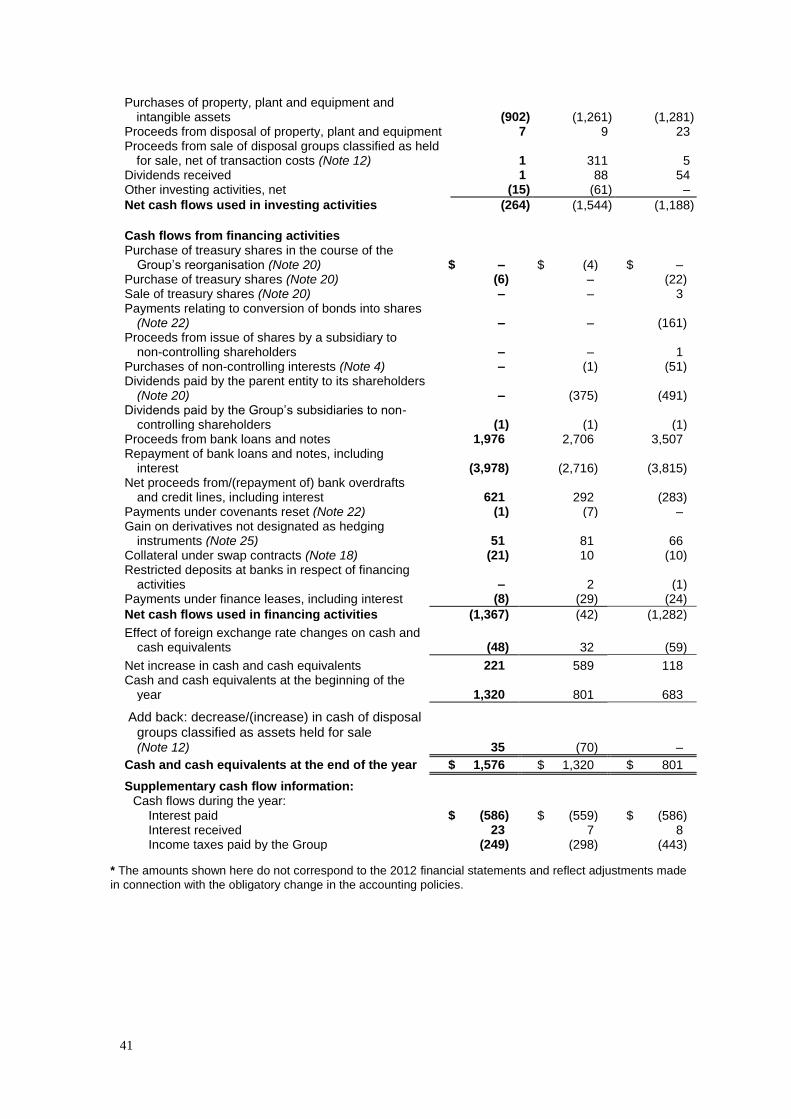
41
Purchases of property, plant and equipment and intangible assets (902) (1,261) (1,281)
Proceeds from disposal of property, plant and equipment 7 9 23 Proceeds from sale of disposal groups classified as held
for sale, net of transaction costs (Note 12) 1 311 5 Dividends received 1 88 54 Other investing activities, net (15) (61) –
Net cash flows used in investing activities (264) (1,544) (1,188) Cash flows from financing activities Purchase of treasury shares in the course of the
Group’s reorganisation (Note 20) $ – $ (4) $ – Purchase of treasury shares (Note 20) (6) – (22) Sale of treasury shares (Note 20) – – 3 Payments relating to conversion of bonds into shares
(Note 22) – – (161) Proceeds from issue of shares by a subsidiary to
non-controlling shareholders – – 1 Purchases of non-controlling interests (Note 4) – (1) (51) Dividends paid by the parent entity to its shareholders
(Note 20) – (375) (491) Dividends paid by the Group’s subsidiaries to non-
controlling shareholders (1) (1) (1) Proceeds from bank loans and notes 1,976 2,706 3,507 Repayment of bank loans and notes, including
interest (3,978) (2,716) (3,815) Net proceeds from/(repayment of) bank overdrafts
and credit lines, including interest 621 292 (283) Payments under covenants reset (Note 22) (1) (7) – Gain on derivatives not designated as hedging
instruments (Note 25) 51 81 66 Collateral under swap contracts (Note 18) (21) 10 (10) Restricted deposits at banks in respect of financing
activities – 2 (1) Payments under finance leases, including interest (8) (29) (24)
Net cash flows used in financing activities (1,367) (42) (1,282) Effect of foreign exchange rate changes on cash and
cash equivalents (48) 32 (59)
Net increase in cash and cash equivalents 221 589 118 Cash and cash equivalents at the beginning of the
year 1,320 801 683
Add back: decrease/(increase) in cash of disposal
groups classified as assets held for sale
(Note 12) 35 (70) –
Cash and cash equivalents at the end of the year $ 1,576 $ 1,320 $ 801
Supplementary cash flow information: Cash flows during the year:
Interest paid $ (586) $ (559) $ (586) Interest received 23 7 8 Income taxes paid by the Group (249) (298) (443)
* The amounts shown here do not correspond to the 2012 financial statements and reflect adjustments made
in connection with the obligatory change in the accounting policies.