evolving trend of consolidation in the banking industry
TRANSCRIPT

Evolving Trend of Consolidation in the Banking Industry:Strategies of Mitsubishi UFJ Financial Group
by
Takeshi Kogure
B.A.. Law, Keio University, 1993
SUBMITTED TO THE ALFRED P. SLOAN SCHOOL OF MANAGEMENT
IN PARTIAL FULFILLMENT OF THE REQUIREMENTS FOR THE DEGREE OF
Master of Science in Management
at the
Massachusetts Institute of Technology
June 2006
© 2006 Takeshi Kogure. All Rights Reserved.
The author hereby grants to MIT permission to reproduce and distribute publicly paper and
electronic copies of this thesis document in whole or in part.
Signature of author
MIT Sloan School of Management
May 12, 2006
Certified by
Accepted by
Henry Birdseye Weil
Senior Lecturer, Sloan School of Management
SThesis Supervisor
MASSACHUSETS INW"TUTEOF TECHNOLOGY
AUG 3 1 2006
LIBRARIES
Director, SloanStephen J. Sacca
Fellows Program in Innovation and Global Leadership
ARCHIVES


Evolving Trend of Consolidation in the Banking Industry:Strategies of Mitsubishi UFJ Financial Group
by
Takeshi Kogure
Submitted to the Alfred P. Sloan School of Management on May 12, 2006
in Partial Fulfillment of the Requirements for the Degree of
Master of Science in Management
ABSTRACT
Consolidation in the financial industry has progressed rapidly in many countries. In the United
States, large financial corporations, such as Citigroup and JP Morgan Chase, formed complex financial
groups and conglomerate structures composed of a commercial bank, a securities company, and an asset
management company.
In recent years, the Japanese financial system has become increasingly deregulated. And many
of the barriers to competition have been reduced or removed. These regulatory reforms have encouraged
Japanese banking institutions to undertake major consolidations that have resulted in larger and more
integrated financial conglomerates. In addition, the advent of Internet technology has enabled new
entrants, such as Internet service companies, to conduct financial business.
In these new circumstances, Mitsubishi Tokyo Financial Group (MTFG), Japan's third largest
banking group, decided to integrate with UFJ Holdings, Japan's fourth largest banking group. This
integration created the world's largest financial conglomerate (based on asset size) named Mitsubishi UFJ
Financial Group (MUFG).
This thesis discusses trends of consolidation in the U.S., European, and Japanese banking
industries. It will analyze the strategic transformation of several financial conglomerates, including
Citigroup, J.P. Morgan Chase, and Deutsche Bank. A second objective is to identify the financial and
strategic positions of MUFG as they compare with the U.S., Europe, and other Japanese financial
conglomerates.
Thesis Supervisor: Henry Birdseye Weil
Title: Senior Lecturer

Contents
Introduction .............................................................................................................. 8
Chapter 1: Overview of Consolidation Trends in the Banking Industry..................................10
1.1 Evolving Consolidation Trends.................................................................... 10
1.2 Why Do Banks Merge? ...................................................... . .. . .. .. . .. .. . .. .. . .. .. . .. . .. . .. .. . . .. . . . . ....... 11
Chapter 2: Patterns of Consolidation in the banking Industry..............................................17
2.1 Financial Conglomerates...........................................................................17
2.2 Consolidation Structure of Banks and Financial Conglomerates..........................18
2.3 Organizational Issues of Consolidation and Financial Conglomerates...................20
Chapter 3: Consolidation in the U.S. Banking Industry.....................................................23
3.1 The Progress of Regulatory Reform.............................................................23
3.2 Transformation of Banking Institutions in the United States.............................27
3.3 Citigroup...............................................................................................27
3.3.1 Recent M&A activities.....................................................................27
3.3.2 Performance after consolidation.........................................................30
3.3.3 Conglomerate discount.....................................................................35
3.3.4 Business restructuring......................................................................36
3.4 J.P. Morgan Chase................................................................................38
3.4.1 Recent M&A activities.....................................................................38
3.4.2 Performance after consolidation.........................................................42
3.4.3 Organizational Issues Following Consolidation.......................................45
3.5 Bank of America..................................................................................46
3.5.1 Recent M&A activities......................................................................46
3.5.2 Performance after consolidation.........................................................47
3.5.3 Low valuation for growth opportunity.................................................50
3.6 Summary..............................................................................................52

Chapter 4: Consolidation in the European Banking Industry..............................................56
4.1 Emergence of a Single Market for Financial Services......................................56
4.2 Transformation of Banking Institutions in Europe..........................................59
4.3 Deutsche Bank......................................................................................60
4.3.1 Recent M&A activities.......................................................................60
4.3.2 Performance after consolidation.........................................................64
4.3.3 Integration a Commercial Bank with an Investment Bank........................66
4.4 Union Bank of Switzerland (UBS)..............................................................67
4.4.1 Recent M&A activities......................................................................67
4.4.2 Performance after consolidation.........................................................69
4.4.3 Integration of IT infrastructure..........................................................70
4.5 Hong Kong and Shanghai Banking Corporation (HSBC)...................................71
4.5.1 Recent M&A activities......................................................................71
4.5.2 Performance after consolidation.........................................................76
4.5.3 Control of Geographically Diversified Organization................................77
4.6 Summary...............................................................................................78
Chapter 5: Consolidation in the Japanese Banking Industry...............................................82
5.1 Non-Performing Loans............................................................................82
5.2 Transformation of Japanese Banking Institutions..........................................85
5.3 Mizuho Financial Group............................................................................86
5.3.1 History..........................................................................................86
5.3.2 Performance after consolidation.........................................................88
5.3.3 Issues regarding merger on the equal term...........................................90
5.4 Sumitomo Mitsui Financial Group.............................................................91
5.4.1 History..........................................................................................91
5.4.2 Performance after consolidation.........................................................92
5.5 Financial Strategies of New Conglomerates..................................................94
5.5.1 Sony Financial Holdings.....................................................................94
5.5.2 Rakuten........................................................................................96
5.6 Summary...............................................................................................97

Chapter 6: Case study: Mitsubishi UFJ Financial Group...............................................99
6.1 History.................................................................................................99
6.2 Comparative analysis.............................................................................102
6.2.1 Profitability..................................................................................102
6.2.2 Operational Efficiency.....................................................................106
6.2.3 Asset Quality and Equity Capital.......................................................107
6.2.4 Strategic Positioning......................................................................108
6.3 Strategies for strengthening Business Capability............................................112
6.3.1 Cross-Selling Across Intra-group Companies.......................................113
6.3.2 Expanded Range of Services............................................................114
6.3.3 Expansion of Retail customer Base.....................................................115
6.3.4 Strengthen relationships with small and medium-size corporate customers..116
6.3.5 Leverage its overseas network..........................................................116
6.3.6 Pursue new business opportunities....................................................117
6.4 Assessment of MUFG's consolidation and Strategies.......................................117
Chapter 7: Conclusion ............................................................................................. 119
References ............................................................................................................ 124

Acknowledgements
I would like to express my sincere appreciation to my thesis advisors, Dr. Henry Birdseye Weil,
for his always helpful and supportive advice. I am convinced that this thesis would have not come to
fulfillment without his support.
Special thanks go to all the people who supported me with words of wisdom and valuable
suggestions. I would also express deep appreciation to all the Sloan Fellows friends who shared valuable
experience together encouraging each other. I would have never achieved this journey without these
life-long valuable friends.
I also thank to my sponsoring company, the Bank of Tokyo-Mitsubishi UFJ, for giving me this
opportunity to pursue my interests in Sloan Fellows Program in Innovation and Global Leadership at
MIT.
Finally, I am mostly grateful to my wife, Aki, for their kind support of my studies in Cambridge.
Without her support, my life in Cambridge would never have been so exciting and memorable.
Takeshi Kogure
May 2006, Boston

Introduction
Consolidation in the banking industry has progressed rapidly in many countries. In the United
States, large banking institutions such as Citibank and J.P. Morgan Chase have formed complex financial
groups and conglomerates composed of a commercial bank, a securities company, and an asset
management company. In Japan, many consolidations among banking institutions and other financial
institutions have occurred, with financial conglomerates emerging as a result.
In this thesis, I will analyze consolidation trends in the banking industry in the United States,
Europe, and Japan, and I will identify strategies and outcomes of several financial conglomerates.
The structure of the thesis is as follows:
* Chapter 1 provides an overview of consolidation trends in the banking industry including reasons for
consolidation.
* In Chapter 2, I discuss structural patterns and organizational issues of consolidation.
* In Chapter 3, I analyze consolidations in the U.S. banking industry, citing specific cases of Citigroup,
J.P. Morgan Chase, and Bank of America.
* In Chapter 4, I analyze consolidations in the European banking industry, citiing specific cases of
Deutsche Bank, Union Bank of Switzerland, and Hong Kong Shanghai Banking Corporation.
* In Chapter 5, I discuss consolidation in the Japanese banking industry, citing the cases of Mizuho
Financial Group and Sumitomo Mitsui Financial Group. In addition I discuss the strategy of two new
conglomerates: Sony Financial Corporation and Rakuten Inc.

* In Chapter 6, I analyze and compare the consolidation of Mitsubishi UFJ Financial Group with other
Japanese financial conglomerates, and those in the U.S. and Europe. I will also identify strategies
utilized by MUFG.
* In the Conclusion, I will summarize current consolidation trends and provide key factors that
influence the success of financial conglomerates based on the analyses in Chapter 1 through 6.

Chapter 1
Overview of Consolidation Trends in the Banking Industry
1.1 Evolving Consolidation Trends
In most Western economies, there is an increasing trend toward consolidation among banks and
other financial firms. According to a 2001 OECD report covering 13 key industrialized countries, during
the 1990s there were more than 7,600 deals involving the acquisition of one financial firm by another,
with a total value of $1.6 trillion. Between 1990 and 1999, there was a threefold increase in the number of
deals while the total value of M&As increased more than tenfold. Of these M&As, 60% were between
banks (see Table 1-1-1), 25% were between securities firms (including investment banks), and 15%
involved acquisitions of insurance firms.
Table 1-1. Number of Mergers and Acquisitions in the banking industry
1990 1995 1999USANational 111 370 242Global 2 11 13
Total 113 381 255Value ($m) 3,986 71,417 68,399
Europe'National 30 99 136Global 19 45 48
Total 49 144 184Value ($m) 4,946 27,631 124,873
'Europe includes: Belgium, France, Germany, Italy,Netherlands, Spain, Sweden, Switzerland, UKSource: OECD (2001), Report on Consolidation in the Financial Sector, Annex 1.

In 1998, there were a number of "super mega mergers," or mergers between banks with assets in
excess of $100 billion each. These mergers included:
* Citicorp Travelers
* Bank America and Nationsbank
* Bank One and First Chicago
* Norwest and Wells Fargo
* UBS-Swiss Bank Corporation
1.2 Why Do Banks Merge?
The reasons for the trend toward consolidation in the banking industry fall into two broad
categories.
* The first is the broad goal of maximizing shareholder wealth.
Banks aim to enhance shareholder wealth by exploiting the potential for profit and cost
economies of scale and scope through M&A activities.
Profit Economies of Scale and Scope
One motive for bank mergers is to increase the scale and scope of profit through expanding
their product offerings, and by adding non-banking products such as mutual funds, securities, and
insurance. In this way, the banks provide more services for existing customers, thereby ensuring loyalty
and attracting new clients. Cross-selling of banking and non-banking products brings further opportunities
to realize profits from single clients rather than offering only banking products. Clients appreciate the
convenience of handling a wide range of financial needs through one institution, which increases their

loyalty. Banks can also capture new clients' needs that were previously fulfilled by securities or insurance
firms. The managements of merged banks often argue that a broader range of products and client
coverage leads to profit increases and shareholder-value enhancement.
Expanding the geographical coverage of their businesses is another way for banks to increase
the scale and scope of profit. Entering other domestic regions or countries through M&A enables banks to
extend their products into other regional markets and increase their ability to book transactions for
corporate or institutional clients that are doing business in those areas.
Cost Economy of Scale and Scope
Realizing greater operating efficiency is another motive for merger. Banks continually seek
cost reductions by eliminating redundant branches, human resources, IT capacity, and transaction-
processing infrastructures. Consolidation of administrative and corporate management functions through
merger also contributes to cost reduction. Merged banks expect that the cost of identifying and adding
new clients will be reduced from the level it would be as a separate entity (see Table 1-2-1).
Table 1-2. Announced cost savings in selected U.S. bank mergers
Bank Announced SavingsCitigroup $1.3 billion over 2 years after taxBank of America $930 million
Source: Walter, Mergers and Acquisitions in Banking and Finance (2004)

Acquisition of Technical Know-How
Acquisition of technical know-how is another motive for merger. Major financial services, such
as investment banking and asset management, require highly specialized expertise. In the late 1990s and
early 2000s, many commercial banks acquired independent securities firms or merchant banks as one
means of acquiring such expertise (see Table 1-2-2). M&A activities were intended to strengthen the
capability of investment banking business and enhance profitability by acquiring highly specialized
know-how and combining it with huge capital and a broad client base.
Table 1-3. Recent examples of security firms and merchant bank acquisitions
Acquired firm Acquiring firm1989 Morgan Grenfell (UK) Deutche bank (Germany)1995 Kleinwort Benson (UK) Dresdner bank (Germany)1995 SG Warburg (UK) SBC (Switzerland)1995 Barings (UK) ING bank (Netherland)1997 Dillon Read (U.S.) SBC (Switzerland)1998 Hambros (UK) Societe General (France)1999 Bankers Trust (U.S.) Deutche bank (Germany)2000 Robert Fleming (U.S.) Chase (U.S.)2000 JP Morgan (U.S.) Chase (U.S.)2000 PeineWebber (U.S.) UBS (Switzerland)
Diversification of the Business Portfolio
One argument for bank mergers is that better diversified income from multiple products, client
groups, geographies, and business risks creates more stable, safe, and ultimately more valuable banking
institutions. The results are higher credit quality and debt ratings, and lower costs of financing than those
faced by narrow, more focused banks.

* The second category of reasons for the trend toward consolidation in the banking industry is
the factors that create an environment favorable to M&As. These include changes in the structure of the
banking industry, changes in regulations, and development of Information technologies.
Structure Changes in the Banking Industry
The structure of the banking industry is changing as more and more non-bank institutions enter
the banking business. Insurance firms are a case in point.
In Germany, Allianz AG, the world's largest property and casualty insurer, acquired Dresdner
Bank for the purpose of creating a multi-channel distribution platform and to leverage the complementary
distribution strengths of both firms in each of their primary target markets. The acquisition aimed to
expand cross-selling opportunities to both firms' clients and to enhance profitability. In the UK,
Prudential established "Egg", an Internet-only bank, in 1998. Egg has acquired over three million
customers in the four years since its establishment.
Non-financial institutions are also entering into the banking business. In the UK, Tesco, a large
supermarket chain, launched its own on-line banking, "Tesco Personal Finance (TPF)," in 1997 through a
joint venture with Royal Bank of Scotland, for the purpose of selling loan products, credit cards, and
insurance to its over ten million customers. TPF now has provided its financial products to more than five
million customers. In the U.S., Wal-Mart applied in 2005 for permission to create and operate an
industrial bank. Its announced objective is to internally capture costs currently paid to third- party
financial institutions who process debit, credit, and electronic check transactions, however the Wal-Mart
bank is expected to begin to offer banking products in the future. In Japan, Ito-Yokado, the largest
supermarket chain in Japan, established "IY Bank" in 2001, a sprawling ATM network focused on
financial settlement, but it intends to develop its loan and card businesses. Sony, a large electronic

manufacturer, launched an Internet-only bank, "Sony Bank" in 2001. By leveraging Sony's brand
reputation, Sony Bank acquired over 400,000 accounts.
Increased competition with new entrants encourages banks to merge for the purpose of retaining
their competitive advantage and maintaining current market share.
Changes in Regulations
Regulator change is another factor in the environment that favors consolidation. In the U.S.,
changes to the Bank Holding Company Act of 1970, combined with liberalization of state laws governing
the treatment of bank holding companies, has led to increased merger activity. More recently, commercial
banks have been allowed to have subsidiaries that engage in securities activities. Also the laws on
interstate branches have been relaxed, and the Glass Steagall Act has been repealed, so financial holding
companies now can have banking, securities, and insurance subsidiaries, which encourage greater
consolidation and nationwide banking.
In Europe, the Banking and Investment Services Directives, the introduction of the euro, and
the Lamfalussy Report have encouraged greater integration of EU banking markets. I will explain these
changes in the U.S., Europe, and Japanese regulation in greater detail in the following chapters.
Development of Information Technologies
Development of information technologies also encourages banks to merger. Such development
enables banks to establish a sophisticated, multiple-product, management system, a customer relations
management system, and a risk management system that covers all aspects of the business. It also enables
banks to offer a broader array of products and services to larger numbers of clients over wider

geographical areas than would have been feasible in the past, and to develop efficient multiple product
delivery channels, such as an Internet-based retail financial service. Development of information
technologies provides favorable infrastructure that allows banks to merge with another bank or another
kind of financial institution.

Chapter 2
Patterns of Consolidation in the Banking Industry
2.1. Financial Conglomerates
In the 1980s, most of the consolidation in the banking industry took place between commercial
banks. In the 1990s, major banks began to incorporate other kinds of financial businesses. As a result, in
many Western countries financial conglomerates arose. The definition of financial conglomerates is not
explicit, but they are typically defined as a firm that undertakes at least two of several financial activities,
such as ordinary banking business, investment banking, securities, credit card issuance, asset management,
or insurance. In 2002, the EU passed the Financial Conglomerate Directive, which aimed to standardize
the way financial conglomerates are supervised across the EU. In the Directive, financial conglomerates
were defined as follows:
1. Any group with "significant" involvement in two sectors: banking, investment and insurance.
2. More specifically, in terms of its balance sheet, at least 40% of the group's activities are financial;
and the smaller of the two sectors contributes 10% or more to the group's balance sheet and the
group's capital requirements.
By this definition, there are 38 financial conglomerates in the EU (2002 figures), and most of
them have banking as their main line of business. These financial conglomerates are important players,

especially in banking, where they hold 27% of the EU deposit market; their market share in the insurance
market is 20% in terms of premium income (Heffernan, 2005).
2.2. Consolidation Structure of Banks and Financial Conglomerates
In terms of organizational structure, consolidation between two commercial banks is
straightforward. Usually the target bank is folded into the existing organizational structure of the
acquiring bank and the target bank disappears. In contrast, the organizational structure of financial
conglomerates is more complex, and may take a number of more or less distinct forms. The
organizational structures of banks establishing financial conglomerates are stylized as follows:
Type A: FULL INTEGRATION
BANK
Bank Securities Insurance OtherActivities Activities Activities
A fully integrated bank (Type A) provides a broad range of financial services (banking, asset
management, securities, and insurance) under a single corporate structure supported by a single capital
base. This comes close to the classic European-style universal bank. But this model does not seem to exist
in Western countries. (Even in Germany, the home of the universal bank, conducting banking activities
and insurance activities within a single corporate entity is not allowed.)
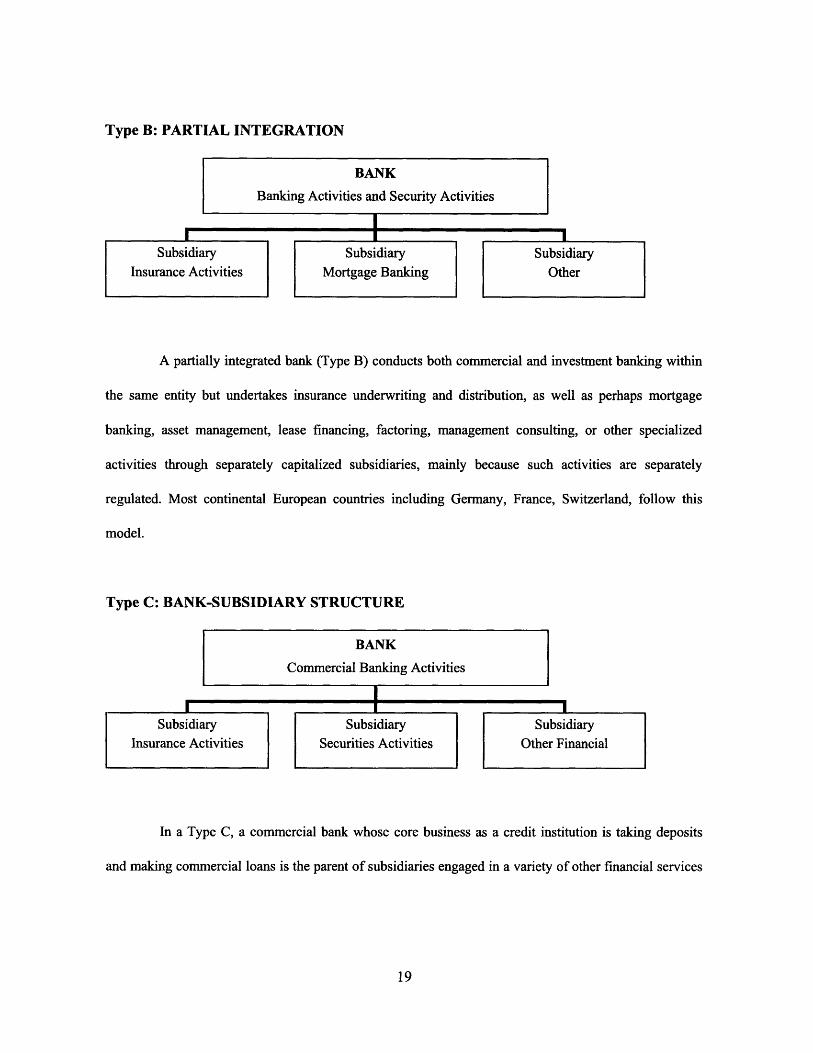
Type B: PARTIAL INTEGRATION
A partially integrated bank (Type B) conducts both commercial and investment banking within
the same entity but undertakes insurance underwriting and distribution, as well as perhaps mortgage
banking, asset management, lease financing, factoring, management consulting, or other specialized
activities through separately capitalized subsidiaries, mainly because such activities are separately
regulated. Most continental European countries including Germany, France, Switzerland, follow this
model.
Type C: BANK-SUBSIDIARY STRUCTURE
BANK
Commercial Banking Activities
_ • _I
SubsidiaryInsurance Activities
SubsidiarySecurities Activities
SubsidiaryOther Financial
In a Type C, a commercial bank whose core business as a credit institution is taking deposits
and making commercial loans is the parent of subsidiaries engaged in a variety of other financial services
ranging from investment banking to insurance. British multifunctional banks traditionally follow this
model, with securities and insurance activities (if any) carried out via subsidiaries of the bank itself.
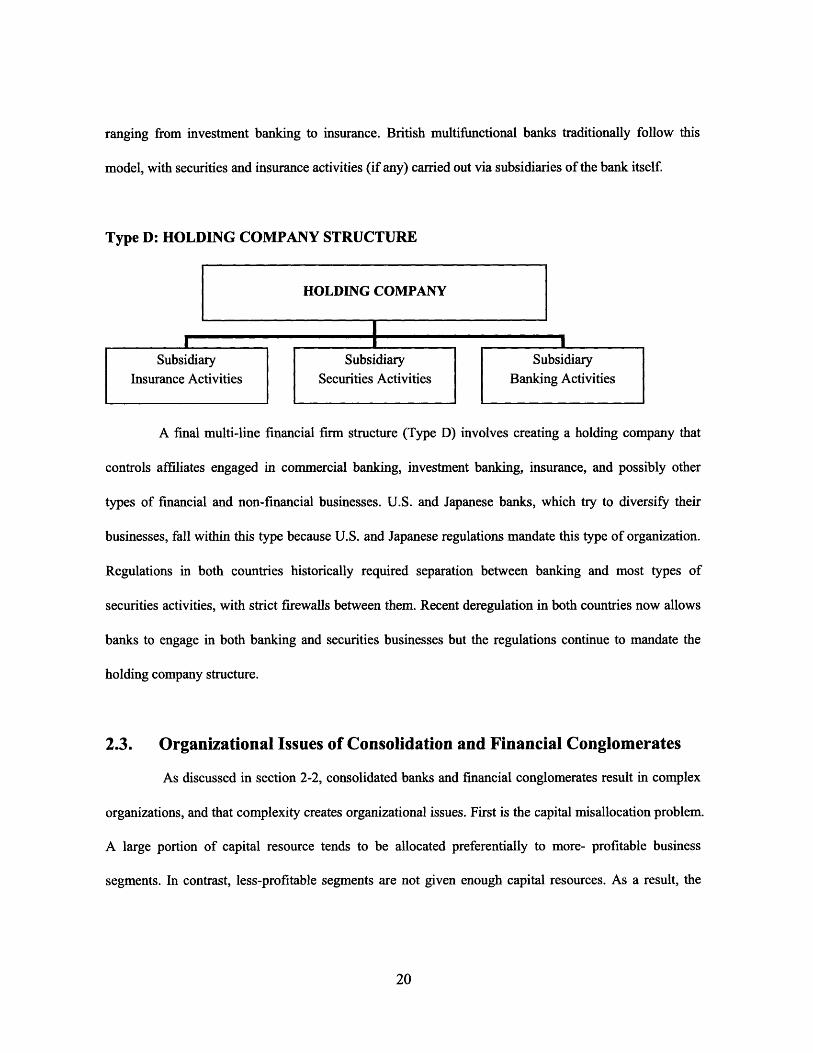
Type D: HOLDING COMPANY STRUCTURE
A final multi-line financial firm structure (Type D) involves creating a holding company that
controls affiliates engaged in commercial banking, investment banking, insurance, and possibly other
types of financial and non-financial businesses. U.S. and Japanese banks, which try to diversify their
businesses, fall within this type because U.S. and Japanese regulations mandate this type of organization.
Regulations in both countries historically required separation between banking and most types of
securities activities, with strict firewalls between them. Recent deregulation in both countries now allows
banks to engage in both banking and securities businesses but the regulations continue to mandate the
holding company structure.
2.3. Organizational Issues of Consolidation and Financial Conglomerates
As discussed in section 2-2, consolidated banks and financial conglomerates result in complex
organizations, and that complexity creates organizational issues. First is the capital misallocation problem.
A large portion of capital resource tends to be allocated preferentially to more- profitable business
segments. In contrast, less-profitable segments are not given enough capital resources. As a result, the

less-profitable business becomes less competitive against more narrowly focused financial institutions.
Due to this, some consolidated banks cannot sufficiently exploit the potential synergies from several
business segments.
The second issue is promoting collaboration among several business organizations or entities. A
performance-driven corporate culture sometimes causes conflicts among several organizations or entities,
where each one tries to maximize its own profit instead of collaborating with the others. Without careful
attention to limiting such conflicts of interest, it is difficult to realize synergy effects from cross-selling or
corporate segments.
The third issue is designing a proper compensation and incentive system. For example, it is
often difficult to maintain a high-level, performance-based compensation and incentive structure for
employees engaged in investment banking and at the same time a parallel, relatively flat structure for
employees engaged in commercial banking - both within one corporate entity. If banks separately
subsidize several business segments as Type B, C, D, they can set up different compensation and
incentive structures. But when they want to transfer employees across business entities as part of
cross-selling initiatives, they need to take special care to align their compensation and incentive
structures.
Organizational complexity sometimes results in disadvantages to a bank's clients. The more
complex the bank's organization becomes, the more difficult it is for them to maintain strict compliance
control across business segments. Recently, many compliance violations by large financial institutions
have occurred. In 2003 Citigroup was ordered by Japan's Financial Services Agency (FSA) to shut down
its private banking operations for higher-net-worth individuals in Japan after the agency discovered that
its private banking division had violated banking laws and regulations. It was said that the lack of

cross-functional compliance controls caused this violation. Accordingly, many private clients of
Citigroup's Japanese subsidiaries suffered the sudden suspension of their private banking services.
For shareholders and investors, the structural complexity of consolidated banks and financial
conglomerates makes it difficult to add pure sectoral exposures to their portfolio. In effect, the forming of
financial conglomerates prevents them from optimizing asset allocation across specific segments of the
financial industry. Investors may avoid such stocks in their efforts to construct asset-allocation profiles.
It is often argued that the shares of financial conglomerates tend to trade at prices lower than the
shares of more narrowly focused financial institutions (portfolio-selection effect). This tendency, called "a
conglomerate discount," arises from both capital misallocation and the portfolio-selection effect. I will
provide an example of conglomerate discount by Citigroup in the following chapter.

Chapter 3
Consolidation in the U.S. Banking Industry
3.1 The Progress of Regulatory Reform
In the 1980s, many U.S. commercial banks suffered losses from failed property loans and loans
to emerging countries. In addition, severe competition from investment banks, securities firms, foreign
banks, and savings and loans banks (S&Ls) also contributed to lowering the banks' profitability. Under
these circumstances, many commercial banks that wanted to expand their business in order to return to
profitability, and the Federal Reserve Bank (FRB) which sought recovery for the banking industry in
general, asked for regulatory reforms that would prohibit banks from extending their business to other
geographic areas and other financial business sectors.
Regarding the geographic aspect, since 1933 most states prohibited out-of-state banks from
collecting retail deposits, which effectively excluded them from setting up out-of-state branches. Bank
holding companies might establish bank subsidiaries in other states, but each was an individual legal
entity that had to be separately capitalized. But in the 1980s the failure of thousands of banks and S&Ls
put pressure on individual states to revise their legislation to allow entry to out-of-state banks through the
merger of healthy bank holding companies with unsound local banks and S&Ls. Also, some neighboring
states entered into regional reciprocal agreements to allow branches across state lines.
In response to these deregulatory moves and intensified pressure for reform from banks and
FRB, the Riegle Neal Interstate Banking and Branching Efficiency Act was passed in 1994. This act
eliminated the restrictions on interstate banking businesses and, beginning in September 1995, allowed all

U.S. banks to acquire banks in other states. From June 1997, bank holding companies could convert
subsidiaries to branches, and any out-of-state bank taken over by another bank could be converted to a
branch. To prevent excessive concentration, a bank holding company may not hold more than 30% of
total deposits in any given state, and 10% nationally. As a result, interstate branching through the
acquisition of existing banks became easier and more attractive, and many banks acquired other banks in
order to expand into other geographic regions. Examples of M&A activities in the 1980s and 1990s are
illustrated in Figure 3-1.

As of 1995
Figure 3-1. Recent U.S. bank mergers
1996 -2000 2000-
Wachovia ,I J
I *.,TT....
(Year)
Wachovia
i'mmi"" -
At the same time interstate branch banking deregulation occurred, rules that imposed functional
segmentation were repealed in incremental steps. The Glass Steagall Act prevented banks from trading
securities, or underwriting insurance, or owning shares in non-financial companies, and it limited the
I I"1_\ I 1111 I ·SllJlll
I

securities functions of commercial banks to underwriting and dealing in municipal government debt.
Since 1987 the act was gradually relaxed so that commercial banks were allowed to enter into securities
businesses. In 1999, the Gramm Leach Bliley Financial Modernisation Act was passed and eliminated
functional segmentation among banking business, securities, and insurance, As a result banks can
establish financial holding companies which own banking, securities, and insurance subsidiaries. The
deregulation promoted banks to acquire or merge with securities and insurance firms. Chief examples of
recent consolidating movements across different financial sectors are illustrated in Figure 3-2.
Figure 3-2. Recent U.S. bank consolidations across several financial sectors
Commercial Bank Consumer finance /Card

3.2 Transformation of Banking Institutions in the United States
Regulatory reforms prompted U.S. banks to consolidate with other banks and other kinds of
financial institutions. In this chapter, I will analyze the transformation of three large U.S. banking
institutions: Citigroup, J.P. Morgan Chase, and Bank of America. These three are experiencing rapid
growth through mergers, by consolidating activities, and by establishing large financial conglomerates.
The ranking of these three banks among the world's banks, based on market value, is shown in Table 3-1.
Table 3-1. Ranking of the world's banking institutions
fI I f,_ T:,.. I I Total Market value I Total Asset Amount
5 Wells Fargo US 99,144 387,7986 Royal Bank of Scotland UK 87,048 814,227'7 UBS Switzerland 79,152 1,118,5538 Wachovia US 61,675 401,0329 Barclays UK 59,738 792,74310 Mitsubishi Tokyo Financial Group Japan 58,125 992,695
Source: The Wall Street Journal 2004.9.27
3.3 Citigroup
3.3.1 Recent M&A activities
In 1998 Citigroup came into existence through a merger between Citicorp and Travelers Group.
For Citigroup, the first objective of the merger was to strengthen its retail business by adding Travelers'
securities and insurance products to its banking products. The second objective was to consolidate its

investment banking business by acquiring Salomon Smith Barney, an investment banking subsidiary of
Travelers. At the time, and despite its strong position, Citicorp faced severe competition from other banks,
credit-card firms, and securities firms in the retail business. Citicorp felt the need to enhance its retail
business by rebuilding its investment banking business, by realistically consideration of the slow growth
of global financial businesses due to the financial crisis in Asia, and the shift among its individual clients
from bank deposits to stocks and/or mutual funds. Travelers' primary objective was to improve
profitability through cross-selling its securities and insurance products to Citicorp's large client base.
Citigroup immediately implemented an expansion plan by completing a number of acquisitions.
In 1999, it announced two separate acquisitions that would strengthen its consumer lending position. First,
it acquired Mellon Bank's credit card business, including a portfolio of $1.9 billion in credit card
receivables. Then Citigroup signed an agreement to acquire a $558 million loan portfolio and 128
consumer finance branch offices from Associates First Capital. In 2003, Citigroup acquired Sears' $29
billion portfolio of private label and bankcard credit card receivables. The acquisition also included Sears'
financial products business and credit card facilities. It also launched a strategic partnership with Home
Depot to provide consumer and commercial credit card accounts to its customers. In 2004, Citigroup
acquired the mortgage banking business of the Principal Financial Group, an Iowa-based financial
services company, in a move that would bolster its position in the U.S. home lending business. In 2004, it
also purchased the consumer finance business from Washington Mutual, the giant U.S. retail financial
institution. The acquisition included more than 400 offices in 25 states, adding to Citigroup's consumer
finance network in southeastern and southwestern U.S.
Simultaneously, Citigroup tried to strengthen its retail network. In 2001, it acquired European
American bank, a large bank in New York, from ABN AMRO. In 2003, it acquired Golden State Bancorp
and expanded its retail distribution franchise in key California and Nevada markets. In 2004, it also

acquired First American Bank in Texas, a $3.5 billion asset bank with a strong commercial presence and
more than 100 branches in Texas.
In the investment banking sector, Citigroup expanded through a number of acquisitions and
strategic alliances. In 1999, Salomon Smith Barney, a subsidiary of Citigroup, established Nikko Salomon
Smith Barney (now Nikko Citigroup), a wholesale investment bank in Japan, with Japan Nikko Securities.
In 2000, Salomon Smith Barney, agreed to acquire the investment banking businesses of Schroder, a UK
investment banking and asset management firm. That acquisition doubled Citigroup's investment banking
and equities platforms in Europe. In 2004, Citigroup purchased the derivative business from Knight
Trading to expand its derivatives capabilities and add significant scale to its U.S. equities business. It also
acquired Lava Trading (the leader in electronic execution and sell-side order management systems) to
consolidate its leading market position in electronic trade execution.
Meanwhile, Citigroup sought to enlarge its global business through a number of acquisitions
and strategic alliances. In 1999, it acquired Financiero Atlas, a Chile-based consumer finance company
with 65 branches throughout Chile and $460 million in assets. In 2000, it acquired acquire Associates
First Capital Corporation, the fifth-largest consumer finance company in Japan (now CFJ K.K.). In 2001,
it acquired Grupo Financiero Banamex-Accival, a Mexican financial services group that integrates
operations in Mexico under the Banamex brand name. In 2003, it agreed to a strategic alliance with
Shanghai Pudong Development Bank, a Chinese commercial bank, to enter China's emerging credit card
market. In 2004, it acquired KorAm Bank, the sixth-largest commercial bank in Korea. The combined
businesses of Citigroup and KorAm now constituted the fifth-largest financial business in Korea based on
revenues.
Through its M&A activities, Citigroup has established itself as the world's largest financial
conglomerate. The company's organization structure is illustrated in Figure 3-3.

Figure 3-3. Citigroup organization
Commercial Bank Consumer finance / Investment Bank / InsuranceCard Securities /
Asset Management
Citigroup Inc. (Financial Holding Company (FHC))
Citigroup Holding Company Citigroup Global Primerica Financial(Banking Holding Company (BHC)) Markets Holding Service
Company (Insurance Broker)(Securities Holding
Citibank N.A. Citibank Delaware Company (SHC)) - --rvls - Po(Commercial Bank) - (Credit card) Travelers Property
Casualty
-Citibank Mortgage Citigroup Global (Property and(Mortgage loan) - Markets Inc. casualty insurance)
(Securities Company) (Sold)--------------------------------------
Associates First ----------------r ---- -- ---- -- Travelers Life&Capital Salomon Brothers Travelers Life &
(Consumer finance) Asset Management Annuity(Sold) (Life insurance)
S (Sold)----------
3.3.2. Performance after consolidation
Five years after the consolidation of Citicorp and Travelers, total net revenue has increased 1.36
times and net income has increased 1.25 times. Total assets have also increased 1.64 times (see Table 3-2
and Figure 3-4).

Table 3-2. Citigroup Five-Year summary of selected financial data
($billion) 2000 2001 2002 2003 2004Total Net Revenues 58.2 61.6 66.2 71.6 79.6Operating expenses 34.3 35.0 35.9 37.5 49.8Net Income 13.5 14.1 15.2 17.8 17.0Total Assets 902.6 1,051.9 1,097.6 1,264.0 1,484.1Common Stockholders' Equity 66.2 79.7 85.3 96.8 108.1Return on Asset (ROA) 1.5% 1.3% 1.4% 1.4% 1.1%Return on Common Equity (ROE) 20.4% 17.7% 17.8% 18.4% 15.7%Expense ratio (Operating expenses 58.9% 56.9% 54.2% 52.4% 62.5%/ Total net revenues)
Source: Citigroup Form 10 OK 2004
Figure 3-4. Citigroup total net revenues and income
$billion90.080.070.060.050.040.030.020.010.0
3 Total Net Revenues
SNet Income
U.0
2000 2001 2002 2003 2004 Year
Table 3-2 also shows that among its four business segments, the Global Consumer Group and
Corporate & Investment Banking have increased their net incomes.

Table 3-3. Citigroup Segment results of Net Income
($billion) 2002 2003 2004Global Consumer Group 8.2 9.6 11.9Corporate & Investment Banking 4.6 5.4 6.4Global Wealth Management 0.5 1.3 1.2Global Investment Management 1.1 1.2 1.3*2002 excludes a $1.4 billion after-tax change related to the Enron and Litigation Reserve Change*2004 excludes a $4.9 billion after-tax change related to the WorldCom and Litigation Reserve Change
Source: Citigroup Annual report 2003,2004
Based on revenue and income increases, it seems that consolidation has produced positive
effects for Citigroup. Also Citigroup can obtain synergy effects through various M&A activities. For
example, in the investment banking business Citigroup has enhanced its position in the ranking of world
M&A advisory and underwriting of U.S. bonds, as shown in Table 3-4. As a result of the consolidation of
Citicorp and Travelers, Citigroup could offer a wide array of financial products to its clients and exploit
cross-selling opportunities. The ability to provide total financial solutions have contributed to revenue
increases.
Table 3-4. World's M&A Advisory ranking Ranking of underwriting of US Bond
CitigroupJPMorgan ChaseGoldman Sachs
Ranking (Market Share)2000 2002 2003
6 (5.3%) 2 (16.8%) 2 (18.0%)5 (8.5%) 5 (14.4%) 3 (15.9%)1 (17.2%) 1 (24.4%) 1 (24.5%)
CitigroupJPMorgan ChaseGoldman Sachs
Ranking (Market Share)2000 2002 2003
2 (13.7%) 1 (15.0%) 1 (13.5%)3(12.2%) 2 (13.4%) 2 (11.1%)7 (6.9%) 9 (5.0%) 8 (5.7%)
Souce: One-Stop Shopping for Financial Sevices, Shiraishi, 2005
In addition to product diversification, rapid geographic expansion was also a characteristic of
Citigroup's M&A activities. As shown in Figure 3-5, Citigroup's revenue stream is regionally diversified.
Citigroup attempts to maximize its business opportunities in worldwide regions by extending its business

models. In 2004, net revenues from Asia (ex. Japan) increased by 29%; from Europe, the Middle East,
and Africa by 21%; and from Mexico by 19%. The geographic expansion has contributed to its total
revenue growth and diversification of its business risk. This is one of the positive results of Citigroup's
M&A activities.
Figure 3-5. Citigroup Geographical split of income (2004)
Latin America,8%
Europe, MiddleEast, Africa,
14%
Mexico, 101
Japan, 50/c
Norht America,47%
Asia, 160/c
Source: Citigroup Annual Report 2004
But ROA and ROE have had a downward tendency since 2000 (see Figure 3-6). Those show
that the growth of profitability has not kept pace with that of total assets generated through active M&A
activities.
Figure 3-6. Citigroup ROA and ROE trends
ROA
2000 2001 2002 2003 2004Year
ROE
25.0%20.0%15.0%10.0%
5.0%nno/-
2000 2001 2002 2003 2004Year
%2.0%
1.5%
1.0%
0.5%
0.0% v#ov iv

The slower growth of profitability can be primarily attributed to three reasons. The first is that
collaboration and cross-selling across several functional divisions has not been fully realized. After the
consolidation of Citicorp and Travelers, customer relationship management across several functional
divisions has not been integrated. For example, as of 2003, the management of customer relationships for
the corporate banking division, transaction service division, and investment banking division (old
Salomon Smith Barney) had not been integrated. This hindered cross-selling of bank loans and
investment banking products to single corporate clients. Further, this sometimes caused conflicts of
interest across several functional divisions. As for insurance products, subsidiaries such as Primerica and
Smith Barney execute a large portion of sales, and collaboration with bank branches does not seem to be
fully promoted.
The second reason is complexity associated with the existence of several similar business
entities. For example, in the consumer finance business sector, Citigroup has two business brands,
CitiFinancial and Associates First Capital. The existence of several distribution channels causes
overlapping of some business content and related inefficiency. It also causes confusion among individual
clients. Associates First Capital was sued by more than 700 clients for insufficient explanation regarding
multiple financial products sales (Aonuma, 2000).
The third reason is that cost economies of scale and scope have not yet been realized. As shown
in Figure 3-7, expense ratio and number of employees have not decreased noticeably in recent years and
in fact increased in 2004. This factor can be attributed primarily to Citigroup's consolidation, which
emphasized revenue growth by cross-selling several products and by geographic diversification rather
than cost reduction. Citicorp and Travelers had very little duplication in their business activities, so it was
difficult to make considerable cut costs.

Figure 3-7. Citigroup five-year trend of operating expenses
Expense ratio
70%
60%
50%
,'U 70
2000 2001 2002 2003 2004
Number of employees
300,000
250,000
200,000
1 n nnn
2000 2001 2002 2003 2004
Source: Citigroup Form 10K 2004 and Financial Snapshot on HP
3.3.3 Conglomerate discount
In this section I analyze the investors' evaluation of Citigroup's M&A strategy.
As shown in Table 3-5, Citigroup's price earnings ratio (PER) in 2001 was higher than the
industry averages of several financial business sectors. But by 2004 PER was lower than the industry
average of all financial business sectors. This means that investors do not highly evaluate the stock
performance and growth of Citigroup compared with more narrowly focused financial institutions in each
financial business sector.
Table 3-5. Citigroup Price earnings ratio (Comparison with industry average)Industry Average
Year Citigroup Retail Transaction Consumer Life Asset Investment RetailBank Service Finance / Card Insurance Management Bank Securities
2001 18.1 17.4 24.7 16.5 16.6 23.3 13.2 18.12004 11.8 15.0 19.0 16.3 14.0 21.6 14.0 17.2
Source: Bank of Tokyo-Mitsubishi UFJ, New York Branch Report
I-- '-~~---- -- -~-~--

As explained in Chapter 2.3, "Conglomerate discount" became actualized in Citigroup. In
addition to lower growth of profitability, several issues caused by organizational complexity negatively
affected investors' sentiment. One major problem is the lack of strict compliance control. Citigroup was
accused of a number of legal and ethical violations, including the Enron and WorldCom scandals, both of
which resulted in enormous financial damage. In 2003 Citigroup was ordered by Japan's Financial
Services Agency (FSA) to shut down its private banking operations in Japan for violating banking laws
and regulations. Such problems were caused by a lack of strict compliance control, which resulted from
the increased complexity of its organization due to the number of M&As. Citigroup bore huge losses,
both financially and to its reputation, through a series of scandals. Investors abhor such compliance risk in
financial conglomerates, and will avoid holding the stock of financial conglomerates like Citigroup.
3.3.4 Business restructuring
Citigroup has pursued economies of scale and scope through several M&As. But in response to
lower growth, it began to review its conglomerate structure and made a decision to restructure its business
portfolio. In 2002, it spun off and/or sold its property and casualty insurance businesses conducted by
Travelers Property and Casualty Insurance and retreated from underwriting and manufacturing such
insurance. At that time the performance of Travelers Property and Casualty Insurance was severely
damaged by the impact of the September 11, 2001 attacks as well as a string of hurricane damages. In
addition to lower profitability and the slower growth of the property and casualty insurance businesses,
the volatility of these profits made Citigroup reluctant to continue in those businesses.
In 2005, Citigroup decided to sell its life insurance subsidiary, Travelers Life & Annuity, to
Met Life and to focus on promoting the sales of outsourced insurance products through its distribution
channels. Charles Prince, Chief Executive Officer of Citigroup, said:

Travelers Life & Annuity has a long and successful history of providing world-class products
and services to its global customer base. This transaction joins Travelers Life & Annuity with
one of the world's leading insurance companies and sharpens our focus on Citigroup's
long-term growth franchises. We will redeploy the sale proceeds to higher return and higher
growth opportunities and to maximize returns to our shareholders. (Citigroup, press release,
January 31, 2005).
As shown in Figure 3-8, the profitability of the life insurance and annuities business is lower
than other Citigroup business segments. Furthermore, the profit from investment in underwriting assets is
influenced by stock market performance and is highly volatile. Those factors are the main reason for this
business sellout.
Figure 3-8. Citigroup return on risk capital of each business segment
Citiroup Return on Rsk Asset of each business segnent
Source: Citigroup Form 10-K, 20041 Risk capital is defined as the amount of capital required to absorb potential unexpected economic losses
resulting from severe events over a one-year time period. Return on risk capital is calculated as net incomedivided by average risk capital.
In 2005, Citigroup decided to sell substantially all of its asset management business to Legg
Mason in exchange for Legg Mason's broker-dealer business. As also shown in Figure 3-8, the

profitability of the business is not much lower than other business. However, major investment will be
required to continue this business due to its scale and technology-driven nature despite the pressure to
lower charges for asset management services. Such a decision would be based on the idea that a firm
should dispose of non-core and/or unprofitable and unpromising businesses and redeploy the sale
proceeds to core or more profitable businesses.
Citigroup's recent restructuring activities show that a financial conglomerate is not necessarily
an ideal business model in the banking industry. In particular, synergies between the banking and
insurance businesses cannot be easily realized.
As to the business model in which banks undertake the insurance business, an "open
architecture" model that focuses on the distribution of external products by outsourcing product
manufacturing, will become common practice in the banking industry.
3.4. J.P. Morgan Chase
3.4.1. Recent M&A activities
J.P. Morgan Chase created its current configuration through four major mergers. In 1991,
Manufacturers Hanover and Chemical Bank merged to consolidate their business base in the New York
area. In 1996, Chemical Bank merged with Chase Manhattan Bank to further consolidate its business base
in that region. As a result, the new Chase Manhattan Bank (CMB) became the largest bank in the U.S.
(based on assets), exceeding Citicorp. Both of those mergers aimed to consolidate the base of business in
New York and other focused regions, and to cut costs by eliminating overlap in the branch network and
redundant managerial resources.

These two mergers were good for CMB. It acquired more than 20% of the market share of
deposit balances in the New York area. Its operating expense ratio decreased from around 70% in 1990
(Manufacturers Hanover and Chemical Bank) to 55% in 1999. In 1999, CMB's ROE was higher than
Citicorp and Bank of America, and its stock enjoyed the best performance of the three banks.
Meanwhile, CMB was trying to strengthen its investment banking businesses, which were
expected to bring higher profitability. In 1999, it acquired Hambrecht & Quist (H&Q), an investment
bank that specialized in IPOs of IT venture companies. In 2000, CMB acquired Robert Fleming, a UK
investment bank and Beacon Group, which specialized in M&As. However, CMB's investment banking
business presence remained largely behind specialized investment banks such as Goldman Sachs or
Morgan Stanley. CMB's global market share of investment banking business in 1999 was even lower than
Citicorp: 7.8% in M&A advisory (Citigroup 12.6%), debt underwriting 5.0% (Citigroup 9.2%), and IPO
1.8% (Citigroup 4.1%) (UBS, 1999).
To enhance its investment banking capabilities, in 2000 CMB decided to acquire J.P. Morgan, a
leading global investment bank, thus creating a new entity named J.P. Morgan Chase. This acquisition
significantly changed its business structure. As shown in Figure 3-9, the weight of the investment banking
business (investment bank / wholesale + private equity) in net income increased by 11% after merging
Chase Manhattan with J.P. Morgan.
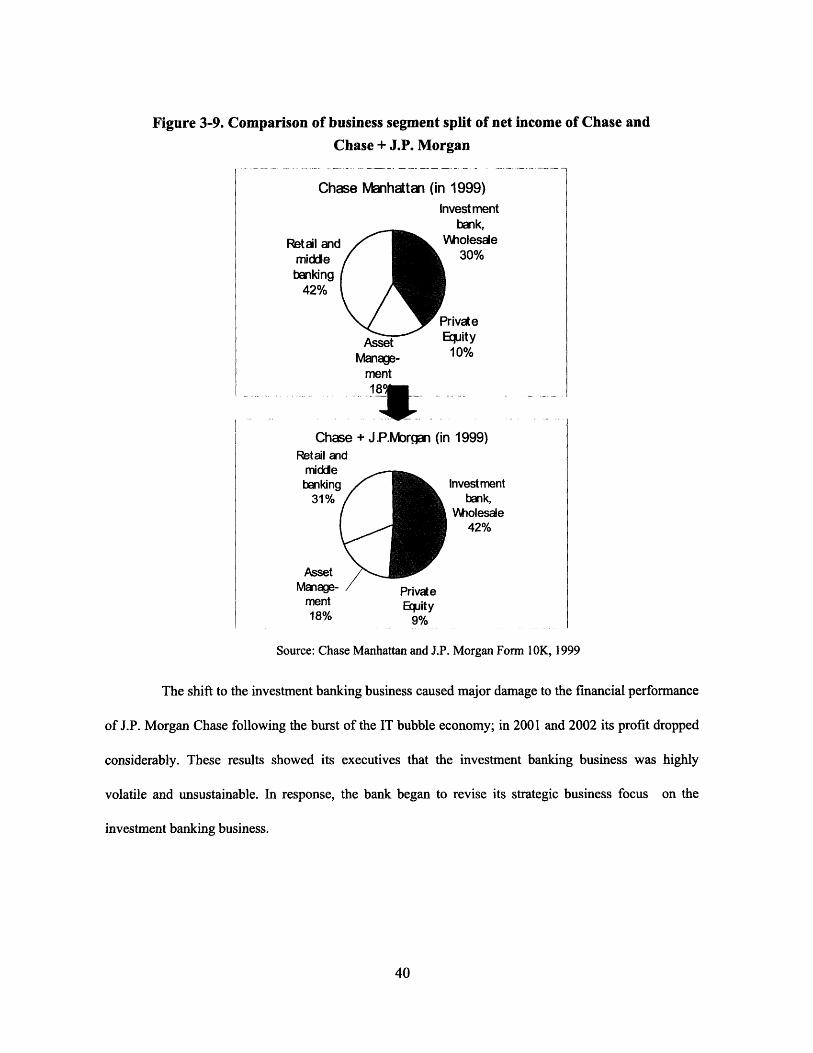
Figure 3-9. Comparison of business segment split of net income of Chase andChase + J.P. Morgan
Chase Manhattan (in 1999)Investment
knak.
Retail andmiddle
banking42%
'holesae30%
rivateiquity
Chase + J.P.Morgan (in 1999)Retail and
middebanking
31%
Asset
Investmentbank,
Wiolesale42%
Manage- / Privatement Equity18% 9%
Source: Chase Manhattan and J.P. Morgan Form 10 OK, 1999
The shift to the investment banking business caused major damage to the financial performance
of J.P. Morgan Chase following the burst of the IT bubble economy; in 2001 and 2002 its profit dropped
considerably. These results showed its executives that the investment banking business was highly
volatile and unsustainable. In response, the bank began to revise its strategic business focus on the
investment banking business.
Manage- 10%ment18
1W

In 2003, J.P. Morgan Chase acquired the U.S. insurance business from Zurich Life. The aim of
this acquisition was to strengthen its retail business capability through cross-selling of banking and
insurance products. The consolidation of Citicorp and Travelers also influenced this decision.
In 2004, J.P. Morgan Chase decided to merge with Bank One, a New York-based commercial
bank that had a competitive advantage in the consumer finance and credit card business. As a result of
this merger, J.P. Morgan Chase attempted to shift to the investment banking business and to achieve a
business portfolio that was well-balanced between investment banking and retail banking. As shown in
Figure 3-10, the weight of the investment banking business on net income decreased by 14% and the
combined weight of the middle/retail banking and credit card businesses increased by 12% after the
merger with Bank One.
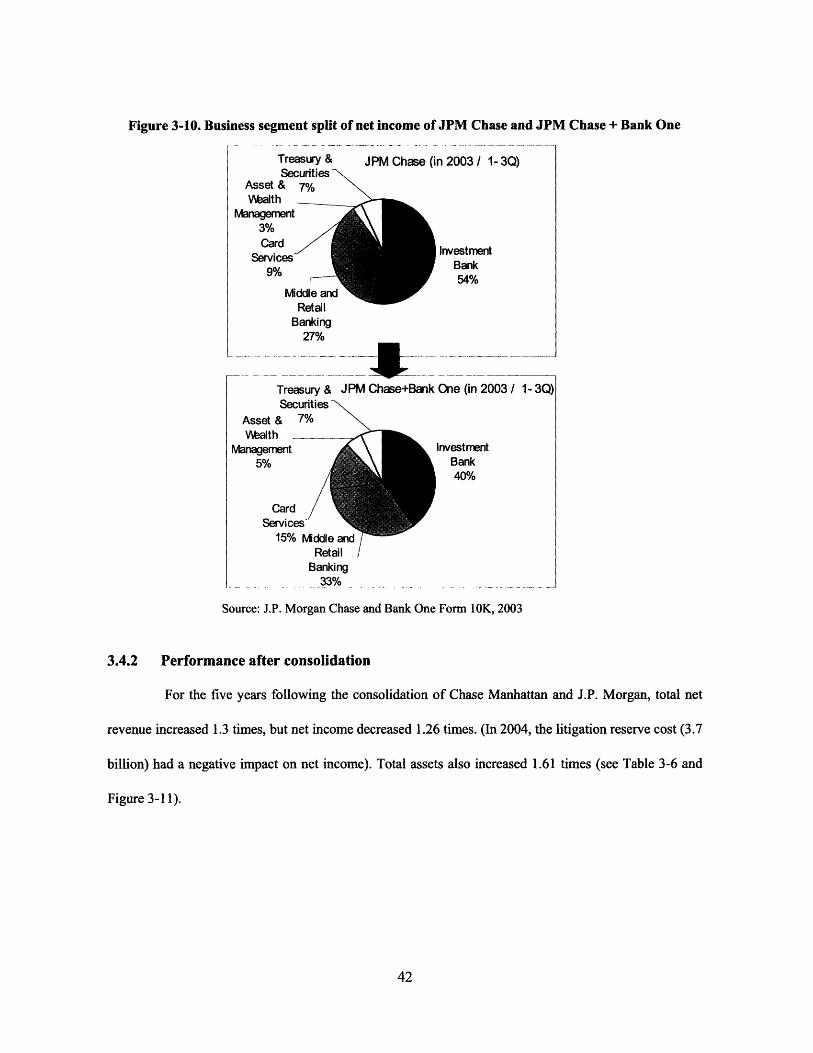
Figure 3-10. Business segment split of net income of JPM Chase and JPM Chase + Bank One
Treasury & JPM Chase (in 2003 / 1- 3Q)Securities
Asset & 7%Wealth
Management3%Card
Services9%
Middle aRt Lil
InvestmentBank54%
Banking27%
Treasury & JPM Chase+Bank One (in 2003 / 1- 3Q)Securities
Asset & 7%Vbalth
Management5%
CardServices
15% MidA
nvestmentBank40%
-... -''/Retail IBanking
33%
Source: J.P. Morgan Chase and Bank One Form 10K, 2003
3.4.2 Performance after consolidation
For the five years following the consolidation of Chase Manhattan and J.P. Morgan, total net
revenue increased 1.3 times, but net income decreased 1.26 times. (In 2004, the litigation reserve cost (3.7
billion) had a negative impact on net income). Total assets also increased 1.61 times (see Table 3-6 and
Figure 3-11).

Table 3-6. J.P. Morgan Chase Five-Year summary of selected financial
($billion) 2000 2001 2002 2003 2004Total Net Revenues 33.2 29.3 29.6 33.4 43.1Operating expenses 21.6 21.1 20.3 21.7 29.3Net Income 5.7 1.7 1.7 6.7 4.5Total Assets 715.3 693.5 758.8 770.9 1,157.2Common Stockholders' Equity 40.8 40.0 41.2 45.1 105.3Return on Asset (ROA) 0.8% 0.2% 0.2% 0.9% 0.4%Return on Common Equity (ROE) 14.0% 4.2% 4.0% 14.9% 4.2%Expense ratio (Operating expenses / 65.2% 71.8% 68.4% 65.0% 68.0%Total net revenues)
Source: J.P. Morgan Chase Form 10 OK 2004
Figure 3-11. J.P. Morgan total net revenues and income
$billion50.0
40.0
30.0
20.0
10.0
0.02000 2001 2002 2003 2004 Year
In 2001 and 2002, J.P. Morgan Chase suffered a decline in revenue and net income due to the
burst of the IT bubble. In 2003 its financial performance improved as the stock markets recovered. As
shown in Table 3-7, in 2002 net income from the investment banking business was small, but in 2003 it
improved significantly. In 2004, it maintained the same level as 2003.
Comparing results, it is clear that the investment banking business is volatile and not
sustainable. In contrast, net income from retail financial and card services was relatively sustainable, and
the 2004 merger with Bank One contributed to income increases for those services.
* Tota Net Revenues* Net Income

Table3-7. J.P.Morgan Chase Segment results of Net Income
($billion) 2002 2003 2004Investment Bank 0.4 4.5 4.6Retail Financial Services 2.2 2.4 3.5Card Services 1.0 1.0 2.0Commercial Banking 0.5 0.5 1.0Treasury & Securities 0.8 0.6 0.6Asset & Wealth Management 0.4 0.4 1.0
Source: J.P. Morgan Chase Form 10K 2004
As shown in Figure 3-12, net income from the J.P. Morgan Chase retail financial, credit card,
and investment banking businesses became equally diversified as a result of the merger with Bank One,
and its business portfolio came close to Citigroup's. This diversification will mitigate business risk
depending on the investment banking sector.
Figure 3-12. Business segment splits
Asset & J.P.Morgan Chase 2004Walth
ry &ities
rmm
RetalFinancialServices
27%Bank
80,
InvestmentBank36%
Card.crvrces16%
net income of JPM Chase and CitigrouD
Gobd Citigroup 2004Walth
ManagementGlobal
InvestmentMianagement
6%
CorporateInvestment
Banking1 31%
GlobalConsumer
Group57%
Source: J.P. Morgan Chase and Citigroup Form 10K, 2004
As shown in Figure 3-13, J.P. Morgan Chase also diversified its geographical business
portfolio like Citigroup, but net income from the Europe/ Middle East/Africa segment is larger than other
foreign areas. This can be attributed to the fact that most of its international business is based on J.P.
Morgan's and Robert Fleming's investment banking businesses in Europe.
TreasuSecur
50Y
Co
I (I~.....~~. _ _.__.

Figure 3-13. J.P. Morgan Chase Geographical split of income (2004)
Latin America6% 1
Norht America53%
Europe, MiddeEast, Africa
29%
Asia12%
Source: J.P. Morgan Chase Form 10 OK 2004
3.4.3 Organizational Issues Following Consolidation
The series of consolidations caused some organizational problems within J.P. Morgan Chase.
One problem was the difficulty of blending people from the former Chase Manhattan with those from J.P.
Morgan. According to Walter (2004), many key Morgan managers left the new organization due to what
they believed to be unfair treatment. Despite the fact that several business divisions were being conducted
under the J.P. Morgan brand (see Figure 3-14), it was said that most key managerial positions were held
by former Chase people. In addition, there were cultural differences between the two entities which
contributed to the difficulty of blending the entities following consolidation.
Figure 3-14. Organization of J.P. Morgan Chase
J.P. Morgan Chase
J.P. Morgan is the brand name Chase is the brand name
Investment Treasury Asset & Retail Card CommercialBank Securities Wealth Financial Services Banking
Services Management Services
Source: J.P. Morgan Chase Form 10K 2004
~~~ ~ -~~~~ --~~-~~-~-

3.5. Bank of America
3.5.1 Recent M&A activities
Bank of America was created through the merger of NationsBank and BankAmerica in 1999.
NationsBank had a strong presence in southeastern U.S., and BankAmerica had a major presence in the
West Coast. The merger of these two super-regional banks was complementary in geographic terms and
the goal was to create significant geographic coverage throughout the U.S. as well as creating advantages
of profit and cost economies of scale by spreading marketing and reducing administrative costs.
In 2003 Bank of America acquired Fleet Boston, the seventh largest bank in the U.S. with a
solid base in the northeast. The merger created the second largest bank in the U.S. with the largest
nationwide branch network and the largest share of deposit amounts in the U.S.
The main reasons for the merger were geographic expansion and consolidation of the business
base in the nationwide retail and middle banking business. The business structures of the former
NationsBank, BankAmerica, and Fleet Boston were quite similar in terms of their focus on the retail and
middle banking business. This was quite a contrast with the Citigroup consolidation which emphasized
products and international diversification, or the J.P. Morgan Chase consolidation which emphasized the
investment banking business.
In 2005, Bank of America acquired MBNA Corporation, the largest independent credit card
lender in the U.S., for the purpose of further consolidating its retail banking business. Through this
acquisition, Bank of America became the largest card issuer in the U.S., based on number of accounts,
with 40 million account holders. Bank of America and MBNA together held a total of approximately
$143 billion in outstanding card balances at the end of 2004, compared to J.P. Morgan Chase's $134.7
billion and Citigroup's $116 billion (Creditsights, 2005).

3.5.2 Performance after consolidation
In the past five years, total net revenue has increased 1.48 times and net income has increased
1.88 times, while total assets have increased 1.55 times (see Table 3-8 and Figure 3-15). Among the three
case studies, Bank of America recorded the largest increase of net revenue and net income over the past
five years. In this sense, it achieved the most success through its M&A strategy of the three banking
institutions.
Table 3-8. Bank of America Five-Year summary of selected financial data
($billion) 2000 2001 2002 2003 2004Total Net Revenues 32.9 34.6 34.5 37.9 48.8Operating expenses 18.6 20.7 18.4 20.1 27.0Net Income 7.5 6.7 9.2 10.8 14.1Total Assets 670.0 644.8 653.7 749.0 1,044.6Common Stockholders' Equity 47.0 48.6 47.5 49.1 83.9Return on Asset (ROA) 1.1% 1.0% 1.4% 1.4% 1.3%Return on Common Equity (ROE) 16.0% 13.8% 19.4% 22.0% 16.8%Expense ratio (Operating expenses / 56.5% 59.8% 53.3% 53.0% 55.3%Total net revenues)
Source: Bank of America Annual Report 2004
Figure 3-15. Bank of America total net revenues and income
$billion60.0
50.0
40.0
30.0
20.0
10.0
0.0
Total Net RevenuesSNet income
2000 2001 2002 2003 2004 Year

This success can be attributed to the bank's unrivaled presence in the nationwide retail and
middle banking markets, which were consolidated through a series of M&A. For example, the largest
holding share of banking accounts generated large amount of non-interest revenue solely from account
service charges in US$ 6.9 billion in 2004. It could successfully increase its market share in the U.S.
syndicate loan to corporate clients, especially medium and small companies, and achieve the largest share
in 2004 (see Table 3-9).
Table 3-9. Market share in the U.S. syndicate loan
1991 2004Share %)
1 Citicorp 16%2 Chemical 9% Chase 23 Chase 7% 3 Citi ou 11%
5 JP Morgan 6%
I
Source: Gold Sheets, IDD
Success also can be attributed to the less-volatile nature of its business structure. Bank of
America's revenue stream comes primarily from retail and middle banking business and is not largely
dependent on the investment banking business. As shown in Figure 3-16, the percentage of net income
from the investment banking business is small compared to Citigroup and J.P. Morgan Chase, which
meant that the bank suffered less impact when the IT bubble economy burst in 2001 and 2002, and the
bank has been able to achieve sustainable income growth in recent years.

Figure 3-16. Business segment split of Net Income
Asset & Others
Consumer& SmaIbusiness
46%
VWathManage-
ment11%
CapitaMarkets &Invest ment
Bank14% Cc
Source: Bank of America Annual Report 2004
Bank of America's relatively conservative attitude toward credit risk is one factor in its success.
In 2004, 70% of its consumer loan portfolio consisted of residential mortgages which have lower risk than
card loans or consumer finance, instead of lower interest margin. This is higher than Citigroup's 46%,
which is weighted toward card loans and consumer finance. This results in better credit quality (the
percentage of impaired loan is 0.24%) than Citigroup (0.52%) and J.P. Morgan Chase (0.45%) and in
smaller losses related to impaired loans.
The cost scale of economy is another factor in Bank of America's success. In addition to its
nationwide branch banking network, Bank of America has established extensive delivery channels such as
ATMs, customer service via telephone, and online banking. It is estimated that Bank of America has a
largest number of online banking users in the U.S. banking industry. Active online banking subscribers
increased 73% in 2004 (approximately half of which was due to the acquisition of Fleet Boston
customers) (Datamonitor, 2005). Its large size allows Bank of America to invest huge amounts of capital
into the development of a common system platform and efficient delivery channels across merged entities.
As a result, it could achieve cost efficiencies following its merger between BankAmerica and
banking(Midde
business)20%

NationsBank. As shown in Table 3-10, its expense ratio in 2004 was lower (55.3%) than before the
merger (57.2%).
Table 3-10. Bank of America Five-Year trend of operating expenses
1997($billion) (Expense ratio: %) (Nations+ 2000 2001 2002 2003 2004
BankAmerica)Total Net Revenues 27.8 32.9 34.6 34.5 37.9 48.8Operating expenses 15.9 18.6 20.7 18.4 20.1 27.0Expense ratio (Operating expenses / 57.2% 56.5% 59.8% 53.3% 53.0% 55.3%Total net revenues)
Source: Bank of America Annual Report 2004
3.5.3 Low valuation for growth opportunity
Bank of America will likely achieve success as a result of its M&A activities. However, it
currently suffers from lower valuation for its growth opportunity. Its price/earning ratio is lower than
Citigroup and J.P. Morgan Chase, although its performance is better than those institutions in recent years
(see Table 3-11).
Table 3-11: Valuation ratio of U.S. three mega banks
Bank of JP Morgan(%) (January 2006) CitigroupAmerica ChasePrice/Earnings1 10.6 11.4 18.0
Forward P/E2 10.3 11.5 12.9Return on common
16.8 15.7 4.2stock (in 2004)Dividend Yield 4.3 3.9 3.61Price/Earnings : A stock's current price divided by the company's trailing 12-month earnings per share.2Forward P/E: A stock's current price divided by the mean EPS estimate for the current fiscal year.
EPS Estimates are provided by Reuters Estimates.Source: Morningstar, January 2006

These results indicate that investors put a lower value on the future growth of Bank of America.
Investors may expect lower growth for several reasons. First is the limited opportunity for further
geographical expansion in the U.S. The bank already holds the largest market share in many states and it
would be difficult to pursue further extension. Second is Bank of America's lesser capability in the
investment banking business compared to Citigroup and J.P. Morgan Chase. In recent years it has
emphasized less on investment banking business than retail and medium banking business. As shown in
its segment result of net income in Chapter 3.5.2, the weight of investment banking business is small in
comparison to Citigroup and J.P. Morgan Chase. This business strategy resulted in smaller
competitiveness in the business. For example, its share in M&A advisory at 2004 (11.4%) is behind
Citigroup (13.3%) and J.P. Morgan Chase (19.4%) (Gold Sheets, 2005). As discussed in Chapter 3.5.2,
the business strategy enabled it to avoid negative impact from the burst of IT bubble economy and to
achieve good financial results in recent years. But investment banking business has an opportunity for
higher profits than retail and middle banking business instead of huge volatility. Smaller capability in the
business would give investors little expectation for the rapid and strong earning growth of Bank of
America.
For the sake of finding new growth opportunities, Bank of America takes on extending the
international reach. Reflecting on the failure in business in emerging markets of former BankAmerica, it
scaled down business in foreign countries in the 1980s and 1990s. As shown in Figure 3-18, the weight of
net income from foreign countries is only 4%.

Figure 3-18. Geographical spilt of income (2004)
Source: Bank of America Annual Report 2004
In 2002, Bank of America acquired a 24.9% stake in Grupo Financiero Santander Serfin,
Mexico's most profitable bank, from Santander Central Hispano. In 2005, it acquired 9% of the stock of
China Construction Bank, the second largest commercial bank in China, seeking to build long-term
prospects in the high-potential Chinese markets. But its attempt to extend its international reach remains
focused largely on the acquisition of minor interests in several foreign banking institutions, and it may
take longer to realize strong growth in the international business.
3.6 Summary
In this chapter, I discussed the trend of consolidation in the banking industry in the United
States. It was confirmed that regulatory reform encouraged banking institutions to consolidate. Some
created a financial conglomerate through merger with non-bank financial institutions. However, the
objective of consolidation was different among several financial conglomerates.
Europe, MiddleEast, Africa Latin America
AQI~i 1% 2%
1%
brthfnmerica
96%
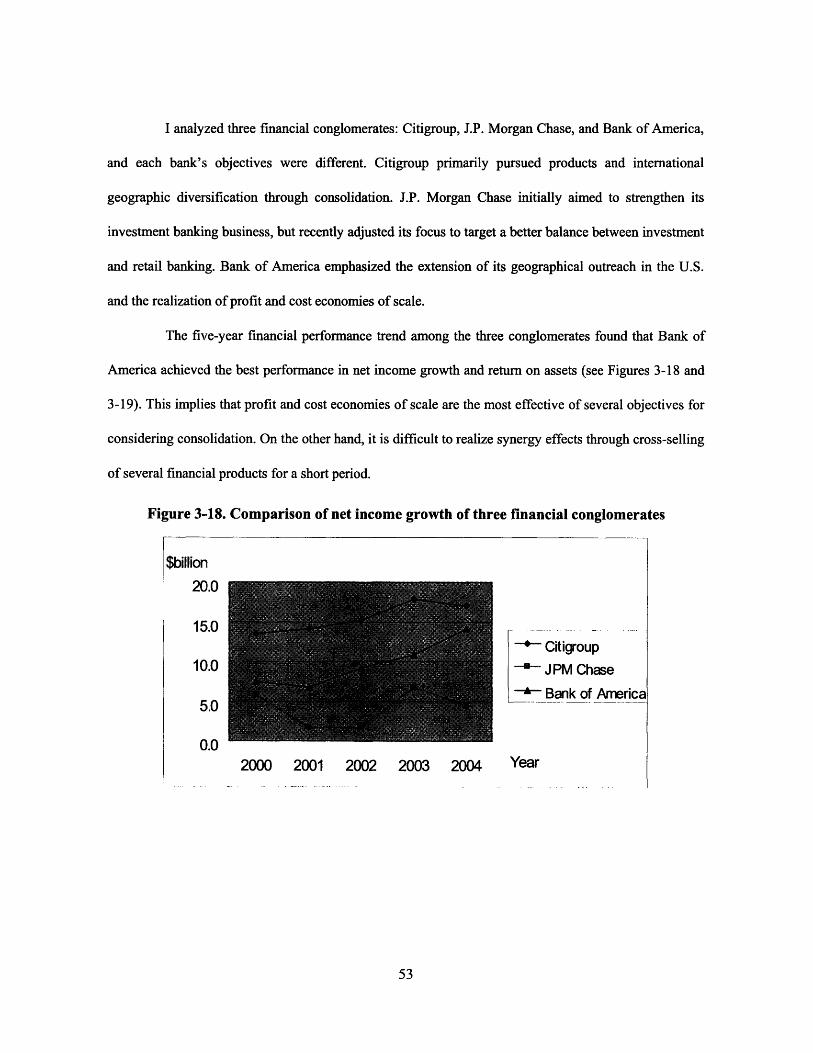
I analyzed three financial conglomerates: Citigroup, J.P. Morgan Chase, and Bank of America,
and each bank's objectives were different. Citigroup primarily pursued products and international
geographic diversification through consolidation. J.P. Morgan Chase initially aimed to strengthen its
investment banking business, but recently adjusted its focus to target a better balance between investment
and retail banking. Bank of America emphasized the extension of its geographical outreach in the U.S.
and the realization of profit and cost economies of scale.
The five-year financial performance trend among the three conglomerates found that Bank of
America achieved the best performance in net income growth and return on assets (see Figures 3-18 and
3-19). This implies that profit and cost economies of scale are the most effective of several objectives for
considering consolidation. On the other hand, it is difficult to realize synergy effects through cross-selling
of several financial products for a short period.
Figure 3-18. Comparison of net income growth of three financial conglomerates
$billion
20.0
15.0
10.0
5.0
. 2000 2001 2002 2003 2004 Year
Citigroup
JPM Chase
Bank of America

Figure 3-19. Comparison of Return on Asset (ROA) of three financial conglomerates
1.6%1.4%1.2%1.0%0.8%0.6%
0.4%02%n no/L
Citigroup
SJPM ChaseSBank of America
2000 2001 2002 2003 2004 Year
Source: Author, 2006
At this stage, investors do not put a higher value on financial conglomerates. As shown in Table
3-12, all forward price/earnings ratios of the three financial conglomerates are lower than the industry
average for commercial banks.
Table3-12: Valuation ratio of U.S. three financial conglomerates
(%) (January 2006) Citigroup JP Morgan Bank of Indu S&P 500Chase America Average
Price/Earnings 11.4 18.0 10.6 16.6 21.8Forward P/E 11.5 12.9 10.3 13.2 18.7
Source: MORNINGSTAR, January 2006
The so-called "conglomerate discount" arises from several issues associated with financial
conglomerates. The first issue is inefficient capital use and distribution across several business segments.
As discussed in section 3-3, Citigroup finally decided to sell a large part of its insurance business to

improve its profitability even though it had infused capital into the business for several years after the
merger.
The second issue is compliance risk. Organizational complexity resulted in the lack of strict
compliance control across several business segments and became one of the factors causing the scandals.
Citigroup and J.P. Morgan Chase suffered huge losses as a result of the Enron and WorldCom scandals.
The third issue is the unsuccessful fusion of several business entities. As discussed in section
3.4., J.P. Morgan Chase failed to harmoniously integrate employees from the two predecessor entities.
This failure prevented it from realizing the potential synergies that might have taken place between the
investment banking and corporate banking business segments. This is an example of the difficulty of
consolidating different corporate cultures during a merger.

Chapter 4
Consolidation in the European Banking Industry
4.1 Emergence of a Single Market for Financial Services
Since the end of World War II, most European countries had made major efforts to integrate
their economic markets. In 1986, the Single European Act was introduced to speed up the movement
toward a single internal market. In January 1993, the single internal market was created so that
cross-border barriers between European countries were largely eliminated, and people and commodities
could move freely.
At the same time, the integration of financial markets was also promoted. In 1989, the Second
Banking Directive was passed by the Commission of European Communities. This directive granted
financial institutions in the European Union (EU) a "passport" to offer financial services in the EU,
provided member states have banking laws that meet certain minimum standards. The passport means that
if a bank is licensed to conduct activities in its home country, it can offer any of these services in an EU
country without having to seek additional authorization from the host country. This rule encouraged
financial institutions in the EU to expand their businesses in other European countries or across the entire
European region.
The directive also covered third country banks, that is, banks headquartered in countries outside
the EU. The principle of equal treatment applies: the EU has the right to either suspend new banking
licenses or negotiate with the third country if EU financial institutions find themselves at a competitive
disadvantage because foreign and domestic banks are treated differently.

These articles established a favorable environment for foreign financial institutions, whose
home country allows European financial institutions to conduct business there, to enter the European
market. The directive also allowed financial institutions in the EU to conduct "universal banking"
including deposit taking, lending, mortgages, financial leasing, underwriting and dealing securities, and
asset management.
In January 1999, a single currency, the euro, was introduced for general use in the EU, and it
has been adopted by Germany, France, Italy, Spain, Portugal, Finland, Austria, Belgium, Luxembourg,
Netherlands, and Ireland (UK, Denmark, and Sweden have not yet adopted the euro). This further
promoted the integration of EU financial markets, and enabled EU companies to access the most
favorable financial markets in the EU to raise money, while enabling individuals to invest in securities
products of other European countries.
Although it has not adopted the euro, the UK has promoted deregulation in financial markets in
parallel with the integration of the EU financial markets. Unlike European continental countries, the UK
had prohibited commercial banks from conducting business in securities and insurance. But the Building
Societies Act passed in 1986 triggered the financial "Big Bang," which eliminated the "firewall" between
banking, securities, and insurance. The Act proposed reforming building societies (mutual associations
that offer their subscribers funds for house purchasing or building) by allowing them to convert into
commercial banks. In return, commercial banks were allowed to conduct securities and insurance
businesses. At that time, as the country's population grew older, the demand for annuity and life
insurance products rapidly increased. In response, UK commercial banks established insurance
subsidiaries or acquired insurance companies.
The financial "Big Bang" encouraged non-financial firms to enter the banking businesses. As
discussed in Chapter 1, both Tesco and Sainsburys, large UK supermarket chains, launched on-line

banking. In addition, banking institutions in continental Europe and the U.S. expanded their presence by
acquiring UK merchant banks. New entrants from the non-banking sector and from foreign countries
made competition in the UK banking industry fierce.
The integration of financial markets and the introduction of a single currency encouraged the
EU banking institutions to expand their businesses throughout the entire EU region. Also foreign banking
institutions, including U.S. banks, also entered the EU market. As a result, competition in the EU banking
market became fierce. More and more corporate and individual clients asked for services that covered the
entire EU. Under these circumstances, many EU banks were encouraged to consolidate in order to
enhance their business capabilities. Examples of major bank consolidations in the EU are shown in Table
4-1.
Table 4-1. Examples of recent consolidation in the European banking industry
Year Acquirer Name Target Name1997 Bayerische Verainsbank (Germany) Bayerische Hypotheken (Germany)1998 UBS (Switzerland) SBC (Switzerland)1999 Banco de Santander (Spain) Banco Central Hispano (Spain)1999 BNP (France) Paribas (France)1999 Banca Intensa (Italy) Banca Commerciale Italiana (Italy)2000 Royal bank of Scotland (UK) National Westminster (UK)2000 HSBC (UK) Credit Commercial de France (France)2001 Halifax (UK) Bank of Scotland (UK)2002 Credit Agricole (France) Credit Lyonnais (France)2004 Banco de Santander (Spain) Abbey National (UK)
Source: Walter, "Mergers and Acquisitions in Banking and Finance", Oxford, 2004
In addition to consolidations between banks, there were also frequent consolidations between
banks and insurance firms, creating "Bankcasurance." Acquisition of banking institutions was attractive
to insurance firms since they could use the bank's network as an extended delivery channel for their
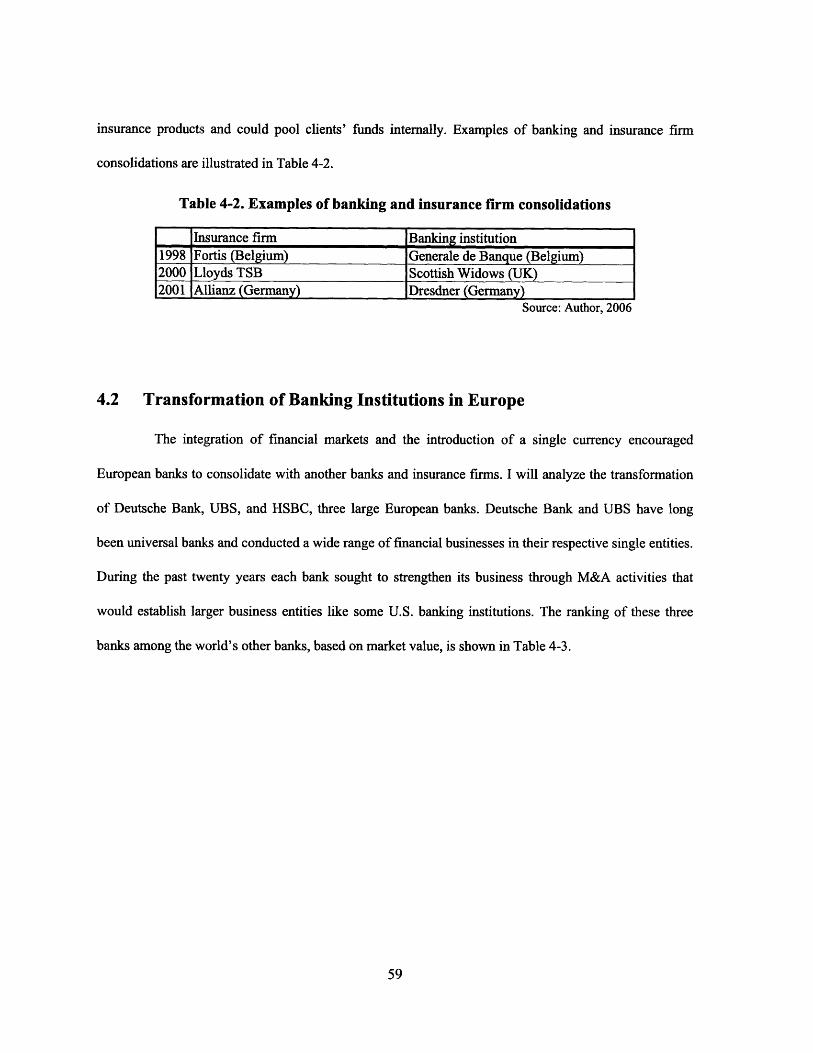
insurance products and could pool clients' funds internally. Examples of banking and insurance firm
consolidations are illustrated in Table 4-2.
Table 4-2. Examples of banking and insurance firm consolidations
Insurance firm Banking institution1998 Fortis (Belgium) Generale de Banque (Belgium)2000 Lloyds TSB Scottish Widows (UK)2001 Allianz (Germany) Dresdner (Germany)
Source: Author, 2006
4.2 Transformation of Banking Institutions in Europe
The integration of financial markets and the introduction of a single currency encouraged
European banks to consolidate with another banks and insurance firms. I will analyze the transformation
of Deutsche Bank, UBS, and HSBC, three large European banks. Deutsche Bank and UBS have long
been universal banks and conducted a wide range of financial businesses in their respective single entities.
During the past twenty years each bank sought to strengthen its business through M&A activities that
would establish larger business entities like some U.S. banking institutions. The ranking of these three
banks among the world's other banks, based on market value, is shown in Table 4-3.

Table 4-3. Ranking of world's banking institutions
Total Market value Total Asset Amount2004/08) ($million) (2003) ($million)
1 Citigroup US 240,888 1,264,0322 Bank of America US 183,410 93680
4 J.P.Morgan Chase US 141,037 1,097,4755 Wells Fargo US 99,144 387,7986 Royal Bank of Scotland UK 87,048 814,227
8 Wachovia US 61,675 401,0329 Barclays UK 59,738 792,743
Source: The Wall Street Journal 2004.9.27
4.3 Deutsche Bank
4.3.1 Recent M&A activities
Deutsche Bank has long been the largest bank in Europe, with strong relationships with many
other German large companies through cross-shareholding and delegation of company auditors.
Traditionally, Deutsche Bank's core business has been conventional commercial banking activities, such
as loans and foreign currency trading. Its securities business was another key business line because many
German corporations depended on bank loans to raise capital.
However, the emergence of a single EU financial market encouraged many German companies
to shift to capital markets in other European countries if they could find more favorable term.
Furthermore, an increase of new European and U.S. banking institutions into Germany's capital market
created fierce competition. In those circumstances, Deutsche Bank's loan balance was restricted and its
loan margin declined from 3% in the 1980s to 2% in the early 1990s, producing a negative impact on

earnings and growth. In response, Deutsche Bank attempted to move its business out of conventional
commercial banking and strengthen its investment banking.
Deutsche Bank had another reason for shifting to the investment banking business: the retail
and middle banking businesses in Germany were becoming increasingly unattractive. In these markets,
state-owned regional and local savings banks still maintain a strong position with about 80% share of
retail deposits and loans, while Deutsche Bank had a 5% share of retail deposits. In addition, high
operating expense ratios as a result of labor conditions had a negative impact on profitability. In response,
Deutsche Bank sought to extend its retail business into other European countries, such as Italy and Spain,
through acquisitions of those countries' small banks. However, this strategy requires considerable time
before improved profitability is realized.
To enhance its investment-banking capability, Deutsche Bank acquired the UK merchant bank
Morgan Grenfell in 1989. But Deutsche Bank did not succeed in integrating the two organizations and
many of the specialist personnel at Morgan Grenfell left the new entity. Consequently, this acquisition did
not produce the hoped-for capability enhancements. To improve the situation, Deutsche Bank attempted
to fully integrate Morgan Grenfell into its London corporate finance headquarters by establishing
Deutsche Morgan Grenfell (DMG) in 1995. Through those efforts, it gradually enhanced Deutsche
Bank's presence in capital markets. For example, Deutsche Bank's ranking in the U.S. security
underwriting table improved, moving from twentieth in 1996 to seventeenth in 1997. However, Deutsche
Bank was never appointed lead manager for major deals, such as the restructuring of AEG or the merger
between Daimler and Chrysler, which prompted the bank to take further steps to strengthen its investment
banking capability.
In 1998, Deutsche Bank acquired Bankers Trust, the eighth-largest bank in the U.S. The
objective of this acquisition was to establish a strong position in the derivative markets, risk management,

and high-yield debt finance which was important in the run-up to IPOs and in leveraged buyouts, which
were expected to experience above-average growth in Europe in the future.
Meanwhile, Deutsche Bank also strengthened its asset and wealth management businesses to
improve profitability in the private banking business and to build a second pillar of growth in investment
banking. It acquired the institutional asset management business of Prudential UK as well as First
Australian Property Group in 2000. In 2002 it acquired the U.S. asset manager Zurich Scudder
Investments from Zurich Financial Services. In 2005, Deutsche Bank announced its entry into the China
fund management market through a joint venture with Harvest Fund Management Company.
Through this series of M&As, Deutsche Bank took several steps to transform itself from a
conventional commercial bank to a firm that specializes in investment banking and asset management. As
Figure 4-1 shows, non-interest revenue (i.e., commissions and fee income + trading revenues) rose
dramatically from 1991 to 2004 while interest revenue remained at a plateau. This illustrates the shifting
of Deutsche Bank's business structure from dependence on loan assets to a fee business based on trading
and advisory services.
Figure 4-1. Deutsche Bank revenue transformation
$billio~n30.025.020.015.010.05.0n~ f't
* Noninterest revenueM Interest revenue
9 .1991 2004 Year
Source: Deutsche Bank Annual Report 1999 and 2004
----

In 2004, Deutsche Bank rose to seventh position in the corporate and investment banking and in
asset/wealth management businesses handled by global banking institutions (see Figure 4-2).
Figure 4-2. Deutsche Bank's corporate/investment banking and asset/wealth management, 2004
Corporate Investment bank
0 2 4 6 8
CitigoupJP.Morgan
Goldnmn SachsIMeVrrill Lynch
Mvorgan StanleyUBS
Deutsche Bank
Source: Deutsche Bank Investors Presentation 2004
Deutsche Bank also grew internationally through its M&A activities. As Figure 4-3 shows, in
the past its revenue stream depended on the German market. Today its dependence on the German market
has declined and greater geographic diversification has been achieved.
Figure 4-3. Deutsche Bank's revenue diversification and geographic split
1989U.SA. Asia /
Europe 1% Pacific
excl.Germany
16%
17o
GermanyL10oI
P
2004Asia /
Ger332%
Europeexcl.
G imlil
31%
Source: Deutsche Bank Investors Presentation 2004
Asset / Vbalth Management$billion
0 5 10 15
CitigoupJP.Morgan
UBSCredit Suisse
Morgan StanleyMerrill Lynch
Deutsche Bank
ur /o

4.3.2 Performance after consolidation
In 2000, income tax benefit from the effective tax rate and the reversing effect increased total
net revenues and net income. For four years since 2001, net income has increased 16 times while total net
revenue has decreased by 25%. Total asset has decreased by 10% (see Table 4-4, and Figure 4-4). The
increase of impaired loans had a negative effect on revenues in 2001, 2002, and 2003. Revenue growth
and asset decrease in 2004 mainly came from reducing of impaired loan.
Table 4-4. Five-year summary of selected financial data for Deutsche Bank
($billion) 2000 2001 2002 2003 2004Total Net Revenues 46.0 38.6 33.0 27.2 29.1Operating expenses 36.7 36.1 28.3 23.4 23.7Net Income' 18.3 0.2 0.5 1.8 3.2Total Assets 1,257.5 1,243.1 1,026.6 1,087.9 1,137.2Total Stockholders' Equity 59.0 54.3 40.5 38.2 35.1Return on Asset (ROA) 1.5% 0.0% 0.1% 0.2% 0.3%Return on Common Equity (ROE) 31.0% 0.4% 1.3% 4.6% 9.3%Expense ratio (Operating expenses / 79.7% 93.7% 85.7% 86.1% 81.4%Total net revenues)
In 2003, 2002 and 2001, these figures reflect the cumulative effect of changes in accounting principle.
Source: Deutsche Bank Annual Report 2004
Figure 4-4. Deutsche Bank's total net revenues and income. . .... . . . ... .. .. .. . .. . . . ..... . ... . . . . . .. .. ... . ..
$billion50
40
30
20
10
0
.0
.0
.0
.0
.0
* Total Net Revenues* Net Income
2.U2000 2001 2002 2003 2004 Year

Total net revenues and net income have shown some recovery, and accordingly, profitability
has improved. But ROA and ROE are still lower than U.S. rivals such as Citigroup and J.P. Morgan (see
Figure 4-5).
Figure 4-5. Deutsche Bank's ROA and ROE trends
ROA
1.5%1.3%1.0%0.8%0.5%0.3%0.0%
2001 2002 2003 2004Year
U.U0o
2001 2002 2003 2004Year
Source: Deutsche Bank Annual Report 2004
The lower profitability can be attributed mainly to an inefficient cost structure. As shown in
Figure 4-6, the operating expense ratio remains very high (around 80%). This means that Deutsch Bank
did not achieve cost economies of scale through its M&A, and further consolidation and restructuring in
its merged businesses will be required.
Figure 4-6. Deutsche Bank's five-year trend of operating expenses
2000 2001 2002 2003 2004
Source: Deutsche Bank Annual Report 2004
ROE%
20.0%16.0%12.0%
8.0%4.0%I'. f'tl/'
100%
90%
80%
70o/%i v/u

4.3.3 Integrating a Commercial Bank with an Investment Bank
Deutsche Bank's various M&As offer some insights into the process of integrating the very
different cultures of a commercial bank with an investment bank. As a conventional commercial bank,
Deutsche Bank had long emphasized long-term results, organizational performance, and a conservative
attitude toward risk. In contrast, investment banks usually emphasize short-term results, individual
performance, and active risk-taking. As mentioned in section 4-3-1, Deutsche Bank experienced some
difficulty in its attempt to integrate Morgan Grenfell into the Deutsche Bank culture, and in the end,
Deutsche Bank decided to allow the merger to take an independent course. This lack of control caused
several problems, including a rogue employee scandal and the defection of key staff.
After considering the failure, Deutsche Bank decided to change its management structure. In
1997, it appointed Rolf Breuer, from the investment banking division, as chairman. In 1996, it picked
Josef Ackermann, a member of the board of managing directors from Credit Suisse, as its current
chairman. Those two experts from investment banks tried to change Deutsche Bank's culture by
introducing a performance-based compensation system and hiring outside professionals. They also tried
to preserve the good aspects of Deutsche Bank's culture: a strong focus on client and relationship-based
business. The primary reason why they selected Bankers Trust of many investment banks was that both
banks had similar philosophy focusing on long-term relation with clients.
After its acquisition of Bankers Trust, Deutsche Bank worked to make the integration of the
two cultures work more smoothly than had happened with Morgan Grenfell. In this case, Breuer and
Ackermann paid special attention to the integration, and made use of their experience and deep
understanding of the investment banking culture. This illustrates the importance of management structure
and careful consideration of culture during the process of M&A.

4.4 Union Bank of Switzerland (UBS)
4.4.1 Recent M&A activities
In 1998, Union Bank of Switzerland (UBS) merged with Swiss Bank Corporation (SBC) to
become the largest banking institution in Europe based on total assets. The purpose of the merger was to
attain the leading position in investment banking and asset/wealth management at the global level.
Until the mid-1980s, banks in Switzerland held their leading position based on strong financial
markets in their home country. But the emergence of the single European financial market and the decline
in value of the Swiss franc through the decrease of capital flight, eroded the competitive advantage of the
Swiss financial market and its banking institutions. In response, UBS (which was strongly competitive in
the asset management business) decided to merge with SBC (whose strength was investment banking).
Earlier, SBC had enhanced its investment-banking capability through the acquisition of SG Warburg
(UK), and Dillon Read (US)--both investment banks.
After the merger with SBC, UBS sought to strengthen its position in both business areas. In
2000 it acquired the US investment bank, PaineWebber. In 2004 it acquired Charles Schwab Sound View
Capital markets to strengthen its stock-trading capability on the NASDAQ. In 2004 it also acquired the
private-client business of Merrill Lynch in Germany and (IFA) Sauberborn Trust, a major German
financial advisor. It also purchased IFA Scott Goodman Harris and Laing & Cruickshank (both UK
institutions) in 2004. Outside Europe and the U.S., UBS tried to enlarge its business base through M&A.
For example, it acquired 49% of China Dragon Fund Management and Latin American Wealth
Management unit of Dresdner Bank Latinamerika. As a result of these mergers and acquisitions, UBS
now ranks fifth in Germany and the UK in the asset/wealth management business.

All these M&A activities were focused on the investment banking and asset/wealth
management businesses. Through several M&As, UBS became one of the leading financial institutions in
the both businesses. As shown previously in Figure 4-2, UBS is positioned sixth in investment banking
and third in asset/wealth management based on 2004 pretax profits. Approximately 80% of its profit
comes from these two business segments (see Figure 4-7). This proportion is the largest of the six U.S.
and European banks that are part of this thesis analysis.
Figure 4-7. UBS business segment income split, 2004
Business V\althBanking Manage-
OWILLUI lad lU
17%
PrivateBanks
5%
Ie•I IL
33%
GobalAsset
eI sVteL I IL IvIanage-Bank ment39% 6%
Source: UBS Annual Report 2004
As was the case for Deutsche Bank, UBS was able to grow internationally through M&As. As
shown in Figure 4-8, the revenue stream from the Swiss market has declined, while the U.S. and other
European markets have increased. But UBS has a smaller presence in the Asia Pacific region than other
competitors as Citigroup and Deutsche Bank.
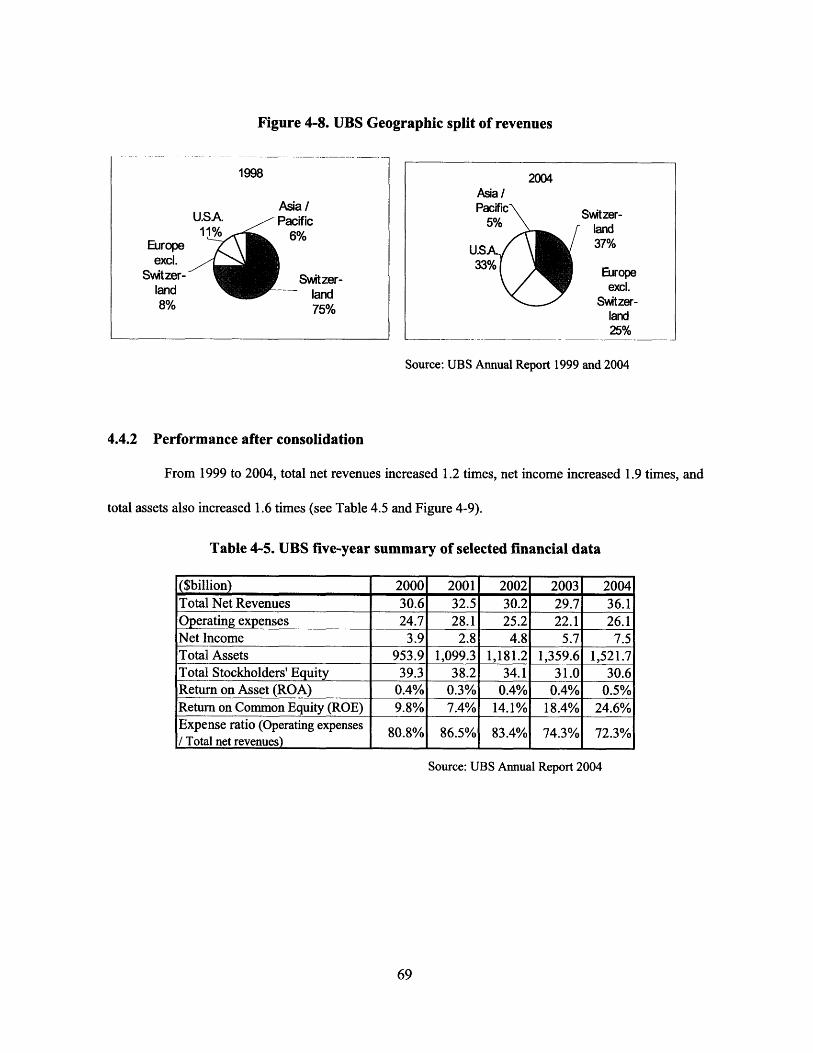
Figure 4-8. UBS Geographic split of revenues
Asia /Pacific
6%
Switzer-land75%
2004Asia /
Switzer-
37%
Europeexcl.
Switzer-land25%
Source: UBS Annual Report 1999 and 2004
4.4.2 Performance after consolidation
From 1999 to 2004, total net revenues increased 1.2 times, net income increased 1.9 times, and
total assets also increased 1.6 times (see Table 4.5 and Figure 4-9).
Table 4-5. UBS five-year summary of selected financial data
($billion) 2000 2001 2002 2003 2004Total Net Revenues 30.6 32.5 30.2 29.7 36.1Operating expenses 24.7 28.1 25.2 22.1 26.1Net Income 3.9 2.8 4.8 5.7 7.5Total Assets 953.9 1,099.3 1,181.2 1,359.6 1,521.7Total Stockholders' Equity 39.3 38.2 34.1 31.0 30.6Return on Asset (ROA) 0.4% 0.3% 0.4% 0.4% 0.5%Return on Common Equity (ROE) 9.8% 7.4% 14.1% 18.4% 24.6%Expense ratio (Operating expenses 80.8% 86.5% 83.4% 74.3% 72.3%/ Total net revenues)
Source: UBS Annual Report 2004
1998
U.SA.
Europeexcl.
Switzer-landon,
S70

Figure 4-9. UBS total net revenues and net income
$billion40.035.030.025.020.015.010.05.0A A/'
* Tota Net Revenues
SNet Income
Source: UBS Annual Report 2004
Since 2001, UBS's profitability has steadily increased, even thought its total assets also
increased. This can be attributed to three reasons: (1) increased revenue and income, (2) strict control of
operating expenses, and (3) the repurchase of its own stock. UBS also has utilized a flexible financial
strategy to reducing excess capital acquired through its M&As. It appears that UBS successfully captured
profit and cost economies of scale through its M&A.
4.4.3 Integration of IT infrastructure
Many bank consolidations are intent on reducing costs by integrating IT technologies. Given a
sensible merger strategy and the existing IT setups of the merging firms, four IT integration strategies can
be identified.
* Full integration or absorption of one firm's IT systems into the other's existing systems
* Keeping the systems separate and running the two IT platforms in parallel
* Combining the most efficient pieces of both firms' systems
* Developing a new, state-of-the-art IT system
u.u
2000 2001 2002 2003 2004 Year
.....................

From the standpoint of cost reduction and quick integration, full integration or absorption
would be the best strategy, but it is often difficult to decide which system should be adopted since the IT
staffs of each bank naturally claim that their technology is superior.
According to Walter (2004), the merger between UBS and SBC faced this difficulty. UBS had
its own Abacus suite that only worked on Unisys computers; SBC's software only ran on its
IBM-compatible mainframes. The two banks had invested decades in the development of their respective
systems, and both IT staffs were hesitant to abandon them. But top management of the new UBS did not
waste time making a decision. Soon after the merger, an external consultant was retained to evaluate the
competing systems, and the consultant recommended keeping the former UBS system. Top management
of the new UBS heeded this recommendation and by the end of 1999, the introduction of the UBS system
into SBC branches was complete. This quick decision and the speedy integration enabled the new UBS to
avoid added IT expenses and to realize operational efficiency. The new UBS reduced its IT outsourcing
expenses by 25%, from $1.4 billion in 1998 to $1.08 billion in 2004. The UBS case shows the importance
of an IT integration strategy as part of the merger process.
4.5 Hong Kong and Shanghai Banking Corporation (HSBC)
4.5.1 Recent M&A activities
The Hong Kong and Shanghai Banking Corporation (HSBC), which originated in Hong Kong,
has eagerly expanded numerous M&As. The main reason for this expansion was to adjust the bank's
heavy dependence on the domestic market in Hong Kong due to fierce competition in the Hong Kong
market and strong concerns about geopolitical risks associated with the reversion to China. HSBC

generated about half of its revenue in the Hong Kong market until it acquired Marine Midland Bank in the
U.S. in 1980 (Aono, 2005).
HSBC's most important acquisition was Midland Bank, the UK's fourth largest bank, in 1992,
in order to establish a strong presence in the UK. In 1993, HSBC moved its headquarters to London.
HSBC continued its policy of growth through M&A, with acquisitions of banks in Brazil and Argentina,
and the purchase of Republic New York Corporation in 1999. In 2000, it acquired Credit Commercial de
France and increased its shareholdings in Egyptian British Bank to over 90% (now HSBC Bank Egypt
S.A.E.). In 2001, it acquired Demirbank TAS, now HSBC Bank A.S., Turkey's fifth-largest private bank.
In 2002 it acquired Grupo Financiero Bital de in Mexico and also Household International, the
second-largest U.S. consumer finance company. In 2003, HSBC Insurance Brokers Limited formed a
joint venture with Ping An Insurance Company in China to offer insurance broking and risk management
services in Mainland China. It also acquired a stake in UTI bank, an India-based retail bank. It also
acquired a 19.9% stake in China's Bank of Communication and set up a business to offer local currency
credit cards in China (see Table 4-6).

Table 4-6. Recent M&A activities of HSBC
North America
(1980) Acquires
New York State's Marine
Midland (now HSBC
bank USA)
(1981) Establishes
HSBC Canada
(1983) Acquires
Carroll McEntee &
McGinley (now HSBC
Securities (USA))
(1999) Acquires
Republic New York
(2003) Acquires
Household International,US consumer finance
company
Europe / Middle East
(1982) Establishes
Egyptian British Bank
(1992) Acquires
Midland Bank
(1999) Acquires
Mid-Med Bank in Malta
(1999) Acquires
Safra Republic Holdings
(now HSBC
Luxembourg)
(2000) Acquires
Credit Commercial de
France
(2001) Acquires
Demirbank TASin Turkey
(2003)Establishes HSBC
Private Bank France
Asia
(1994) Establishes
HSBC Malaysia
(2001) Acquires
8% stake in
Bank of Shanghai
(2003) HSBC Insurance
forms a joint venture,Beijing HSBC Insurance
in China
(2003) Hang Seng Bank
acquires 15.98% ofIndustrial Bank, a China
commercial bank
(2003) Acquires
Fujian Asia Bank
(2004) Acquires
19.9% of Bank of
Communications,
China's fifth largest bank
South America
(1997) Establishes
HSBC Brazil
(1997) Acquires
Roberts S.A. de
Invesiones in Argentina
(2002) Acquires
Grupo Financiero Bital in
Mexico
(2003) Acquires
Lloyds TSB's Brazilian
assets including Losango
Promotora de Vendas, a
major consumer credit
institution
(2004) Acquires
The Bank of Bermuda
Source: Author 2006
The first objective of HSBC's M&A strategy was geographic expansion. HSBC attempted to
enhance its presence, not only in countries such as the U.S. and the U.K., but also in high-growth
countries such as China, India, Turkey, and those in South America. To date, HSBC has experienced
major revenue growth, especially in the Asia/Pacific (excl. HK) and North American regions for the past
six years (see Figure 4-10)

Figure 4-10. Revenue growth in each region
US$ billion
0 South America0 North America
0 Asia / Pacific ExcI.HKSEuropeSHong Kong
Source: HSBC Annual Report 1998 and 2004
As a result, the total amount of revenues in Asia/Pacific (excl. HK), North America, and South
America increased in 2004 compared to 1998 (see Figure 4-11).
Figure 4-11. HSBC Geographical split of revenues
1998 2004North South South HongKong
America\ America Hlong America 1 25%51 %0
Asia /PacificExcI.HK
1%
/Kong37%
Europe4140/
. Europe31%
Source: HSBC Annual Report 1998 and 2004
A distinctive feature of HSBC's geographical expansion through M&As is the expansion of its
business in higher-growth countries such as Brazil, India, and China. As shown in Table 4-7, profits from
those three countries increased in recent three years by 78%.
25
20
15
10
5
0
1998 2004 Year
I \ I I

Table 4-7. HSBC Profit before tax in China, India, and Brazil
(US$million) 2002 2003 2004Brazil 54 65 113India 85 94 180China (Mainland) 50 42 44Total 189 2011 337
Source: HSBC Annual Report 2003,2004
For example, HSBC gained a foothold in Brazil by acquiring a domestic retail bank,
Bamerindus, in1997. It had been under Central Bank intervention after speculation put it near collapse.
HSBC restructured Bamerindus to improve its profitability, and Bamerindus is now growing at 15%
annually despite a series of financial crises, including the 1999 devaluation of the local currency. By 2003,
HSBC was the ninth-largest bank in Brazil.
After restructuring Bamerindus, HSBC attempted to expand through repeated acquisitions. In
2000, HSBC doubled its asset-management portfolio by acquiring Credit Commercial de France, whose
Brazilian subsidiary was also active in corporate finance and private pensions. In 2003, HSBC purchased
Lloyds TSB's Brazilian assets, including its consumer finance business, Losango. In 2004, it acquired
CrediMatone SA, the consumer finance arm of Banco Matone SA.
One HSBC strategy is to extend the business models of banks obtained in the U.S. or European
countries. For example, it tried to transplant the consumer finance business model of Household
International, whose strength lines in high-risk consumer loans, mortgages, and auto loans. Several
Household staff are already working in Brazil to improve apply their know-how in credit scoring,
payment collection, and marketing. Profit from private financial services in Brazil increased from US$11
million in 2002 to US$51 million in 2004.

Losango already boasts 7.5 million customers, a figure HSBC plans to double within four
years.
4.5.2 Performance after Consolidation
From 1999 to 2004, HSBC doubled its total net revenue (2.1 times), net income (1.8 times), and
total asset (1.9 times) (see Table 4-8 and Figure 4-12).
Table 4-8. HSBC Five-Year summary of selected financial data
(US$ billion) 2000 2001 2002 2003 2004Total Net Revenues 24.5 25.8 26.5 40.9 50.5Operating expenses 10.1 15.4 15.8 22.4 27.7Net Income 6.4 4.9 6.2 8.7 11.8Total Assets 673.5 695.5 758.6 1,034.2 1,276.7Total Stochholders' Equity 48.0 48.4 55.8 80.2 90.0Return on Asset (ROA) 1.0% 0.7% 0.8% 0.8% 0.9%Return on Common Equity (ROE) 13.3% 10.1% 11.1% 10.8% 13.1%Expense ratio (Operating expenses / 41.2% 59.7% 59.6% 54.8% 54.9%Total net revenues)
Source: HSBC Annual Report 2004
Figure 4.12. HSBC total net revenues and income
$billion60.0
50.040.0
30.020.0
10.00n
U Total Net Revenues
U Operating expenses
2000 2001 2002 2003 2004 Year

Among the six U.S. and European banking institutions analyzed in this thesis, HSBC has
experienced the most rapid growth of revenue, income, and assets. Its basic M&A strategy was to invest
surplus profits from its dominant position in Hong Kong to acquire distressed assets and improve their
performance. For example, Midland Bank in California had been hurt by bad debts, but after HSBC
acquired it, performance improved and net income increased 2.8 times for four years since 1995 (Aono,
2005).
4.5.3 Control of Geographically Diversified Organizations
The example of HSBC provides some insight into managing a rapidly expanding and
functionally diversified organization. A headquarters holding company in London controls the
geographically scattered subsidiaries. To promote rapid decision making and local accountability, the
holding company provides only essential functions such as strategic planning, human resource
management, and legal, administrative, and financial planning and control. It also maintains the HSBC
universal banking system, the platform on which most IT applications run, as well as a multifaceted risk
and credit control system. HSBC delegates operational authority to subsidiary heads, each of whom strive
to meet annual operating targets as part of a five-year group strategic plan.
While HSBC emphasizes local accountability in order to maintain local flexibility, its risk and
credit functions in the holding company strictly control the implementation of group lending guidelines
on a global basis according to country, sector, line of business, financial instrument, and counterparty
bank ratings. All transactions exceeding $50 million are submitted to London for same-day approval. In
this respect, HSBC differs from several of its competitors that allocate risk limits geographically and
leave it to local managers to decide what instruments to use to generate revenue locally.

HSBC utilizes a global matrix organization structure, which overlays "customer groups," or
lines of business, on its geographic organization. The customer groups include Corporate and Investment
Banking and Markets, Personal Financial Services, Private Banking, Commercial Middle Market, and
Consumer Finance. This structure helps keep the geographic and customer group perspectives closely
linked. In addition, HSBC attempts to enhance its knowledge management. For example, it established an
enterprise knowledge platform in the Asian region which can be accessed by its 37 million employees.
This structure also helps HSBC make the best use of its global reach and shared best practices
in product development, management, and marketing. One example of extending best practice across
multiple regions is HSBC's insurance business. Through the acquisition of Midland Bank, the company
tried to extend its insurance business knowledge to the Asian region, including its knowledge of on-line
insurance products. HSBC successfully increased its insurance business revenue by 7% annually in Hong
Kong, and its insurance commission income in Asian countries (excl. HK) by 134% from 2003 to 2004.
A balance between regional accountability and global integrity, and strategic knowledge
sharing/extension are key aspects of HSBC's geographic expansion through M&As.
4.6 Summary
In this chapter, I discussed consolidation trends in the banking industry in Europe. The analysis
confirmed that the integration of financial markets and the introduction of a single currency encouraged
banking institutions to consolidate.
The primary objectives of consolidation for Deutsche Bank, UBS, and HSBC were similar.
Through M&A, the three institutions expanded out from their home country markets where they could not
longer expect rapid growth.

However, the focus and process of their M&A activities were not the same. Deutsche Bank
changed its business structure from that of a conventional commercial bank to one focused on investment
banking. UBS experienced the horizontal integration of two banks that had similar strategies focused on
investment banking and asset management, and enhanced its competitive advantage in those business
segments. HSBC expanded geographically by focusing on higher-growth countries and on the
retail/consumer finance business.
In analyzing the financial performance of the three conglomerates, HSBC achieved the best
performance in net income growth and return on assets (see Figures 4-13 and 4-14). One reason is that
HSBC has the lowest operating expense ratio (54.9% in 2004) compared to Deutsche Bank (81.4%) and
UBS (72.3%). This can be attributed to its human resource practices. It pays executives much less
compared with other European and U.S. bank executives. It recruits better-than-average people rather
than paying millions of dollars to get star-quality people, which many European and U.S. banks rely on in
the investment banking business (TARUN and David, 2005).
Figure 4-13. Comparison of net income growth
$billion16.014.012.010.08.06.04.02.0AIt'
Deutsche Bank
SUBSSHSBC
2000 2001 2002 2003 2004 Year

Figure 4-14. Comparison of return on assets
2000 2001 2002 2003 2004 Year
Source: Author, 2006
Today, investors place somewhat higher value on European financial conglomerates than on
those based in the U.S, but not much higher than the industry average (see Table 4-9).
Table 4-9. Valuation ratio of the three European financial conglomerates
(January 2006) Bank Average
Price/Earnings 18.5 17.8 15.4 16.6 21.8Forward P/E 12.2 13.7 13.1 13.2 18.7
Source: MORNINGSTAR, January 2006
The analysis of these three European financial conglomerates illustrates some important points
of managing a consolidated financial firm.
Li The governance capacity of top management. It is important for top management to show strong
governance capability and expertise in the acquired business in order to facilitate integration of

disparate firms with different business structures. As described in Section 4-3-3, Deutsche Bank,
formerly a conventional commercial bank, was able to integrate its acquired investment banks
through strong governance practices implemented by its top management, which had considerable
experience in the investment banking business.
o A well-defined IT integration strategy. It is important to map out an IT integration strategy in the
early phase of consolidation, and then carefully implement it. An early and smooth integration of IT
enables the consolidated financial firm to avoid increased operating expenses and to capture scale
economies following the M&A. As discussed in section 4-4-3, UBS captured operational efficiency
through early integration of the IT infrastructures of two banking institutions.
o Balancing regional accountability and global integrity. Following global expansion through M&A,
it is essential to establish an effective and efficient authority structure to control the geographically
diversified institutions. As discussed in section 4-5-2, HSBC experiences its successful growth
through a well-coordinated authority mechanism and actively sharing and extending its strong
in-house knowledge.

Chapter 5
Consolidation in the Japanese Banking Industry
5.1 Non-Performing Loans
The collapse of Japan's bubble economy in the late 1980s brought considerable damage to the
Japanese banking industry. In the early and mid-1980s, the Bank of Japan relaxed its monetary policy in
order to reduce the value of the yen against the US dollar in response to repeated U.S. requests for Japan
to reduce its trade surplus, which was undermining the value of the dollar. The change of the monetary
policy caused huge amounts of capital inflow into assets such as stocks and real estate in Japan. Many
finance companies (called "non-banks" in Japan) and even manufacturing firms invested in stocks and
real estate. As a result, stock market prices increased six-fold from 1979 to 1989. In 1985 the Nikkei
stock index was hovering around 10,000; by September 1989 it had risen to a peak of 38,916. Japanese
banks enthusiastically lent money to those companies to increase their profits and assets.
In 1989, the governor of the Bank of Japan, influenced by the Ministry of Finance, expressed
concern that the Japanese economy was overheating and was being threatened by inflation. In early 1990
the Bank of Japan tightened its monetary policy and interest rates spiked. This sharp rise in interest rates
pricked the bubble economy and triggered a decline of asset prices. The Nikkei index fell sharply to less
than 15,000--down 62% from its 1989 peak.
The collapse of assets prices caused major financial distress at many finance companies. In
addition, many non-financial companies suffered from the failure of investment into assets uncorrelated to

their core business. This financial distress at many Japanese companies harmed the loan assets of
Japanese banking institutions and non-performing loans quickly piled up.
In 1997, a major bank, Hokkaido Takushoku Bank, collapsed as a result of the amount of non-
performing loan, followed in 1998 by Long Term Credit Bank and Nippon Credit Bank. Soon the
Japanese population began to worry about the possible insolvency of the Japanese banking industry
because the collapse of major banks was one of the first experiences after World War II. To mitigate these
fears, the Japanese government decided to infuse public funds (Y21 trillion/US$200 billion) into several
banking institutions to restructure their impaired capital. This "bail out" rescued the Japanese banking
industry, but it brought severe criticism from the Japanese public for "overprotection" of the banking
industry, and led to rising demand for independent management of the banking institutions.
As a result, many Japanese banks began to consider consolidation as one way to strengthen
their ability to cope with non-performing loans. It was also hoped that consolidation would expand their
revenue sources to cover the write-off costs of non-performing loans. The banks asked the government to
eliminate the regulation that prevented them from moving into other financial business sectors such as
securities and insurance, whether by themselves or by their subsidiaries.
The Japanese government, which hoped to liberalize the financial markets and strengthen the
competitiveness of the Japanese financial industry, embarked on regulatory reform in the 1990s. In 1993,
banks were allowed to establish a securities subsidiary. In 1996, the "Big Bang" was announced which
created barriers separating the ownership of banks, trusts, securities firms, and insurance companies.
Establishment of financial holding companies was allowed. In 1998, banks were allowed to sell mutual
funds, and soon thereafter annuity insurance and securities products.

In 2005, the Japanese financial supervisory authorities (FSA) set a "Guideline for Financial
Conglomerates Supervision" which prescribes basic regulatory principles for financial conglomerates. It
is expected to facilitate the consolidation of Japanese financial institutions.
The combination of financial difficulties related to non-performing loans and regulatory reform
caused many mergers, and the Japanese government encouraged such consolidation. In the past fifteen
years (1990-2005), major Japanese banking institutions became largely integrated into three financial
groups (see Figure 5-1).
Figure 5-1. Recent bank mergers
Before 1995 1996 to 2000 After 2001
Mitsubishi bank
Bank of Tokyo
"I -l --' - - Il- - -
Sanwa bank,
Tokai bank
--1
uaa a au
Sumitomo bank
Mitsui bankSakura bank
Taiyo Kobe
Mizuho Financial Group
Sumitomo Mitsui Financial Group(SMFG)
I
Dai-Ichi Kangyo bank [
Fuji Bank i
Industrial Bank of Japan [
X7 A
I| •
I
""""""'""' '"'"' '
Toyo Trust

Regulatory reforms also encouraged banks to integrate with other kinds of financial firms such
as securities and consumer finance firms. At the current rate, however, such integration across different
financial entities is not occurring on the large scale seen in the U.S. and Europe. Typically, such
integration is taking place between small and medium-size security firms and banks. Three major security
firms-Nomura, Daiwa, and Nikko Cordial securities-still maintain managerial independence although
they have formed a strategic alliance with banking institutions, especially in business areas. The
integration between banking institutions and insurance firms has not yet happened except among some
new entrants that are Internet-only banks.
Regulatory reforms also motivated non-financial institutions to enter the banking business and
form a financial conglomerate. Sony established a financial holding company that subsidizes its banking
and insurance functions. Rakuten Inc., an Internet service company, provides insurance products and
credit card services through its Web portal site, and also plans to enter into banking business. I will
discuss these new types of financial conglomerates in the following chapter.
5.2 Transformation of Japanese Banking Institutions
The combination of financial difficulties related to non-performing loans and regulatory reform
encouraged Japanese banks to consolidate with each other. In this chapter, I will analyze the strategic
transformations of two major Japanese banking institutions: Mizuho Financial Group and Sumitomo
Mitsui Financial Group. I will analyze Mitsubishi UFJ Financial Group, the largest banking institutions in
Japan, in Chapter 6.
Before the bubble economy burst, Japanese banking institutions were a major presence in the
world markets. In 1990, they dominated the first to seventh positions among top banking institutions
based on market capitalization. But the bursting of the bubble economy, and the consolidation of U.S. and

European banking institutions eroded the market presence of Japanese banks. In 2004, only one,
Mitsubishi Tokyo Financial Group (current Mitsubishi UFJ Financial Group), remained within the top ten
world banking institutions (see Table 5-1).
Table 5-1. Ranking of world banking institutions
Total Market value Total Asset Amount(2004/08) ($million) (2003) ($million)
1 Citigroup US 240,888 1,264,0322 Bank of America US 183,410 936,6803 HSBC UK 171,135 1,034,2164 J.P.Morgan Chase US 141,037 1,097,4755 Wells Fargo US 99,144 387,7986 Royal Bank of Scotland UK 87,048 814,2277 UBS Switzerland 79,152 1,118,5538 Wachovia US 61,675 401,0329 Barclas UK 59,738 792,743
Source: The Wall Street Journal 2004.9.27
5.3 Mizuho Financial Group
5.3.1 History
Mizuho Financial Group (Mizuho) was formed in 2000 as the holding company for Dai-Ichi
Kangyo Bank (DKB), Fuji Bank, and the Industrial Bank of Japan (IBJ). DKB and Fuji had been the
largest commercial banks in Japan, while IBJ was a wholesale bank that provided loans and financial
services to large corporations. In 2002, these three banking institutions under Mizuho were reorganized
into two banking institutions: Mizuho Corporate Bank, which focuses on wholesale and investment
banking, and Mizuho Bank, which focuses on retail and middle banking. At the same time, the affiliated

security companies were consolidated into two security companies: Mizuho Securities, which focuses on
the wholesale market, and Mizuho Investors Securities, which focuses on retail and middle markets. In
addition, an affiliated trust bank, asset management companies, and credit card companies were
subsidized and a financial conglomerate was formed. The organization structure of Mizuho is illustrated
in Figure 5-2.
Figure 5-2. Organization structure of Mizuho Financial Group
Securities
MizuhoSecurities
MizuhoInvestorsSecurities
ShinkoSecurities
Trust /Assetmanagement
Trust &Custody
Services BankMizuho Trust _
Banking
DKBAssetManagement
FujiInvestment
DLIBJ AssetManagement
Others
SMizuho Capital(Venture Capital)
Mizuho ResearchInstitute
Mizuho Information& Research
(IT)
Mizuho has made several attempts to enhance its business capability through alliances. In 2004,
Mizuho agreed to cooperate with Orient Corporation, one of the largest consumer finance companies, to
expanding its consumer finance business. In 2005, Mizuho established business alliances with Credit
Saison, the third largest credit company in Japan, and with Japan East Railway Company to enlarge its
credit card marketing share. In 2005, Mizuho entered into an alliance with the third-largest security
company in Japan, Nikko Cordial Securities, to cooperate in the security business.
CreditCard
nmercialbank
Aizuho)rporateBank
MizuhoBank1---------Retail &
Middle
.
--
UC Card

5.3.2 Performance after consolidation
From 2002 to 2004, total net revenue has decreased by 9.1% while net income has increased
due to reduced operating expenses.
Mizuho achieved cost efficiencies through consolidation but did not realize increased revenues
(see Table 5.2 and Figure 5-3). The primary reason was the decline of interest revenue due to loan asset
reduction caused by adjusting clients' loan transaction shares which were duplicated among the three
former banking institutions and the write-off of non-performing loans. The loan transaction share
adjustment was one of the negative effects of consolidation. On the other hand, Mizuho has successfully
reduced its outstanding non-performing loans from US$50 billion in 2002 (6.4% of total loan) to US$14
billion in 2005 (2.1%).
Table 5-2. Mizuho four-rear summary of selected financial data($billion) 2002 2003 2004Total Net Revenues 20.4 19.7 18.6Operating expenses 11.5 10.5 10.2Net Income -22.1 3.8 5.8Total Assets 1,248.0 1,282.6 1,332.2Total Stockholders' Equity 26.6 33.9 36.4Return on Asset (ROA) -1.8% 0.3% 0.4%Return on Common Equity (ROE) -83.1% 11.2% 16.1%
Source: Mizuho Financial Group Annual Report 2004
Figure 5-3. Mizuho total net revenues and net income
$billion30.0
20.0
10.0
0.0
-10.0
- 20,0
- lIVI(
STotd Net Revenues
ENet IncomeY'ear

A distinctive characteristic of Mizuho's revenue structure is its heavy dependence on the
corporate and wholesale banking segments (see Figure 5-4). In contrast, its consumer and retail banking
segments are smaller compared to U.S. banks. Another distinctive characteristic is heavy dependence on
the domestic Japanese market (see Figure 5-5).
Figure 5-4. Mizuho business segment split of net revenue, 2004
Figure 5-5. Mizuho Geographic split of income, 2004
Europa_2%
Asia /Pacific
U.SA..-..--10%
excl.Japan
3%
In an
85%
Source: Mizuho Financial Group Investors presentation 2005
I

5.3.3. Issues regarding merger on the equal term
A distinctive feature of Misuho's consolidations is that the three legacy banks involved in the
merger-Dai-Ichi Kangyo Bank, Fuji Bank, and Industrial Bank of Japan-were equal partners in the
merger. But that very equality caused power struggles among the three that caused problems and delayed
the integration of the three banks.
One key challenge was how to integrate the three banks' respective IT infrastructures. In 1999,
the three banks decided that a merged retail bank should adopt Dai-Ichi Kangyo Bank's IT system.
However, that decision was rescinded in 2000 due to strong opposition from Fuji Bank, which was
concerned that Dai-Ichi Kangyo Bank would take a leadership role in developing any combined retail
banking platform. The banks eventually reached a compromise to install relay computers that connected
the three separate IT platforms, thus maintaining the existing systems for a period of time. In April 2002,
Mizuho encountered major IT problems that caused most of its 7,000 ATMs to malfunction and delayed
money transfers. The total number of pending money transfer orders reached 2.5 million. That problem
damaged public confidence in Mizuho. In the end, it took five years for Mizuho to complete the IT
integration once the merger was announced.
The second challenge was the integration of subsidiary companies of the three banks. Mizuho
maintains three security subsidiaries and asset management firms that formerly belonged to one of the
three banks. Power struggles occurred within the subsidiaries, which delayed group integration. The lack
of integration caused inefficiencies and less synergy. Additionally, it resulted in confusion among the
bank's clients. For example, Mizuho Bank opened new branches jointly with two security
subsidiaries-Mizuho Investors Securities and Shinko Securities. Even with three security subsidiaries of

its own, it still engaged in a business alliance with an out-of-group security company, Nikko Cordial
Securities. It seems to me that Mizuho Group's strategy was ambiguous.
5.4 Sumitomo Mitsui Financial Group
5.4.1 History
In 2001, Sumitomo Mitsui Banking Corporation (SMBC) was established as a result of a
merger between Sumitomo Bank and Sakura Bank. Sumitomo Bank was part of Sumitomo Group, a
Japanese large company network, while Sakura Bank (formerly Taiyo Kobe Mitsui Bank) had been part
of another large company network, Mitsui Group. The Sumitomo/Sakura merger was distinctive because
it was a consolidation across two separate company networks, Sumitomo and Mitsui. In 2002, Sumitomo
Mitsui Financial Group (SMFG) was formed as the holding company for SMBC.
SMFG holds the credit card business, lease business, and the research/IT subsidiary. It also
holds two securities subsidiaries: SMBC Friend Securities, which focuses on retail and middle markets,
and Daiwa Securities SMBC, which was established in 1999 as a joint venture between Sumitomo Bank
and Daiwa Securities, and is focused on the wholesale market. Sumitomo Bank transferred its investment
banking business function to Daiwa Securities SMBC. The organization structure of SMFG is illustrated
in Figure 5-6.

Figure 5-6. Organization structure of SMFG
Commercialbank
SumitomoMitsui
BankingCorporation( SMBC )
CreditCard
-----------------Sumitomo
MitsuiCard
Securities
DaiwaSecurities
SMBC------------------
SMBCFriend
Securities
Assetmanagement
Daiwa SBInvestment
Others
SMBC Leasing(Lease)
------ ~---~---`-----~------
The JapanResearch Institute
(Research/IT)
SMFG also attempted to enhance its business capability in consumer finance and the credit card
business through business alliances. In 2004, SMFG entered into a strategic alliance with PROMISE, one
of the largest consumer finance companies. In 2005, it formed a business alliance with NTT DoCoMo, the
largest mobile phone company in Japan, to create a new credit card market using mobile phones.
5.4.2 Performance after consolidation
SMFG's total net revenue remained at the same level following consolidation. Net income
became negative due to write-off expenses for non-performing loans (see Table 5-3). However, SMFG
achieved cost synergies after consolidation by reducing its operating expenses. The number of SMBC
employees was reduced from 27,000 at the merger to 21,000. The operating expense ratio declined to
37.4% in 2004-lower than other Japanese and foreign competitors. SMFG has also successfully reduced
its outstanding non-performing loans from US$54 billion at 2002 (9% of total loans) to US$16 billion in
2004 (3.3%).
Wholesale
----------------Retail &
Middle
- --
--------------------

Table 5-3. SMFG four-year summary of selected financial data
($billion) 2002 2003 2004Total Net Revenues 21.4 21.2 21.3Operating expenses 8.1 8.3 7.9Net Income -4.8 3.2 -0.3Total Assets 974.0 951.7 928.6Total Stockholders' Equity 22.6 28.6 25.8Return on Asset (ROA) -0.5% 0.3% 0.0%Return on Common Equity (ROE) -21.3% 11.2% -1.1%
Source: Sumitomo Mitsui Financial Group Annual Report 2004
SMFG's revenue structure is similar to that of Mizuho. The percentage of corporate banking
segments, including middle market and international banking segments, is larger while the consumer
banking segment is smaller compared to U.S. banks (see Figure 5-7). SMFG also earns a large part of its
revenue in the Japanese domestic market (see Figure 5-8).
Figure 5-7. SMFG business segment split of net revenue, 2004
Treasury20%iV /0
Inter-national___Banking
5%Corporate
Banking16%
Consumer- Banking
12%
MiddleK A,•r tU,4
L IVICOI R•1L
Banking47%

Figure 5-8. SMFG Geographic split of income, 2004
Asia /Europe Pacific
/ •v~lVAL#%.
Japan3%
apanl
2%U.SA.
4%
91%
Source: Sumitomo Mitsui Financial Group Investors presentation 2005
5.5 Financial Strategies of New Conglomerates
Technological advances and deregulation have changed the competitiveness of the banking
industry. Like U.S and European countries, several Japanese non-financial institutions have decided to
enter the banking and other financial sectors in order to establish financial conglomerates. The emergence
of these new entrants is an important force that encourages consolidation among existing banks for the
purpose of retaining their competitive advantage and maintaining current market share. In this section, I
will present examples of the strategies of two financial conglomerates: Sony Financial Holdings and
Rakuten Inc.
5.5.1 Sony Financial Holdings
Sony Financial Holdings (SFH) was established in 2004 as wholly owned subsidiary of Sony
Corporation, one of the world's largest electronic firms, by subsidizing Sony Bank, Sony Life (a life
insurance company), and Sony Assurance (a casualty insurance company). SFH was the first financial

group in Japan to offer banking and insurance service under one umbrella. Sony Bank was launched in
2001 as an Internet-only bank offering settlements, deposits, and loan services. Sony Life began
operations in 1981 delivering life insurance products through life planners or partners. Sony Assurance
was established in 1998 and offers non-life insurance products directly over the telephone or via the
Internet. The primary objective of consolidating the three financial companies was to realize synergies
across them and to create more optimal capital allocation.
SFH is eager to maximize its cross-selling of banking and insurance products. For example,
Sony Bank offers insurance products supplied by Sony Life on its Internet website. It also offers fire
insurance from Sony Assurance to its mortgage loan clients. Financial planners and partners of Sony Life
propose mortgage loans and mutual funds to their clients. They are expected to leverage their
understanding of clients' life planning to promote savings, investing, and borrowing services.
One of SFH's competitive advantages is the public's strong brand recognition of the Sony name.
By leveraging that brand power, Sony Banks has rapidly increased the number of account holders and the
deposit amount (see Figure 5-9). Sony Life holds the ninth largest share of the life insurance market in
Japan.
Figure 5-9. Number of account holders and deposits at Sony Bank
400000
350000
300000
250000
200000
150000
100000
50000
0
6000 ($million)
5000
4000Number of account
3000 holders
2000 .I - Deposit amount
10001
02001 2002 2003 2004 2005 Year
Source: Sony Bank HP, 2006
.. I- I

SFH also tried to expand its business by launching a security brokerage service on the Sony
Bank website. At the end of third quarter 2005, Sony had gained US$1.6 billion in revenue (8% of total
revenue) and US$399 million in operating income (23% of total operating income) from its financial
business segments.
5.5.2 Rakuten
Rakuten Inc. is an entrepreneurial Internet service company established in 1997. Its core
business is the operation of an electronic shopping mall that offers a wide range of products and services
through the Internet. It has become one of the largest Internet sites and a major rival to Yahoo Japan.
Since 2003, Rakuten has expanded its business into other areas, including financial services. In
2003, it subsidized DLJ Direct SFG Securities, an Internet securities company (now called Rakuten
Securities). It established credit card and consumer finance subsidiaries in 2005. In early 2006, it formed
business alliances with three financial firms: (1) American International Group, Inc., to launch into sales
of small-amount, short-term insurance products; (2) Shinsei Bank, to advance mortgage loans over the
Internet; and (3) Tokyo Tomin Bank to offer online banking services at Rakuten's website. Rakuten aims
to leverage its experience in Internet services and database marketing know-how to improve synergies
between each business company (E-commerce, portal and media, travel) and its financial business.
Rakuten has a huge potential to sell financial products to its fifteen million E-commerce
member clients. For example, Rakuten Securities rapidly increased the number of new account: from
3,000-4,000 per month before Rakuten's acquisition, to 18,000 today. In 2005, Rakuten generated
US$670 million in revenue (55% of total revenue) and US$174 million in operating income (53% of
operating income) in its financial business.

5.6 Summary
In this chapter, I discussed the consolidation trend in Japan's banking industry. It was
confirmed that the problem of non-performing loans coupled with deregulation encouraged banking
institutions to consolidate. Some created a financial conglomerate through merger with non-bank
financial institutions in the U.S. and Europe. However, the objective of consolidation was different among
each financial conglomerate.
Although the problem of non-performing loans in the Japanese banking industry has not yet
been solved, banks such as Mizuho and SMFG successfully overcame the problem through consolidation.
As shown in Figure 5-10, the balance of non-performing loans has decreased in all banks.
Figure 5-10. Trends in outstanding non-performing loansin the Japanese banking industry
US$ one-hlundredi billion
SMajor banks
All banks
--- Ratio of non-performing loansof major banks
9.0%8.0%7.0%6.0%5.0%4.0%3.0%2.0%
54.5
43.5
32.5
21.5
10.5
n
2002 2003 2004 2005 Year
Source: FSA
Mizuho and SMFG utilized consolidation to achieve their original objective of addressing the
problem of non-performing loans, and to enter the next stage where they pursue synergies across different
financial businesses in order to increase profitability. Although both conglomerates realized large assets
1.0%S0OL

through the process of conglomeration, their profitability remains lower than some U.S. and European
financial conglomerates (see Figure 5-11). (I will analyze the profitability of Japanese banks in the next
chapter.) In addition, both conglomerates will have to deal with the arrival of new entrants such as Sony
Financial Holdings or Rakuten, both of which gained new clients rapidly. Faced with such a situation,
Mizuho and SMFG will be required to establish a future conglomeration strategy rapidly.
Figure 5-11. Comparison of profitability, 2004
2.50%
2.00%
1.50%
1.00%
0.50%
U.UU0lo
Mizuho SMFG Citigroup JPM Bank of HSBCChase America
Source: Author, 2006
~~- ~~ -~ ~~ ~-'---~~--`~- ~ ~~~ ~-~ ~~~- ~~-~~~~~~~~-~~ ~~~-~~-~~ `-- -~~ ~-~~ ~

Chapter 6
Case Study: Mitsubishi UFJ Financial Group
6.1 History
In this chapter I will analyze the position and strategy of Mitsubishi UFJ Financial Group
(MUFG), the world's largest financial conglomerate (based on total assets), compared to other Japanese,
U.S., and European financial conglomerates.
MUFG was formed in 2005 as a result of a merger between Mitsubishi Tokyo Financial Group
(MTFG) and UFJ Group (UFJ), Japan's third- and fourth-largest financial conglomerates. Prior to the
merger, MTFG consisted of a commercial bank (Bank of Tokyo-Mitsubishi), a trust bank (Mitsubishi
Trust Bank), a securities firm (Mitsubishi Securities), and other subsidiaries. UFJ consisted of a
commercial bank (UFJ Bank), a trust bank (UFJ Trust bank), a securities firm (UFJ Tsubasa Securities)
and other subsidiaries. The merged entity known as MUFG consolidated the subsidiaries into the
following major subsidiaries: a commercial bank (Bank of Tokyo-Mitsubishi UFJ), a trust bank
(Mitsubishi UFJ Trust and Banking), and a securities firm (Mitsubishi UFJ Securities) (see Figure 6-1).

Figure 6-1. MUFG Organization Structure
Commercial bank Credit Card Securities Trust /Asset OthersConsumer Finance management
Bank of Tokyo- DCCard Mitsubishi Mitsubishi UFJ Mitsubishi UFJMitsubishi UFJ UFJ Trust & Research &
SUFJ Nicos Securities Banking ConsultingUnion mBank of Kabu.com Diamond
California DC Cash One Securities Mitsubishi UFJ Computer Service(US subsidiary) (Internet Asset (IT)
ManagementMobit Securities) Diamond Lease
MUFG's objective for the merger was to establish an overwhelming presence in the Japanese
and Asian financial markets by adding the geographic coverage and customer portfolios of MTFG and
UFJ. Regarding geographic coverage, 77% of MTFG's domestic branches were concentrated in eastern
Japan; in contrast, UFJ was more balanced, with 28% of its branches in central Japan and 34% in western
Japan. Furthermore, MTFG had the largest overseas network among all Japanese financial institutions, so
MUFG hoped to add UFJ's customer base.
The respective customer portfolios were also complementary. Over half of MTFG's loan
portfolio was to large companies (53% at end of March 2004), and UFJ's lending was weighted toward
medium- and small-size companies and individuals (64%) (see Figure 6-2).
100

Figure 6-2. Lending portfolios of MTFG and UFJ (as of March 31, 2004)
-MTFG
Overseas10% \
Individuals_19%
Mediurnm-I crmll-
Largecompanies
43%
sizedconmpanies
?RO%
Overseas L5%
Individuals26%
Mediur-I small-
sizedcompanies
.. .. . .. % .
Source: Source : Mitsubishi UFJ Financial Group Investors press release, February 2005
MUFG became the world's largest financial institution based on total assets, but it is the
world's seventh-largest based on total market value (see Table 6-1). MUFG aims to become one of the
top five global financial institutions based on market value by the end of FY 2008.
Table 6-1. Ranking of world's banking institutions
Total Market value Total Asset Amount(2004/08) ($million) (2003) ($million)
1 Citigroup US 240,888 1,264,0322 Bank of America US 183,410 936,6803 HSBC UK 171,135 1,034,2164 J.P.Morgan Chase US 141,037 1,097,4755 Wells Fargo US 99,144 387,7986 Royal Bank of Scotland UK 87,048 814,227
8 UBS Switzerland 79,152 1,118,5539 Wachovia US 61,675 401,03210 Barclays UK 59,738 792,743
Source: The Wall Street Journal 2004.9.27
101
LdI
- companies31%
I
I

6.2 Comparative Analysis
6.2.1 Profitability
In terms of total net revenue and net operating income, MUFG exceeds Mizuho and SMFG,
other Japanese financial conglomerates in this study, but lags behind the U.S. three financial
conglomerates and HSBC (see Figure 6-3).
Figure 6-3. Comparison of total net revenue and operating net income (2004)
Source: Author, 2006
In terms of ROA, MUFG is higher than Mizuho but lower than SMFG, the U.S. three financial
conglomerates and HSBC (see Figure 6-4).
102

Figure 6-4. Comparison of ROA (2004)
Source: Author, 2006
MUFG's lower profitability compared to the three U.S. financial conglomerates and HSBC can
be attributed to two reasons. The first is lower loan and deposit margins, as shown in Figure 6-5. MUFG
depends to a large extent on loan transactions for large corporate customers; this comprised 43% of its
loan portfolio in 2004. However, competition in this segment is severe, so it is difficult to earn high loan
margins. In comparison, the percentage of its loan portfolio to private customers, from which higher loan
margins can be expected, is only 24%. The percentage of loans provided to individual customers at
Citigroup is 78% and Bank of America is 62% (see Figure 6-6).
103
2.50%2.00%
1.50%1.00%
0.50%
0.00%

Figure 6-5. Comparison of loan and deposit margin (2004)
Figure 6-6. Comparison of loan portfolio (2004)
Source: Author, 2006
Recently, Japanese banking institutions have not participated actively in the consumer finance
business due to regulations that set an upper limit on the loan interest rate. As a result, the market share of
consumer loans at Japanese banking institutions was only 17% in 2003; independent consumer finance
companies held the largest share.
Japanese banking institutions were not allowed to provide revolving credit card loan service
until a few years ago, again owing to regulations-another reason for few consumer loans. Today, as a
104
8.00%7.00%6.00%5.00%4.00%3.00%2.00%1.00%n no)OL
4(l
800700600500400300200100
0
6 To Private Customer
STo Corporate Customer
I oý 0~ S;~~~4
v.v /U
US$ billion
v

result of less restrictive regulations, Japanese banking institutions are eagerly expanding their consumer
finance business by establishing consumer finance and credit card subsidiaries or forming business
alliances with such companies. More time will be needed, however, to realize significant revenue in the
consumer finance business.
A second reason for lower profitability is a weak capability to earn non-interest revenue (see
Figure 6-7). This weakness arises from two facts. First, until recently Japanese banking institutions were
not allowed to offer mutual funds and annuity insurance products for regulatory reasons, which
Figure 6-7. Non-interest revenue (2004)
Source: Author, 2006
in the U.S. and Europe are a major source of non-interest revenue for the financial conglomerates. Second,
investment banking competence among Japanese banking institutions is not as strong as their counterparts
in U.S. and Europe due to earlier regulatory firewalls between banking and the securities business.
Among Japanese financial conglomerates, including MUFG, commercial banks play a central role, and
securities subsidiaries have a lesser role compared to independent securities firms. As a result, in areas
such as large-scale M&A advising or stock underwriting, Japanese financial conglomerates still rank well
105

behind independent securities firms or foreign investment banks. Unlike the U.S. and Europe, mergers
between commercial banks and investment banks/securities firms have not yet occurred in Japan, except
as joint ventures or business alliances.
6.2.2 Operational Efficiency
Operational efficiency at MUFG is higher than that of U.S. and European financial
conglomerates, but lower than SMFG (see Figure 6-8). As described in Chapter 5.4, SMFG achieved
Figure 6-8. Operating expense ratios* (2004)
90%80%70%60%50%40%30%20%10%0%
sz)
* Operating expenses as a percentage of total net revenue
Source: Author, 2006
greater efficiency by reducing its abundant resources following consolidation. MUFG has only recently
been formed, so it too can pursue efficiencies by eliminating overlapping resources between former
MTFG and UFJ. This will be an important factor in actualizing future growth whether it successfully
restructures or not.
106
.. .... ........ ..MM. MlauRW 'EM Nir ON iýMll ýPINITHI IN
ýJýPý MNR 245- ýEEIIIýR Q-ý"rE. X-W.A.... ......
NNW 51""N'st. RwLM 10WHIMixq
It\
i

6.2.3 Asset Quality and Equity Capital
As described in Chapter 5, Japanese banking institutions has made tremendous efforts to
improve asset quality by reducing the number of non-performing loans. Although non-performing loans
have been decreased significantly, MUFG and other Japanese financial conglomerates still have far more
compared to U.S. and European financial conglomerates (see Figures 6-9 and 6-10). Charges for
write-offs for the non-performing loans undermined the equity capital of MUFG and other Japanese
financial conglomerates. As a result, they have smaller equity capital against total asset in comparison
with U.S. and European financial conglomerates.
Figure 6-9. Comparison of non-performing loan ratios* (2004)
5.00%
4.00%
3.00%
2.00%
1.00%tA t'CIO/
J.LUL-/o
4:? B~
* Outstanding non-performing loans as a percentage of total assets
Source: Author, 2006
107
I
L_ ~

Figure 6-10: Comparison of equity capital ratios* (2004)
10.00%
8.00%
6.00%
4.00%
2.00%
0.00%
* Stockholder's equity as a percentage of total assets
Source: Author, 2006
The former MTFG was the only financial conglomerate that did not accept public bailout funds
from the government, since it had sufficient capital of its own to bear the credit cost. On the other hand,
the former UFJ suffered huge capital losses due to many non-performing loans. Soon after MTFG decided
to merge with UFJ, MTFG infused approximately US$7 billion into UFJ to cover its capital loss.
Therefore, for MUFG it is essential to recover and further enhance its equity capital through increasing
profit for future growth.
6.2.4 Strategic Positioning
MUFG's business structure is similar to that of Mizuho and SMFG in terms of major
dependence on wholesale banking rather than retail banking (see Figure 6-11). MUFG has a slightly
larger geographic diversification than Mizuho and SMFG, but it still remains heavily dependent on the
domestic Japanese market for revenue (see Figure 6-12).
108
R W MM:.. ... ...... ...... .. ... ...... .g.4 ...... ... .....K R . ............MINA AP., A a
IIs if 69 sp ýZý

Figure 6-11. MUFG Net Revenue by segment (first half of 2005)
..... lb,assets-
1%Overseas-
13%
2004Treasury 2 Retailtc surT
Banking16%
Domest icCorporate
54%
Source: Mitsubishi UFJ Financial Group Investors press release, February 2005
Figure 6-12. MUFG net revenue by geographic segments (2004)
Asia /Pacificexcl.
Japan, O/
Europa--u5%
U.S.A.12%
Others2%
Japan78%
Source: MTFG and UFJ Annual report 2004
MUFG's business structure as well as that of other Japanese financial conglomerates, is explicit
compared with U.S. and European financial conglomerates (see Figure 6-13). A major portion of profit
comes from wholesale and middle-business segments (i.e., business for corporate customers, including
investment banking) and the domestic markets while the retail/private banking business segment
(individual customers) remains small.
109

In contrast, the business structure of U.S. and European financial conglomerates is not like that
shown in the figure. The typical features of these banks are summarized as follows:
* Citigroup: Retail/Private banking is larger. Geographically diversified.
* JPM Chase: Retail and Wholesale are equally balanced. Geographically diversified.
* Bank of America: Retail/Private banking is larger. Geographically not diversified
* HSBC: Retail/Private banking is larger. Geographically diversified.
* Deutsche: Wholesale is larger. Geographically diversified.
* UBS: Retail/Private banking is larger. Geographically diversified.
Figure 6-13. Profit by business and geographic segments (2004)
Global
VMholesale/ Mddle
_ MT'FG+UJFJ)
HBSB
Citigrop Retail/. ". Private
r Bank"JPM Chase Bank
Bank of America:]
Domestic
Source: Author, 2006
110
--

The characteristics of the business structures of U.S. and European financial conglomerates align
with consolidation objectives, as summarized in Table 6-2.
Table 6-2. Summary of consolidation objectives
Citigroup Maximize profit in retail market through cross-selling. Emphasize investment
banking in corporate banking business. Pursue geographic diversification.
JP Morgan Chase Balance the retail and wholesale (investment) banking business.
Bank of America Establish overwhelming presence in the U.S. retail and middle market.
HSBC Enhance retail and middle banking capability worldwide.
Aggressively pursue geographic diversification, including emerging markets.
Deutsche Bank Strengthen wealth management, investment banking, and asset management
business capability. Pursue geographic diversification.
UBS Strengthen investment banking and asset management business capability.
Pursue geographic diversification.
Source: Author, 2006
MUFG and other Japanese financial conglomerates largely fulfilled their initial purposes for
consolidation: to reduce non-performing loans. However, their current business structures are not strong
enough to drive future growth. The next objectives of consolidation include the following strategies:
* In the: individual customer segment - more focus on retail financial business. Maximize
synergy across multiple financial products such as deposits and loans, consumer finance,
credit cards, securities, mutual funds, and insurance. Strengthen private banking business to
increase non-interest revenue.
* In the corporate customer segment - strengthen business relationships with small and
medium-size companies. For large companies, emphasize investment banking services rather
than corporate loan services.
111

* In the overseas business segment - enhance business capability in China and other Asian
countries.
MUFG has set targets for increasing the weight of retail business in its business portfolio, from
16% in 2004 to over 35% in 2008 (see Figure 6-14).
Figure 6-14. MUFG
Treasury 20Trcf I.
l b'assets
1%Overseas-,
13%
RetailBanking
16%
business portfolio targets
Treasury 2008 (Targeted)TrustIM t-
3%e
)verseas
DomesticCorporate
54%
7%DomesticCorporate
50%
Source : Mitsubishi UFJ Financial Group Investors press release, February 2005
6.3 Strategies for Strengthening Business Capability
MUFG is taking specific steps to enhance it profitability by strengthening its business
capability in the retail and middle financial business segments. In this section I will provide examples of
MUFG's concrete strategies in those business areas.
112
RetailBanking
35%
\
- -

6.3.1 Cross-Selling Across Intra-Group Companies
One-stop access
In 2004, former Bank of Tokyo-Mitsubishi (BTM), Mitsubishi Trust Banking, and Mitsubishi
Securities opened "MTFG Plaza," a jointly managed branch that gives customers one-stop access to all
essential financial products and services, including deposits, housing loans, mutual funds, investment
trusts, and securities. Since its opening, MTFG Plaza has proved to be highly attractive to customers, and
the number of customers is growing rapidly.
Former UFJ also opened a jointly managed branch named "UFJ Plus," which offers services
like a banking and securities subsidiary in combination with 24/7/365 ATM service-a unique service in
Japan provided only by UFJ. MUFG will try to combine the advantages of both group's services and to
expand its service locations.
Innovative delivery channel
MUFG also plans to provide one-stop access in more remote areas. In 2005, the former BTM
commenced its Telebank service, a new financial service utilizing broadband technology. Telebank is an
automated contract terminal that uses video-conferencing technology to allow customers to perform
various financial transactions and consult face-to-face with a bank officer via a monitor screen. Plans are
being developed to offer multiple financial products from group companies. Telebank is available until
8:00 pm on weekday, weekends, and public holidays, which gives customers who work during the day a
convenient access to MUFG financial consulting services (see Figure 6-15). Combination of geographic
coverage of MTFG and UFJ enables MUFG to easily increase the location of Telebank.
113

Figure 6-15. Telebank service
6.3.2 Expanded Range of Services
Consumer finance and credit card business
In 2004, the former MTFG formed a strategic alliance with ACOM, a large consumer finance
company in Japan. The aim was to widen the consumer loan products line to respond to customer needs
for short-term finance. MUFG plans to leverage ACOM's credit know-how into a credit card loan service.
Mitsubishi UFJ Bank issues its "Super IC Card," which provides multiple innovative services that utilize
the latest integrated circuit (IC) technology. An IC chip embedded in the card contains useful customer
information that enables the bank to provide value-added services such as accumulating service points,
preferential interest rates on banking products, various credit card settlement options, and customized
revolving credit functions. The new card also provides greatly improved cash card security through the
use of hand-vein recognition---a highly secure identification method that allows only the cardholder to
use the card. The alliance with ACOM was the driving force behind the rollout of the Super IC Card
service.
In addition, MUFG plans to consolidate its credit card subsidiaries, UFJ NICOS and DC Card.
The new company, to be called MUFG NICOS, will become the number one credit card company in
114
4MUFG operating center
MUFG OperatorI
Japan. MUFG is also considering whether to consolidate its credit card business with that of MUFG
NICOS, to offer comprehensive and cutting-edge services to customers.
Insurance products
MUFG is planning to broaden its life and annuity insurance products as another pillar of its
retail financial products. The business model is an "open architecture" model that focuses on the
distribution of external, high-quality products by outsourcing product manufacturing to companies such
as Citigroup. MUFG has built several alliances with domestic and foreign insurance companies such as
MNanuLife, ING, and AXA, which gives it access to high-quality products.
Private banking and wealth management
MUFG plans to strengthen its private banking and wealth management business by increasing
its financial advisory staff. In addition, MUFG has entered into an agreement with Merrill Lynch to
establish a private banking and wealth management joint venture in Japan. The new entity will serve
high-net-worth individuals as well as small- and medium-size institutions in Japan. The new company
will combine Menrrill Lynch's global reach, expertise in wealth management, and sophisticated product
line with MUFG's substantial high-net-worth client base. This strategy will enable MUFG to provide a
higher quality of service, increased product innovations, and faster growth than it could achieve alone.
6.3.3 Expansion of Retail Customer Base
In order to aggressively expand its customer base, MUFG has decided to enter into a strategic
alliance with Norinchukin Bank, the central bank for Japan's agricultural, forestry, and fishery
cooperatives (4,919 cooperatives) and, of course, its related strong customer base of farmers, fishermen,
and foresters. This alliance will enables MUFG to provide credit card and trust banking services to
115
customer of Norinchukin Bank. In turn, Norinchukin Bank will acquire various retail banking products
and know-how. This alliance will help MTFG strengthen its customer base and overtake other Japanese
financial conglomerates in terms of market share.
6.3.4 Strengthen relationships with small and medium-size corporate customers
In its corporate banking segments, MUFG tries to meet its customers' financing needs more
quickly by offering unsecured loans that utilize a simple yet sophisticated credit review model. This loan
service enables MUFG to strengthen its business relationships with small and medium corporate
customers and also to obtain a higher loan/deposit margin than transactions with large corporate
customers.
MUFG is aggressively establishing small branches that will specialize in this loan service in
regional areas where it did not formerly have business locations. The rollout of this loan service will give
MUFG the largest market share of small and medium-size corporate customers among the three Japanese
financial conglomerates.
6.3.5 Leverage its overseas network
The former MTFG was especially strong in overseas operations among the three Japanese
financial conglomerates. It had the largest overseas branch network (81 locations as of March 31, 2005)
compared with Mizuho (40) and SMFG (40). MUFG aims to build synergies between the former MTFG's
overseas network and UFJ's broad customer base. MUFG will increase its customer service staff and
develop innovative services, such as a sophisticated cash management service.
Its overseas strategy focuses on business relationships with excellent Japanese or domestic
companies worldwide, with a special focus in Asia. Its strong competitors, Citigroup and HSBC,
emphasize consumer financial business and business relationships with large companies in their overseas
116

operations. By enhancing its market presence through a merger between MTFG and UFJ, and
concentrating its managerial resources on the corporate banking business, MUFG hopes to enhance its
business capability in its overseas operation to effectively compete with Citigroup and HSBC.
6.3.6 Pursue new business opportunities
MUFG is planning to offer an E-payment option for online or mobile-phone small purchases by
forming a joint venture with DeNA, a Japanese Internet service company. MUFG is also planning to offer
an escrow service to add take advantage of its high public credibility. MUFG aims to satisfy the growing
demand for inexpensive and trusted payment solutions for the purchase of low-priced goods on the
Internet, mobile phone shopping, and auctions. It also aims to compete with new entrants such as Rakuten,
which is trying to capture the market for online or mobile small purchases.
6.4 Assessment of MUFG's Consolidation and Strategies
MUFG's consolidation can be positively assessed in terms of the following potential
competitive advantages:
* Increased competency for developing innovative services
MUFG's consolidation has obtained more investment capability for developing innovative
services than MTFG and UFJ could have achieved as separate entities. In 2006 MUFG plans to
invest US$16 billion in new service developments, such as its IC credit card, Telebank, and
E-payment solutions. Without the consolidation, MTFG would have invested only US$9 billion.
117
* Enhanced competitiveness of its affiliated companies
MUFG holds the largest commercial bank as a core entity under its umbrella. Furthermore, its
affiliated trust bank and credit card company have become the largest in Japan, and its affiliated
securities company is now the fourth-largest in Japan. MUFG is n a position to achieve a large
market presence and potential synergies in a broad array of Japanese financial markets.
* Strengthened capability in its international financial business
By leveraging an expanded customer base, MUFG will be able to take advantage of the
profitability and service capability of the former MTFG's overseas network. MUFG will be able
to enjoy greater competitiveness with foreign financial institutions in several business areas,
especially in corporate banking business in Asian countries.
* More opportunities for service coverage and enhanced service quality
MUFG's strong market presence and broad customer base will be attractive to external
companies that may want to enter into collaborations with MUFG. It can make maximum use of
its alliance strategy to extend service coverage and enhance service quality. It can also use an
alliance strategy, like the one with DeNA, to meet the challenges of new entrants.
The urgent task for MUFG is to enhance its equity capital for future growth. MUFG's strategy
of emphasizing retail and middle financial business is appropriate because these businesses are less
volatile and risky than investment banking, and they contribute to MUFG's sustainable growth. While
investment banking is generally lucrative in terms of huge upside profit potential, it also has the
possibility of exposing equity capital to higher risk and volatility. MUFG should pursue the investment
banking business prudently until it accumulates sufficient equity capital.
118

Chapter 7
Conclusion
I have discussed consolidation trends in the U.S., European, and Japanese banking industries
and analyzed the strategic transformation of several financial conglomerates in those regions. It is
apparent that the banks' desire to maximize shareholder wealth while responding to the external
environment, including changes in the structure of the banking industry, regulatory changes, and the
development of cutting-edge information technologies has motivated and encouraged the banking
institutions to consolidate.
Does consolidation bring benefits to banking institutions? Some find that it enhances their
ability to effectively compete with others and that consolidation enables them to retain their market
presence. However, as described in Chapters 3 and 4, investors do not put a higher value on
conglomerates, largely because new financial conglomerates have not yet fully exploited any potential
advantages of consolidation, including increased profits or cost economies of scale and scope.
Exploiting the possibilities of increased profit and cost economies are the primary motivators
behind bank consolidation. Chapters 3 and 4 confirmed that profit and cost economies of scale are
achievable in a relatively short time horizon. For example, Bank of America achieved the best
performance among three U.S financial conglomerates. On the other hand, profit and cost economies of
scope (cross-selling, synergy across different business segments) require longer time to be achieved. The
so-called "conglomerate discount" arising from inefficient capital use, compliance risk, and the
119

unsuccessful fusion of several business entities, makes it difficult for profit and cost economies of scope
to be achieved.
However, just achieving profit increases and cost economies of scale are not enough for
investors because opportunities for further geographic expansion and cost reduction become limited as
banks continue to exploit those options. For example, Bank of America currently suffers from lower
valuation of its growth opportunity, which implies that exploiting profit and cost economies of scope is
much more important for consolidated financial firms in order to obtain higher evaluation than specialized
financial firms.
Following elements are important considerations in the pursuit of increased profit and cost
economies of scope.
The governance capacity of top manarement It is important for top management to demonstrate
strong governance capability in order to overcome the "conglomerate discount" factor. This can be done
by facilitating the integration of disparate firms with different business structures, establishing a strong
cross-selling organization, and executing strict compliance control.
Efficient monitoring of multiple business segments Efficient monitoring of profit and cost
performance, and appropriate capital distribution across multiple business segments are essential for
pursuing synergies. Restructuring business segments that are unprofitable and do not contribute to
synergy will be inevitable.
A well-defined IT intezration strategv A well-defined IT infrastructure that enables integrated
customer relationship management, multiple products management, and efficient managerial control of
several business segments, is essential to maximizing synergy.
120

Enhanced platform for cross-selling An enhanced customer relations management system and
precise product sales data are key elements for promoting cross-selling. Product sales data should be
categorized by customer and geographic segments. Promotional strategies for multiple products based on
detailed sales data-mining are critical for effective cross-selling. Mike Harris, former Chief Executive of
Egg plc and now advisor to the Chief Executive of Royal Bank of Scotland, said:
Royal Bank of Scotland (RBS) became one of the most
successful banks by growing through a number of M&As.
RBS is also very successful in cross-selling multiple
products, especially in retail banking. One of the key
factors of success is our business format based on a
detailed analysis ofproduct sales data at each bank branch.
It is important to precisely capture the sales trend of each
product along with each customer and geographic segment.
Based on that, it is possible to carry out effective
promotional activities for cross-selling. (Interview,
4/25/06)
Optimum Brand Strategv Strategies for corporate branding following consolidation are also
important. It is critical to decide whether the acquired company's brand should be pulled into the
acquiring company, or if the acquired company's brand should be maintained. RBS maintains the brands
of banks it has acquired, such as NatWest and Citizens. Harris said:
RBS is pursuing geographic and product expansion
through M&A and cost and profit economies of scale by
transplanting its own business format into the acquired
companies. However, a policy is needed to maintain the
acquired company's brand because many customers feel
loyalty to the brand. For a service company like a banking
institution, brand is the most decisive factor for
differentiating itself from other banks and retaining
121

customers. It is risky to thoughtlessly integrate brands of
former entities following consolidation. (Interview,
4/25/06)
In contrast, HSBC takes the opposite policy when it comes to brand. HSBC tries to stretch its
own brand into the acquired companies. HSBC emphasizes providing an integrated, single-brand
experience for its customers worldwide. Sir John Bond, HSBC Group Chairman, said:
One important customer of former Midland Bank, who
had visited Thailand and got into financial trouble there,
told us after he came back that he had not been able to
depend on Midland in Thailand since he could not find a
Midland branch there. If Midland had had a branch in
Thailand, it would have been very helpful. However, at
that time HSBC was the largest foreign bank in Thailand
If Midland had been renamed to HSBC at that time, he
would have noticed our existence there and depended on
us. But he felt inconvenienced due to the unintegrated
brand policy of our group. Enhancement of customer
awareness of a single brand is very important for us as we
conduct financial business all over the world. (Aono,
2005, p.160)
These two examples confirm that brand strategy has a great influence on customer loyalty
toward consolidated banks. The banks must make deliberate decisions about brand policy in order to
retain customers following consolidation.
Achieving the above elements is critical to determining whether consolidation is successful or
not. Just executing a consolidation does not necessarily mean success for the banking institutions
involved. Successful management after the consolidation is much more important in order to achieve a
higher evaluation than the bank's competitors.
122

Japanese banking institutions, including MUFG, are also experiencing consolidation. However,
most consolidations occur between banking institutions. Establishing financial conglomerates that include
non-banking entities has only recently begun, so it is challenging for the banks to realize increased profit
and cost economies of scope. However, to increase profitability and effectively compete with foreign
financial conglomerates, achieving increased profit and cost economies of scope is inevitable. As
described in Chapter 6, MUFG is eager to try a number of strategies for achieving these goals.
New conglomerates established with non-financial institutions add a new dimension to
competition in the banking industry. They have the potential to become strong competitors with
incumbent financial conglomerates. An effective strategy for incumbent financial conglomerates is to
form strategic alliances with the non-financial institutions and deal with them not as competitors but as
collaborators. When MUFG formed an alliance with DeNA, the ensuing collaboration with new entrants
brought new business opportunities to the incumbent financial conglomerates. It also gives them new
distribution channels for their financial products.
In the UK, Royal Bank of Scotland formed an alliance with Tesco, a large supermarket chain.
Bank of Scotland (HBOS) collaborates with Sainsbury's, another supermarket chain. In both cases, they
have efficiently expanded their distribution of products through using the non-financial institution's
channel instead of establishing new banking branches.
Effective alliance strategies will be the critical factor for the success of financial conglomerates.
123

References
Aizawa, Kouetsu and Natsuo Nishio, Financial conglomerate and Revival ofJapanese banks, 2005.
Aono, Masamichi. Global strategy ofHSBC, Chuo Keizai, 2005.
Aonuma, Joji. Citibank's Strategy, NikkeiBP, 2000.
Bank of America, Annual Report, 2003, 2004.
Bank of Tokyo-Mitsubishi UFJ New York Branch Report, US Financial Conglomerates, 2005.
Bank One, Form 10K, 1999.
Chase Manhattan Bank, Form 10K, 1999.
Citigroup, Annual Report, 2003, 2004.
Citigroup, Form 10K, 2004.
Deutsche Bank, Annual Report, 1999, 2003, 2004.
Harvard Business Review Anthology. "Management for the Financial Service Industry," 2005.
Heffernan, Shelagh. Modern Banking, John Wiley & Son, Ltd, 2005.
Hong Kong and Shanghai Banking Corporation, Annual Report, 1998, 2003, 2004.
HSBC Banking on Brazil, Business Latin America, 10/20/2003.
J.P. Morgan Chase, Annual Report, 2003, 2004.
J.P. Morgan Chase, Form 10 OK, 2003, 2004.
J.P. Morgan, Form 10K, 1999.
Khanna, Tarun, and David Lane, "HSBC Holdings",Harvard Business School 9-705-466, 2005.
Mitsubishi Tokyo Financial Group, Annual Report, 2004.
Mizuho Financial Group, Annual Report, 2004.
Nihon Keizai Shinbun, "Merger between Mitsubishi Tokyo Financial Group and UFJ," 2004.
Nomura Research Institute, Conglomeration of US Financial institutions, 2001
124

Nomura Research Institute, Investment banking business ofSwiss and German banks, 2001
Numata, Yuko. Introduction to US Financial Service Businesses, Toyokeizai, 2002.
OECD, Report on Consolidation in the Financial Sector, 2001.
Sasajima, Katsuhito. Japanese Banks, Nihon Keizai Shinbun, 2005.
Shiraishi, Wataru. One-Stop Shopping for Financial Services, Seibunsha, 2005.
STANDARD & POOR'S, Insight into Credit Risk at Japan's Financial institutions, 2004, 2005.
Sumitomo Mitsui Financial Group, Annual Report, 2004.
The Economist, "A Survey of International Banking," May 21, 2005.
Togashi, Naoki. Advent of retail-universal banking, Nippon Hyoronsha, 2004.
UFJ Group, Annual Report, 2004.
Union Bank of Switzerland, Annual Report, 1999, 2003, 2004.
Walter, Ingo. Mergers and Acquisitions in Banking and Finance, Oxford University Press, 2004.
White, David. Mergers & Acquisitions in Global Financial Institutions, Business Insights, 1999.
125