evolving today’s smart grid needs into tomorrow’s · pdf fileevolving...
TRANSCRIPT

ANALYSTS PANEL:
Evolving Today’s Smart Grid Needs Into Tomorrow’s Smarter World Solutions

Agenda
Topics
• Enabling Dynamic Pricing
• Growth of Distribution Automation
• Smart Grid Trends
• Era of Big Data for Energy
• Ahmad Faruqui, Principal, The Brattle Group
• Rick Thompson, President & Co-Founder, Greentech Media, Inc.
• Rick Nicholson, Group Vice President, IDC Energy Insights
• Katie Fehrenbacher, Editor, Earth2Tech.com and Writer, GigaOM
• Carter Schoop, Equity Research Analyst, Clean Tech at Key Bank
Participants

WILL THE SMART GRID ENABLE DYNAMIC PRICING?
Ahmad Faruqui, Ph. D.
The views expressed in this presentation are strictly mine and not necessarily of The Brattle Group, Inc.
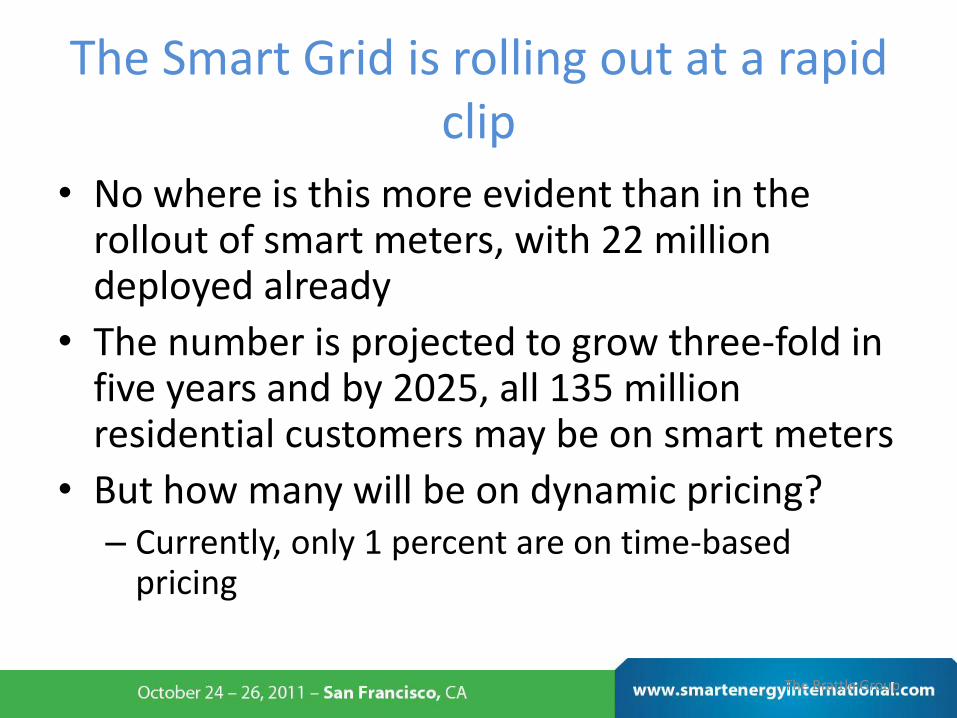
The Smart Grid is rolling out at a rapid clip
• No where is this more evident than in the rollout of smart meters, with 22 million deployed already
• The number is projected to grow three-fold in five years and by 2025, all 135 million residential customers may be on smart meters
• But how many will be on dynamic pricing? – Currently, only 1 percent are on time-based
pricing
The Brattle Group
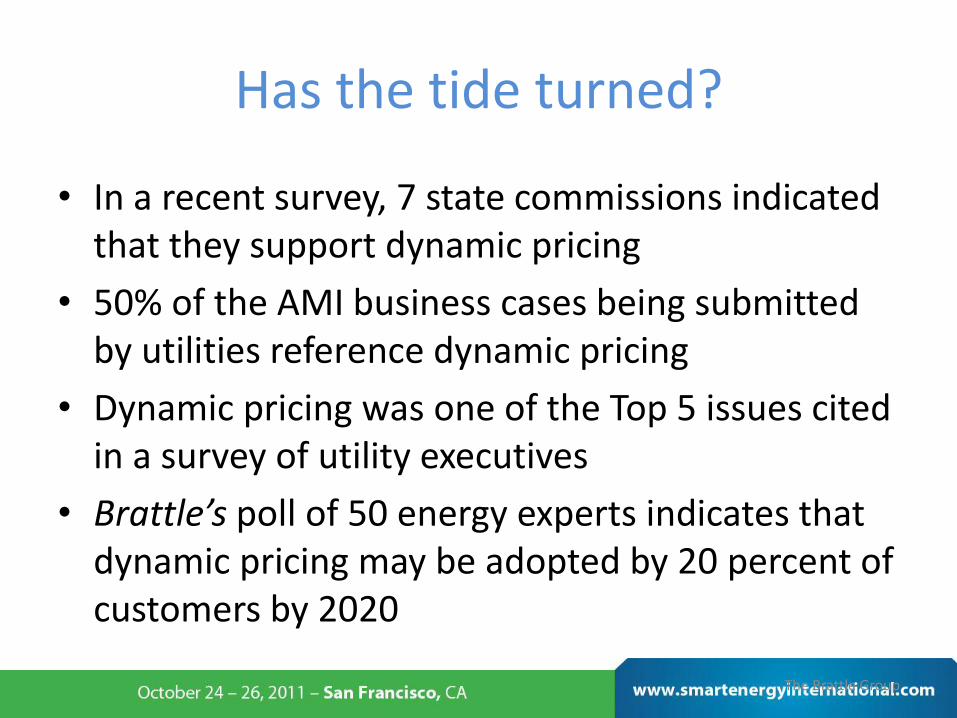
Has the tide turned?
• In a recent survey, 7 state commissions indicated that they support dynamic pricing
• 50% of the AMI business cases being submitted by utilities reference dynamic pricing
• Dynamic pricing was one of the Top 5 issues cited in a survey of utility executives
• Brattle’s poll of 50 energy experts indicates that dynamic pricing may be adopted by 20 percent of customers by 2020
The Brattle Group
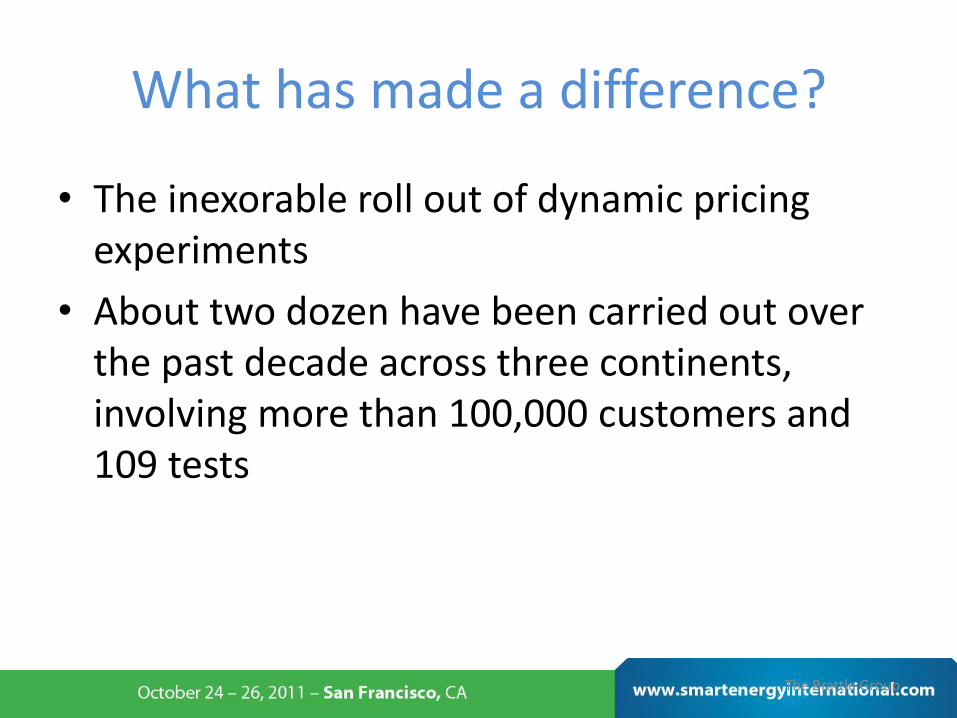
What has made a difference?
• The inexorable roll out of dynamic pricing experiments
• About two dozen have been carried out over the past decade across three continents, involving more than 100,000 customers and 109 tests
The Brattle Group
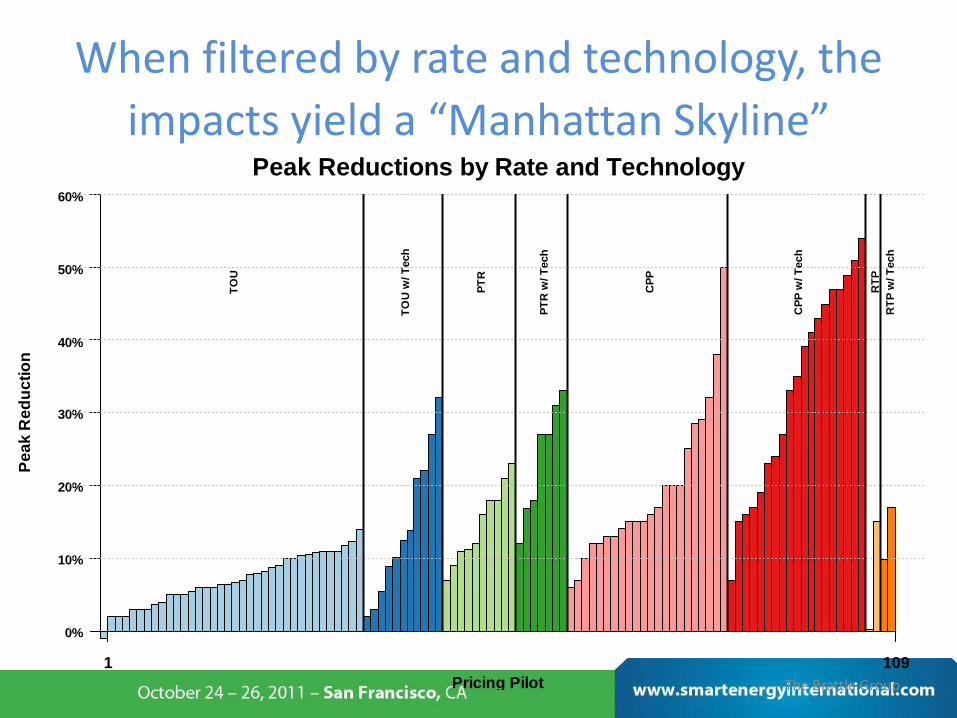
When filtered by rate and technology, the
impacts yield a “Manhattan Skyline” Peak Reductions by Rate and Technology
Pricing Pilot
Pe
ak
Re
du
cti
on
1 109
0%
10%
20%
30%
40%
50%
60%
TO
U
TO
U w
/ T
ech
PT
R
PT
R w
/ T
ech
CP
P
CP
P w
/ T
ech
RT
P
RT
P w
/ T
ech
The Brattle Group

The best-designed pilots allow us to infer the “Arc of Price Responsiveness” with much clarity
The Brattle Group
Pilot Results by Peak to Off-Peak Ratio
Price-Only Results
Peak to Off-Peak Ratio
Pe
ak
Re
du
cti
on
1 2 3 4 5 6 7 8 9 10 11 12 13 14 15 16 17 18 19 20 21 22 23 24 25
0%
5%
10%
15%
20%
25%
30%
35%
40%
Best-Fit Curve

In most cases, the inclusion of enabling technology boosts price
responsiveness
The Brattle Group
Pilot Results by Peak to Off-Peak Ratio
Results with Enabling Technology
Peak to Off-Peak Ratio
Pe
ak
Re
du
cti
on
1 2 3 4 5 6 7 8 9 10 11 12 13 14 15 16 17 18 19 20 21 22 23 24 25
0%
5%
10%
15%
20%
25%
30%
35%
40%
Technology Curve
Price-Only Curve
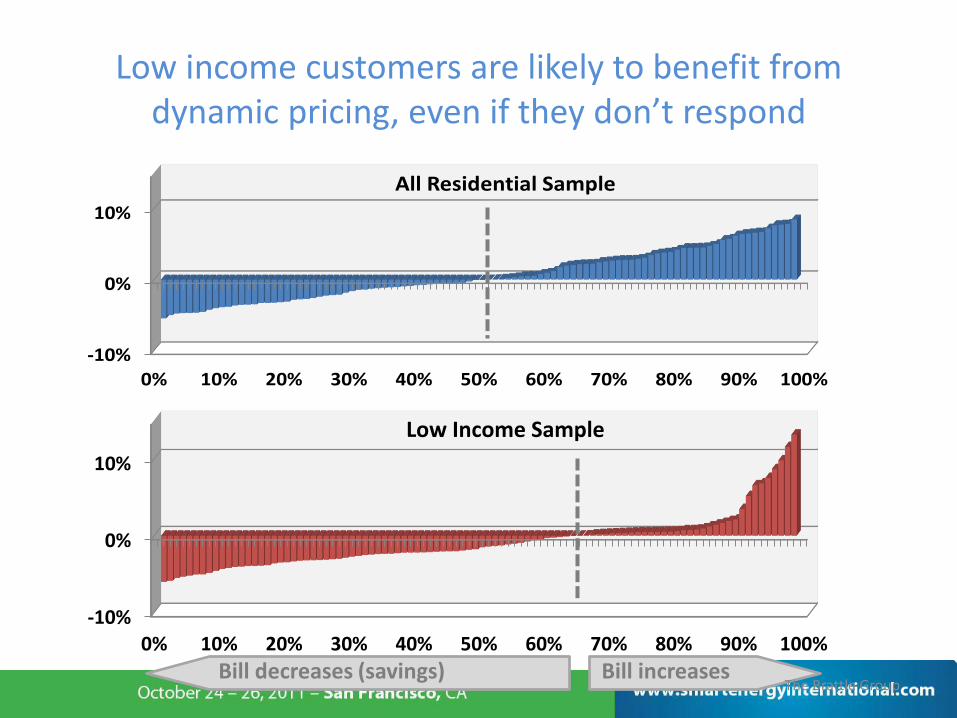
Low income customers are likely to benefit from dynamic pricing, even if they don’t respond
-10%
0%
10%
0% 10% 20% 30% 40% 50% 60% 70% 80% 90% 100%
All Residential Sample
-10%
0%
10%
0% 10% 20% 30% 40% 50% 60% 70% 80% 90% 100%
Low Income Sample
Bill increases Bill decreases (savings) The Brattle Group
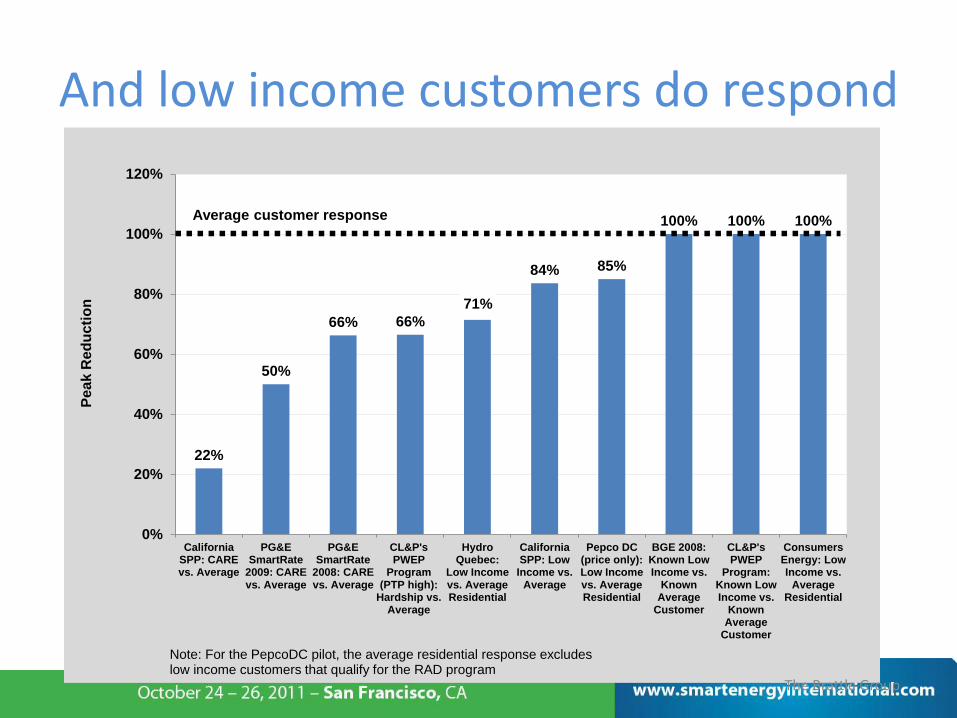
And low income customers do respond
22%
50%
66% 66%
71%
84% 85%
100% 100% 100%
0%
20%
40%
60%
80%
100%
120%
CaliforniaSPP: CAREvs. Average
PG&ESmartRate
2009: CAREvs. Average
PG&ESmartRate
2008: CAREvs. Average
CL&P'sPWEP
Program(PTP high):
Hardship vs.Average
HydroQuebec:
Low Incomevs. AverageResidential
CaliforniaSPP: Low
Income vs.Average
Pepco DC(price only):Low Incomevs. AverageResidential
BGE 2008:Known LowIncome vs.
KnownAverage
Customer
CL&P'sPWEP
Program:Known LowIncome vs.
KnownAverage
Customer
ConsumersEnergy: LowIncome vs.
AverageResidential
Pe
ak
Red
uc
tio
n
Average customer response
Note: For the PepcoDC pilot, the average residential response excludes low income customers that qualify for the RAD program
The Brattle Group

Questions

Growth of Distribution Automation
Rick Thompson
President & Co-Founder
Greentech Media, Inc.


GTM’S TOP 5 SMART GRID TRENDS
1. The Growth of Distribution Automation and Intelligent Power Electronics (the smart circuit)
2. Utilities must increase consumer awareness and engagement (provide tangible benefits for smart grid)
3. Realizing the network infrastructure foundation BEYOND AMI
4. Managing distributed PV growth on circuits with higher than 20% penetration
5. Analytics

DA and the Intelligent Power Infrastructure Layer
A wide array of potential advances that will give utilities and grid operators digital control over the power delivery network
– advanced power electronics, communication technologies in the power plane, data processing and analysis
Encompasses improvements in four main areas
– System Reliability
– Grid Optimization
– Effective DG/EV Integration
– Asset Utilization and Protection
Enabled largely by the addition of new sensor and communications technology, and a new generation of intelligent power-layer devices
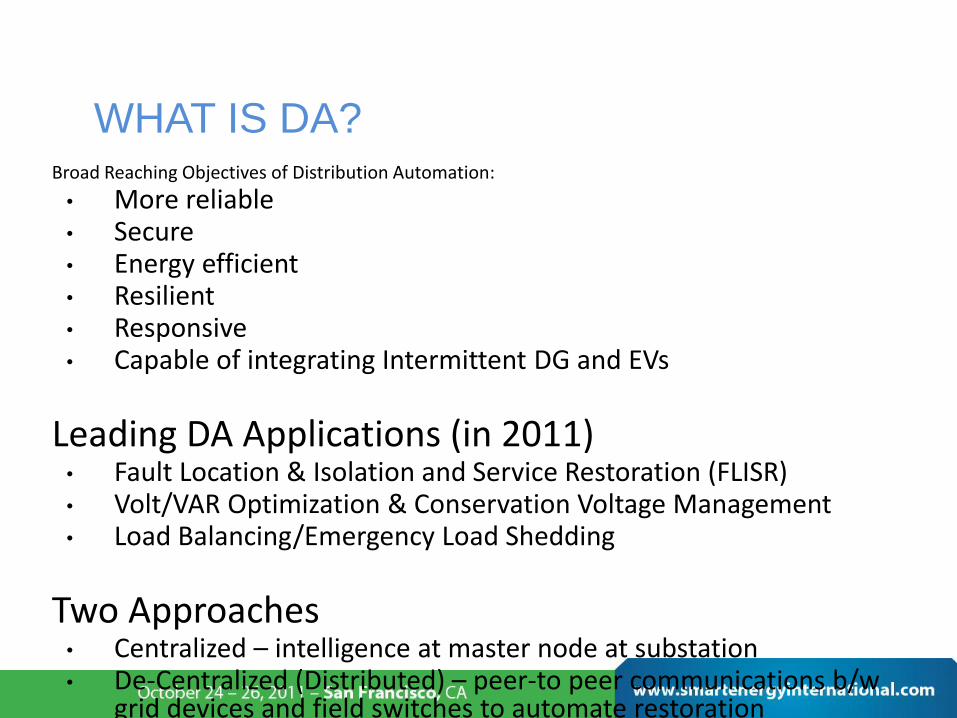
WHAT IS DA? Broad Reaching Objectives of Distribution Automation:
• More reliable • Secure • Energy efficient • Resilient • Responsive • Capable of integrating Intermittent DG and EVs
Leading DA Applications (in 2011) • Fault Location & Isolation and Service Restoration (FLISR) • Volt/VAR Optimization & Conservation Voltage Management • Load Balancing/Emergency Load Shedding
Two Approaches • Centralized – intelligence at master node at substation • De-Centralized (Distributed) – peer-to peer communications b/w
grid devices and field switches to automate restoration

ECONOMIC BENEFITS Reliability Benefits
– Reduced # of customers effected by outages (SAIFI, MAIFI)
– Shorter duration of outages (SAIDI)
– Precise understanding of which customers are experiencing low voltage, power outages, poor PQ, etc.
– Improved System Efficiency
– Reduced Line Losses
– Reduced Total Energy (Capital Avoidance from less peak)
Advanced Asset Management
– Less maintenance, reduced equipment failure
– Deferral of replacement Capex
Effective DG/EV Integration
– Reduced operational impact from DG/EV
– Better power quality and greater reliability
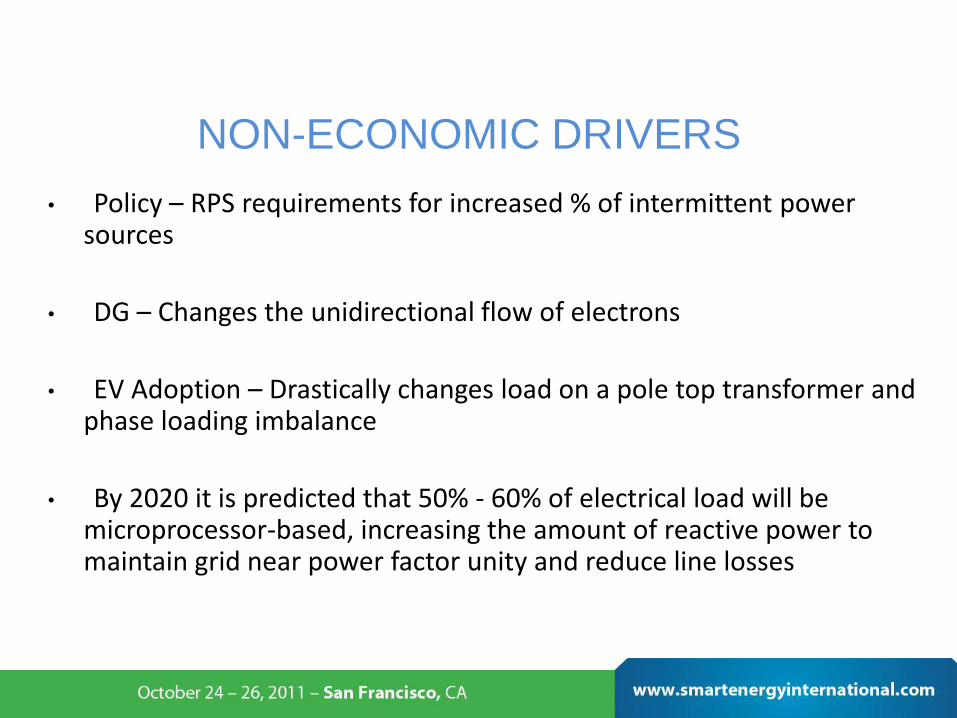
NON-ECONOMIC DRIVERS
• Policy – RPS requirements for increased % of intermittent power sources
• DG – Changes the unidirectional flow of electrons
• EV Adoption – Drastically changes load on a pole top transformer and phase loading imbalance
• By 2020 it is predicted that 50% - 60% of electrical load will be microprocessor-based, increasing the amount of reactive power to maintain grid near power factor unity and reduce line losses

Dynamic Devices at the Edge (and a new generation of switching)
• Advanced Capacitor banks
• Advanced Voltage Regulators
• More Robust Tap Changers
• Energy Storage (at both substation and on
feeders/laterals)
• New generation of reclosures, that can switch
net loads to the phase with the lowest voltage
• Intelligent transformers with multi-function
integrated grid assets
• Advanced medium/high-voltage Power
Electronics
• Sensing is only the beginning – the industry
needs to move toward real-time actuation
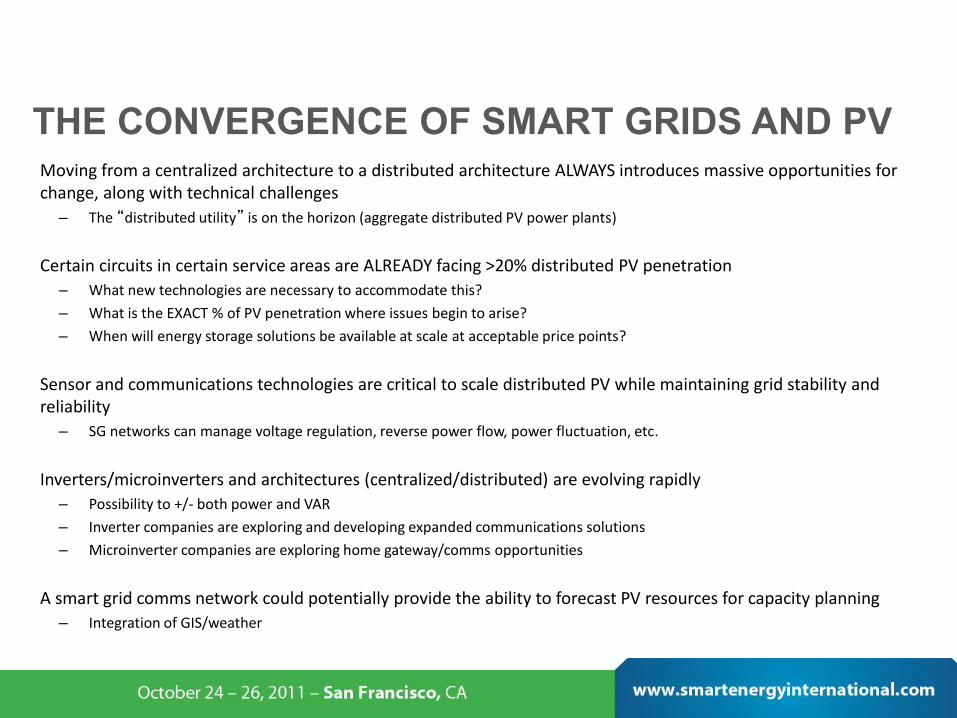
Moving from a centralized architecture to a distributed architecture ALWAYS introduces massive opportunities for change, along with technical challenges
– The “distributed utility” is on the horizon (aggregate distributed PV power plants)
Certain circuits in certain service areas are ALREADY facing >20% distributed PV penetration
– What new technologies are necessary to accommodate this?
– What is the EXACT % of PV penetration where issues begin to arise?
– When will energy storage solutions be available at scale at acceptable price points?
Sensor and communications technologies are critical to scale distributed PV while maintaining grid stability and reliability
– SG networks can manage voltage regulation, reverse power flow, power fluctuation, etc.
Inverters/microinverters and architectures (centralized/distributed) are evolving rapidly
– Possibility to +/- both power and VAR
– Inverter companies are exploring and developing expanded communications solutions
– Microinverter companies are exploring home gateway/comms opportunities
A smart grid comms network could potentially provide the ability to forecast PV resources for capacity planning
– Integration of GIS/weather
THE CONVERGENCE OF SMART GRIDS AND PV

Questions
• All energy infrastructure is becoming connected
• Utilities will be overwhelmed with data and need
software & analytics to make sense of the info
• Buildings, consumer devices, & cars will connect
to this energy network & produce data
• Clean power will produce data, too
The Era of Big Data for Energy

• Opower has saved utilities/homes half a terawatt to date. Launched a Facebook app.
• Ecologic Analytics’ meter software crunches 550 million meter reads ever day.
• The national repository for grid sensor data uses Hadoop (hot “big data” open source data base tool)
• The market for smart grid analytics is supposed to deliver $11.3 billion in cumulative revenue between 2011 and 2015
Examples:
Questions:
•What are the biggest hurdles to utilities mining useful data from their smart grids? (standards, networks, silos, lack of IT knowledge, lack of business model?) •Will consumers benefit from the intelligence found in this data? Will the planet?
Smart Grid Trends Rick Nicholson, Group Vice President
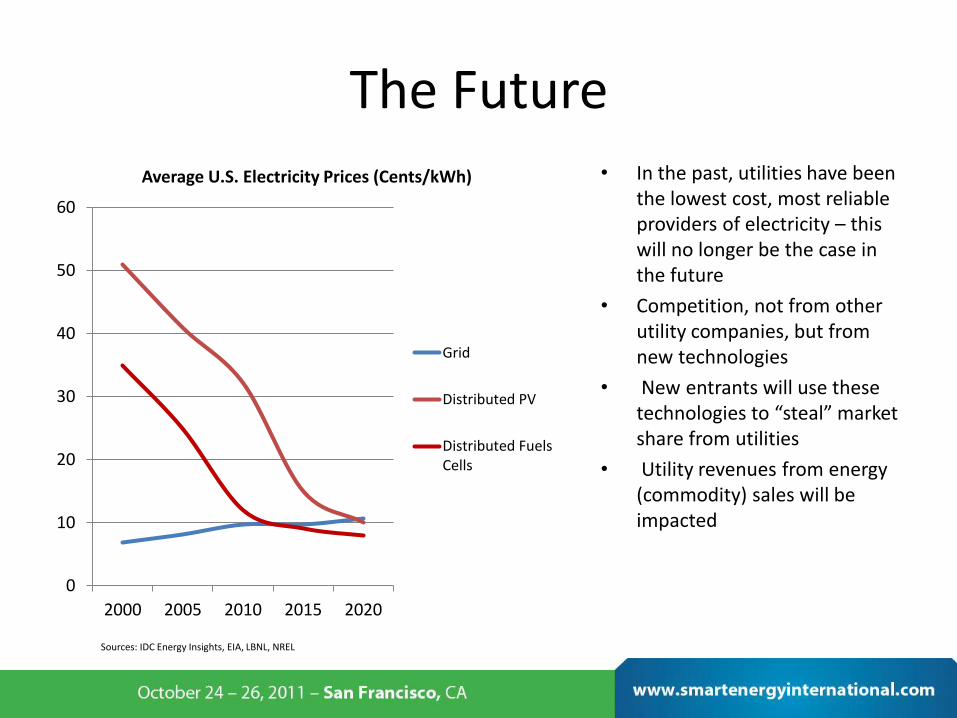
The Future
0
10
20
30
40
50
60
2000 2005 2010 2015 2020
Average U.S. Electricity Prices (Cents/kWh)
Grid
Distributed PV
Distributed FuelsCells
• In the past, utilities have been the lowest cost, most reliable providers of electricity – this will no longer be the case in the future
• Competition, not from other utility companies, but from new technologies
• New entrants will use these technologies to “steal” market share from utilities
• Utility revenues from energy (commodity) sales will be impacted
Sources: IDC Energy Insights, EIA, LBNL, NREL

Commodities to Services
Airlines Seats Travel
Telecom Minutes Communications
Utilities kWh ???
Information Environment Poor Rich

Big Data and Analytics
• Big data sources – Smart meters – Grid sensors – Smart equipment (transformers, solar inverters, thermostats) – External data sources (weather, prices)
• Analytics turn data into actionable information – Visualization and dashboards – Alerting (role-based, using rules to analyze the data) – Scorecards and benchmarks (comparative analysis, set goals,
measure progress) – Predictive analytics and optimization (predict future trends and
behaviors, optimize performance)
Questions
• How will big data and analytics enable the development of these evolving services?
• Is the regulatory environment and business models for utilities conducive to fully benefit from this type of era of big data?
• Who will make the most money off of energy data analytics? (IT companies, startups, utilities)

References
• The Brattle Group, “DRex: International Database of Dynamic Pricing Experimental Results,” July 2011.
• Faruqui, Ahmad and Jenny Palmer, “Dynamic Pricing and its Discontents,” Regulation, Fall 2011.
• Faruqui, Ahmad, Ryan Hledik, Armando Levy and Alan Madian, “Smart pricing, smart charging,” Public Utilities Fortnightly, October 2011.
• Faruqui, Ahmad and Sanem Sergici, “Dynamic pricing of electricity in the mid-Atlantic region: econometric results from the Baltimore gas and electric company experiment,” Journal of Regulatory Economics, Volume 40: Number 1, August 2011.
• Faruqui, Ahmad and Sanem Sergici, “Household response to dynamic pricing of electricity–a survey of 15 experiments,” Journal of Regulatory Economics (2010), 38:193-225.
The Brattle Group