evolutionary graphics and recursive algorithms for ... · nsupermarket scanner data ... a case...
TRANSCRIPT
Evolutionary Graphics and Recursive Algorithmsfor Streaming Data
Edward J. WegmanCenter for Computational Statistics
George Mason University
Outline of Talk
Streaming Data n A New Statistical Paradigmn New Data Structures Lead to New Methods
Background on TCP/IPA Bit on Our ProjectRecursive AlgorithmsSome Graphics Proposals
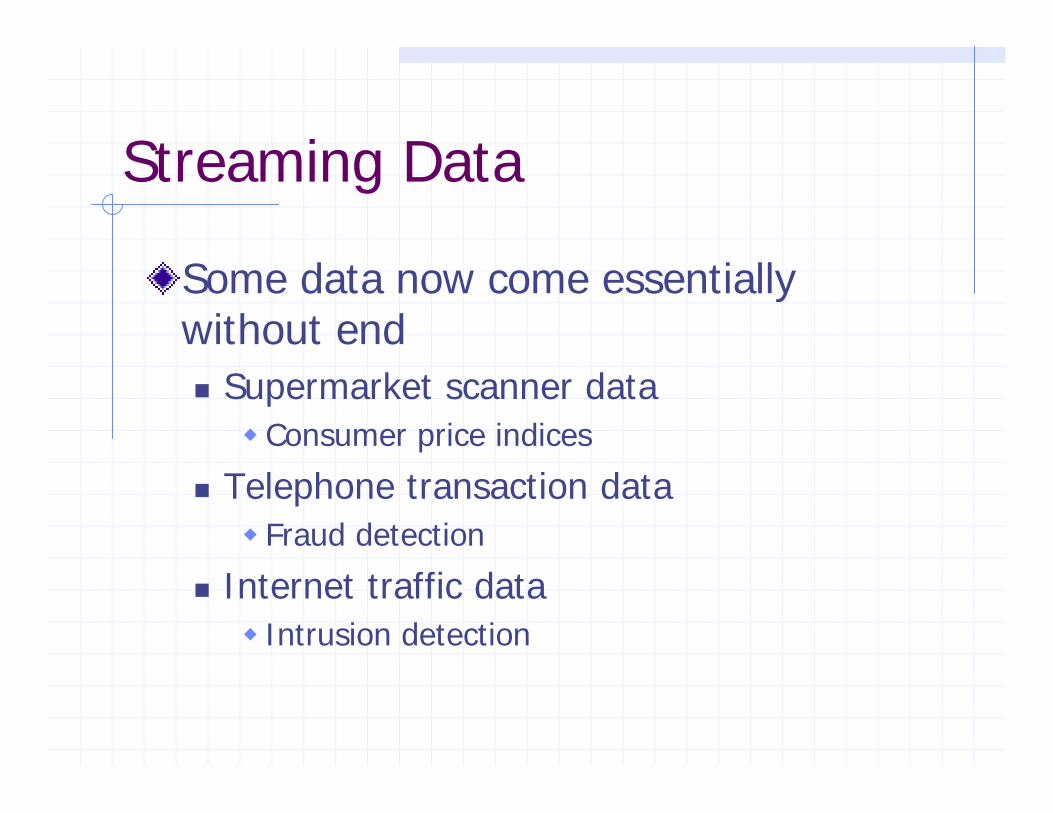
Streaming Data
Some data now come essentially without endn Supermarket scanner dataw Consumer price indices
n Telephone transaction dataw Fraud detection
n Internet traffic dataw Intrusion detection

Scope of the Problem
Most of us have seen IP addressesn More precisely IPv4 address n An IPv4 is a 32 bit number usually
represented as 4 dotted fieldsn field1.field2.field3.field4n These IP addresses uniquely identify a
machine.n In theory, there are 4,294,967,296
addressable machines

Types of Networks
Class A – field1 identifies the network, fields2-4 identify the specific hostn field1 is smaller than 127, e.g. 1.1.1.1
Class B – field1.field2 identifies the network field3.field4 identifies the specific host, field3 sometimes used for subnetn Field1 is larger than 127, e.g. 130.103.40.210
Class C- field1.field2.field3 identifies the network, field4 the hostn E.g. 192.9.200.15
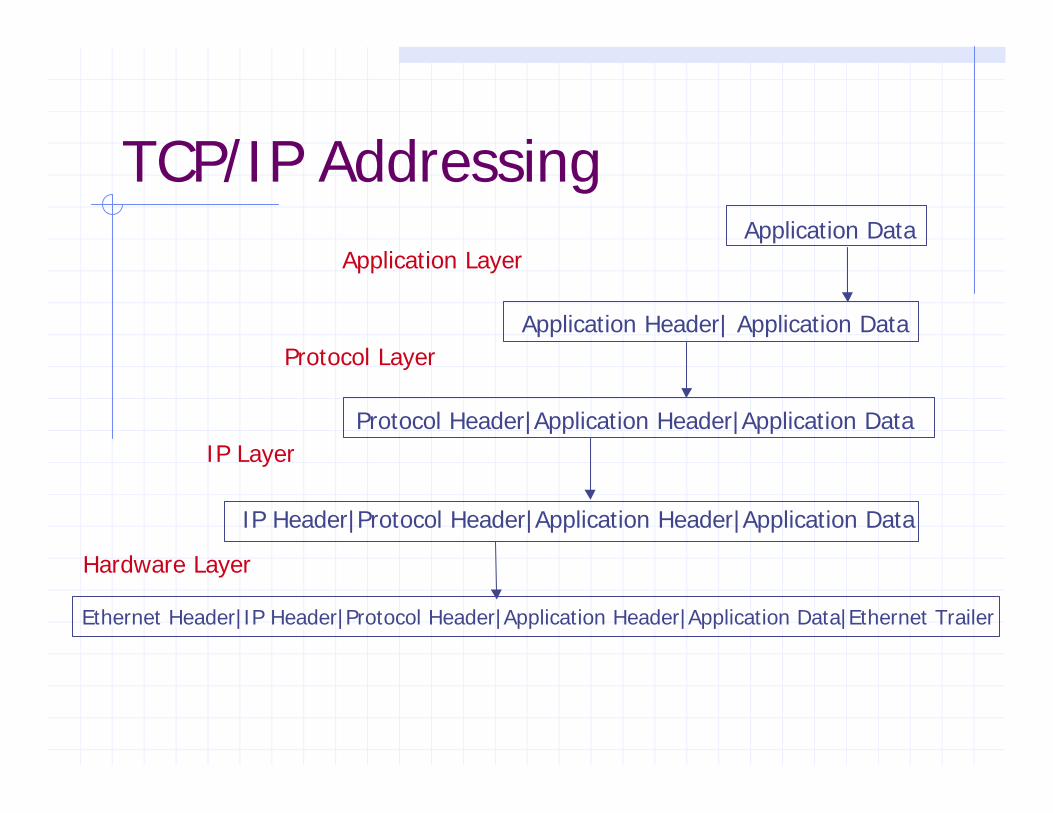
TCP/IP AddressingApplication Data
Application Header| Application Data
Protocol Header|Application Header|Application Data
IP Header|Protocol Header|Application Header|Application Data
Ethernet Header|IP Header|Protocol Header|Application Header|Application Data|Ethernet Trailer
Application Layer
Protocol Layer
IP Layer
Hardware Layer

Common Protocols
TCP=Transmission Control ProtocolUDP=User Datagram ProtocolICMP=Internet Control Message Protocol

TCP/IP Addressing
The IP Header
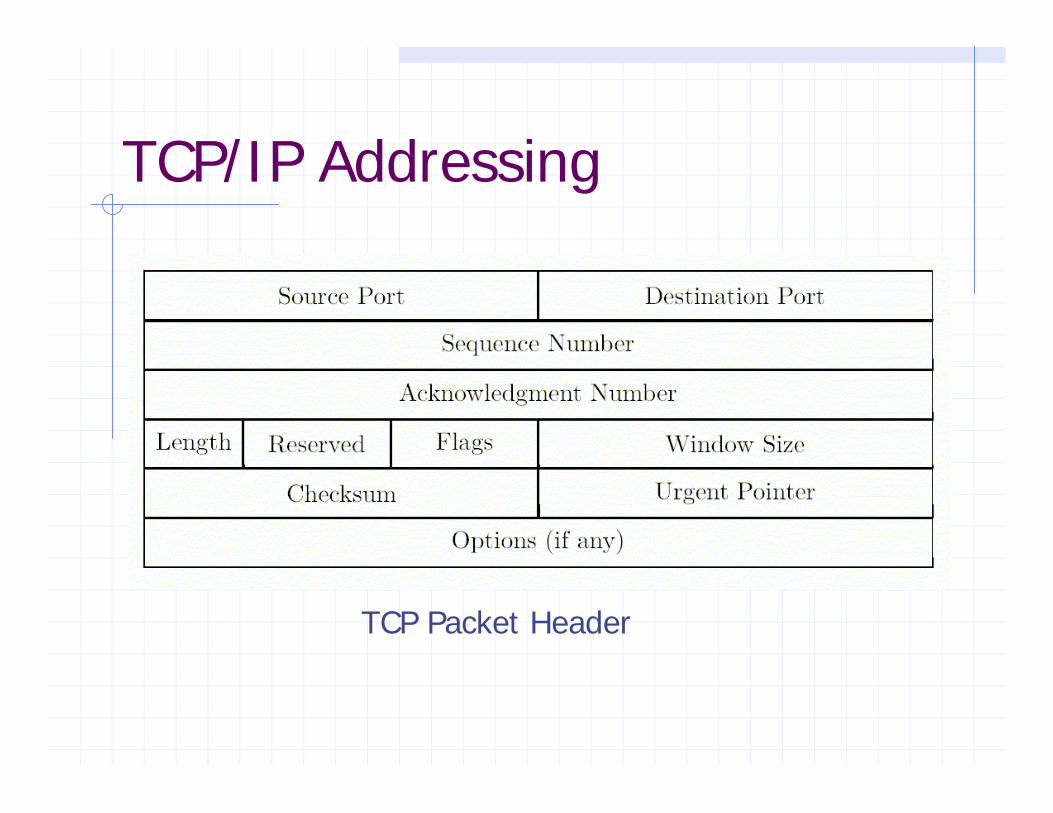
TCP/IP Addressing
TCP Packet Header

TCP/IP Addressing
Some Flag Typesn ACK – used to acknowledge receipt of a packet
n PSH – data should be pushed to application ASAP
n RST – reset
n SYN – synchronize connection so each host knows order of packets
n FIN – finish the connection
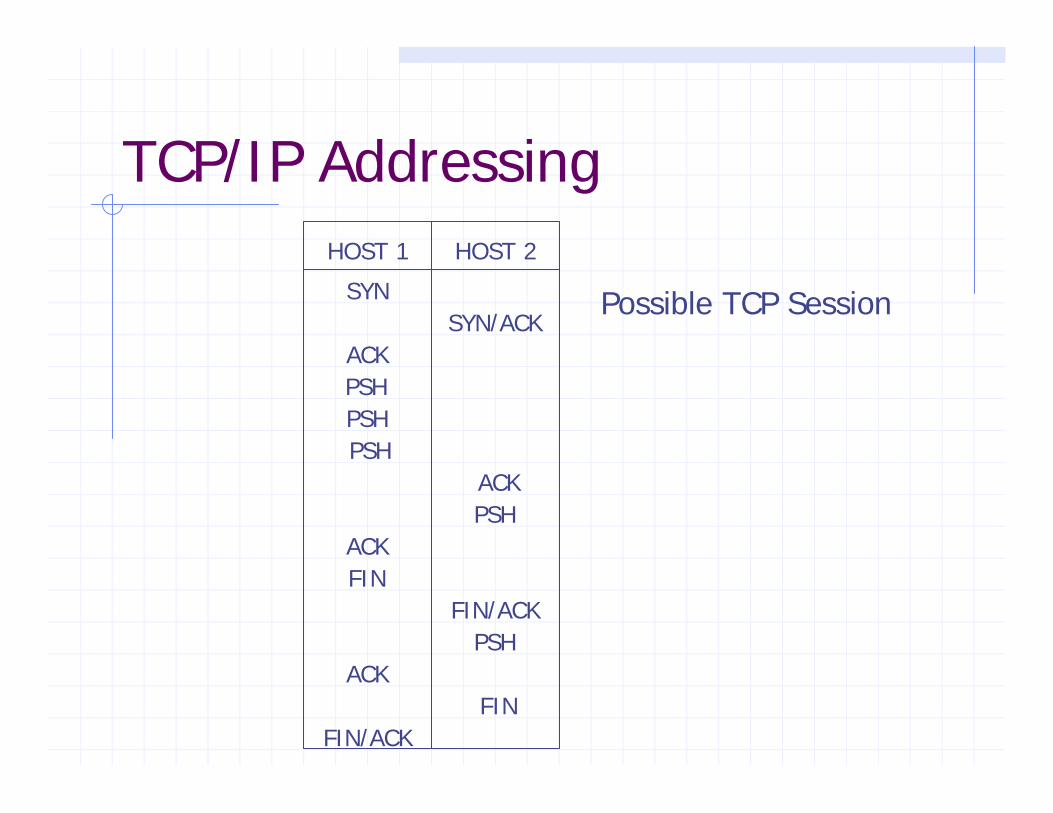
TCP/IP AddressingHOST 1 HOST 2
SYNSYN/ACK
ACKPSHPSH
ACKPSH
ACKFIN
FIN/ACKPSH
ACK
PSH
FINFIN/ACK
Possible TCP Session
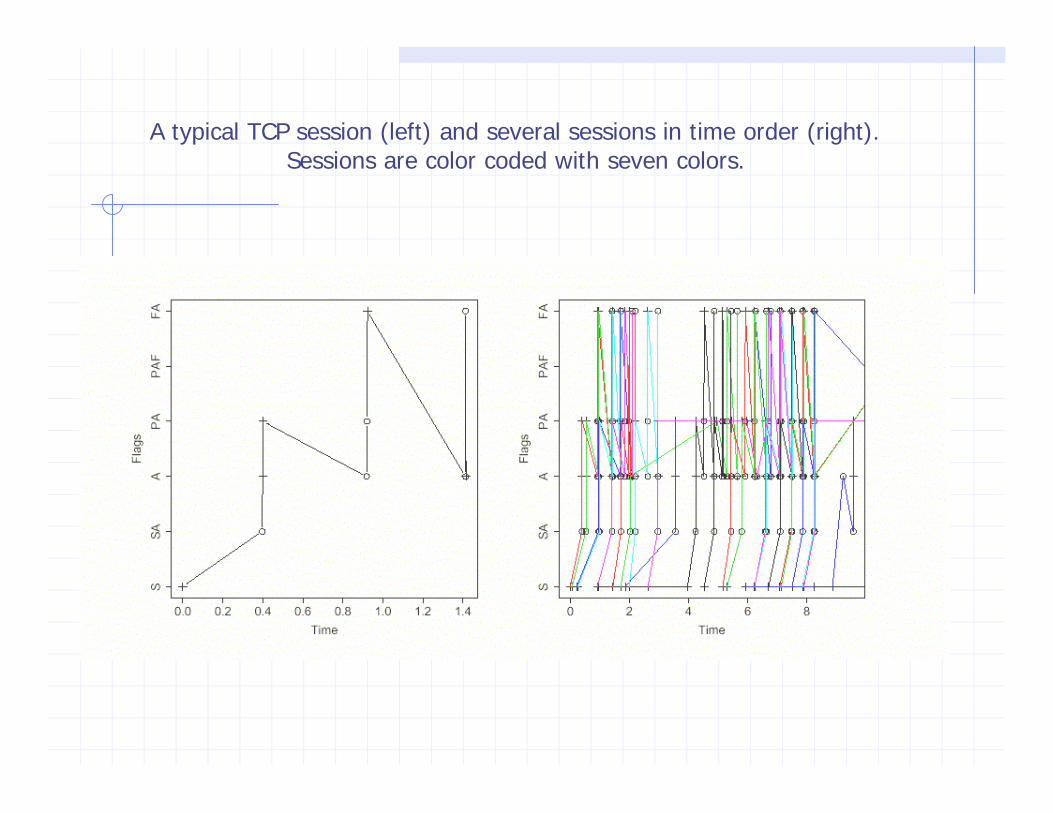
A typical TCP session (left) and several sessions in time order (right). Sessions are color coded with seven colors.
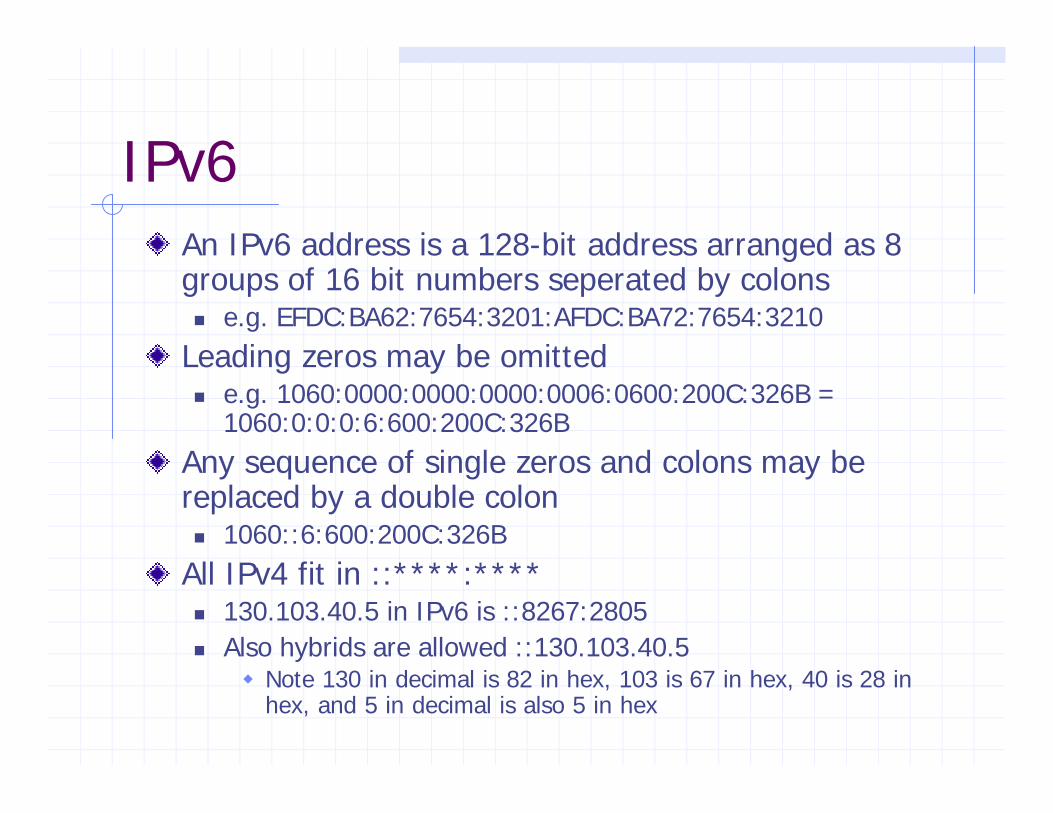
IPv6An IPv6 address is a 128-bit address arranged as 8 groups of 16 bit numbers seperated by colonsn e.g. EFDC:BA62:7654:3201:AFDC:BA72:7654:3210
Leading zeros may be omitted n e.g. 1060:0000:0000:0000:0006:0600:200C:326B =
1060:0:0:0:6:600:200C:326B
Any sequence of single zeros and colons may be replaced by a double colonn 1060::6:600:200C:326B
All IPv4 fit in ::****:****n 130.103.40.5 in IPv6 is ::8267:2805n Also hybrids are allowed ::130.103.40.5
w Note 130 in decimal is 82 in hex, 103 is 67 in hex, 40 is 28 in hex, and 5 in decimal is also 5 in hex

IPv6
How many hosts are possible in IPv6?n 3.4028236692093846337460743177 x 1038
n Less a few reserved addresses
IPv4 has basically 4 billionVisualization of everything is hard even in IPv4
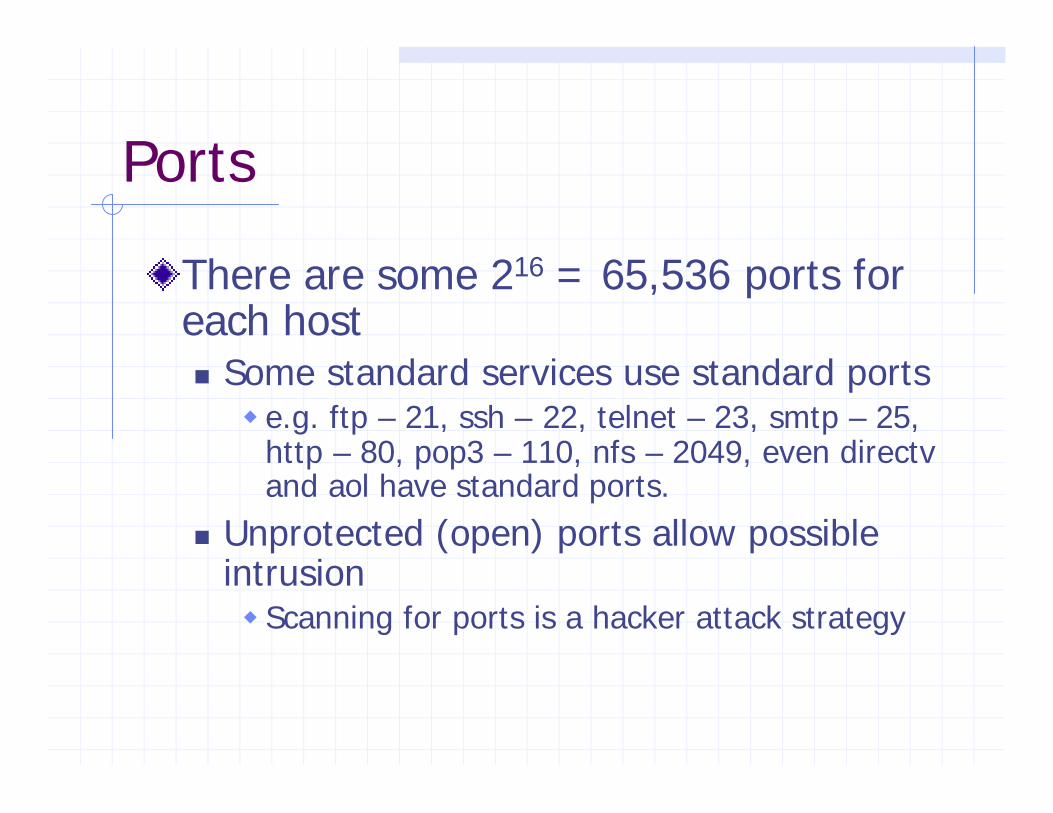
Ports
There are some 216 = 65,536 ports for each hostn Some standard services use standard portsw e.g. ftp – 21, ssh – 22, telnet – 23, smtp – 25,
http – 80, pop3 – 110, nfs – 2049, even directv and aol have standard ports.
n Unprotected (open) ports allow possible intrusionw Scanning for ports is a hacker attack strategy

tcpdumpIn order to analyze network traffic data, data are captured by programs called “sniffers”n tcpdump is such a program n Sniffers capture all or part of the data flowing
through a given pointn At GMU, we have been allowed to install a sniffer
outside the firewall capturing all packet header data flowing in and out of GMUw Total traffic in and out of the class B network at GMU is
in the multi-terabyte rangew .60-1.5 gigabytes of header data per half hourw Even within the relatively small statistics subnet, we see
65,000 –150,000 packets per hour (during final exams when traffic is low)

Observations• The scale of traffic, although discrete, is for many purposes essentially continuous.
• Storage of all header data is not possible. We have terabyte storage capability, but streaming algorithms and methods are essential. Recursive algorithms are essential.
• Fortunately, not every computer in the system talks to every other computer, but even visualization methods are stretched to their limits.
• Nature of traffic changes during the day.

Our Project at GMU
Knossos?
Our Project at GMU
Cerberus Three-headed dog guarding the Gates of hell
After all, they do call it a firewall!
Our Project at GMU
St. Peter Guarding the gates of heaven?
No good – Theory has it he keeps data forever.

Our Project at GMU
Project Santa Claus
Keeps a list and checks it twice – finding out who is naughty and nice.
But discards data after one year … clearly a streaming data analyst.

Some Recursive Algorithms
n

Recursive Density Estimation

More

More
Exponentially weighted averages
Yt = Σ (1- θ) θ j Xt – j,
Then
Yt = (1 - θ) Xt + θ Yt - 1
Moving windows of finite width
Tapered windows with other than exponential tapers

Geometry-based Quantization
In one dimensionn Only polytope is a straight line segment (also
bounded by a one-dimensional sphere).
In two dimensionsn Only polytopes are equilateral triangles, squares
and hexagons

Geometry-based Quantization
In 3 dimensionsn Tetrahedrons (3-simplex), cube, hexagonal prism,
rhombic dodecahedron, truncated octahedron.
In 4 dimensionsn 4 simplex, hypercube, 24 cell
Truncated octahedron tessellation

Geometry-based Quantization
Tetrahedron* .1040042…Cube* .0833333…Octahedron .0825482…Hexagonal Prism* .0812227…Rhombic Dodecahedron* .0787451…Truncated Octahedron* .0785433…Dodecahedron .0781285…Icosahedron .0778185…Sphere .0769670
Dimensionless Second Moment for 3-D Polytopes
Quantization of Data
Choose E[W|Q = yj] = mean of observations in jth bin = yj
In other words, E[W|Q] = QThe quantizer is self-consistent

Results of Quantization
E[W] = E[Q]If θ is a linear unbiased estimator, then so is E[θ|Q]If h is a convex function, then E[h(Q)] ≤ E[h(W)].n In particular, E[Q2] ≤ E[W2] and var (Q) ≤ var (W).
E[Q(Q-W)] = 0cov (W-Q) = cov (W) - cov (Q)E[W-P]2 ≥ E[W-Q]2 where P is any other quantizer.
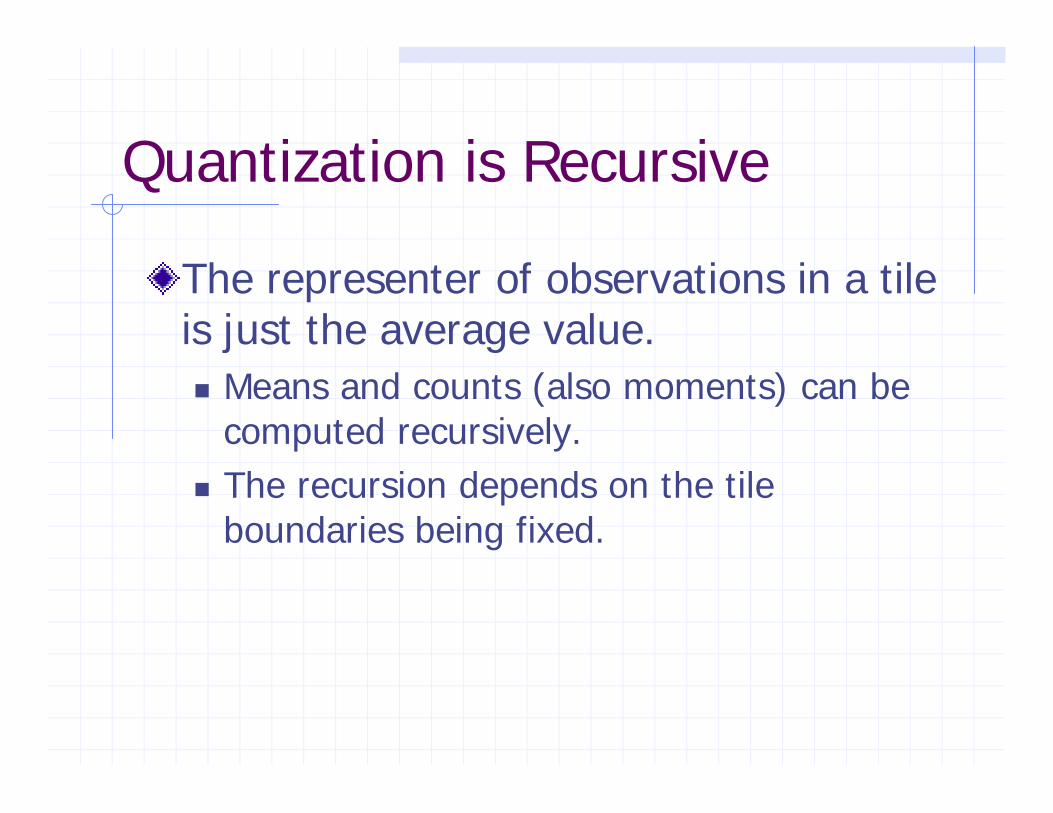
Quantization is Recursive
The representer of observations in a tile is just the average value.n Means and counts (also moments) can be
computed recursively.n The recursion depends on the tile
boundaries being fixed.

Geometry-based Quantization
Need space-filling tessellationsNeed congruent tilesNeed as spherical as possible

More
References to recursive methods:Wegman, E. J. and Davies, H. I. (1979) “Remarks on some recursive estimators of a probability density,” Annals of Statistics, 7, 316-327
Priebe, C. E. (1994) “Adaptive Mixtures,” Journal of the American Statistical Association, 89, 796-806
Khumbah, N-A and Wegman, E. J. (2003) “Data compression by geometric quantization,” To appear in Recent Advances and Trends in Nonparametric Statistics, (M. Akritas and D. Politis, eds), Elsevier: Amsterdam

Graphics Suggestions
Waterfall (ports and/or IP)Transient Geographic Mappingn High intensity traffic persistentn Low intensity traffic persistent
Multivariate to visualizen Port scanningn Denial of service attacks
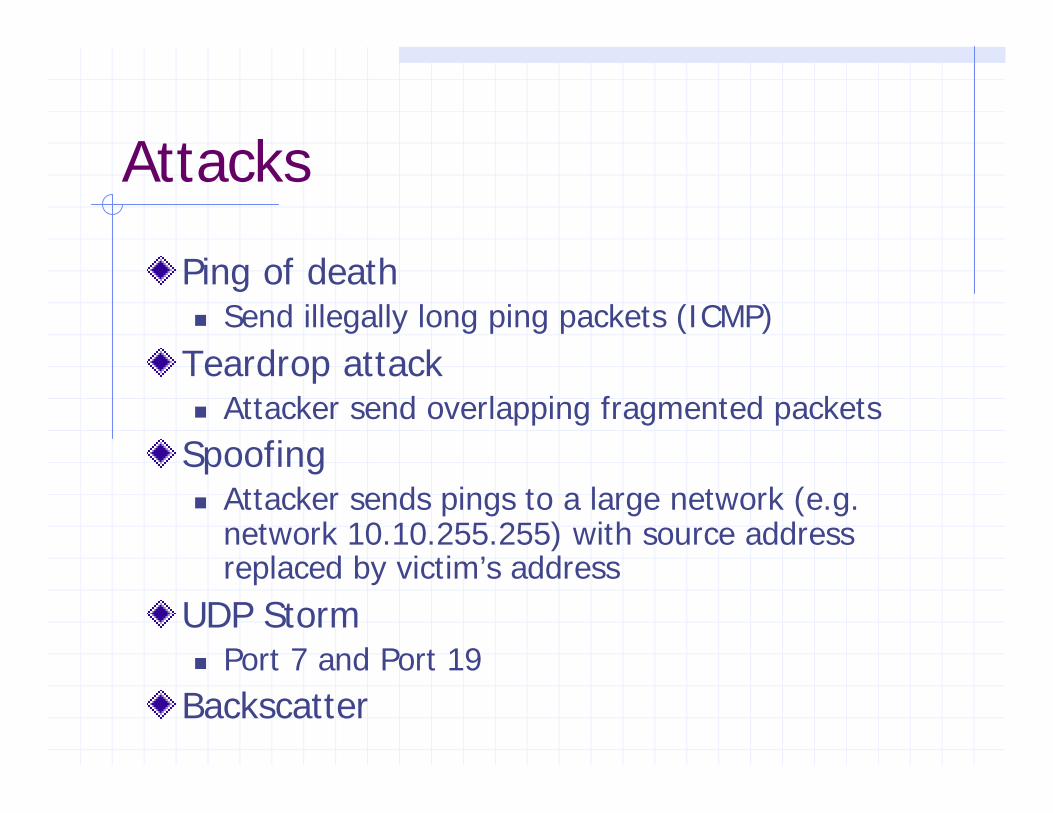
Attacks
Ping of deathn Send illegally long ping packets (ICMP)
Teardrop attackn Attacker send overlapping fragmented packets
Spoofingn Attacker sends pings to a large network (e.g.
network 10.10.255.255) with source address replaced by victim’s address
UDP Stormn Port 7 and Port 19
Backscatter

Waterfall for Destination IP versus Time for only one hour

Waterfall for Source Port vs Time

Number of Bytes vs Number Packets – Full Scale

Number of Bytes vs Number of Packets – ½ Scale

Number of Packets vs Number of Bytes – ¼ Scale

Number of Packets vs Number of Bytes – ¼ scale with Anomaly

Source IP versus Time – Anomalous Clump in Red
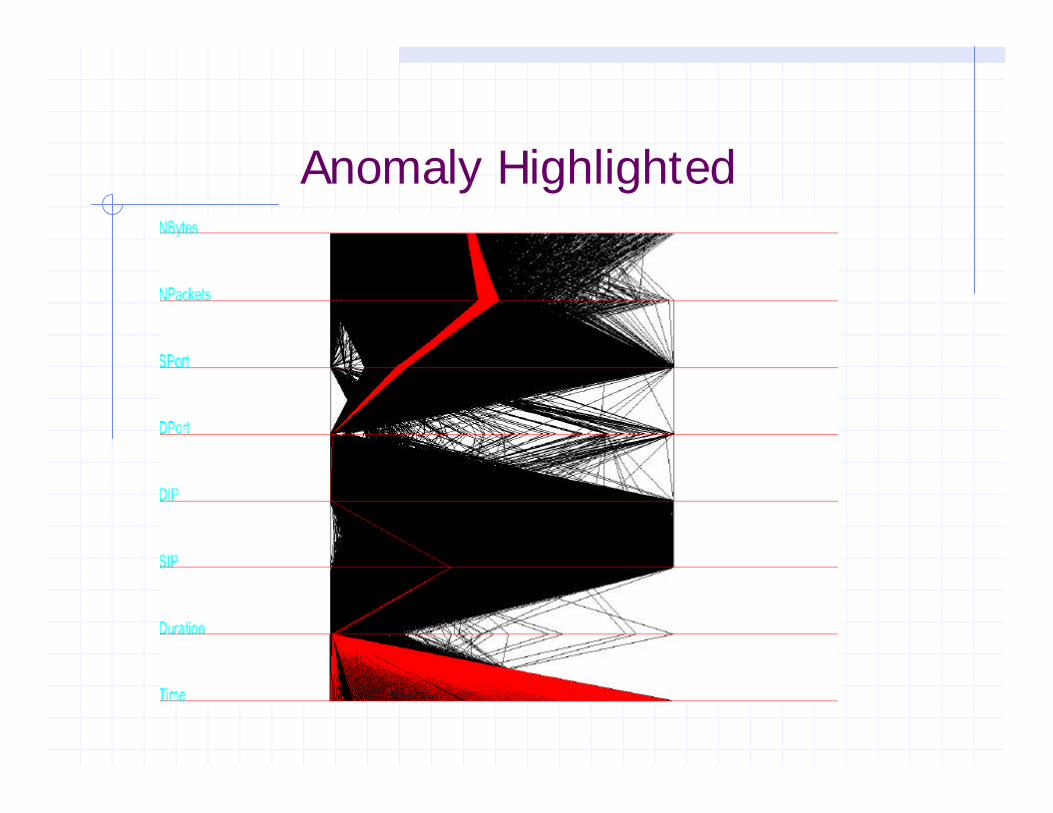
Anomaly Highlighted

Number of Bytes vs Duration –Full Scale
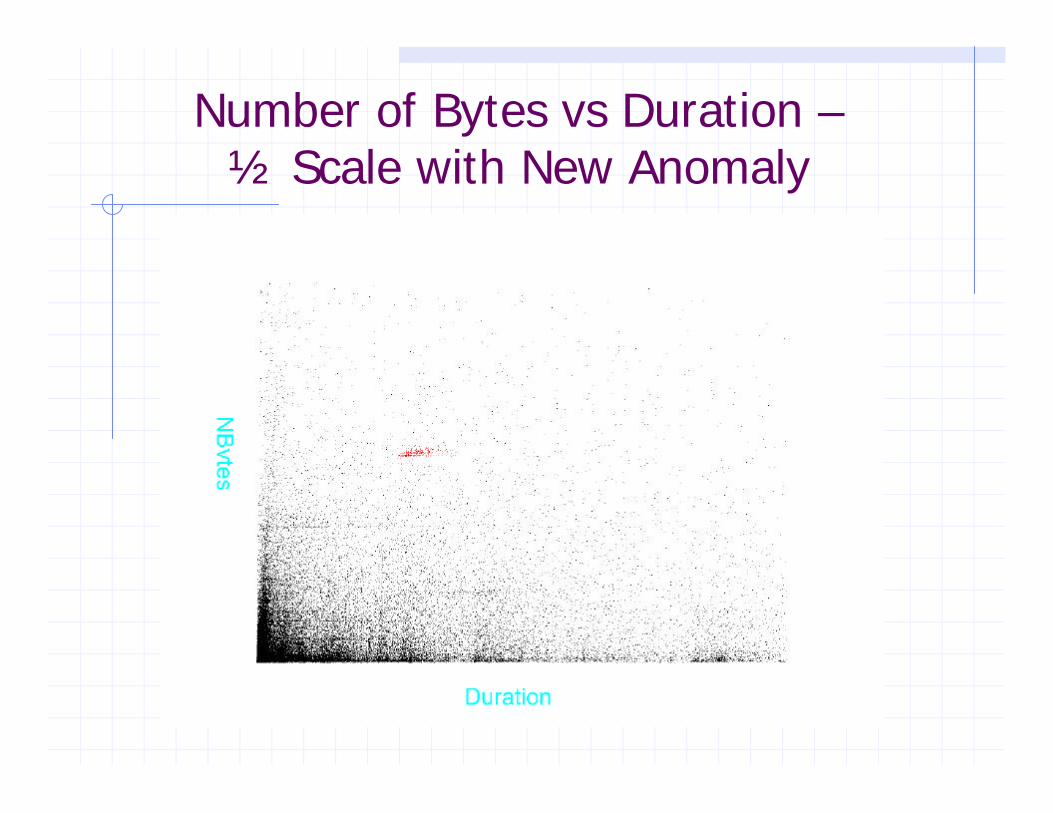
Number of Bytes vs Duration –½ Scale with New Anomaly

Anomaly Highlighted

Destination IP versus Source IP for one hour.
Vertical lines are indicative of scans.

# Bytes versus # Packets for Various Services
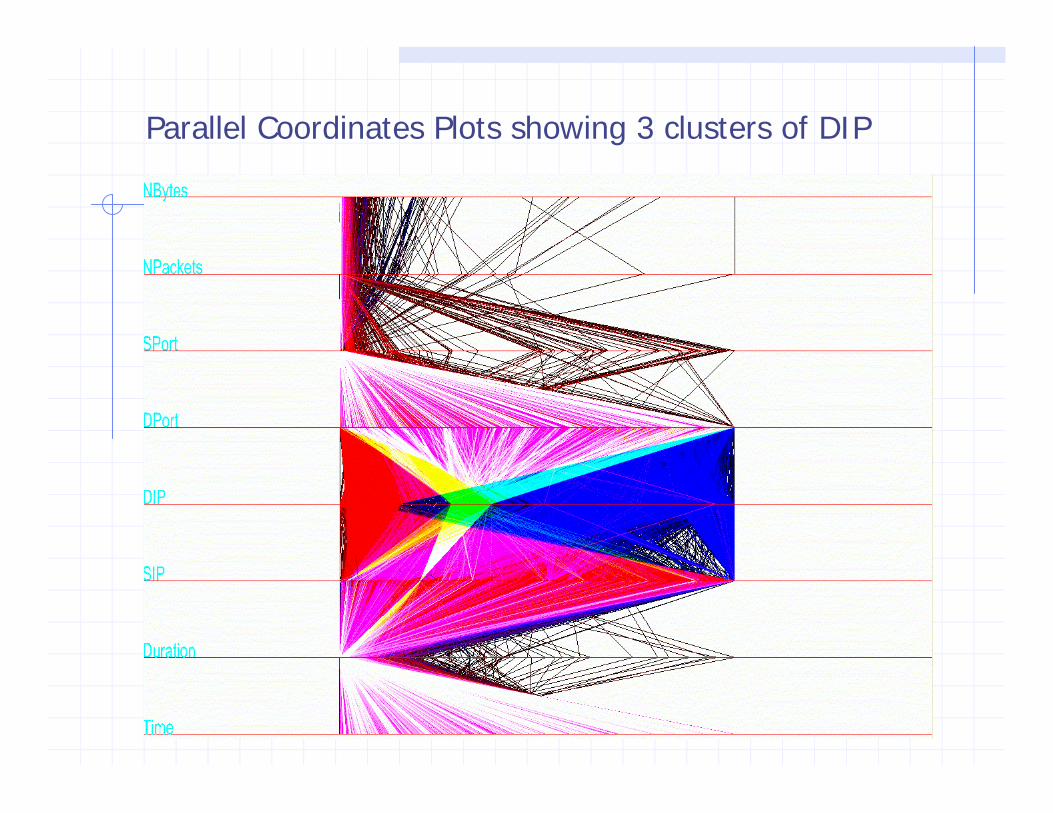
Parallel Coordinates Plots showing 3 clusters of DIP


Additional ReferencesMarchette, D. J. (2001) Computer Intrusion Detection and Network Monitoring, New York: Springer-Verlag
Stevens, W. R. (1994) TCP/IP Illustrated, Vol. 1, Reading, MA: Addison-Wesley
Leiden, C. and Wilensky, M. (2000) TCP/IP for Dummies (4th Edition), New York: Hungry Minds
Solka, J. L., Marchette, D. J. and Wallet, B. (2000) “Statistical visualization methods in intrusion detection,” Computing Science and Statistics, 32, 16-24
Marchette, D. J. and Wegman, E. J. (2003) “Statistical analysis of network data for cybersecurity,” to appear Chance
Wegman, E. J. and Marchette, D. J. (2003) “On some techniques for streaming data: A case study of internet packet headers,” to appear (we hope) Journal of Computational and Graphical Statistics
Acknowledgements
Our work is supported and surveillance equipment provided by the AFOSR.
Dr. Wegman’s work is also supported by DARPA’s ISP program through a subcontract with the Johns Hopkins University, Carey E. Priebe principal investigator and by ONR
Special acknowledgement goes to David Marchette.

Contact
Edward J. WegmanCenter for Computational StatisticsGeorge Mason UniversityFairfax, VA 22030-4444
Email: [email protected]