evolutionary dynamics of molecular markers during local adaptation: a case study in drosophila...
TRANSCRIPT

BioMed CentralBMC Evolutionary Biology
ss
Open AcceResearch articleEvolutionary dynamics of molecular markers during local adaptation: a case study in Drosophila subobscuraPedro Simões*1, Marta Pascual2, Josiane Santos1, Michael R Rose3 and Margarida Matos1Address: 1Universidade de Lisboa, Faculdade de Ciências da Universidade de Lisboa, Centro de Biologia Ambiental, Departamento de Biologia Animal, Campo Grande, 1749-016 Lisboa, Portugal, 2Department of Genetics, Faculty of Biology, University of Barcelona, 08028 Barcelona, Spain and 3Department of Ecology and Evolutionary Biology, University of California, Irvine, California 92697-2525, USA
Email: Pedro Simões* - [email protected]; Marta Pascual - [email protected]; Josiane Santos - [email protected]; Michael R Rose - [email protected]; Margarida Matos - [email protected]
* Corresponding author
AbstractBackground: Natural selection and genetic drift are major forces responsible for temporalgenetic changes in populations. Furthermore, these evolutionary forces may interact with eachother. Here we study the impact of an ongoing adaptive process at the molecular genetic level byanalyzing the temporal genetic changes throughout 40 generations of adaptation to a commonlaboratory environment. Specifically, genetic variability, population differentiation and demographicstructure were compared in two replicated groups of Drosophila subobscura populations recentlysampled from different wild sources.
Results: We found evidence for a decline in genetic variability through time, along with an increasein genetic differentiation between all populations studied. The observed decline in genetic variabilitywas higher during the first 14 generations of laboratory adaptation. The two groups of replicatedpopulations showed overall similarity in variability patterns. Our results also revealed changingdemographic structure of the populations during laboratory evolution, with lower effectivepopulation sizes in the early phase of the adaptive process. One of the ten microsatellites analyzedshowed a clearly distinct temporal pattern of allele frequency change, suggesting the occurrence ofpositive selection affecting the region around that particular locus.
Conclusion: Genetic drift was responsible for most of the divergence and loss of variabilitybetween and within replicates, with most changes occurring during the first generations oflaboratory adaptation. We also found evidence suggesting a selective sweep, despite the lownumber of molecular markers analyzed. Overall, there was a similarity of evolutionary dynamics atthe molecular level in our laboratory populations, despite distinct genetic backgrounds and somedifferences in phenotypic evolution.
BackgroundEvolution in a novel environment involves a complexarray of processes that produces both genetic and pheno-
typic changes. The extent of these changes varies as a func-tion of several forces, such as the selective pressuresimposed and the magnitude of genetic drift, as well as the
Published: 26 February 2008
BMC Evolutionary Biology 2008, 8:66 doi:10.1186/1471-2148-8-66
Received: 26 June 2007Accepted: 26 February 2008
This article is available from: http://www.biomedcentral.com/1471-2148/8/66
© 2008 Simões et al; licensee BioMed Central Ltd. This is an Open Access article distributed under the terms of the Creative Commons Attribution License (http://creativecommons.org/licenses/by/2.0), which permits unrestricted use, distribution, and reproduction in any medium, provided the original work is properly cited.
Page 1 of 11(page number not for citation purposes)

BMC Evolutionary Biology 2008, 8:66 http://www.biomedcentral.com/1471-2148/8/66
genetic background and prior evolutionary history of thepopulations concerned. Natural selection is an importantevolutionary process affecting differentiation betweenpopulations. Different selective regimes foster evolution-ary divergence, while common novel selective forces areexpected to lead to convergence [1]. Nevertheless, there isno certainty about the evolutionary outcome when multi-ple selectively differentiated populations adapt to thesame environment (e.g., [2]).
An important evolutionary factor leading to differencesamong populations is genetic drift, particularly in popula-tions with low effective size [3]. Moreover, natural selec-tion and drift may interact, leading to disparateevolutionary outcomes among populations sharing acommon environment (see [4,5]). Genetic drift can pro-mote the loss of different alleles among distinct isolatedpopulations, potentially affecting the evolutionaryresponse of selected traits that are influenced by such alle-les. In addition, directional selection can reduce effectivepopulation size, enhancing the impact of genetic drift ongenetic variability within populations and differentiationamong them (see [6]).
Experimental evolution can help address these issuesthrough the use of controlled selection regimes, control-led population sizes, and replication, both simultaneousand sequential [7]. In particular, the study of the evolu-tion of laboratory populations since their foundationfrom the wild allows us to study the effects of populationof origin, demographic structure, and the absence of geneflow on the process of evolutionary domestication. Thisexperimental paradigm has the additional interest arisingfrom the common pattern of large population sizes in thenatural population(s) of origin, leading typically to labo-ratory populations with high initial genetic variability. Allof this makes the study of adaptation to the laboratorywell-suited to the analysis of the roles of selection, geneticdrift, and their interaction during evolution in a novelenvironment [8]. In this setting, the evolutionary dynam-ics of molecular markers during laboratory adaptationoffers the possibility of clarifying the impact of an ongo-ing adaptive event at the molecular genetic level. Fewstudies have collected such information in an experimen-tal evolution framework (but see [9,10]).
The joint study of evolutionary changes in selectively-important quantitative traits, such as those that define lifehistories, and highly polymorphic molecular markers,such as microsatellites, allows us to analyse in furtherdetail the effects of natural selection and genetic drift inthe genome of evolving populations.
Multilocus screens have been used as a tool to identifyregions of the genome that have undergone positive selec-
tion (e.g., [11,12]). These tests rely on the assumption thatregions subjected to positive selection will deviate fromthe neutral pattern that is assumed to be present in theremainder of the genome. Microsatellite loci, given theirfrequent polymorphism, wide distribution, and abun-dance in eukaryotic genomes, are particularly suited forthese screens [12,13]. Although microsatellite markers areoften assumed to be neutral (see [14]), they can beaffected by selective forces if linkage disequilibrium witha selected locus occurs, an effect known as "hitchhiking"[15]. The spread of a beneficial allele in an adapting pop-ulation is expected to cause a reduction of variability inthe selected locus and its flanking regions [11,16,17] – a"selective sweep". Studying polymorphic microsatellitemarkers in populations adapting to a new environmentshould help evaluate their ability to detect loci that devi-ate from neutral expectations and, at the same time, mightreveal regions of the genome implicated in adaptive proc-esses [11].
Here we present a detailed study of the temporal geneticchanges in two sets of replicated populations of Drosophilasubobscura derived from different foundations in the wild(one from Sintra and one from Arrábida, Portugal) as theyundergo adaptation to a common laboratory environ-ment, based on molecular markers.
The phenotypic evolution of these populations in the lab-oratory environment has already been analyzed throughevolutionary trajectories for several life history traits,revealing a clear adaptive response, particularly for fecun-dity-related traits. Nevertheless, these populations alsoshowed differences in their phenotypic evolutionary rates,particularly during an early phase of the laboratory adap-tation process [8]. Bearing this in mind, we compared thegenetic variability of microsatellites between these popu-lations, searching for possible associations between neu-tral genetic variability and their adaptive response.
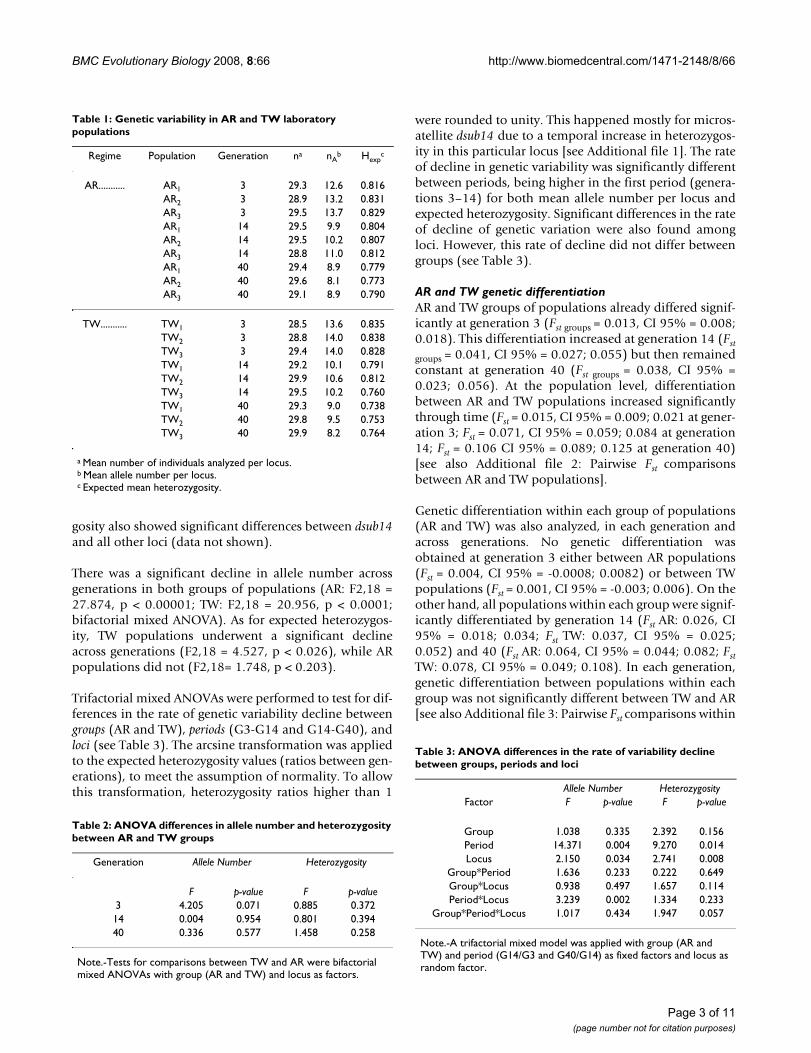
ResultsAR and TW genetic variabilityAll AR and TW populations showed high initial geneticvariability, as measured at the third generation of labora-tory adaptation (see Table 1). The two groups of popula-tions did not statistically differ with respect to either allelenumber or expected heterozygosity in any of the threegenerations analyzed by bifactorial mixed ANOVAs (seeTable 2). However, significant differences were observedbetween loci for both allele number and expected hetero-zygosity in each generation, with microsatellite locusdsub14 presenting the lowest mean allele number and thelowest expected heterozygosity in all generations analyzed[see Additional file 1: Genetic Variability of AR and TWpopulations]. Post hoc Scheffé tests on expected heterozy-
Page 2 of 11(page number not for citation purposes)
BMC Evolutionary Biology 2008, 8:66 http://www.biomedcentral.com/1471-2148/8/66
gosity also showed significant differences between dsub14and all other loci (data not shown).
There was a significant decline in allele number acrossgenerations in both groups of populations (AR: F2,18 =27.874, p < 0.00001; TW: F2,18 = 20.956, p < 0.0001;bifactorial mixed ANOVA). As for expected heterozygos-ity, TW populations underwent a significant declineacross generations (F2,18 = 4.527, p < 0.026), while ARpopulations did not (F2,18= 1.748, p < 0.203).
Trifactorial mixed ANOVAs were performed to test for dif-ferences in the rate of genetic variability decline betweengroups (AR and TW), periods (G3-G14 and G14-G40), andloci (see Table 3). The arcsine transformation was appliedto the expected heterozygosity values (ratios between gen-erations), to meet the assumption of normality. To allowthis transformation, heterozygosity ratios higher than 1
were rounded to unity. This happened mostly for micros-atellite dsub14 due to a temporal increase in heterozygos-ity in this particular locus [see Additional file 1]. The rateof decline in genetic variability was significantly differentbetween periods, being higher in the first period (genera-tions 3–14) for both mean allele number per locus andexpected heterozygosity. Significant differences in the rateof decline of genetic variation were also found amongloci. However, this rate of decline did not differ betweengroups (see Table 3).
AR and TW genetic differentiationAR and TW groups of populations already differed signif-icantly at generation 3 (Fst groups = 0.013, CI 95% = 0.008;0.018). This differentiation increased at generation 14 (Fst
groups = 0.041, CI 95% = 0.027; 0.055) but then remainedconstant at generation 40 (Fst groups = 0.038, CI 95% =0.023; 0.056). At the population level, differentiationbetween AR and TW populations increased significantlythrough time (Fst = 0.015, CI 95% = 0.009; 0.021 at gener-ation 3; Fst = 0.071, CI 95% = 0.059; 0.084 at generation14; Fst = 0.106 CI 95% = 0.089; 0.125 at generation 40)[see also Additional file 2: Pairwise Fst comparisonsbetween AR and TW populations].
Genetic differentiation within each group of populations(AR and TW) was also analyzed, in each generation andacross generations. No genetic differentiation wasobtained at generation 3 either between AR populations(Fst = 0.004, CI 95% = -0.0008; 0.0082) or between TWpopulations (Fst = 0.001, CI 95% = -0.003; 0.006). On theother hand, all populations within each group were signif-icantly differentiated by generation 14 (Fst AR: 0.026, CI95% = 0.018; 0.034; Fst TW: 0.037, CI 95% = 0.025;0.052) and 40 (Fst AR: 0.064, CI 95% = 0.044; 0.082; FstTW: 0.078, CI 95% = 0.049; 0.108). In each generation,genetic differentiation between populations within eachgroup was not significantly different between TW and AR[see also Additional file 3: Pairwise Fst comparisons within
Table 3: ANOVA differences in the rate of variability decline between groups, periods and loci
Allele Number HeterozygosityFactor F p-value F p-value
Group 1.038 0.335 2.392 0.156Period 14.371 0.004 9.270 0.014Locus 2.150 0.034 2.741 0.008
Group*Period 1.636 0.233 0.222 0.649Group*Locus 0.938 0.497 1.657 0.114Period*Locus 3.239 0.002 1.334 0.233
Group*Period*Locus 1.017 0.434 1.947 0.057
Note.-A trifactorial mixed model was applied with group (AR and TW) and period (G14/G3 and G40/G14) as fixed factors and locus as random factor.
Table 2: ANOVA differences in allele number and heterozygosity between AR and TW groups
Generation Allele Number Heterozygosity
F p-value F p-value3 4.205 0.071 0.885 0.37214 0.004 0.954 0.801 0.39440 0.336 0.577 1.458 0.258
Note.-Tests for comparisons between TW and AR were bifactorial mixed ANOVAs with group (AR and TW) and locus as factors.
Table 1: Genetic variability in AR and TW laboratory populations
Regime Population Generation na nAb Hexp
c
AR........... AR1 3 29.3 12.6 0.816AR2 3 28.9 13.2 0.831AR3 3 29.5 13.7 0.829AR1 14 29.5 9.9 0.804AR2 14 29.5 10.2 0.807AR3 14 28.8 11.0 0.812AR1 40 29.4 8.9 0.779AR2 40 29.6 8.1 0.773AR3 40 29.1 8.9 0.790
TW........... TW1 3 28.5 13.6 0.835TW2 3 28.8 14.0 0.838TW3 3 29.4 14.0 0.828TW1 14 29.2 10.1 0.791TW2 14 29.9 10.6 0.812TW3 14 29.5 10.2 0.760TW1 40 29.3 9.0 0.738TW2 40 29.8 9.5 0.753TW3 40 29.9 8.2 0.764
a Mean number of individuals analyzed per locus.b Mean allele number per locus.c Expected mean heterozygosity.
Page 3 of 11(page number not for citation purposes)

BMC Evolutionary Biology 2008, 8:66 http://www.biomedcentral.com/1471-2148/8/66
and across laboratory generations]. In both groups ofpopulations genetic differentiation increased significantlybetween generation 3 and 14 (AR and TW) (Fst generations =0.005, CI 95% = 0.002; 0.008 for AR; Fst generations = 0.018,CI 95% = 0.005; 0.034 for TW) but not between genera-tions 14 and 40 (Fst generations= -0.007, CI 95% = -0.0006; -0.0129 for AR; Fst generations= -0.006, CI 95% = -0.015; 0.003for TW).
AR and TW effective population sizesTable 4 presents Ne estimates for both AR and TW popula-tions during the two periods of laboratory adaptation: thefirst period (generations 3 to 14), the second period (gen-erations 14 to 40) and also during the overall study (gen-erations 3 to 40) using both a pseudo-likelihoodapproach and the loss of heterozygosity method. Ne val-ues were estimated excluding microsatellite locus dsub14from the data, given its extremely low diversity and itsincrease in heterozygosity between generations 3 and 14.Furthermore, the disparity between dsub14 and all othermicrosatellite loci may be due to non-neutrality at thislocus, an assumption of all models estimating Ne. Thecase of this particular locus will be addressed furtherbelow.
Using either method, effective population size estimatesfor the first period of laboratory adaptation were signifi-cantly lower than those obtained for the second period forboth TW and AR groups of populations (t-tests using asdata points the √Ne estimates of the three replicate popu-lations; p < 0.05 for all estimates; see Table 4).
AR populations presented a significantly higher Ne thanTW populations between generations 3 to 14, accordingto the loss of heterozygosity method (AR Ne value =125.67; TW Ne value = 71.00; t-test; p = 0.04). Neverthe-less, the AR and TW Ne estimates obtained using thepseudo-likelihood method for this first period did not dif-fer significantly (t-tests; p > 0.1; see Table 4). In contrast,all effective population sizes estimates between genera-tions 14 and 40 for all AR and TW populations were notsignificantly different (t-tests; p > 0.1; see Table 4).
AR and TW effective population sizes were also not signif-icantly different when all 40 generations of laboratoryadaptation were considered, regardless of the estimationmethod used. Ne/N ratios ranged between 19.8 to 30.6%in AR populations and between 20.8 to 28.1% in TW pop-ulations when using the pseudo-likelihood approach.When using the loss of heterozygosity method Ne /Nratios for the AR populations ranged between 19.6 to31.2%, and for the TW populations between 12.7 to18.2% (see Table 4).
Testing for positive selection during laboratory adaptationHeterozygosity ratios (Ln RH ratios) were calculated forboth groups of populations by comparing data betweengenerations 3 and 14 as well as between generations 14and 40. When comparing generations 3 and 14, Ln RHvalues were significantly different between loci, both inTW and AR populations (one-way ANOVA; p < 0.001). LnRH values for locus dsub14 were significantly differentfrom those obtained for all other loci in all six popula-tions (post hoc Scheffé test; p < 0.0001 for all comparisons)
Table 4: Estimates of effective population size (Ne) for AR and TW populations
AR1 AR2 AR3 TW1 TW2 TW3
Generations 3 to 14Ne (pseudo-likelihood) 101.52 109.96 227.36 122.86 134.01 115.85CI (95%) (74.51–144.62) (80.41–156.67) (144.62–419.8) (88.14–180.43) (96.61–196.83) (84.87–165.25)
Ne (Ht/Ho) 116.80 112.78 146.88 69.33 95.13 49.02N (census) 841.67 800.00 820.83 816.67 895.83 816.67
Generations 14 to 40Ne (pseudo-likelihood) 304.42 268.77 395.01 274.10 313.29 389.06CI (95%) (209.72–469.60) (186.20–411.28) (255.97–677.39) (209.88–364.82) (235.63–425.67) (275.45–573.51)
Ne (Ht/Ho) 282.10 203.60 437.50 160.70 257.50 -N (census) 927.78 866.67 875.93 963.33 951.85 965.19
Generations 3 to 40Ne (pseudo-likelihood) 274.65 165.83 253.08 230.36 263.19 190.98CI (95%) (201.40–384.17) (127.24–218.88) (186.01–351.29) (174.43–309.09) (198.19–357.58) (143.87–258.34)
Ne (Ht/Ho) 196.87 163.64 271.90 117.71 170.64 170.83N (census) 897.30 836.49 871.62 924.59 936.49 916.49
Page 4 of 11(page number not for citation purposes)

BMC Evolutionary Biology 2008, 8:66 http://www.biomedcentral.com/1471-2148/8/66
as a result of the increase in heterozygosity at this locus. LnRH values between all other pairs of loci were not signifi-cantly different (p > 0.05 for all comparisons). Also, stand-ardized Ln RH values for microsatellite locus dsub14 felloutside the 95% confidence interval of the standard nor-mal distribution for all replicates (see Fig. 1). The patternobserved in locus dsub14 was due to the increase in fre-quency of the same allele (120 bp) in all TW populationsand the AR3 population, while a different allele (with 116bp) increased in frequency in both AR1 and AR2 popula-tions. In TW populations, the allele that increased in fre-quency (120 bp) rose from an average initial frequency of11.5% at generation 3 to 31.6% at generation 14. In theAR3 population, the 120 bp allele increased from 5% to19.2% while the 116 bp allele increased in AR1 and AR2populations from an average frequency of 5.2% to 15.5%.
Between generations 14 and 40, Ln RH ratios for the ARpopulations were similar to those mentioned above,again with only locus dsub14 significantly differing fromall other loci (post hoc Scheffé test; p < 0.05 for all compar-isons). This was also observed for each replicate popula-tion by analyzing the standardized Ln RH values (see Fig.2). During this second period of laboratory evolution, thefrequencies of the potentially selected allele in locusdsub14 continued to rise in AR1 and AR2 populations (withthe 116 bp allele reaching a frequency of 27.8 and 41.4%at generation 40, respectively). Nevertheless, in the AR3population the allele that had previously increased in fre-quency (120 bp) slightly decreased (from 19.2% to13.5%), being the high Ln RH ratio due to the increase in
frequency of other alleles. For the TW populations, no sig-nificant differences between loci were detected with thegeneral ANOVA or the Scheffé test. However, the analysisof the standardized Ln RH values for each TW replicatepopulation showed some significant results, though theywere not consistent among replicates. Specifically, locusdsub14 showed a significant decrease in heterozygosity inthe TW2 population, due to a decrease in frequency of the120 bp allele. Heterozygosities for this particular locusremained almost constant in the TW1 and TW3 popula-tions during this period (see Fig. 2).
DiscussionInitial microsatellite variability and genetic differentiationBoth AR and TW populations presented similar high lev-els of initial variability at the ten microsatellite loci stud-ied. Sampling effects of foundation thus apparently didnot greatly deplete genetic variability at the start of labo-ratory culture. The mean allele number (nA = 13.4–14.9)and expected heterozygosity (Hexp = 0.877–0.898) inthese populations were similar to the values observed forthe same seven common loci studied in other Europeannatural populations (nA = 14–16.5, Hexp = 0.875–0.911,data from [18]).
Nevertheless, AR and TW populations showed significantinitial genetic differentiation. The overall Fst value of0.015 at generation 3 was slightly higher than the valuesobtained from other comparisons among European pop-ulations of Drosophila subobscura (average Fst = 0.006; see[18]). This suggests independent evolution of the ances-
Standardized Heterozygosity ratios (Ln RH) between generations 3 and 14Figure 1Standardized Heterozygosity ratios (Ln RH) between generations 3 and 14. Ln RH ratios (H14/H3) for AR (Fig. 1A) and TW (Fig. 1B) populations. Dashed lines represent the 95% confidence interval of the standardized normal distribution. Pos-itive Ln RH values correspond to increases in variation through time.
-3.0-2.5-2.0-1.5-1.0-0.50.00.1.
50
1.50
2.53.03.5
dsub
01
dsub
02
dsub
05
dsub
10
dsub
14
dsub
19
dsub
20
dsub
21
dsub
23
dsub
27
Ln R
H
2.
Ln RH AR1Ln RH AR2Ln RH AR3
dsub
01
dsub
02
dsub
05
dsub
10
dsub
14
dsub
19
dsub
20
dsub
21
dsub
23
dsub
27
Ln RH TW1Ln RH TW2Ln RH TW3
A B
Page 5 of 11(page number not for citation purposes)

BMC Evolutionary Biology 2008, 8:66 http://www.biomedcentral.com/1471-2148/8/66
tral natural populations at the locations from which thesepopulations were derived, Arrábida and Sintra, both inPortugal. These results are somewhat surprising, given theclose proximity of the two natural sites where the found-ers were collected, with a distance of around 50 km. It ispossible that the foundation process and the subsequentthree generations in the laboratory environment mayhave accentuated the differences in allele frequenciesbetween these populations. Further sampling and also theanalyses of founder individuals may help to clarifywhether these two natural populations present restrictedgene flow or if their genetic differentiation was just anartefact of laboratory foundation.
Temporal dynamics of microsatellite variability and genetic differentiationDuring the course of 40 generations of laboratory culture,the initially high genetic variability was progressivelyeroded: both allele number and heterozygosity showedsigns of decline during this period. This was predictable,because two forces that are both expected to erode geneticvariability – random genetic drift and sustained direc-tional selection – are likely to be pronounced in labora-tory cultures, particularly given that effective populationsizes are likely to be much lower than those occurring innatural populations of Drosophila. This depletion ingenetic variability was generally observed throughout lab-oratory culture for both AR and TW populations, asshown by the parallel declines among variability indexes.However, it is important to note that this loss of geneticvariability was relatively mild, since after 40 generations
of laboratory adaptation AR and TW populationsretained, respectively, 95% and 90% of their initialgenetic diversity. The careful maintenance and overallhigh census sizes (around 900 individuals) in our popula-tions may explain these results. This is in accordance withthe high levels of genetic variability that we had alreadyfound for our NW Drosophila subobscura populations after49 generations in the laboratory, with 87 to 89% of thegenetic diversity of the third generation of TW popula-tions (Simões et al. unpublished data: Divergent evolu-tion of molecular markers during laboratorydomestication in Drosophila subobscura).
In a recent experimental evolution study with Drosophilamelanogaster [10], a significant decline in heterozygositywas found, with an estimated loss of 16% for genetic var-iability in experimental populations maintained with animposed census size (N≈Ne) of 100 individuals during 38generations of laboratory culture after sampling from thewild. The relatively modest decline in genetic diversityobserved in this study (5–10%), with a more variable sizeacross generations, suggests the absence of important bot-tlenecks events during the evolution of our laboratorypopulations.
The two variability measures used in this study showedsimilar patterns of decline. Both mean allele number andexpected heterozygosity showed a non-linear pattern,with a higher rate of decline in genetic variability betweengenerations 3 and 14. This decline might be the result of ahigh initial loss of rare alleles due to a bottleneck effect
Standardized Heterozygosity ratios (Ln RH) between generations 14 and 40Figure 2Standardized Heterozygosity ratios (Ln RH) between generations 14 and 40. Ln RH ratios (H40/H14) for AR (Fig. 2A) and TW (Fig. 2B) populations. Dashed lines represent the 95% confidence interval of the standardized normal distribution. Positive Ln RH values correspond to increases in variation through time.
dsub
01
dsub
02
dsub
05
dsub
10
dsub
14
dsub
19
dsub
20
dsub
21
dsub
23
dsub
27
Ln RH TW1Ln RH TW2Ln RH TW3
-3.0-2.5-2.0-1.5-1.0-0.50.00.51.01.52.02.53.03.5
sub0
1
dsub
02
dsub
05
dsub
10
dsub
14
dsub
19
dsub
20
dsub
21
dsub2
3
dsub
27
Ln R
H
d
Ln RH AR1Ln RH AR2Ln RH AR3
A B
Page 6 of 11(page number not for citation purposes)

BMC Evolutionary Biology 2008, 8:66 http://www.biomedcentral.com/1471-2148/8/66
associated with the first generations after foundation fromthe wild. Such bottleneck effects are expected to lead to alarge drop in allele number, though they are not expectedto have a major impact on the rate of decline of mean het-erozygosity (see [19,20]). The slowing down of the rate ofheterozygosity decline through time may instead be aresult of a smaller effective population size during the ini-tial generations of laboratory adaptation (see next sec-tion).
As a consequence of differential allele loss and allele fre-quency changes in each population, genetic differentia-tion (as measured by Fst values) increased among all sixpopulations through time. This is expected to be particu-larly important in smaller populations, due to geneticdrift [6]. This led to a progressive divergence among repli-cate populations within each group, despite their initiallack of differentiation. This genetic differentiation wasfaster than the differentiation that occurred between thetwo groups. In fact, in spite of the significant initial differ-entiation between AR and TW groups the genetic differen-tiation between populations within each group (Fst TW =0.078; Fst AR = 0.064) was higher than between groups (Fst
groups = 0.038) by generation 40. This suggests thatalthough there were differences in the initial genetic back-ground between the Arrábida and Sintra foundations,they do not seem to have played a central role in the tem-poral divergence observed among our laboratory popula-tions.
Our results indicate general similarity in the evolutionarydynamics of microsatellite loci during laboratory adapta-tion across populations. We found no associationbetween the initial genetic variability in molecular mark-ers – which was similar in both groups of populations –and the subsequent phenotypic evolutionary response tothe laboratory environment – with a higher adaptive ratefor TW relative to AR populations, particularly in the first14 generations [see 8]. Furthermore, the depletion ofgenetic variability through time showed only a weak asso-ciation with the phenotypic evolution of our populations.There was only a suggestion of a higher rate of depletionof heterozygosity in TW populations, which were in factthe ones that presented a higher adaptive rate [8]. Overall,the data suggest that phenotypic adaptation within ourlaboratory populations had little correlation with the var-iability shown by molecular markers. Our study suggestscaution when inferring adaptive potential from microsat-ellite data (see also [21-23]; but see [24]) although otherlaboratory studies covering a wider range of environmentsand populations are necessary to address this issue.
Effective population sizes during laboratory adaptationWe found evidence of an increase in the effective size ofour laboratory populations through time. The higher
selective pressures suffered shortly after laboratory foun-dation could account for the initial lower effective sizes,since family contributions may vary greatly under strongselection in an initial phase of adaptation [6]. It is how-ever possible that a smaller Ne in the first period was inpart due to an underestimation of the effective size of pop-ulations that have just been brought into the lab from thewild, having thus suffered a recent bottleneck. Thechanges in Ne across generations may thus reflect allelefrequency changes as the populations approach an equi-librium situation. Nevertheless, several simulations doneon likelihood based estimation reveal that a severe reduc-tion in population size followed by expansion does notlead to a considerable underestimation of Ne – less than5% for an Ne > 50, as is our case [25]. Moreover, thepseudo-likelihood method of Ne estimation that weemployed is considered relatively robust to frequencychanges in rare alleles [26], frequency changes that in ourpopulations occur particularly during the first generationsafter foundation. Thus, it seems unlikely that the changesin effective population size found using this method –with a three-fold increase between the two periods studied– were chiefly due to the effects of genetic drift in the firstgenerations leading to the loss of rare alleles.
Average Ne values for the TW populations were systemati-cally lower than those obtained for AR populations. Inparticular, TW populations presented a significantly lowereffective population size when it was estimated using theloss of heterozygosity method applied to the first 14 gen-erations. These results are consistent with the finding ofboth higher selective pressure (associated with a higheradaptive rate – see [8]) and more genetic drift effects inTW populations (see above).
The Ne/N ratios obtained in this study – 0.26 for AR and0.25 for TW populations, according to the pseudo-likeli-hood estimates – are higher than most estimates based onlaboratory-maintained populations. For instance, Ne/Nvalues below 0.051 were found for captive populations ofDrosophila melanogaster [27], and other studies in labora-tory Drosophila populations have also presented valuesconsiderably below our estimate (see [27] for a briefreview). Our Ne/N ratios were also higher than the averagevalues of 0.11 reported for natural populations [28].These higher values might be a result of the lower fluctua-tions in the overall census size of our laboratory popula-tions through time, compared to other laboratory studiesor to what is expected to occur in wild populations. How-ever, given the abrupt transformation imposed on thedemographic structure on our populations as a result oftheir recent sampling from the wild, this cross-study com-parison has to be made with caution.
Page 7 of 11(page number not for citation purposes)

BMC Evolutionary Biology 2008, 8:66 http://www.biomedcentral.com/1471-2148/8/66
Testing for positive selection at the molecular levelIt has been extensively documented that both AR and TWpopulations have undergone adaptation to laboratoryconditions with respect to life-history traits, some ofwhich show clear directional trends of improvementthroughout laboratory culture [8]. For the microsatellitedata, we obtained significant deviations from neutralexpectations at locus dsub14 for both groups of AR and TWpopulations after 14 generations of laboratory adapta-tion. This was due to an increase in frequency of a low fre-quency allele in all 6 populations studied betweengenerations 3 and 14 for that particular locus, suggestingthat positive selection could have occurred in the regionof this microsatellite. However, a significant increase inheterozygosity through time was observed at this locusand not a decline, which is the common expectation of aselective sweep (e.g. [12]). This increase in heterozygositycould be a transient effect on a locus with a low numberof alleles and low heterozygosity, leading to higher heter-ozygosity resulting from a rise in the frequency of an ini-tially rare allele [see Additional file 1]). The lower initialvariability at this locus could in turn have been the resultof selective constraints affecting this region in wild popu-lations, although we cannot exclude low mutation rates asa possible explanation given the low number of repeats inthis locus [29].
A strong point in favour of the action of directional selec-tion near the dsub14 locus is that the allele showing anincreased frequency was the same in all TW populations.However, this pattern is not ineluctable, since samplingeffects in the formation of our replicate populations, par-ticularly involving low frequency alleles, could have led todifferent linkage disequilibria between alleles at this mic-rosatellite locus and positively selected alleles some dis-tance away from dsub14. This may explain the patternobserved at this locus in the AR populations, where twoalleles were involved, one common to the AR1 and AR2populations, and a different one for AR3.
Between generations 14 and 40, microsatellite locusdsub14 showed a significant deviation from neutrality inAR but not in TW populations. During this period, theTW2 population underwent a drop in the frequency of theputative hitchhiking allele, leading to a significant declinein heterozygosity over this period. Moreover, the devia-tion from neutrality of the AR3 population was not due tochanges of frequency in the expected direction, since therewas a drop in frequency of the putatively selected allele.These results complicate the interpretation of our find-ings, since hitchhiking within a region undergoing direc-tional selection is expected to lead to a consistent increasein the frequency of the hitchhiking allele and ultimately toits fixation, unless linkage is broken by recombination.
The continued monitoring of allele frequency change atthis locus over subsequent generations could help to clar-ify the evolutionary forces acting on it. Also, since thenumber of loci involved in our screen of molecular vari-ants is low, the analysis of other microsatellite loci adja-cent to this particular locus, searching for signs of lowpolymorphism in the genomic region, may rule out thepossibility of false positive results (see [30]). At the sametime, sequence analysis of flanking regions could be use-ful in the search for candidate genes underlying pheno-typic adaptation. In fact, its location in chromosome Ocould account for the hitchhiking effect involving dsub14,since this chromosome harbours considerable inversionpolymorphisms in Drosophila subobscura, which limitrecombination [31,32].
ConclusionWe observed a depletion of genetic variability and anincrease in genetic differentiation among our laboratorypopulations through time. This is the predicted outcomeof genetic drift effects in populations with smaller sizes,relative to those that are characteristic in the natural envi-ronment. Different genetic backgrounds appear to havehad limited impact on these drift effects, since laboratorypopulations founded from different wild sources did notdiffer in their rate of variability decline through time. Ourdata suggest that selection acting on life history traitsinteracts with genetic drift, particularly through thesmaller effective population sizes at early stages of adapta-tion, leading to a steeper initial drop in molecular geneticvariability. Finally, we also found evidence of positiveselection at one of the ten molecular markers analyzed,although this inference should only be considered provi-sional at this point.
MethodsFoundation and maintenance of the laboratory populationsThis study involves two synchronous laboratory founda-tions carried out in the autumn of 2001, one from Sintra,Portugal, called "TW", and another one from Arrábida,Portugal, called "AR" (the two localities being 50 Kmapart). The TW population was founded from 110 femalesand 44 males and the AR population began with 59females and 24 males. After two generations in the labo-ratory, each population was split into three replicate pop-ulations, TW1–3 and AR1–3. From the moment offoundation, all populations were maintained under thesame conditions: discrete generations of 28 days, repro-duction close to peak fecundity, a controlled temperatureof 18°C, and controlled densities (see [8,33]). Populationsizes were usually between 600 and 1200 individuals.
Page 8 of 11(page number not for citation purposes)

BMC Evolutionary Biology 2008, 8:66 http://www.biomedcentral.com/1471-2148/8/66
Microsatellite genotyping methodsAR and TW populations were genotyped for 10 microsat-ellite loci at generations 3, 14, and 40 after laboratoryfoundation. At each generation, 30 females were analyzedfor each of the six populations studied (TW1–3 and AR1–3).
The ten microsatellite loci analyzed in this study were:dsub01, dsub02, dsub05, dsub10, dsub14, dsub19, dsub20,dsub21, dsub23 and dsub27. These markers had been previ-ously identified and characterized in D. subobscura [29].Loci dsub05, dsub19 and dsub21 are X-linked and the oth-ers are autosomal.
DNA for the microsatellite analysis was extracted fromsingle flies using an extraction protocol described in [34].PCR reactions were performed for a total volume of 25 μlwith 2.5 pmol of each primer (10 μM), 3 μl dNTP's (1mM), 2 μl 10 × buffer, 1 U Taq polymerase and 1 μl ofDNA. All 10 loci were amplified using four different mul-tiplex PCR reactions (dsub02+dsub05; dsub10+dsub14;dsub20+dsub21+dsub27; dsub01+dsub19+dsub23). All reac-tions were performed on an ABI GeneAmp PCR System2700 machine using the following steps: 5 min at 95°C,then 30 cycles of 1 min at 95°C, 1 min at 54°C and 30 sat 72°C followed by 5 min at 72°C. After amplification,the products were visualized in an agarose gel and thenloaded on an ABI PRISM 310 sequencer (Applied Biosys-tems). Allele sizes were estimated by comparison to aninternal size standard (GeneScan-500 ROX) using thesoftware program Genotyper (Applied Biosystems).
Statistical methodsMicrosatellite analysisa) Measures of genetic diversity and differentiationGenetic variability was measured using both meannumber of alleles per locus and mean expected heterozy-gosity with GENEPOP, version 3.2 [35].
Differences in genetic variability between AR and TWgroups of populations in each generation were assessedusing a bifactorial mixed ANOVA defining group (withtwo categories: AR and TW) as a fixed factor and locus as arandom factor, with each genetic variability measure as adependent variable. To test for differences in genetic vari-ability in each group across generations, we applied a sim-ilar model, with generation as a fixed factor (with threecategories: generations 3, 14, and 40) and locus as a ran-dom factor. The changes in microsatellite variabilitythrough time were studied by defining two periods: thefirst period between generations 3 and 14 and the subse-quent period between generations 14 and 40. Rates of var-iability decline were calculated for each period for bothAR and TW populations, using both allele number andexpected heterozygosity (standardized by the square rootof the number of generations of each period). Differences
in the rates of variability decline between periods andgroups were tested with trifactorial mixed ANOVAs (sigma-restricted, type III SS model) with group, period (fixed) andlocus (random) as factors.
All parameters tested by ANOVA had a normal distribu-tion of residuals. Rates of heterozygosity decline were arc-sine transformed to meet ANOVA assumptions. AllANOVAs were performed using Statistica 5.0.
Genetic differentiation was accessed through a hierarchi-cal design with the following levels: groups (or genera-tions); populations within groups (or generations) andindividuals within populations. All measures were calcu-lated according to Wright's F statistics using the GDA soft-ware version 1.1 ([36]; see also [37]). These parametersincluded calculations at the following levels of hierarchy:at the group level (Fst groups and Fst generations described as θPin the GDA software) and at the population level (Fstdescribed as θS in the GDA software). The significance ofthe F statistics was evaluated using 95% confidence inter-vals (CIs) that were calculated by 1,000 bootstrap repli-cates of the loci.
Specifically, the following comparisons were performedin each generation analyzed (generations 3, 14 and 40):(a) Between the two groups of populations (Fst groups ; ARvs. TW); (b) Between populations from the two differentgroups (Fst; AR populations vs. TW populations); (c)Between populations within each group (Fst; i.e. differen-tiation between replicate populations from the samegroup, e.g. AR1–3). Comparisons between generations foreach group (Fst generations; e.g. TW at generation 3 vs. TW atgeneration 14; etc...) were also performed.
b) Estimating effective population sizesEffective population sizes (Ne) for each AR and TW popu-lation during laboratory adaptation were estimated fromtemporal microsatellite data using a pseudo-likelihoodapproach [26] and also through the loss of heterozygosityformula Ht/H0 = (1-1/2Ne)t (see [38]). Likelihood-basedmethods were used because they provide more reliable Neestimates relative to classical methods (e.g., [39,40]), par-ticularly for samples with many rare alleles [41,42]. Thetemporal method allows to estimate the effective popula-tion size through the analysis of the variation in the allelefrequencies of temporally spaced samples of a given pop-ulation [41]. This method calculates the standardized var-iance in the temporal changes of allele frequency F, whichis reciprocally proportional to the effective populationsize. In our study, the Ne estimates will thus represent theeffective size of our populations during laboratory evolu-tion and not that of the natural populations from whichthey have been derived.
Page 9 of 11(page number not for citation purposes)

BMC Evolutionary Biology 2008, 8:66 http://www.biomedcentral.com/1471-2148/8/66
Effective population sizes were estimated for the two peri-ods (between generations 3 -14 and between generations14 – 40), and also for the overall data (generations 3 to40) in both AR and TW populations.
The pseudo-likelihood Ne estimates were obtained usingthe MLNE program [26,42], given our temporally spacedsamples for each AR and TW population. All analyses wereperformed allowing a maximum Ne value of 1000.
c) Testing for positive selectionEffects of positive selection were tested for each microsat-ellite locus by applying the Ln RH test statistic [12]. Thistest is based on the comparison of the logarithm of theratio between expected heterozygosities obtained for eachlocus in two populations: Ln RH = Ln [((1/(1- Hpop1))2-1)/((1/(1- Hpop2))2 -1)]. The aim of this test is to search forloci with a pattern of variability which is significantly dif-ferent from that expected with neutrality.
To apply this test, ratios of expected heterozygosities werecalculated for each locus using data from generations 3and 14 (G14/G3 ratios) and also generations 14 and 40(G40/G14 ratios) for each AR and TW populations. Toaccount for the different effective population sizes of Xchromosomes, a correction was introduced for the X chro-mosomal loci heterozygosities (see [43]):
Hcorr = 1-1/[√1+k(1/(1-Hobs)2-1)],
the correction factor k used was 1.33, assuming a balancedsex ratio [44]. Since Ln RH values are expected to follow aZ distribution for neutrally evolving microsatellite loci[11], significant deviations of standardized Ln RH valuesfrom this distribution indicate a putative selective sweep[12]. This test was applied for each AR and TW replicatepopulation.
To detect potentially selected loci, we also performed aone-way ANOVA, defining locus as factor and the Ln RHvalues (of the three AR or TW populations) as the depend-ent variable. To search for differences between loci a posthoc Scheffé test was also performed. Normality in Ln RHdata was previously tested. All these analyses were done inStatistica 5.0.
Authors' contributionsPS, JS and MM performed the life history trait assays andmaintained laboratory populations. PS and JS performedthe microsatellite analyses. PS and MM carried out the sta-tistical analyses. PS, MP, MRR and MM designed theexperiment. PS and MM wrote the first draft of the manu-script. MP, MRR, and JS contributed to the final draft ofthe manuscript. All authors read and approved the finalmanuscript.
Additional material
AcknowledgementsWe thank Ana Duarte for technical help. This study was partially financed by "Fundação para a Ciência e a Tecnologia" (FCT) project n° POCTI/BSE/33673/2000, by FCT and POCI 2010 project n° POCI-PPCDT/BIA-BDE/55853/2004 (both with co-participation of FEDER), and project CGL2006-13423-C02/BOS from the Ministerio de Educación y Ciencia. J. Santos had a BTI grant and P. Simões had a PhD grant (SFRH/BD/10604/2002) from FCT.
References1. Futuyma DJ: Evolutionary Biology 3rd edition. Sunderland, MA: Sinauer
Associates; 1998. 2. Teotónio H, Rose MR: Variation in the reversibility of evolu-
tion. Nature 2000, 408:463-466.3. Hartl DL, Clark AG: Principles of Population Genetics Sunderland, MA:
Sinauer Associates; 1989. 4. Cohan FM: Can uniform selection retard random genetic
divergence between isolated conspecific populations? Evolu-tion 1984, 38:495-504.
5. Cohan FM, Hoffmann AA: Uniform selection as a diversifyingforce in evolution: Evidence from Drosophila. Am Nat 1989,134:613-637.
6. Falconer DS, Mackay TFC: Introduction to Quantitative Genetics Harlow:Addison Wesley Longman; 1996.
7. Rose MR, Nusbaum TJ, Chippindale AK: Laboratory evolution:the experimental Wonderland and the Cheshire Cat syn-drome. In Adaptation Edited by: Rose MR, Lauder GV. San Diego,CA: Academic Press; 1996:221-241.
8. Simões P, Rose MR, Duarte A, Gonçalves R, Matos M: Evolutionarydomestication in Drosophila subobscura. J Evol Biol 2007,20:758-766.
9. Morgan TJ, Garland T Jr, Irwin BL, Swallow JG, Carter PA: Themode of evolution of molecular markers in populations ofhouse mice under artificial selection for locomotor behavior.Heredity 2003, 94:236-242.
10. Rodriguez-Ramilo ST, Moran P, Caballero A: Relaxation of selec-tion with equalization of parental contributions in conserva-
Additional file 1Genetic Variability of AR and TW populations. Mean allele number and expected heterozygosity per locus for the AR and TW groups of popu-lations at generations 3, 14 and 40 of laboratory evolution.Click here for file[http://www.biomedcentral.com/content/supplementary/1471-2148-8-66-S1.xls]
Additional file 2Pairwise Fst comparisons between AR and TW populations. Genetic dif-ferentiation between AR and TW populations at each of the three genera-tions analyzed: generation 3, 14 and 40.Click here for file[http://www.biomedcentral.com/content/supplementary/1471-2148-8-66-S2.xls]
Additional file 3Pairwise Fst comparisons within and across laboratory generations. Genetic differentiation in each set of replicate populations (AR or TW) within and across generations analyzed.Click here for file[http://www.biomedcentral.com/content/supplementary/1471-2148-8-66-S3.xls]
Page 10 of 11(page number not for citation purposes)

BMC Evolutionary Biology 2008, 8:66 http://www.biomedcentral.com/1471-2148/8/66
Publish with BioMed Central and every scientist can read your work free of charge
"BioMed Central will be the most significant development for disseminating the results of biomedical research in our lifetime."
Sir Paul Nurse, Cancer Research UK
Your research papers will be:
available free of charge to the entire biomedical community
peer reviewed and published immediately upon acceptance
cited in PubMed and archived on PubMed Central
yours — you keep the copyright
Submit your manuscript here:http://www.biomedcentral.com/info/publishing_adv.asp
BioMedcentral
tion programs: An experimental test with Drosophilamelanogaster. Genetics 2006, 172:1043-1054.
11. Schlötterer C: A microsatellite-based multilocus screen forthe identification of local selective sweeps. Genetics 2002,160:753-763.
12. Kauer MO, Dieringer D, Schlötterer C: A microsatellite variabil-ity screen for positive selection associated with the "Out ofAfrica" habitat expansion of Drosophila melanogaster. Genetics2003, 165:1137-1148.
13. Harr B, Kauer M, Schlötterer C: Hitchhiking mapping: A popula-tion-based fine-mapping strategy for adaptive mutations inDrosophila melanogaster. Proc Natl Acad Sci USA 2002,99:12949-12954.
14. Goldstein DB, Schlötterer C, (Eds): Microsatellites: evolution and appli-cations Oxford: Oxford University Press; 1999.
15. Maynard Smith J, Haigh J: The hitch-hiking effect of a favourablegene. Genet Res 1974, 23:23-35.
16. Kaplan NL, Hudson RR, Langley CH: The "hitchhiking effect"revisited. Genetics 1989, 123:887-899.
17. Slatkin M: Hitchhiking and associative overdominance at amicrosatellite locus. Mol Biol Evol 1995, 12:473-480.
18. Pascual M, Aquadro CF, Soto V, Serra L: Microsatellite variationin colonizing and paleartic populations of Drosophila subob-scura. Mol Biol Evol 2001, 18:731-740.
19. Nei M, Maruyama M, Chakraborty R: The bottleneck effect andgenetic variability in populations. Evolution 1975, 29:1-10.
20. Allendorf FW: Genetic drift and the loss of alleles versus het-erozygosity. Zoo Biology 1986, 5:181-190.
21. Hedrick PW: Highly variable loci and their interpretation inevolution and conservation. Evolution 1999, 53:313-318.
22. Crandall KA, Bininda-Edmonds ORP, Mace GM, Wayne RK: Consid-ering evolutionary processes in conservation biology: return-ing to the original meaning of "evolutionary significantunits". Trends Ecol Evol 2000, 15:290-295.
23. Reed DH, Frankham R: How closely correlated are molecularand quantitative measures of genetic variation? A meta-analysis. Evolution 2001, 55:1095-1103.
24. Reed DH, Frankham R: Correlation between fitness and geneticdiversity. Conserv Biol 2003, 17:230-237.
25. Berthier P, Beaumont MA, Cornuet JM, Luikart G: Likelihood-based estimation of the effective population size using tem-poral changes in allele frequencies: a genealogical approach.Genetics 2002, 160:741-751.
26. Wang J: A pseudo-likelihood method for estimating effectivepopulation size from temporally spaced samples. Genet ResCamb 2001, 78:243-257.
27. Briscoe DA, Malpica JM, Robertson A, Smith GJ, Frankham R, BanksRG, Barker JSF: Rapid loss of genetic variation in large captivepopulations of Drosophila flies: implications for the geneticmanagement of captive populations. Conserv Biol 1992,6:416-425.
28. Frankham R: Effective population size/adult population sizeratios in wildlife: a review. Genet Res Camb 1995, 66:95-107.
29. Pascual M, Schug MD, Aquadro CF: High density of long dinucle-otide microsatellites in Drosophila subobscura. Mol Biol Evol2000, 17:1259-1267.
30. Wiehe T, Nolte V, Zivkovic D, Schlotterer C: Identification ofSelective Sweeps Using a Dynamically Adjusted Number ofLinked Microsatellites. Genetics 2007, 175:207-218.
31. Hoffmann AA, Sgrò CM, Weeks AR: Chromosomal inversion pol-ymorphisms and adaptation. Trends Ecol Evol 2004, 19:482-488.
32. Munté A, Rozas J, Aguadé M, Segarra C: Chromossomal inversionpolymorphism leads to extensive genetic structure: a multi-locus survey in Drosophila subobscura. Genetics 2005,179:1573-1581.
33. Matos M, Rose MR, Rocha Pité MT, Rego C, Avelar T: Adaptationto the laboratory environment in Drosophila subobscura. JEvol Biol 2000, 13:9-19.
34. Gloor GB, Preston CR, Johnson-Schlitz DM, Nassif NA, Phillis RW,Benz WK, Robertson HM, Engels WR: Type I repressors of P ele-ment mobility. Genetics 1993, 135:81-95.
35. Raymond M, Rousset F: GENEPOP (version 1.2): Populationgenetics software for exact tests and ecumenicism. J Heredity1995, 86:248-249.
36. Lewis PO, Zaykin D: Genetic Data Analysis: Computer Pro-gram for the Analysis of Allelic Data, Version 1.1; 2001. Free
program available at [http://www.eeb.uconn.edu/people/plewis/software.php].
37. Weir BS: Genetic Data Analysis II Sunderland, MA: Sinauer Associates;1996.
38. Crow JF, Kimura M: An Introduction to Population Genetics Theory NewYork: Harper & Row; 1970.
39. Nei M, Tajima F: Genetic drift and estimation of effective pop-ulation size. Genetics 1981, 98:625-640.
40. Waples RS: A generalized approach for estimating effectivepopulation size from temporal changes in allele frequency.Genetics 1989, 121:379-391.
41. Wang J: Estimation of effective population sizes from data ongenetic markers. Phil Trans R Soc B 2005, 360:1395-1409.
42. Wang J, Whitlock MC: Estimating effective population size andmigration rates from genetic samples over space and time.Genetics 2003, 163:429-446.
43. Kauer MO, Zangerl B, Dieringer D, Schlötterer C: Chromossomalpatterns of microsatellite variability contrast sharply in Afri-can and Non-African populations of Drosophila melanogaster.Genetics 2002, 160:247-256.
44. Pascual M, Mestres F, Serra L: Sex-ratio in natural and experi-mental populations of Drosophila subobscura from NorthAmerica. J Zool Syst Evol Research 2004, 42:33-37.
Page 11 of 11(page number not for citation purposes)