evolutionary dynamics among salamanders in the group, with an
TRANSCRIPT

Evolutionary dynamics among salamanders in the Plethodon glutinosus group, with
an emphasis on three species: P. jordani, P. metcalfi, and P. teyahalee (Caudata:
Plethodontidae)
by
Matthew Williams Howard Chatfield
A dissertation submitted in partial fulfillment
of the requirements for the degree of
Doctor of Philosophy
(Ecology and Evolutionary Biology)
In The University of Michigan
2009
Doctoral Committee:
Professor Priscilla K. Tucker, Co-Chair
Professor Ronald A. Nussbaum, Co-Chair
Professor, Jeffrey C. Long
Assistant Professor Thomas F. Duda, Jr

Copyright
Matthew Williams Howard Chatfield
2009

ii
ACKNOWLEDGEMENTS
This dissertation would not have been possible without the help and guidance of a
great many people and institutions. I would especially like to thank Priscilla Tucker for
her patience and willingness to engage at every stage of this long process. Her dedication,
not just to research, but education as well has made this project possible. I would also like
to thank my other committee members: Ron Nussbaum, Tom Duda, and Jeff Long.
A few people have provided early insight into the study system, most notable are
Richard Highton and Stephen Tilley. These acknowledgements would not be complete
without mentioning Nelson Hairston, Sr. Although I only the chance to meet him once
before his death last summer, his work on plethodontid biology and this study system in
particular laid the groundwork for this dissertation.
The work presented here is the product of a long and expensive endeavor, and
there are many institutions that have generously given their financial support. Many
departments and institutions within the University of Michigan have been especially
generous, including the Department of Ecology and Evolutionary Biology, the Museum
of Zoology, Rackham Graduate School, and the Department of Human Genetics. Other
essential granting institutions and societies include: the National Institutes of Health, the
Society for the Study of Amphibians and Reptiles, and the North Carolina Herpetological
Society.

iii
Lab work was undoubtedly the largest component of this project, and the learning
curve was steep. For their help, I would like to thank past and present members of the
Tucker Lab, especially Les Harris for showing me the ropes of lab work. Elizabeth
Jockusch gave me much needed nuclear DNA primers, and time and patience after that.
David Weisrock provided help with the mtDNA primers, and his own dissertation work
on the Plethodon jordani complex is often cited in this dissertation. I would also like to
thank Ken Luzynski and Armand Conti for spending last summer genotyping samples in
the lab.
Field work was not only an essential component of my dissertation work, but
provided a much needed respite from urban life. For making work in the Smokies and my
summers in the field an absolute pleasure, I would like to thank the crew at the
Appalachian Highlands Science Learning Center at Purchase Knob, especially Paul
Super, Susan Sachs, Jonathan Mays, and Gabrielle Riesner. Kevin Hamed’s help in the
field is almost as appreciated as his wit and humor.
I am indebted to Ben Fitzpatrick for his help with the statistical analysis in
Chapter III and Ken Kozak for creating the niche models used in Chapter III and IV.
Both of these excellent researchers are rightfully co-authors. I would also like to thank
Amanda Zellmer for her time and patience in helping with the niche modeling (and other
projects not related to this dissertation).
For making my graduate career proceed relatively smoothly, I need to thank the
staff of the Department of Ecology and Evolutionary Biology, especially LaDonna
Walker, Julia Eussen, and Jane Sullivan. I also need to thank the staff at the Museum of

iv
Zoology, especially Bev Dole, Norah Daugherty, and Robbin Murrell. Their aid in the
day-to-day logistics of carrying out this project was invaluable.
I am not able to express my gratitude deeply enough to the following people:
Lucía Luna for making office life not only tolerable, but fun; Matt Vance for his patience
throughout; and Clay Vance for reminding me that it is the love of the organism that
ultimately matters. I cannot end these acknowledgements without thanking my parents,
Virginia and Robert Chatfield, for instilling the idea that one should always put education
and the pursuit of one’s interests above all else.

v
TABLE OF CONTENTS
ACKNOWLEDGEMENTS ii
LIST OF FIGURES vii
LIST OF TABLES ix
LIST OF APPENDICES x
ABSTRACT xi
CHAPTER
I. Introduction 1
Literature Cited 8
II. Difficulties with species delimitation and DNA barcoding in 14
the Plethodon glutinosus group (Caudata: Plethodontidae)
Abstract 14
Introduction 15
Difficulties with species delimitation 18
The Plethodon glutinosus group 26
Taxonomic history of the Plethodon glutinosus group 28
Species delimitation in the Plethodon glutinosus group 30
Conclusion 41
Literature Cited 51
III. Differential introgression of mtDNA relative to nuclear DNA 61

vi
and morphology in a salamander hybrid zone involving three
species (Plethodontidae: Plethodon)
Abstract 61
Introduction 62
Methods 65
Results 74
Discussion 78
Literature Cited 124
IV. Past, present, and future range dynamics of the montane 131
salamanders Plethodon jordani and P. metcalfi
(Caudata: Plethodontidae)
Abstract 131
Introduction 131
Methods 136
Results 138
Discussion 140
Literature Cited 157
V. Conclusion 163
Literature Cited 166

vii
LIST OF FIGURES
FIGURE
2.1 Competing phylogenetic trees from Palmer et al. (2005) constructed 44
using allozymes and Wiens et al. (2006) constructed using
mitochondrial and nuclear DNA
3.1 Map of study area showing collection localities of parental 86
(Plethodon jordani, P. metcalfi, and P. teyahalee) and hybrid samples
3.2 Map of the mtDNA ND2 gene with adjacent tRNA genes and partial 88
map of nuclear ILF3 gene showing relative positions of the middle
exon and two introns
3.3 Map of Balsam Mountain showing transect, collection localities, 90
sample sizes, marker scores, and habitat suitability values
3.4 Map of Hyatt Ridge showing transect, collection localities, sample 92
sizes, and marker scores
3.5 Map of Palmer Creek showing transect, collection localities, sample 94
sizes, and marker scores
3.6 Map of Mt Sterling showing transect, collection localities, sample 96
sizes, and marker scores
3.7 Ecological niche modeling results showing present-day predicted 98
geographic distributions for P. jordani and P. metcalfi

viii
4.1 Topographical relief map of southern Appalachians highlighting 146
mountain ranges mentioned in text and ecological niche modeling
results showing present-day predicted geographic distribution for
Plethodon jordani and P. metcalfi
4.2 Ecological niche modeling result showing predicted geographic 150
distribution for Plethodon jordani and P. metcalfi during the last
glacial maximum 21,000 years ago
4.3 Ecological niche modeling result showing predicted geographic 153
distribution for Plethodon jordani and P. metcalfi in the year 2050

ix
LIST OF TABLES
TABLE
2.1 Species currently recognized in the Plethodon glutinosus complex 46
2.2 Taxonomic timeline of the Plethodon glutinosus group 47
2.3 Phases of species delimitation in the Plethodon glutinosus group 50
3.1 Climatic variables used in creation of ecological niche models 101
3.2 Summary of salamander samples from the hybrid zone 102
3.3 Contingency table showing individual sample data used to test for 103
differential patterns of introgression
3.4 Contingency table showing sample localities classified by their 104
most common haplotype
3.5 Results of general linear models (GLMs) 105
3.6 Home range sizes in for males and females of Plethodon 106
jordani, P. teyahalee, and P. metcalfi
4.1 Climatic variables used in creation of ecological niche models 156

x
LIST OF APPENDICES
APPENDIX
3.1 Collection localities, sites codes, elevation, and latitude and 107
longitude for animals captured in the hybrid zones
3.2 Collection localities, sites codes, elevation, and latitude and 109
longitude for parental taxa
3.3 Pure parental individuals and marker scores used in panel for 110
marker development
3.4 Samples and marker scores for all samples used in analyses 112

xi
ABSTRACT
Evolutionary dynamics among salamanders in the Plethodon glutinosus group, with
an emphasis on three species: P. jordani, P. metcalfi, and P. teyahalee (Caudata:
Plethodontidae)
by
Matthew Williams Howard Chatfield
Co-Chairs: Priscilla K. Tucker and Ronald A. Nussbaum
This dissertation includes three studies that focus on the evolution of salamanders
in the Plethodon glutinosus group (family Plethodontidae), that are found throughout
much of the eastern United States. The first study explores species delimitation in
taxonomically problematic groups and then, in that context, examines the long and
contentious taxonomic history of the P. glutinosus group. Four commonly encountered
problems are reviewed: (1) the presence of cryptic species complexes, (2) incomplete
lineage sorting, (3) introgressive hybridization, and (4) the application of different
species concepts. The history of species description in the P. glutinosus group is then
discussed in light of these problems. The controversial use of DNA barcoding is also
discussed, as is its potential utility in the group. The second study is a spatially fine-scale
analysis of a hybrid zone that occurs among three species within the P. glutinosus group
– P. jordani, P. metcalfi, and P. teyahalee – in the southern Appalachian Mountains.
Spatial patterns of variation along four transects are examined at four markers: single

xii
nucleotide polymorphisms located in the mtDNA ND2 gene and the nuclear DNA ILF3
gene and the morphological markers of red cheek pigmentation and white flecks.
Concordance among nuclear DNA and both morphological markers across the four
transects is observed. In three of the four transects, however, the pattern of mtDNA is
discordant from all other markers. This finding, in addition to previous studies
demonstrating mating asymmetry and differing ecological niches, suggests the hybrid
zone may be moving. The third study uses ecological niche modeling to explore range
dynamics of P. jordani and P. metcalfi at three time periods: (1) present-day, (2) during
the last glacial maximum 21,000 years ago, and (3) in the year 2050 under a climate
warming scenario. Generated models suggest the distributions of these species are
influenced by precipitation and are dynamic across the time periods studied. The
conservation status of P. jordani and P. metcalfi are discussed in light of anthropogenic
climate change.

1
CHAPTER I
Introduction
Arnold et al. (1993) expressed a growing sentiment when they stated that the
family Plethodontidae is an ideal system in which to study the evolutionary process of
speciation. For no group within Plethodontidae is this more true than for the Plethodon
glutinosus group. The range of this monophyletic group extends throughout eastern North
America, from the lowest to the highest elevations (Petranka 1998). Ecological studies
within the group have a long history, making it relatively well known and amenable as a
model system (Arnold et al. 1993). The taxonomic history of the group has a long history
as well, extending back to the early 1800s (Gilliam 1818, Green 1818), but it is only in
recent decades, with the advent of molecular tools, that species boundaries and
relationships have been refined (Highton 2000), and ecological and evolutionary
processes understood.
Research on the evolution of the group continues to document extensive
hybridization. Based on morphology and allozyme data, 28 lineages are currently
recognized as species (Highton 1989, Highton and Peabody 2000). Among these, 17 pairs
are sympatric and five are known to hybridize; and among 16 parapatric pairs, 11 are
known to form hybrid zones (Highton and Peabody 2000). Detailed studies of
hybridizing taxa, especially using genetic markers, have revealed a complex
biogeographic history and numerous instances of introgressive hybridization (Highton

2
1970, 1972, 1989, Hairston et al. 1992, Weisrock et al. 2005, Weisrock and Larson
2006). This is most readily seen in studies in the southern Appalachians, where
mountainous terrain, climate change, and niche conservatism (Kozak and Wiens 2006)
have led to numerous mountain-top isolates.
Three species within the P. glutinosus group – P. jordani, P. metcalfi, and P.
teyahalee – are especially well studied. These species were the focus of much of
Hairston’s (Hairston 1980a, 1980b, 1983, Hairston et al. 1987) ecological work on
interspecific competition. His findings suggest that competition likely plays a role in
species distributions. Hybridization among the species was known as far back as the
middle of the last century when morphological intermediates between P. jordani and P.
metcalfi (Hairston 1950) and P. jordani-P. metcalfi hybrids and P. teyahalee (Highton
1970) were first reported. Numerous studies since then have provided information on the
geographic extent and relative abundance of hybrids. For example, using allozymes,
Peabody (1978) examined differences among the species. His cursory analysis of
hybridization between P. jordani and P. teyahalee documented, for the first time, the
presence of hybrids using genetic markers. Manzo (1988) conducted a morphometric
analysis of P. jordani and P. teyahalee and concluded that the parental species were
different from one another and that hybrids exhibited intermediacy. Lastly, Reagan
(1992) studied sexual isolation between populations of P. jordani, P. metcalfi, and P.
teyahalee. Her study documented asymmetrical mating between many different
populations, including P. jordani and P. metcalfi. Furthermore, the study revealed
variation in the extent of reproductive isolation between P. jordani and P. teyahalee, with
some populations exhibiting greater isolation than others. These findings are interesting
3
in that they suggest different regions of hybridization may have different evolutionary
dynamics.
Species delimitation is at the heart of the fundamentally important question,
“What is a species?” The answer to this question has important implications for many
fields within biology, including systematics, ecology, behavior, and evolution (Mayr
1963, Highton 1995, Cracraft 2002, King et al. 2008). Nearly all these studies use species
as the fundamental unit of classification (Harrison 1998), making accurate species
boundaries essential to uncovering biological patterns. Lastly, the urgent need to
catalogue biodiversity in the face of impending extinctions (Balakrishnan 2005), as well
as identifying distinct evolutionary lineages for conservation purposes (Rojas 1992,
Cracraft 2002, Hey et al. 2003, Agapow et al. 2004, Mace 2004) makes species
delimitation even more important.
Chapter II of this dissertation begins with a review of many of the problems
encountered when delimiting species boundaries. Four of these are discussed at length:
(1) the use of different species concepts, (2) the presence of cryptic species complexes,
(3) incomplete lineage sorting, and (4) introgressive hybridization. Numerous examples
are presented of studies that have encountered these issues, and a brief summary of how
each problem is combated is also given. Included in this chapter is a discussion on the
utility of DNA barcoding. This is a controversial topic that has received considerable
attention in recent years (Rubinoff et al. 2006, Hajibabaei et al. 2007).
The second part of Chapter II discusses the role that each of the four species
delimitation problems have played in the P. glutinosus group. Using a timeline of
taxonomic history, methodological patterns of species delimitations are described

4
throughout the long taxonomic history of the group. The chapter concludes by
highlighting the following: (1) homoplasy and morphological stasis have resulted in
cryptic species complexes, (2) a rapid and recent radiation has resulted in incomplete
lineage sorting, and (3) introgressive hybridization resulting from incomplete
reproductive isolation is common. Furthermore, the application of many different species
concepts has caused considerable confusion in defining species boundaries as well.
Lastly, it is unlikely that DNA barcoding will prove to be a useful tool in identifying
species in this group.
Despite the fact that hybrid zones cause practical and philosophical complications
in traditional taxonomic classificaton (Harrison 1990), many researchers believe we are
in the midst of a paradigm shift as zoologists increasingly recognize the constructive role
of hybridization in evolution (Arnold 2006, Arnold and Meyer 2006, but see Coyne and
Orr 2004). There are two reasons for this: First, there is widespread recognition that
hybridization among animals is more common than once thought (10% of animal species
by one estimate, Mallet 2005), and second, evolutionary studies of hybridization are
documenting substantial introgression (e.g., Bull et al. 2006, Minder and Widmer 2008).
Introgression of adaptive alleles across a porous species boundary (Kim and Rieseberg
1999, Martinsen et al. 2001, Martin et al. 2006) represents a contrasting view to
traditional models of evolution where de novo mutations are the sole source of novel
adaptations in naïve populations.
As recognition of the importance of hybridization increases, so too do the
ramifications of hybridization research. The clearest example of this is work being done
on the evolutionary processes underlying speciation. In contrast to early proponents of

5
the biological species concept, which originally precluded the existence of any gene flow
among species (Mayr 1963), the possibility of gene flow between diverging and even
full-fledged species is now commonly accepted (e.g., Kronforst 2008). Theoretical
models of sympatric and parapatric speciation abound in the literature (e.g., Takimoto et
al. 2000, Gavrilets and Waxman 2002, Almeida and de Abreu 2003, Kawata et al. 2007)
and the number of plausible empirical examples is growing as well (e.g., Friesen et al.
2007, Herder et al. 2008). Besides evolutionary biology, hybridization research is
important in the field of systematics. Increasingly sophisticated methods of species
delimitation no longer require complete reproductive isolation, but rather strive to detect
signals of speciation despite incomplete lineage sorting and gene flow (e.g., Knowles and
Carstens 2007). Another field which is impacted by hybridization studies is conservation
biology. As currently described in the Endangered Species Act, determination of
protection status and the setting of conservation guidelines are dependent upon the
“purity” of the taxon in question (O’Brien and Mayr 2001). The identification of natural
and anthropogenically-mediated hybridization necessarily causes confusion (Allendorf et
al. 2001).
Chapter III is an analysis of a hybrid zone involving P. jordani, P. metcalfi, and
P. teyahalee. This study builds on earlier studies that have examined hybridization
between P. jordani and P. metcalfi (Peabody 1978, Hairston et al. 1992) and between P.
jordani and P. teyahalee (Manzo 1988, Reagan 1992). The analyses presented here
expand on earlier studies in three ways: (1) patterns of spatial variation are examined for
mtDNA, nuclear DNA, and morphological markers; (2) hybrid populations involving P.
jordani, P. metcalfi, and P. teyahalee are analyzed across four transects, two along high

6
elevation ridgelines predominately connecting the ranges of P. jordani and P. metcalfi,
and two elevational transects connecting hybrid populations of the former species with
that of P. teyahalee; and (3) sampling in this study was performed at a spatially fine
scale, allowing for increased resolution in the detection of introgression.
In the discussion, the hypothesis of hybrid zone movement is put forward as a
likely explanation for the pattern of differential introgression observed in this study.
Support for the hypothesis of hybrid zone movement is drawn from Reagan’s (1992)
work on mating asymmetry. Support also comes from the ecological niche modeling
presented in Chapters III and IV. Although speculative, the possibility is presented that
the unique morphological character of red cheek pigmentation of P. jordani may play a
role in the movement of the hybrid zone as well. This trait is putatively under positive
selection (Huheey 1960, Brodie and Howard 1973, Hensel and Brodie 1976), and hybrid
zone movement appears to be occurring from P. jordani into the ranges of P. metcalfi and
P. teyahalee.
In Chapter IV, ecological niche modeling is used to address range dynamics in P.
jordani and P. metcalfi. Models for three time periods are presented: (1) the last glacial
maximum, which occurred 21,000 years ago; (2) present-day; and (3) the year 2050,
using a standard scenario of climate change based on anthropogenic carbon emissions.
When considered together, these models reflect the extremes of range shifts and put the
hybrid zone analysis of Chapter III into a spatial and temporal context. Models generated
using present-day bioclimatic variables indicate that P. jordani and P. metcalfi currently
occupy nearly all of the regions that are predicted to contain suitable habitat. Models that
reconstruct distributions during the last glacial maximum show little change from the

7
present-day, although the resolution at which these models were created may be an issue.
Lastly, future projections indicate that the ranges of P. jordani and P. metcalfi will be
substantially smaller than present-day as the species migrate upslope to track shifts in
suitable habitat.
Chapter V consists of concluding remarks on the dissertation and suggests future
directions of research into the evolutionary dynamics of the P. glutinosus group. Avenues
of research that would be especially interesting are range shifts and the changing
dynamics of hybridization among P. jordani, P. metcalfi, and P. teyahalee in the face of
anthropogenic climate change. Recent work by Highton (2005) suggests that Plethodon
across the eastern U. S. may be experiencing severe declines. While the root cause of
these declines remains unknown, numerous factors have been implicated and likely act in
concert (Blaustein and Kiesecker 2002, Stuart et al. 2004, Halliday 2008, Pounds and
Coloma 2008). These include deforestation (Petranka et al. 1993, Ash 1997, Harpole and
Haas 1999, Duguay and Wood 2002), road construction (Semlitsch et al. 2007), and
infection by the pathogenic chytrid fungus Batrachochytrium dendrobatidis (Vazquez et
al. 2009). Addressing the role of anthropogenic climate change in the fate of these three
species will require expanding on both the hybrid zone analysis in Chapter III and the
niche modeling presented in Chapter IV to examine habitat preferences, changing
habitats, and range dynamics at a fine scale. The work presented in this dissertation is a
first step in the right direction.

8
Literature Cited
Agapow, P-M., O. L. P. Bininda-Emonds, K. A. Crandall, J. L. Gittleman, G. M. Mace, J.
C. Marshall, and A. Purvis. 2004. The impact of species concept on biodiversity
studies. The Quarterly Review of Biology 79(2):161-179.
Allendorf, F. W., R. F. Leary, P. Spruell, and J. K. Wenburg. 2001. The problems with
hybrids: setting conservation guidelines. Trends in Ecology and Evolution
16(11):613-622.
Almeida, C. R., and F. V. de Abreu. 2003. Dynamical instabilities lead to sympatric
speciation. Evolutionary Ecology Research 5:739-757.
Arnold, M. L. 2006. Evolution through Genetic Exchange. Oxford University Press, New
York.
Arnold, M. L. and A. Meyer. 2006. Natural hybridization in primates: one evolutionary
mechanism. Zoology 109:261-276.
Arnold, S. J. N. L. Reagan, and P. A. Verrell. 1993. Reproductive isolation and speciation
in plethodontid salamanders. Herpetologica 49(2):216-228.
Ash, A. N. 1997. Disappearance and return of plethodontid salamanders to clearcut plots
in the southern Blue Ridge Mountains. Conservation Biology 11(4):983-989.
Balakrishnan, R. 2005. Species concepts, species boundaries and species identification: a
view from the tropics. Systematic Biology 54(4):689-693.
Blaustein, A. R. and J. M. Kiesecker. 2002. Complexity in conservation: lessons from the
global decline of amphibian populations. Ecology Letters 5:597-608.
Brodie, E. D., Jr. and R. R. Howard. 1973. Experimental study of Batesian mimicry in the
salamanders Plethodon jordani and Desmognathus ochrophaeus. The American
Midland Naturalist 90(1):38-46.
Bull, V., M. Beltrán, C. D. Jiggins, W. O. McMillan, E. Bermingham, and J. Mallet.
2006. Polyphyly and gene flow between non-sibling Heliconius species. BMC
Biology 4:11.
Coyne, J. A. and H. A. Orr. 2004. Speciation. Sinauer Associates, Inc., Massachusetts.
Cracraft, J. 2002. The seven great questions of systematic biology: an essential
foundation for conservation and the sustainable use of biodiversity. Annals of the
Missouri Botanical Garden 89(2):127-144.
Duguay, J. P. and P. B. Wood. 2002. Salamander abundance in regenerating forest stands

9
on the Monongahela National Forest, West Virginia. Forest Science 48(2):331-
335.
Friesen, V. L., A. L. Smith, E. Gómez-Díaz, M. Bolton, R. W. Furness, J. González-
Solís, and L. R. Monteiro. 2007. Sympatric speciation by allochrony in a seabird.
Proceedings of the National Academy of Sciences 104(47):18589-18594.
Gavrilets, S. and D.Waxman. 2002. Sympatric speciation by sexual conflict. Proceedings
of the National Academy of Sciences 99(16):10533-10538.
Gilliam, J. 1818. Descriptions of two new species of Linnean Lacerta. Journal of the
Academy of Natural Sciences Philadelphia 1:460-462.
Green, J. 1818. Descriptions of several species of North American Amphibia,
accompanied with observations. Journal of the Academy of Natural Sciences,
Philadelphia 1:348-359.
Hairston, N. G. 1950. Intergradation in Appalachian salamanders of the genus Plethodon.
Copeia 4:262-273.
Hairston, N. G. 1980a. The experimental test of an analysis of field distributions:
competition in terrestrial salamanders. Ecology 61(4):817-826.
Hairston, N. G. 1980b. Evolution under interspecific competition: field experiments on
terrestrial salamanders. Evolution 34(3):409-420.
Hairston, N. G. 1983. Alpha selection in competing salamanders: experimental
verification of an a priori hypothesis. The American naturalist 122(1):105-113.
Hairston, N. G., Wiley, R. H., C. K. Smith, and K. A. Kneidel. 1992. The dynamics of
two hybrid zones in Appalachian salamanders of the genus Plethodon. Evolution
46(4):930-938.
Hairston Sr, N. G., K. C. Nishikawa, and S. L. Stenhouse. 1987. The evolution of
competing species of terrestrial salamanders: niche partitioning or interference?
Evolutionary Ecology 1:247-262.
Hajibabaei, M., G. A. C. Singer, P. D. N. Hebert, and D. A. Hickey. 2007. DNA
barcoding: how it complements taxonomy, molecular phylogenetics and
populations genetics. Trends in Genetics 23(4):167-172.
Halliday, T. R. 2008. Why amphibians are important. International Zoo Yearbook
42(1):7-14.
Harpole, D. N. and C. A. Haas. 1999. Effects of seven silvicultural treatments on
terrestrial salamanders. Forest Ecology and Management 114:349-356.

10
Harrison, R. G. 1990. Hybrid zones: windows on the evolutionary process. Oxford
Surveys in Evolutionary Biology 7:69-128.
Harrison, R. G. 1998. Linking evolutionary pattern and process: the relevance of species
concepts for the study of speciation. Pp 19-31 in Howard, D. J. and S. H.
Berlocher, eds. Endless Forms: Species and Speciation. Oxford University Press.
New York.
Hensel, Jr, J. L. and E. D. Brodie, Jr. 1976. An experimental study of aposematic
coloration in the salamanders Plethodon jordani. Copeia 1:59-65.
Herder, F., J. Pfaender, and U. K. Schliewen. 2008. Adaptive sympatric speciation of
polychromatic “roundfin” sailfin silverside fish in Lake Matano (Sulawesi).
Evolution 62(9):2178-2195.
Hey, J., R. S. Waples, M. L. Arnold, R. K. Butlin, and R. G. Harrison. 2003.
Understanding and confronting species uncertainty in biology and conservation.
Trends in Ecology and Evolution 18(11):597-603.
Highton, R. 1970. Evolutionary interactions between species of North American
salamanders of the genus Plethodon. Part I. Genetic and ecological relationships
of Plethodon jordani and P. glutinosus in the southern Appalachian Mountains.
Evolutionary Biology 4:211-241.
Highton, R. 1972. Distributional interactions among North American salamanders of the
genus Plethodon. Pp. 139-188 in Holt, P. C., ed. The distributional history of the
biota of the southern Appalachians. Research Division Monograph 4. Virginia
Polytechnic Institute and State University, Blacksburg, Virginia.
Highton, R. 1989. Biochemical evolution in the slimy salamanders of the Plethodon
glutinosus complex in the eastern United States. Part I. Geographic protein
variation. Illinois Biological Monographs 57:1-78.
Highton, R. 1995. Speciation in eastern North American salamanders of the genus
Plethodon. Annual Review of Ecology and Systematics 26:579-600.
Highton, R. 2000. Detecting cryptic species using allozyme data. Pp. 215-241 in Bruce,
R. C., R. Jaeger, and L. D. Houck, eds. The Biology of Plethodontid Salamanders.
Kluwer Academic/Plenum. New York.
Highton, R. 2005. Declines of eastern North American woodland salamanders
(Plethodon). Pp. 34-46 in Lannoo, M., ed. Amphibian Declines: The Conservation
Status of United States Species. University of California Press. California.
Highton, R. and R. B. Peabody. 2000. Geographic protein variation and speciation in

11
salamanders of the Plethodon jordani and Plethodon glutinosus complexes in the
southern Appalachian mountains with the description of four new species. Pp. 31-
93 in Bruce R. C., R. Jaeger and L. D. Houck, eds. The biology of plethodontid
salamanders. Kluwer Academic/Plenum. New York.
Huheey, J. E. 1960. Mimicry in the color pattern of certain Appalachian salamanders.
Journal of the Elisha Mitchell Scientific Society 76(2):246-251.
Kawata, M., A. Shoji, S. Kawamura, and O. Seehausen. 2007. A genetically explicit
model of speciation by sensory drive within a continuous population in aquatic
environments. BMC Evolutionary Biology 7:99.
Kim, S-C. and L. H. Riesebereg. 1999. Genetic architecture of species differences in
annual sunflowers: implications for adaptive trait introgression. Genetics
153:965-977.
King, R. A., A. L. Tibble, and W. O. C. Symondson. 2008. Opening a can of worms:
unprecedented sympatric cryptic diversity within British lumbricid earthworms.
Molecular Ecology 17(21):4684-4698.
Knowles, L. L. and B. C. Carstens. 2007. Delimiting species without monophyletic gene
trees. Systematic Biology 56(6):887-895.
Kozak, K. H. and J. J. Wiens. 2006. Does niche conservatism promote speciation? A case
study in North American salamanders. Evolution 60(12):2604-2621.
Kronforst, M. R. 2008. Gene flow persists millions of years after speciation in Heliconius
butterflies. BMC Evolutionary Biology 8:98.
Mace, G. M. 2004. The role of taxonomy in species conservation. Philosophical
Transactions of the Royal Society of London B 359:711-719.
Mallet, J. 2005. Hybridization as an invasion of the genome. Trends in Ecology and
Evolution 20(5):229-237.
Manzo, P. A. 1988. A morphometric analysis of Plethodon jordani Blatchley and its
hybrids. MS Dissertation, University of Maryland.
Martin, N. H., A. C. Bouck, and M. L. Arnold. 2006. Detecting adaptive trait
introgression between Iris fulva and I. brevicaulis in highly selective field
conditions. Genetics 172:2481-2489.
Martinsen, G. D., T. G. Whitham, R. J. Turek, and P. Keim. 2001. Hybrid populations
selectively filter gene introgression between species. Evolution 55(7):1325-1335.
Mayr, E. 1963. Animal Species and Evolution. Belknap Press, Massachusetts.

12
Minder, A. M. and A. Widmer. 2008. A population genomic analysis of species
boundaries: neutral processes, adaptive divergence and introgression between two
hybridizing plant species. Molecular Ecology 17:1552-1563.
O’Brien, S. J. and E. Mayr. 1991. Bureaucratic mischief: recognizing endangered species
and subspecies. Science 251:1187-1188.
Peabody, R. B. 1978. Electrophoretic analysis of geographic variation and hybridization
of two Appalachian salamanders, Plethodon jordani and Plethodon glutinosus.
PhD Dissertation, University of Maryland.
Petranka, J. W. 1998. Salamanders of the United States and Canada. Smithsonian
Institution Press, Washington.
Petranka, J. W., M. E. Eldridge, and K. E. Haley. 1993. Effects of timber harvesting on
southern Appalachian salamanders. Conservation Biology 7(2):363-370.
Pounds, J. A. and L. A. Coloma. 2008. Beware the lone killer. Nature Reports Climate
Change 2:57-59.
Reagan, N. L. 1992. Evolution of sexual isolation in salamanders in the genus Plethodon.
PhD Dissertation, The University of Chicago.
Rojas, M. 1992. The species problem and conservation: What are we protecting?
Conservation Biology 6(2):170-178.
Rubinoff, D., S. Cameron, and K. Will. 2006. A genomic perspective on the
shortcomings of mitochondrial DNA for “barcoding” identification. Journal of
Heredity 97(6):581-594.
Semlitsch, R. D., T. J. Ryan, K. Hamed, M. Chatfield, B. Drehman, N. Pekarek, M.
Spath, and A. Watland. 2007. Salamander abundance along road edges and within
abandoned logging roads in Appalachian forests. Conservation Biology
21(1):159-167.
Stuart, S. N., J. S. Chanson, N. A. Cox, B. E. Young, A. S. L. Rodriguez, D. L. Fischman,
R. W. Waller. 2004. Status and trends of amphibian declines and extinctions
worldwide. Science 306:1783-1786.
Takimoto, G., M. Higashi, ans M. Yamamura. 2000. A deterministic genetic model for
sympatric speciation by sexual selection. Evolution 54(6):1870-1881.
Vazquez, V. M., B. B. Rothermel, and A. P. Pessier. 2009. Experimental infection of
North American plethodontid salamanders with the fungus Batrachochytrium
dendrobatidis. Diseases of Aquatic Organisms 84:1-7.

13
Weisrock, D. W. and A. Larson. 2006. Testing hypotheses of speciation in the Plethodon
jordani species complex with allozymes and mitochondrial DNA sequences.
Biological Journal of the Linnean Society 89:25-51.
Weisrock, D. W., K. H. Kozak, and A. Larson. 2005. Phylogenetic analysis of mtDNA
gene flow and introgression in the salamander, Plethodon shermani. Molecular
Ecology 14(5):1457-1472.
14
CHAPTER II
Difficulties with species delimitation and DNA barcoding in the Plethodon glutinosus
group (Caudata: Plethodontidae)
Abstract
Species delimitation is a fundamental component of systematics, the accuracy of
which is essential to many fields including behavior, ecology, evolutionary biology and
conservation. Given this importance, numerous studies have elucidated the difficulties in
accurate species delimitation. This review is a synthesis of four commonly encountered
problems: (1) the presence of cryptic species complexes, (2) incomplete lineage sorting,
(3) introgressive hybridization, and (4) the application of different species concepts.
Some, often all, of these problems are encountered through the use of DNA barcoding.
Barcoding relies on a short segment of mtDNA to describe or identify species, often (but
not always) in conjunction with other data (e.g., additional mtDNA, nuclear DNA,
allozymes, morphology, geography). Criticism of barcoding is pervasive in the literature;
however, proponents point to the utility of a single, universal, easily-applied molecular
tool for species description and identification. Arguably, few species groups have a
longer and more contentious taxonomic history than the Plethodon glutinosus group.
Beginning with the initial description of P. glutinosus sensu stricto in 1818, 35 lineages
(species or subspecies) have been recognized, all occurring in the eastern United States.
Currently, 28 species are commonly accepted. The history of species description

15
in the P. glutinosus group has been contentious, involving numerous name changes and
disagreements. Much of this controversy results from: (1) homoplasy and morphological
stasis, resulting in cryptic species complexes; (2) rapid, recent radiation resulting in
incomplete lineage sorting; and (3) introgressive hybridization from a lack of complete
reproductive isolation. Furthermore, the application of many different species concepts
has caused considerable confusion in defining species boundaries as well. Recently, great
strides have been made to combat these problems, but it is unlikely that DNA barcoding
will prove to be a useful tool in identifying species in this group.
Introduction
Species delimitation, how species boundaries are described and new species
identified, is a major topic within the field of systematics (Cracraft 2002, Wiens 2007).
This is partly due to the nature of the field of systematics, which is charged with
addressing the question “What is a species?” (Cracraft 2002). Additionally, accurately
delimiting species into real and natural groups that are biologically meaningful is
essential for basic ethological, ecological, and evolutionary studies (Mayr 1963, Highton
1995, Cracraft 2002, King et al. 2008). Nearly all these studies use species as the
fundamental unit of classification (Harrison 1998), making accurate species boundaries
essential to uncovering biological patterns. Lastly, the urgent need to catalogue
biodiversity in the face of the extinction crisis (Balakrishnan 2005), as well as identifying
distinct evolutionary lineages for conservation purposes (Rojas 1992, Cracraft 2002, Hey
et al. 2003, Agapow et al. 2004, Mace 2004) makes species delimitation even more
important.

16
Despite its importance, accurate species delimitation is fraught with difficulties.
Methodologies that (1) yield consistent results, (2) are universally applicable (i.e., may be
applied irrespective of the taxon under consideration), and (3) are easily applied across
different types of data sets (e.g., single nucleotide polymorphisms, DNA sequences,
allozymes, morphology) remain elusive and have not been thoroughly tested
(Balakrishnan 2005). Other difficulties hindering accurate species delimitation deal not
with the development of appropriate methods, but rather with our understanding of
lineage independence or the populations themselves. These include the presence of
cryptic species complexes, incomplete lineage sorting, and introgressive hybridization.
These difficulties are in addition to the basic supposition that the lineages under
consideration are well sampled (Funk and Omland 2003). Lastly, there is the theoretical
issue of what constitutes a species.
One controversial topic that has received considerable attention in recent years is
DNA barcoding. Using this technique, researchers attempt to streamline species
identification and description through the sequencing of standard mtDNA sequences,
often in conjunction with more traditional (i.e., integrative) systematic approaches
(Rubinoff et al. 2006, Hajibabaei et al. 2007). Proponents stress the easy application of
barcoding by non-molecular biologists, the speed at which species can be identified, and
the standardized results making cross-species comparisons relatively easy (Hebert et al.
2004). Criticism of barcoding has been extensive and ranges from claims of
insurmountable technical difficulties to oversimplification of systematic inquiry that may
ultimately undermine the integrity of systematic research (Rubinoff et al. 2006). Both
sides of the argument seem to agree, however, that some degree of error in species

17
classification is inevitable (<5%, see Hajibabaei et al. 2007; ~20%, Meyer and Paulay
2005). Taxa that are most prone to misclassification are likely to be the same as those for
which traditional systematics have been difficult, i.e., in the presence of incomplete
lineage sorting and introgressive hybridization.
Certain taxa have proved especially contentious in attempting to delimit species
boundaries. The Plethodon glutinosus group (family Plethodontidae) in the southeastern
United States is one such example. Species description in this group began in the early
1800s and extends to the 21st century. Current recognition of 28 species in the group
(Highton and MacGregor 1983, Highton 1983, 1989, Highton and Peabody 2000) is
gaining acceptance, although the methods by which much of this diversity was described
has been debated (see Frost and Hillis 1990 and Highton 1990). The long history of
species delimitation in this group highlights many difficulties in species delimitation in
other groups of organisms, and understanding the root of these difficulties will help us
understand the nature of species boundaries.
Methods for delimiting species have recently been reviewed (Sites and Marshall
2003, 2004) and will not be discussed here. Rather, the objective of this paper is to
review some of the problems associated with delimiting species among lineages that have
recently speciated or are in the process of speciating. These problems are clearly and
sometimes integrally related to one another. As a result, many researchers will find
themselves facing many or even all of these difficulties. The P. glutinosus group is an
especially good example of the difficulties that can arise in species delimitation.
Systematists delimiting species in this group have had to contend with the presence of
cryptic species, incomplete lineage sorting, introgressive hybridization, and the

18
application of different species concepts. Also presented is a comprehensive taxonomic
review, which further highlights the ambiguity of species boundaries and relationships in
this group. Lastly, the deficiencies of DNA barcoding as a method of species delimitation
for this group are apparent and will be discussed.
Difficulties with species delimitation
Different species concepts
There are over 20 different species concepts discussed in the literature (see
Harrison 1998, de Queiroz 1998, and Coyne and Orr 2004 for partial reviews). These
conceptual groups fall into two categories, those that are based on reproductive isolation
and those based on phylogenetic clustering. Within these two broad conceptual
categories, the criteria used to delimit species boundaries may vary considerably.
Different conclusions on species delimitation may be drawn depending on which species
concept a researcher chooses (e.g., Young 1998, Agapow et al. 2004, Sanders et al. 2006,
Alstrom et al. 2008). For example, when comparing two of the most common concepts,
the Biological Species Concept (BSC; sensu Mayr 1963) and the Phylogenetic Species
Concept (PSC; sensu Cracraft 1989), Dettman et al. (2003) found that when using the
PSC they recognized five independent lineages in a group of 73 samples from the fungus
Neurospora, while using the BSC they recognized only four lineages. The discrepancy
suggests two possible causes: (1) phylogenetic divergence precedes reproductive
isolation (Dettman et al. 2003) or (2) the PSC offers greater resolution and increased
ability to distinguish independent lineages (Dettman et al. 2003, Agapow et al. 2004).
Similarly, Gleason et al. (1998) obtained conflicting phylogenies when comparing the

19
BSC to the PSC in a study of the Drosophila willistoni group. In contrast to Dettman et
al. (2003), however, the BSC recognized more lineages than the PSC (Gleason et al.
1998). Studies in which more species are diagnosed using reproductive isolation criteria
(such as the BSC) than phylogenetic criteria (such as the PSC) are uncommon. In a
review of 83 published studies (incorporating plants, fungi, invertebrates, vertebrates, and
some microorganisms), Agapow et al. (2004) found that variants on the PSC recognized
48.7% more species than the BSC and other non-phylogenetic methods.
Despite the studies comparing phylogenetic and reproductive isolation criteria,
which are relatively few in number, researchers rarely state explicitly the species concept
to which they adhere. This oversight makes it difficult to determine the full extent of the
disagreements among species concepts. Furthermore, studies comparing different
methods have done so with two, or occasionally three, different species concepts, a small
number relative to the number of concepts in existence.
Although no species concept excels under all circumstances, the BSC and the
PSC have both been severely criticized. From a philosophical perspective, the BSC is
unsatisfactory to many because, by relying on reproductive isolation, it does not always
yield monophyletic groups, and therefore does not reflect evolutionary history (Harrison
1998). From a practical standpoint, determining whether or not two populations can and
do interbreed in the wild is just not feasible. This is especially problematic when the
populations under consideration are allopatric. Furthermore, it is increasingly apparent
that hybridization in nature is more common than once thought (25% of plant species and
10% of animal species, Mallet 2005). The reproductive barrier between hybridizing
populations can range from weak to nearly complete, making species delimitation among

20
hybridizing taxa seem arbitrary. Lastly, the BSC is inoperable for extinct and asexual
taxa (see Agapow et al. 2004). The PSC, likewise, has been criticized. Coyne (1994)
offers a philosophical drawback of the PSC because it neither yields insight nor promotes
research into speciation and the maintenance of species boundaries. There are also
notable operational problems with the PSC. For instance, because of incomplete lineage
sorting and introgressive hybridization (see below), gene trees do not always equate to
species trees, making species diagnosis imperfect (see Coyne and Orr 2004).
Attempts have been made to reconcile the differences among competing species
concepts and the problems that result when researchers apply different criteria to species
delimitation. de Quieroz (1998) proposed the General Lineage Concept (GLC), which
states that “all contemporary species definitions describe variations of the general
concept of species as evolutionary lineages”. This concept, therefore, seeks to define the
underlying fundamental similarity among all other species concepts, namely, the
identification of independent population level evolutionary lineages. de Quieroz (1998)
emphasizes that speciation is a process and, as such, contains a “gray zone” of multiple
“events” that occur throughout this process. All other species concepts, the author argues,
simply place a species boundary at one of these events, creating a threshold. From the
conceptual point of view of the GLC, competing species concepts are, in fact,
complementary.
Cryptic species
Recognition of species boundaries may be difficult in taxa where morphological
stasis or homoplasy (Wake 1991, Mueller et al. 2004) result in an initial

21
underrepresentation of the true extent of species diversity. There is an increasing number
of studies where the full extent of diversity is revealed only after the application of
molecular methods. For example, using mtDNA and AFLP data, King et al. (2008)
discovered abundant cryptic diversity in British lumbricid earthworms. In one purported
species, Allolobophora chlorotica, the authors identified 55 mtDNA haplotypes
representing five highly divergent lineages that likely represented multiple cryptic
species. In another example, the plethodontid salamander Desmognathus ochrophaeus
was thought to be monotypic until allozyme studies revealed substantial cryptic diversity.
Tilley et al. (1978), in a preliminary analysis using 11 allozyme loci, found significant
genetic differentiation among para- and allopatric populations of what was then
considered to be a single species, D. ochrophaeus. Using an expanded dataset of 22
allozyme loci and additional collecting localities, Tilley and Mahoney (1996) and
Anderson and Tilley (2003) identified five lineages. Applying the Evolutionary Species
Concept (a variant of the PSC that aims to identify independent evolutionary lineages),
the authors elevated all five lineages to species status. Kozak et al. (2005), using mtDNA,
included multiple species from the D. ochrophaeus complex in a genus-wide
phylogenetic analysis. Results from this study suggest that, not only is the D.
ochrophaeus complex non-monophyletic, but some species within the complex are also
non-monophyletic.
Problems associated with delimiting species in cryptic species complexes are
already being tackled. This is done principally through the increased use of molecular
phylogenetics (see Wake 2006), and is one area where DNA barcoding has proved
especially useful (e.g., Hebert et al. 2004). As originally proposed, and often emphasized,

22
barcoding performs best when used in addition to other systematic approaches, such as
the use of multiple markers, nuclear markers, morphology, etc. (Hebert et al. 2004,
Rubinoff et al. 2006). Barcoding in this broader integrative approach becomes just one
tool of many, and is often not the primary mode of species delimitation. One proposed
use of barcoding is to perform preliminary scans of known cryptic species complexes in
order to best allocate research effort (Rubinoff et al. 2006).
The use of a genetic cutoff is an inherent component of DNA barcoding (Rubinoff
et al. 2006); however, the use of a genetic threshold to delimit species boundaries has
been around much longer. Using allozymes, Baverstock et al. (1977) found that rodent
populations that were fixed at 15% of their loci (Nei’s genetic distance, D, of 0.15) were
likely to have achieved species status. Similarly, Thorpe (1982) estimated that the
threshold necessary for allopatric populations to be considered separate species is a
genetic identity of 0.85, which equates to a Nei’s D of 0.16. Thorpe (1982) continues by
stating that using genetic distance is warranted when the populations in question are
allopatric. The controversy surrounding the use of genetic cutoffs reached a pinnacle
when Highton (1989) used a cutoff of a Nei’s D of 0.15 to delimit species in the P.
glutinosus group (see below, as well as Frost and Hillis 1990 and Highton 1990).
Incomplete lineage sorting
Lineage sorting is the gradual loss of ancestral polymorphisms, which results in
monophyletic groups (Funk and Omland 2003). Difficulties in species delimitation arise
when researchers attempt to infer a species tree based on one or more gene trees that were
constructed using incompletely sorted genes. Such situations are likely to occur when

23
lineages have only recently diverged (Shaffer and Thomson 2007). Differentiating
incomplete lineage sorting from introgressive hybridization, which may create a similar
pattern of shared polymorphisms, can be difficult. Oftentimes, information from many
independent markers (Weisrock et al. 2006), the geographic extent of shared
polymorphisms (Moran and Kornfield 1993), the frequency of hybridization (Moran and
Kornfield 1993, Pinho et al. 2008), and the age of shared alleles (Pinho et al. 2008) is
required to distinguish between these two phenomena.
One of the most well known examples of incompletely sorted lineages comes
from cichlid fishes of Lake Malawi. Based on known dates of lake level fluctuations,
many of the 300 species of Lake Malawi cichlids are only about 25,000 years old, yet
many species have diverged substantially both ecologically and behaviorally (Albertson
2008). A mtDNA phylogeny constructed for this group, however, fails to reflect what is
believed to be the true species relationships, with many species being polymorphic for
divergent haplotypes (Moran and Kornfield 1993). Incomplete lineage sorting, as
opposed to introgressive hybridization, is the most likely explanation for the observed
pattern because: (1) hybrids have never been recorded for this well studied group, (2)
interspecific courtship has never been observed, and (3) shared polymorphisms are
widespread across species ranges and not restricted to areas of overlap or parapatry
(Moran and Kornfield 1993).
As another example, Podarcis lizards of the Iberian Peninsula and North Africa
constitute a cryptic species complex, with mtDNA sequence divergences (8-12%) greater
than those used to define other squamate species (2-5.4%) (Pinho et al. 2007). Although
there are currently four described species, Pinho et al. (2007) found evidence for 11

24
diagnosable lineages. In a recent study of Podarcis, Pinho et al. (2008) compared two
nuclear gene phylogenies to previously published mtDNA and allozyme phylogenies.
Despite general agreement between the mtDNA and allozyme phylogenies, the nuclear
DNA phylogenies are incongruent with mtDNA and allozymes. Again, explaining this
incongruence requires distinguishing between the competing hypotheses of incomplete
lineage sorting and hybridization. The authors give three lines of evidence in favor of
incomplete lineage sorting. First, we would not expect the allozyme data to show
differentiation among lineages if gene flow were causing incongruent nuclear DNA
phylogenies. This was not the case, as mtDNA and allozymes did differentiate (and were
in agreement) among lineages. Second, if hybridization was responsible for the observed
incongruence, then we would expect both ancestral and derived alleles to be about
equally widespread across species. This is not what is found, however, as more ancestral
than derived alleles are shared among lineages, suggesting incomplete lineage sorting is
responsible for the observed polyphyly. Third, results from coalescent modeling suggest
historical gene flow is nearly absent, making hybridization unlikely.
Great strides have recently been made in resolving the problems of incomplete
lineage sorting when determining species boundaries. For example, Knowles and
Carstens (2007) presented a method for delimiting species that have not yet achieved
reciprocal monophyly. Most species delimitation criteria use gene trees as a proxy for
species trees and utilize a somewhat arbitrary threshold to determine species boundaries.
Knowles and Carstens (2007) used a model-based approach to detect signals of species
divergence irrespective of exclusivity criteria, which may arrive at incongruent species
trees. Such an approach is important in taxa that are in the early stages of speciation as

25
the time it takes to achieve reciprocal monophyly can be long (9-12 N generation for 95%
of sampled nuclear loci to reach reciprocal monophyly, where N is equal to the historical
effective population size; Hudson and Coyne 2002).
Hybridization
The role of hybridization in adaptive evolution has received considerable attention
in recent years. Rates of naturally occurring hybridization are estimated to be at least
25% for plants and about 10% for animals (Mallet 2005). With such prevalence in nature,
the effects of hybridization on evolutionary processes, such as speciation, are potentially
great. While hybridization was traditionally thought to result in unfit hybrids that are
evolutionary dead ends, researchers are increasingly viewing hybridization as a positive
force, introducing new adaptations to naïve populations (see Mallet 2005 for a review).
Like incomplete lineage sorting, incomplete reproductive isolation leading to
introgressive hybridization may also result in ambiguous species boundaries. There is
mounting evidence that the process of speciation is usually not instantaneous, and may
involve prolonged periods of hybridization. For example, Osada and Wu (2005)
compared 345 coding and 143 intergenic DNA sequences between humans and
chimpanzees, and concluded that divergence times among coding sequences are longer
than those for intergenic sequences. This result is expected if coding sequences are more
likely to contain genes that contribute to reproductive incompatibility. No such
inhibitions are predicted for intergenic (i.e., neutral or nearly neutral) sequences. In a
review of bird species, Price and Bouvier (2002) found that after diverging for 7-17

26
million years many interspecific crosses are still able to produce fertile offspring, and
after 11-55 million years some viable hybrids are still produced.
In a study of Mexican salamander species in the genus Ambystoma, Weisrock et
al. (2006) found discordance between nuclear and mtDNA gene trees. While incomplete
lineage sorting may account for some of the observed non-monophyly, the authors
indicate that hybridization is likely important in one group of A. ordinarium. The authors’
thorough examination of multiple nuclear and mtDNA genes makes possible the
conclusion that hybridization is causing the pattern of discordance between nuclear and
mtDNA.
The Plethodon glutinosus group
The Plethodon glutinosus group belongs to the family Plethodontidae, the largest,
most widespread and ecologically diverse of all salamander families. The P. glutinosus
group, one of four groups in the genus, is monophyletic (Wiens et al. 2006). Membership
in the group has ranged from one (Gilliam 1818, Green 1818) to 35 species or subspecies
(Adler and Dennis 1962, Highton 1995, Highton and Peabody 2000, Wiens et al. 2006),
with increases through time corresponding to increased sampling and advances in marker
development and technology. Current (and widely accepted) estimates place the number
of species in the group at 28 (see Highton 1989, 1995, Highton and Peabody 2000 and
Wiens et al. 2006), with subdivisions consisting of the P. glutinosus complex (16
species), the P. jordani complex (seven species), the P. ouachitae complex (three
species), and three other species (P. kentucki, P. petraeus, and P. yonahlossee) (Table

27
2.1). Subspecies are not currently recognized by most researchers (Highton and Peabody
2000).
Highton (1995), using a molecular clock applied to allozyme data, estimated that
the P. glutinosus group underwent a rapid radiation about 5 million years ago (mya) in
eastern North America. Using two nuclear and two mtDNA markers, Wiens et al. (2006)
estimated the age of the radiation to be 8-14 my, and Kozak et al. (2006), using only
mtDNA, estimated the radiation to have occurred 8-11 mya. Despite the age of the
radiation, however, the P. glutinosus group exhibits the same extensive morphological
stasis seen in many other groups of plethodontids (e.g., Batrachoceps and Ensatina;
Wake et al. 1983, Wake 2006; see also Mueller et al. 2004).
Although the group is widely distributed across the eastern United States
(Petranka 1998), the southern Appalachian Mountains are especially species rich and
show greater levels of genetic diversity than surrounding areas (Marshall and Camp
2006). This is one line of evidence that has led to the suggestion that the family
Plethodontidae originated in the southern Appalachians (Wilder and Dunn 1920, Beachy
and Bruce 1992, but see Reuben and Boucot 1989). Southern Appalachian ecosystems,
while not encompassed within the range of Pleistocene glaciers, were nonetheless directly
impacted by glacial and interglacial events (see Watts 1980, Delcourt and Delcourt 1998,
Crespi et al. 2003).
Most of the species’ ranges in the P. glutinosus group are para- or allopatric, often
with species boundaries coinciding with geographic boundaries such as rivers, or
replacing one another elevationally. Of 17 sympatrically distributed pairs of species in
the group, five are known to hybridize; of 16 parapatrically distributed pairs, 11 are

28
known to hybridize and another four pairs are data deficient (Highton and Peabody
2000). This rampant hybridization may be viewed as multiple (mostly) independent
snapshots into the speciation process and, as a result, has been called an ideal system in
which to study the process of speciation (Arnold et al.1993).
Taxonomic history of the Plethodon glutinosus group
The taxonomic histories of many groups, especially those containing cryptic
species complexes, can be partitioned into three phases. Before the widespread
application of molecular methods, species were generally delimited using morphological
characters. In the 1970s, it was discovered that lineages could be differentiated using
allozymes (protein variants). Although still in use today, allozyme studies have been all
but supplanted through the use of DNA sequence data. A detailed taxonomic history of
the Plethodon glutinosus group is presented in Table 2.2. This history parallels the
general pattern of species delimitation seen in other groups, and can likewise be
partitioned into three discrete phases (Table 2.3). Phase 1, which began with the
description of P. glutinosus in 1818, lasted until 1962. This phase is characterized by the
use of morphology in the description of new species. During Phase 2, which lasted from
1978 to 2000, species were described using allozymes. The majority of new species
descriptions, as well as the placement of species into monophyletic groups, took place
during this phase. The contributions by one researcher, Richard Highton, dominated the
allozyme phase, with nearly all contributions having been made by him and his
collaborators (Highton 1962, 1989, 1995, 2000, Duncan and Highton1979, Highton and
MacGregor 1983). Phase 3 began in 2005 with a publication by Weisrock et al. (2005)

29
utilizing mtDNA sequences to address evolutionary questions on gene flow and
introgression among previously described species in the P. glutinosus group. Phase 3
continues to the present day.
The P. glutinosus group, like other plethodontid salamander groups, is known to
contain cryptic species and is characterized by morphological stasis (Highton and
Peabody 2000). As a result, taxonomy before the molecular age was unstable. During the
morphological phase (1818-1962), 29 studies which dealt with the subject of taxonomy
and/or systematics in the group were published. In the studies, 20 lineages were described
(or placed under a different name, for example when a subspecies was later elevated to
species status) that, at least by their authors, warranted specific or subspecific status.
Fully 15 of these 20 described lineages were departures from a previous author’s
assigned name or systematic status (Table 2.3). In the allozyme phase (1978-2000),
which lasted 22 years (versus the 144 years of the morphological phase), nine studies
were published examining taxonomy and/or systematics in the group. In these studies, 20
lineages were described, all of which resulted from splitting apart cryptic species
complexes into multiple species. Interestingly, there were only two disagreements in the
literature amidst this taxonomic reorganization: the recognition that P. longicrus is not
distinct from P. yonahlossee and the resurrection of P. kentucki from P. g. glutinosus
(Table 3). The comparatively short DNA sequence phase, with only five published
studies to date, is interesting in two respects. First, no new lineages have been proposed.
This is likely due to the extensive sampling by Highton and colleagues (Highton 1962,
Highton 1989, Highton and Peabody 2000) and the success of allozyme techniques in
detecting independent lineages (Highton 2000). Second, although some authors have

30
voiced reservations over the species status of all P. glutinosus group members (e.g.,
Weins et al. 2006), there have been no formally proposed changes to the 28 species
recognized by morphology and allozymes (Table 3). Studies published during the DNA
sequence phase (2001-present) have focused on addressing evolutionary questions and
resolving evolutionary relationships rather than on species delimitation (Weisrock et al.
2005, Kozak and Weins 2006, Kozak et al. 2006, Weisrock and Larson 2006, Wiens et al.
2006).
Species delimitation in the Plethodon glutinosus group
Researchers attempting to delimit species in the Plethodon glutinosus group have
had to contend with the four problems associated with species delimitation discussed
above. Systematic research into the group has a long history, beginning with Gilliam
(1818) and Green (1818), with researchers using a diverse array of delimitation methods.
Species have been delimited, therefore, using many different concepts (e.g., typological,
biological, phylogenetic, evolutionary). Furthermore, diversification in the P. glutinosus
group has occurred in a relatively recent rapid radiation (Highton 1995, Wiens et al.
2006, Kozak et al. 2006) making incomplete lineage sorting and hybridization persistent
problems. Lastly, morphological differences among many members are sparse (Highton
1989), creating many cryptic species complexes within the group. These characteristics
have led to a long and contentious history of species delimitation that has only recently
subsided.

31
The problem of cryptic species
Before the advent of molecular tools, researchers had to rely solely on limited
morphological differences to diagnose species in the P. glutinosus group (Wake et al.
1983, Larson 1984, 1989). In the early years of systematics of this group, the task was
relatively straightforward as a few characters are reliable in diagnosing species or clusters
of species. For example, P. glutinosus sensu stricto was initially described because of the
presence of dorsal and lateral white flecks (Green 1818), P. jordani was distinguished by
the presence of red cheek patches (Blatchley 1901), P. shermani (except for populations
in the Unicoi Mountains) by the presence of red legs (Stejneger 1906), P. yonahlossee
because of reddish dorsal pigmentation (Dunn 1917), and P. metcalfi sensu stricto
because it lacked white or red pigmentation of any sort (Brimley 1912). Attempts at
finding other diagnostic morphological characters were largely unsuccessful and met with
controversy. For example, the presence of brassy flecks on the dorsum of southeastern
populations of P. jordani complex species were used in the description of P. clemsonae
by Brimley (1927). The species was subsequently treated as a subspecies of P. shermani
(Hairston and Pope 1948), a race of P. metcalfi (Mittleman 1948), and a subspecies of P.
jordani (Hairston 1950). It was not until the application of allozymes by Highton and
Peabody (2000) that the species was found to be genetically indistinct from P. metcalfi
and the taxonomy stabilized (see Table 2). As another example, Pope and Hairston
(1948) used costal groove counts, extent of dark ventral pigmentation, and number of
vomerine teeth to distinguish P. shermani rabunensis and P. s. melaventris from other
members of what they term the “jordani-metcalfi” group. Mittleman (1948), however,
pointed out that costal groove counts are: (1) variable within a species and (2) dependent

32
upon preservation and development. Therefore, a count of 13 (the number given for the
type specimen of P. s. rabunensis) may easily be interpreted as 15, which is within the
range recorded for P. clemsonae and P. metcalfi. Mittleman (1948) further points out
ventral pigmentation is variable within both P. metcalfi and P. clemsonae, encompassing
descriptions from dark gray to black, the same as given for P. s. rabunensis and P. s.
melavaentris. There is similar overlap in vomerine tooth count (Mittleman 1948).
Morphologically intermediate hybrid animals confused early taxonomists as well.
The early detection of P. shermani x P. glutinosus (now P. teyahalee) hybrids caused
Bishop (1941) to reclassify P. shermani as a subspecies of P. glutinosus. The same
hybrid morphology caused Hairston (1950) to classify P. teyahalee as a subspecies of P.
jordani. Currently, P. teyahalee is generally accepted as a full species under the P.
glutinosus complex. Interestingly, however, Highton (1989) suggested that P. teyahalee
might be of hybrid origin, having arisen through one or more hybridization events
between P. shermani (of the P. jordani complex) and P. cylindraceus (of the P.
glutinosus complex). Another controversy surrounding P. teyahalee involves the putative
hybrid nature of the type specimen. Animals collected from Teyahalee Bald in the
Snowbird Mountains of North Carolina were originally named as a subspecies of P.
jordani (P. j. teyahalee) by Hairston (1950). Highton (1983, 1989) suggested the
specimen is of hybrid origin but most closely resembles P. glutinosus, and consequently
elevated the subspecies to full species status. The name P. teyahalee was contested by
Hairston (1993) since names based on hybrid specimens are invalid under the
International Code of Zoological Nomenclature; Hairston (1993) proposed the name P.
33
oconaluftee instead. The name P. teyahalee remains prominent in the literature, although
some authors adhere to the name P. oconoluftee (e.g., Petranka 1998, Dodd 2004).
Later studies of morphological variation have also failed to satisfactorily delimit
species boundaries. Highton (1962) considered vomerine tooth count and pigmentation in
a genus-wide analysis, and concluded, “Geographic variation in the Plethodon is
sometimes great, spectacular examples occur. Even so it is necessary to be so arbitrary in
the choice of characters used to demarcate subspecies that I fail to see the advantage of
their continued use.” Manzo (1988) conducted a morphometric analysis of five species of
the P. jordani complex (P. cheoah, P. jordani, P. metcalfi, P. montanus, and P.
shermani) using 12 measurements. Only 54.9% of specimens were correctly assigned to
their known species (based on allozyme data, morphology, and geography). Moreover,
results showed a near complete lack of congruence between phylogenies based on
morphometric data versus allozyme data. More recently, Carr (1996) performed the most
comprehensive morphological analysis to date. Using 10 characters, the author analyzed
1,022 specimens from 26 populations representing 14 of the 16 species of the P.
glutinosus complex, as well as P. petraeus and P. yonahlossee. Results showed that body
size explained 75.2% of observed morphological variation, although there were also
differences in shape and proportion. Even so, only 61.5% of specimens were classified
into their correct species. After controlling for variation in body size, correct
classification fell to 50.0%. These findings led the author to conclude that
intrapopulational variation is as great as interpopulational variation, and therefore
morphology was not useful in species diagnosis.

34
Species delimitation in the allozyme phase ushered in a new age of Plethodon
systematics. With the publication of Highton (1989), the number of species recognized
within the P. glutinosus complex (the largest complex within the group) grew from four
to 16 (four of which were formerly considered subspecies within P. glutinosus; see Table
2). Highton (1989) used a Nei’s genetic distance of 0.15 (based on 22 allozyme loci) as a
threshold; populations separated by at least this distance were considered to be
sufficiently divergent to warrant species status. Highton justified use of this cutoff based
on the following: (1) it is consistent with some morphological characters and (2) previous
authors (Baverstock et al. 1977, Thorpe 1982) have suggested using a cutoff of 15%
divergence to separate species. In their paper on species concepts and the nature of
species, this method was openly criticized by Frost and Hillis (1990) on multiple
accounts: (1) a genetic threshold of 0.15, or the use of any genetic threshold, is arbitrary.
(2) It is difficult to determine if allopatric taxa are reproductively isolated or not.
Therefore, to say that a cutoff of 15% probably makes them different biological species is
unwarranted. (3) Highton himself adjusts the cutoff in order to make two exceptions,
once to raise a population to species level despite a genetic distance of 0.146 and once to
group two populations with a distance of 0.155. (4) The use by Baverstock et al. (1977)
of a genetic threshold of 15% does not correspond to a Nei’s genetic distance of 0.15.
Populations that differ by 15% in the number of fixed loci can actually vary between 0
and infinity, depending upon the level of polymorphism. (5) Since genetic distance is
heavily influenced by the level of polymorphism, simply choosing faster or slower
evolving genes can lower or raise the resulting genetic distance, thereby making a genetic
cutoff even more arbitrary. (6) There was clearly (according to Frost and Hillis 1990 and

35
Highton 1989) a failure in the clustering algorithm in assigning P. albagula to the proper
population. As reported by Highton, this species more closely resembled eight other
clusters than it did other populations of P. albagula. The authors point out that since P.
albagula did not cluster into a monophyletic group, then other species may not be
clustered accurately either (Frost and Hillis 1990).
Highton (1990) defended his use of a genetic cutoff by arguing the following: (1)
Use of a genetic threshold of 0.15 is not arbitrary since divergence of this amount
successfully unifies geographically contiguous groups that are morphologically and
genetically concordant. He further emphasizes that this value is consistent with
previously published values for species level divergence (Baverstock et al. 1977 and
Thorpe 1982); implying that, rather than arbitrarily adopting divergence values found in
other studies using different taxa, his was independent corroborative evidence. (2) His
application of a genetic cutoff in delimiting allopatric lineages is necessary since it is
impossible to apply the reproductive isolation criteria of the Biological Species Concept
to allopatric populations. (3) As a genetic cutoff of 0.15 is only an approximation of the
amount of genetic divergence necessary to achieve species status, actual values may
differ. It is, therefore, important to consider other lines of evidence such as geography
and morphology. (4) Highton amended his statement to read “Two populations that have
fixed differences at 15% of their loci would usually have…a (Nei’s) D > 0.16”. (5) The
presence of polymorphism does not substantially alter the genetic distance as Frost and
Hillis (1990) argued. When compared to a corrected genetic distance (denoted D*), actual
values from Hillis’s (1985) own work showed only insignificant differences. (6) The last
criticism of Frost and Hillis (1990) remained unaddressed. In sum, Frost and Hillis never

36
published a response to Highton’s (1990) rebuttal. Although frequently commented on,
this public debate seems not to have dissuaded researchers from accepting Highton’s
taxonomy.
The application of different species concepts
Prior to the early 1970s, no researcher stated explicitly to which species
delimitation criterion he or she adhered; however, this period predates the proliferation of
species concepts. Since no systematic study published during this time used reproductive
isolation criteria, and since morphological characters were the only diagnostic tools at
their disposal, researchers during this early period may be said to have used a typological
species criteria. This contradicts Highton’s (1995) assertion that most Plethodon
taxonomists since 1945 have used the BSC. In his own work, Highton used
morphological characters (pre-1970s) and allozymes (post-1970s) to infer the extent of
gene exchange. As the BSC relies chiefly on reproductive isolation, proxies such as the
extent of morphological or genetic divergence should, in theory, yield identical species
boundaries. Recent studies, however, have empirically demonstrated that applying
different species concepts to the same system may yield incongruous results (see above
under Difficulties with species delimitation: Different species concepts).
Beginning in 1978 with the clumping of P. longicrus into P. yonahlossee by
Guttman et al. (1978), which used allozyme data for the first time, researchers switched
from a typological species concept to a version of the PSC or Evolutionary Species
Concept. Given the way in which species delimitation was practiced by researchers
during this time, there is no distinction between the two, related concepts. This view is

37
shared by Tilley et al. (2008) who briefly summarized the use of species concepts in
allozyme studies. These authors claim to use the same methodology as Highton (1989)
and Highton and Peabody (2000), and further claim use of the General Lineage Concept
(de Quieroz 1998) and elements of the Evolutionary Species Concept (Wiley 1978, see
also Frost and Hillis 1990). This contradicts Highton and Peabody (2000) who explicitly
state adherence to the BSC, despite the difficulty encountered when applying it to a group
which experiences such widespread hybridization.
Highton and Peabody (2000) and Highton (2000) set forth a list of lines of
evidence that may be used to delimit species. These authors rely heavily on allozyme data
and used similar guidelines in delimiting many of the presently recognized species in the
P. glutinosus group. The lines of evidence are: (1) a Nei’s D of 0.15 or greater, (2)
morphologically distinct groups, (3) a lack of interbreeding among sympatric lineages,
(4) little or no gene flow among parapatric lineages, and (5) patterns of geographic
genetic variation within putative species which suggest the presence of gene flow.
Furthermore, Highton and Peabody (2000) use two additional lines of evidence to delimit
species of the P. jordani complex: (1) The Good-Wake method, which regresses the
genetic distance versus geographic distance of paired samples (Good and Wake 1992). If
the regression line passes through the origin, then no discontinuity exists and it can be
inferred that the samples belong to a single interbreeding population. (2) Highton’s
(1989) method whereby the modality (unimodal vs. multimodal) of distribution of D-
values is determined for a group of samples. A unimodal distribution is expected if all
samples are from a single interbreeding population. When applied to the P. jordani

38
complex samples, the authors found strong evidence for the presence of seven
independent lineages, which they designate as species.
Weisrock and Larson (2006) expand on the anaylsis of Highton and Peabody
(2000) by applying additional statistical analyses to the same allozyme dataset, as well as
incorporating mtDNA. In their analysis of the P. jordani complex, Weisrock and Larson
conclude that all seven lineages identified by Highton and Peabody are, in fact, valid
species according to the PSC (as defined by Cracraft 1989) and the General Lineage
Concept (GLC), since they appear to have the requisite pattern of ancestry and descent.
Currently, species status of all seven lineages is widely accepted.
Distinguishing between incomplete lineage sorting and introgressive hybridization
It is often difficult to distinguish between incomplete lineage sorting and
hybridization (see above). In the P. glutinosus group, however, it is known that historical
(Weisrock et al. 2005, Weisrock and Larson 2006) and present-day hybridization
(Hairston et al. 1992, Highton and Peabody 2000) occur. Despite the prevalence of
hybridization, the Good-Wake method employed by Highton and Peabody (2000) using
22 allozyme loci shows some genetic isolation among many species, suggesting a lack of
widespread introgression. This is confirmed by other studies using different molecular
markers. Despite known hybridization of P. jordani sensu stricto and P. cheoah with
other members of the P. glutinosus group, Weisrock and Larson (2006) found no
evidence of widespread introgression of mtDNA. This is in contrast to the same authors’
findings for P. amplus, P. meridianus, P. metcalfi and P. montanus. Although these four
species are differentiated enough at mtDNA loci to diagnose as separate species under the

39
PSC and GLC, there is strong haplotype sharing, suggesting periods of gene flow. It
should also be noted that neither Highton and Peabody (2000) nor Weisrock and Larson
(2006) found fixed genetic differences among the sample of 22 allozyme loci (the same
set of loci was used in both studies). Additionally, Weisrock et al. (2005) found extensive
mtDNA introgression in P. shermani from many other species in the P. glutinosus group.
Interestingly, shared mtDNA haplotypes occur between some species that otherwise have
deeply divergent mtDNA lineages (e.g., P. shermani and P. jordani). This finding
suggests that similarity between species results, not from incomplete lineage sorting, but
from introgressive hybridization, likely as a result of past range shifts (Weisrock et al.
2005).
Fine-scale analyses of a few of the myriad hybrid zones occurring between
species in the P. glutinosus group are another approach that has been used to document
past and present gene flow. In a 20-year study of a hybrid zone between P. shermani and
P. teyahalee in the Nantahala Mountians, Hairston et al. (1992) found substantial and
increasing introgression. The latter species, the authors conclude, is expanding its range
upslope into the range of the former, possibly as a result of cessation of logging activity
in the 1930s. As part of the same study (over an 18-year period, rather than 20-year
period), the authors failed to detect introgression across a hybrid zone between P. jordani
and P. metcalfi at the interface of the Great Smoky and Balsam Mountains (Hairston et
al. 1992). Importantly, however, only a few morphological characters were used in this
study. Genetic sampling, especially of mtDNA, might yield different results (Funk and
Omland 2003, Weisrock et al. 2005).

40
A third approach used to detect the presence of gene flow is the use of laboratory
crosses. Using this method researchers seek to quantify the extent of reproductive
isolation between closely related lineages. Reagan (1992) performed sexual isolation
experiments on 12 pairs of populations from five species in the P. jordani complex (P.
jordani, P. metcalfi, P. montanus, P. cheoah and P. shermani). Mating trials were scored
using two indices of mating success, spermatophore deposition and insemination. Results
for the two indices are largely concordant; significant sexual isolation (determined using
isolation coefficients comparing homotypic versus heterotypic crosses) was found in 10
out of the 12 pairs when considering spermatophore deposition and nine out of the 12
pairs for insemination. Reagan’s (1992) dataset includes two crosses between different
isolates of the same species (the Cowee Bald and Blue Ridge isolates of P. metcalfi and
the Wayah Bald and Standing Indian isolates of P. shermani). Crosses from homotypic P.
shermani populations do not show significant sexual isolation. Crosses from homotypic
P. metcalfi populations, however, do show significant isolation. This finding is consistent
with Weisrock and Larson’s (2006) finding of considerable mtDNA haplotype structuring
and introgression in P. metcalfi. Another interesting finding by Reagan (1992) is that
some parapatric populations of P. teyahalee and P. jordani exhibit sexual isolation from
one another, while other populations do not show such a pattern. The reproductive
isolation criterion of the BSC is clearly not met (Larson and Chippendale 1993), despite
Highton’s assertion that these species were diagnosed using the BSC (Highton and
Peabody 2000).
Although evidence for introgressive hybridization is strong, there is some
evidence that incomplete lineage sorting has also played a role in species delimitation in

41
the P. glutinosus group. Highton (1995) proposed that the genus Plethodon underwent a
rapid radiation about 5 mya; the P. glutinosus group became especially species rich
during this time. The phylogenetic tree created from allozyme data (see Palmer et al.
2005) shows that, while the P. glutinosus group is monophyletic, the same is not true for
the P. jordani and P. glutinosus complexes. This general pattern of polyphyly in the P.
jordani and P. glutinosus complexes is corroborated by Wiens et al. (2006) using a
phylogeny which included two mitochondrial and two nuclear genes (Figure 2.1).
Although the independent phylogenies share clustering of some groups (e.g., P.
fourchensis, P. ouachitae and P. caddoensis), the remaining species do not cluster
similarly between the two trees. Furthermore, the timing of diversification as estimated
by Wiens et al. (2006) is possibly much older than that reported by Highton (1995). In
support of Wiens et al. (2006), an estimate of 8-11 mya was also made Kozak et al.
(2006) using mtDNA. Such a recent, rapid radiation has likely resulted in incomplete
lineage sorting, and may be responsible for at least some of the difficulty in delimiting
species boundaries in the group. Regarding species delimitation, Wiens et al. (2006) state
“We acknowledge the possibility that some pairs of species in this group may prove to be
conspecific upon further investigation…but we consider it unlikely that the number of
species in the glutinosus group has been substantially overestimated.”
Conclusion
Historically, species delimitation in the Plethodon glutinosus group has been
fraught with difficulties and controversy. This is largely due to rampant homoplasy
(Wake 1991) and morphological stasis (Wake et al. 1983, Highton 1989), which have

42
resulted in few morphologically diagnostic characters. Because of extensive sampling by
Highton and colleagues (Highton and MacGregor 1983, Highton 1983, 1989, Highton
and Peabody 2000), it is unlikely that many more species will be described in the group.
Furthermore, species relationships within the group remain ambiguous, likely because
rapid radiation of one or a few ancestral forms roughly 10 mya (Highton 1995, Wiens et
al. 2006, Kozak et al. 2006), coupled with extensive introgressive hybridization (e.g.,
Weisrock et al. 2005, Weisrock and Larson 2006), has led to few genetic differences
among species. Recent attempts at identifying relationships have focused on expanded
mtDNA phylogenies (Kozak et al. 2006) and multilocus nuclear and mtDNA datasets
(Wiens et al. 2006). Despite this recent attention, however, the status of species
relationships continues to be dynamic, and it is in this area that more extensive multilocus
datasets will prove most beneficial.
In recent years, great strides have been made by systematists in resolving the
problems of cryptic species, incomplete lineage sorting and introgressive hybridization.
This has been primarily done through the use of multilocus datasets (e.g., Belfiore et al.
2008, Brumfield et al. 2008). There has also been considerable attention recently to
develop computer programs (e.g., BEST, Liu and Pearl 2007 and Edwards et al. 2007;
BUCKy, Ané et al. 2007) to handle such datasets. Furthermore, genomics-based methods
show considerable promise for species delimitation as well. The use of whole genomes
(or, at least, greatly expanded DNA sequence datasets) in the construction of
phylogenetic trees has become feasible for many model groups (see, for example, Rivera
2007).

43
The utility of DNA barcoding, especially in understudied groups, has been
severely criticized (Rubinoff et al. 2006). Barcoding relies on a short segment (~600 bp)
of mtDNA (cytochrome c oxidase subunit 1, CO1). Although not directly tested in the P.
glutinosus group, it is clear that this method would fail to recover species known from
morphology, geography, allozymes, nuclear DNA and more extensive mtDNA sampling.
Incongruent mtDNA phylogenies (Kozak et al. 2006, Wiens et al. 2006), extensive
mtDNA introgression (Weisrock et al. 2005, Weisrock and Larson 2006, see also Chapter
III), and extensive hybridization (e.g., Hairston et al. 1992, Highton and Peabody 2000)
support this argument. If applied to the P. glutinosus group, barcoding would almost
certainly fail to capture the complex history of the organisms. As a result, species
identifications using barcoding would be suspect at best.

44
Figure 2.1. Competing phylogenetic trees of the Plethodon glutinosus group from (A)
Palmer et al. (2005) constructed using allozymes and (B) Wiens et al. (2006) constructed
using mitochondrial and nuclear DNA. Species from the P. jordani complex are indicated
in bold. Shared monophyletic groups are indicated with boxes.

45
P. teyahaleeP. cylindraceus
P. shermani
P. chlorobryonisP. variolatus
P. chattahoocheeP. cheoahP. amplus
P. meridianusP. metcalfi
P. montanusP. grobmani
P. kisatchie
P. ocmulgeeP. savannahP. albagula
P. sequoyahP. kiamchi
P. mississippiP. aureolus
P. glutinosusP. jordani
P. fourchensis
P. ouachitaeP. caddoensis
P. kentuckiP. petraeus
P. yonahlossee
P. montanusP. metcalfiP. amplus
P. meridianusP. shermaniP. teyahaleeP. jordaniP. cheoah
P. kiamchiP. mississippiP. grobmaniP. cylindraceusP. sequoyah
P. kisatchieP. albagulaP. glutinosusP. ocmulgeeP. aureolus
P. fourchensisP. caddoensisP. ouachitaeP. variolatusP. chattahoochee
P. chlorobryonisP. petraeusP. savannahP. kentuckiP. yonahlossee
A B

46
Table 2.1. Species currently recognized in the Plethodon glutinosus complex.
Complex Species Complex Species
P. glutinosus P. albagula P. jordani P. amplus
P. aureoles P. cheoah
P. chattahoochee P. jordani
P. chlorobryonis P. meridianus
P. cylindraceous P. metcalfi
P. glutinosus P. montanus
P. grobmani P. shermani
P. kiamichi
P. kisatchie P. ouachitae P. caddoensis
P. mississippi P. fourchensis
P. ocmulgee P. ouachitae
P. savannah
P. sequoyah Other species P. kentucki
P. teyahalee* P. petraeus
P. variolatus P. yonahlossee *There is disagreement in the literature as to whether the correct name for this species is P. teyahalee or P.
oconoluftee.

47
Table 2.2. Taxonomic timeline of the Plethodon glutinosus group.
Date Species described Citation
1818 P. glutinosus Green (1818)
1818 Salamandra variolata Gilliams (1818)
1825 Salamandra cylindraceus Harlan (1825)
1854 P. variolosum (changed from S. variolata) Dumeril et al. (1854)
1901 P. jordani (red-cheeked form only) Blatchley (1901)
1906 P. shermani (red-legged form only) Stejneger (1906)
1912 P. metcalfi Brimley (1912)
1917 P. yonahlossee Dunn (1917)
1917 P. wehrlei* Fowler and Dunn (1917)
1927 P. clemsonae Brimley (1927)
1933 P. ouachitae Dunn and Heinze (1933)
1941 P. shermani considered subspecies of
P. glutinosus Bishop (1941)
1944 P. glutinosus albagula; two species groups
recognized (P. glutinosus group:
P. glutinosus glutinosus,
P. glutinosus albagula, P. ouachitae,
P. wehrlei, P. yonalossee; P. metcalfi
group: P. metcalfi, P. clemsonae,
P. jordani, P. shermani) Grobman (1944)
1948 P. shermani shermani, P. s. rabunensis
and P. s. melaventris Pope and Hairston (1948)
1948 P. shermani clemsonae Hairston and Pope (1948)
1948 P. shermani rabunensis and
P. s. melaventris refuted (all considered
P. metcalfi) Mittleman (1948)
1949 P. dixi Pope and Fowler (1949)
1949 P. glutinosus grobmani Allen and Neill (1949)
1950 P. jordani teyahalee; P. jordani contains
seven subspecies (P. j. jordani,
P. j. shermani, P. j. metcalfi,
P. j. clemsonae, P. j. rabunensis,
P. j. melaventris and P. j. teyahalee) Hairston (1950)
1951 P. caddoensis Pope and Pope (1951)
1951 P. kentucki Mittleman (1951)
1953 P. kentucki recognized as subspecies of
P. jordani Schmidt (1953)
1954 P. jacksoni Newman (1954)
1954 P. dixi considered subspecies of P. wehrlei;
P. wehrlei contains two subspecies
P. w. wehrlei and P. w. dixi Bogert (1954)
1955 P. kentucki sunk into P. glutinosus
glutinosus Clay et al. (1955)
1956 P. glutinosus grobmani refuted Humphries (1956)

48
1961 P. jacksoni considered subspecies of
P. wehrlei; P. wehrlei contains three
subspecies P. w. wehrlei, P. w. dixi and
P. w. jacksoni Cochran (1961)
1962 P. yonahlossee group (P. yonahlossee,
P. ouachitae, P. caddoensis) and
P. glutinosus group (P. jordani,
P. glutinosus glutinosus, P. glutinosus
albagula) recognized Highton (1962)
1962 P. longicrus Adler and Dennis (1962)
1978 P. longicrus sunk into P. yonahlossee Guttman et al. (1978)
1979 P. fourchensis Duncan and Highton (1979)
1979 P. glutinosus group recognized (as distinct
from P. wehrlei group): P. glutinosus,
P. jordani, P. yonahlossee, P. ouachitae,
P. fourchensis, P. caddoensis Highton and Larson (1979)
1983 P. kentucki resurrected Highton and MacGregor (1983)
1984 P. aureolus Highton (1984)
1988 P. petraeus Wynn et al. (1988)
1989 P. albagula (formerly P. glutinosus
albagula), P. chattahoochee,
P. chlorobryonis (formerly P. glutinosus
chlorobryonis), P. cylandraceus (formerly
Salamandra cylandracea), P. grobmani
(formerly P. glutinosus grobmani),
P. kiamichi, P. kisatchie, P. mississippi,
P. ocmulgee, P. savannah, P. sequoyah,
P. variolatus (formerly P. variolosum) Highton (1989)
1995 Three complexes and three other species
recognized in the P. glutinosus group:
P. petraeus, P. yonahlossee, P. ouachitae
complex (P. caddoensis, P. fourchensis,
P. ouachitae), P. jordani complex
(P. jordani), and P. glutinosus complex
(P. albagula, P. aureolus,
P. chattahoochee, P. chlorobryonis,
P. cylindraceus, P. glutinosus,
P. grobmani, P. kentucki, P. kiamichi,
P. kisatchie, P. mississippi, P. ocmulgee,
P. savannah, P. sequoyah, P. teyahalee,
P. variolatus) Highton (1995)
2000 P. amplus, P. cheoah, P. meridianus and
P. montanus Highton and Peabody (2000)
2006 Three clades and five other species
recognized: “Clade B”(P. oconoluftee
and P. teyahalee [unsure of species

49
status so both included in analysis],
P. cylindraceus, P. shermani,
P. chlorobryonis, P. variolatus,
P. chattahoochee, P. cheoah, P. amplus,
P. meridianus, P. metcalfi, P. montanus),
“Clade A” (P. grobmani, P. kisatchie,
P. ocmulgee, P. savannah, P. albagula,
P. sequoyah, P. kiamichi, P. mississippi,
P. aureoles, P. glutinosus), P. ouchitae
complex (P. fourchensis, P. ouachitae,
P. caddoensis), P. jordani, P. kentucki,
P. petraeus, P. longicrus and
P. yonahlossee [unsure of species status
so both included in analysis] Wiens et al. (2006) * Plethodon wehrlei is currently recognized as belonging to either the P. welleri group (see Palmer et al.
2005) or the P. welleri-P. wehrlei group (Wiens et al. 2006). Some early researchers (e.g., Grobman 1944),
however, included P. wehrlei as a part of the P. glutinosus group, and the species is therefore included in
this table.

50
Table 2.3. Phases of species delimitation in the Plethodon glutinosus group, the dates
during which the phases lasted, and the number of studies published with a focus on
taxonomy or systematics.
# of Species/
Dates of N Subspecies # of Name
Phase Criteria Utilization (Studies) Described Changes*
1 Morphology 1818-1962 29 20 15
2 Allozymes 1978-2000 9 20 2
3 DNA sequence 2001-present 5 0 0 * Indicates the number of times a species or subspecies was clumped into a different species or subspecies,
or a previously recognized species or subspecies was resurrected.

51
Literature Cited
Adler, K. K. and D. M. Dennis. 1962. Plethodon longicrus, a new salamander
(Amphibia: Plethodontidae) from North Carolina. Special Publication Ohio
Herpetological Society 4:1-14.
Agapow, P-M., O. L. P. Bininda-Emonds, K. A. Crandall, J. L. Gittleman, G. M. Mace, J.
C. Marshall, and A. Purvis. 2004. The impact of species concept on biodiversity
studies. The Quarterly Review of Biology 79(2):161-179.
Albertson, R. C. 2008. Morphological divergence predicts habitat partitioning in a Lake
Malawi cichlid species complex. Copeia 3:689-698.
Allen, E. R. and W. T. Niell. 1949. A new subspecies of salamander (genus Plethodon)
from Florida and Georgia. Herpetologica 5:112-114.
Alstrom, P., P. C. Rasmussen, U. Olsson, and P. Sundberg. 2008. Species delimitation
based on multiple criteria: the Spotted Bush Warbler Bradypterus thoracicus
complex (Aves: Megaluridae). Zoological Journal of the Linnean Society
154:291-307.
Anderson, J. A. and S. G. Tilley. 2003. Systematics of the Desmognathus ochrophaeus
complex of the Cumberland Plateau of Tennessee. Herpetological Monographs
17:75-110.
Ané, C., B. Larget, D. A. Baum, S. D. Smith, and A. Rokas. 2007. Bayesian estimation of
concordance among gene trees. Molecular Biology and Evolution 24(2):412-426.
Arnold, S. J., N. A. Reagan, and P. A. Verrell. 1993. Reproductive isolation and
speciation in plethodontid salamanders. Herpetologica 49(2):216-228.
Balakrishnan, R. 2005. Species concepts, species boundaries and species identification: a
view from the tropics. Systematic Biology 54(4):689-693.
Baverstock, P. R., C. H. S. Watts, and S. R. Cole. 1977. Electrophoretic comparisons
between allopatric populations of five Australian pseudomyine rodents (Muridae).
Australian Journal of Biological Science 30:471-485.
Beachy, C. K. and R. C. Bruce. 1992. Lunglessness in plethodontid salamanders in
consistent with the hypothesis of a mountain stream origin: a response to Ruben
and Boucot. The American Naturalist 139(4):839-847.
Belfiore, N. M., L. Liu, and C. Moritz. 2008. Multilocus phylogenies of a rapid radiation
in the genus Thomomys (Rodentia: Geomyidae). Systematic Biology 57(2):294-
310.

52
Bishop S. C. 1941. Notes on salamanders with descriptions of several new forms.
Occasional Papers of the Museum of Zoology, University of Michigan 451:1-25.
Blatchley, W. S. 1901. On a small collection of batrachians from Tennessee, with
descriptions of two new species. 25th
Annual Report of the Department of
geologic and Natural resources of Indiana 1900:759-763.
Bogert, C. M. 1954. Amphibians and Reptiles of the World 2:1195. The Animal
Kingdom, Doubleday and Company, Garden City, New York.
Brimley, C. S. 1912. Notes on the salamanders of the North Carolina mountains with
descriptions of two new forms. Proceedings of the Biological Society of
Washington 25:135-140.
Brimely, C. S. 1927. An apparently new salamander (Plethodon clemsonae) from S. C.
Copeia 1927:73-75.
Brumfield, R. T., L. Liu, D. E. Lum, and S. V. Edwards. 2008. Comparison of species
tree methods for reconstructing the phylogeny of bearded manikins (Aves:
Pipridae, Manacus) from multilocus sequence data. Systematic Biology
57(5):719-731.
Carr, D. E. 1996. Morphological variation among species and populations of salamanders
in the Plethodon glutinosus complex. Herpetologica 52(1):56-65.
Clay, W. M., R. B. Case, and R. Cunningham. 1955. On the taxonomic status of the slimy
salamander, Plethodon glutinosus (Green), in southeastern Kentucky.
Transactions of the Kentucky Academy of Science 16(3):57-65.
Cochran, D. M. 1961. Type specimens of reptiles and amphibians in the U. S. National
Museum. Bulletin of the United States National Museum 220:20.
Coyne, J. A. and H. A. Orr. 2004. Speciation. Sinauer Associates, Inc. Sunderland,
Massachusetts.
Cracraft, J. 1989. Speciation and it ontology: the empirical consequences of alternative
species concepts for understanding patterns in nature and processes of
differentiation. In D. Otte and J. A. Endler, eds. Speciation and Its Consequences.
Sunderland, Mass.: Sinauer, pp.28-59.
Cracraft, J. 2002. The seven great questions of systematic biology: an essential
foundation for conservation and the sustainable use of biodiversity. Annals of the
Missouri Botanical Garden 89(2):127-144.
Crespi, E. J., L. J. Rissler, and R. A. Browne. 2003. Testing Pleistocene refugia theory:

53
phylogeographical analysis of Desmognathus wrighti, a high-elevation
salamander of the southern Appalachians. Molecular Ecology 12:969-984.
Delcourt, P. A. and H. R. Delcourt. 1998. Paleological insights on conservation of
biodiversity: a focus on species, ecosystems, and landscapes. Ecological
Applications 8(4):921-934.
de Queiroz, K. 1998. The general lineage concept of species, species criteria and the
process of speciation. Pp 57-75 in Howard, D. J. and S. H. Berlocher, eds. Endless
Forms: Species and Speciation. Oxford University Press. New York.
Dettman, J. R., D. J. Jacobson, E. Turner, A. Pringle, and J. W. Taylor. 2003.
Reproductive isolation and phylogenetic divergence in Neurospora: comparing
methods of species recognition in a model eukaryote. Evolution 57(12):2721-
2741.
Dodd, Jr., C. K. 2004. The Amphibians of Great Smoky Mountains National Park. The
University of Tennessee Press, Knoxville.
Duméril, A. M. C., G. Bibron, and A. Duméril. 1854. Erpétologie Générale ou Histoire
Naturelle des Reptiles. Librairie Encyclopedique de Roret, Paris.
Duncan, R. and R. Highton. 1979. Genetic relationships of the eastern large Plethodon of
the Ouachita Mountains Copeia 1979:96-110.
Dunn, E.R. 1917. Reptile and amphibian collections from the North Carolina mountains,
with especial references to salamanders. Bulletin of the American Museum of
Natural History 37:593-634.
Dunn, E. R. and A. A. Heinze. 1933. A new salamander from the Ouachita Mountains.
Copeia 1933:121-122.
Edwards, S. V., L. Liu, and D. K. Pearl. 2007. High-resolution species trees without
concatenation. Proceedings of the National Academy of Sciences 104(14):5936-
5941.
Fowler, H.W. and E. R. Dunn. 1917. Notes on salamanders. Proceedings of the Academy
of Natural Sciences of Philadelphia 69:7-28.
Frost, D. R. and D. M. Hillis. 1990. Species in concept and practice: herpetological
applications. Herpetologica 46(1):87-104.
Funk, D. J. and K. E. Omland. 2003. Species-level paraphyly and polyphyly: Frequency,
causes, and consequences, with insights from animal mitochondrial DNA. Annual
Review of Ecology, Evolution and Systematics 34:397-423.

54
Gilliam, J. 1818. Descriptions of two new species of Linnean Lacerta. Journal of the
Academy of Natural Sciences Philadelphia 1:460-462.
Gleason, J. M., E. C. Griffith, and J. R. Powell. 1998. A molecular phylogeny of the
Drosphila willistoni group: conflicts between species groups? Evolution
52(4):1093-1103.
Good, D. A. and D. B. Wake. 1992. Geographic variation and speciation in the torrent
salamanders of the genus Rhyacotriton (Caudata: Rhyacotritonidae). University of
California Publications in Zoology 126:1-91.
Green, J. 1818. Descriptions of several species of North American Amphibia,
accompanied with observations. Journal of the Academy of Natural Sciences,
Philadelphia 1:348-359.
Grobman, A. B. 1944. The distribution of the salamanders of the genus Plethodon in
eastern United States and Canada. Annals of the New York Academy of Sciences
45:261-316.
Guttman, S. I., A. A. Karlin, and G. M. Labanick. 1978. A biochemical and
morphological analysis of the relationship between Plethodon longicrus and
Plethodon yonahlossee (Amphibia, Urodela, Plethodontidae). Journal of
Herpetology 12:445-454.
Hairston, N. G. 1950. Intergradation in Appalachian salamanders of the genus Plethodon.
Copeia 1950(4):262-273.
Hairston, N. G. 1993. On the validity of the name teyahalee as applied to a member of
the Plethodon glutinosus complex (Caudata: Plethodontidae): a new name.
Brimleyana 18:65-69.
Hairston, N. G. and C. H. Pope. 1948. Geographic variation and speciation in
Appalachian salamanders (Plethodn jordani group). Evolution 2:266-278.
Hairston, N. G., Wiley, R. H., C. K. Smith, and K. A. Kneidel. 1992. The dynamics of
two hybrid zones in Appalachian salamanders of the genus Plethodon. Evolution
46(4):930-938.
Hajibabaei, M., G. A. C. Singer, P. D. N. Hebert, and D. A. Hickey. 2007. DNA
barcoding: how it complements taxonomy, molecular phylogenetics and
populations genetics. Trends in Genetics 23(4):167-172.
Harlan, R. 1825. Description of a variety of Coluber fulvius, Linn., a new species of
Scincus, and two new species of Salamandra. Journal of the Academy of Natural
Sciences, Philadelphia 5:226-242.

55
Harrison, R. G. 1998. Linking evolutionary pattern and process: the relevance of species
concepts for the study of speciation. Pp 19-31 in Howard, D. J. and S. H.
Berlocher, eds. Endless Forms: Species and Speciation. Oxford University Press.
New York.
Hebert, P. D. N., E. H. Penton, J. M. Burns, D. H. Janzen, and W. Hallwachs. 2004. Ten
species in one: DNA barcoding reveals cryptic species in the neotropical skipper
butterfly Astraptes fulgerator. Proceedings of the National Academy of Sciences
101(41):14812-14817.
Hey, J., R. S. Waples, M. L. Arnold, R. K. Butlin, and R. G. Harrison. 2003.
Understanding and confronting species uncertainty in biology and conservation.
Trends in Ecology and Evolution 18(11):597-603.
Highton, R. 1962. Revision of North American salamanders of the genus Plethodon.
Bulletin of the Florida State Museum 6(3):235-367.
Highton, R. 1983. A new species of woodland salamander of the Plethodon glutinosus
group from the southern Appalachian Mountains. Brimleyana 9:1-20.
Highton, R. 1989. Biochemical evolution in the slimy salamanders of the Plethodon
glutinosus complex in the eastern United States. Part I. Geographic protein
variation. Illinois Biological Monographs 57:1-78.
Highton, R. 1990. Taxonomic treatment of genetically differentiated populations.
Herpetologica 46(1):114-121.
Highton, R. 1995. Speciation in eastern North American salamanders of the genus
Plethodon. Annual Review of Ecology and Systematics 26:579-600.
Highton, R. 2000. Detecting cryptic species using allozyme data. Pp. 215-241 in Bruce,
R. C., R. Jaeger, and L. D. Houck, eds. The Biology of Plethodontid Salamanders.
Kluwer Academic/Plenum. New York.
Highton, R. and A. Larson. 1979. The genetic relationships of the salamanders of the
genus Plethodon. Systematic Zoology 28:579-599.
Highton, R. and J. R. MacGregor. 1983. Plethodon kentucki Mittleman: a valid species of
Cumberland Plateau woodland salamander. Herpetologica 39:189-200.
Highton, R. and R. B. Peabody. 2000. Geographic protein variation and speciation in
salamanders of the Plethodon jordani and Plethodon glutinosus complexes in the
southern Appalachian mountains with the description of four new species. Pp. 31-
93 in Bruce R. C., R. Jaeger and L. D. Houck, eds. The biology of plethodontid
salamanders. Kluwer Academic/Plenum. New York.

56
Hillis, D. M. 1985. Evolutionary genetics of the Andean lizard genus Philodobolus
(Sauria: Gymnophthalmidae): phylogeny, biogeography, and a comparison of tree
construction techniques. Systematic Zoology 34:109-126.
Humphries, R. L. 1956. An unusual aggregation of Plethodon glutinosus and remarks on
its subspecific status. Copeia 195692):122-123.
Hudson, R. R. and J. A. Coyne. 2002. Mathematical consequences of the genealogical
species concept. Evolution 56(8):1557-1565.
King, R. A., A. L. Tibble, and W. O. C. Symondson. 2008. Opening a can of worms:
unprecedented sympatric cryptic diversity within British lumbricid earthworms.
Molecular Ecology 17(21):4684-4698.
Knowles, L. L. and B. C. Carstens. 2007. Delimiting species without monophyletic gene
trees. Systematic Biology 56(6):887-895.
Kozak, K. H. and J. J. Wiens. 2006. Does niche conservatism promote speciation? A case
study in North American salamanders. Evolution 60(12):2604-2621.
Kozak, K. H., A. Larson, R. M. Bonett, and L. J. Harmon. 2005. Phylogenetic analysis of
ecomorphological divergence, community structure, and diversification rates in
dusky salamanders(Plethodontidae: Desmognathus). Evolution 59(9):2000-2016.
Kozak, K. H., D. W. Weisrock, and A. Larson. 2006. Rapid lineage accumulation in a
non-adaptive radiation: phylogenetic analysis of diversification rates in eastern
North American woodland salamanders (Plethodontidae: Plethodon). Proceedings
of the Royal Society of London B 273:539-546.
Larson, A. 1984. Neontological inferences of evolutionary pattern and process in the
salamander family Plethodontidae. Evolutionary biology 17:119-217.
Larson, A. 1989. The relationship between speciation and morphological evolution. In D.
Otte and J. A. Endler, eds. Speciation and Its Consequences. Sunderland, Mass.:
Sinauer, pp.579-598.
Larson, A. and P. Chippindale. 1993. Molecular approaches to the evolutionary biology
of plethodontid salamanders. Herpetologica 49(2):204-215.
Liu, L. and D. K. Pearl. 2007. Species trees from gene trees: reconstructing Bayesian
posterior distributions of a species phylogeny using estimated gene tree
distributions. Systematic Biology 56(3):504-514.
Mace, G. M. 2004. The role of taxonomy in species conservation. Philosophical
Transactions of the Royal Society of London B 359:711-719.

57
Mallet, J. 2005. Hybridization as an invasion of the genome. Trends in Ecology and
Evolution 20(5):229-237.
Manzo, P. A. 1988. A morphometric analysis of Plethodon jordani Blatchley and its
hybrids. MS Dissertation, University of Maryland.
Marshall J. L. and C. D. Camp. 2006. Environmental correlates of species and genetic
richness in lungless salamanders (family Plethodontidae). Acta Oecologica 29:33-
44.
Mayr, E. 1963. Animal Species and Evolution. Belknap Press, Massachusetts.
Meyer, C. P. and G. Paulay. 2005. DNA barcoding: error rates based on comprehensive
sampling. PLoS Biology 3(12):e422.
Mittleman, M. B. 1948. American Caudata, V: Notes on certain Appalachian salamanders
of the genus Plethodon. Journal of the Washington Academy of Sciences
38(12):416-419.
Moran, P. and I. Kornfield. 1993. Retention of an ancestral polymorphism in the mbuna
species flock (Teleostei: Cichlidae) of Lake Malawi. Molecular Biology and
Evolution 10(5):1015-1029.
Mueller, R. L., J. R. Macey, M. Jaekel, D. B. Wake, and J. L. Boore. 2004.
Morphological homoplasy, life history, and historical biogeography of
plethodontid salamanders inferred from complete mitochondrial genomes.
Proceedings from the National Academy of Sciences 101(38):13820-13825.
Newman, W. B. 1954. A new plethodontid salamander from southwestern Virginia.
Herpetologica 10:9-14.
Osada, N. and C.-I. Wu. 2005. Inferring the mode of speciation from genomic data: a
study of the great apes. Genetics 169:259-264.
Palmer, C. A., R. A. Watts, R. G. Gregg, M. A. McCall, L. D. Houck, R. Highton, and S.
J. Arnold. 2005. Lineage-specific differences in evolutionary mode in a
salamander courtship pheromone. Molecular Biology and Evolution 22(11):2243-
2256.
Petranka, J. W. 1998. Salamanders of the United States and Canada. Smithsonian
Institution Press, Washington.
Pinho, C., D. J. Harris, and N. Ferrand. 2007. Comparing patterns of nuclear and
mitochondrial divergence in a cryptic species complex: the case of Iberian and
North African wall lizards (Podarcis, Lacertidae). Biological Journal of the
Linnean Society 91:121-133.

58
Pinho, C., D. J. Harris, and N. Ferrand. 2008. Non-equilibrium estimates of gene flow
inferred from nuclear genealogies suggest that Iberian and North African wall
lizards (Podarcis spp.) are an assemblage of incipient species. BMC Evolutionary
Biology 8:63-82.
Pope, C. H. and J. A. Fowler. 1949. A new species of salamander (Plethodon) from
southwestern Virginia. Natural History Miscellanea, Chicago Academy of
Sciences 47:1-4.
Pope, C. H. and N. G. Hairston. 1948. Two new subspecies of the salamander Plethodon
shermani. Copeia:1948:106-107.
Pope, C. H. and S. H. Pope. 1951. A study of the salamander Plethodon ouachitae and
the description of an allied form. Bulletin of the Chicago Academy of Sciences
9(8):129-152.
Price, T. D. and M. M. Bouvier. 2002. The evolution of F1 post-zygotic incompatibilities
in birds. Evolution 56(10):2083-2089.
Reagan, N. L. 1992. Evolution of sexual isolation in salamanders in the genus Plethodon.
PhD Dissertation, The University of Chicago.
Rojas, M. 1992. The species problem and conservation: What are we protecting?
Conservation Biology 6(2):170-178.
Rivera, M. C. 2007. Genomic analyses and the origin of the eukaryotes. Chemistry and
Biodiversity 4(11):2631-2638.
Ruben, J. A. and A. J. Boucot. 1989. The origin of the lungless salamanders (Amphibia:
Plethodontidae). The American Naturalist 134(2):161-169.
Rubinoff, D., S. Cameron, and K. Will. 2006. A genomic perspective on the
shortcomings of mitochondrial DNA for “barcoding” identification. Journal of
Heredity 97(6):581-594.
Sanders, K. L. A. Malhotra, and R. S. Thorpe. 2006. Combining molecular,
morphological and ecological data to infer species boundaries in a cryptic tropical
pitviper. Biological Journal of the Linnean Society 87:343-364.
Schmidt, K. P. 1953. A check list of North American amphibians and reptiles. Sixth ed.
American Society of Ichthyology and Herpetology.
Shaffer, H. B. and R. C. Thomson. 2007. Delimiting species in recent radiations.
Systematic Biology 56(6):875-878.

59
Sites Jr, J. W. and J. C. Marshall. 2003. Delimiting species: a renaissance issue in
systematic biology. Trends in Ecology and Evolution 18(9):462-470.
Sites Jr, J. W. and J. C. Marshall. 2004. Operational criteria for delimiting species.
Annual Review of Ecology, Evolution and Systematics 35:199-227.
Stejneger, L. 1906. A new salamander from North Carolina. Proceedings from the United
States National Museum 30:559-562.
Thorpe, J. P. 1982. The molecular clock hypothesis: biochemical evolution, genetic
differentiation and systematic. Annual Review of Ecology and Systematics
13:139-168.
Tilley, S. G., R. B. Merritt, B. Wu, and R. Highton. 1978. Genetic differentiation in
salamanders of the Desmognathus ochrophaeus complex (Plethodontidae).
Evolution 32(1):93-115.
Tilley, S. G. and M. J. Mahoney. 1996. Patterns of genetic differentiation in salamanders
of the Desmognathus ochrophaeus complex (Amphibia: Plethodontidae).
Herpetological Monographs 10:1-42.
Tilley, S. G., R. L. Eriksen, and L. A. Katz. 2008. Systematics of dusky salamanders,
Desmognathus (Caudata: Plethodontidae), in the mountain and piedmont regions
of Virginia and North Carolina, USA. Zoological Journal of the Linnean Society
152:115-130.
Wake, D. B. 1991. Homoplasy: the result of natural selection, or evidence of design
limitations? The American Naturalist 138(3):543-567.
Wake, D. B. 2006. Problems with species: patterns and processes of species formation in
salamanders. Annals of the Missouri Botanical Gardens 93:8-23.
Wake, D. B., G. Roth and M. H. Wake. 1983. On the problem of stasis in organismal
evolution. Journal of Theoretical Biology 101:211-224.
Watts, W. A. 1980. The late Quaternary vegetation history of the southeastern United
States. Annual Review of Ecology and Systematics 11:387-409.
Weisrock, D. W. and A. Larson. 2006. Testing hypotheses of speciation in the Plethodon
jordani species complex with allozymes and mitochondrial DNA sequences.
Biological Journal of the Linnean Society 89:25-51.
Weisrock, D. W., K. H. Kozak, and A. Larson. 2005. Phylogenetic analysis of mtDNA
gene flow and introgression in the salamander, Plethodon shermani. Molecular
Ecology 14(5):1457-1472.

60
Weisrock, D. W., H. B. Shaffer, B. L. Storz, and S. R. Storz. 2006. Multiple nuclear gene
sequences identify phylogenetic species boundaries in the rapidly radiating clade
of Mexican ambystomatid salamanders. Molecular Ecology 15:2489-2503.
Wiens, J. 2007. Species delimitation: new approaches for discovering diversity.
Systematic Biology 56(6):875-878.
Wiens, J. J., T. N. Engstrom, and P. T. Chippendale. 2006. Rapid diversification,
incomplete isolation, and the “speciation clock” in North American salamanders
(genus Plethodon): testing the hybrid swarm hypothesis of rapid radiation.
Evolution 60(12):2585-2603.
Wilder, I. W. and E. R. Dunn. 1920. The correlation of lunglessness in salamanders with
a mountain brook habitat. Copeia 84:63-68.
Wiley, E. O. 1978. The evolutionary species concept reconsidered. Systematic Zoology
27:17-26.
Wynn, A. H., R. Highton, and J. F. Jacobs. 1988. A new species of rock-crevice dwelling
Plethodon from Pigeon Mountain, Georgia. Herpetologica 44(2):135-143.
Young, N. 1998. Pacific coast Iris species delimitation using three species definitions:
biological, phylogenetic and genealogical. Biological Journal of the Linnean
Society 63:99-120.

61
CHAPTER III
Differential introgression of mtDNA relative to nuclear DNA and morphology in a
salamander hybrid zone involving three species (Plethodontidae: Plethodon)
Abstract
The role of hybridization as an important mechanism in animal evolution is
gaining acceptance. Presented here are analyses from a hybrid zone that occurs among
the salamanders Plethodon jordani, P. metcalfi, and P. teyahalee from the southern
Appalachian Mountains. Spatial patterns of variation are examined at four markers:
single nucleotide polymorphisms (SNPs) located in the mitochondrial DNA (mtDNA)
ND2 gene and the nuclear DNA ILF3 gene and the morphological markers of red cheek
pigmentation and white flecks. Four transects were established: two along high elevation
ridgelines predominately connecting the ranges of P. jordani and P. metcalfi, and two
elevational transects connecting hybrid populations of the former species with that of P.
teyahalee. Localities along these transects were sampled at a fine-scale. Concordance
among nuclear DNA and both morphological markers across the four transects is
observed. In three of the four transects, however, the pattern of mtDNA is discordant
from all other markers, with an overrepresentation of P. metcalfi mtDNA in the northern
and lower elevation localities than is expected given nuclear DNA and morphology. This
finding, in addition to studies demonstrating mating asymmetry and differing

62
ecological niches, suggests the hybrid zone may be moving south into the range of P.
metcalfi and downslope into the range or P. teyahalee.
Introduction
The importance of hybridization in evolution has long been known to botanists
(see Arnold 2006 and Arnold and Meyer 2006), but its importance in zoology has been
less clear (Mayr 1963, Coyne and Orr 2004). Seeds of the idea that hybrids are
evolutionary dead ends can be seen in Darwin (1859), when he stated that hybrids were
nothing more than imperfect offspring of “pure species”. Mayr (1963) voiced a similar
sentiment when he wrote, “The total weight of the available evidence contradicts the
assumption that hybridization plays a major evolutionary role among higher animals.”
Recent studies highlighting the prevalence of hybridization in animals (Mallet 2005) and
considerable work demonstrating the porous nature of some species boundaries
(Martinsen et al. 2001, Shaw and Danley 2003, Bull et al. 2006, Minder and Widmer
2008) has led researchers to suggest that introgressive hybridization plays an important
role in animal, as well plant, evolution (Grant et al. 2005, Arnold 2006, Arnold and
Meyer 2006).
Hybrid zones, which form after secondary contact of two partially reproductively
isolated populations, have been especially useful in elucidating evolutionary processes.
Harrison (1990) viewed these regions of parapatry as “windows on the evolutionary
process”, and numerous studies of naturally occurring hybrid zones have yielded
considerable insight into the process of speciation (e.g., Szymura and Barton 1991,
Tucker et al. 1992, Rieseberg et al. 1999, Vines et al. 2003, Payseur et al. 2004, Teeter et

63
al. 2008). Additionally, because hybrid zones occur between two partially reproductively
isolated populations, analysis may uncover the mechanisms maintaining species
boundaries (Piálek and Barton 1997, Porter et al. 1997, Kim and Rieseberg 1999,
Brumfield et al. 2001, McDonald et al. 2001, Martin et al. 2006). Theoretical work
suggests traits or alleles that are under positive selection can introgress across a species
boundary even if the remaining genetic background is selected against (Barton 2001).
Importantly, introgression can happen as long as the trait or allele is not as
disadvantageous in the hybrid background as it is in one of the parental types.
Recent work on hybrid zone movement challenges early assumptions of hybrid
zone stasis. In a recent review, Buggs et al. (2007) identified 23 studies which
documented hybrid zone movement and another 16 studies which had patterns consistent
with movement. These studies utilize two different approaches: First, long-term
monitoring of molecular and morphological markers across a hybrid zone is a fool proof
method for detecting movement. Second, analyzing differential patterns of introgression
at a single point in time may allow for inference of movement. The eventual elimination
of the recipient species is one possible outcome of hybrid zone movement. Genetic
swamping, the abundant and asymmetrical spread of alleles across species boundaries,
results in the extirpation of the recipient species (Rhymer and Simberloff 1996, Wolf et
al. 2001, Ayres et al. 2004, Fitzpatrick and Shaffer 2007).
One species rich group where hybridization is especially common is the
Plethodon glutinosus group (Caudata: Plethodontidae), which is found throughout the
southeastern United States. Based on morphology and allozyme data, 28 lineages are
currently recognized as species (Highton 1989, Highton and Peabody 2000). Among 17

64
pairs of sympatric species in the group, five are known to hybridize; and among 16
parapatric pairs, 11 are known to form hybrid zones (Highton and Peabody 2000).
Furthermore, it appears that much of this hybridization is introgressive. In a study of a
hybrid zone between P. shermani and P. teyahalee, Hairston et al. (1992) discovered
what appears to be massive morphological introgression of P. teyahalee into P. shermani
populations. This hybrid zone movement, the authors conclude, is likely due to the
cessation of logging activity early last century. In another example, using mtDNA and
allozyme data involving the seven members of the P. jordani complex (one complex of
many in the P. glutinosus group), Weisrock and Larson (2006) found evidence for
substantial mtDNA introgression. In a finer scale analysis, Weisrock et al. (2005)
uncovered substantial introgression of P. teyahalee mtDNA in one geographic isolate of
P. shermani. Evidence of past genetic swamping by P. teyahalee is seen in another
isolate of P. shermani as well (Highton 1970, 1972, 1989). Evidence for such pervasive
introgression supports the idea that hybridization plays an important role in the evolution
of salamanders in the P. glutinosus group.
A series of hybrid zones among three species in the P. glutinosus group occur at
the interface of the Great Smoky and Balsam Mountains in the southern Appalachians.
The high elevation species P. jordani and P. metcalfi are known to hybridize along two
ridgelines, Balsam Mountain and Hyatt Ridge (Hairston 1950, Highton 1970). These
ridgelines are high elevation corridors that connect the Great Smoky to the Balsam
Mountains, the ranges of P. jordani and P. metcalfi, respectively. A third species, P.
teyahalee, inhabits lower elevations throughout much of the southern Appalachians and
hybridizes with the former species at intermediate elevations (Peabody 1978, Manzo

65
1988, Reagan 1992). The most complete study in this system was done by Hairston et al.
(1992). These authors sampled salamanders from the same five localities along the
southern portion of Balsam Mountain each year for an 18-year period and recorded the
amount of red cheek pigmentation, which is diagnostic for P. jordani but absent in P.
metcalfi. This study documented the extensive nature of hybridization along the ridgeline
and, since no movement was detected, yielded some insight on the short-term stability of
the hybrid zone.
The existence of hybrid populations among species in the P. glutinosus group as
documented by previous researchers allows for the opportunity to study the dynamics of
naturally occurring hybrid zones. The analyses presented here expand on earlier studies
in three ways: (1) patterns of spatial variation are examined for mtDNA, nuclear DNA,
and morphological markers; (2) hybrid populations involving P. jordani, P. metcalfi, and
P. teyahalee are analyzed across four transects, two along high elevation ridgelines
predominately connecting the ranges of P. jordani and P. metcalfi, and two elevational
transects connecting hybrid populations of the former species with that of P. teyahalee;
and (3) sampling in this study was performed at a spatially fine scale, allowing for
increased resolution in the detection of introgression. Results presented here show a
pattern of differential introgression of mtDNA relative to nuclear DNA and morphology.
Methods
Sampling
Two high elevation transects were established along Balsam Mountain and Hyatt
Ridge. Salamanders were collected from 24 localities along the 24-km long Balsam

66
Mountain. At each collection locality, a minimum of five salamanders were sampled
(Figure 3.1 and Appendix 3.1). Salamanders were collected from 13 localities along 6 km
of the southernmost portion of Hyatt Ridge, with a minimum of 10 salamanders sampled
per locality (Figure 3.1 and Appendix 3.1). Two elevational transects were also created
that connect high and low elevation populations. The Palmer Creek transect begins at
1,390 m in elevation and extends 8 km to 951 m. Salamanders were collected from eight
localities, with a minimum of five salamanders per locality (Figure 3.1 and Appendix
3.1). The Mt Sterling transect follows Mt Sterling Ridge for 1.5 km to Mt Sterling
summit (at 1,768 m elevation) before descending for 2 km to 1,134 m. Salamanders were
collected from 13 localities, with a minimum of 5 salamanders sampled at each locality
(Figure 3.1 and Appendix 3.1).
Parental animals from each of the three species were also sampled at locations
distant from known areas of hybridization (Figure 3.1 and Appendix 3.2). These included
8 localities in the Great Smoky Mountains (the range of P. jordani), 6 from the Balsam
Mountains (within the range of P. metcalfi), and 6 from low elevations in the Great
Smoky Mountains (within the range of P. teyahalee). It should be noted that Highton and
Peabody (2000) and Weisrock and Larson (2006) uncovered two genetically divergent
lineages of P. metcalfi corresponding to the Balsam and Blue Ridge Mountains. As only
populations from the Balsam Mountains are known to hybridize with P. jordani, only
these populations of P. metcalfi were sampled.

67
Tissue collection and DNA extraction
Samples were collected in the field from 2004 to 2007 during the months of May
to July. Salamanders were captured by hand and 10-20 mm of the tail tip removed for
genetic analysis. In the field, vials containing tissue samples were immediately placed in
an ice-salt mixture (approximately -20oC) until they could be transferred to liquid
nitrogen 3-48 hours later. At the end of the field season, samples were removed from the
liquid nitrogen and stored at -80oC. All samples have been cataloged into the tissue
collection of the Division of Reptiles and Amphibians, Museum of Zoology at the
University of Michigan (under accession number 2008-09 no. 3, and uniquely identified
by field number; Appendices 3.3 and 3.4).
DNA was extracted from tail tissue using a standard phenol-chloroform protocol
(Museum of Vertebrate Zoology, University of California, Berkeley, CA). Briefly, 0.5-20
µg of frozen tissue was washed in 1 ml of cold STE buffer, and then incubated in a
mixture of lysis buffer, proteinase K, and RNase A. Samples were centrifuged and pellets
discarded. The resultant supernatant was subjected to three rounds of purification with a
phenol-chloroform mixture and centrifugation. DNA was precipitated in ~900 ml of cold
95% ethanol, centrifuged, and the supernatant discarded. The resultant pellet was washed
twice with 70% ethanol, allowed to dry, and resuspended in 100 µl of TE buffer.
Morphological markers
Animals were scored in the field for two morphological markers. The first, red
cheek pigmentation, is diagnostic for animals captured within the range of P. jordani, and
is absent in parental populations of P. metcalfi and P. teyahalee. Animals were scored on

68
a 14-point scale, with 0 indicating the complete absence of red cheek pigmentation and
13 indicating bright and pervasive red cheek pigmentation, extending onto the throat,
shoulders, and forelimbs. Assigned scores accounted for both extent and intensity of red
pigmentation, as well as both the right and left cheeks. The second marker, white
flecking, is diagnostic of pure P. teyahalee, and is absent in parental populations of P.
jordani and P. metcalfi. The amount and pattern of white flecking is variable in P.
teyahalee, but lateral flecks are generally abundant and large, while dorsal flecks are
sparse and small. White flecks were scored as being either present or absent. In order to
achieve consistency in scoring the morphological markers, all animals were scored by
MWHC. Digital photographs of the right and left sides of the head were taken of each
animal. These images have been cataloged into the digital image collection of the
Division of Reptiles and Amphibians, Museum of Zoology at the University of Michigan
(under accession number 2008-09 no. 3, image numbers 49-960, and uniquely identified
by field number; Appendices 3.3 and 3.4).
mtDNA marker
A series of two single nucleotide polymorphisms (SNPs) were identified in the
mtDNA gene NADH subunit II (ND2): the first distinguishes P. jordani from P. metcalfi
and P. teyahalee, and the second distinguishes P. teyahalee from P. jordani and P.
metcalfi. Thus, when used in tandem, the SNPs were diagnostic for each species. The
panel used to identify these single nucleotide differences consisted of the following pure
parental samples: 18 animals from 8 populations within the range of P. jordani, 16
animals from 5 populations within the range of P. metcalfi, and 13 animals from 6

69
populations within the range of P. teyahalee (Figure 3.1 and Appendix 3.3).
Approximately 950 base pairs of the ND2 gene, the entire tRNAAla
, and a portion of the
tRNATrp
gene were amplified with the forward primer MC001 (5’-
TTTCTAACCCAATCTATAGCATCC-3’) and the reverse primer MC002 (5’-
GTCTTGCAAGTTCGAGTCAGA-3’), designed using the on-line software Primer3
(Figure 3.2A). Polymerase chain reaction (PCR) protocols followed Weisrock et al.
(2001), with the inclusion of a 5 min hot start at 95oC and a 7 min final extension at 72
oC.
Sequencing was performed on an ABI 3730 XL automated DNA sequencer through the
University of Michigan DNA Sequencing Core facility. Resulting sequences were
aligned using Sequencher version 4.8.
Scoring samples at the mtDNA marker was done using restriction fragment length
polymorphism (RFLP) digests. The PCR product for each sample was divided into two
equal aliquots and digested with BanI and MfeI restriction enzymes. When used in
tandem, RFLP digestions were unambiguous when scoring at the ND2 locus. Digestion
with BanI cut the PCR product of P. jordani into fragments with approximate lengths of
300 and 650 base pairs, while leaving the products of P. metcalfi and P. teyahalee whole.
Similarly, digestion with MfeI cut the PCR product of P. teyahalee into fragments with
approximate lengths of 280 and 670 base pairs, while leaving the products of P. jordani
and P. metcalfi whole (Figure 3.2A). Because of a polymorphism in P. jordani, products
for this species were occasionally cut with MfeI; however, since P. teyahalee was never
cut with BanI, resulting fragments remained diagnostic. Banding patterns from the RFLP
digestions were visualized and scored on 2% NuSieve gels.

70
Nuclear DNA marker
As with the mtDNA marker, a panel was developed to identify diagnostic nuclear
SNPs. The panel consisted of 12 animals from 6 localities in the range of P. jordani, 11
animals from 5 localities in the range of P. metcalfi, and 8 animals from 5 localities in the
range of P. teyahalee (Figure 3.1 and Appendix 3.3). As in the mtDNA analysis, two
SNPs were identified that, when used in tandem, could distinguish the three parental
species. No restriction enzymes with suitable recognition sites could be found. Therefore,
scoring samples at the nuclear DNA marker were done by sequencing each PCR product
and scoring the sequences by eye. Approximately 280 base pairs of the middle exon (and
partial sequences of the surrounding introns) in the nuclear gene interleukin enhancer
binding factor 3 (ILF3) were amplified with the forward primer MC003 (5’-
CCAGGCATTTATGCATCCTT-3’) and the reverse primer MC004 (5’-
CGTGCTAGCCTCGGTAACAT-3’), designed using Oligo version 6.71 (Figure 2B).
PCR was performed using a hot start of 94oC for 3 min, 20 cycles at 94
oC for 30 sec,
65oC minus 0.5
oC/cycle for 30 sec, and 72
oC for 1 min, followed by 20 cycles at 94
oC for
30 sec, 55oC for 30 sec, and 72
oC for 1 min, with a final extension at 72
oC for 8 min (E.
Jockusch pers. comm.). Sequencing and alignments were performed as described above.
Hybrid zone analysis
Two different types of analyses were performed in order to explore differential
patterns of introgression. The first consisted of two chi-square contingency table tests on
the entire dataset that were used specifically to test for differential introgression of
mtDNA relative to nuclear DNA. The first test was performed on individual samples and
71
tested the null hypothesis that nuclear and mtDNA haplotypes were over- or
underrepresented. The second test compared sample localities that were classified by
their most common haplotype at the nuclear and mtDNA markers and tested the null
hypothesis that P. jordani, P. metcalfi, and P. teyahalee haplotypes are equally well
represented among the collection localities. In both tests, significance was assigned at the
P ≤ 0.05 level.
Maximum likelihood was used to compare the relative abundance of nuclear and
mtDNA genotypes across the entire dataset. Like the contingency table tests, this analysis
was used to assess coincidence among molecular markers; however, multimodel testing
allowed different genotypic combinations to vary independently. Samples were grouped
according to whether they were: (1) homozygous at the nuclear marker and had
homospecific mtDNA, (2) homozygous at the nuclear marker and had heterospecific
mtDNA, (3) heterozygous at the nuclear marker and had mtDNA from one of the nuclear
parents, or (4) heterozygous at the nuclear marker and had mtDNA from a third parental
species. Generalized linear models (GLMs) were then created to compare the likelihood
that the multilocus genotype frequencies could be predicted by the single-locus genotype
frequencies. Eleven different models were tested: an independence (null) model in which
each possible genotypic category is predicted independently by the frequency of the
single-locus genotypes, a symmetrical model in which each of the four classes is
predicted independently from one another, and nine asymmetrical models in which each
of the six nuclear genotypes (three homozygous and three heterozygous combinations)
and each of the three mtDNA genotypes is predicted independently from the other
multilocus genotypes.

72
Two methods were used to assess the suitability of each model. The first is the
Akaike information criterion (AIC). Rather than finding the single best model, the AIC is
a multimodel inference tool that assesses the suitability of the full set of models given the
data (Burnham and Anderson 2004). Models are ranked hierarchically according to their
AIC values, with lower values indicating higher suitability. Often, as is done here, AIC
values are given as ΔAIC, which is the difference of each AIC value from that of the best
model. The second method uses the residual deviance as a measure of the goodness-of-fit
of a model relative to a saturated model, which acts as a baseline (Agresti 2007). Higher
values indicate more variation is unaccounted for by the model and, therefore, lower
values indicate models with a better fit. Significance levels are determined by comparison
of each model to the saturated model. Therefore, an insignificant residual deviance (P >
0.05) means the residual variance is adequately explained as sampling error and the
model is an adequate description of the data. All analyses were performed using R
version 2.4.1.
Ecological niche modeling
Ecological niche models were created for P. jordani and P. metcalfi.
Georeferenced localities for P. jordani (n = 374) and P. metcalfi (n = 289) are a subset of
those used by Kozak and Wiens (2006) and were obtained by those authors from the
collection of the U. S. National Museum. Most specimens used in the analysis were
collected by R. Highton and assigned to species using morphology and allozymes. Any
specimen with uncertain identification was omitted from the analysis (Kozak and Wiens
2006). Models for P. teyahalee are not included in the hybrid zone analysis, as the model

73
resolution is not fine enough to permit meaningful interpretation in the narrow area of
hybridization.
Models were created using Maxent version 3.2.1 (Phillips et al. 2004, Phillips et
al. 2006). Maxent is a machine-learning method which utilizes presence-only data in the
construction of models of species distributions. Like other niche modeling methods, the
objective of Maxent is to predict environmental suitability within a specified area given
the environmental conditions of known collection localities of a population or species of
interest. Maxent does this by creating a probability distribution of habitat suitability for
all grid cells in the specified region by computing the probability distribution of
maximum entropy, i.e., a distribution that is closest to uniform with respect to the average
of environmental conditions at the known collection localities. Habitat suitability values
for each grid cell are given as a probability, and probability values for all grid cells must
sum to 1.0. Each cumulative probability value is subsequently multiplied by 100 to give a
percentage. Raster files of habitat suitability values created in Maxent were converted to
ASCII files and viewed in ArcGIS version 9.3.
The bioclimatic variables used to model species distributions consisted of the 19
available from the WorldClim database (www.worldclim.org; Table 3.1). Many previous
ecological niche modeling studies attempted to minimize non-independence among
variables by including representatives from groups of highly correlated variables. Maxent
differs from many other niche modeling programs in that it assesses and incorporates
variables and the interactions between variables, thus accounting for non-independence
(Phillips et al. 2006).

74
Results
Every salamander captured within the range of pure Plethodon jordani had at
least some red cheek pigmentation (mean = 8.02, range = 1-13, n = 90), while red
pigmentation was entirely absent in populations of pure P. metcalfi and P. teyahalee.
Similarly, the presence of white flecks was found to be diagnostic for pure P. teyahalee
(n = 11) and was completely absent in populations of pure P. jordani and P. metcalfi
(Appendix 3.3). Within the hybrid zone, the number of samples collected per transect are
as follows: Balsam Mountain, 5-16 per locality, 264 samples total; Hyatt Ridge, 10-15
per locality, 155 samples total; Palmer Creek, 5-16 samples, 86 samples total; and Mt
Sterling, 5-13 per locality, 140 samples total (Appendix 4). Salamanders captured within
the hybrid zone show a wide range of cheek pigmentation scores (range = 0-13, n = 740),
and 14 individuals showed the presence of both red cheek pigmentation and white flecks.
Most combinations of genotypic classes are represented in the hybrid zone (Table
3.2). Curiously, no P. metcalfi-P. teyahalee heterozygotes were found at the nuclear
marker. Similarly, no individuals were found that were homozygous for P. teyahalee at
the nuclear marker while having P. jordani mtDNA. Other genotypic classes are
uncommon. For example, only a single individual was sampled that was heterozygous for
P. jordani and P. metcalfi at the nuclear marker but had P. teyahalee mtDNA. Similarly,
only two individuals were sampled that were homozygous for the P. metcalfi nuclear
allele but had P. teyahalee mtDNA. Most other hybrid genotype combinations are
moderately well represented. For example, P. jordani-P. metcalfi heterozygotes at the
nuclear marker with P. jordani mtDNA were found in 28 samples; P. jordani-P.
teyahalee heterozygotes at the nuclear marker with P. metcalfi mtDNA were found in 15

75
samples; and P. jordani-P. teyahalee heterozygotes with P. jordani mtDNA were found
in 8 samples. Results from the contingency table test on individual samples show that P.
metcalfi mtDNA is most common, while P. jordani nuclear DNA is most common (χ2 =
193.1835, D.F. = 2, P < 0.0001; Table 3.3). Similarly, results from the contingency table
test on sample localities show that P. metcalfi mtDNA is most common and P. jordani
nuclear DNA is most common at the majority of localities (χ2 = 9.0195, D.F. = 2, P =
0.0110; Table 3.4). This suggests P. metcalfi mtDNA is more widespread than P. metcalfi
nuclear DNA and P. jordani nuclear DNA is more widespread that P. jordani mtDNA.
The general linear models depict general patterns of association that might be
functions of spatial structure, nonrandom mating, natural selection, or any combination
thereof. Based on resulting ΔAIC values and residual deviances, the models may be
categorized into three groups (Table 3.5). The first group contains those models with
large ΔAIC values and significant residual deviances, meaning these models are not
suitable given the data. This group includes the null model, the symmetrical model, and
the following asymmetrical models: P. metcalfi / P. teyahalee heterozygotes, P. metcalfi
homozygotes, P. jordani / P. metcalfi heterozygotes, and P. jordani / P. teyahalee
heterozygotes (all are nuclear DNA genotypes). The second group contains those models
with moderate ΔAIC values and smaller, although still significant, residual deviances.
This group includes: P. jordani homozygotes (nuclear DNA genotype), and the models
varying P. jordani and P. metcalfi mtDNA. The third group contains two models which
have low ΔAIC values and insignificant residual deviances. These models – P. teyahalee
homozygotes (nuclear DNA genotype) and P. teyahalee mtDNA – are the only two
models not rejected by the goodness-of-fit test. Overall, these results demonstrate

76
associations among genotypes, with some genotypic combinations being under- or
overrepresented.
Three patterns emerge from the Balsam Mountain transect: First, at four localities
near the center of the transect (LB, LC, PO, and FR), the presence of P. teyahalee was
detected both morphologically and genetically (Figure 3.3). This occurs at Pin Oak Gap,
a low point in the otherwise high elevation of the Balsam Mountain ridgeline. Second,
frequencies of the P. jordani nuclear marker and the incidence of red cheek pigmentation
are in close agreement (Figure 3.3). That is, populations from localities along the
ridgeline that show a predominance of the P. jordani nuclear marker also have a high
cheek pigmentation score (e.g., localities LG, BH, BG, and SP). Third, frequencies of P.
jordani mtDNA are largely discordant with respect to those of the nuclear marker and red
cheek pigmentation. This is most clearly seen in localities GF, BI, LG, BG, LB, SM, SP,
HC, CB, and CA (Figure 3.3).
The pattern of differential introgression is not seen in the Hyatt Ridge transect
(Figure 3.4). Rather, there is coincidence among all markers. Also unlike Balsam
Mountain, P. teyahalee markers do not appear on Hyatt Ridge, except for one individual
that is heterozygous at the nuclear DNA marker (with P. jordani mtDNA and no white
flecks) and one apparently pure P. teyahalee from the southernmost collection locality
(which has a lower elevation than most other sites on the ridgeline).
The pattern of differential introgression is strongly apparent in the Palmer Creek
transect (Figure 3.5). The upslope (western) end of the transect begins in a hybrid
population of P. jordani and P. metcalfi (locality PC); however, nuclear and mtDNA
markers show a prevalence of P. metcalfi alleles. The average cheek pigmentation score

77
is 0.9, with 2 out of 11 animals having some red pigmentation, and a considerable amount
of P. jordani nuclear DNA (8 out of 20 allele copies). There is, however, a complete
absence of P. jordani mtDNA at this site. The presence of the P. jordani nuclear marker
extends downslope to 1000 m elevation, almost to the valley floor. The presence of some
red cheek pigmentation extends to the lowest elevation sampled (locality BK at 951 m
with an average cheek pigmentation score of 0.125). This pattern is in contrast to the
complete absence of P. jordani mtDNA along the transect. Patterns in white flecks are
consistent with those of red cheek pigmentation and nuclear DNA.
Patterns of marker frequencies are more complicated along the Mt Sterling
transect (Figure 3.6). Along the ridgeline of the western portion of the transect (localities
ZI-ZM; 1,561-1,768 m elevation) there is a predominance of P. jordani nuclear DNA,
mtDNA, and morphology, although P. metcalfi mtDNA may be slightly overrepresented.
At localities beginning immediately off the ridge top, there is a complete absence of P.
jordani mtDNA. This is in sharp contrast to the patterns of the P. jordani nuclear marker
and red cheek pigmentation, both of which predominate to an elevation of 1,280 m. As in
the Palmer Creek and Balsam Mountain transects, patterns in P. teyahalee (white flecks)
are largely coincident with those of red cheek pigmentation and nuclear DNA.
Ecological niche modeling results are presented in Figures 3.3 and 3.7. The
models show higher predicted suitability values for P. jordani in comparison to P.
metcalfi over much, but not all, of the hybrid zone. The values for P. jordani are high
(80-100%) throughout the northern areas of the hybrid zone, and moderately high (60-
80%) in the southern areas. The distribution of highly suitable habitat for P. metcalfi is
patchy, concentrated in the southern areas of the hybrid zone, and is often restricted from

78
the highest elevations. When suitability values within grid cells are compared between
the two species at the transect collection localities, P. jordani is seen to have higher
predicted suitability than P. metcalfi at all localities except the southernmost sites (PG,
ST, WK, and HT; Figure 3.3).
Out of the 19 bioclimatic variables used to construct the ecological niche models,
two highly correlated variables emerged as important (Table 3.1). BIO14, precipitation in
the driest month, and BIO17, precipitation in the driest quarter, together explain 77.4% of
the predicted distribution for P. jordani and 84.7% for P. metcalfi. A third variable,
precipitation seasonality (BIO15), explains a further 6.9% of the distribution of P.
jordani and 7.9% of the distribution for P. metcalfi.
Discussion
When samples from all four transects are combined, a clear pattern of differential
introgression of nuclear and mtDNA emerges. This is most clearly seen in the
contingency table results, which show a significant overrepresentation of Plethodon
metcalfi mtDNA and P. jordani nuclear DNA. Results from the general linear models
reflect more complex patterns of species interactions. The best fitting models are those in
which P. teyahalee homozygotes at the nuclear marker or P. teyahalee mtDNA vary in
abundance. Specifically, the pure P. teyahalee genotype is overrepresented, which
suggests P. teyahalee is less likely to form hybrids than are P. jordani and P. metcalfi.
This finding is consistent with observations that P. teyahalee is the most ecologically
(based on elevation differences in species ranges) and morphologically (Highton and
Peabody 2000) divergent of the three species. The group of models with moderate ΔAIC

79
values show interesting trends, although the results are not significant (i.e., residual
deviances have P-values < 0.05). One trend observed in the general linear model results is
the overrepresentation of P. jordani homozygotes at the nuclear marker, which suggests
P. jordani hybrids are more likely to backcross with P. jordani than with P. metcalfi.
Another trend is the atypical patterns of P. jordani and P. metcalfi mtDNA, which
reflects an overrepresentation of P. metcalfi mtDNA and a subsequent
underrepresentation of P. jordani mtDNA.
The pattern of differential introgression that is observed in the combined dataset is
clearly seen in three of the four individual transects: Balsam Mountain, Palmer Creek,
and Mt Sterling. A second pattern that emerges is the general concordance of nuclear
DNA and morphology across all four transects. In the Balsam Mountain transect, where
hybridization occurs predominately between P. jordani and P. metcalfi, there is a shift of
P. metcalfi mtDNA northwards relative to P. jordani nuclear DNA and morphology
(Figure 3.3). Interestingly, this pattern is not seen in the Hyatt Ridge transect (Figure
3.4). One possible reason for this discrepancy is that Hyatt Ridge, while extending north
into the range of P. jordani, does not extend into the range of pure P. metcalfi in the
south. Rather, the ridge descends into a valley, i.e., into habitat that is unsuitable for P.
metcalfi and P. jordani. Thus, while gene flow from pure populations of P. jordani may
occur from the north, there is currently no such gene flow from pure P. metcalfi in the
south. In the Palmer Creek and Mt Sterling transects there is a clear discordance, with P.
jordani mtDNA being restricted to the highest elevations sampled despite the presence of
P. jordani nuclear DNA and morphology extending much of the way to the valley below
(Figures 3.5 and 3.6).

80
Numerous studies have documented differential introgression of mtDNA relative
to nuclear DNA and morphology (Funk and Omland 2003, Chan and Levin 2005). Many
of these are phylogenetic studies between closely related species that share select mtDNA
haplotypes, suggesting a pattern of current or historic mtDNA gene flow (e.g., Weisrock
and Larson 2006, Linnen and Farrell 2007). Many other cases documenting mtDNA
introgression come from studies of naturally occurring hybrid zones showing shifts in
clines of mtDNA relative to nuclear DNA and morphology (e.g., Arntzen and Wallis
1991, Sequeira et al. 2005, Vörös et al. 2006, Brito 2007, Hofman and Szymura 2007,
Leaché and Cole 2007, Kawakami et al. 2008). Natural selection has been proposed as a
source of discordance between mtDNA and nuclear markers in some systems (e.g.,
Doiron et al. 2002, Bachtrog et al. 2006). In this system, positive selection acting on P.
metcalfi mtDNA would yield a pattern of differential introgression. This hypothesis is
difficult to test, and selection remains a possible cause of discordance in this system.
Another hypothesis that accounts for the differential introgression seen in the
Balsam Mountain transect is that the hybrid zone is moving southward into the range of
P. metcalfi. Since mtDNA is maternally inherited, under this scenario, the absence of P.
jordani mtDNA from the expanding front may be a result of mating asymmetry as found
by Reagan (1992). That study used laboratory crosses and measured two different proxies
of mating success, spermatophore deposition and insemination. Heterospecific crosses
between female P. metcalfi and male P. jordani yielded about a 10% mating success rate,
while the reverse cross yielded only a 1% success rate. (It should be noted that laboratory
crosses between homospecifics yields only about a 5% mating success rate for P. jordani
and a 16% success rate for P. metcalfi.) These data indicate strong mating asymmetry,

81
and may have given rise to the pattern of differential introgression observed in the
Balsam Mountain transect.
A second possible mechanism for hybrid zone movement is dispersal asymmetry.
Asymmetrical dispersal of female P. metcalfi would result in a pattern of displacement of
P. metcalfi mtDNA relative to that of P. metcalfi nuclear DNA and morphology. While
no data are available on dispersal of P. jordani, P. metcalfi, and P. teyahalee, numerous
studies have estimated the related measure of home range size (Table 6). Madison and
Shoop (1970) found that P. metcalfi males had home ranges that were five times greater
than those estimated for females, although sample sizes used in this study were small
(nmales = 2, nfemales = 4). Studies on P. jordani and P. teyahalee showed asymmetries
between the sexes that are similar in magnitude and direction (Merchant 1972, Nishikawa
1990). Given the strength and direction of asymmetry in home range size, it is unlikely
that asymmetrical dispersal of female P. metcalfi is a valid explanation for the pattern of
hybrid zone movement observed in this study.
Similar hypotheses of hybrid zone movement have been proposed by other
researchers. García-París et al. (2003) documented a moving hybrid zone between
populations of fire salamanders of the genus Salamandra on the Iberian Peninsula. In that
study, the authors found strong discordance between mtDNA on the one hand and
allozymes, morphology, and life history on the other. Similarly to the study presented
here, male-biased dispersal in Salamandra rules out the possibility that female dispersal
played a role in the observed pattern of differential introgression. The authors also
conclude that sexual asymmetry is likely important, but provide no definitive evidence
for it. In another study, Rohwer et al. (2001) examined hybridization between warbler

82
species of the genus Dendroica from the Pacific Northwest. Patterns of differential
introgression between mtDNA and a suite of morphological markers led the researchers
to conclude that the hybrid zone is moving. Independent observations on behavior and
inferences from historical data suggest mating asymmetry may be the cause of hybrid
zone movement in that system.
Hairston et al. (1992) made the assumption that red cheek pigmentation is
neutrally diffusing across the P. jordani-P. metcalfi hybrid zone. Based on the most
recent warming period during the Hypsithermal Interval (~5,000 years ago; see Pielou
1991), the authors hypothesized that populations of P. jordani and P. metcalfi migrated
along the Balsam Mountain ridgeline from their mountain top refuges and met near the
center of the hybrid zone as inferred by the authors. However, the expanded and finer-
scale sampling performed in this study uncovered extensive hybridization farther north
than that documented by Hairston et al. (1992), thus nearly doubling the width of the
hybrid zone. Furthermore, this study documents a non-clinal transition between the
parental species, which suggests a much more complex biogeographic history than the
one outlined by Hairston et al. (1992). A more likely scenario is that repeated bouts of
isolation and secondary contact throughout the Pleistocene (perhaps as early as eight
million years ago, i.e., shortly after molecular clock estimates place the date of
divergence; Highton 1995, Kozak et al. 2005, Wiens et al. 2006), have left a more
complex, geographically reticulate pattern of hybridization.
Patterns of differential introgression seen in the Palmer Creek and Mt Sterling
transects suggest P. jordani may be expanding downslope into the range of P. teyahalee
as well. The dynamics of hybridization, however, may differ somewhat from those found

83
between P. jordani and P. metcalfi. First, there is likely to be differential adaptation of
the parental species because P. teyahalee is restricted to low elevations, while P. jordani
and P. metcalfi are only found at high elevations; the parental species belong to different
species complexes (P. jordani and P. metcalfi belong to the P. jordani complex and P.
teyahalee belongs to the P. glutinosus complex) and are morphologically more
differentiated from one another than P. jordani is from P. metcalfi (Highton and Peabody
2000); and previous studies (Hairston 1980a, 1980b, 1983a, Hairston et al. 1987, Adams
2004) have demonstrated that competitive interactions play a role in the distributions of
P. jordani and P. teyahalee. Second, P. jordani and P. metcalfi occur at a greater density
than P. teyahalee (Highton 1970, Merchant 1972, Hairston 1980a, 1980b). Population
density is one determinant of hybrid zone structure and, when asymmetrical, may result
in the movement of the hybrid zone towards the less dense parental species (Barton and
Hewitt 1985).
An additional line of evidence that the hybrid zone between P. jordani and P.
metcalfi is dynamic comes from ecological niche modeling. A fine-scale analysis of
habitat suitability values along the Balsam Mountain transect (Figures 3.3 and 3.7)
suggests the hybrid zone may lie in an ecotonal area where highly suitable habitats
between P. jordani and P. metcalfi meet. Models depict highly suitable P. metcalfi
habitat at areas surrounding, but not including, the highest elevations of the Balsam
Mountain ridgeline. The highest elevations are currently occupied by populations
containing predominantly P. jordani mtDNA, nuclear DNA, and morphology. Recent
work suggests the ranges of P. jordani and P. metcalfi are influenced by climate (Chapter

84
IV). Therefore, the observed mtDNA “footprint” may reflect a past distribution of P.
metcalfi, with movement of the hybrid zone tracking changes in suitable habitat.
The results of the ecological niche modeling highlight the importance of elevation
in determining the position and structure of the hybrid zone. Climatic conditions along
elevational gradients are likely to involve temperature and moisture, two variables that
have been implicated in amphibian range restrictions in previous studies (Daszak et al.
2005, McMenamin et al. 2008). In this study, the two variables with the greatest
explanatory power, precipitation in the driest month (BIO14) and precipitation in the
driest quarter (BIO17), clearly indicate that moisture is important in determining the
ranges of P. jordani and P. metcalfi. Further support for the importance of elevation in
determining the structure of the hybrid zone comes from the presence of P. teyahalee in
the vicinity of Pin Oak Gap. At an elevation of 1,348 m, Pin Oak Gap is a low point in
the otherwise high elevation of the Balsam Mountain ridgeline, and the presence of P.
teyahalee in this area suggests P. jordani and P. metcalfi may be at a competitive
disadvantage.
One interesting observation is that early studies on P. jordani morphology show
that red cheek pigmentation has an aposematic function, serving as a warning to potential
predators (Huheey 1960, Brodie and Howard 1973, Hensel and Brodie 1976). While not
toxic, all three species are noxious, and when disturbed, such as during a predator attack,
copious amounts of glandular secretions are released from the skin (Huheey 1960, Brodie
and Howard 1973, Hensel and Brodie 1976, Brodie et al. 1979, pers. obs.). Another
plethodontid salamander, Desmognathus imitator, is likely a Batesian mimic of P.
jordani, with about 25% of the population possessing red cheeks like their noxious model

85
(Orr 1968, Brodie and Howard 1973). Aposematism and mimicry of red cheek
pigmentation suggests this trait is under positive selection, and hybrids possessing at least
some red pigmentation may have a selective advantage. If this were the case, increased
fitness of red-cheeked populations may be another explanation for the patterns of
introgression observed in this study. Additional work on the introgression of this
morphological trait is needed.
The results presented here suggest that the range of P. jordani is currently
expanding southwards, and possibly downslope as well. This finding reflects a complex
and dynamic biogeographic history of repeated isolation and contact that likely results
from climatic oscillations and shifting habitat. Accordingly, the extensive occurrence of
P. metcalfi mtDNA may best be viewed as a relict, i.e, a footprint of the historic range of
P. metcalfi that cannot be eliminated because of mating asymmetry. Other studies have
documented the same phenomenon of a moving hybrid zone that leaves a “wake” of
mtDNA occupying the former range of the retreating species (Rohwer et al. 2001,
García-París et al. 2003, Leaché and Cole 2007). Furthermore, severely limited dispersal
abilities (as suggested by small home range sizes; Table 6), long generation times (every
other year beginning at four years of age for P. jordani and P. metcalfi; Hairston 1983b),
and stasis during the 18-year study period of Hairston et al. (1992) suggest this hybrid
zone may be moving very slowly. Results from the ecological niche modeling further
suggest that the hybrid zone may shift in response to changing climates, continually
tracking suitable habitats. Hairston et al.’s (1992) hypothesis of neutral diffusion gives
way to one of hybrid zone movement and differential introgression on an evolutionary
time scale not readily measured by ecological studies (Dasmahapatra et al. 2002).

86
Figure 3.1. (A) Map of study area showing collection localities of parental (Plethodon
jordani, P. metcalfi, and P. teyahalee) and hybrid samples. Inset depicts location of study
within the continental United States. (B) Expanded map of hybrid zones from A showing
collection localities of hybrid samples. In both A and B, darkened areas = high elevation
and light areas = low elevation.

87

88
Figure 3.2. (A) Map of the mtDNA ND2 gene with adjacent tRNA genes and relative
positions of forward (MC001) and reverse (MC002) primers. Expanded sections of the
gene show the six base pair restriction enzyme (BanI and MfeI) recognition sites and cut
sites (indicated by “/”). (B) Partial map of nuclear ILF3 gene showing relative positions
of the middle exon and two introns and the forward (MC003) and reverse (MC004)
primers. Expanded section depicts SNPs (in bold) that, when used in tandem, are
diagnostic for Plethodon jordani, P. metcalfi, and P. teyahalee. Base pairs are indicated
below arrows in both A and B. Maps are not drawn to scale.

89
ND2 tRNAAla tRNATrp
A
G/GAACC C/AATTG
0 178
846
1,1261,041
MfeIMC001 MC002BanI
472
B
0
P. jordani TACCTATATGG
P. metcalfi TACCTATGTGG
P. teyahalee TACTTATGTGG
Intron IntronExon
278
MC003 MC004
133 137

90
Figure 3.3. Map of Balsam Mountain showing transect (bold line), collection localities,
sample sizes, marker scores, and habitat suitability values. Pie charts are interpreted as
follows: (1) proportion of samples at a given locality that are diagnostic for each parental
species, (2) proportion of alleles at a given locality that are diagnostic for each parental
species, (3) the average scaled cheek pigmentation score (i.e., average score divided by
the average for pure parental Plethodon jordani), and (4) the proportion of animals that
have at least some white flecks. Habitat suitability values are extracted from the
ecological niche models presented in Figure 3.7 and are given as a percentage from 0 to
100. Note that more than one collection locality may lie within a single grid cell;
therefore, identical values may not be independent from one another.

91
N1 km
TB
LU
DB
GF
BI
LG
BH
BG
LB
LC
PO
PC
FR
SM
SP
BB
CM
HC
CB
CA
PG
ST
WK
HT
15
15
15
15
15
5
10
10
10
13
10
11
10
10
10
9
9
10
10
10
10
11
5
16
100
100
100
100
100
100
100
100
100
100
100
99.8
100
75.8
100
100
100
100
75.5
75.8
75.8
75.8
75.8
76.2
46.5
46.6
47.1
92.23
47
46.7
95.9
92.4
86.1
90.7
90.1
87.8
89
66.6
91.2
91.2
100
46.9
47.2
66.7
100
100
100
91.5
P. jordani P. metcalfi P. teyahalee
P. metcalfi / P. teyahalee P. jordani / P. metcalfi
Legend:

92
Figure 3.4. Map of Hyatt Ridge showing transect (bold line), collection localities, sample
sizes, and marker scores. Interpretation of marker scores is as given in Figure 3.3.
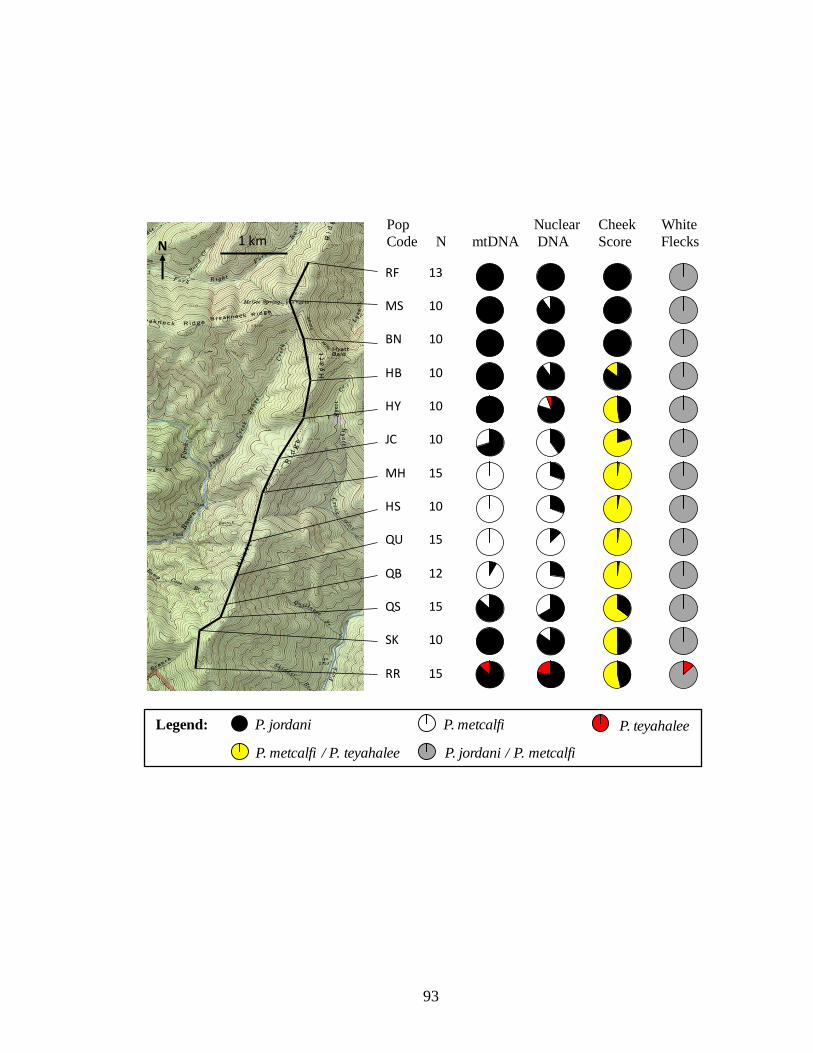
93
N 1 km
13
10
10
10
10
10
15
10
15
12
15
10
15
RF
MS
BN
HB
HY
JC
MH
HS
QU
QB
QS
SK
RR
P. jordani P. metcalfi P. teyahalee
P. metcalfi / P. teyahalee P. jordani / P. metcalfi
Legend:
Pop Nuclear Cheek White
Code N mtDNA DNA Score Flecks

94
Figure 3.5. Map of Palmer Creek showing transect (bold line), collection localities,
sample sizes, and marker scores. Interpretation of marker scores is as given in Figure 3.3.

95
N 1 km
PC TR BC BD BFBE BJ BK
11 5 16 14 1314 5 8
P. jordani P. metcalfi P. teyahalee
P. metcalfi / P. teyahalee P. jordani / P. metcalfi
Legend:
Pop Code
N
mtDNA
Nuclear DNA
Cheek Score
White Flecks

96
Figure 3.6. Map of Mt Sterling showing transect (bold line), collection localities, sample
sizes, and marker scores. Interpretation of marker scores is as given in Figure 3.3.

97
N 1 km
ZM ZL ZK ZJ ZI ZH ZG ZF ZE ZD ZC ZB ZA
8 12 12 12 13 12 10 12 11 11 12 10 5
P. jordani P. metcalfi P. teyahalee
P. metcalfi / P. teyahalee P. jordani / P. metcalfi
Legend:
Pop Code N mtDNA Nuclear DNA Cheek Score White Flecks

98
Figure 3.7. Ecological niche modeling results showing present-day predicted geographic
distributions for P. jordani (A) and P. metcalfi (B). For comparison, collection localities
are shown for both P. jordani (+) and P. metcalfi (□). Inner boxes encompass hybrid zone
and are expanded to show sampling localities (Δ) along the Balsam Mountain transect.
Colors indicate habitat suitability values as assigned by Maxent, and are given as
percentages (cumulative probability x 100; see text for more detail).

99
A
0 – 2020 – 4040 – 6060 – 8080 – 100

100
B

101
Table 3.1. Climatic variables1 used in creation of ecological niche models.
Percent for Percent for
Variables2 Description P. jordani
3 P. metcalfi
3
BIO1 Annual Mean Temperature 3.3 3.5
BIO2 Mean Diurnal Range 0.2 0
BIO3 Isothermality 0 0.1
BIO4 Temperature Seasonality 1.1 1
BIO5 Max Temperature of Warmest Month 0 0
BIO6 Min Temperature of Coldest Month 0 0
BIO7 Temperature Annual Range 0.1 0
BIO8 Mean Temperature of Wettest Quarter 2.1 0.2
BIO9 Mean Temperature of Driest Quarter 0 0.5
BIO10 Mean Temperature of Warmest Quarter 2 1.5
BIO11 Mean Temperature of Coldest Quarter 0.2 0
BIO12 Annual Precipitation 0.6 0.2
BIO13 Precipitation of Wettest Month 0.2 0.1
BIO14 Precipitation of Driest Month 19.4 53.4
BIO15 Precipitation Seasonality 6.9 7.9
BIO16 Precipitation of Wettest Quarter 0 0
BIO17 Precipitation of Driest Quarter 58 31.3
BIO18 Precipitation of Warmest Quarter 5.4 0
BIO19 Precipitation of Coldest Quarter 0.3 0.5 1 Variables are as given on the WorldClim database, available at www.worldclim.org/bioclim.htm.
2 Variable names are as assigned by WorldClim.
3 Given as a percent contribution for model predictions for Plethodon jordani and P. metcalfi.

102
Table 3.2. Summary of salamander samples from the hybrid zone that are classified by
their nuclear and mtDNA haplotypes. The number of animals with at least some red on
their cheeks and with at least some white flecks are given in parentheses, respectively.
mtDNA
Nuclear DNA P. jordani P. metcalfi P. teyahalee
P. jordani / P. jordani 180 (177,1) 168 (142,2) 15 (10,6)
P. metcalfi / P. metcalfi 4 (3,0) 96 (12,3) 2 (0,2)
P. teyahalee / P. teyahalee 0 (0,0) 5 (3,1) 47 (2,42)
P. jordani / P. metcalfi 28 (27,0) 67 (25,3) 1 (0,0)
P. jordani / P. teyahalee 8 (8,1) 15 (10,2) 9 (5,5)
P. metcalfi / P. teyahalee 0 (0,0) 0 (0,0) 0 (0,0)

103
Table 3.3. Contingency table showing individual sample data used to test for differential
patterns of introgression.
mtDNA nuclear DNA
Species Obs. Exp. Obs. Exp. Total
Plethodon jordani 227 365 868 730 1095
P. metcalfi 369 235 336 470 705
P. teyahalee 82 78 152 156 234
Total 678 678 1356 1356 2034

104
Table 3.4. Contingency table showing sample localities classified by their most common
haplotype.
mtDNA nuclear DNA
Species Obs. Exp. Obs. Exp. Total
Plethodon jordani 27 36 45 36 72
P. metcalfi 35 27.5 20 27.5 55
P. teyahalee 12 10.5 9 10.5 21
Total 74 74 74 74 148

105
Table 3.5. Results of general linear models (GLMs) showing the Akaike information
criterion values (given as ΔAIC), residual deviances (and associated degrees of freedom),
and significance levels.
Residual
Model ΔAIC1 Deviance
2 D.F.
3 P-value
4
Null 387.3449 405.4704 10 6.4467 x 10-81
Symmetrical 55.6383 69.7638 8 5.4763 x 10⁻¹²
Asymmetrical5
P. metcalfi / P. teyahalee - - - -
P. metcalfi / P. metcalfi 57.0183 69.1439 7 2.2001 x 10⁻¹²
P. jordani / P. metcalfi 54.0597 66.1852 7 8.6866 x 10⁻¹²
P. jordani / P. teyahalee 54.0597 66.1852 7 8.6866 x 10⁻¹²
P. jordani 15.8975 24.0230 5 2.1491 x 10⁻⁴
P. metcalfi 13.2398 21.3654 5 6.9090 x 10⁻⁴
P. jordani / P. jordani 12.8195 24.9450 7 7.7603 x 10⁻⁴
P. teyahalee / P. teyahalee 1.8222 13.9477 7 0.052120
P. teyahalee 0.0000 8.1255 5 0.14950 1 Akaike information criterion values given as the difference from the best model.
2 Residual deviance is a measure of the goodness-of-fit of a model to the data. Higher values indicate more
variation is unaccounted for by the model and, therefore, lower values indicate models with a better fit. 3 Degrees of freedom of the residual deviance.
4 Insignificant residual deviance (P > 0.05) means the residual variance is adequately explained as sampling
error and, therefore, the model is an adequate description of the data. Insignificant residual P-values are
given in bold. 5 Results for all nine possible asymmetrical models are given (except for P. metcalfi / P. teyahalee
heterozygotes since none were found at the nuclear marker).

106
Table 3.6. Home range sizes in m2 (sample sizes given in parentheses) for males and
females of Plethodon jordani, P. teyahalee, and P. metcalfi.
Species Males Females Reference
P. jordani 5.0 (3) 1.9 (4) Nishikawa 1990
11.5 (>10) 2.8 (>10) Merchant 1972
P. teyahalee 0.5 (3) 1.0 (8) Nishikawa 1990
14.4 (<10) 6.5 (>10) Merchant 1972
P. metcalfi 51.5 (2) 11.8 (4) Madison and Shoop 1970

107
Appendix 3.1. Collection localities, sites codes, elevation, and latitude and longitude for
animals captured in the hybrid zones.
Transect Site Code Elev. (m) Latitude Longitude
Balsam Mountain PG 1609 35.56391995 -83.16177777
CA 1719 35.57600245 -83.16661544
SM 1719 35.61182943 -83.17341010
PC 1390 35.62587308 -83.17494958
PO 1402 35.63506813 -83.18189032
BG 1597 35.64780588 -83.20261272
BB 1743 35.60265632 -83.18266536
CM 1780 35.59448665 -83.18429759
HC 1707 35.58762766 -83.18325042
CB 1792 35.57927508 -83.17757258
LC 1475 35.63881075 -83.19269241
FR 1402 35.61897075 -83.18275550
LB 1548 35.64003041 -83.20141642
SP 1707 35.60772728 -83.17742746
BH 1707 35.65601586 -83.19533869
LG 1670 35.66442415 -83.18705236
ST 1597 35.55633270 -83.16211448
DB 1768 35.68424458 -83.20981273
BI 1707 35.67418439 -83.19162726
HT 1402 35.53020408 -83.17087478
LU 1829 35.68998283 -83.21979420
TB 1804 35.69133307 -83.23495880
GF 1634 35.67858068 -83.20113841
WK 1634 35.54805040 -83.15396128
Hyatt Ridge HS 1414 35.60886296 -83.24311502
JC 1719 35.61778960 -83.23911412
HB 1500 35.62823755 -83.23473519
MS 1536 35.63775908 -83.23799285
QB 1512 35.60026432 -83.24643994
SK 1500 35.59652094 -83.24994428
RR 1378 35.59175893 -83.25007582
MH 1390 35.61473777 -83.24179986
QS 1512 35.59844068 -83.24803346
QU 1524 35.60440438 -83.24534156
HY 1414 35.62363991 -83.23620805
RF 1481 35.64342471 -83.23435206
BN 1536 35.63347478 -83.23522333
Palmer Creek BE 1122 35.63002728 -83.15551872
PC 1390 35.62587308 -83.17494958
TR 1305 35.62835489 -83.16980536
BD 1219 35.62859372 -83.16005132
BC 1280 35.62936480 -83.16579152
BF 1061 35.63301985 -83.15201048

108
BJ 1000 35.63377620 -83.14348422
BK 951 35.63799563 -83.13179235
Mt Sterling ZI 1768 35.69926099 -83.12346552
ZB 1207 35.69795847 -83.09910776
ZE 1451 35.69957733 -83.10909630
ZD 1329 35.69787315 -83.10758163
ZL 1585 35.69144561 -83.12905953
ZM 1561 35.68843010 -83.13338816
ZK 1646 35.69491291 -83.12619018
ZJ 1695 35.69779646 -83.12370294
ZH 1622 35.69982399 -83.11864002
ZF 1451 35.70187413 -83.11279277
ZG 1536 35.70117879 -83.11439897
ZC 1280 35.69900670 -83.10565542
ZA 1134 35.69457493 -83.09619011

109
Appendix 3.2. Collection localities, sites codes, elevation, and latitude and longitude for
parental taxa.
Species Site Code Elev. (m) Latitude Longitude
Plethodon jordani SH 1600 35.61192974 -83.41908953
JR 1524 35.56044427 -83.72307361
PE 1600 35.65003605 -83.30803398
GU 1951 35.70336446 -83.26300058
CS 1539 35.57753645 -83.60428684
VF 1353 35.51853193 -83.85393919
MB 1978 35.56004153 -83.50680322
CO 1573 35.72775821 -83.18706962
P. metcalfi WK 1609 35.54654147 -83.15465992
WR 1707 35.46220459 -83.13776387
TA 1695 35.29046957 -82.91683637
MP 1561 35.42294145 -82.75138204
CL 1631 35.40413851 -82.86246472
LK 1707 35.37606578 -83.03479743
P. teyahalee CK 1707 35.60772728 -83.17742746
VA 863 35.74326344 -83.27905659
VB 671 35.55596160 -83.31333018
VD 1329 35.62904920 -83.08786358
VE 881 35.61496116 -83.12378423
SB 975 35.62684900 -83.11931790

110
Appendix 3.3. Pure parental individuals (Plethodon jordani, P. metcalfi, and P.
teyahalee) and marker scores used in panel for marker development.
Site Indiv. SVL Cheek White
Species Code1 Code
2 (mm)
3 Score
4 Flecks mtDNA
5 nDNA
6
P. jordani MB 97 55 10 Absent J n/a
98 39 4 Absent J n/a
CO 306 43 3 Absent J n/a
307 48 10 Absent J n/a
SH 332 58 11 Absent J J/J
333 48 7 Absent J J/J
JR 340 41 7 Absent J J/J
341 42 11 Absent J J/J
PE 402 43 7 Absent J J/J
403 41 4 Absent J J/J
GU 435 47 12 Absent J n/a
436 55 12 Absent J J/J
437 36 6 Absent J n/a
438 67 8 Absent J J/J
CS 447 43 4 Absent J J/J
448 42 9 Absent J J/J
VF 942 43 3 Absent J J/J
944 47 4 Absent J J/J
P. metcalfi WK 64 53 0 Absent M M/M
65 60 0 Absent M M/M
66 65 0 Absent M M/M
WR 201 52 0 Absent M n/a
202 31 0 Absent M n/a
203 29 0 Absent M M/M
TA 372 49 0 Absent M n/a
373 38 0 Absent M M/M
374 32 0 Absent M M/M
375 45 0 Absent M n/a
376 48 0 Absent M M/M
377 54 0 Absent M n/a
MP 382 52 0 Absent M M/M
383 31 0 Absent M M/M
CL 424 30 0 Absent M M/M
425 50 0 Absent M M/M
426 55 0 Absent M n/a
427 31 0 Absent M n/a
LK 365 54 0 Absent M n/a
366 50 0 Absent M n/a
367 49 0 Absent M n/a
P. teyahalee CK 222 66 0 Present T T/T
223 27 0 Present T n/a
224 44 0 Present T T/T
VA 902 55 0 Present T T/T
VB 911 66 0 Present T T/T
912 65 0 Present T T/T
914 60 0 Present T n/a
VD 932 44 0 Present T T/T
VE 935 58 0 Present T T/T
937 43 0 Present T T/T
938 42 0 Present T n/a

111
SB 327 19 0 Present T n/a
329 69 0 Present T n/a 1 See Figure 1 and Appendix 1 for site locations.
2 Individual codes are those assigned by the author.
3 SVL (Snout Vent Length) was measured from the tip of the snout to the posterior end of the cloaca.
4 Cheek pigmentation was scored on a scale of 0 to 13, with 0 indicating a complete lack of red
pigmentation and 13 indicating extensive and bright red pigment. 5 As the mitochondrial genome is haploid, only a single haplotype is given.
6 As the nuclear genome is diploid, two haplotypes are given.

112
Appendix 3.4. Samples (arranged by transect) and marker scores for all samples used in
analyses.
Site Indiv. SVL Cheek White
Transect Code1 Code
2 (mm)
3 Score
4 Flecks mtDNA
5 nDNA
6
Balsam Mtn PG 1 35 0 Absent M J/M
2 50 0 Absent M M/M
3 52 0 Absent M J/J
4 36 0 Absent M J/J
5 58 0 Absent M J/M
6 54 0 Absent M J/J
7 48 0 Absent M J/M
8 50 0 Absent M J/M
9 54 1 Absent M J/J
10 57 0 Absent M M/M
CA 11 38 0 Absent M J/J
12 37 3 Absent M J/J
13 35 6 Absent M J/J
14 40 0 Absent M J/J
15 36 7 Absent M J/J
47 50 11 Absent M J/J
48 37 6 Absent M J/M
49 45 3 Absent M J/J
50 52 9 Absent M J/M
51 60 5 Absent M J/J
SM 16 54 9 Absent M J/M
17 58 0 Absent M J/J
18 53 10 Absent M J/J
19 41 2 Absent M J/J
20 57 11 Absent M J/J
21 43 9 Absent M J/J
22 50 11 Absent M J/J
23 49 10 Absent M J/T
24 51 9 Present M J/J
25 32 1 Absent M J/J
PC 26 30 0 Absent M M/M
27 38 1 Absent M J/J
28 43 0 Absent M M/M
29 52 0 Absent M J/M
30 29 0 Absent M J/M
32 45 0 Absent M J/M
33 50 0 Absent M M/M
34 47 0 Absent M J/M
35 50 0 Absent M M/M
36 50 9 Absent M J/J
PO 37 53 0 Absent M J/J
42 58 0 Absent M M/M
43 44 0 Absent M J/M
44 57 1 Absent M J/M
45 32 0 Absent M J/M
46 28 0 Absent M J/M
BG 52 67 10 Absent M J/J
53 63 7 Absent M J/J
54 61 8 Absent M J/J
55 38 12 Absent M J/J
56 47 0 Absent M J/J

113
57 60 5 Absent M J/J
58 58 4 Absent M J/J
59 64 2 Absent M J/T
60 55 4 Absent M J/J
61 33 8 Absent M J/J
BB 67 43 4 Absent J J/J
69 27 7 Absent J J/J
70 31 4 Absent J J/J
71 31 1 Absent J J/J
72 48 5 Absent J J/J
73 59 11 Absent J J/J
74 29 11 Absent J J/J
75 54 5 Absent J J/J
CM 77 60 3 Absent J J/J
78 54 1 Absent J J/J
79 43 1 Absent M J/J
80 55 10 Absent M J/J
81 45 4 Absent J J/J
82 70 11 Absent M J/J
83 58 6 Absent J J/J
84 46 2 Absent J J/J
85 60 3 Absent J J/J
HC 132 33 0 Absent M J/M
133 48 0 Absent M J/T
134 33 6 Absent M J/J
135 58 1 Absent M J/M
136 41 3 Absent M J/M
137 47 1 Absent M J/J
138 47 7 Absent M J/M
139 63 0 Absent M J/M
140 66 0 Absent M J/J
141 45 0 Absent M J/J
CB 142 54 0 Absent M M/M
143 48 4 Absent M J/J
144 60 0 Absent M M/M
145 48 0 Absent M M/M
146 65 0 Absent M M/M
147 61 0 Absent M M/M
148 55 0 Absent M M/M
149 45 5 Absent M J/J
150 47 0 Absent M M/M
151 57 0 Absent M M/M
LC 152 58 0 Present T J/J
153 56 2 Present T J/J
154 42 2 Absent M J/J
155 47 1 Absent M J/J
156 62 0 Present T T/T
157 37 0 Present T T/T
159 38 0 Present T J/J
160 41 1 Present M T/T
161 40 1 Present T T/T
193 41 0 Absent T T/T
194 39 0 Absent T J/T
195 55 0 Absent T J/M
FR 167 62 11 Absent M J/J
168 60 4 Absent M J/T

114
174 54 5 Absent M J/M
175 60 12 Absent M J/J
176 53 2 Absent M J/J
177 50 0 Absent M J/T
179 50 12 Absent T J/T
180 57 12 Absent M J/J
182 57 1 Absent T J/J
LB 183 57 10 Absent M J/M
184 52 1 Absent M M/M
185 56 1 Absent M J/M
186 64 0 Present M J/M
187 58 3 Absent M J/J
188 33 0 Absent M J/J
189 55 1 Absent M J/T
190 55 0 Absent M J/J
191 36 6 Absent M J/J
192 36 1 Absent M J/J
SP 281 33 5 Present M J/J
282 50 5 Absent J J/J
283 50 9 Absent J J/J
284 34 12 Absent M J/J
285 32 2 Absent M J/J
286 48 10 Absent M J/J
287 45 12 Present M J/J
288 49 13 Absent M J/J
289 50 11 Absent M J/J
290 56 8 Absent M J/J
BH 291 58 13 Absent J J/J
292 57 8 Absent J J/J
293 51 9 Absent M J/J
294 52 6 Absent M J/J
295 66 9 Absent J J/J
296 62 6 Absent J J/J
297 60 9 Absent J J/M
298 63 3 Absent J J/J
299 62 6 Absent M J/J
300 51 8 Absent J J/M
LG 301 60 10 Absent M J/J
302 60 12 Absent M J/J
303 48 3 Absent M J/J
304 50 4 Absent M J/J
305 62 6 Absent M J/J
TR 317 41 0 Absent M M/M
318 46 0 Absent M M/M
319 50 1 Present M J/M
320 42 0 Absent M M/M
321 41 1 Present M M/M
ST 526 39 0 Absent M M/M
527 32 0 Absent M M/M
528 49 0 Absent M J/M
529 53 0 Absent M M/M
530 53 0 Absent M M/M
531 42 0 Absent M M/M
532 50 0 Absent M M/M
533 38 0 Absent M M/M
534 36 0 Absent M J/J

115
535 44 0 Absent M J/M
536 47 0 Absent M M/M
DB 537 53 7 Absent J J/J
538 45 8 Absent J J/J
540 48 4 Absent M J/J
541 55 7 Absent J J/J
542 54 11 Absent J J/M
543 53 6 Absent J J/J
544 44 4 Absent J J/J
545 59 7 Absent J J/J
546 62 10 Absent J J/J
547 51 8 Absent M J/J
548 49 9 Absent J J/J
549 63 8 Absent M J/J
550 54 11 Absent J J/J
551 59 12 Absent M J/J
BI 552 36 9 Absent M J/J
554 48 10 Absent J J/J
555 32 10 Absent J J/J
556 30 11 Absent J J/J
557 34 9 Absent J J/J
558 54 12 Absent M J/J
559 54 10 Absent M J/J
560 53 9 Absent J J/J
561 60 11 Absent M J/J
562 50 7 Absent J J/J
563 53 10 Absent J J/J
564 37 9 Absent M J/J
565 30 9 Absent M J/M
566 30 7 Absent M J/J
GF 567 43 12 Absent J J/M
569 52 9 Absent M J/J
570 55 10 Absent M J/J
571 55 9 Absent J J/M
572 54 12 Absent J J/M
573 71 9 Absent J J/J
574 53 10 Absent M J/M
575 55 7 Absent M J/J
576 47 9 Absent M J/J
577 53 9 Absent M J/J
579 63 8 Absent J J/J
580 52 10 Absent M J/J
581 46 12 Absent J J/J
HT 582 46 0 Absent M M/M
583 41 0 Absent M M/M
584 33 0 Absent M M/M
585 53 0 Absent M M/M
586 48 0 Absent M M/M
587 49 0 Absent M M/M
588 49 0 Absent M M/M
589 34 0 Absent M M/M
590 48 0 Absent M M/M
591 51 0 Absent M M/M
592 45 0 Absent M M/M
593 58 0 Absent M M/M
594 36 0 Absent M M/M

116
595 40 0 Absent M M/M
596 53 0 Absent M M/M
597 65 0 Present T M/M
BU 665 54 6 Absent M J/J
666 54 12 Absent M J/J
667 56 7 Absent M J/M
668 62 9 Absent M J/J
669 63 8 Absent M J/J
670 51 5 Absent M J/J
671 56 11 Absent M J/J
672 30 9 Absent M J/J
673 59 10 Absent M J/J
674 34 12 Absent M J/J
675 50 10 Absent M J/J
676 55 8 Absent M J/J
677 45 10 Absent M J/J
678 32 4 Absent J J/J
679 59 12 Absent J J/J
BA 680 38 3 Absent M J/J
681 62 13 Absent M J/J
682 50 10 Absent M J/J
683 53 10 Absent M J/J
684 55 9 Absent M J/J
685 37 5 Absent M J/J
686 41 8 Absent M J/J
687 56 10 Absent M J/J
688 31 7 Absent M J/J
689 54 10 Absent M J/J
690 56 11 Absent M J/J
691 53 6 Absent M J/J
692 60 10 Absent M J/J
694 37 6 Absent M J/J
LU 695 49 5 Absent J J/J
696 55 7 Absent J J/J
697 63 5 Absent J J/J
698 53 6 Absent J J/J
699 52 11 Absent J J/J
700 54 10 Absent J J/J
701 41 1 Absent J J/J
702 64 9 Absent J J/J
703 55 7 Absent J J/J
704 50 6 Absent J J/J
705 49 10 Absent J J/J
706 54 9 Absent J J/J
707 58 6 Absent J J/J
708 53 6 Absent J J/M
709 59 4 Absent J J/M
TB 710 40 6 Absent J J/M
711 50 12 Absent J J/J
712 44 4 Absent J J/J
713 32 3 Absent J J/J
714 44 6 Absent J J/J
715 53 5 Absent J J/M
716 39 9 Absent J J/J
717 54 7 Absent J J/J
719 55 6 Absent J J/J

117
720 50 6 Absent J J/J
721 47 7 Absent J J/J
722 36 7 Absent J J/J
723 57 11 Absent J J/J
724 50 11 Absent J J/M
Hyatt Ridge HS 231 52 2 Absent M J/M
232 52 0 Absent M J/J
233 45 0 Absent M J/M
234 56 0 Absent M J/J
235 47 0 Absent M M/M
236 43 0 Absent M M/M
237 38 0 Absent M M/M
238 37 0 Absent M M/M
239 42 0 Absent M M/M
240 48 0 Absent M M/M
JC 241 55 6 Absent J J/M
242 35 1 Absent J J/M
243 53 4 Absent J J/M
244 31 1 Absent J J/M
245 55 8 Absent J J/M
246 55 0 Absent J J/M
247 37 0 Absent J M/M
248 32 0 Absent M J/M
249 33 0 Absent M M/M
250 28 0 Present M J/M
HB 251 59 4 Absent J J/J
252 59 1 Absent J J/J
253 32 4 Present J J/J
254 60 12 Present J J/M
255 59 10 Absent J J/J
256 65 4 Absent J J/J
257 54 4 Absent J J/J
258 55 6 Absent J J/J
259 62 5 Absent J J/J
260 48 4 Absent J J/M
MS 261 49 10 Absent J J/J
262 21 5 Absent J J/J
263 51 6 Absent J J/J
264 39 5 Absent J J/J
265 53 10 Absent J J/J
266 60 12 Present J J/J
267 58 8 Absent J J/J
268 52 8 Absent J J/J
269 45 5 Absent J M/M
270 58 7 Absent J J/J
QB 350 46 0 Absent M M/M
351 51 0 Absent M M/M
352 43 0 Absent M J/J
353 43 0 Absent M M/M
355 43 0 Absent M J/M
356 33 1 Absent J J/J
357 52 0 Absent M J/M
358 41 0 Absent M M/M
359 53 0 Absent M M/M
360 44 1 Absent M M/M
361 54 0 Absent M M/M

118
SK 392 46 4 Absent J J/J
393 41 3 Absent J J/J
394 53 6 Absent J M/M
395 53 5 Absent J J/M
396 42 6 Absent J J/J
397 30 0 Absent J J/J
398 51 1 Absent J J/J
399 35 3 Absent J J/J
400 47 2 Absent J J/J
401 53 1 Absent J J/J
RR 457 38 0 Present T T/T
459 51 1 Absent J J/J
460 51 1 Absent J J/J
461 33 6 Absent J J/T
462 50 4 Absent J J/J
463 55 5 Absent J J/J
464 54 5 Absent J J/J
465 41 3 Absent J J/J
466 34 3 Absent J J/T
467 45 5 Absent J J/J
468 49 3 Absent J J/J
469 50 4 Absent J J/J
470 31 2 Absent J J/J
471 56 0 Present T T/T
MH 471 50 0 Absent M M/M
472 34 0 Absent M M/M
473 45 0 Absent M J/M
474 52 0 Absent M J/J
475 53 1 Absent M J/M
476 54 0 Absent M M/M
477 40 0 Absent M M/M
478 38 0 Absent M M/M
479 47 0 Absent M M/M
480 47 0 Absent M M/M
481 30 0 Absent M M/M
482 48 0 Absent M J/J
483 54 0 Absent M J/M
484 53 1 Absent M J/M
485 42 0 Absent M J/M
QS 486 36 1 Absent J J/M
487 58 3 Absent J J/M
488 52 2 Absent J J/J
489 49 1 Absent J J/M
490 33 5 Absent J J/M
491 44 0 Absent M M/M
492 41 0 Absent J J/J
493 48 4 Absent J J/M
494 48 4 Absent J J/J
495 60 1 Absent M J/M
496 43 1 Absent J J/M
497 46 3 Absent J J/J
498 45 2 Absent J J/J
499 54 4 Absent J J/J
500 36 2 Absent J J/M
QU 501 43 0 Absent M J/M
502 45 0 Absent M M/M

119
503 44 0 Absent M J/M
504 48 0 Absent M M/M
505 44 0 Absent M M/M
506 55 0 Absent M M/M
507 49 1 Absent M M/M
508 48 0 Absent M M/M
509 56 0 Absent M M/M
510 58 1 Absent M M/M
511 52 0 Absent M M/M
512 60 0 Absent M M/M
513 38 0 Absent M M/M
514 33 0 Absent M J/M
515 41 0 Absent M J/M
HY 516 34 7 Absent J M/M
517 35 1 Absent J J/J
518 56 1 Absent J J/J
519 32 1 Absent J J/J
520 51 5 Absent J J/J
521 46 2 Absent J J/T
522 44 7 Absent J J/J
523 37 1 Absent J J/M
524 54 3 Absent J J/J
525 48 1 Absent J J/J
RF 642 51 8 Absent J J/J
643 36 8 Absent J J/J
644 42 3 Absent J J/J
645 44 11 Absent J J/J
646 50 11 Absent J J/J
647 58 10 Absent J J/J
648 59 7 Absent J J/J
649 58 9 Absent J J/J
650 36 10 Absent J J/J
651 32 9 Absent J J/J
652 57 11 Absent J J/J
653 54 6 Absent J J/J
654 32 5 Absent J J/J
BN 655 39 9 Absent J J/J
656 39 6 Absent J J/J
657 55 11 Absent J J/J
658 53 9 Absent J J/J
659 57 11 Absent J J/J
660 54 5 Absent J J/J
661 59 12 Absent J J/J
662 49 13 Absent J J/J
663 48 7 Absent J J/J
664 53 1 Absent J J/J
Palmer Creek BE 598 50 0 Absent M M/M
599 43 0 Absent M M/M
600 54 0 Absent M M/M
601 43 1 Present M J/J
602 55 0 Absent M M/M
603 46 0 Absent M M/M
604 47 0 Absent M J/M
605 46 0 Absent M M/M
606 38 0 Absent M J/M
607 49 0 Absent M M/M

120
608 52 0 Absent M J/J
609 49 0 Present M M/M
610 53 0 Absent M M/M
611 38 0 Present T T/T
BD 612 51 1 Absent M M/M
613 51 0 Present M M/M
614 49 0 Absent M M/M
615 53 0 Absent M J/M
616 49 1 Present M M/M
618 55 0 Present T T/T
619 69 0 Present T T/T
620 32 0 Absent M J/M
621 58 0 Present T T/T
622 33 0 Present T J/T
623 32 1 Absent M M/M
624 61 0 Present T T/T
625 63 0 Present T T/T
BC 626 48 1 Absent M M/M
627 48 0 Absent M J/M
628 55 0 Present M J/M
629 42 1 Absent M M/M
630 39 0 Absent M M/M
631 50 1 Absent M J/J
632 55 0 Absent M J/M
633 53 1 Absent M J/J
634 44 1 Absent M J/M
635 33 0 Absent M J/M
636 47 0 Absent M M/M
637 57 0 Absent M T/T
638 57 1 Present M M/M
639 53 0 Present T T/T
640 63 0 Present T T/T
641 64 0 Present T T/T
BF 725 43 0 Absent M J/M
726 44 0 Absent M M/M
727 38 0 Absent M J/M
728 40 0 Absent M M/M
729 47 0 Absent M M/M
730 55 0 Absent M M/M
731 54 1 Absent M J/J
732 56 0 Absent M J/J
733 46 0 Absent M J/M
734 55 0 Absent M J/M
735 48 3 Absent M J/M
736 40 1 Absent M J/M
737 55 0 Absent M M/M
BJ 738 57 1 Absent M M/M
739 48 0 Absent M J/M
740 40 1 Absent M J/M
741 38 0 Absent M M/M
742 66 0 Present T T/T
BK 743 52 0 Present T T/T
744 60 0 Present T T/T
745 61 0 Present T T/T
746 58 0 Present T T/T
747 69 1 Present T T/T

121
748 54 0 Present T T/T
749 70 0 Present T T/T
750 72 0 Present T T/T
Mt Sterling ZI 752 46 2 Present J J/T
753 48 8 Absent J J/J
754 56 5 Absent J J/J
755 50 5 Absent J J/J
756 36 3 Present J J/J
757 38 6 Absent J J/J
758 49 10 Absent J J/J
762 52 6 Absent J J/J
763 35 3 Absent J J/J
764 42 1 Absent M J/J
765 46 8 Absent M J/J
766 49 5 Absent M J/J
ZB 767 65 0 Present T T/T
768 52 0 Present T T/T
769 51 0 Present T T/T
770 76 0 Present T T/T
771 35 0 Present T T/T
772 53 0 Present T T/T
774 65 0 Present T T/T
777 36 0 Present T T/T
778 35 0 Present T T/T
779 57 0 Present T T/T
ZE 780 59 2 Absent T J/J
781 63 0 Present T J/T
782 56 0 Present M J/J
783 55 1 Present M T/T
784 43 0 Absent T J/J
785 54 0 Present M J/T
786 43 4 Present T J/J
787 57 5 Absent M J/T
788 55 0 Present T J/J
789 58 2 Absent T J/J
790 44 7 Present M J/T
ZD 791 49 0 Present T T/T
792 62 1 Absent M J/J
794 51 0 Present T T/T
795 49 1 Present T J/T
796 52 0 Present T T/T
797 59 0 Present T T/T
798 40 0 Present T T/T
799 48 0 Present T T/T
800 42 0 Present T T/T
801 63 0 Present T T/T
802 64 0 Present M J/T
ZL 951 39 6 Absent J J/J
952 34 5 Absent J J/J
953 36 7 Absent J J/J
954 52 6 Absent M J/J
955 50 4 Absent J J/J
956 57 9 Absent J J/T
957 53 3 Absent M J/J
958 52 2 Absent J J/J
959 54 8 Absent J J/J

122
960 50 7 Absent M J/J
961 52 3 Absent J J/J
962 45 8 Absent M J/J
ZM 963 43 4 Absent T J/J
964 53 4 Absent J J/J
965 48 4 Absent J J/J
966 57 8 Absent J J/J
967 58 9 Absent J J/T
968 54 7 Absent J J/J
969 44 6 Absent J J/J
970 53 10 Absent J J/J
971 44 4 Absent J J/J
972 46 11 Absent J J/J
ZK 973 47 8 Absent M J/J
974 53 8 Absent J J/J
975 56 7 Absent J J/J
976 53 1 Absent J J/J
977 53 6 Absent M J/J
978 38 7 Absent M J/J
979 59 8 Absent M J/J
980 53 2 Absent J J/J
981 44 10 Absent J J/J
982 50 3 Absent J J/J
983 48 5 Absent J J/J
984 47 6 Absent M J/J
ZJ 985 55 3 Absent J J/J
987 48 3 Absent J J/T
988 48 2 Absent J J/T
989 60 5 Absent M J/J
990 50 1 Absent J J/J
991 48 0 Absent J J/J
992 54 7 Absent M J/J
993 55 1 Absent J J/J
994 52 8 Absent J J/J
995 42 3 Absent J J/J
996 55 5 Absent J J/J
ZH 997 56 2 Absent M J/J
998 54 0 Absent M J/J
999 63 6 Absent M J/J
1000 55 8 Absent M J/J
1001 57 1 Absent M J/J
1002 62 2 Absent M J/J
1003 60 3 Absent M J/J
1004 60 5 Absent M J/J
1005 61 8 Absent M J/J
1006 48 3 Absent M J/J
1007 40 1 Absent M J/J
1008 34 7 Absent M J/T
ZF 1009 55 8 Absent M J/J
1010 44 5 Absent M J/J
1011 51 4 Absent M J/J
1012 56 2 Absent M J/T
1013 48 6 Absent M J/J
1014 51 5 Absent M J/J
1015 50 6 Absent T T/T
1016 54 1 Absent M J/J

123
1017 52 3 Absent M J/M
1018 45 6 Absent M J/J
1019 38 3 Absent M J/J
1020 41 9 Absent M J/M
ZG 1021 57 4 Absent M J/J
1022 51 6 Absent M J/J
1023 52 3 Absent M J/T
1024 53 4 Absent M J/J
1025 54 0 Absent M J/J
1026 41 7 Absent M J/J
1027 44 0 Absent M J/J
1028 38 8 Absent M J/J
1029 39 5 Absent M J/J
1030 55 9 Absent M J/J
ZC 1031 60 7 Absent T J/T
1032 49 4 Present T J/T
1033 37 3 Absent T J/J
1034 36 5 Present T J/J
1035 36 1 Absent M T/T
1036 35 0 Present T J/T
1037 35 5 Absent T J/J
1038 36 2 Absent M J/T
1039 50 0 Absent M J/T
1040 59 5 Absent T J/T
1041 64 1 Absent T J/J
1042 55 0 Present T J/J
ZA 1043 37 0 Present T T/T
1046 55 0 Present T T/T
1047 69 0 Present T T/T
1048 64 0 Present T T/T
1049 57 0 Present T T/T 1 See Figure 1 and Appendix 1 for site locations.
2 Individual codes are those assigned by the authors.
3 SVL (Snout Vent Length) was measured from the tip of the snout to the posterior end of the cloaca.
4 Cheek pigmentation was scored on a scale of 0 to 13, with a score of 0 indicating a complete lack of red
pigment and 13 indicating extensive and bright red pigment. 5 As the mitochondrial genome is haploid, only a single haplotype copy is given.
6 As the nuclear genome is diploid, two haplotypes are given.

124
Literature Cited
Adams, D. C. 2004. Character displacement via aggressive interference in Appalachian
salamanders. Ecology 85(10):2664-2670.
Agresti, A. 2007. An Introduction to Categorical Data Analysis. John Wiley and Sons,
Inc., New Jersey.
Arnold, M. L. 2006. Evolution through Genetic Exchange. Oxford University Press, New
York.
Arnold, M. L. and A. Meyer. 2006. Natural hybridization in primates: one evolutionary
mechanism. Zoology 109:261-276.
Arntzen, J. W. and G. P. Wallis. 1991. Restricted gene flow in a moving hybrid zone of
the newts Triturus cristatus and T. marmoratus in western France. Evolution
45(4):805-826.
Ayres, D. R., K. Zaremba, and D. R. Strong. 2004. Extinction of a common native
species by hybridization with a native congener. Weed Technology 18:1288-
1291.
Bachtrog, D., K. Thornton, A. Clark, and P. Andolfatto. 2006. Extensive introgression of
mitochondrial DNA relative to nuclear genes in the Drosophila yakuba species
group. Evolution 60(2):292-302.
Barton, N. H. 2001. The role of hybridization in evolution. Molecular Ecology 10:551-
568.
Barton, N. H. and G. M. Hewitt. 1985. Analysis of hybrid zones. Annual Review of
Ecology and Systematics 16:113-148.
Brito, P .H. 2007. Contrasting patterns of mitochondrial and microsatellite genetic
structure among Western European populations of tawny owls (Strix aluco).
Molecular Ecology 16:3423-3437.
Brodie, E. D., Jr. and R. R. Howard. 1973. Experimental study of Batesian mimicry in the
salamanders Plethodon jordani and Desmognathus ochrophaeus. The American
Midland Naturalist 90(1):38-46.
Brodie, E. D., Jr., R. T. Nowak, and W. R. Harvey. 1979. The effectiveness of
antipredator secretions and behavior of selected salamanders against shrews.
Copeia 2:270-274.
Brumfield, R. T., R. W. Jernigan, D. B. McDonald, and M. J. Braun. 2001. Evolutionary

125
implications of divergent clines in an avian (Manacus: Aves) hybrid zone.
Evolution 55(10):2070-2087.
Buggs, R. J. A. 2007. Empirical study of hybrid zone movement. Heredity 99:301-312.
Bull, V., M. Beltrán, C. D. Jiggins, W. O. McMillan, E. Bermingham, and J. Mallet.
2006. Polyphyly and gene flow between non-sibling Heliconius species. BMC
Biology 4:11.
Burnham, K. P. and D. R. Anderson. 2004. Multimodel inference: understanding AIC
and BIC in model inference. Sociological Methods and Research 33(2):261-304.
Chan, K. M. A. and S. A. Levin. 2005. Leaky prezygotic isolation and porous genomes:
rapid introgression of maternally inherited DNA. Evolution 59(4):720-729.
Coyne, J. A. and H. A. Orr. 2004. Speciation. Sinauer Associates, Inc., Massachusetts.
Darwin, C. 1859. On the Origin of Species by Means of Natural Selection or the
Preservation of Favoured Races in the Struggle for Life. John Murray, London.
Dasmahapatra, K. K., M. J. Blum, A. Aiello, S. Hackwell, N. Davies, E. P. Bermingham,
and J. Mallet. 2002. Inferences from a rapidly moving hybrid zone. Evolution
56(4):741-753.
Daszak, P., D. E. Scott, A. M. Kilpatrick, C. Faggioni, J. W. Gibbons, and D. Porter.
2005. Amphibian population declines at Savannah River Site are linked to
climate, not chytridiomycosis. Ecology 86(12):3232-3237.
Doiron, S., L. Bernatchez, and P. U. Blier. 2002. A comparative mitogenomic analysis of
the potential adaptive value of arctic charr mtDNA introgression in brook charr
populations (Salvelinus fontinalis Mitchill). Molecular Biology and Evolution
19(11):1902-1909.
Fitzpatrick, B. M. and H. B. Shaffer. 2007. Hybrid vigor between native and introduced
salamanders raises new challenges for conservation. Proceedings of the National
Academy of Sciences 104(40):15793-15798.
Funk, D. J. and K. E. Omland. 2003. Species-level paraphyly and polyphyly: Frequency,
causes, and consequences, with insights from animal mitochondrial DNA. Annual
Review of Ecology, Evolution and Systematics 34:397-423.
García-París, M., M. Alcobendas, D. Buckley, and D. B. Wake. 2003. Dispersal of
viviparity across contact zones in Iberian populations of fire salamanders
(Salamandra) inferred from discordance of genetic and morphological traits.
Evolution 57(1):129-143.

126
Grant, P. R., B. R. Grant, and K. Petren. 2005. Hybridization in the recent past. The
American Naturalist 166(1):56-67.
Hairston, N. G. 1950. Intergradation in Appalachian salamanders of the genus Plethodon.
Copeia 4:262-273.
Hairston, N. G. 1980a. The experimental test of an analysis of field distributions:
competition in terrestrial salamanders. Ecology 61(4):817-826.
Hairston, N. G. 1980b. Evolution under interspecific competition: field experiments on
terrestrial salamanders. Evolution 34(3):409-420.
Hairston, N. G. 1983a. Alpha selection in competing salamanders: experimental
verification of an a priori hypothesis. The American naturalist 122(1):105-113.
Hairston, N. G. 1983b. Growth, survival and reproduction of Plethodon jordani: trade-
offs between selective pressures. Copeia 4:1024-1035.
Hairston Sr, N. G., K. C. Nishikawa, and S. L. Stenhouse. 1987. The evolution of
competing species of terrestrial salamanders: niche partitioning or interference?
Evolutionary Ecology 1:247-262.
Hairston, N. G., Wiley, R. H., C. K. Smith, and K. A. Kneidel. 1992. The dynamics of
two hybrid zones in Appalachian salamanders of the genus Plethodon. Evolution
46(4):930-938.
Harrison, R. G. 1990. Hybrid zones: windows on the evolutionary process. Oxford
Surveys in Evolutionary Biology 7:69-128.
Hensel, Jr, J. L. and E. D. Brodie, Jr. 1976. An experimental study of aposematic
coloration in the salamanders Plethodon jordani. Copeia 1:59-65.
Highton, R. 1970. Evolutionary interactions between species of North American
salamanders of the genus Plethodon. Part I. Genetic and ecological relationships
of Plethodon jordani and P. glutinosus in the southern Appalachian Mountains.
Evolutionary Biology 4:211-241.
Highton, R. 1972. Distributional interactions among North American salamanders of the
genus Plethodon. Pp. 139-188 in Holt, P. C., ed. The distributional history of the
biota of the southern Appalachians. Research Division Monograph 4. Virginia
Polytechnic Institute and State University, Blacksburg, Virginia.
Highton, R. 1989. Biochemical evolution in the slimy salamanders of the Plethodon
glutinosus complex in the eastern United States. Part I. Geographic protein
variation. Illinois Biological Monographs 57:1-78.

127
Highton, R. 1995. Speciation in eastern North American salamanders of the genus
Plethodon. Annual Review of Ecology and Systematics 26:579-600.
Highton, R. and R. B. Peabody. 2000. Geographic protein variation and speciation in
salamanders of the Plethodon jordani and Plethodon glutinosus complexes in the
southern Appalachian mountains with the description of four new species. Pp. 31-
93 in Bruce R. C., R. Jaeger and L. D. Houck, eds. The biology of plethodontid
salamanders. Kluwer Academic/Plenum. New York.
Hofman, S. and J. M. Szymura. 2007. Limited mitochondrial DNA introgression in a
Bombina hybrid zone. Biological Journal of the Linnean Society 91:295-306.
Huheey, J. E. 1960. Mimicry in the color pattern of certain Appalachian salamanders.
Journal of the Elisha Mitchell Scientific Society 76(2):246-251.
Kawakami, T., R. K. Butlin, M. Adams, D. J. Paull, and S. J. B. Cooper. 2008. Genetic
analysis of a chromosomal hybrid zone in the Australian morabine grasshoppers
(Vandiemenella viatica species group). Evolution 63(1):139-152.
Kim, S-C. and L. H. Riesebereg. 1999. Genetic architecture of species differences in
annual sunflowers: implications for adaptive trait introgression. Genetics
153:965-977.
Kozak, K. H. and J. J. Wiens. 2006. Does niche conservatism promote speciation? A case
study in North American salamanders. Evolution 60(12):2604-2621.
Kozak, K. H., A. Larson, R. M. Bonett, and L. J. Harmon. 2005. Phylogenetic analysis of
ecomorphological divergence, community structure, and diversification rates in
dusky salamanders (Plethodontidae: Desmognathus). Evolution 59(9):2000-2016.
Leaché, A. D. and C. J. Cole. 2007. Hybridization between multiple fence lizard lineages
in an ecotone: locally discordant variation in mitochondrial DNA, chromosomes,
and morphology. Molecular Ecology 16:1035-1054.
Linnen, C. R. and B. D. Farrell. 2007. Mitonuclear discordance is caused by rampant
mitochondrial introgression in Neodiprion (Hymenoptera: Diprionidae) sawflies.
Evolution 61(6):1417-1438.
Madison, D. M. and C. R. Shoop. 1970. Homing behavior, orientation, and home range
of salamanders tagged with tantalum-182. Science 168(3938):1484-7.
Mallet, J. 2005. Hybridization as an invasion of the genome. Trends in Ecology and
Evolution 20(5):229-237.
Manzo, P. A. 1988. A morphometric analysis of Plethodon jordani Blatchley and its
hybrids. PhD Dissertation, University of Maryland.

128
Martin, N. H., A. C. Bouck, and M. L. Arnold. 2006. Detecting adaptive trait
introgression between Iris fulva and I. brevicaulis in highly selective field
conditions. Genetics 172:2481-2489.
Martinsen, G. D., T. G. Whitham, R. J. Turek, and P. Keim. 2001. Hybrid populations
selectively filter gene introgression between species. Evolution 55(7):1325-1335.
Mayr, E. 1963. Animal Species and Evolution. Belknap Press, Massachusetts.
McDonald, D. B., R. P. Clay, R. T. Brumfield, and M. J. Braun. 2001. Sexual selection
on plumage and behavior in an avian hybrid zone: experimental tests of male-
male interactions. Evolution 55(7):1443-1451.
McMenamin, S. K., E. K. Hadly, and C. K. Wright. 2008. Climate change and wetland
desiccation cause amphibian decline in Yellowstone National Park. Proceedings
of the National Academy of Sciences 105(44):16988-16993.
Merchant, H. 1972. Estimated population size and home range of the salamanders
Plethodon jordani and Plethodon glutinosus. Journal of the Washington Academy
of Sciences 62(3):248-257.
Minder, A. M. and A. Widmer. 2008. A population genomic analysis of species
boundaries: neutral processes, adaptive divergence and introgression between two
hybridizing plant species. Molecular Ecology 17:1552-1563.
Nishikawa, K. C. 1990. Intraspecific spatial relationships of two species of terrestrial
salamanders. Copeia 2:418-426.
Orr, L. P. 1968. The relative abundance of mimics and models in a supposed mimetic
complex in salamanders. The Journal of the Elisha Mitchell Scientific Society
84(2):303-304.
Payseur, B. A., J. G. Krenz, and M. W. Nachman. 2004. Differential patterns of
introgression across the X chromosome in a hybrid zone between two species of
house mice. Evolution 58(9):2064-2078.
Peabody, R. B. 1978. Electrophoretic analysis of geographic variation and hybridization
of two Appalachian salamanders, Plethodon jordani and Plethodon glutinosus.
PhD Dissertation, University of Maryland.
Phillips, S. J., M. Dudík, and R. E. Schapire. 2004. A maximum entropy approach to
species distribution modeling. Pp. 655-662 in Proceedings of the 21st International
Conference on Machine Learning. ACM Press, New York.
Phillips, S. J., R. P. Anderson, and R. E. Schapire. 2006. Maximum entropy modeling of

129
species geographic distributions. Ecological Modelling 190:231-259.
Piálek, J., and N. H. Barton. 1997. The spread of an advantageous allele across a barrier:
the effects of random drift and selection against heterozygotes. Genetics 145:493-
504.
Pielou, E. C. 1991. After the Ice Age: The Return of Life to Glaciated North America.
The University of Chicago Press, Illinois.
Porter, A. H., R. Wenger, H. Geiger, A. Scholl, and A. M. Shapiro. 1997. The Pontia
daplidice-edusa hybrid zone in Northwestern Italy. Evolution 51(5):1561-1573.
Reagan, N. L. 1992. Evolution of sexual isolation in salamanders in the genus Plethodon.
PhD Dissertation, The University of Chicago.
Rhymer, J. M. and J. Simberloff. 1996. Extinction by hybridization and introgression.
Annual Review of Ecology and Systematics 27:83-109.
Rieseberg, L. R., J. Whitton, and K. Gardner. 1999. Hybrid zones and the genetic
architecture of a barrier to gene flow between two sunflower species. Genetics
152:713-727.
Rohwer, S., E. Bermingham, and C. Wood. 2001. Plumage and mitochondrial DNA
haplotype variation across a moving hybrid zone. Evolution 55(2):405-422.
Sequeira, F., F. Alexandrino, S. Rocha, J. W. Arntzen, and N. Ferrand. 2005. Genetic
exchange across a hybrid zone within the Iberian endemic golden-striped
salamander, Chioglossa lusitanica Molecular Ecology 14:245-254.
Shaw, K. L. and P. D. Danley 2003. Behavioral genomics and the study of speciation at a
porous species boundary. Zoology 106:261-273.
Szymura , J. M. and N. H. Barton. 1991. The genetic structure of the hybrid zone
between the fire-bellied toads Bombina bombina and B. variegata: comparison
between transects and between loci. Evolution 45(2):237-261.
Teeter, K.C., B. A. Payseur, L. W. Harris, M. A. Bakewell, L. M. Thibodeau, J. E.
O’Brien, J. G. Krenz, M. A. Sans-Fuentes, M. W. Nachman, and P. K. Tucker.
2008. Genome-wide patterns of gene flow across a house mouse hybrid zone.
Genome Research 18:67-76.
Tucker, P. K., R. D. Sage, J. Warner, A. C. Wilson, and E. M. Eicher. 1992. Abrupt
cline for sex chromosomes in a hybrid zone between two species of mice.
Evolution 46(4):1146-1163.
Vines, T. H., S. C. Kohler, M. Thiel, I. Ghira, T. R. Strands, C. J. MacCallum, N. H.

130
Barton, and B. Nurnberger. 2003. The maintenance of reproductive isolation in a
mosaic hybrid zone between the fire-bellied toads Bombina bombina and B.
variegata. Evolution 57(8):1876-1888.
Vörös, J., M. Alcobendas, I. Martínez-Solano, M. García-París. 2006. Evolution of
Bombina bombina and Bombina variegata (Anura: Discoglossidae) in the
Carpathian Basin: a history of repeated mt-DNA introgression across species.
Molecular Phylogenetics and Evolution 38:705-718.
Weisrock, D. W. and A. Larson. 2006. Testing hypotheses of speciation in the Plethodon
jordani species complex with allozymes and mitochondrial DNA sequences.
Biological Journal of the Linnean Society 89:25-51.
Weisrock, D. W., K. H. Kozak, and A. Larson. 2005. Phylogenetic analysis of mtDNA
gene flow and introgression in the salamander, Plethodon shermani. Molecular
Ecology 14(5):1457-1472.
Wiens, J. J., T. N. Engstrom, and P. T. Chippendale. 2006. Rapid diversification,
incomplete isolation, and the “speciation clock” in North American salamanders
(genus Plethodon): testing the hybrid swarm hypothesis of rapid radiation.
Evolution 60(12):2585-2603.
Wolf, D. E., N. Takebayashi, and L. H. Rieseberg. 2001. Predicting the risk of extinction
through hybridization. Conservation Biology 15(4):1039-1053.

131
CHAPTER IV
Past, present, and future range dynamics of the montane salamanders
Plethodon jordani and P. metcalfi (Caudata: Plethodontidae)
Abstract
In this study, the range dynamics of two species of montane southern Appalachian
salamanders, Plethodon jordani and P. metcalfi, are examined using ecological niche
modeling (ENM) at three time periods: (1) present-day, (2) during the last glacial
maximum 21,000 years ago, and (3) in the year 2050 under a climate warming scenario.
Models generated using present-day bioclimatic variables indicate that P. jordani and P.
metcalfi currently occupy nearly all of the regions that are predicted to contain suitable
habitat. Models that reconstruct distributions during the last glacial maximum show little
change from the present-day, although the resolution at which these models were created
may be an issue. Future projections indicate that the ranges of P. jordani and P. metcalfi
will be substantially smaller than present-day as the species migrate upslope to track
shifts in suitable habitat. The conservation status of P. jordani and P. metcalfi are
discussed in light of modern climate change.
Introduction
Understanding historic and present-day geographic distributions of species are
important for inferring evolutionary processes (Highton and Peabody 2000, Weisrock and

132
Larson 2006, Rodríguez-Sánchez and Arroyo 2008). Information on species’ ranges can
give insight into the mode of speciation (e.g., sympatric versus allopatric; Barraclough
and Vogler 2000), reveal patterns of historic gene flow that may help to explain present
phylogenetic relationships (e.g., Crespi et al. 2003), or aid in the testing of other
evolutionary hypotheses (e.g., selection versus drift as a cause of divergence in mountain-
top isolates; Knowles and Richards 2005). Furthermore, there are an increasing number
of studies that examine range shifts in response to past climatic oscillations in the
Pleistocene (Davis and Shaw 2001, Peterson et al. 2004, Brito 2007). For example, the
last glacial maximum, which occurred about 21,000 years ago, fragmented many
European and North American species into low latitude refugia (Hewitt 1996, 2000,
Davis and Shaw 2001, Waltari et al. 2007).
Species inhabiting mountainous areas are predicted to be differentially affected by
climate change (Hewitt 1996, Guralnick 2007, but see Peterson 2003). Under a cooling
climate scenario, rather than migrate northwards as predicted for flatland species,
montane species will migrate downslope to track the movement of suitable habitat.
Conversely, in a warming climate, ranges are predicted to shift upslope. This latter
prediction has many important consequences: First, ranges will necessarily contract as the
conical shape of mountains means there is less area at higher elevations (Peterson 2003).
Second, populations will become fragmented into mountain-top isolates, often with little
or no gene flow between them (e.g., McDonald and Brown 1992, Highton and Peabody
2000). Lastly, if warming persists or intensifies, species may go extinct (McDonald and
Brown 1992, Peterson et al. 2002).

133
Shifting ranges in response to climate change may also lead to differences in
hybrid zone dynamics. Hybrid zone movement as a result of climate change has not been
empirically well-documented. One rare example is from a ground cricket hybrid zone
(Allenomobius) in the Appalachian Mountains (Britch et al. 2001). In that study,
researchers document an upslope shift in hybrid zone position that they credit to regional
warming trends. It should be noted, however, that definitive evidence is lacking. There is
a growing body of empirical evidence that habitat disturbances other than those caused
by climate change may result in shifts in hybrid zone position. For example, in a 20-year
morphological study, Hairston et al. (1992) documented an upslope shift in the position
of a hybrid zone between two species of salamanders in the genus Plethodon. The authors
correlate the shift with the cessation of logging activity near the beginning of the last
century. Similarly, the overgrazing of cattle may have altered the relative abundance of
preferred habitats of two species of fence lizards (Sceloporous) in the southwestern
United States (Leaché and Cole 2007). The change in habitat may have resulted in what
appears to be a 1.5 km northward shift of the hybrid zone over a 30-year period. Lastly,
conversion of land for agriculture appears to have favored one species of South American
Pholidobolus lizard over a congener with which it hybridizes (Hillis and Simmons 1986).
The shift in hybrid zone position appears to have taken place rapidly, within a 12-year
period. The above examples demonstrate the sensitivity of hybrid zones to environmental
perturbations, be they anthropogenic or natural.
Modern climate change is occurring at an unprecedented rate (Schellnhuber
2008). Estimates place the anticipated global temperature increase during the 21st century
at 1.4-4.3oC, with a reasonable expectation of 2.4
oC (Ramanathan and Feng 2008).

134
Furthermore, new research also suggests atmospheric carbon dioxide levels will not
decline for at least 1,000 years after emissions stop (Solomon et al. 2008). The number of
documented range shifts occurring during recent warming trends is growing (Root et al.
2003), as is the diversity of taxa involved (butterflies, Parmesan et al. 1999; crickets,
Britch et al. 2001; amphibians and reptiles, Raxworthy et al. 2008; birds, Thomas and
Lennon 1999; mammals, Moritz et al. 2008). Anticipated effects of modern climate
change resulting from increased temperatures, greater temperature variability, and
seasonal precipitation changes are likely to be severe for amphibian species (Daszak et al.
2005, McMenamin et al. 2008). Furthermore, studies suggest that the generally low
dispersal abilities of amphibians make them particularly susceptible to the effects of
climate change (Araújo and Pearson 2005, Araújo et al. 2006).
Increasingly, evolutionary biologists are utilizing ecological niche modeling
(ENM), also called habitat distribution modeling, to examine range dynamics (Kozak et
al. 2008, Swenson 2008). ENM is a GIS-based method for predicting species
distributions given georeferenced collection localities and regional environmental data.
Typical environmental variables, termed bioclimatic variables, are biologically relevant
and usually involve measures of temperature (e.g., maximum temperature of warmest
month) and precipitation (e.g., precipitation of driest month). Bioclimatic variables are
spatially interpolated from climate stations and are used to create GIS layers known as
“climate surfaces” (Hijmans et al. 2005). When used in conjunction with locality
information, these layers provide an estimate of a species realized ecological niche
(Phillips et al. 2006). Potential distributions, as predicted by regional bioclimatic
variables, are an estimate of suitable niche space that, depending upon further sampling,

135
may or may not be occupied by the species in question. Reasons why potential niche
space is not occupied include human influences (e.g., habitat degradation), biotic
interactions (e.g., competition from other species), and geographic barriers (Pearson and
Dawson 2003, Phillips et al. 2006). Additionally, insufficient dispersal time may also
explain why potential niche space is not occupied (Araújo and Pearson 2005).
Recently, it has become possible to create niche models based on paleoclimatic
data and inferred future climate scenarios. When modeling is performed at glacial
maxima, it is possible to infer past range expansions (Rodríguez-Sánchez and Arroyo
2008). Such data have proved useful when testing hypotheses of range-shift dynamics
after secondary contact in hybrid zones. For example, Cicero (2004) documented
discordance between the position of an avian hybrid zone as determined using
morphological and molecular markers and a change in vegetation community as
evidenced through ENM. Increasingly, researchers are using ENM to examine the effects
of modern climate change in the dynamics of species ranges under anticipated climate
change scenarios (Peterson et al. 2002, Parra-Olea et al. 2005).
Plethodon jordani and P. metcalfi (family Plethodontidae) are high-elevation
salamander species found in the southern Appalachians. The present-day range of P.
jordani is restricted to the Great Smoky Mountains and the range of P. metcalfi is
restricted to the Blue Ridge and Balsam Mountains (see Figure 4.1A). In a morphological
study of hybrid zone dynamics between the two salamander species, Hairston et al.
(1992) presented a hypothesis on the historic ranges of the species that accounts for the
present day pattern of hybrid formation. Using the morphological trait of red-cheek
pigmentation, which is found in P. jordani but is absent in P. metcalfi, the authors

136
mapped the frequency of hybrids along a transect through the hybrid zone. The transition
was found to be simple and sigmoidal. In a model assuming neutral diffusion of the
measured trait, the authors concluded that isolation between the species last occurred
about 5,000 years ago during the Hypsithermal Interval, a period characterized by
warmer temperatures than those found today. During that time, ranges would have
contracted and P. jordani and P. metcalfi would likely have been isolated from one
another.
There are two goals of this study. First, to reconstruct the historic range
fluctuations of P. jordani and P. metcalfi by modeling the species’ ranges during the last
glacial maximum 21,000 years ago and present-day. Temperatures during the last glacial
maximum were colder and, consequently, distributions are predicted to be greater than at
present. Second, to make predictions using ENM on the future ranges of P. jordani and
P. metcalfi under the specter of modern climate change.
Methods
Sampling for ecological niche modeling
Locality information used in the ecological niche models is a subset of that used
by Kozak and Wiens (2006). Georeferenced localities for Plethodon metcalfi (n = 289)
and P. jordani (n = 374) were obtained from the collection of the U. S. National
Museum. Most specimens used in the analysis were collected by R. Highton and were
assigned to species using morphology and allozymes. Any species with uncertain
identification was omitted from the analysis (Kozak and Wiens 2006).

137
Constructing ecological niche models
Models were created using Maxent version 3.2.1 (Phillips et al. 2004, Phillips et
al. 2006). Maxent is a machine-learning method which utilizes presence-only data in the
construction of models of species distributions. Like other ENM methods, the objective
of Maxent is to predict environmental suitability within a specified area given the
environmental conditions of known collection localities of a population or species of
interest. Maxent does this by creating a probability distribution of habitat suitability for
all grid cells in the specified region by computing the probability distribution of
maximum entropy, i.e., a distribution that is closest to uniform with respect to the average
of environmental conditions at the known collection localities. Habitat suitability values
for each grid cell are given as a probability, and probability values for all grid cells must
sum to 1.0. Each cumulative probability value is subsequently multiplied by 100 to give a
percentage. Raster files of habitat suitability values created in Maxent were converted to
ASCII files and viewed in ArcGIS version 9.3.
The bioclimatic variables used to model species distributions consisted of the 19
available from the WorldClim database (www.worldclim.org; Table 4.1). Many ENM
studies attempted to minimize non-independence among variables by including
representatives from groups of highly correlated variables. Maxent differs from many
other niche modeling programs in that it assesses and incorporates both variables and
their interactions, thus accounting for non-independence of variables (Phillips et al.
2006).
There is considerable inherent uncertainty when inferring past and present climate
scenarios. Consequently, the resolution at which models were made differs between the

138
present-day and those from the past and future. Present-day models were created at a 30
arc-second resolution, which equates to a grid cell size of approximately 1 km2 (Hijmans
et al. 2005). Models for the last glacial maximum 21,000 years ago and future projections
for the year 2050 were created at 2.5 arc-minute resolution, which equates to a grid cell
size of approximately 25 km2. It should be noted that models using climate projections
for the year 2050 are based on Global Climate Models (GCMs; also called General
Circulation Models) and are dependent upon assumptions of future carbon emissions and
their effects (www.worldclim.org). Furthermore, predicting climate patterns has a large
stochastic component that may result in differences between observed and actual climate
scenarios (www.worldclim.org).
Results
Range-wide predictions of the ecological niche models
Ecological niche models generated using present-day bioclimatic variables
indicate that Plethodon jordani and P. metcalfi currently occupy nearly all of the regions
that are predicted to contain suitable habitat. The present distribution of P. jordani is
restricted to the Great Smoky Mountains, and habitat in that region is predicted to be
highly suitable (Figure 4.1B). Portions of the Balsam Mountains, which are contiguous
with the Great Smoky Mountains (Figure 4.1A), are also predicted to be inhabited by P.
jordani with high suitability. The actual present-day distribution of P. metcalfi is the
Balsam and Blue Ridge Mountains, and the predicted distribution is largely concordant
with the species’ actual range (Figure 4.1C). According to the models, the southeastern
portions of the Great Smoky Mountains are also highly suitable habitat for P. metcalfi,

139
although the distribution of this habitat is somewhat patchy. Disjunct mountain ranges to
the southwest and northeast are also predicted to contain suitable habitat for both species.
Out of the 19 bioclimatic variables used to construct the ecological niche models,
two highly correlated variables emerged as important (Table 4.1). BIO14, precipitation in
the driest month, and BIO17, precipitation in the driest quarter, together explain 77.4% of
the predicted distribution for P. jordani and 84.7% for P. metcalfi. A third variable,
precipitation seasonality (BIO15), explains a further 6.9% of the distribution of P.
jordani and 7.9% of the distribution for P. metcalfi.
Projected habitat suitability values during the last glacial maximum were
markedly lower throughout much of the southern Appalachians (note change in
suitability values associated with colors in Figures 4.2A and B). Highly suitable habitat
(arbitrarily set at 80-100%) is absent for either species during the last glacial maximum.
In addition, the suitability values for P. metcalfi tend to be lower throughout the region
(maximum of 48%) that those for P. jordani (maximum of 80%). Overall, ranges are not
expected to have shifted greatly for either P. jordani or P. metcalfi.
Both P. jordani and P. metcalfi in the year 2050, under the scenario of climate
warming, show a dramatic reduction is suitable habitat. This results from reduced habitat
quality (i.e., there is a reduction in the maximum habitat suitability value) and reduced
geographic extent of suitable habitat (Figures 4.3A and B). Habitat suitability values are
substantially lower than those predicted in present-day models, with the maximum values
predicted for P. jordani and P. metcalfi being 36% and 29%, respectively. The highest
available habitat for both species in the year 2050 is restricted to the highest elevations
throughout the southern Appalachians.

140
Discussion
Historical range shifts of Plethodon jordani and P. metcalfi
Based on the ecological niche modeling results, both Plethodon jordani and P.
metcalfi currently occupy a large portion of their predicted distributions. Exceptions
include mountain ranges to the southwest (e.g., the Nantahala and Unicoi Mountains) and
northeast (e.g., the Newfound Mountains) (Figure 4.1A), where there are similarities in
the high-elevation vegetation communities (Hairston 1949, Little 1970) and climate.
Furthermore, the absence of P. jordani and P. metcalfi from these neighboring mountain
ranges is expected given the valleys of unsuitable habitat separating them and the
presence of other members of the P. jordani species complex currently found there
(Highton and Peabody 2000). Additionally, the models suggest that P. jordani and P.
metcalfi have different habitat requirements, as the predicted distributions of the two
species only minimally overlap. In general, P. jordani is predicted to occur in higher
elevations in the northwest regions of the southern Appalachians, while P. metcalfi is
predicted to occur throughout many of the southwestern mountains ranges. This result is
expected since the bioclimatic variables determined to be the best indicators of habitat
suitability are both measures of precipitation during the driest parts of the year (Table
4.1). Presumably, much of the range of P. metcalfi falls within the rain shadow of the
high-elevation Great Smoky Mountains. Also highlighted by the ENM results is the
tolerance of P. metcalfi to a greater range of environmental conditions. Individual P.
metcalfi were sampled in areas with a predicted habitat suitability value as low as 15%
(known as the habitat suitability threshold), whereas the threshold for P. jordani is 33%.

141
Ecological niche models for the last glacial maximum show a reduction in
maximum suitable habitat, but little change in area. Reconstructions of vegetation
communities using pollen and macrofossil data show that much of the southeastern
United States was cooler and dominated by cool-adapted vegetation communities during
the last glacial maximum (Watts 1980, Davis 1983, Jackson et al. 2000). Thus, the
amount of suitable habitat available for montane Plethodon, which are found almost
exclusively in cool-adapted vegetation communities (spruce-fir, cove hardwood, and
northern hardwood), was almost certainly much greater than at present. Reconciling these
results may lie in the inherent limitations of model resolution (see below).
The effects of modern climate change
Species inhabiting mountainous areas are expected to experience range shifts
upslope to track parallel shifts in suitable habitat (McDonald and Brown 1992, Hill et al.
2002, Rull and Vegas-Vilarrúbia 2006, Guralnick 2007, Raxworthy et al. 2008, but see
Peterson 2003). This pattern is especially likely for eastern Plethodon, as previous work
suggests many species within this group have experienced niche conservatism (Kozak
and Wiens 2006) during past range fluctuations. Furthermore, a recent laboratory study
on another genus of plethodontid salamander (Desmognathus) suggests these
salamanders are near their physiological climate limit (Bernardo and Spotila 2006). It
seems probable, therefore, that montane plethodontid salamanders are extremely
vulnerable to the adverse effects of climate change.
Hairston et al. (1992) suggested that warm climates during the Hypsithermal
Interval 5,000 years ago resulted in range contractions of P. jordani and P. metcalfi and,

142
consequently, the separation of their ranges. At a broad scale, the ecological niche models
presented here for the year 2050 show that both P. jordani and P. metcalfi may
experience severe range contractions. This is especially true for P. jordani, as the range
of suitable habitats appears to be narrower and restricted to the highest elevations.
However, the models also show increased overlap of the most suitable habitat for each
species. Thus, the area of contact between the species, as well as the geographic extent of
hybridization, may increase. Furthermore, recent work suggests that the hybrid zone
occurring between P. jordani and P. metcalfi may be moving southwards into the
present-day range of P. metcalfi (see Chapter III). Models presented here show that
habitat suitability values for P. jordani in the Great Smoky and Balsam Mountains may
be similar in the year 2050 (29-36%; Figure 4.3A), which may lead to the continued
southward movement of the hybrid zone.
Increasingly, studies are documenting amphibian declines as a result of climate
change (Araújo et al. 2006, Pounds et al. 2006, Laurance 2008, McMenamin et al. 2008,
Wake and Vredenberg 2008). Montane plethodontid salamanders in the new world
tropics seem especially affected (Parra-Olea et al. 1999). Parra-Olea et al. (2005)
constructed ecological niche models for two Middle American montane plethodontid
salamanders, and concluded that the species could lose up to 75% of their habitat by 2050
as a result of climate change.
The current status of P. jordani and P. metcalfi populations is unknown. Only two
studies directly address declines in eastern Plethodon and neither use rigorous tests,
instead relying on observational data collected for other purposes. Furthermore, their
conclusions are strongly at odds with one another. Hairston and Wiley (1993) made

143
annual collections of P. jordani, P. shermani, and P. teyahalee along two elevational
transects. Their collections were part of a series of class field trips and few attempts were
made to standardize search time, search area, or collector enthusiasm. Their results
suggest considerable fluctuation from year to year, but no trend of declining populations.
In a more comprehensive study, Highton (2005) made observations at 127 localities
representing 38 of the 45 species of eastern Plethodon over a 35-year time period. As in
Hairston and Wiley (1993), the author made little attempt to standardize methodology.
The results indicate no decline from the early 1950s to the mid-1980s, followed by a
severe decline of 58.4% from the late 1980s to the 1990s. Importantly, every species
sampled (including P. jordani and P. metcalfi) experienced declines.
Conclusion
Predicted distributions of P. jordani and P. metcalfi are presented for three time
periods: (1) the last glacial maximum 21,000 years ago, (2) the present-day, and (3) the
year 2050. The historic and future range fluctuations modeled here likely reflect the most
severe climatic conditions that these species would experience. It should be emphasized,
however, that an ecological niche models represents an estimate of a species’ realized
niche, and not its fundamental niche (Phillips et al. 2006). As such, the models presented
here must be taken as an approximation of actual distributions. Furthermore, inferring
historic and predicting future distributions is saddled with inherent uncertainties that may
also influence modeled distributions.
Many researchers have criticized ENM approaches because of the sole reliance on
climatic data in predicting species’ distributions. Critics cite the known importance of

144
biotic interactions and argue that range limits may be determined through competition
with neighboring species rather than by climatically unsuitable habitat (Davis et al. 1998,
Pearson and Dawson 2003, Martínez-Meyer 2005). Previous studies have suggested
competitive interactions may be important in determining the distributions of P. jordani
and P. teyahalee (Hairston 1980a, 1980b, 1983, Nishikawa 1985, 1987, Hairston et al.
1987, Adams 2004). Furthermore, there is some evidence that hybrids may be under
negative selection. In follow-up studies to Hairston’s (1980a) reciprocal transplant
experiments, Highton (1998) demonstrated a deficit of heterozygotes suggesting the
possibility of either selection against hybrids or assortative mating. The latter hypothesis
garnered support from laboratory studies involving heterospecific crosses between P.
jordani and P. metcalfi (Reagan 1992), but lowered heterozygote fitness remains a
possibility. Therefore, biotic interactions, either through competition or hybridization,
may limit species boundaries. If this is the case, then models may underestimate these
species’ potential distributions.
One major limitation of the use of ENM in this study is the resolution at which the
models were created (Swenson 2008). This is true for both the 30 arc-second and 2.5 arc-
minute models, in which habitat heterogeneity is measured in kilometers. This coarse
resolution may obscure differences in microhabitat. If this is the case, then pockets of
suitable habitat (e.g., moist ravines) may act as refugia, resulting in an
underrepresentation of species distributions. This is especially true in this study, as home
range size estimates for these species are small [P. jordani: 1.9-11.5 m2 (Merchant 1972,
Nishikawa 1990); P. metcalfi: 11.8-51.2 m2 (Madison and Shoop 1970)]. Additionally,
interpolation of climate surfaces in mountainous areas is problematic because of the

145
extreme topographic variation (Hijmans et al. 2005), although this may be somewhat
offset by the greater density of climate stations in the eastern United States (Hijmans et
al. 2005).

146
Figure 4.1. Topographical relief map of southern Appalachians highlighting mountain
ranges mentioned in text (A). Ecological niche modeling results showing present-day
predicted geographic distribution for Plethodon jordani (B) and P. metcalfi (C). For
comparison, collection localities of both P. jordani (+) and P. metcalfi (□) are shown in
both maps. Colors in (B) and (C) indicate habitat suitability values as assigned by
Maxent, and are given as percentages (cumulative probability x 100; see text for more
detail).

147
Tennessee
Georgia South Carolina
North Carolina
Great Smoky Mtns
Newfound Mtns
Balsam Mtns
Unicoi Mtns
Blue Ridge Mtns
Nantahala Mtns
A

148
B
0 – 2020 – 40
40 – 60
60 – 80
80 – 100
Plethodon jordani

149
C
0 – 2020 – 40
40 – 60
60 – 80
80 – 100
Plethodon metcalfi

150
Figure 4.2. Ecological niche modeling result showing predicted geographic distribution
for Plethodon jordani (A) and P. metcalfi (B) during the last glacial maximum 21,000
years ago. For comparison, collection localities for both P. jordani (+) and P. metcalfi (□)
are shown in both maps. Colors in (A) and (B) indicate habitat suitability values as
assigned by Maxent, and are given as percentages (cumulative probability x 100; see text
for more detail).

151
0 – 1616 – 32
32 – 48
48 – 64
64 – 80
A Plethodon jordani

152
0 – 99 – 19
19 – 28
28 – 37
37 – 46
B Plethodon metcalfi

153
Figure 4.3. Ecological niche modeling result showing predicted geographic distribution
for Plethodon jordani (A) and P. metcalfi (B) in the year 2050. For comparison,
collection localities for both P. jordani (+) and P. metcalfi (□) are shown in both maps.
Colors in (A) and (B) indicate habitat suitability values as assigned by Maxent, and are
given as percentages (cumulative probability x 100; see text for more detail).

154
0 – 77 – 14
14 – 22
22 – 29
29 – 36
A Plethodon jordani

155
0 – 66 – 11
11 – 17
17 – 23
23 – 29
B Plethodon metcalfi

156
Table 4.1. Climatic variables1 used in creation of ecological niche models.
Percent for Percent for
Variables2 Description P. jordani
3 P. metcalfi
3
BIO1 Annual Mean Temperature 3.3 3.5
BIO2 Mean Diurnal Range 0.2 0
BIO3 Isothermality 0 0.1
BIO4 Temperature Seasonality 1.1 1
BIO5 Max Temperature of Warmest Month 0 0
BIO6 Min Temperature of Coldest Month 0 0
BIO7 Temperature Annual Range 0.1 0
BIO8 Mean Temperature of Wettest Quarter 2.1 0.2
BIO9 Mean Temperature of Driest Quarter 0 0.5
BIO10 Mean Temperature of Warmest Quarter 2 1.5
BIO11 Mean Temperature of Coldest Quarter 0.2 0
BIO12 Annual Precipitation 0.6 0.2
BIO13 Precipitation of Wettest Month 0.2 0.1
BIO14 Precipitation of Driest Month 19.4 53.4
BIO15 Precipitation Seasonality 6.9 7.9
BIO16 Precipitation of Wettest Quarter 0 0
BIO17 Precipitation of Driest Quarter 58 31.3
BIO18 Precipitation of Warmest Quarter 5.4 0
BIO19 Precipitation of Coldest Quarter 0.3 0.5 1 Variables are as given on the WorldClim database, available at www.worldclim.org/bioclim.htm.
2 Variable names are as assigned by WorldClim.
3 Given as a percent contribution for model predictions for Plethodon jordani and P. metcalfi.

157
Literature Cited
Adams, D. C. 2004. Character displacement via aggressive interference in Appalachian
salamanders. Ecology 85(10):2664-2670.
Araújo, M. B. and R. G. Pearson. 2005. Equilibrium of species’ distributions with
climate. Ecography 28(5):693-695.
Araújo, M. B., W. Thuiller, and R. G. Pearson. 2006. Climate warming and the decline of
amphibians and reptiles in Europe. Journal of Biogeography 33:1712-1728.
Barraclough, T. G. and A. P. Vogler. 2000. Detecting the geographical pattern of
speciation from species-level phylogenies. The American Naturalist 155(4):419-
434.
Bernardo, J. and J. R. Spotila. 2006. Physiological constraints on organismal response to
global warming: mechanistic insights from clinally varying populations and
implications for assessing endangerment. Biology Letters 2:135-139.
Britch, S. C., M. L. Cain, and D. J. Howard. 2001. Spatio-temporal dynamics of the
Allenomobius fasciatus-A. socius mosaic hybrid zone: a 14-year perspective.
Molecular Ecology 10:627-638.
Brito, P .H. 2007. Contrasting patterns of mitochondrial and microsatellite genetic
structure among Western European populations of tawny owls (Strix aluco).
Molecular Ecology 16:3423-3437.
Cicero, C. 2004. Barriers to sympatry between avian sibling species (Paridae:
Baeolophus) in local secondary contact. Evolution 58(7):1573-87.
Crespi, E. J. and L. J. Rissler, and R. A. Browne. 2003. Testing Pleistocene refugia
theory: phylogeographical analysis of Desmognathus wrighti, a high-elevation
salamander in the southern Appalachians. Molecular Ecology 12:969-984.
Daszak, P., D. E. Scott, A. M. Kilpatrick, C. Faggioni, J. W. Gibbons, and D. Porter.
2005. Amphibian population declines at Savannah River Site are linked to
climate, not chytridiomycosis. Ecology 86(12):3232-3237.
Davis, M. B. 1983. Quaternary history of deciduous forests of eastern North America and
Europe. Annals of the Missouri Botanical Garden 70(3):550-563.
Davis, M. B. and R. G. Shaw. 2001. Range shifts and adaptive responses to Quaternary
climate change. Science 292:673-679.
Davis, A. J., L. S. Jenkinson, J. H. Lawton, B. Shorrocks, and S. Wood. 1998. Making

158
mistakes when predicting shifts in species range in response to global warming.
Nature 391:783-786.
Guralnick, R. 2007. Differential effects of past climate warming on mountain and flatland
species distributions: a multispecies North American mammal assessment. Global
Ecology and Biogeography 16:14-23.
Hairston, N. G. 1949. The local distribution and ecology of the plethodontid salamanders
of the southern Appalachians. Ecological Monographs 19(1):47-73.
Hairston, N. G. 1980a. The experimental test of an analysis of field distributions:
competition in terrestrial salamanders. Ecology 61(4):817-826.
Hairston, N. G. 1980b. Evolution under interspecific competition: field experiments on
terrestrial salamanders. Evolution 34(3):409-420.
Hairston, N. G. 1983. Alpha selection in competing salamanders: experimental
verification of an a priori hypothesis. The American naturalist 122(1):105-113.
Hairston, N. G., R. H. Wiley. 1993. No decline in salamander (Amphibia: Caudata)
populations: a twenty-year study in the southern Appalachians. Brimleyana 18:59-
64.
Hairston Sr, N. G., K. C. Nishikawa, and S. L. Stenhouse. 1987. The evolution of
competing species of terrestrial salamanders: niche partitioning or interference?
Evolutionary Ecology 1:247-262.
Hairston, N. G., R. H. Wiley, C. K. Smith, and K. A. Kneidel. 1992. The dynamics of
two hybrid zones in Appalachian salamanders of the genus Plethodon. Evolution
46(4):930-938.
Hewitt, G. M. 1996. Some genetic consequences of ice ages, and their role in divergence
and speciation. Biological Journal of the Linnean Society 58:247-276.
Hewitt, G. M. 2000. The genetic legacy of the Quaternary ice ages. Nature 405:907-913.
Highton, R. 1998. Frequency of hybrid between introduced and native populations of the
salamander Plethodon jordani in their first generation of sympatry. Herpetologica
54(2):143-153.
Highton, R. 2005. Declines of eastern North American woodland salamanders
(Plethodon). Pp. 34-46 in Lannoo, M., ed. Amphibian Declines: The Conservation
Status of United States Species. University of California Press. California.
Highton, R. and R. B. Peabody. 2000. Geographic protein variation and speciation in
salamanders of the Plethodon jordani and Plethodon glutinosus complexes in the
southern Appalachian mountains with the description of four new species. Pp. 31-

159
93 in Bruce R. C., R. Jaeger and L. D. Houck, eds. The biology of plethodontid
salamanders. Kluwer Academic/Plenum. New York.
Hijmans, R. J., S. E. Cameron, J. L. Parra, P. G. Jones, and A. Jarvis. 2005. Very high
resolution interpolated climate surfaces for global land areas. International Journal
of Climatology 25:1965-1978.
Hill, J. K., C. D. Thomas, R. Fox, M. G. Telfer, S. G. Willis, J. Asher, and B. Huntley.
2002. Responses of butterflies to twentieth century climate warming: implications
for future ranges. Proceedings of the Royal Society of London Series B 269:2163-
2171.
Hillis, D. M. and J. E. Simmons. 1986. Dynamic change of a zone of parapatry between
two species of Pholidobolus (Saura: Gymnophthalmidae). Journal of Herpetology
20(1):25-87.
Jackson, S. T., R. S. Webb, K. H. Anderson, J. T. Overpeck, T. Webb III, J. W. Williams,
and B. C. S. Hansen. 2000. Vegetation and environment in eastern North America
during the Last Glacial Maximum. Quaternary Science Reviews 19:489-508.
Knowles, L. L. and C. L. Richards. 2005. Importance of genetic drift during Pleistocene
divergence as revealed by analyses of genomic variation. Molecular Ecology
14:4023-4032.
Kozak, K. H. and J. J. Wiens. 2006. Does niche conservatism promote speciation? A case
study in North American salamanders. Evolution 60(12):2604-2621.
Kozak, K. H., C. H. Graham, and J. J. Wiens. 2008. Integrating GIS-based environmental
data into evolutionary biology. Trends in Ecology and Evolution 23(3):141-148.
Laurance, W. F. 2008. Global warming and amphibian extinctions in eastern Australia.
Austral Ecology 33:1-9.
Leaché, A. D. and C. J. Cole. 2007. Hybridization between multiple fence lizard lineages
in an ecotone: locally discordant variation in mitochondrial DNA, chromosomes,
and morphology. Molecular Ecology 16:1035-1054.
Little, Jr, E. L. 1970. Endemic, disjunct and northern trees in the southern Appalachians.
Pp. 249-290 in Holt, P. C., ed. The Distributional History of the biota of the
Southern Appalachians, Part II: Flora. Virginia Polytechnic Institute and State
University. Blacksburg, Virginia.
Madison, D. M. and C. R. Shoop. 1970. Homing behavior, orientation, and home range
of salamanders tagged with tantalum-182. Science 168(3938):1484-7.
Martínez-Meyer, E. 2005. Climate change and biodiversity: some considerations in

160
forecasting shifts in species’ potential distributions. Biodiversity Informatics
2:42-55.
McDonald, K. A. and J. H. Brown. 1992. Using montane mammals to model extinctions
due to climate change. Conservation Biology 6(3):409-415.
McMenamin, S. K., E. K. Hadly, and C. K. Wright. 2008. Climate change and wetland
desiccation cause amphibian decline in Yellowstone National Park. Proceedings
of the National Academy of Sciences 105(44):16988-16993.
Merchant, H. 1972. Estimated population size and home range of the salamanders
Plethodon jordani and Plethodon glutinosus. Journal of the Washington Academy
of Sciences 62(3):248-257.
Moritz, C., J. L. Patton, C. J. Conroy, J. L. Parra, G. C. White, and S. R. Beissinger.
2008. Impact of a century of climate change on small-mammal communities in
Yosemite National Park, USA. Science 322:261-264.
Nishikawa, K. C. 1985. Competition and the evolution of aggressive behavior in two
species of terrestrial salamanders. Evolution 39(6):1282-1294.
Nishikawa, K. C. 1987. Interspecific aggressive behavior in salamanders: species-specific
interference or misidentification? Animal Behaviour 35:263-270.
Nishikawa, K. C. 1990. Intraspecific spatial relationships of two species of terrestrial
salamanders. Copeia 2:418-426.
Parmesan, C., N. Ryrholm, C. Stefanescu, J. K. Hill, C. D. Thomas, H. Descimon, B.
Huntley, L. Kaila, J. Kullberg, T. Tammaru, W. J. Tennent, J. A. Thomas, and M.
Warren. 1999. Poleward shifts in geographical ranges of butterfly species
associated with regional warming. Nature 399:579-583.
Parra-Olea, G., M. García-Paris, and D. B. Wake. 1999. Status of some populations of
Mexican salamanders (Amphibia: Plethodontidae). Revista de Biología Tropical
47:217-223.
Parra-Olea, G., E. Martínez -Meyer, and G. Pérez-Ponce de León. 2005. Forecasting
climate change effects on salamander distributions in the highlands of central
Mexico. Biotropica 37(2):202-208.
Pearson, R. G. and T. P. Dawson. 2003. Predicting the impacts of climate change on the
distribution of species: are bioclimate envelope models useful? Global Ecology
and Biogeogaphy 12:361-371.
Peterson, A. T. 2003. Projected climate change effects on Rocky Mountain and Great

161
Plains birds: generalities of biodiversity consequences. Global Change Biology
9:647-655.
Peterson, A. T., M. A. Ortega-Huerta, J. Bartley, V. Sánchez-Cordero, J. Soberón, R. H.
Buddemeier, and D. R. B. Stockwell. 2002. Future projections for Mexican faunas
under global climate change scenarios. Nature 411:626-629.
Peterson, A. T., E. Martínez-Meyer, and C. González-Salazar. 2004. Reconstructing the
Pleistocene geography of the Aphelocoma jays (Corvidae). Diversity and
Distributions 10:237-246.
Phillips, S. J., M. Dudík, and R. E. Schapire. 2004. A maximum entropy approach to
species distribution modeling. Pp. 655-662 in Proceedings of the 21st International
Conference on Machine Learning. ACM Press, New York.
Phillips, S. J., R. P. Anderson, and R. E. Schapire. 2006. Maximum entropy modeling of
species geographic distributions. Ecological Modelling 190:231-259.
Pounds, J. A., M. R. Bustamante, L. A. Coloma, J. A. Consuegra, M. P. L. Fogden, P. N.
Foster, E. La Marca, K. L. Masters, A. Merino-Viteri, R. Puschendorf, S. R. Ron,
G. A. Sánchez-Azofeifa, C. J. Still, and B. E. Young. 2006. Widespread
amphibian extinctions from epidemic disease driven by global warming. Nature
439:161-167.
Ramanathan, V. and Y. Feng. 2008. On avoiding dangerous anthropogenic interference
with the climate system: Formidable challenges ahead. Proceedings of the
National Academy of Sciences 105(38):14245-14250.
Raxworthy, C. J., R. C. Pearson, N. Rabibisoa, A. M. Rakotondrazafy, J-B.
Ramanamanjato, A. P. Raselimanana, S. Wu, R. A. Nussbaum, D. A. Stone. 2008.
Extinction vulnerability of tropical montane endemism from warming and
upslope displacement: a preliminary appraisal for the highest massif in
Madagascar. Global Change Biology 14:1703-1720.
Reagan, N. L. 1992. Evolution of sexual isolation in salamanders in the genus Plethodon.
PhD Dissertation, The University of Chicago.
Rodríguez-Sánchez, F. and J. Arroyo. 2008. Reconstructing the demise of Tethyan plants:
climate-driven range dynamics of Laurus since the Pliocene.
Root, T. L., J. T. Price, K. R. Hall, S. H. Schneider, C. Rosenzweig, and J. A. Pounds.
2003. Fingerprints of global warming on wild animals and plants. Nature 421:57-
60.
Rull, V. and T. Vegas-Vilarrúbia. 2006. Unexpected biodiversity loss under global

162
warming in the neotropical Guayana Highlands: a preliminary appraisal. Global
Change Biology 12:1-9.
Schellnhuber, H. J. 2008. Global warming: Stop worrying, start panicking? Proceedings
of the National Academy of Sciences 105(38):14239-14240.
Solomon, S., G.-K. Plattner, R. Knutti, and P. Friedlingstein. 2008. Irreversible climate
change due to carbon dioxide emissions. Proceedings of the National Academy of
Sciences 106(6):1704-1709.
Swenson, N. G. 2008. The past and future influence of geographic information systems
on hybrid zone, phylogeographic and speciation research. Journal of Evolutionary
Biology 21:421-434.
Thomas, C. D. and J. J. Lennon. 1999. Birds extend their ranges northwards. Nature
399:213.
Wake, D. B. and V. T. Vredenberg. 2008. Are we in the midst of the sixth mass
extinction? A view from the world of amphibians. Proceedings of the National
Academy of Sciences 105:11466-11473.
Waltari, E., R. J. Hijmans, A. T. Peterson, A. S. Nyári, S. L. Perkins, and R. P. Guralnick.
2007. Locating Pleistocene refugia: comparing phylogeographic and ecological
niche model predictions. PLoS One 7:e563.
Watts, W. A. 1980. The late Quaternary vegetation history of the southeastern United
States. Annual Review of Ecology and Systematics 11:387-409.
Weisrock, D. W. and A. Larson. 2006. Testing hypotheses of speciation in the Plethodon
jordani species complex with allozymes and mitochiondrial DNA sequences.
Biological Journal of the Linnean Society 89:25-51.
\

163
CHAPTER V
Conclusion
The research presented in the previous chapters deals with multiple aspects of the
evolutionary dynamics of species in the Plethodon glutinosus group, with an emphasis on
three species – P. jordani, P. metcalfi, and P. teyahalee. There have been numerous
studies on the evolution of salamanders in the family Plethodontidae and the P.
glutinosus group in particular, leading some authors to suggest that the family is a model
system for understanding evolutionary processes (Arnold et al. 1993). For those students
of evolution interested in speciation and the maintenance of species boundaries, the
species richness, numerous instances of hybridization, and considerable wealth of
information on the behavior, ecology, and life history of most species makes plethodontid
salamanders an ideal system. A central goal of this dissertation is to bridge the gap
between the pioneering studies of early researchers (especially Nelson Hairston, Sr and
Richard Highton) and the next generation of evolutionary biologists that are equipped
with the tools of genomics, speciation theory, and an increasingly sophisticated array of
hybrid zone case studies.
An important component in the evolution of the P. glutinosus group, and the three
focal species especially, is hybridization. This theme emerges, in some form, in every one
of the previous chapters. In Chapter II, hybridization is one of the four major problems
encountered in delimiting species boundaries in the group. Chapter III deals entirely with

164
hybridization, with emergent patterns clearly indicating differential introgression and
possibly hybrid zone movement as well. In Chapter IV, ecological niche modeling is used
to place the P. jordani-P. metcalfi hybrid zone into biogeographic context and give
temporal perspective. As technological advances allow for a greater number of molecular
markers and increased spatial resolution for ecological niche models, the dynamics
presented here may be further elucidated.
With regard to the future of species delimitation in the P. glutinosus group,
researchers have made, and continue to make, significant progress. Most notably, recent
multi-gene phylogenetic analyses are beginning to document widespread paraphyly
among complexes that were once thought to be monophyletic (e.g., the P. glutinosus and
P. jordani complexes). Furthermore, these same studies are in disagreement about
relationships among species (Palmer et al. 2005, Kozak et al. 2006, Wiens et al. 2006).
Besides confirming the genuine difficulty of the group, these studies demonstrate the
continued interest in the evolutionary history of the group. As more genes become
sequenced and multigene analytical methods refined, relationships among the lineages
will almost certainly become clearer.
It is evident that the spatially fine scale analysis presented in Chapter III
determined, to a large extent, the ability to infer hybrid zone movement. A logical next
step is to increase the number of nuclear DNA markers, so that a more complete picture
emerges of the extent of introgression. With enough molecular markers, a hybrid score
can be calculated (following Buerkle 2005), and additional patterns of differential
introgression may emerge. Of particular interest is red cheek pigmentation, as this trait is
under putative positive selection (Huheey 1960, Brodie and Howard 1973, Hensel and

165
Brodie 1976). Empirical examples of the introgression of adaptively advantageous traits
are rare in the literature, and its detection here remains a possibility.
The use of ecological niche modeling has seen a boon in recent years, and has
been successfully applied in a few hybrid zone studies (Cicero 2004, Swenson 2006,
2008, Swenson et al. 2008). Its application in this study, however, is novel in the fine-
scale at which models are utilized. The work presented here represents a good first step to
integrating ecological niche modeling with traditional methods of hybrid zone analyses.

166
Literature Cited
Arnold, S. J. N. L. Reagan, and P. A. Verrell. 1993. Reproductive isolation and speciation
in plethodontid salamanders. Herpetologica 49(2):216-228.
Brodie, E. D., Jr. and R. R. Howard. 1973. Experimental study of Batesian mimicry in the
salamanders Plethodon jordani and Desmognathus ochrophaeus. The American
Midland Naturalist 90(1):38-46.
Buerkle, C. A. 2005. Maximum-likelihood estimation of a hybrid index based on
molecular markers. Molecular Ecology Notes 5:684-687.
Cicero, C. 2004. Barriers to sympatry between avian sibling species (Paridae:
Baeolophus) in local secondary contact. Evolution 58(7):1573-87.
Hensel, Jr, J. L. and E. D. Brodie, Jr. 1976. An experimental study of aposematic
coloration in the salamanders Plethodon jordani. Copeia 1:59-65.
Huheey, J. E. 1960. Mimicry in the color pattern of certain Appalachian salamanders.
Journal of the Elisha Mitchell Scientific Society 76(2):246-251.
Kozak, K. H., D. W. Weisrock, and A. Larson. 2006. Rapid lineage accumulation in a
non-adaptive radiation: phylogenetic analysis of diversification rates in eastern
North American woodland salamanders (Plethodontidae: Plethodon). Proceedings
of the Royal Society of London B 273:539-546.
Palmer, C. A., R. A. Watts, R. G. Gregg, M. A. McCall, L. D. Houck, R. Highton, and S.
J. Arnold. 2005. Lineage-specific differences in evolutionary mode in a
salamander courtship pheromone. Molecular Biology and Evolution 22(11):2243-
2256.
Swenson, N. G. 2006. Gis-based niche models reveal unifying climatic mechanisms that
maintain location of avian hybrid zones in a North American suture zone. Journal
of Evolutionary Biology 19:717-725.
Swenson, N. G. 2008. The past and future influence of geographic information systems
on hybrid zone, phylogeographic and speciation research. Journal of Evolutionary
Biology 21:421-434.
Swenson, N. G., J. M. Fair, and J. Heikoop. 2008. Water stress and hybridization between
Quercus gambelii and Quercus grisea. Western North American Naturalist
68(4):498-507.
Wiens, J. J., T. N. Engstrom, and P. T. Chippendale. 2006. Rapid diversification,

167
incomplete isolation, and the “speciation clock” in North American salamanders
(genus Plethodon): testing the hybrid swarm hypothesis of rapid radiation.
Evolution 60(12):2585-2603.