evolution of the color–magnitude …richard/astro620/mei_cmd_ellipticals.pdf7 leiden observatory,...
TRANSCRIPT
The Astrophysical Journal, 690:42–68, 2009 January 1 doi:10.1088/0004-637X/690/1/42c© 2009. The American Astronomical Society. All rights reserved. Printed in the U.S.A.
EVOLUTION OF THE COLOR–MAGNITUDE RELATION IN GALAXY CLUSTERS AT z ∼ 1 FROM THE ACSINTERMEDIATE REDSHIFT CLUSTER SURVEY
Simona Mei1,2,3,4
, Brad P. Holden5, John P. Blakeslee
6, Holland C. Ford
1, Marijn Franx
7, Nicole L. Homeier
1,
Garth D. Illingworth5, Myungkook J. Jee
8, Roderik Overzier
1,9, Marc Postman
10, Piero Rosati
11,
Arjen Van der Wel1, and James G. Bartlett
2,121 Department of Physics and Astronomy, Johns Hopkins University, Baltimore, MD 21218
2 University of Paris Denis Diderot, 75205 Paris Cedex 13, France3 GEPI, Observatoire de Paris, Section de Meudon, 5 Place J. Janssen, 92195 Meudon Cedex, France; [email protected]
4 University of California, Berkeley, CA 94720, USA5 Lick Observatory, University of California, Santa Cruz, CA 95064, USA
6 Herzberg Institute of Astrophysics, National Research Council of Canada, Victoria, BC V9E2E7, Canada7 Leiden Observatory, Postbus 9513, 2300 RA Leiden, Netherlands
8 University of California, Davis, CA 95616, USA9 Max-Planck-Institut fur Astrophysik, Karl-Schwarzschild-Strasse 1, D-85748 Garching bei Munchen, Germany
10 Space Telescope Science Institute, 3700 San Martin Drive, Baltimore, MD 21218, USA11 European Southern Observatory, Karl-Schwarzschild-Str. 2, D-85748 Garching, Germany
12 APC, 10 rue Alice Domon et Leonie Duquet, 75205 Paris Cedex 13, France (UMR 7164, CEA, CNRS, Obs. de Paris, Univ. Paris Diderot)Received 2007 November 5; accepted 2008 September 2; published 2008 December 1
ABSTRACT
We apply detailed observations of the color–magnitude relation (CMR) with the Advanced Camera for Surveys onthe Hubble Space Telescope to study galaxy evolution in eight clusters at z ≈ 1. The early-type red sequence is welldefined and elliptical and lenticular galaxies lie on similar CMRs. We analyze CMR parameters—scatter, slope,and zero point—as a function of redshift, galaxy properties and cluster mass. For bright galaxies (MB < −21 mag),the CMR scatter of the elliptical population in cluster cores is smaller than that of the S0 population, althoughthe two become similar at faint magnitudes (MB > −21 mag). While the bright S0 population consistentlyshows larger scatter than the ellipticals, the scatter of the latter increases in the peripheral cluster regions. Ifwe interpret these results as due to age differences, bright elliptical galaxies in cluster cores are, on average,older than S0 galaxies and peripheral elliptical galaxies (by about 0.5 Gyr, using a simple, single-burst solarmetallicity stellar population model). The CMR zero point, slope, and scatter in the (U − B)z=0 rest-frame showno significant evolution out to redshift z ≈ 1.3 or significant dependence on cluster mass. Two of our clustersdisplay CMR zero points that are redder (by ≈2σ ) than the average (U − B)z=0 of our sample. We also analyzethe fraction of morphological early-type and late-type galaxies on the red sequence. We find that, while in themajority of the clusters most (80% to 90%) of the CMR population is composed of early-type galaxies, in thehighest-redshift, low-mass cluster of our sample, the CMR late-type/early-type fractions are similar (≈50%),with most of the late-type population composed of galaxies classified as S0/a. This trend is not correlatedwith the cluster’s X-ray luminosity, or with its velocity dispersion, and could be a real evolution with redshift.
Key words: galaxies: clusters: general – galaxies: elliptical and lenticular, cD – galaxies: evolution
1. INTRODUCTION
Observing the evolution of galaxy properties in clustersallows us to probe galaxy formation on the peaks of the darkmatter distribution. In particular, cluster cores harbor most of theearly-type galaxy population in the universe and are thereforeideal environments to constrain the formation epoch of thesegalaxies and their assembly history, a key issue for galaxyformation theories.
In the local universe, galaxies follow well-defined relations,such as the ubiquitous relation between galaxy color andmagnitude (color–magnitude relation, hereafter CMR. Boweret al. 1992; van Dokkum et al. 1998; Hogg et al. 2004; Lopez-Cruz et al. 2004; Baldry et al. 2004; Bell et al. 2004; Bernardiet al. 2005; McIntosh et al. 2005; De Lucia et al. 2006; Gallazziet al. 2006). The CMR displays a bimodal galaxy distributionwith a tight red concentration defining what is called the redsequence and a more diffuse blue distribution known as the bluecloud. The origin of this segregation is central to understandingthe processes driving galaxy formation. Notably, most of theearly-type galaxy population lies on the red sequence, whilethe majority of star-forming galaxies fall within the blue cloud.
The existence of the red sequence indicates that star formationhas been reduced, or quenched, for most early-type galaxies,an important clue to their evolution. Unless stated otherwise,we hereafter use the term CMR in this paper to refer to theearly-type galaxy CMR, i.e., the red sequence.
Two main processes appear responsible for building the redsequence: quenching of star formation in galaxies in the bluecloud, and merging of less luminous, already red galaxies (seealso, e.g., Bell et al. 2004; van Dokkum 2005). The relativeimportance of the two is not clear, and the mechanisms thatcause quenching are not yet well understood. In this light, itis significant that a decrease in the S0 population is observedin high-redshift clusters (e.g., Dressler et al. 1999; Smith et al.2005; Postman et al. 2005; Desai et al. 2007); one explanationis that late-type galaxies falling into the cluster potentialhave undergone quenching and a morphological transformation,thereby “migrating” onto the red sequence as early-type galaxies(probably S0 galaxies; see, e.g., Poggianti et al. 2006; Moranet al. 2007; Tran et al. 2007).
Faber et al. (2007) give a good overview of our currentunderstanding of the way this migration occurs. The resultsof Poggianti et al. (2006) suggest that only part of the current
42
No. 1, 2009 EVOLUTION OF THE CMR 43
early-type population experienced infall and quenching, whileanother part constitutes a pristine, older galaxy populationestablished during the early moments of cluster formation. Forthese authors, the latter population would correspond to thecluster elliptical population, while the S0 population resultsfrom quenched galaxies.
A wealth of ground-based and space-based observations haveshown that the CMR exists out to redshift z ∼1 (Ellis et al.1997; Stanford et al. 1998; van Dokkum et al. 2000; Blakesleeet al. 2003a; Bell et al. 2004; De Lucia et al. 2004; 2007;Holden et al. 2004; Lidman et al. 2004; Tanaka et al. 2005;Blakeslee et al. 2006; Cucciati et al. 2006; Franzetti et al. 2007;Homeier et al. 2006; Mei et al. 2006a, 2006b; Stanford et al.2006; Willmer et al. 2006; Cooper et al. 2007; Tanaka et al.2007; Arnouts et al. 2008). CMR cluster studies have also beenextended to redshifts as high as 2 < z < 4 by targeting knownproto-clusters believed to be the progenitors of 1014−15 M�galaxy clusters that later virialize between z ∼ 1 and z = 0(Steidel et al. 1998, 2005; Pentericci et al. 2000; Venemanset al. 2002, 2007; Kurk et al. 2004; Overzier et al. 2008). Forexample, Kodama et al. (2007) and Zirm et al. (2008) recentlypushed CMR studies to z > 2 and find an excess of red galaxiesaround radio galaxies, suggesting that the bright end of the CMR(galaxies with masses M∗ > 1011 M�) may already be in placeat z ≈ 2 (but not at z ≈ 3). The significance of these results,however, must await spectroscopic confirmation.
Steidel et al. (2005) find that protocluster galaxies are,on average, older and more massive than similar galaxiesin the field, although there is no evidence for a correlationof morphology with environment at these redshifts (Peteret al. 2007; Overzier et al. 2008). If these structures arerepresentative of massive clusters, this would suggest thattheir high-density environments accelerate galaxy evolutioncompared to more average environments, so that their assemblyepoch can be considered as an upper limit to that of the clusterCMR.
Cassata et al. (2008) studied the rest-frame CMR betweenredshifts z = 1.4 and 3 by combining spectroscopy fromthe Galaxy Mass Assembly ultradeep Spectroscopic Survey(GMASS) with GOODS multi-band photometry to obtain afield galaxy sample of 1021 galaxies down to magnitudem(4.5 μm) = 23 mag. They distinguish bimodality in the color–stellar mass plane out to z = 2. At z > 2 they find red galaxies(M > 1010M�), but the bimodality is no longer observed. Thefraction of early-type galaxies on the red sequence decreasesfrom 60–70% at z<0.5 to 50% at z = 2.
The CMR is usually characterized by a linear relation, definedby a zero point, slope and color scatter. These three parametersdepend on stellar population age and metallicity. The lack ofstrong evolution in the slope and scatter back to z∼1 suggeststhat the CMR primarily reflects a metallicity–mass relation (i.e.,metallicity–magnitude), while the scatter around the CMR ismainly due to galaxy age variations (e.g., Kodama & Arimoto1997; Kauffman & Charlot 1998; Bernardi et al. 2005). Froman analysis of SDSS early-type galaxies, Bernardi et al. (2005)and Gallazzi et al. (2006) concluded that the relation betweengalaxy luminosity (magnitude) and stellar population (colors)arises mainly through a dependence on galaxy velocity disper-sion/stellar mass; both metallicity and luminosity-weighted ageincrease with stellar mass. The intrinsic color scatter around theCMR, on the other hand, appears driven principally by galaxyage, with a small contribution from metallicity variations. Thisimplies that accurate galaxy color measurements (e.g., when the
intrinsic scatter can be measured because of small uncertaintieson galaxy colors) can be used to constrain galaxy formationages.
At both low and high (z ≈ 1) redshift, wide ground-basedsurveys have identified some general trends in the CMR. Usinga large sample (55,158 galaxies) of local (0.08 < z < 0.12)galaxies selected from the Sloan Digital Sky Survey (SDSS;York et al. 2000), Hogg et al. (2004) find a CMR with remarkablystable parameters for bulge-dominated galaxies in differentenvironments, with changes in the metallicity and age of the redpopulation of less than 20%, according to Bruzual & Charlot(2003) stellar population models. Baldry et al. (2004) studieda different subsample of the SDSS data, at lower redshift(0.004 < z < 0.08; 207,654 objects, most with spectroscopicobservations), fitting the red and blue peaks of the CMR with adouble Gaussian and deriving best fits for both relations over alarge range in magnitude, −23.5 < Mr < −15.5 mag. Theseauthors show that even if a linear fit is a good approximation tothe red sequence (and the blue sequence) for bright magnitudes,a linear plus a tanh function fit is necessary to cover the entiremagnitude range of their sample. The mean position of the redsequence does not change significantly with environment intheir local sample (Balogh et al. 2004; Baldry et al. 2006). Theyfound a strong dependence of the red fraction with environmentand stellar mass (with the galaxy red fraction increasing withboth projected neighbor density and galaxy stellar mass),consistent with predictions from semi-analytical models basedon the Millennium simulation (Bower et al. 2006, Croton et al.2006).
Cucciati at al. (2006) and Franzetti et al. (2007) performed asimilar kind of analysis out to z ≈ 1.5 with a sample of ≈6000galaxies from the VIMOS–VLT Deep Survey. By comparinglocal and high (z ≈ 1) redshift samples, they show that theCMR distribution is not universal, but rather depends on redshiftand environment. While in the local universe they found (asis commonly found) a dominance of red-sequence galaxies inoverdense regions—with less dense regions mostly populatedby blue galaxies—at higher redshifts they suggest that this trendmight possibly be reversed, with a more pronounced presenceof blue galaxies in higher density regions. The inversion ismainly observed at z > 1, with the red population equallydistributed in different environments at 0.9 < z < 1.2 (e.g.,the fraction of red galaxies does not depend on environment;see also Cooper et al. 2007 for a different interpretationof these results), and an increase of blue galaxies in high-density regions at 1.2 < z < 1.5. A high fraction (35–40%)of their red-sequence galaxies turned out to be star-forminggalaxies, showing the importance of good morphological orspectroscopical classification to studies of early-type galaxieson the red sequence.
Cooper et al. (2007) performed a similar analysis on a muchlarger sample of 19,464 field and group galaxies from theDEEP2 Galaxy Redshift Survey (0.4 < z < 1.35). They founda highly significant relation between galaxy red fraction andenvironment at z ≈ 1, which disappears at z > 1.3, contrary towhat Cucciati et al. found. Exploring this difference in detail,they pointed out that the two results are consistent if the largeruncertainties inherent in the smaller sample of Cucciati et al. anddifferences in data analysis techniques are taken into account.With a better sample and a more detailed analysis, they concludethat a significant relation between red fraction and environmentstill exists at z ≈ 1, demonstrating that a reversal of the color–density relation is not confirmed by the data. While the fraction
44 MEI ET AL. Vol. 690
of galaxies on the red sequence decreases with redshift inoverdense environments (mainly groups of galaxies), it remainsconstant in the field. The two become comparable at z ≈ 1.3(see also Gerke et al. 2007). Their results support a scenarioin which the local environment was important in quenchingstar formation and populating the red sequence in overdenseenvironments.
The present observational situation highlights the importanceof detailed studies of galaxies at redshifts 0.5 < z < 1.5 thatcombine both accurate color measurements and morphologicalclassifications. Although the wealth of ground-based observa-tions has lead to the identification of significant trends in theCMR, only the high-resolution, high-sensitivity observationsafforded by the Advanced Camera for Surveys (ACS; Ford et al.2002) on the Hubble Space Telescope (HST) permit these twoessential measurements, otherwise impossible from the groundat high redshift: (1) the morphological classification of galaxiesas Hubble types out to z ≈ 1 (e.g., Postman et al. 2005) and (2)galaxy color measurements to an accuracy of a few percent of amagnitude (Sirianni et al. 2005; Blakeslee et al. 2003a).
This is precisely one of the main goals of the ACS Interme-diate Redshift Cluster Survey (Ford et al. 2004; Postman et al.2005; see also Table 1). As part of this survey, we observedeight X-ray luminous galaxy clusters with redshifts between 0.8and ∼1.3. This is now the best sample available in terms ofmulti-wavelength observations and spectroscopic follow-up ofknown clusters at z ∼ 1. While eight clusters do not constitutea large sample when compared to ground-based galaxy clustersamples in the local universe, this is the best sample availablewith ACS morphological classification and high precision colormeasurements. And it provides the opportunity to take a closerlook at average color trends observed from the ground and findcorrelations between these trends and galaxy morphology andcolor-derived ages.
CMRs were presented for each cluster in a series of dedicatedpapers (Blakeslee et al. 2003a, 2006; Homeier et al. 2006; Meiet al. 2006a, 2006b, hereafter the CMR paper series). The prin-cipal aim of the CMR paper series was to constrain galaxy agesand study variations in CMR parameters as a function of galaxymorphology and structural properties (e.g., effective radii, el-lipticities, surface brightness). We give the mean luminosityweighted ages derived for the elliptical population in Table 1,using stellar population models from Bruzual & Charlot (2003;hereafter BC03). We found elliptical population ages rangingfrom 2.5 to 3.5 Gyr, depending on cluster redshift, with anaverage formation redshift zf � 2. Early-type galaxy massesrange from ≈1011 to ≈ 1012M� (Holden et al. 2006; Retturaet al. 2006). Galaxy masses were estimated using galaxy color orSEDs, with an error in mass of ≈ 40%. CMR scatter was shownto increase slightly at faint luminosities and with distance fromcluster X-ray emission centers. This suggested that fainter (andthus less massive) and more peripheral galaxies have a largerage dispersion than bright central galaxies. This dependence ongalaxy luminosity/mass and environment is also observed inlocal samples (Hogg et al. 2004; Bernardi et al. 2005; McIntoshet al. 2005; Gallazzi et al. 2006).
In this paper, we use the full sample to systematicallyinvestigate trends in CMR parameters and their dependence onredshift and galaxy cluster properties. Our sample is discussedin Section 2. In Section 3 we present our CMR measurements,in Section 4 our results, and we conclude with Section 5.
We adopt the WMAP cosmology (Spergel et al. 2007)Ωmh2 = 0.137, ΩΛ = 0.72, h = 0.70) as our standard
cosmology. All ACS filter magnitudes are given in the ABsystem (Oke & Gunn 1983; for the ACS, see Sirianni et al.2005), while magnitudes in the Johnson system (Johnson &Morgan 1953; Buser & Kurucz 1978; Bessel 1990) are given asVega magnitudes (see also Appendix B).
2. THE ACS INTERMEDIATE REDSHIFT CLUSTERSURVEY
2.1. The Sample
The ACS Intermediate Redshift Cluster Survey includes eightclusters with redshifts between 0.8 and 1.27. Five of the clusterswere identified from the ROSAT Deep Cluster Survey (Rosatiet al. 1998), while MS 1054−03 comes from the EinsteinExtended Medium Sensitivity Survey (Gioia & Luppino 1994)and the clusters CL 1604+4304 and CL 1604+4321 were foundin a Palomar deep near-infrared photographic survey (Gunnet al. 1986). Recently, CL 1604+4304 and CL 1604+4321 wereobserved in the X-ray by Lubin et al. (2004) and Kocevski et al.(2008), who detected CL 1604+4304 and set an upper limit onemission from CL 1604+4321.
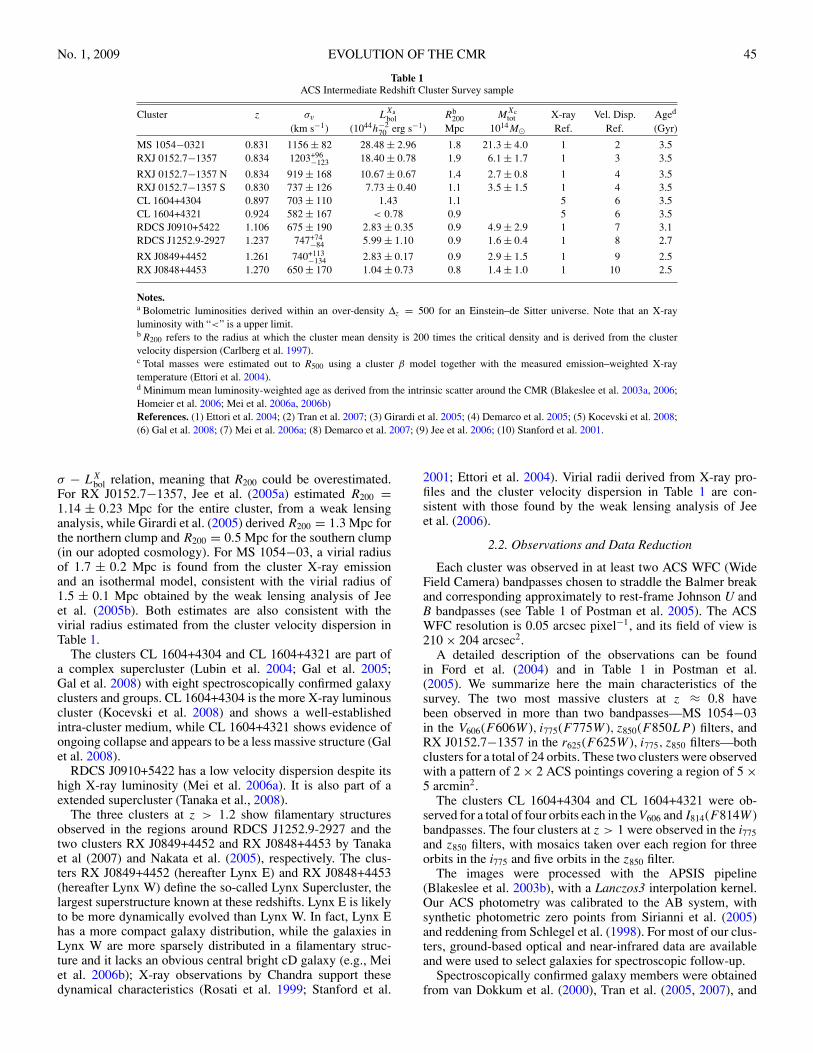
Table 1 shows the principal properties of this sample (seealso Table 1 and the sample description in Ford et al. 2004and Postman et al. 2005). It spans cluster bolometric X-rayluminosities from ∼1.5 to ∼28 × 1044h−2 erg s−1, velocitydispersions from ∼600 to ∼1200 km s−1, and estimated totalmasses from ∼1.3 to 21 × 1014M�. We have measuredaccurate redshifts with spectroscopic follow-up for a largesample of galaxies in most of these clusters (van Dokkumet al. 2000; Tran et al. 2005, 2007; Demarco et al. 2005,2007). Where available (all clusters except CL 1604+4304 andCL 1604+4321), bolometric X-ray luminosities and total clustermass estimates (dark and visible matter) are taken from Ettoriet al. (2004), which gives us as homogeneous a sample aspossible. We use R200, defined as the radius at which thecluster mean density is 200 times the critical density, as anapproximation for the virial radius; in this paper, it is derivedfrom the cluster velocity dispersion (as per Carlberg et al.1997).
These eight clusters are still in the process of forming,showing filamentary and clumpy structures (Gal & Lubin 2004;Gal et al. 2005; Nakata et al. 2005; Tanaka et al. 2005;Tanaka et al. 2007; Gal et al. 2008). X-ray luminosities andvelocity dispersions deviate from the standard LX versus σrelation for clusters (e.g., Wu et al. 1999; Rosati et al. 2002;Mei et al. 2006a), implying that neither X-ray luminosity norcluster velocity dispersion can be used as unbiased proxies ofcluster mass. In general, X-ray luminosity is very sensitive toprocesses in cluster cores and can be enhanced by substructureand merging of sub-clumps, while velocity dispersions can beboosted by infalling substructures. We will use both in ouranalysis, but keeping this caveat in mind.
Both MS 1054−03 and RX J0152.7−1357 display complexstructure in the X-ray and the optical. We observe centralcluster clumps surrounded by minor satellite groups (Gioiaet al. 2004; Demarco et al. 2005; Tran et al. 2005; Jeeet al. 2005a, 2005b; Tanaka et al. 2005). In MS 1054−03 thedifferent peaks in the X-ray and optical distributions are not wellseparated, while in RX J0152.7−1357 there are two distinctcentral clumps (a northern and a southern clump; Maughanet al. 2003), contained within well-defined circular regionsidentified by Demarco et al. (2005). The velocity dispersionsin these clusters are higher than expected from a simple linear
No. 1, 2009 EVOLUTION OF THE CMR 45
Table 1ACS Intermediate Redshift Cluster Survey sample
Cluster z σv LXabol Rb
200 MXctot X-ray Vel. Disp. Aged
(km s−1) (1044h−270 erg s−1) Mpc 1014M� Ref. Ref. (Gyr)
MS 1054−0321 0.831 1156 ± 82 28.48 ± 2.96 1.8 21.3 ± 4.0 1 2 3.5RXJ 0152.7−1357 0.834 1203+96
−123 18.40 ± 0.78 1.9 6.1 ± 1.7 1 3 3.5
RXJ 0152.7−1357 N 0.834 919 ± 168 10.67 ± 0.67 1.4 2.7 ± 0.8 1 4 3.5RXJ 0152.7−1357 S 0.830 737 ± 126 7.73 ± 0.40 1.1 3.5 ± 1.5 1 4 3.5CL 1604+4304 0.897 703 ± 110 1.43 1.1 5 6 3.5CL 1604+4321 0.924 582 ± 167 < 0.78 0.9 5 6 3.5RDCS J0910+5422 1.106 675 ± 190 2.83 ± 0.35 0.9 4.9 ± 2.9 1 7 3.1RDCS J1252.9-2927 1.237 747+74
−84 5.99 ± 1.10 0.9 1.6 ± 0.4 1 8 2.7
RX J0849+4452 1.261 740+113−134 2.83 ± 0.17 0.9 2.9 ± 1.5 1 9 2.5
RX J0848+4453 1.270 650 ± 170 1.04 ± 0.73 0.8 1.4 ± 1.0 1 10 2.5
Notes.a Bolometric luminosities derived within an over-density Δz = 500 for an Einstein–de Sitter universe. Note that an X-rayluminosity with “<” is a upper limit.b R200 refers to the radius at which the cluster mean density is 200 times the critical density and is derived from the clustervelocity dispersion (Carlberg et al. 1997).c Total masses were estimated out to R500 using a cluster β model together with the measured emission–weighted X-raytemperature (Ettori et al. 2004).d Minimum mean luminosity-weighted age as derived from the intrinsic scatter around the CMR (Blakeslee et al. 2003a, 2006;Homeier et al. 2006; Mei et al. 2006a, 2006b)References. (1) Ettori et al. 2004; (2) Tran et al. 2007; (3) Girardi et al. 2005; (4) Demarco et al. 2005; (5) Kocevski et al. 2008;(6) Gal et al. 2008; (7) Mei et al. 2006a; (8) Demarco et al. 2007; (9) Jee et al. 2006; (10) Stanford et al. 2001.
σ − LXbol relation, meaning that R200 could be overestimated.
For RX J0152.7−1357, Jee et al. (2005a) estimated R200 =1.14 ± 0.23 Mpc for the entire cluster, from a weak lensinganalysis, while Girardi et al. (2005) derived R200 = 1.3 Mpc forthe northern clump and R200 = 0.5 Mpc for the southern clump(in our adopted cosmology). For MS 1054−03, a virial radiusof 1.7 ± 0.2 Mpc is found from the cluster X-ray emissionand an isothermal model, consistent with the virial radius of1.5 ± 0.1 Mpc obtained by the weak lensing analysis of Jeeet al. (2005b). Both estimates are also consistent with thevirial radius estimated from the cluster velocity dispersion inTable 1.
The clusters CL 1604+4304 and CL 1604+4321 are part ofa complex supercluster (Lubin et al. 2004; Gal et al. 2005;Gal et al. 2008) with eight spectroscopically confirmed galaxyclusters and groups. CL 1604+4304 is the more X-ray luminouscluster (Kocevski et al. 2008) and shows a well-establishedintra-cluster medium, while CL 1604+4321 shows evidence ofongoing collapse and appears to be a less massive structure (Galet al. 2008).
RDCS J0910+5422 has a low velocity dispersion despite itshigh X-ray luminosity (Mei et al. 2006a). It is also part of aextended supercluster (Tanaka et al., 2008).
The three clusters at z > 1.2 show filamentary structuresobserved in the regions around RDCS J1252.9-2927 and thetwo clusters RX J0849+4452 and RX J0848+4453 by Tanakaet al (2007) and Nakata et al. (2005), respectively. The clus-ters RX J0849+4452 (hereafter Lynx E) and RX J0848+4453(hereafter Lynx W) define the so-called Lynx Supercluster, thelargest superstructure known at these redshifts. Lynx E is likelyto be more dynamically evolved than Lynx W. In fact, Lynx Ehas a more compact galaxy distribution, while the galaxies inLynx W are more sparsely distributed in a filamentary struc-ture and it lacks an obvious central bright cD galaxy (e.g., Meiet al. 2006b); X-ray observations by Chandra support thesedynamical characteristics (Rosati et al. 1999; Stanford et al.
2001; Ettori et al. 2004). Virial radii derived from X-ray pro-files and the cluster velocity dispersion in Table 1 are con-sistent with those found by the weak lensing analysis of Jeeet al. (2006).
2.2. Observations and Data Reduction
Each cluster was observed in at least two ACS WFC (WideField Camera) bandpasses chosen to straddle the Balmer breakand corresponding approximately to rest-frame Johnson U andB bandpasses (see Table 1 of Postman et al. 2005). The ACSWFC resolution is 0.05 arcsec pixel−1, and its field of view is210 × 204 arcsec2.
A detailed description of the observations can be foundin Ford et al. (2004) and in Table 1 in Postman et al.(2005). We summarize here the main characteristics of thesurvey. The two most massive clusters at z ≈ 0.8 havebeen observed in more than two bandpasses—MS 1054−03in the V606(F606W ), i775(F775W ), z850(F850LP ) filters, andRX J0152.7−1357 in the r625(F625W ), i775, z850 filters—bothclusters for a total of 24 orbits. These two clusters were observedwith a pattern of 2 × 2 ACS pointings covering a region of 5 ×5 arcmin2.
The clusters CL 1604+4304 and CL 1604+4321 were ob-served for a total of four orbits each in the V606 and I814(F814W )bandpasses. The four clusters at z > 1 were observed in the i775and z850 filters, with mosaics taken over each region for threeorbits in the i775 and five orbits in the z850 filter.
The images were processed with the APSIS pipeline(Blakeslee et al. 2003b), with a Lanczos3 interpolation kernel.Our ACS photometry was calibrated to the AB system, withsynthetic photometric zero points from Sirianni et al. (2005)and reddening from Schlegel et al. (1998). For most of our clus-ters, ground-based optical and near-infrared data are availableand were used to select galaxies for spectroscopic follow-up.
Spectroscopically confirmed galaxy members were obtainedfrom van Dokkum et al. (2000), Tran et al. (2005, 2007), and
46 MEI ET AL. Vol. 690
Demarco et al. (2005) for MS 1054−03 and RX J0152.7−1357(see Blakeslee et al. 2006), from Gal & Lubin (2004) forCL 1604+4304 and CL 1604+4321 (see Homeier et al. 2006),from S. A. Stanford (private communication; see Mei et al.2006a) for RDCS J0910+5422, from Demarco et al. (2007)for RDCS J1252.9−2927, and from Rosati et al. (1999), Stan-ford et al. (1997) and B. P. Holden et al. 2008 (in prepara-tion) for the Lynx Supercluster (see Mei et al. 2006b). Spectro-scopically confirmed interlopers have been excluded from ouranalysis.
3. COLOR–MAGNITUDE RELATION IN THE ACSINTERMEDIATE CLUSTER SURVEY
3.1. Galaxy Sample Selection
In this analysis we concentrate on the early-type red sequence.We select early-type CMR galaxy candidates using the visualmorphological classification from Postman et al. (2005), ACSgalaxy colors and, when available, ground-based infrared pho-tometry and spectroscopy (Blakeslee et al. 2003a, 2006; Home-ier et al. 2006; Mei et al. 2006a, 2006b).
First, we use the catalogs of Postman et al. (2005) to selectearly-type galaxies. From here on, the terms early-type andlate-type galaxy refer, respectively, to galaxies morphologicallyclassified as elliptical and S0, and as spiral galaxies according toPostman et al. (2005). Thanks, in particular, to the high angularresolution and sensitivity of the ACS, the Postman et al. (2005)visual morphological classification distinguishes two differentclasses of early-type galaxies—elliptical and S0—and differentclasses of late-type galaxies. Of the latter, however, we onlyconsidered the S0/a as a separate class in this work.
In MS 1054−03 and RX J0152.7−1357, we considered onlyspectroscopically confirmed cluster members. For all clusters,following the morphological selection, we perform a color cutto further isolate the likely cluster members. To this end, weused SExtractor (Bertin & Arnouts 1996) photometry in dual-image mode, as in Benıtez et al. (2004). This means that objectdetection employed the two filters simultaneously, and objectfluxes were then measured independently in the two filtersusing the same object coordinates and apertures. This colorselection was performed to extract galaxies over the color range0.1 � (U − B)z=0 � 0.8 mag.
3.2. Measurements of Galaxy Color and Magnitude
In order to accurately determine the early-type CMR, wemade precision color measurements on the galaxies selectedas described above. Aiming to avoid systematics due to internalgalaxy gradients, our final colors were measured inside a circularaperture scaled by the galaxy average half-light radius Re (vanDokkum et al. 1998, 2000; Scodeggio 2001). The primaryeffect of internal galaxy gradients on this sample would be asteepening of the CMR slope (e.g., by ∼50% when isophotalcolors from SExtractor are used). Our Re values were derived byfitting elliptical Sersic models to each galaxy image using theprogram GALFIT (Peng et al. 2002). In the fit we constrainedthe Sersic index to 1 � n � 4. Our final results do not change(within the uncertainties) if the effective radii are calculatedvia a two-component (Sersic bulge + exponential disk) surfacebrightness decomposition technique using GIM2D (Marleau &Simard 1998; Rettura et al. 2006) that better fits the galaxy lightprofile (Mei et al. 2006a).
We removed blurring effects due to different point-spreadfunctions (PSFs) by deconvolving galaxy images with the
CLEAN algorithm (Hogbom 1974). Final colors were measuredon the deconvolved images within a circular aperture equal toRe
√q (see Blakeslee et al. 2006), where q = b
ais the axial ratio
obtained from GALFIT. When Re < 3 pixels, we set it equalto 3 pixels. Our median Re is ≈5 pixels (0.25 arcsec, ≈2 kpc atz ≈ 1).
For most of the clusters, we estimate color errors by addingthe uncertainty due to flat fielding, point-spread function (PSF)variations, and ACS pixel-to-pixel correlations in quadratureto the flux uncertainties (Sirianni et al. 2005). The imagescovering MS 1054−03 and RX J0152.7−1357 were processedboth individually and as a large mosaic (see details in Blakesleeet al. 2006) to assess the color measurement uncertainties. Withthe high sensitivity of the ACS, we reach, on average, coloruncertainties of 0.01 and 0.03 mag, an impressive achievementof the HST for galaxies at these high redshifts.
We used SExtractor’s MAGAUTO as an estimate of galaxytotal magnitude. As pointed out by Benıtez et al. (2004),Giavalisco et al. (2004), and Blakeslee et al. (2006), comparisonto other measures suggests that MAGAUTO is an imperfectestimator. Specifically, Benıtez et al. (2004) required a fifth-order polynomial to describe the relation between MAGAUTOand the difference between MAGAUTO and the asymptoticisophotal Sextractor magnitude. Over the magnitude range20.5 � i775 � 23.5 mag, Blakeslee et al. (2006) found aconstant shift of 0.2 mag between GALFIT and MAGAUTOtotal magnitudes. Giavalisco et al. (2004) discovered a similarsystematic offset of ≈0.2–0.3 mag between MAGAUTO andsimulated spheroid magnitudes for the magnitude range of oursample. Bertin & Arnouts (1996), Giavalisco et al. (2004), andHaussler et al. (2007) found that both GALFIT and SExtractormagnitudes give estimates fainter than real magnitudes by aquantity that depends on galaxy surface brightness and the skybrightness determination. We will not correct our MAGAUTOACS magnitudes in this paper, but, keeping this in mind,will warn the reader when a comparison to other samples ismade.
3.3. Measurements of Galaxy Properties and Projected Density
Each galaxy is described by its ellipticity (defined as 1-q),average half-light radius Re, and Sersic index n. These parame-ters are found by fitting elliptical Sersic models to each galaxyimage using GALFIT. As described above, q = b
ais the axial
ratio obtained from GALFIT and we constrained 1 � n � 4.Postman et al. (2005) provide the neighbor galaxy projected
density Σ for each galaxy. These densities were calculated usingthe distance to the seventh nearest neighbor (Postman et al.2005 for details). Both the nearest-N-neighbor approach andfriends-of-friends algorithm gave consistent results (Postmanet al. 2005), indicating the robustness of this measurement.A good estimate of galaxy densities implies the ability tocorrect for fore/background galaxy contaminants. The densityestimate is more accurate for some of clusters (MS 1054−0321,RX J0152−1357, and RDCS J1252−2927) where spectroscopicor photometric redshift information was available; this enabledus to exclude fore/background objects (see the Appendix inPostman et al. 2005). When redshift information was notavailable, a statistical background correction was applied withthe caveat that it is only reliable in dense regions (>80 GalMpc−2). Statistical uncertainties on the galaxy projected densityare estimated to be ≈0.2 dex in Gal Mpc−2 (≈0.2 log10Σ;Postman et al. 2005).
No. 1, 2009 EVOLUTION OF THE CMR 47
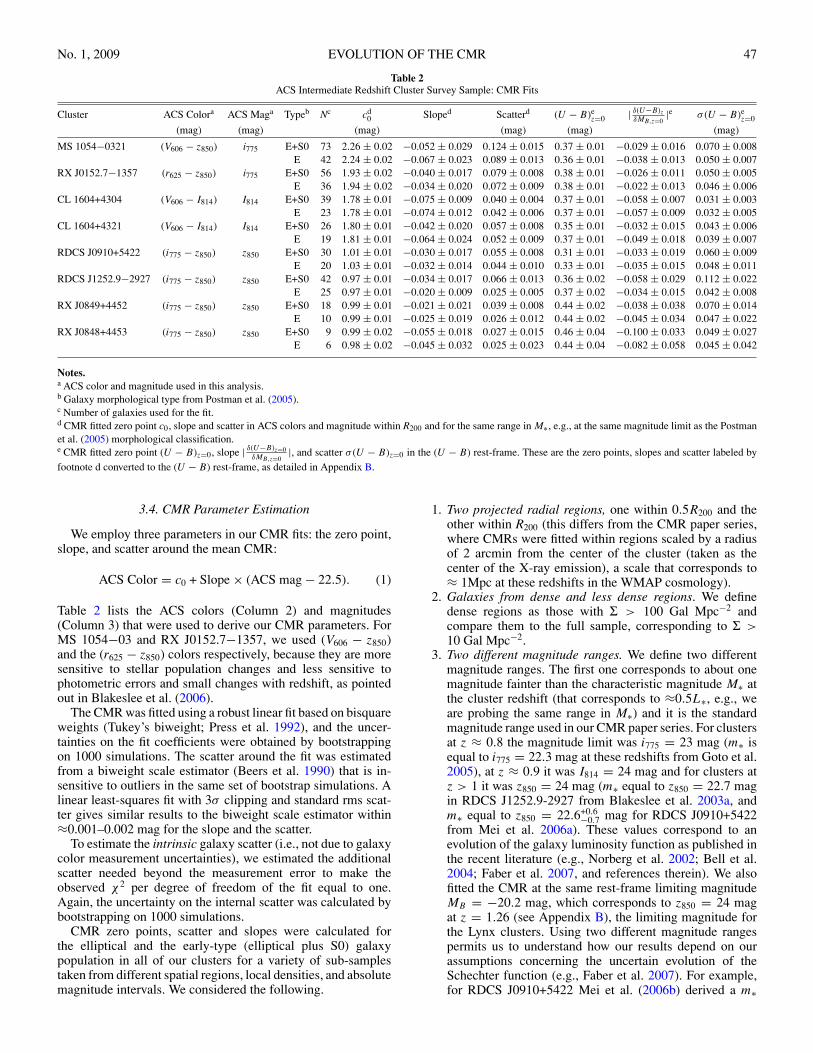
Table 2ACS Intermediate Redshift Cluster Survey Sample: CMR Fits
Cluster ACS Colora ACS Maga Typeb Nc cd0 Sloped Scatterd (U − B)e
z=0 | δ(U−B)zδMB,z=0
|e σ (U − B)ez=0
(mag) (mag) (mag) (mag) (mag) (mag)
MS 1054−0321 (V606 − z850) i775 E+S0 73 2.26 ± 0.02 −0.052 ± 0.029 0.124 ± 0.015 0.37 ± 0.01 −0.029 ± 0.016 0.070 ± 0.008E 42 2.24 ± 0.02 −0.067 ± 0.023 0.089 ± 0.013 0.36 ± 0.01 −0.038 ± 0.013 0.050 ± 0.007
RX J0152.7−1357 (r625 − z850) i775 E+S0 56 1.93 ± 0.02 −0.040 ± 0.017 0.079 ± 0.008 0.38 ± 0.01 −0.026 ± 0.011 0.050 ± 0.005E 36 1.94 ± 0.02 −0.034 ± 0.020 0.072 ± 0.009 0.38 ± 0.01 −0.022 ± 0.013 0.046 ± 0.006
CL 1604+4304 (V606 − I814) I814 E+S0 39 1.78 ± 0.01 −0.075 ± 0.009 0.040 ± 0.004 0.37 ± 0.01 −0.058 ± 0.007 0.031 ± 0.003E 23 1.78 ± 0.01 −0.074 ± 0.012 0.042 ± 0.006 0.37 ± 0.01 −0.057 ± 0.009 0.032 ± 0.005
CL 1604+4321 (V606 − I814) I814 E+S0 26 1.80 ± 0.01 −0.042 ± 0.020 0.057 ± 0.008 0.35 ± 0.01 −0.032 ± 0.015 0.043 ± 0.006E 19 1.81 ± 0.01 −0.064 ± 0.024 0.052 ± 0.009 0.37 ± 0.01 −0.049 ± 0.018 0.039 ± 0.007
RDCS J0910+5422 (i775 − z850) z850 E+S0 30 1.01 ± 0.01 −0.030 ± 0.017 0.055 ± 0.008 0.31 ± 0.01 −0.033 ± 0.019 0.060 ± 0.009E 20 1.03 ± 0.01 −0.032 ± 0.014 0.044 ± 0.010 0.33 ± 0.01 −0.035 ± 0.015 0.048 ± 0.011
RDCS J1252.9−2927 (i775 − z850) z850 E+S0 42 0.97 ± 0.01 −0.034 ± 0.017 0.066 ± 0.013 0.36 ± 0.02 −0.058 ± 0.029 0.112 ± 0.022E 25 0.97 ± 0.01 −0.020 ± 0.009 0.025 ± 0.005 0.37 ± 0.02 −0.034 ± 0.015 0.042 ± 0.008
RX J0849+4452 (i775 − z850) z850 E+S0 18 0.99 ± 0.01 −0.021 ± 0.021 0.039 ± 0.008 0.44 ± 0.02 −0.038 ± 0.038 0.070 ± 0.014E 10 0.99 ± 0.01 −0.025 ± 0.019 0.026 ± 0.012 0.44 ± 0.02 −0.045 ± 0.034 0.047 ± 0.022
RX J0848+4453 (i775 − z850) z850 E+S0 9 0.99 ± 0.02 −0.055 ± 0.018 0.027 ± 0.015 0.46 ± 0.04 −0.100 ± 0.033 0.049 ± 0.027E 6 0.98 ± 0.02 −0.045 ± 0.032 0.025 ± 0.023 0.44 ± 0.04 −0.082 ± 0.058 0.045 ± 0.042
Notes.a ACS color and magnitude used in this analysis.b Galaxy morphological type from Postman et al. (2005).c Number of galaxies used for the fit.d CMR fitted zero point c0, slope and scatter in ACS colors and magnitude within R200 and for the same range in M∗, e.g., at the same magnitude limit as the Postmanet al. (2005) morphological classification.e CMR fitted zero point (U − B)z=0, slope | δ(U−B)z=0
δMB,z=0|, and scatter σ (U − B)z=0 in the (U − B) rest-frame. These are the zero points, slopes and scatter labeled by
footnote d converted to the (U − B) rest-frame, as detailed in Appendix B.
3.4. CMR Parameter Estimation
We employ three parameters in our CMR fits: the zero point,slope, and scatter around the mean CMR:
ACS Color = c0 + Slope × (ACS mag − 22.5). (1)
Table 2 lists the ACS colors (Column 2) and magnitudes(Column 3) that were used to derive our CMR parameters. ForMS 1054−03 and RX J0152.7−1357, we used (V606 − z850)and the (r625 − z850) colors respectively, because they are moresensitive to stellar population changes and less sensitive tophotometric errors and small changes with redshift, as pointedout in Blakeslee et al. (2006).
The CMR was fitted using a robust linear fit based on bisquareweights (Tukey’s biweight; Press et al. 1992), and the uncer-tainties on the fit coefficients were obtained by bootstrappingon 1000 simulations. The scatter around the fit was estimatedfrom a biweight scale estimator (Beers et al. 1990) that is in-sensitive to outliers in the same set of bootstrap simulations. Alinear least-squares fit with 3σ clipping and standard rms scat-ter gives similar results to the biweight scale estimator within≈0.001–0.002 mag for the slope and the scatter.
To estimate the intrinsic galaxy scatter (i.e., not due to galaxycolor measurement uncertainties), we estimated the additionalscatter needed beyond the measurement error to make theobserved χ2 per degree of freedom of the fit equal to one.Again, the uncertainty on the internal scatter was calculated bybootstrapping on 1000 simulations.
CMR zero points, scatter and slopes were calculated forthe elliptical and the early-type (elliptical plus S0) galaxypopulation in all of our clusters for a variety of sub-samplestaken from different spatial regions, local densities, and absolutemagnitude intervals. We considered the following.
1. Two projected radial regions, one within 0.5R200 and theother within R200 (this differs from the CMR paper series,where CMRs were fitted within regions scaled by a radiusof 2 arcmin from the center of the cluster (taken as thecenter of the X-ray emission), a scale that corresponds to≈ 1Mpc at these redshifts in the WMAP cosmology).
2. Galaxies from dense and less dense regions. We definedense regions as those with Σ > 100 Gal Mpc−2 andcompare them to the full sample, corresponding to Σ >10 Gal Mpc−2.
3. Two different magnitude ranges. We define two differentmagnitude ranges. The first one corresponds to about onemagnitude fainter than the characteristic magnitude M∗ atthe cluster redshift (that corresponds to ≈0.5L∗, e.g., weare probing the same range in M∗) and it is the standardmagnitude range used in our CMR paper series. For clustersat z ≈ 0.8 the magnitude limit was i775 = 23 mag (m∗ isequal to i775 = 22.3 mag at these redshifts from Goto et al.2005), at z ≈ 0.9 it was I814 = 24 mag and for clusters atz > 1 it was z850 = 24 mag (m∗ equal to z850 = 22.7 magin RDCS J1252.9-2927 from Blakeslee et al. 2003a, andm∗ equal to z850 = 22.6+0.6
−0.7 mag for RDCS J0910+5422from Mei et al. 2006a). These values correspond to anevolution of the galaxy luminosity function as published inthe recent literature (e.g., Norberg et al. 2002; Bell et al.2004; Faber et al. 2007, and references therein). We alsofitted the CMR at the same rest-frame limiting magnitudeMB = −20.2 mag, which corresponds to z850 = 24 magat z = 1.26 (see Appendix B), the limiting magnitude forthe Lynx clusters. Using two different magnitude rangespermits us to understand how our results depend on ourassumptions concerning the uncertain evolution of theSchechter function (e.g., Faber et al. 2007). For example,for RDCS J0910+5422 Mei et al. (2006b) derived a m∗
48 MEI ET AL. Vol. 690
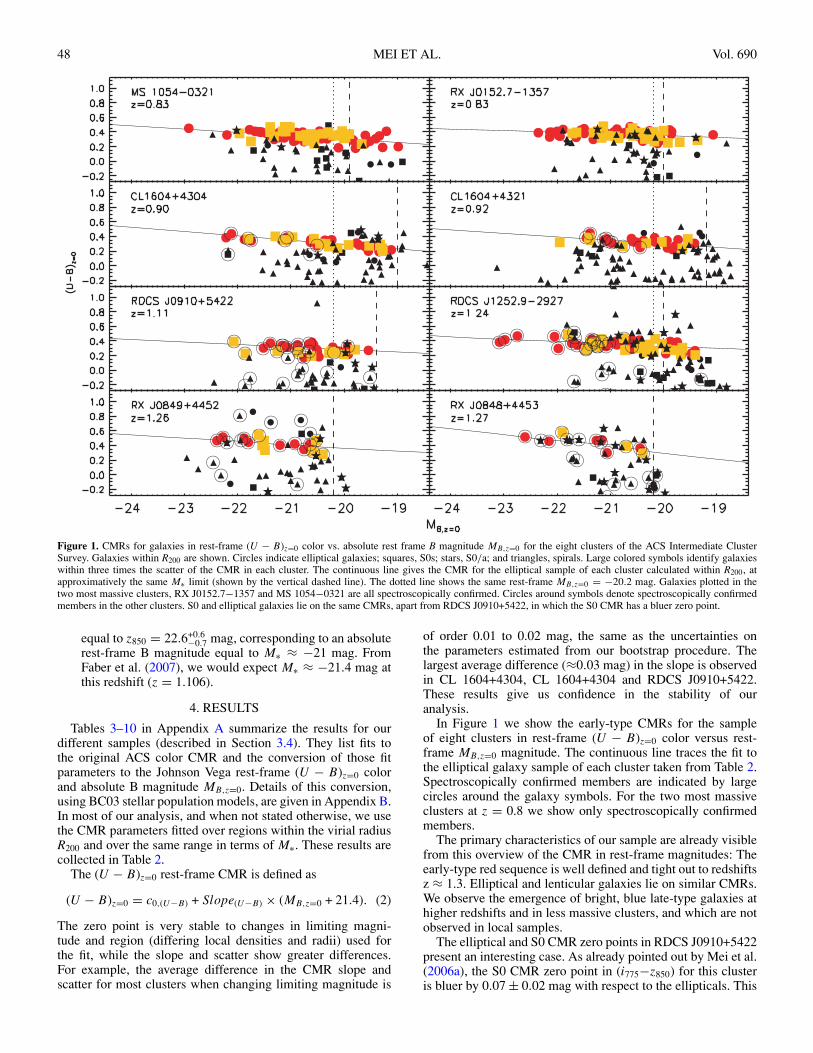
Figure 1. CMRs for galaxies in rest-frame (U − B)z=0 color vs. absolute rest frame B magnitude MB,z=0 for the eight clusters of the ACS Intermediate ClusterSurvey. Galaxies within R200 are shown. Circles indicate elliptical galaxies; squares, S0s; stars, S0/a; and triangles, spirals. Large colored symbols identify galaxieswithin three times the scatter of the CMR in each cluster. The continuous line gives the CMR for the elliptical sample of each cluster calculated within R200, atapproximatively the same M∗ limit (shown by the vertical dashed line). The dotted line shows the same rest-frame MB,z=0 = −20.2 mag. Galaxies plotted in thetwo most massive clusters, RX J0152.7−1357 and MS 1054−0321 are all spectroscopically confirmed. Circles around symbols denote spectroscopically confirmedmembers in the other clusters. S0 and elliptical galaxies lie on the same CMRs, apart from RDCS J0910+5422, in which the S0 CMR has a bluer zero point.
equal to z850 = 22.6+0.6−0.7 mag, corresponding to an absolute
rest-frame B magnitude equal to M∗ ≈ −21 mag. FromFaber et al. (2007), we would expect M∗ ≈ −21.4 mag atthis redshift (z = 1.106).
4. RESULTS
Tables 3–10 in Appendix A summarize the results for ourdifferent samples (described in Section 3.4). They list fits tothe original ACS color CMR and the conversion of those fitparameters to the Johnson Vega rest-frame (U − B)z=0 colorand absolute B magnitude MB,z=0. Details of this conversion,using BC03 stellar population models, are given in Appendix B.In most of our analysis, and when not stated otherwise, we usethe CMR parameters fitted over regions within the virial radiusR200 and over the same range in terms of M∗. These results arecollected in Table 2.
The (U − B)z=0 rest-frame CMR is defined as
(U − B)z=0 = c0,(U−B) + Slope(U−B) × (MB,z=0 + 21.4). (2)
The zero point is very stable to changes in limiting magni-tude and region (differing local densities and radii) used forthe fit, while the slope and scatter show greater differences.For example, the average difference in the CMR slope andscatter for most clusters when changing limiting magnitude is
of order 0.01 to 0.02 mag, the same as the uncertainties onthe parameters estimated from our bootstrap procedure. Thelargest average difference (≈0.03 mag) in the slope is observedin CL 1604+4304, CL 1604+4304 and RDCS J0910+5422.These results give us confidence in the stability of ouranalysis.
In Figure 1 we show the early-type CMRs for the sampleof eight clusters in rest-frame (U − B)z=0 color versus rest-frame MB,z=0 magnitude. The continuous line traces the fit tothe elliptical galaxy sample of each cluster taken from Table 2.Spectroscopically confirmed members are indicated by largecircles around the galaxy symbols. For the two most massiveclusters at z = 0.8 we show only spectroscopically confirmedmembers.
The primary characteristics of our sample are already visiblefrom this overview of the CMR in rest-frame magnitudes: Theearly-type red sequence is well defined and tight out to redshiftsz ≈ 1.3. Elliptical and lenticular galaxies lie on similar CMRs.We observe the emergence of bright, blue late-type galaxies athigher redshifts and in less massive clusters, and which are notobserved in local samples.
The elliptical and S0 CMR zero points in RDCS J0910+5422present an interesting case. As already pointed out by Mei et al.(2006a), the S0 CMR zero point in (i775−z850) for this clusteris bluer by 0.07 ± 0.02 mag with respect to the ellipticals. This
No. 1, 2009 EVOLUTION OF THE CMR 49
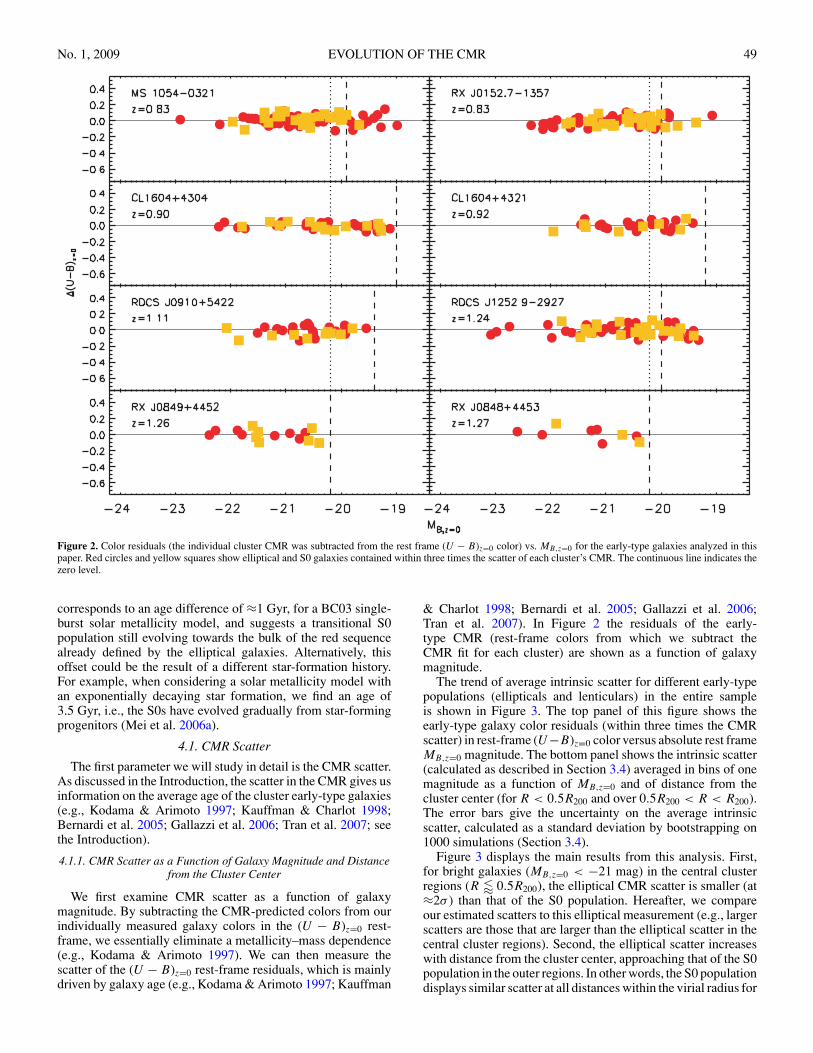
Figure 2. Color residuals (the individual cluster CMR was subtracted from the rest frame (U − B)z=0 color) vs. MB,z=0 for the early-type galaxies analyzed in thispaper. Red circles and yellow squares show elliptical and S0 galaxies contained within three times the scatter of each cluster’s CMR. The continuous line indicates thezero level.
corresponds to an age difference of ≈1 Gyr, for a BC03 single-burst solar metallicity model, and suggests a transitional S0population still evolving towards the bulk of the red sequencealready defined by the elliptical galaxies. Alternatively, thisoffset could be the result of a different star-formation history.For example, when considering a solar metallicity model withan exponentially decaying star formation, we find an age of3.5 Gyr, i.e., the S0s have evolved gradually from star-formingprogenitors (Mei et al. 2006a).
4.1. CMR Scatter
The first parameter we will study in detail is the CMR scatter.As discussed in the Introduction, the scatter in the CMR gives usinformation on the average age of the cluster early-type galaxies(e.g., Kodama & Arimoto 1997; Kauffman & Charlot 1998;Bernardi et al. 2005; Gallazzi et al. 2006; Tran et al. 2007; seethe Introduction).
4.1.1. CMR Scatter as a Function of Galaxy Magnitude and Distancefrom the Cluster Center
We first examine CMR scatter as a function of galaxymagnitude. By subtracting the CMR-predicted colors from ourindividually measured galaxy colors in the (U − B)z=0 rest-frame, we essentially eliminate a metallicity–mass dependence(e.g., Kodama & Arimoto 1997). We can then measure thescatter of the (U − B)z=0 rest-frame residuals, which is mainlydriven by galaxy age (e.g., Kodama & Arimoto 1997; Kauffman
& Charlot 1998; Bernardi et al. 2005; Gallazzi et al. 2006;Tran et al. 2007). In Figure 2 the residuals of the early-type CMR (rest-frame colors from which we subtract theCMR fit for each cluster) are shown as a function of galaxymagnitude.
The trend of average intrinsic scatter for different early-typepopulations (ellipticals and lenticulars) in the entire sampleis shown in Figure 3. The top panel of this figure shows theearly-type galaxy color residuals (within three times the CMRscatter) in rest-frame (U−B)z=0 color versus absolute rest frameMB,z=0 magnitude. The bottom panel shows the intrinsic scatter(calculated as described in Section 3.4) averaged in bins of onemagnitude as a function of MB,z=0 and of distance from thecluster center (for R < 0.5R200 and over 0.5R200 < R < R200).The error bars give the uncertainty on the average intrinsicscatter, calculated as a standard deviation by bootstrapping on1000 simulations (Section 3.4).
Figure 3 displays the main results from this analysis. First,for bright galaxies (MB,z=0 < −21 mag) in the central clusterregions (R � 0.5R200), the elliptical CMR scatter is smaller (at≈2σ ) than that of the S0 population. Hereafter, we compareour estimated scatters to this elliptical measurement (e.g., largerscatters are those that are larger than the elliptical scatter in thecentral cluster regions). Second, the elliptical scatter increaseswith distance from the cluster center, approaching that of the S0population in the outer regions. In other words, the S0 populationdisplays similar scatter at all distances within the virial radius for
50 MEI ET AL. Vol. 690
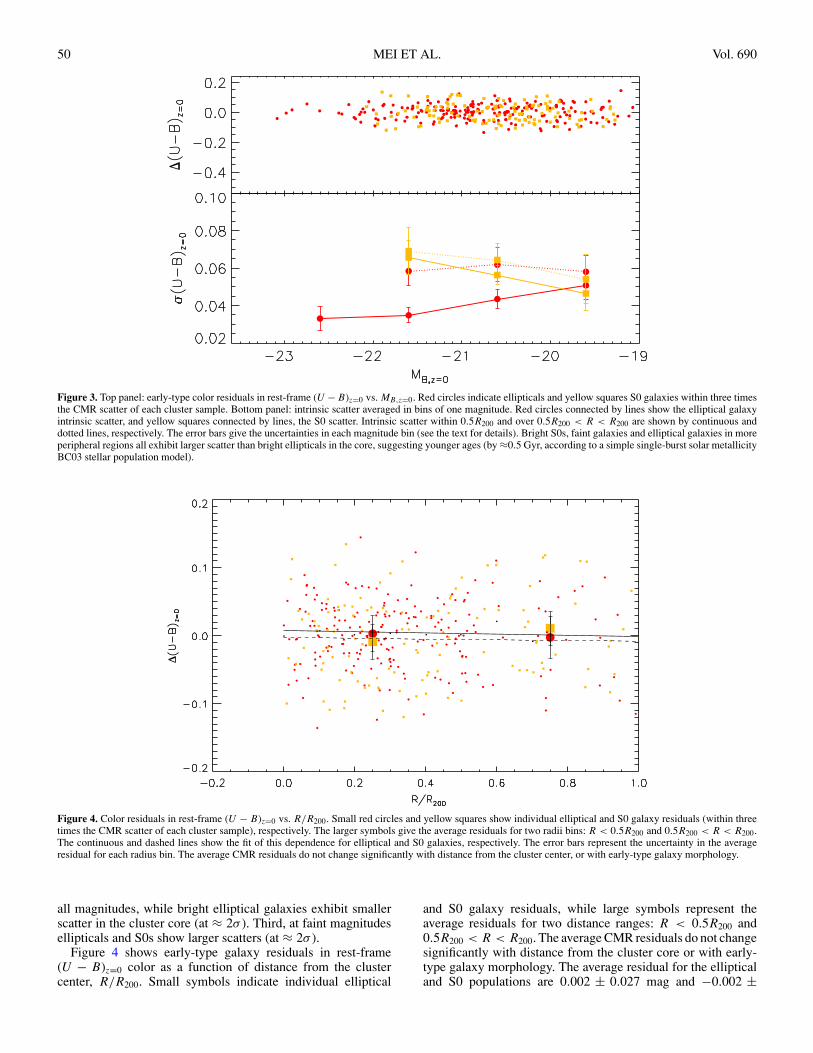
Figure 3. Top panel: early-type color residuals in rest-frame (U − B)z=0 vs. MB,z=0. Red circles indicate ellipticals and yellow squares S0 galaxies within three timesthe CMR scatter of each cluster sample. Bottom panel: intrinsic scatter averaged in bins of one magnitude. Red circles connected by lines show the elliptical galaxyintrinsic scatter, and yellow squares connected by lines, the S0 scatter. Intrinsic scatter within 0.5R200 and over 0.5R200 < R < R200 are shown by continuous anddotted lines, respectively. The error bars give the uncertainties in each magnitude bin (see the text for details). Bright S0s, faint galaxies and elliptical galaxies in moreperipheral regions all exhibit larger scatter than bright ellipticals in the core, suggesting younger ages (by ≈0.5 Gyr, according to a simple single-burst solar metallicityBC03 stellar population model).
Figure 4. Color residuals in rest-frame (U − B)z=0 vs. R/R200. Small red circles and yellow squares show individual elliptical and S0 galaxy residuals (within threetimes the CMR scatter of each cluster sample), respectively. The larger symbols give the average residuals for two radii bins: R < 0.5R200 and 0.5R200 < R < R200.The continuous and dashed lines show the fit of this dependence for elliptical and S0 galaxies, respectively. The error bars represent the uncertainty in the averageresidual for each radius bin. The average CMR residuals do not change significantly with distance from the cluster center, or with early-type galaxy morphology.
all magnitudes, while bright elliptical galaxies exhibit smallerscatter in the cluster core (at ≈ 2σ ). Third, at faint magnitudesellipticals and S0s show larger scatters (at ≈ 2σ ).
Figure 4 shows early-type galaxy residuals in rest-frame(U − B)z=0 color as a function of distance from the clustercenter, R/R200. Small symbols indicate individual elliptical
and S0 galaxy residuals, while large symbols represent theaverage residuals for two distance ranges: R < 0.5R200 and0.5R200 < R < R200. The average CMR residuals do not changesignificantly with distance from the cluster core or with early-type galaxy morphology. The average residual for the ellipticaland S0 populations are 0.002 ± 0.027 mag and −0.002 ±
No. 1, 2009 EVOLUTION OF THE CMR 51
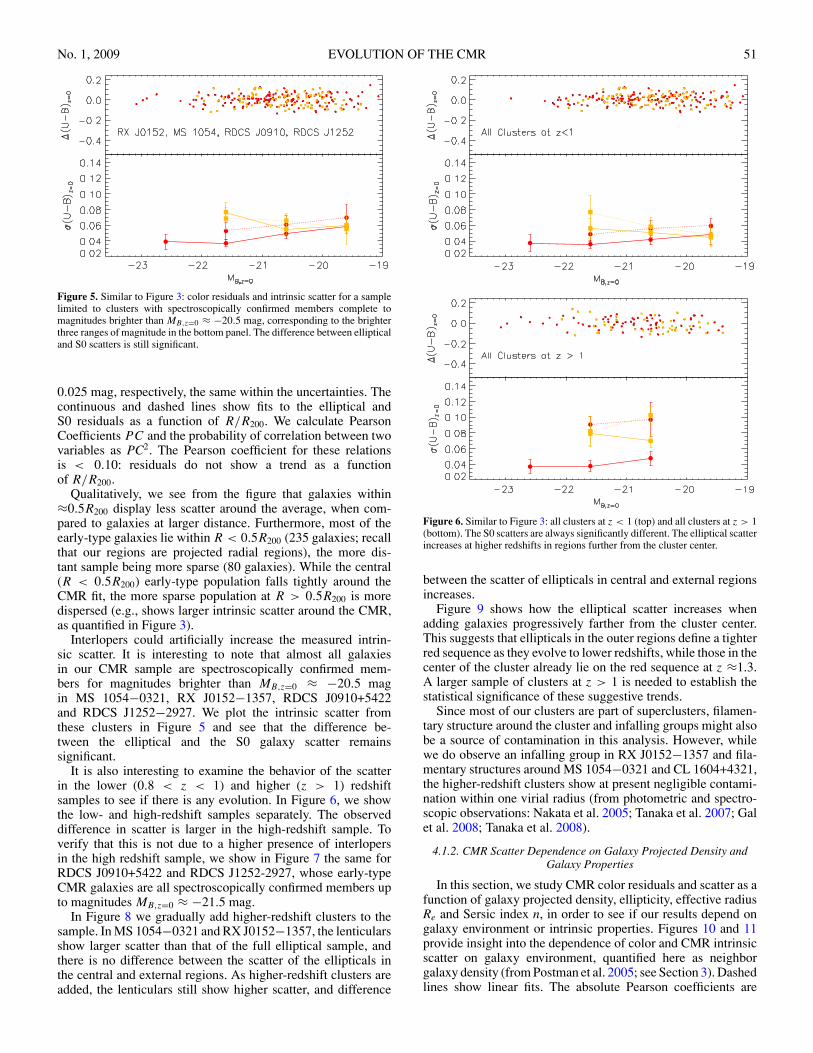
Figure 5. Similar to Figure 3: color residuals and intrinsic scatter for a samplelimited to clusters with spectroscopically confirmed members complete tomagnitudes brighter than MB,z=0 ≈ −20.5 mag, corresponding to the brighterthree ranges of magnitude in the bottom panel. The difference between ellipticaland S0 scatters is still significant.
0.025 mag, respectively, the same within the uncertainties. Thecontinuous and dashed lines show fits to the elliptical andS0 residuals as a function of R/R200. We calculate PearsonCoefficients PC and the probability of correlation between twovariables as PC2. The Pearson coefficient for these relationsis < 0.10: residuals do not show a trend as a functionof R/R200.
Qualitatively, we see from the figure that galaxies within≈0.5R200 display less scatter around the average, when com-pared to galaxies at larger distance. Furthermore, most of theearly-type galaxies lie within R < 0.5R200 (235 galaxies; recallthat our regions are projected radial regions), the more dis-tant sample being more sparse (80 galaxies). While the central(R < 0.5R200) early-type population falls tightly around theCMR fit, the more sparse population at R > 0.5R200 is moredispersed (e.g., shows larger intrinsic scatter around the CMR,as quantified in Figure 3).
Interlopers could artificially increase the measured intrin-sic scatter. It is interesting to note that almost all galaxiesin our CMR sample are spectroscopically confirmed mem-bers for magnitudes brighter than MB,z=0 ≈ −20.5 magin MS 1054−0321, RX J0152−1357, RDCS J0910+5422and RDCS J1252−2927. We plot the intrinsic scatter fromthese clusters in Figure 5 and see that the difference be-tween the elliptical and the S0 galaxy scatter remainssignificant.
It is also interesting to examine the behavior of the scatterin the lower (0.8 < z < 1) and higher (z > 1) redshiftsamples to see if there is any evolution. In Figure 6, we showthe low- and high-redshift samples separately. The observeddifference in scatter is larger in the high-redshift sample. Toverify that this is not due to a higher presence of interlopersin the high redshift sample, we show in Figure 7 the same forRDCS J0910+5422 and RDCS J1252-2927, whose early-typeCMR galaxies are all spectroscopically confirmed members upto magnitudes MB,z=0 ≈ −21.5 mag.
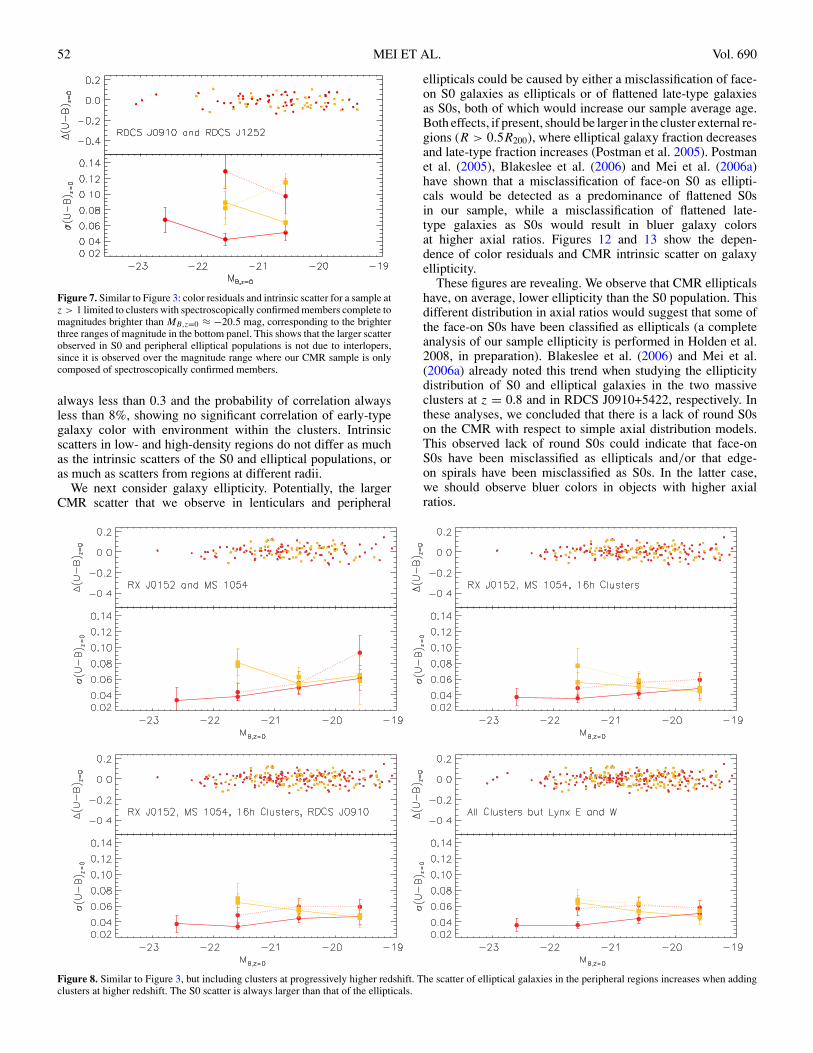
In Figure 8 we gradually add higher-redshift clusters to thesample. In MS 1054−0321 and RX J0152−1357, the lenticularsshow larger scatter than that of the full elliptical sample, andthere is no difference between the scatter of the ellipticals inthe central and external regions. As higher-redshift clusters areadded, the lenticulars still show higher scatter, and difference
Figure 6. Similar to Figure 3: all clusters at z < 1 (top) and all clusters at z > 1(bottom). The S0 scatters are always significantly different. The elliptical scatterincreases at higher redshifts in regions further from the cluster center.
between the scatter of ellipticals in central and external regionsincreases.
Figure 9 shows how the elliptical scatter increases whenadding galaxies progressively farther from the cluster center.This suggests that ellipticals in the outer regions define a tighterred sequence as they evolve to lower redshifts, while those in thecenter of the cluster already lie on the red sequence at z ≈1.3.A larger sample of clusters at z > 1 is needed to establish thestatistical significance of these suggestive trends.
Since most of our clusters are part of superclusters, filamen-tary structure around the cluster and infalling groups might alsobe a source of contamination in this analysis. However, whilewe do observe an infalling group in RX J0152−1357 and fila-mentary structures around MS 1054−0321 and CL 1604+4321,the higher-redshift clusters show at present negligible contami-nation within one virial radius (from photometric and spectro-scopic observations: Nakata et al. 2005; Tanaka et al. 2007; Galet al. 2008; Tanaka et al. 2008).
4.1.2. CMR Scatter Dependence on Galaxy Projected Density andGalaxy Properties
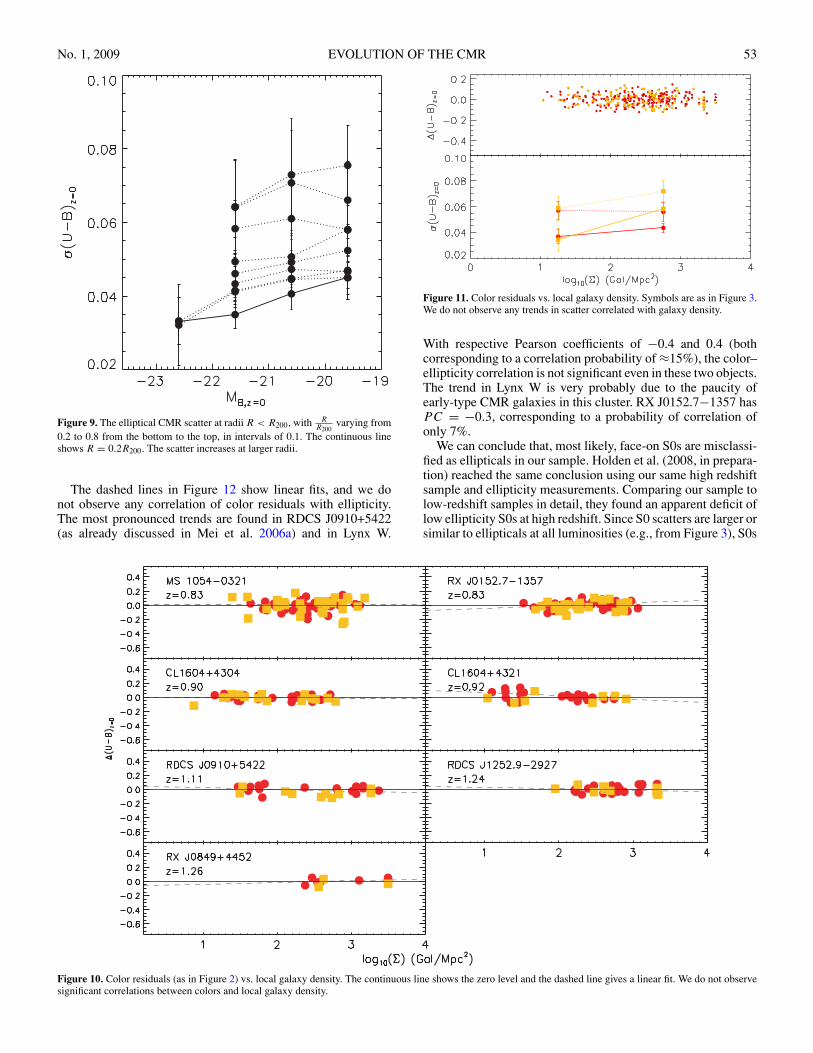
In this section, we study CMR color residuals and scatter as afunction of galaxy projected density, ellipticity, effective radiusRe and Sersic index n, in order to see if our results depend ongalaxy environment or intrinsic properties. Figures 10 and 11provide insight into the dependence of color and CMR intrinsicscatter on galaxy environment, quantified here as neighborgalaxy density (from Postman et al. 2005; see Section 3). Dashedlines show linear fits. The absolute Pearson coefficients are
52 MEI ET AL. Vol. 690
Figure 7. Similar to Figure 3: color residuals and intrinsic scatter for a sample atz > 1 limited to clusters with spectroscopically confirmed members complete tomagnitudes brighter than MB,z=0 ≈ −20.5 mag, corresponding to the brighterthree ranges of magnitude in the bottom panel. This shows that the larger scatterobserved in S0 and peripheral elliptical populations is not due to interlopers,since it is observed over the magnitude range where our CMR sample is onlycomposed of spectroscopically confirmed members.
always less than 0.3 and the probability of correlation alwaysless than 8%, showing no significant correlation of early-typegalaxy color with environment within the clusters. Intrinsicscatters in low- and high-density regions do not differ as muchas the intrinsic scatters of the S0 and elliptical populations, oras much as scatters from regions at different radii.
We next consider galaxy ellipticity. Potentially, the largerCMR scatter that we observe in lenticulars and peripheral
ellipticals could be caused by either a misclassification of face-on S0 galaxies as ellipticals or of flattened late-type galaxiesas S0s, both of which would increase our sample average age.Both effects, if present, should be larger in the cluster external re-gions (R > 0.5R200), where elliptical galaxy fraction decreasesand late-type fraction increases (Postman et al. 2005). Postmanet al. (2005), Blakeslee et al. (2006) and Mei et al. (2006a)have shown that a misclassification of face-on S0 as ellipti-cals would be detected as a predominance of flattened S0sin our sample, while a misclassification of flattened late-type galaxies as S0s would result in bluer galaxy colorsat higher axial ratios. Figures 12 and 13 show the depen-dence of color residuals and CMR intrinsic scatter on galaxyellipticity.
These figures are revealing. We observe that CMR ellipticalshave, on average, lower ellipticity than the S0 population. Thisdifferent distribution in axial ratios would suggest that some ofthe face-on S0s have been classified as ellipticals (a completeanalysis of our sample ellipticity is performed in Holden et al.2008, in preparation). Blakeslee et al. (2006) and Mei et al.(2006a) already noted this trend when studying the ellipticitydistribution of S0 and elliptical galaxies in the two massiveclusters at z = 0.8 and in RDCS J0910+5422, respectively. Inthese analyses, we concluded that there is a lack of round S0son the CMR with respect to simple axial distribution models.This observed lack of round S0s could indicate that face-onS0s have been misclassified as ellipticals and/or that edge-on spirals have been misclassified as S0s. In the latter case,we should observe bluer colors in objects with higher axialratios.
Figure 8. Similar to Figure 3, but including clusters at progressively higher redshift. The scatter of elliptical galaxies in the peripheral regions increases when addingclusters at higher redshift. The S0 scatter is always larger than that of the ellipticals.
No. 1, 2009 EVOLUTION OF THE CMR 53
Figure 9. The elliptical CMR scatter at radii R < R200, with RR200
varying from0.2 to 0.8 from the bottom to the top, in intervals of 0.1. The continuous lineshows R = 0.2R200. The scatter increases at larger radii.
The dashed lines in Figure 12 show linear fits, and we donot observe any correlation of color residuals with ellipticity.The most pronounced trends are found in RDCS J0910+5422(as already discussed in Mei et al. 2006a) and in Lynx W.
Figure 11. Color residuals vs. local galaxy density. Symbols are as in Figure 3.We do not observe any trends in scatter correlated with galaxy density.
With respective Pearson coefficients of −0.4 and 0.4 (bothcorresponding to a correlation probability of ≈15%), the color–ellipticity correlation is not significant even in these two objects.The trend in Lynx W is very probably due to the paucity ofearly-type CMR galaxies in this cluster. RX J0152.7−1357 hasPC = −0.3, corresponding to a probability of correlation ofonly 7%.
We can conclude that, most likely, face-on S0s are misclassi-fied as ellipticals in our sample. Holden et al. (2008, in prepara-tion) reached the same conclusion using our same high redshiftsample and ellipticity measurements. Comparing our sample tolow-redshift samples in detail, they found an apparent deficit oflow ellipticity S0s at high redshift. Since S0 scatters are larger orsimilar to ellipticals at all luminosities (e.g., from Figure 3), S0s
Figure 10. Color residuals (as in Figure 2) vs. local galaxy density. The continuous line shows the zero level and the dashed line gives a linear fit. We do not observesignificant correlations between colors and local galaxy density.
54 MEI ET AL. Vol. 690
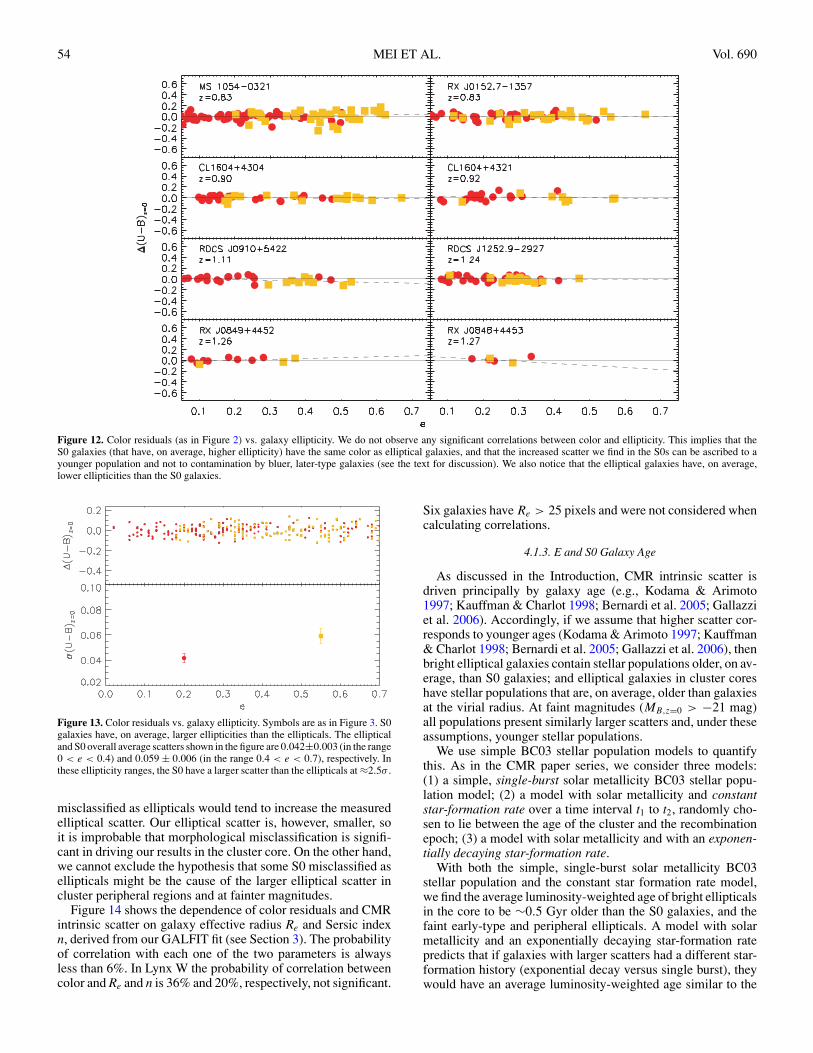
Figure 12. Color residuals (as in Figure 2) vs. galaxy ellipticity. We do not observe any significant correlations between color and ellipticity. This implies that theS0 galaxies (that have, on average, higher ellipticity) have the same color as elliptical galaxies, and that the increased scatter we find in the S0s can be ascribed to ayounger population and not to contamination by bluer, later-type galaxies (see the text for discussion). We also notice that the elliptical galaxies have, on average,lower ellipticities than the S0 galaxies.
Figure 13. Color residuals vs. galaxy ellipticity. Symbols are as in Figure 3. S0galaxies have, on average, larger ellipticities than the ellipticals. The ellipticaland S0 overall average scatters shown in the figure are 0.042±0.003 (in the range0 < e < 0.4) and 0.059 ± 0.006 (in the range 0.4 < e < 0.7), respectively. Inthese ellipticity ranges, the S0 have a larger scatter than the ellipticals at ≈2.5σ .
misclassified as ellipticals would tend to increase the measuredelliptical scatter. Our elliptical scatter is, however, smaller, soit is improbable that morphological misclassification is signifi-cant in driving our results in the cluster core. On the other hand,we cannot exclude the hypothesis that some S0 misclassified asellipticals might be the cause of the larger elliptical scatter incluster peripheral regions and at fainter magnitudes.
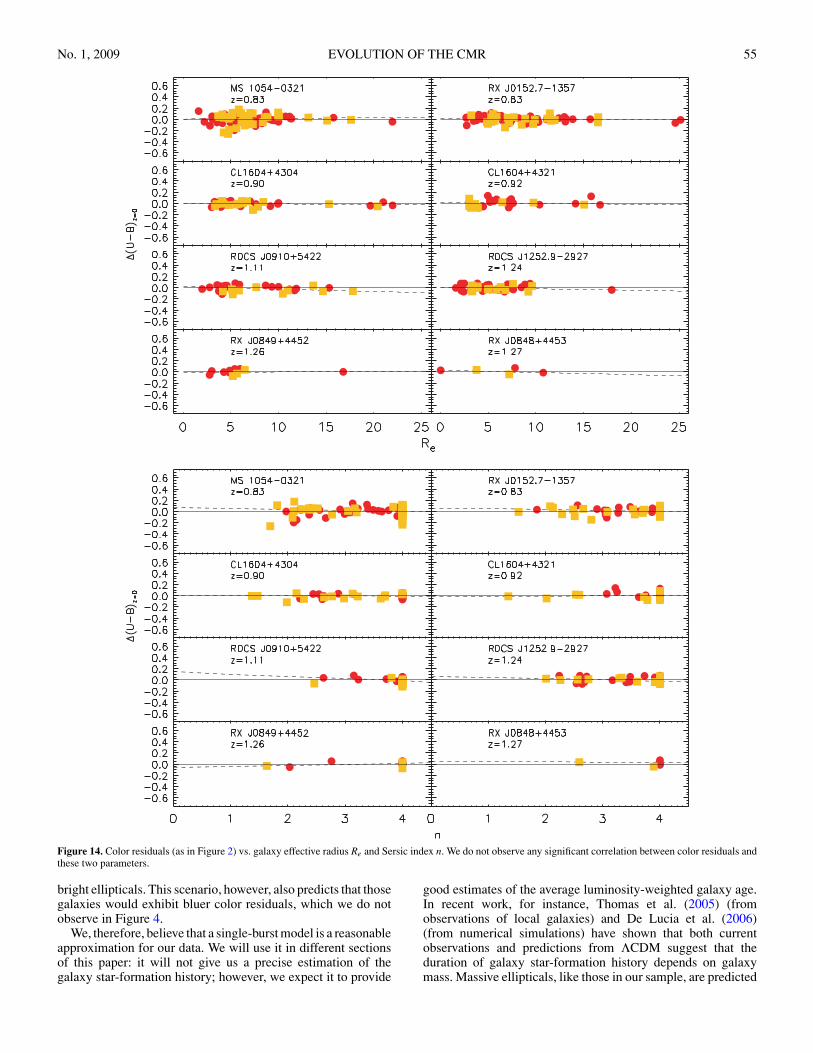
Figure 14 shows the dependence of color residuals and CMRintrinsic scatter on galaxy effective radius Re and Sersic indexn, derived from our GALFIT fit (see Section 3). The probabilityof correlation with each one of the two parameters is alwaysless than 6%. In Lynx W the probability of correlation betweencolor and Re and n is 36% and 20%, respectively, not significant.
Six galaxies have Re > 25 pixels and were not considered whencalculating correlations.
4.1.3. E and S0 Galaxy Age
As discussed in the Introduction, CMR intrinsic scatter isdriven principally by galaxy age (e.g., Kodama & Arimoto1997; Kauffman & Charlot 1998; Bernardi et al. 2005; Gallazziet al. 2006). Accordingly, if we assume that higher scatter cor-responds to younger ages (Kodama & Arimoto 1997; Kauffman& Charlot 1998; Bernardi et al. 2005; Gallazzi et al. 2006), thenbright elliptical galaxies contain stellar populations older, on av-erage, than S0 galaxies; and elliptical galaxies in cluster coreshave stellar populations that are, on average, older than galaxiesat the virial radius. At faint magnitudes (MB,z=0 > −21 mag)all populations present similarly larger scatters and, under theseassumptions, younger stellar populations.
We use simple BC03 stellar population models to quantifythis. As in the CMR paper series, we consider three models:(1) a simple, single-burst solar metallicity BC03 stellar popu-lation model; (2) a model with solar metallicity and constantstar-formation rate over a time interval t1 to t2, randomly cho-sen to lie between the age of the cluster and the recombinationepoch; (3) a model with solar metallicity and with an exponen-tially decaying star-formation rate.
With both the simple, single-burst solar metallicity BC03stellar population and the constant star formation rate model,we find the average luminosity-weighted age of bright ellipticalsin the core to be ∼0.5 Gyr older than the S0 galaxies, and thefaint early-type and peripheral ellipticals. A model with solarmetallicity and an exponentially decaying star-formation ratepredicts that if galaxies with larger scatters had a different star-formation history (exponential decay versus single burst), theywould have an average luminosity-weighted age similar to the
No. 1, 2009 EVOLUTION OF THE CMR 55
Figure 14. Color residuals (as in Figure 2) vs. galaxy effective radius Re and Sersic index n. We do not observe any significant correlation between color residuals andthese two parameters.
bright ellipticals. This scenario, however, also predicts that thosegalaxies would exhibit bluer color residuals, which we do notobserve in Figure 4.
We, therefore, believe that a single-burst model is a reasonableapproximation for our data. We will use it in different sectionsof this paper: it will not give us a precise estimation of thegalaxy star-formation history; however, we expect it to provide
good estimates of the average luminosity-weighted galaxy age.In recent work, for instance, Thomas et al. (2005) (fromobservations of local galaxies) and De Lucia et al. (2006)(from numerical simulations) have shown that both currentobservations and predictions from ΛCDM suggest that theduration of galaxy star-formation history depends on galaxymass. Massive ellipticals, like those in our sample, are predicted
56 MEI ET AL. Vol. 690
to form most of their stars in a short episode of star formation,which we are approximating here as a single burst.
Concerning metallicity, the CMR scatter at the same averageluminosity-weighted galaxy age is predicted to be smaller forlower metallicities, which correspond to fainter magnitudes(e.g., Kodama & Arimoto 1997 and Figure 8 in Mei et al.2006a). Since we observe larger scatter for S0 galaxies and atfainter magnitudes, taking this into account would only increasethe deduced difference in age.
4.2. CMR Parameters as a Function of Redshift and TotalCluster Mass
In this section, we analyze CMR parameters as a functionof redshift. Because our higher-redshift clusters are also theleast massive of our sample, we examine CMR parameters as afunction of cluster velocity dispersion and X-ray luminosity tounderstand the influence of cluster properties on our interpre-tation of the evolution of the CMR with redshift. These rela-tions also give us additional information about galaxy evolu-tion: different galaxy histories in clusters with different phys-ical properties, in particular cluster total mass, can be broughtout by studying the dependence of CMR parameters on thosephysical properties (e.g., Wake et al. 2005; Poggianti et al.2006). In current cosmological models, for example, we ex-pect that galaxies form later (and as a consequence might haveyounger ages/larger CMR scatter at z ≈ 1) in low-mass clus-ters. When comparing our CMR parameters to cluster mass,we will consider both X-ray luminosity and velocity dispersionas proxies for cluster total mass, keeping in mind the poten-tial systematics associated with each of these quantities (seeSection 2.1).
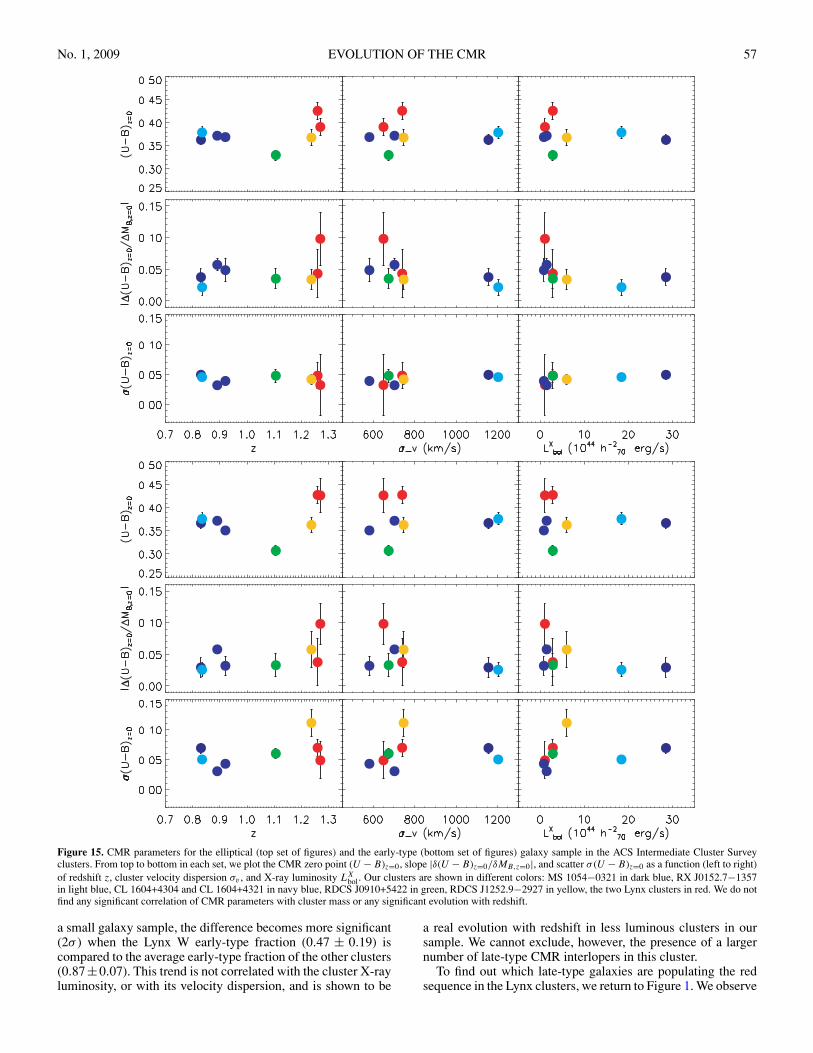
In Figure 15, from top to bottom, we plot the elliptical (top)and early-type (bottom) CMR zero point (U − B)z=0, slope|δ(U −B)z=0/δMB,z=0|, and scatter σ (U −B)z as a function ofredshift z, cluster velocity dispersion σv , and X-ray luminosityLX
bol (from left to right). We calculate the Pearson coefficientand correlation probabilities for the CMR zero point, slope andscatter as a function of redshift, cluster velocity dispersion andX-ray luminosity. All relations have PC � 0.5, PC2 � 30%,and we do not find any significant trend with the cluster massproxies. The lower-mass, higher-redshift clusters show moredispersion in their CMR slopes and zero points, as predicted bysome semi-analytical models (Menci et al. 2008). The size ofour sample does not, however, permit us to establish a generaltrend at high redshift.
The average CMR zero point, slope and scatter in our samplein rest-frame (U−B)z=0 color are 0.36±0.01 mag (not includingthe two Lynx clusters), −0.047 ± 0.023, and 0.042 ± 0.021mag, respectively, which are the values plotted in Figure 16 andFigure 15. We applied a 3σ clip to derive the average, andthe error is the uncertainty on the average. When we considerthe total early-type (ellipticals plus S0s) sample, we obtain0.36 ± 0.01 mag, −0.046 ± 0.023, and 0.061 ± 0.015 mag,respectively.
Figure 16 shows CMR zero points as a function of redshift.The Lynx cluster zero points show redder (U − B)z=0 col-ors even when compared to lower-redshift clusters of similarX-ray luminosity and velocity dispersion (central and rightpanel). The difference between their average zero point and theaverage zero point from our other clusters is 0.09 ± 0.04 mag (a≈ 2σ difference). This might suggest a different stellar forma-tion history in these two clusters, and perhaps a higher spreadin the CMR zero point at higher redshifts, which is predicted
by recent semi-analytical models of galaxy formation (Menciet al. 2008). This observation has been widely discussed in Meiet al. (2006b), who point out that observed (i775 −z850) colors inthese clusters are redder (by 0.07 ± 0.04 mag) than theoreticalpredictions from a simple single-burst, solar metallicity stellarpopulation model from BC03. While there might be an indica-tion of a different star-formation history in these two clusters,this conclusion is highly uncertain due to the uncertainty ofa few hundreds of a magnitude in the calibration of the ACSz850 filter (Sirianni et al. 2005). The ACS bandpass responseshave been calibrated to 9000 Å, with an uncertainty on ACSbandpass zero points of 0.01 mag. Since the local 4000 Å breakobserved in galaxy templates with age 4 Gyr and solar metal-licity is redshifted to around 9000 Å at z = 1.26, most of thegalaxy light at the Lynx cluster redshift lies at wavelengths largerthan 9000 Å, where the ACS z850 bandpass calibration is moreuncertain.
The variation of CMR scatter and slope with redshift iscompared to local clusters in Figure 17 for both the ellipticalsand the full early-type galaxy sample. Published colors weretransformed to rest-frame slopes, |δ(U − B)z=0/δMB,z=0|, andscatters, σ (U −B)z=0, using single-burst solar metallicity stellarpopulation models from BC03, as described in Appendix B. Forthe elliptical galaxy CMR, we considered the Bower et al. (1992)results for the Coma and Virgo clusters; Ellis et al. (1997) resultsfor a sample of clusters of galaxies at z ≈ 0.5, and van Dokkumet al. (1998) results for MS 1054−0321. The continuous lineshows the average parameter value in our sample and the dottedline the 1σ range.
CMR parameters do not exhibit significant evolution up toredshift z ≈ 1.3. This remarkable constancy of the CMR withredshift might be due to the fact that, when selecting galaxieswithin three times the scatter around the CMR, we are notcomparing the same galaxy populations at low and high redshift.As pointed out by van Dokkum & Franx (2001), we might beaffected by a progenitor bias: the high redshift sample would notinclude the bluer progenitors of the low redshift CMR sample,but only their oldest progenitors.
4.3. CMR Galaxy Type Fraction Evolution
In this section, we focus on the morphological make-up ofthe red sequence. Even if our small sample size and lack ofa complete spectroscopic sample (especially for blue galaxies)do not permit us to quantify in detail the evolution of blue andred galaxies, we can study the evolution of the morphologicaldistribution of the galaxies on our CMR.
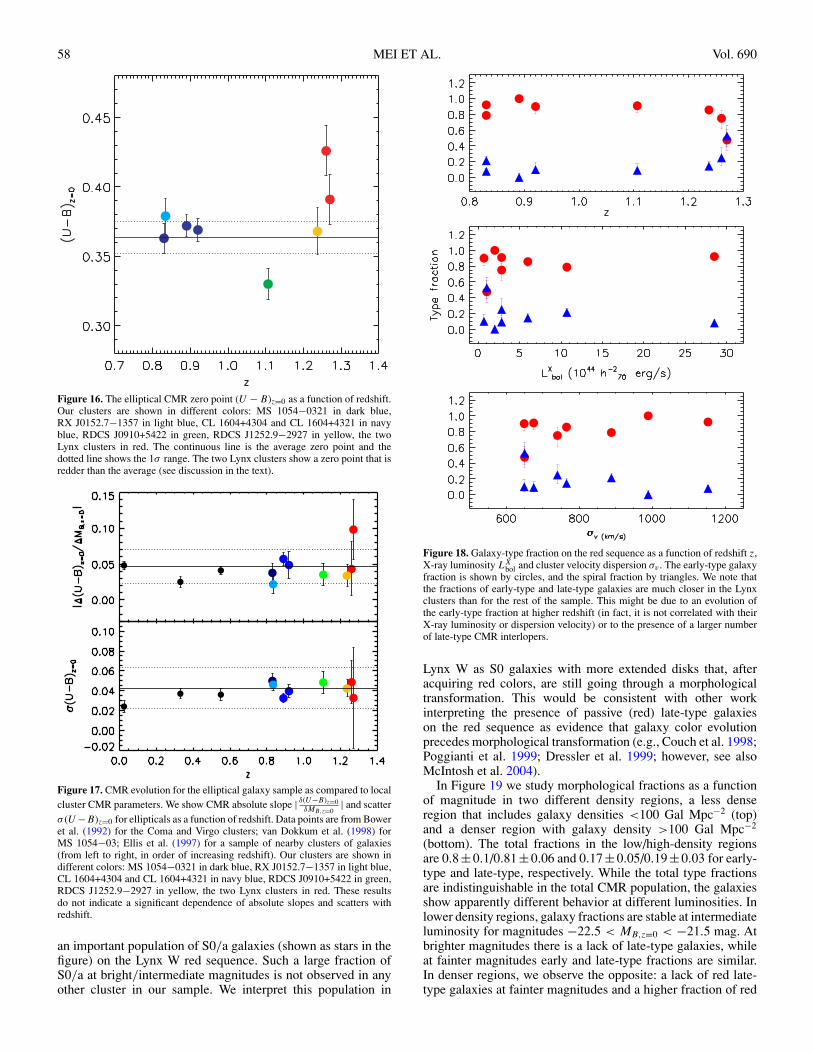
The CMR galaxy early-type and late-type fractions are shownin Figure 18 as a function of redshift, X-ray luminosity andvelocity dispersion. We have considered all galaxies withinthree times the CMR scatter. The uncertainties on morphologicalfractions are calculated following Gehrels (1986; see Section 3for binomial statistics). These approximations apply even whenratios of different events are calculated from small numbers,and yield the lower and upper limits of a binomial distributionwithin the 84% confidence limit, which corresponds to 1σ .
The majority of the clusters in our sample show little evidenceof evolution, suggesting that the increase in the late-type fractionobserved at this redshift (Postman et al. 2005; Desai et al. 2007)might come from an increase in bluer, star forming galaxies (seealso van der Wel et al. 2007). In Lynx W the late-type/early-typefractions are similar (around 50%). Even if the fractions are notsignificantly different (the difference between 80% and 50% isonly 1σ at z > 1) because of the large Poissonian errors on such
No. 1, 2009 EVOLUTION OF THE CMR 57
Figure 15. CMR parameters for the elliptical (top set of figures) and the early-type (bottom set of figures) galaxy sample in the ACS Intermediate Cluster Surveyclusters. From top to bottom in each set, we plot the CMR zero point (U − B)z=0, slope |δ(U − B)z=0/δMB,z=0|, and scatter σ (U − B)z=0 as a function (left to right)of redshift z, cluster velocity dispersion σv , and X-ray luminosity LX
bol. Our clusters are shown in different colors: MS 1054−0321 in dark blue, RX J0152.7−1357in light blue, CL 1604+4304 and CL 1604+4321 in navy blue, RDCS J0910+5422 in green, RDCS J1252.9−2927 in yellow, the two Lynx clusters in red. We do notfind any significant correlation of CMR parameters with cluster mass or any significant evolution with redshift.
a small galaxy sample, the difference becomes more significant(2σ ) when the Lynx W early-type fraction (0.47 ± 0.19) iscompared to the average early-type fraction of the other clusters(0.87±0.07). This trend is not correlated with the cluster X-rayluminosity, or with its velocity dispersion, and is shown to be
a real evolution with redshift in less luminous clusters in oursample. We cannot exclude, however, the presence of a largernumber of late-type CMR interlopers in this cluster.
To find out which late-type galaxies are populating the redsequence in the Lynx clusters, we return to Figure 1. We observe
58 MEI ET AL. Vol. 690
Figure 16. The elliptical CMR zero point (U − B)z=0 as a function of redshift.Our clusters are shown in different colors: MS 1054−0321 in dark blue,RX J0152.7−1357 in light blue, CL 1604+4304 and CL 1604+4321 in navyblue, RDCS J0910+5422 in green, RDCS J1252.9−2927 in yellow, the twoLynx clusters in red. The continuous line is the average zero point and thedotted line shows the 1σ range. The two Lynx clusters show a zero point that isredder than the average (see discussion in the text).
Figure 17. CMR evolution for the elliptical galaxy sample as compared to localcluster CMR parameters. We show CMR absolute slope | δ(U−B)z=0
δMB,z=0| and scatter
σ (U −B)z=0 for ellipticals as a function of redshift. Data points are from Boweret al. (1992) for the Coma and Virgo clusters; van Dokkum et al. (1998) forMS 1054−03; Ellis et al. (1997) for a sample of nearby clusters of galaxies(from left to right, in order of increasing redshift). Our clusters are shown indifferent colors: MS 1054−0321 in dark blue, RX J0152.7−1357 in light blue,CL 1604+4304 and CL 1604+4321 in navy blue, RDCS J0910+5422 in green,RDCS J1252.9−2927 in yellow, the two Lynx clusters in red. These resultsdo not indicate a significant dependence of absolute slopes and scatters withredshift.
an important population of S0/a galaxies (shown as stars in thefigure) on the Lynx W red sequence. Such a large fraction ofS0/a at bright/intermediate magnitudes is not observed in anyother cluster in our sample. We interpret this population in
Figure 18. Galaxy-type fraction on the red sequence as a function of redshift z,X-ray luminosity LX
bol and cluster velocity dispersion σv . The early-type galaxyfraction is shown by circles, and the spiral fraction by triangles. We note thatthe fractions of early-type and late-type galaxies are much closer in the Lynxclusters than for the rest of the sample. This might be due to an evolution ofthe early-type fraction at higher redshift (in fact, it is not correlated with theirX-ray luminosity or dispersion velocity) or to the presence of a larger numberof late-type CMR interlopers.
Lynx W as S0 galaxies with more extended disks that, afteracquiring red colors, are still going through a morphologicaltransformation. This would be consistent with other workinterpreting the presence of passive (red) late-type galaxieson the red sequence as evidence that galaxy color evolutionprecedes morphological transformation (e.g., Couch et al. 1998;Poggianti et al. 1999; Dressler et al. 1999; however, see alsoMcIntosh et al. 2004).
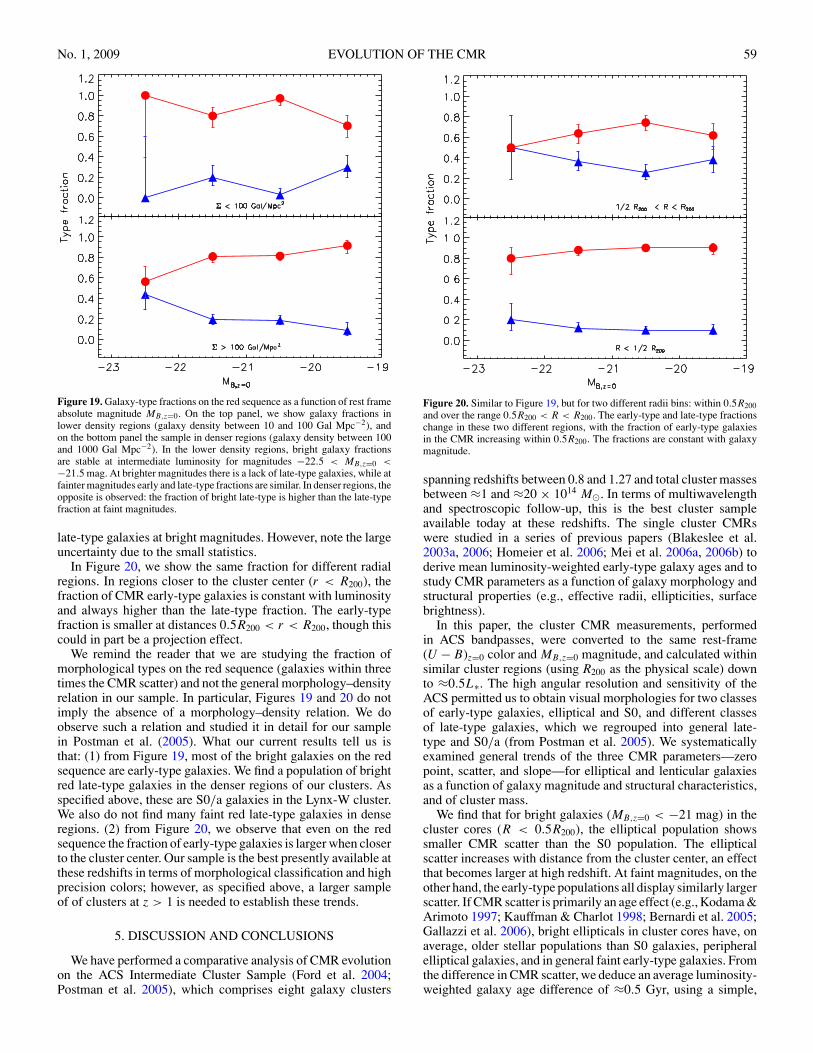
In Figure 19 we study morphological fractions as a functionof magnitude in two different density regions, a less denseregion that includes galaxy densities <100 Gal Mpc−2 (top)and a denser region with galaxy density >100 Gal Mpc−2
(bottom). The total fractions in the low/high-density regionsare 0.8±0.1/0.81±0.06 and 0.17±0.05/0.19±0.03 for early-type and late-type, respectively. While the total type fractionsare indistinguishable in the total CMR population, the galaxiesshow apparently different behavior at different luminosities. Inlower density regions, galaxy fractions are stable at intermediateluminosity for magnitudes −22.5 < MB,z=0 < −21.5 mag. Atbrighter magnitudes there is a lack of late-type galaxies, whileat fainter magnitudes early and late-type fractions are similar.In denser regions, we observe the opposite: a lack of red late-type galaxies at fainter magnitudes and a higher fraction of red
No. 1, 2009 EVOLUTION OF THE CMR 59
Figure 19. Galaxy-type fractions on the red sequence as a function of rest frameabsolute magnitude MB,z=0. On the top panel, we show galaxy fractions inlower density regions (galaxy density between 10 and 100 Gal Mpc−2), andon the bottom panel the sample in denser regions (galaxy density between 100and 1000 Gal Mpc−2). In the lower density regions, bright galaxy fractionsare stable at intermediate luminosity for magnitudes −22.5 < MB,z=0 <
−21.5 mag. At brighter magnitudes there is a lack of late-type galaxies, while atfainter magnitudes early and late-type fractions are similar. In denser regions, theopposite is observed: the fraction of bright late-type is higher than the late-typefraction at faint magnitudes.
late-type galaxies at bright magnitudes. However, note the largeuncertainty due to the small statistics.
In Figure 20, we show the same fraction for different radialregions. In regions closer to the cluster center (r < R200), thefraction of CMR early-type galaxies is constant with luminosityand always higher than the late-type fraction. The early-typefraction is smaller at distances 0.5R200 < r < R200, though thiscould in part be a projection effect.
We remind the reader that we are studying the fraction ofmorphological types on the red sequence (galaxies within threetimes the CMR scatter) and not the general morphology–densityrelation in our sample. In particular, Figures 19 and 20 do notimply the absence of a morphology–density relation. We doobserve such a relation and studied it in detail for our samplein Postman et al. (2005). What our current results tell us isthat: (1) from Figure 19, most of the bright galaxies on the redsequence are early-type galaxies. We find a population of brightred late-type galaxies in the denser regions of our clusters. Asspecified above, these are S0/a galaxies in the Lynx-W cluster.We also do not find many faint red late-type galaxies in denseregions. (2) from Figure 20, we observe that even on the redsequence the fraction of early-type galaxies is larger when closerto the cluster center. Our sample is the best presently available atthese redshifts in terms of morphological classification and highprecision colors; however, as specified above, a larger sampleof of clusters at z > 1 is needed to establish these trends.
5. DISCUSSION AND CONCLUSIONS
We have performed a comparative analysis of CMR evolutionon the ACS Intermediate Cluster Sample (Ford et al. 2004;Postman et al. 2005), which comprises eight galaxy clusters
Figure 20. Similar to Figure 19, but for two different radii bins: within 0.5R200and over the range 0.5R200 < R < R200. The early-type and late-type fractionschange in these two different regions, with the fraction of early-type galaxiesin the CMR increasing within 0.5R200. The fractions are constant with galaxymagnitude.
spanning redshifts between 0.8 and 1.27 and total cluster massesbetween ≈1 and ≈20 × 1014 M�. In terms of multiwavelengthand spectroscopic follow-up, this is the best cluster sampleavailable today at these redshifts. The single cluster CMRswere studied in a series of previous papers (Blakeslee et al.2003a, 2006; Homeier et al. 2006; Mei et al. 2006a, 2006b) toderive mean luminosity-weighted early-type galaxy ages and tostudy CMR parameters as a function of galaxy morphology andstructural properties (e.g., effective radii, ellipticities, surfacebrightness).
In this paper, the cluster CMR measurements, performedin ACS bandpasses, were converted to the same rest-frame(U − B)z=0 color and MB,z=0 magnitude, and calculated withinsimilar cluster regions (using R200 as the physical scale) downto ≈0.5L∗. The high angular resolution and sensitivity of theACS permitted us to obtain visual morphologies for two classesof early-type galaxies, elliptical and S0, and different classesof late-type galaxies, which we regrouped into general late-type and S0/a (from Postman et al. 2005). We systematicallyexamined general trends of the three CMR parameters—zeropoint, scatter, and slope—for elliptical and lenticular galaxiesas a function of galaxy magnitude and structural characteristics,and of cluster mass.
We find that for bright galaxies (MB,z=0 < −21 mag) in thecluster cores (R < 0.5R200), the elliptical population showssmaller CMR scatter than the S0 population. The ellipticalscatter increases with distance from the cluster center, an effectthat becomes larger at high redshift. At faint magnitudes, on theother hand, the early-type populations all display similarly largerscatter. If CMR scatter is primarily an age effect (e.g., Kodama &Arimoto 1997; Kauffman & Charlot 1998; Bernardi et al. 2005;Gallazzi et al. 2006), bright ellipticals in cluster cores have, onaverage, older stellar populations than S0 galaxies, peripheralelliptical galaxies, and in general faint early-type galaxies. Fromthe difference in CMR scatter, we deduce an average luminosity-weighted galaxy age difference of ≈0.5 Gyr, using a simple,
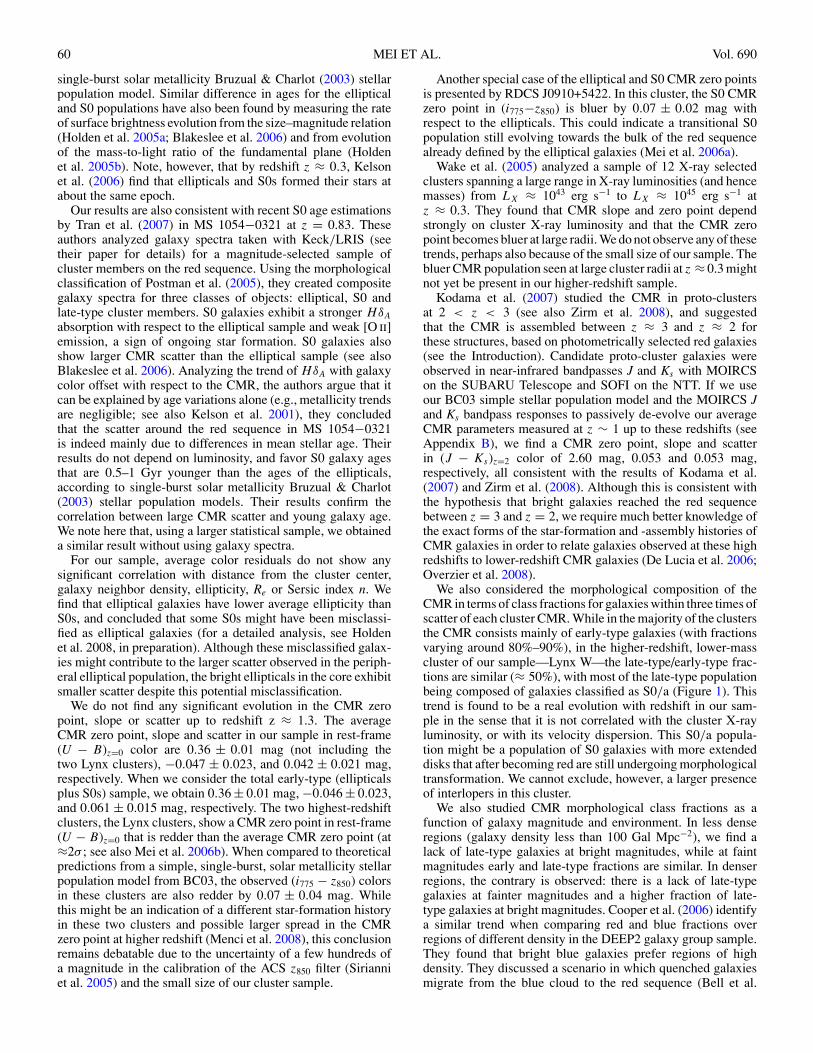
60 MEI ET AL. Vol. 690
single-burst solar metallicity Bruzual & Charlot (2003) stellarpopulation model. Similar difference in ages for the ellipticaland S0 populations have also been found by measuring the rateof surface brightness evolution from the size–magnitude relation(Holden et al. 2005a; Blakeslee et al. 2006) and from evolutionof the mass-to-light ratio of the fundamental plane (Holdenet al. 2005b). Note, however, that by redshift z ≈ 0.3, Kelsonet al. (2006) find that ellipticals and S0s formed their stars atabout the same epoch.
Our results are also consistent with recent S0 age estimationsby Tran et al. (2007) in MS 1054−0321 at z = 0.83. Theseauthors analyzed galaxy spectra taken with Keck/LRIS (seetheir paper for details) for a magnitude-selected sample ofcluster members on the red sequence. Using the morphologicalclassification of Postman et al. (2005), they created compositegalaxy spectra for three classes of objects: elliptical, S0 andlate-type cluster members. S0 galaxies exhibit a stronger HδA
absorption with respect to the elliptical sample and weak [O ii]emission, a sign of ongoing star formation. S0 galaxies alsoshow larger CMR scatter than the elliptical sample (see alsoBlakeslee et al. 2006). Analyzing the trend of HδA with galaxycolor offset with respect to the CMR, the authors argue that itcan be explained by age variations alone (e.g., metallicity trendsare negligible; see also Kelson et al. 2001), they concludedthat the scatter around the red sequence in MS 1054−0321is indeed mainly due to differences in mean stellar age. Theirresults do not depend on luminosity, and favor S0 galaxy agesthat are 0.5–1 Gyr younger than the ages of the ellipticals,according to single-burst solar metallicity Bruzual & Charlot(2003) stellar population models. Their results confirm thecorrelation between large CMR scatter and young galaxy age.We note here that, using a larger statistical sample, we obtaineda similar result without using galaxy spectra.
For our sample, average color residuals do not show anysignificant correlation with distance from the cluster center,galaxy neighbor density, ellipticity, Re or Sersic index n. Wefind that elliptical galaxies have lower average ellipticity thanS0s, and concluded that some S0s might have been misclassi-fied as elliptical galaxies (for a detailed analysis, see Holdenet al. 2008, in preparation). Although these misclassified galax-ies might contribute to the larger scatter observed in the periph-eral elliptical population, the bright ellipticals in the core exhibitsmaller scatter despite this potential misclassification.
We do not find any significant evolution in the CMR zeropoint, slope or scatter up to redshift z ≈ 1.3. The averageCMR zero point, slope and scatter in our sample in rest-frame(U − B)z=0 color are 0.36 ± 0.01 mag (not including thetwo Lynx clusters), −0.047 ± 0.023, and 0.042 ± 0.021 mag,respectively. When we consider the total early-type (ellipticalsplus S0s) sample, we obtain 0.36 ± 0.01 mag, −0.046 ± 0.023,and 0.061 ± 0.015 mag, respectively. The two highest-redshiftclusters, the Lynx clusters, show a CMR zero point in rest-frame(U − B)z=0 that is redder than the average CMR zero point (at≈2σ ; see also Mei et al. 2006b). When compared to theoreticalpredictions from a simple, single-burst, solar metallicity stellarpopulation model from BC03, the observed (i775 − z850) colorsin these clusters are also redder by 0.07 ± 0.04 mag. Whilethis might be an indication of a different star-formation historyin these two clusters and possible larger spread in the CMRzero point at higher redshift (Menci et al. 2008), this conclusionremains debatable due to the uncertainty of a few hundreds ofa magnitude in the calibration of the ACS z850 filter (Sirianniet al. 2005) and the small size of our cluster sample.
Another special case of the elliptical and S0 CMR zero pointsis presented by RDCS J0910+5422. In this cluster, the S0 CMRzero point in (i775−z850) is bluer by 0.07 ± 0.02 mag withrespect to the ellipticals. This could indicate a transitional S0population still evolving towards the bulk of the red sequencealready defined by the elliptical galaxies (Mei et al. 2006a).
Wake et al. (2005) analyzed a sample of 12 X-ray selectedclusters spanning a large range in X-ray luminosities (and hencemasses) from LX ≈ 1043 erg s−1 to LX ≈ 1045 erg s−1 atz ≈ 0.3. They found that CMR slope and zero point dependstrongly on cluster X-ray luminosity and that the CMR zeropoint becomes bluer at large radii. We do not observe any of thesetrends, perhaps also because of the small size of our sample. Thebluer CMR population seen at large cluster radii at z ≈ 0.3 mightnot yet be present in our higher-redshift sample.
Kodama et al. (2007) studied the CMR in proto-clustersat 2 < z < 3 (see also Zirm et al. 2008), and suggestedthat the CMR is assembled between z ≈ 3 and z ≈ 2 forthese structures, based on photometrically selected red galaxies(see the Introduction). Candidate proto-cluster galaxies wereobserved in near-infrared bandpasses J and Ks with MOIRCSon the SUBARU Telescope and SOFI on the NTT. If we useour BC03 simple stellar population model and the MOIRCS Jand Ks bandpass responses to passively de-evolve our averageCMR parameters measured at z ∼ 1 up to these redshifts (seeAppendix B), we find a CMR zero point, slope and scatterin (J − Ks)z=2 color of 2.60 mag, 0.053 and 0.053 mag,respectively, all consistent with the results of Kodama et al.(2007) and Zirm et al. (2008). Although this is consistent withthe hypothesis that bright galaxies reached the red sequencebetween z = 3 and z = 2, we require much better knowledge ofthe exact forms of the star-formation and -assembly histories ofCMR galaxies in order to relate galaxies observed at these highredshifts to lower-redshift CMR galaxies (De Lucia et al. 2006;Overzier et al. 2008).
We also considered the morphological composition of theCMR in terms of class fractions for galaxies within three times ofscatter of each cluster CMR. While in the majority of the clustersthe CMR consists mainly of early-type galaxies (with fractionsvarying around 80%–90%), in the higher-redshift, lower-masscluster of our sample—Lynx W—the late-type/early-type frac-tions are similar (≈ 50%), with most of the late-type populationbeing composed of galaxies classified as S0/a (Figure 1). Thistrend is found to be a real evolution with redshift in our sam-ple in the sense that it is not correlated with the cluster X-rayluminosity, or with its velocity dispersion. This S0/a popula-tion might be a population of S0 galaxies with more extendeddisks that after becoming red are still undergoing morphologicaltransformation. We cannot exclude, however, a larger presenceof interlopers in this cluster.
We also studied CMR morphological class fractions as afunction of galaxy magnitude and environment. In less denseregions (galaxy density less than 100 Gal Mpc−2), we find alack of late-type galaxies at bright magnitudes, while at faintmagnitudes early and late-type fractions are similar. In denserregions, the contrary is observed: there is a lack of late-typegalaxies at fainter magnitudes and a higher fraction of late-type galaxies at bright magnitudes. Cooper et al. (2006) identifya similar trend when comparing red and blue fractions overregions of different density in the DEEP2 galaxy group sample.They found that bright blue galaxies prefer regions of highdensity. They discussed a scenario in which quenched galaxiesmigrate from the blue cloud to the red sequence (Bell et al.
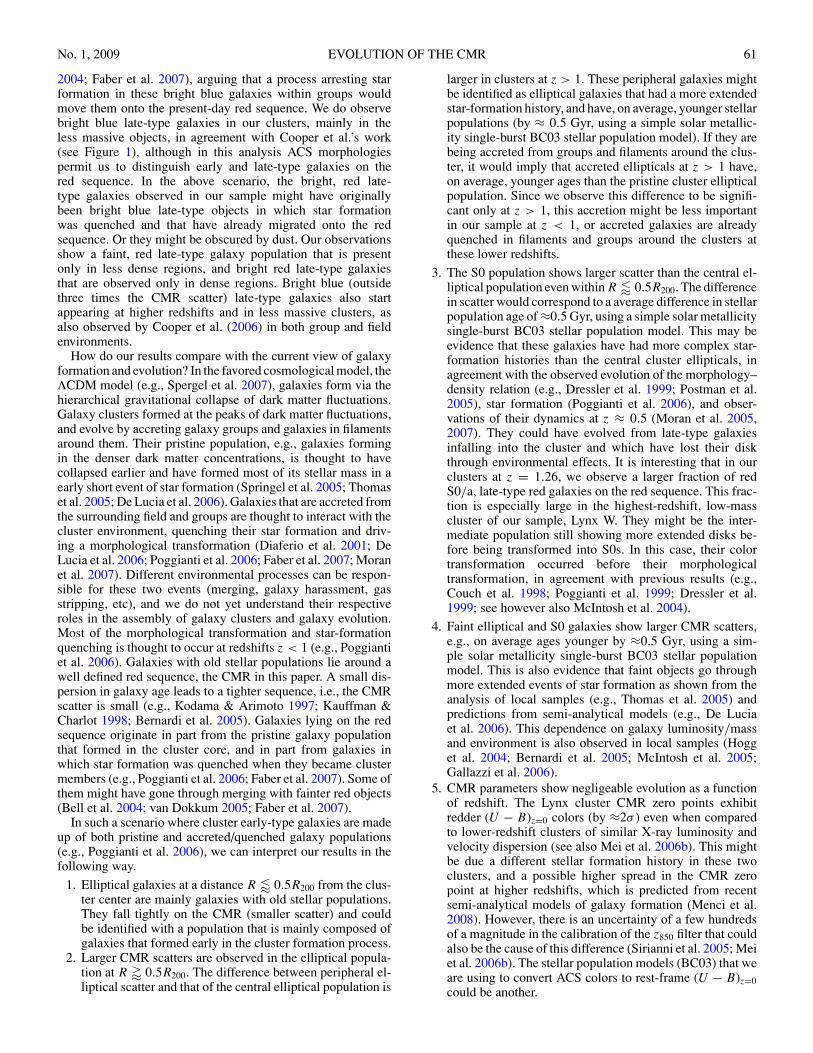
No. 1, 2009 EVOLUTION OF THE CMR 61
2004; Faber et al. 2007), arguing that a process arresting starformation in these bright blue galaxies within groups wouldmove them onto the present-day red sequence. We do observebright blue late-type galaxies in our clusters, mainly in theless massive objects, in agreement with Cooper et al.’s work(see Figure 1), although in this analysis ACS morphologiespermit us to distinguish early and late-type galaxies on thered sequence. In the above scenario, the bright, red late-type galaxies observed in our sample might have originallybeen bright blue late-type objects in which star formationwas quenched and that have already migrated onto the redsequence. Or they might be obscured by dust. Our observationsshow a faint, red late-type galaxy population that is presentonly in less dense regions, and bright red late-type galaxiesthat are observed only in dense regions. Bright blue (outsidethree times the CMR scatter) late-type galaxies also startappearing at higher redshifts and in less massive clusters, asalso observed by Cooper et al. (2006) in both group and fieldenvironments.
How do our results compare with the current view of galaxyformation and evolution? In the favored cosmological model, theΛCDM model (e.g., Spergel et al. 2007), galaxies form via thehierarchical gravitational collapse of dark matter fluctuations.Galaxy clusters formed at the peaks of dark matter fluctuations,and evolve by accreting galaxy groups and galaxies in filamentsaround them. Their pristine population, e.g., galaxies formingin the denser dark matter concentrations, is thought to havecollapsed earlier and have formed most of its stellar mass in aearly short event of star formation (Springel et al. 2005; Thomaset al. 2005; De Lucia et al. 2006). Galaxies that are accreted fromthe surrounding field and groups are thought to interact with thecluster environment, quenching their star formation and driv-ing a morphological transformation (Diaferio et al. 2001; DeLucia et al. 2006; Poggianti et al. 2006; Faber et al. 2007; Moranet al. 2007). Different environmental processes can be respon-sible for these two events (merging, galaxy harassment, gasstripping, etc), and we do not yet understand their respectiveroles in the assembly of galaxy clusters and galaxy evolution.Most of the morphological transformation and star-formationquenching is thought to occur at redshifts z < 1 (e.g., Poggiantiet al. 2006). Galaxies with old stellar populations lie around awell defined red sequence, the CMR in this paper. A small dis-persion in galaxy age leads to a tighter sequence, i.e., the CMRscatter is small (e.g., Kodama & Arimoto 1997; Kauffman &Charlot 1998; Bernardi et al. 2005). Galaxies lying on the redsequence originate in part from the pristine galaxy populationthat formed in the cluster core, and in part from galaxies inwhich star formation was quenched when they became clustermembers (e.g., Poggianti et al. 2006; Faber et al. 2007). Some ofthem might have gone through merging with fainter red objects(Bell et al. 2004; van Dokkum 2005; Faber et al. 2007).
In such a scenario where cluster early-type galaxies are madeup of both pristine and accreted/quenched galaxy populations(e.g., Poggianti et al. 2006), we can interpret our results in thefollowing way.
1. Elliptical galaxies at a distance R � 0.5R200 from the clus-ter center are mainly galaxies with old stellar populations.They fall tightly on the CMR (smaller scatter) and couldbe identified with a population that is mainly composed ofgalaxies that formed early in the cluster formation process.
2. Larger CMR scatters are observed in the elliptical popula-tion at R � 0.5R200. The difference between peripheral el-liptical scatter and that of the central elliptical population is
larger in clusters at z > 1. These peripheral galaxies mightbe identified as elliptical galaxies that had a more extendedstar-formation history, and have, on average, younger stellarpopulations (by ≈ 0.5 Gyr, using a simple solar metallic-ity single-burst BC03 stellar population model). If they arebeing accreted from groups and filaments around the clus-ter, it would imply that accreted ellipticals at z > 1 have,on average, younger ages than the pristine cluster ellipticalpopulation. Since we observe this difference to be signifi-cant only at z > 1, this accretion might be less importantin our sample at z < 1, or accreted galaxies are alreadyquenched in filaments and groups around the clusters atthese lower redshifts.
3. The S0 population shows larger scatter than the central el-liptical population even within R � 0.5R200. The differencein scatter would correspond to a average difference in stellarpopulation age of ≈0.5 Gyr, using a simple solar metallicitysingle-burst BC03 stellar population model. This may beevidence that these galaxies have had more complex star-formation histories than the central cluster ellipticals, inagreement with the observed evolution of the morphology–density relation (e.g., Dressler et al. 1999; Postman et al.2005), star formation (Poggianti et al. 2006), and obser-vations of their dynamics at z ≈ 0.5 (Moran et al. 2005,2007). They could have evolved from late-type galaxiesinfalling into the cluster and which have lost their diskthrough environmental effects. It is interesting that in ourclusters at z = 1.26, we observe a larger fraction of redS0/a, late-type red galaxies on the red sequence. This frac-tion is especially large in the highest-redshift, low-masscluster of our sample, Lynx W. They might be the inter-mediate population still showing more extended disks be-fore being transformed into S0s. In this case, their colortransformation occurred before their morphologicaltransformation, in agreement with previous results (e.g.,Couch et al. 1998; Poggianti et al. 1999; Dressler et al.1999; see however also McIntosh et al. 2004).
4. Faint elliptical and S0 galaxies show larger CMR scatters,e.g., on average ages younger by ≈0.5 Gyr, using a sim-ple solar metallicity single-burst BC03 stellar populationmodel. This is also evidence that faint objects go throughmore extended events of star formation as shown from theanalysis of local samples (e.g., Thomas et al. 2005) andpredictions from semi-analytical models (e.g., De Luciaet al. 2006). This dependence on galaxy luminosity/massand environment is also observed in local samples (Hogget al. 2004; Bernardi et al. 2005; McIntosh et al. 2005;Gallazzi et al. 2006).
5. CMR parameters show negligeable evolution as a functionof redshift. The Lynx cluster CMR zero points exhibitredder (U − B)z=0 colors (by ≈2σ ) even when comparedto lower-redshift clusters of similar X-ray luminosity andvelocity dispersion (see also Mei et al. 2006b). This mightbe due a different stellar formation history in these twoclusters, and a possible higher spread in the CMR zeropoint at higher redshifts, which is predicted from recentsemi-analytical models of galaxy formation (Menci et al.2008). However, there is an uncertainty of a few hundredsof a magnitude in the calibration of the z850 filter that couldalso be the cause of this difference (Sirianni et al. 2005; Meiet al. 2006b). The stellar population models (BC03) that weare using to convert ACS colors to rest-frame (U − B)z=0could be another.
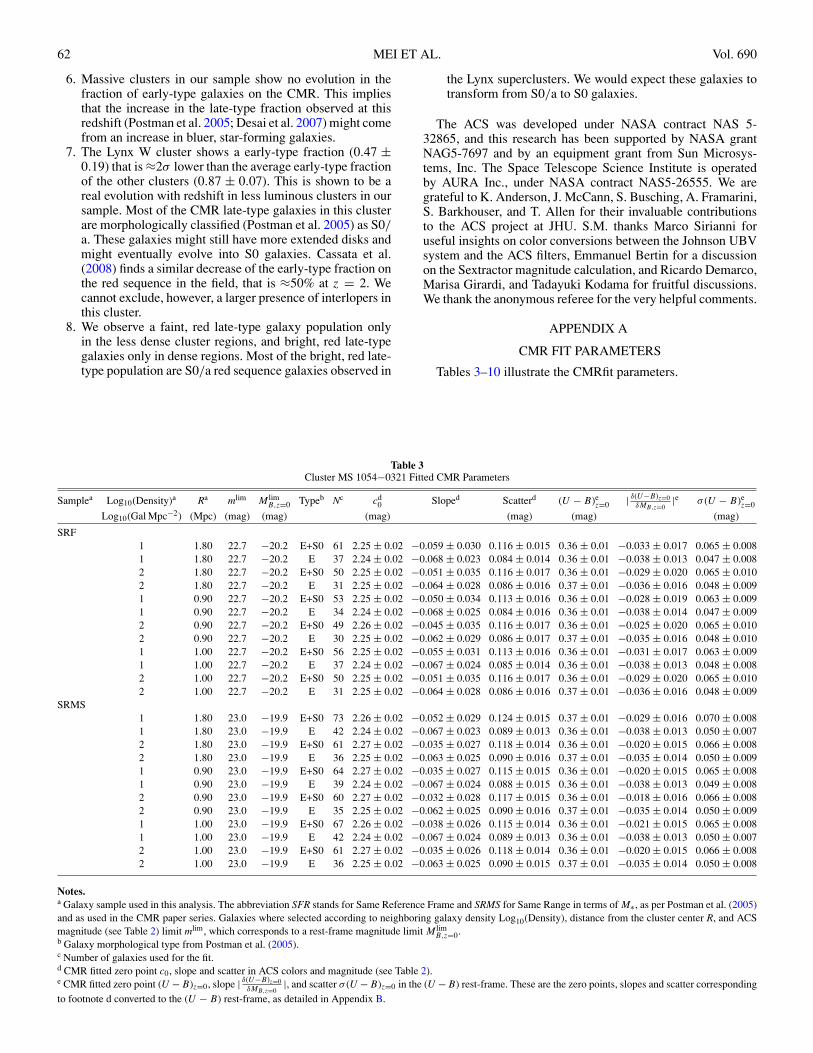
62 MEI ET AL. Vol. 690
6. Massive clusters in our sample show no evolution in thefraction of early-type galaxies on the CMR. This impliesthat the increase in the late-type fraction observed at thisredshift (Postman et al. 2005; Desai et al. 2007) might comefrom an increase in bluer, star-forming galaxies.
7. The Lynx W cluster shows a early-type fraction (0.47 ±0.19) that is ≈2σ lower than the average early-type fractionof the other clusters (0.87 ± 0.07). This is shown to be areal evolution with redshift in less luminous clusters in oursample. Most of the CMR late-type galaxies in this clusterare morphologically classified (Postman et al. 2005) as S0/a. These galaxies might still have more extended disks andmight eventually evolve into S0 galaxies. Cassata et al.(2008) finds a similar decrease of the early-type fraction onthe red sequence in the field, that is ≈50% at z = 2. Wecannot exclude, however, a larger presence of interlopers inthis cluster.
8. We observe a faint, red late-type galaxy population onlyin the less dense cluster regions, and bright, red late-typegalaxies only in dense regions. Most of the bright, red late-type population are S0/a red sequence galaxies observed in
the Lynx superclusters. We would expect these galaxies totransform from S0/a to S0 galaxies.
The ACS was developed under NASA contract NAS 5-32865, and this research has been supported by NASA grantNAG5-7697 and by an equipment grant from Sun Microsys-tems, Inc. The Space Telescope Science Institute is operatedby AURA Inc., under NASA contract NAS5-26555. We aregrateful to K. Anderson, J. McCann, S. Busching, A. Framarini,S. Barkhouser, and T. Allen for their invaluable contributionsto the ACS project at JHU. S.M. thanks Marco Sirianni foruseful insights on color conversions between the Johnson UBVsystem and the ACS filters, Emmanuel Bertin for a discussionon the Sextractor magnitude calculation, and Ricardo Demarco,Marisa Girardi, and Tadayuki Kodama for fruitful discussions.We thank the anonymous referee for the very helpful comments.
APPENDIX A
CMR FIT PARAMETERS
Tables 3–10 illustrate the CMRfit parameters.
Table 3Cluster MS 1054−0321 Fitted CMR Parameters
Samplea Log10(Density)a Ra mlim M limB,z=0 Typeb Nc cd
0 Sloped Scatterd (U − B)ez=0 | δ(U−B)z=0
δMB,z=0|e σ (U − B)e
z=0
Log10(Gal Mpc−2) (Mpc) (mag) (mag) (mag) (mag) (mag) (mag)
SRF1 1.80 22.7 −20.2 E+S0 61 2.25 ± 0.02 −0.059 ± 0.030 0.116 ± 0.015 0.36 ± 0.01 −0.033 ± 0.017 0.065 ± 0.0081 1.80 22.7 −20.2 E 37 2.24 ± 0.02 −0.068 ± 0.023 0.084 ± 0.014 0.36 ± 0.01 −0.038 ± 0.013 0.047 ± 0.0082 1.80 22.7 −20.2 E+S0 50 2.25 ± 0.02 −0.051 ± 0.035 0.116 ± 0.017 0.36 ± 0.01 −0.029 ± 0.020 0.065 ± 0.0102 1.80 22.7 −20.2 E 31 2.25 ± 0.02 −0.064 ± 0.028 0.086 ± 0.016 0.37 ± 0.01 −0.036 ± 0.016 0.048 ± 0.0091 0.90 22.7 −20.2 E+S0 53 2.25 ± 0.02 −0.050 ± 0.034 0.113 ± 0.016 0.36 ± 0.01 −0.028 ± 0.019 0.063 ± 0.0091 0.90 22.7 −20.2 E 34 2.24 ± 0.02 −0.068 ± 0.025 0.084 ± 0.016 0.36 ± 0.01 −0.038 ± 0.014 0.047 ± 0.0092 0.90 22.7 −20.2 E+S0 49 2.26 ± 0.02 −0.045 ± 0.035 0.116 ± 0.017 0.36 ± 0.01 −0.025 ± 0.020 0.065 ± 0.0102 0.90 22.7 −20.2 E 30 2.25 ± 0.02 −0.062 ± 0.029 0.086 ± 0.017 0.37 ± 0.01 −0.035 ± 0.016 0.048 ± 0.0101 1.00 22.7 −20.2 E+S0 56 2.25 ± 0.02 −0.055 ± 0.031 0.113 ± 0.016 0.36 ± 0.01 −0.031 ± 0.017 0.063 ± 0.0091 1.00 22.7 −20.2 E 37 2.24 ± 0.02 −0.067 ± 0.024 0.085 ± 0.014 0.36 ± 0.01 −0.038 ± 0.013 0.048 ± 0.0082 1.00 22.7 −20.2 E+S0 50 2.25 ± 0.02 −0.051 ± 0.035 0.116 ± 0.017 0.36 ± 0.01 −0.029 ± 0.020 0.065 ± 0.0102 1.00 22.7 −20.2 E 31 2.25 ± 0.02 −0.064 ± 0.028 0.086 ± 0.016 0.37 ± 0.01 −0.036 ± 0.016 0.048 ± 0.009
SRMS1 1.80 23.0 −19.9 E+S0 73 2.26 ± 0.02 −0.052 ± 0.029 0.124 ± 0.015 0.37 ± 0.01 −0.029 ± 0.016 0.070 ± 0.0081 1.80 23.0 −19.9 E 42 2.24 ± 0.02 −0.067 ± 0.023 0.089 ± 0.013 0.36 ± 0.01 −0.038 ± 0.013 0.050 ± 0.0072 1.80 23.0 −19.9 E+S0 61 2.27 ± 0.02 −0.035 ± 0.027 0.118 ± 0.014 0.36 ± 0.01 −0.020 ± 0.015 0.066 ± 0.0082 1.80 23.0 −19.9 E 36 2.25 ± 0.02 −0.063 ± 0.025 0.090 ± 0.016 0.37 ± 0.01 −0.035 ± 0.014 0.050 ± 0.0091 0.90 23.0 −19.9 E+S0 64 2.27 ± 0.02 −0.035 ± 0.027 0.115 ± 0.015 0.36 ± 0.01 −0.020 ± 0.015 0.065 ± 0.0081 0.90 23.0 −19.9 E 39 2.24 ± 0.02 −0.067 ± 0.024 0.088 ± 0.015 0.36 ± 0.01 −0.038 ± 0.013 0.049 ± 0.0082 0.90 23.0 −19.9 E+S0 60 2.27 ± 0.02 −0.032 ± 0.028 0.117 ± 0.015 0.36 ± 0.01 −0.018 ± 0.016 0.066 ± 0.0082 0.90 23.0 −19.9 E 35 2.25 ± 0.02 −0.062 ± 0.025 0.090 ± 0.016 0.37 ± 0.01 −0.035 ± 0.014 0.050 ± 0.0091 1.00 23.0 −19.9 E+S0 67 2.26 ± 0.02 −0.038 ± 0.026 0.115 ± 0.014 0.36 ± 0.01 −0.021 ± 0.015 0.065 ± 0.0081 1.00 23.0 −19.9 E 42 2.24 ± 0.02 −0.067 ± 0.024 0.089 ± 0.013 0.36 ± 0.01 −0.038 ± 0.013 0.050 ± 0.0072 1.00 23.0 −19.9 E+S0 61 2.27 ± 0.02 −0.035 ± 0.026 0.118 ± 0.014 0.36 ± 0.01 −0.020 ± 0.015 0.066 ± 0.0082 1.00 23.0 −19.9 E 36 2.25 ± 0.02 −0.063 ± 0.025 0.090 ± 0.015 0.37 ± 0.01 −0.035 ± 0.014 0.050 ± 0.008
Notes.a Galaxy sample used in this analysis. The abbreviation SFR stands for Same Reference Frame and SRMS for Same Range in terms of M∗, as per Postman et al. (2005)and as used in the CMR paper series. Galaxies where selected according to neighboring galaxy density Log10(Density), distance from the cluster center R, and ACSmagnitude (see Table 2) limit mlim, which corresponds to a rest-frame magnitude limit M lim
B,z=0.b Galaxy morphological type from Postman et al. (2005).c Number of galaxies used for the fit.d CMR fitted zero point c0, slope and scatter in ACS colors and magnitude (see Table 2).e CMR fitted zero point (U −B)z=0, slope | δ(U−B)z=0
δMB,z=0|, and scatter σ (U −B)z=0 in the (U −B) rest-frame. These are the zero points, slopes and scatter corresponding
to footnote d converted to the (U − B) rest-frame, as detailed in Appendix B.

No. 1, 2009 EVOLUTION OF THE CMR 63
Table 4Cluster RX J0152.7−1357 Fitted CMR Parameters
Samplea Log10(Density)a Ra mlim M limB,z=0 Typeb Nc cd
0 Sloped Scatterd (U − B)ez=0 | δ(U−B)z=0
δMB,z=0|e
σ (U − B)ez=0
Log10(Gal Mpc−2) Mpc mag mag mag mag mag mag
SRF1 1.90 22.8 −20.2 E+S0 50 1.95 ± 0.02 −0.021 ± 0.018 0.076 ± 0.009 0.38 ± 0.01 −0.013 ± 0.012 0.049 ± 0.0061 1.90 22.8 −20.2 E 33 1.96 ± 0.02 −0.011 ± 0.020 0.066 ± 0.009 0.38 ± 0.01 −0.007 ± 0.013 0.042 ± 0.0062 1.90 22.8 −20.2 E+S0 38 1.96 ± 0.02 −0.024 ± 0.023 0.081 ± 0.012 0.39 ± 0.01 −0.015 ± 0.015 0.052 ± 0.0082 1.90 22.8 −20.2 E 24 1.98 ± 0.03 −0.011 ± 0.025 0.065 ± 0.011 0.39 ± 0.02 −0.007 ± 0.016 0.042 ± 0.0071 0.95 22.8 −20.2 E+S0 37 1.95 ± 0.02 −0.029 ± 0.022 0.080 ± 0.012 0.38 ± 0.01 −0.019 ± 0.014 0.051 ± 0.0081 0.95 22.8 −20.2 E 25 1.96 ± 0.03 −0.021 ± 0.026 0.071 ± 0.010 0.38 ± 0.02 −0.013 ± 0.017 0.045 ± 0.0062 0.95 22.8 −20.2 E+S0 34 1.96 ± 0.03 −0.028 ± 0.025 0.080 ± 0.013 0.39 ± 0.02 −0.018 ± 0.016 0.051 ± 0.0082 0.95 22.8 −20.2 E 22 1.97 ± 0.03 −0.015 ± 0.029 0.068 ± 0.012 0.39 ± 0.02 −0.010 ± 0.019 0.043 ± 0.0081 1.00 22.8 −20.2 E+S0 41 1.95 ± 0.02 −0.026 ± 0.021 0.080 ± 0.011 0.38 ± 0.01 −0.017 ± 0.013 0.051 ± 0.0071 1.00 22.8 −20.2 E 27 1.96 ± 0.02 −0.018 ± 0.023 0.072 ± 0.010 0.38 ± 0.01 −0.012 ± 0.015 0.046 ± 0.0062 1.00 22.8 −20.2 E+S0 37 1.96 ± 0.02 −0.029 ± 0.023 0.080 ± 0.012 0.39 ± 0.01 −0.019 ± 0.015 0.051 ± 0.0082 1.00 22.8 −20.2 E 23 1.97 ± 0.03 −0.016 ± 0.026 0.067 ± 0.012 0.39 ± 0.02 −0.010 ± 0.017 0.043 ± 0.008
SRMS1 1.90 23.0 −20.0 E+S0 56 1.93 ± 0.02 −0.040 ± 0.017 0.079 ± 0.008 0.38 ± 0.01 −0.026 ± 0.011 0.050 ± 0.0051 1.90 23.0 −20.0 E 36 1.94 ± 0.02 −0.034 ± 0.020 0.072 ± 0.009 0.38 ± 0.01 −0.022 ± 0.013 0.046 ± 0.0062 1.90 23.0 −20.0 E+S0 40 1.95 ± 0.02 −0.033 ± 0.020 0.081 ± 0.011 0.38 ± 0.01 −0.021 ± 0.013 0.052 ± 0.0072 1.90 23.0 −20.0 E 25 1.97 ± 0.02 −0.021 ± 0.023 0.066 ± 0.010 0.39 ± 0.01 −0.013 ± 0.015 0.042 ± 0.0061 0.95 23.0 −20.0 E+S0 38 1.95 ± 0.02 −0.032 ± 0.021 0.079 ± 0.011 0.38 ± 0.01 −0.020 ± 0.013 0.050 ± 0.0071 0.95 23.0 −20.0 E 26 1.95 ± 0.02 −0.028 ± 0.024 0.070 ± 0.010 0.38 ± 0.01 −0.018 ± 0.015 0.045 ± 0.0062 0.95 23.0 −20.0 E+S0 35 1.96 ± 0.02 −0.032 ± 0.023 0.079 ± 0.012 0.39 ± 0.01 −0.020 ± 0.015 0.050 ± 0.0082 0.95 23.0 −20.0 E 23 1.97 ± 0.03 −0.022 ± 0.024 0.068 ± 0.011 0.39 ± 0.02 −0.014 ± 0.015 0.043 ± 0.0071 1.00 23.0 −20.0 E+S0 42 1.95 ± 0.02 −0.029 ± 0.020 0.079 ± 0.011 0.38 ± 0.01 −0.019 ± 0.013 0.050 ± 0.0071 1.00 23.0 −20.0 E 28 1.95 ± 0.02 −0.024 ± 0.020 0.071 ± 0.009 0.38 ± 0.01 −0.015 ± 0.013 0.045 ± 0.0062 1.00 23.0 −20.0 E+S0 38 1.95 ± 0.02 −0.033 ± 0.021 0.079 ± 0.011 0.38 ± 0.01 −0.021 ± 0.013 0.050 ± 0.0072 1.00 23.0 −20.0 E 24 1.96 ± 0.02 −0.024 ± 0.023 0.067 ± 0.010 0.39 ± 0.01 −0.015 ± 0.015 0.043 ± 0.006
Note. Footnotes a, b, c, d, and e as in Table 3.
Table 5Cluster CL 1604+4304 Fitted CMR Parameters
Samplea Log10(Density)a Ra mlim M limB,z=0 Typeb Nc cd
0 Sloped Scatterd (U − B)ez=0 | δ(U−B)z=0
δMB,z=0|e σ (U − B)e
z=0
Log10(Gal Mpc−2) Mpc mag mag mag mag mag mag
SRF1 1.10 22.8 −20.2 E+S0 22 1.79 ± 0.01 −0.056 ± 0.015 0.037 ± 0.005 0.37 ± 0.01 −0.043 ± 0.012 0.029 ± 0.0041 1.10 22.8 −20.2 E 13 1.80 ± 0.01 −0.041 ± 0.018 0.032 ± 0.008 0.37 ± 0.01 −0.032 ± 0.014 0.025 ± 0.0062 1.10 22.8 −20.2 E+S0 13 1.79 ± 0.01 −0.060 ± 0.020 0.035 ± 0.008 0.37 ± 0.01 −0.046 ± 0.015 0.027 ± 0.0062 1.10 22.8 −20.2 E 8 1.80 ± 0.01 −0.034 ± 0.011 0.015 ± 0.006 0.36 ± 0.01 −0.026 ± 0.008 0.012 ± 0.0051 0.55 22.8 −20.2 E+S0 16 1.79 ± 0.02 −0.055 ± 0.019 0.043 ± 0.006 0.37 ± 0.02 −0.042 ± 0.015 0.033 ± 0.0051 0.55 22.8 −20.2 E 9 1.81 ± 0.01 −0.039 ± 0.024 0.039 ± 0.012 0.37 ± 0.01 −0.030 ± 0.019 0.030 ± 0.0092 0.55 22.8 −20.2 E+S0 9 1.80 ± 0.02 −0.076 ± 0.036 0.043 ± 0.012 0.39 ± 0.02 −0.059 ± 0.028 0.033 ± 0.0092 0.55 22.8 −20.2 E 5 1.82 ± 0.01 −0.028 ± 0.004 0.013 ± 0.008 0.37 ± 0.01 −0.022 ± 0.003 0.010 ± 0.0061 1.00 22.8 −20.2 E+S0 22 1.79 ± 0.01 −0.056 ± 0.015 0.037 ± 0.005 0.37 ± 0.01 −0.043 ± 0.012 0.029 ± 0.0041 1.00 22.8 −20.2 E 13 1.80 ± 0.01 −0.041 ± 0.018 0.032 ± 0.008 0.37 ± 0.01 −0.032 ± 0.014 0.025 ± 0.0062 1.00 22.8 −20.2 E+S0 13 1.79 ± 0.01 −0.060 ± 0.020 0.034 ± 0.008 0.37 ± 0.01 −0.046 ± 0.015 0.026 ± 0.0062 1.00 22.8 −20.2 E 8 1.80 ± 0.01 −0.034 ± 0.011 0.015 ± 0.006 0.36 ± 0.01 −0.026 ± 0.008 0.012 ± 0.005
SRMS1 1.10 24.0 −19.0 E+S0 39 1.78 ± 0.01 −0.075 ± 0.009 0.040 ± 0.004 0.37 ± 0.01 −0.058 ± 0.007 0.031 ± 0.0031 1.10 24.0 −19.0 E 23 1.78 ± 0.01 −0.074 ± 0.012 0.042 ± 0.006 0.37 ± 0.01 −0.057 ± 0.009 0.032 ± 0.0052 1.10 24.0 −19.0 E+S0 20 1.78 ± 0.01 −0.076 ± 0.016 0.043 ± 0.006 0.37 ± 0.01 −0.059 ± 0.012 0.033 ± 0.0052 1.10 24.0 −19.0 E 11 1.80 ± 0.02 −0.077 ± 0.052 0.046 ± 0.020 0.39 ± 0.02 −0.059 ± 0.040 0.035 ± 0.0151 0.55 24.0 −19.0 E+S0 29 1.78 ± 0.01 −0.072 ± 0.010 0.040 ± 0.005 0.37 ± 0.01 −0.056 ± 0.008 0.031 ± 0.0041 0.55 24.0 −19.0 E 17 1.78 ± 0.02 −0.072 ± 0.013 0.046 ± 0.006 0.37 ± 0.02 −0.056 ± 0.010 0.035 ± 0.0052 0.55 24.0 −19.0 E+S0 14 1.80 ± 0.02 −0.070 ± 0.017 0.038 ± 0.010 0.38 ± 0.02 −0.054 ± 0.013 0.029 ± 0.0082 0.55 24.0 −19.0 E 7 1.82 ± 0.01 −0.060 ± 0.037 0.041 ± 0.029 0.39 ± 0.01 −0.046 ± 0.029 0.032 ± 0.0221 1.00 24.0 −19.0 E+S0 39 1.78 ± 0.01 −0.075 ± 0.009 0.040 ± 0.004 0.37 ± 0.01 −0.058 ± 0.007 0.031 ± 0.0031 1.00 24.0 −19.0 E 23 1.78 ± 0.01 −0.074 ± 0.012 0.043 ± 0.006 0.37 ± 0.01 −0.057 ± 0.009 0.033 ± 0.0052 1.00 24.0 −19.0 E+S0 20 1.78 ± 0.01 −0.076 ± 0.016 0.043 ± 0.006 0.37 ± 0.01 −0.059 ± 0.012 0.033 ± 0.0052 1.00 24.0 −19.0 E 11 1.80 ± 0.02 −0.076 ± 0.049 0.046 ± 0.019 0.39 ± 0.02 −0.059 ± 0.038 0.035 ± 0.015
Note. Footnotes a, b, c, d, and e as in Table 3.
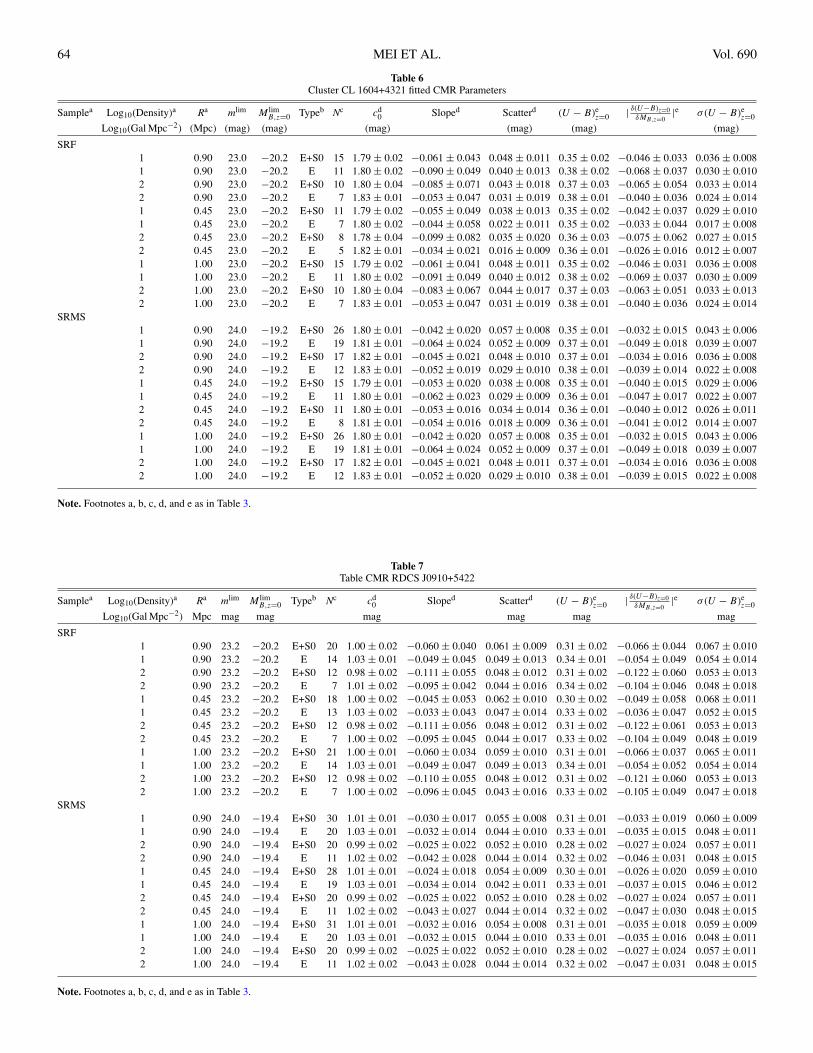
64 MEI ET AL. Vol. 690
Table 6Cluster CL 1604+4321 fitted CMR Parameters
Samplea Log10(Density)a Ra mlim M limB,z=0 Typeb Nc cd
0 Sloped Scatterd (U − B)ez=0 | δ(U−B)z=0
δMB,z=0|e σ (U − B)e
z=0
Log10(Gal Mpc−2) (Mpc) (mag) (mag) (mag) (mag) (mag) (mag)
SRF1 0.90 23.0 −20.2 E+S0 15 1.79 ± 0.02 −0.061 ± 0.043 0.048 ± 0.011 0.35 ± 0.02 −0.046 ± 0.033 0.036 ± 0.0081 0.90 23.0 −20.2 E 11 1.80 ± 0.02 −0.090 ± 0.049 0.040 ± 0.013 0.38 ± 0.02 −0.068 ± 0.037 0.030 ± 0.0102 0.90 23.0 −20.2 E+S0 10 1.80 ± 0.04 −0.085 ± 0.071 0.043 ± 0.018 0.37 ± 0.03 −0.065 ± 0.054 0.033 ± 0.0142 0.90 23.0 −20.2 E 7 1.83 ± 0.01 −0.053 ± 0.047 0.031 ± 0.019 0.38 ± 0.01 −0.040 ± 0.036 0.024 ± 0.0141 0.45 23.0 −20.2 E+S0 11 1.79 ± 0.02 −0.055 ± 0.049 0.038 ± 0.013 0.35 ± 0.02 −0.042 ± 0.037 0.029 ± 0.0101 0.45 23.0 −20.2 E 7 1.80 ± 0.02 −0.044 ± 0.058 0.022 ± 0.011 0.35 ± 0.02 −0.033 ± 0.044 0.017 ± 0.0082 0.45 23.0 −20.2 E+S0 8 1.78 ± 0.04 −0.099 ± 0.082 0.035 ± 0.020 0.36 ± 0.03 −0.075 ± 0.062 0.027 ± 0.0152 0.45 23.0 −20.2 E 5 1.82 ± 0.01 −0.034 ± 0.021 0.016 ± 0.009 0.36 ± 0.01 −0.026 ± 0.016 0.012 ± 0.0071 1.00 23.0 −20.2 E+S0 15 1.79 ± 0.02 −0.061 ± 0.041 0.048 ± 0.011 0.35 ± 0.02 −0.046 ± 0.031 0.036 ± 0.0081 1.00 23.0 −20.2 E 11 1.80 ± 0.02 −0.091 ± 0.049 0.040 ± 0.012 0.38 ± 0.02 −0.069 ± 0.037 0.030 ± 0.0092 1.00 23.0 −20.2 E+S0 10 1.80 ± 0.04 −0.083 ± 0.067 0.044 ± 0.017 0.37 ± 0.03 −0.063 ± 0.051 0.033 ± 0.0132 1.00 23.0 −20.2 E 7 1.83 ± 0.01 −0.053 ± 0.047 0.031 ± 0.019 0.38 ± 0.01 −0.040 ± 0.036 0.024 ± 0.014
SRMS1 0.90 24.0 −19.2 E+S0 26 1.80 ± 0.01 −0.042 ± 0.020 0.057 ± 0.008 0.35 ± 0.01 −0.032 ± 0.015 0.043 ± 0.0061 0.90 24.0 −19.2 E 19 1.81 ± 0.01 −0.064 ± 0.024 0.052 ± 0.009 0.37 ± 0.01 −0.049 ± 0.018 0.039 ± 0.0072 0.90 24.0 −19.2 E+S0 17 1.82 ± 0.01 −0.045 ± 0.021 0.048 ± 0.010 0.37 ± 0.01 −0.034 ± 0.016 0.036 ± 0.0082 0.90 24.0 −19.2 E 12 1.83 ± 0.01 −0.052 ± 0.019 0.029 ± 0.010 0.38 ± 0.01 −0.039 ± 0.014 0.022 ± 0.0081 0.45 24.0 −19.2 E+S0 15 1.79 ± 0.01 −0.053 ± 0.020 0.038 ± 0.008 0.35 ± 0.01 −0.040 ± 0.015 0.029 ± 0.0061 0.45 24.0 −19.2 E 11 1.80 ± 0.01 −0.062 ± 0.023 0.029 ± 0.009 0.36 ± 0.01 −0.047 ± 0.017 0.022 ± 0.0072 0.45 24.0 −19.2 E+S0 11 1.80 ± 0.01 −0.053 ± 0.016 0.034 ± 0.014 0.36 ± 0.01 −0.040 ± 0.012 0.026 ± 0.0112 0.45 24.0 −19.2 E 8 1.81 ± 0.01 −0.054 ± 0.016 0.018 ± 0.009 0.36 ± 0.01 −0.041 ± 0.012 0.014 ± 0.0071 1.00 24.0 −19.2 E+S0 26 1.80 ± 0.01 −0.042 ± 0.020 0.057 ± 0.008 0.35 ± 0.01 −0.032 ± 0.015 0.043 ± 0.0061 1.00 24.0 −19.2 E 19 1.81 ± 0.01 −0.064 ± 0.024 0.052 ± 0.009 0.37 ± 0.01 −0.049 ± 0.018 0.039 ± 0.0072 1.00 24.0 −19.2 E+S0 17 1.82 ± 0.01 −0.045 ± 0.021 0.048 ± 0.011 0.37 ± 0.01 −0.034 ± 0.016 0.036 ± 0.0082 1.00 24.0 −19.2 E 12 1.83 ± 0.01 −0.052 ± 0.020 0.029 ± 0.010 0.38 ± 0.01 −0.039 ± 0.015 0.022 ± 0.008
Note. Footnotes a, b, c, d, and e as in Table 3.
Table 7Table CMR RDCS J0910+5422
Samplea Log10(Density)a Ra mlim M limB,z=0 Typeb Nc cd
0 Sloped Scatterd (U − B)ez=0 | δ(U−B)z=0
δMB,z=0|e σ (U − B)e
z=0
Log10(Gal Mpc−2) Mpc mag mag mag mag mag mag
SRF1 0.90 23.2 −20.2 E+S0 20 1.00 ± 0.02 −0.060 ± 0.040 0.061 ± 0.009 0.31 ± 0.02 −0.066 ± 0.044 0.067 ± 0.0101 0.90 23.2 −20.2 E 14 1.03 ± 0.01 −0.049 ± 0.045 0.049 ± 0.013 0.34 ± 0.01 −0.054 ± 0.049 0.054 ± 0.0142 0.90 23.2 −20.2 E+S0 12 0.98 ± 0.02 −0.111 ± 0.055 0.048 ± 0.012 0.31 ± 0.02 −0.122 ± 0.060 0.053 ± 0.0132 0.90 23.2 −20.2 E 7 1.01 ± 0.02 −0.095 ± 0.042 0.044 ± 0.016 0.34 ± 0.02 −0.104 ± 0.046 0.048 ± 0.0181 0.45 23.2 −20.2 E+S0 18 1.00 ± 0.02 −0.045 ± 0.053 0.062 ± 0.010 0.30 ± 0.02 −0.049 ± 0.058 0.068 ± 0.0111 0.45 23.2 −20.2 E 13 1.03 ± 0.02 −0.033 ± 0.043 0.047 ± 0.014 0.33 ± 0.02 −0.036 ± 0.047 0.052 ± 0.0152 0.45 23.2 −20.2 E+S0 12 0.98 ± 0.02 −0.111 ± 0.056 0.048 ± 0.012 0.31 ± 0.02 −0.122 ± 0.061 0.053 ± 0.0132 0.45 23.2 −20.2 E 7 1.00 ± 0.02 −0.095 ± 0.045 0.044 ± 0.017 0.33 ± 0.02 −0.104 ± 0.049 0.048 ± 0.0191 1.00 23.2 −20.2 E+S0 21 1.00 ± 0.01 −0.060 ± 0.034 0.059 ± 0.010 0.31 ± 0.01 −0.066 ± 0.037 0.065 ± 0.0111 1.00 23.2 −20.2 E 14 1.03 ± 0.01 −0.049 ± 0.047 0.049 ± 0.013 0.34 ± 0.01 −0.054 ± 0.052 0.054 ± 0.0142 1.00 23.2 −20.2 E+S0 12 0.98 ± 0.02 −0.110 ± 0.055 0.048 ± 0.012 0.31 ± 0.02 −0.121 ± 0.060 0.053 ± 0.0132 1.00 23.2 −20.2 E 7 1.00 ± 0.02 −0.096 ± 0.045 0.043 ± 0.016 0.33 ± 0.02 −0.105 ± 0.049 0.047 ± 0.018
SRMS1 0.90 24.0 −19.4 E+S0 30 1.01 ± 0.01 −0.030 ± 0.017 0.055 ± 0.008 0.31 ± 0.01 −0.033 ± 0.019 0.060 ± 0.0091 0.90 24.0 −19.4 E 20 1.03 ± 0.01 −0.032 ± 0.014 0.044 ± 0.010 0.33 ± 0.01 −0.035 ± 0.015 0.048 ± 0.0112 0.90 24.0 −19.4 E+S0 20 0.99 ± 0.02 −0.025 ± 0.022 0.052 ± 0.010 0.28 ± 0.02 −0.027 ± 0.024 0.057 ± 0.0112 0.90 24.0 −19.4 E 11 1.02 ± 0.02 −0.042 ± 0.028 0.044 ± 0.014 0.32 ± 0.02 −0.046 ± 0.031 0.048 ± 0.0151 0.45 24.0 −19.4 E+S0 28 1.01 ± 0.01 −0.024 ± 0.018 0.054 ± 0.009 0.30 ± 0.01 −0.026 ± 0.020 0.059 ± 0.0101 0.45 24.0 −19.4 E 19 1.03 ± 0.01 −0.034 ± 0.014 0.042 ± 0.011 0.33 ± 0.01 −0.037 ± 0.015 0.046 ± 0.0122 0.45 24.0 −19.4 E+S0 20 0.99 ± 0.02 −0.025 ± 0.022 0.052 ± 0.010 0.28 ± 0.02 −0.027 ± 0.024 0.057 ± 0.0112 0.45 24.0 −19.4 E 11 1.02 ± 0.02 −0.043 ± 0.027 0.044 ± 0.014 0.32 ± 0.02 −0.047 ± 0.030 0.048 ± 0.0151 1.00 24.0 −19.4 E+S0 31 1.01 ± 0.01 −0.032 ± 0.016 0.054 ± 0.008 0.31 ± 0.01 −0.035 ± 0.018 0.059 ± 0.0091 1.00 24.0 −19.4 E 20 1.03 ± 0.01 −0.032 ± 0.015 0.044 ± 0.010 0.33 ± 0.01 −0.035 ± 0.016 0.048 ± 0.0112 1.00 24.0 −19.4 E+S0 20 0.99 ± 0.02 −0.025 ± 0.022 0.052 ± 0.010 0.28 ± 0.02 −0.027 ± 0.024 0.057 ± 0.0112 1.00 24.0 −19.4 E 11 1.02 ± 0.02 −0.043 ± 0.028 0.044 ± 0.014 0.32 ± 0.02 −0.047 ± 0.031 0.048 ± 0.015
Note. Footnotes a, b, c, d, and e as in Table 3.
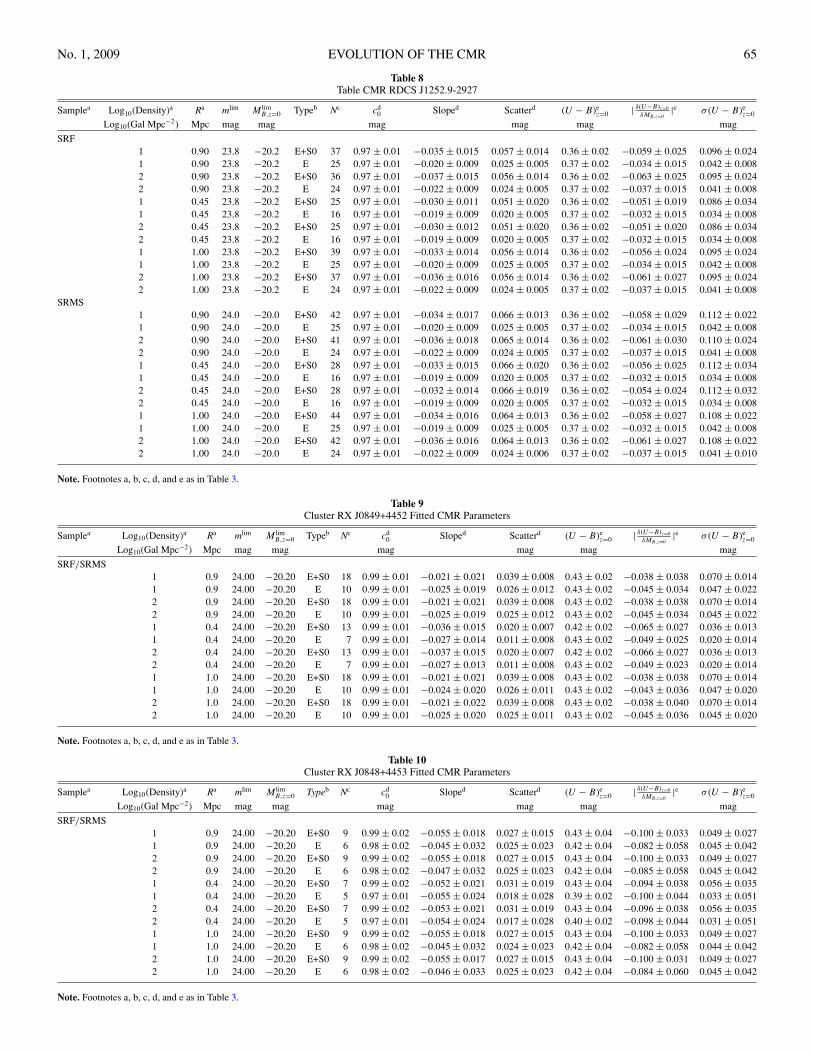
No. 1, 2009 EVOLUTION OF THE CMR 65
Table 8Table CMR RDCS J1252.9-2927
Samplea Log10(Density)a Ra mlim M limB,z=0 Typeb Nc cd
0 Sloped Scatterd (U − B)ez=0 | δ(U−B)z=0
δMB,z=0|e σ (U − B)e
z=0
Log10(Gal Mpc−2) Mpc mag mag mag mag mag mag
SRF1 0.90 23.8 −20.2 E+S0 37 0.97 ± 0.01 −0.035 ± 0.015 0.057 ± 0.014 0.36 ± 0.02 −0.059 ± 0.025 0.096 ± 0.0241 0.90 23.8 −20.2 E 25 0.97 ± 0.01 −0.020 ± 0.009 0.025 ± 0.005 0.37 ± 0.02 −0.034 ± 0.015 0.042 ± 0.0082 0.90 23.8 −20.2 E+S0 36 0.97 ± 0.01 −0.037 ± 0.015 0.056 ± 0.014 0.36 ± 0.02 −0.063 ± 0.025 0.095 ± 0.0242 0.90 23.8 −20.2 E 24 0.97 ± 0.01 −0.022 ± 0.009 0.024 ± 0.005 0.37 ± 0.02 −0.037 ± 0.015 0.041 ± 0.0081 0.45 23.8 −20.2 E+S0 25 0.97 ± 0.01 −0.030 ± 0.011 0.051 ± 0.020 0.36 ± 0.02 −0.051 ± 0.019 0.086 ± 0.0341 0.45 23.8 −20.2 E 16 0.97 ± 0.01 −0.019 ± 0.009 0.020 ± 0.005 0.37 ± 0.02 −0.032 ± 0.015 0.034 ± 0.0082 0.45 23.8 −20.2 E+S0 25 0.97 ± 0.01 −0.030 ± 0.012 0.051 ± 0.020 0.36 ± 0.02 −0.051 ± 0.020 0.086 ± 0.0342 0.45 23.8 −20.2 E 16 0.97 ± 0.01 −0.019 ± 0.009 0.020 ± 0.005 0.37 ± 0.02 −0.032 ± 0.015 0.034 ± 0.0081 1.00 23.8 −20.2 E+S0 39 0.97 ± 0.01 −0.033 ± 0.014 0.056 ± 0.014 0.36 ± 0.02 −0.056 ± 0.024 0.095 ± 0.0241 1.00 23.8 −20.2 E 25 0.97 ± 0.01 −0.020 ± 0.009 0.025 ± 0.005 0.37 ± 0.02 −0.034 ± 0.015 0.042 ± 0.0082 1.00 23.8 −20.2 E+S0 37 0.97 ± 0.01 −0.036 ± 0.016 0.056 ± 0.014 0.36 ± 0.02 −0.061 ± 0.027 0.095 ± 0.0242 1.00 23.8 −20.2 E 24 0.97 ± 0.01 −0.022 ± 0.009 0.024 ± 0.005 0.37 ± 0.02 −0.037 ± 0.015 0.041 ± 0.008
SRMS1 0.90 24.0 −20.0 E+S0 42 0.97 ± 0.01 −0.034 ± 0.017 0.066 ± 0.013 0.36 ± 0.02 −0.058 ± 0.029 0.112 ± 0.0221 0.90 24.0 −20.0 E 25 0.97 ± 0.01 −0.020 ± 0.009 0.025 ± 0.005 0.37 ± 0.02 −0.034 ± 0.015 0.042 ± 0.0082 0.90 24.0 −20.0 E+S0 41 0.97 ± 0.01 −0.036 ± 0.018 0.065 ± 0.014 0.36 ± 0.02 −0.061 ± 0.030 0.110 ± 0.0242 0.90 24.0 −20.0 E 24 0.97 ± 0.01 −0.022 ± 0.009 0.024 ± 0.005 0.37 ± 0.02 −0.037 ± 0.015 0.041 ± 0.0081 0.45 24.0 −20.0 E+S0 28 0.97 ± 0.01 −0.033 ± 0.015 0.066 ± 0.020 0.36 ± 0.02 −0.056 ± 0.025 0.112 ± 0.0341 0.45 24.0 −20.0 E 16 0.97 ± 0.01 −0.019 ± 0.009 0.020 ± 0.005 0.37 ± 0.02 −0.032 ± 0.015 0.034 ± 0.0082 0.45 24.0 −20.0 E+S0 28 0.97 ± 0.01 −0.032 ± 0.014 0.066 ± 0.019 0.36 ± 0.02 −0.054 ± 0.024 0.112 ± 0.0322 0.45 24.0 −20.0 E 16 0.97 ± 0.01 −0.019 ± 0.009 0.020 ± 0.005 0.37 ± 0.02 −0.032 ± 0.015 0.034 ± 0.0081 1.00 24.0 −20.0 E+S0 44 0.97 ± 0.01 −0.034 ± 0.016 0.064 ± 0.013 0.36 ± 0.02 −0.058 ± 0.027 0.108 ± 0.0221 1.00 24.0 −20.0 E 25 0.97 ± 0.01 −0.019 ± 0.009 0.025 ± 0.005 0.37 ± 0.02 −0.032 ± 0.015 0.042 ± 0.0082 1.00 24.0 −20.0 E+S0 42 0.97 ± 0.01 −0.036 ± 0.016 0.064 ± 0.013 0.36 ± 0.02 −0.061 ± 0.027 0.108 ± 0.0222 1.00 24.0 −20.0 E 24 0.97 ± 0.01 −0.022 ± 0.009 0.024 ± 0.006 0.37 ± 0.02 −0.037 ± 0.015 0.041 ± 0.010
Note. Footnotes a, b, c, d, and e as in Table 3.
Table 9Cluster RX J0849+4452 Fitted CMR Parameters
Samplea Log10(Density)a Ra mlim M limB,z=0 Typeb Nc cd
0 Sloped Scatterd (U − B)ez=0 | δ(U−B)z=0
δMB,z=0|e σ (U − B)e
z=0
Log10(Gal Mpc−2) Mpc mag mag mag mag mag mag
SRF/SRMS1 0.9 24.00 −20.20 E+S0 18 0.99 ± 0.01 −0.021 ± 0.021 0.039 ± 0.008 0.43 ± 0.02 −0.038 ± 0.038 0.070 ± 0.0141 0.9 24.00 −20.20 E 10 0.99 ± 0.01 −0.025 ± 0.019 0.026 ± 0.012 0.43 ± 0.02 −0.045 ± 0.034 0.047 ± 0.0222 0.9 24.00 −20.20 E+S0 18 0.99 ± 0.01 −0.021 ± 0.021 0.039 ± 0.008 0.43 ± 0.02 −0.038 ± 0.038 0.070 ± 0.0142 0.9 24.00 −20.20 E 10 0.99 ± 0.01 −0.025 ± 0.019 0.025 ± 0.012 0.43 ± 0.02 −0.045 ± 0.034 0.045 ± 0.0221 0.4 24.00 −20.20 E+S0 13 0.99 ± 0.01 −0.036 ± 0.015 0.020 ± 0.007 0.42 ± 0.02 −0.065 ± 0.027 0.036 ± 0.0131 0.4 24.00 −20.20 E 7 0.99 ± 0.01 −0.027 ± 0.014 0.011 ± 0.008 0.43 ± 0.02 −0.049 ± 0.025 0.020 ± 0.0142 0.4 24.00 −20.20 E+S0 13 0.99 ± 0.01 −0.037 ± 0.015 0.020 ± 0.007 0.42 ± 0.02 −0.066 ± 0.027 0.036 ± 0.0132 0.4 24.00 −20.20 E 7 0.99 ± 0.01 −0.027 ± 0.013 0.011 ± 0.008 0.43 ± 0.02 −0.049 ± 0.023 0.020 ± 0.0141 1.0 24.00 −20.20 E+S0 18 0.99 ± 0.01 −0.021 ± 0.021 0.039 ± 0.008 0.43 ± 0.02 −0.038 ± 0.038 0.070 ± 0.0141 1.0 24.00 −20.20 E 10 0.99 ± 0.01 −0.024 ± 0.020 0.026 ± 0.011 0.43 ± 0.02 −0.043 ± 0.036 0.047 ± 0.0202 1.0 24.00 −20.20 E+S0 18 0.99 ± 0.01 −0.021 ± 0.022 0.039 ± 0.008 0.43 ± 0.02 −0.038 ± 0.040 0.070 ± 0.0142 1.0 24.00 −20.20 E 10 0.99 ± 0.01 −0.025 ± 0.020 0.025 ± 0.011 0.43 ± 0.02 −0.045 ± 0.036 0.045 ± 0.020
Note. Footnotes a, b, c, d, and e as in Table 3.
Table 10Cluster RX J0848+4453 Fitted CMR Parameters
Samplea Log10(Density)a Ra mlim M limB,z=0 Typeb Nc cd
0 Sloped Scatterd (U − B)ez=0 | δ(U−B)z=0
δMB,z=0|e σ (U − B)e
z=0
Log10(Gal Mpc−2) Mpc mag mag mag mag mag mag
SRF/SRMS1 0.9 24.00 −20.20 E+S0 9 0.99 ± 0.02 −0.055 ± 0.018 0.027 ± 0.015 0.43 ± 0.04 −0.100 ± 0.033 0.049 ± 0.0271 0.9 24.00 −20.20 E 6 0.98 ± 0.02 −0.045 ± 0.032 0.025 ± 0.023 0.42 ± 0.04 −0.082 ± 0.058 0.045 ± 0.0422 0.9 24.00 −20.20 E+S0 9 0.99 ± 0.02 −0.055 ± 0.018 0.027 ± 0.015 0.43 ± 0.04 −0.100 ± 0.033 0.049 ± 0.0272 0.9 24.00 −20.20 E 6 0.98 ± 0.02 −0.047 ± 0.032 0.025 ± 0.023 0.42 ± 0.04 −0.085 ± 0.058 0.045 ± 0.0421 0.4 24.00 −20.20 E+S0 7 0.99 ± 0.02 −0.052 ± 0.021 0.031 ± 0.019 0.43 ± 0.04 −0.094 ± 0.038 0.056 ± 0.0351 0.4 24.00 −20.20 E 5 0.97 ± 0.01 −0.055 ± 0.024 0.018 ± 0.028 0.39 ± 0.02 −0.100 ± 0.044 0.033 ± 0.0512 0.4 24.00 −20.20 E+S0 7 0.99 ± 0.02 −0.053 ± 0.021 0.031 ± 0.019 0.43 ± 0.04 −0.096 ± 0.038 0.056 ± 0.0352 0.4 24.00 −20.20 E 5 0.97 ± 0.01 −0.054 ± 0.024 0.017 ± 0.028 0.40 ± 0.02 −0.098 ± 0.044 0.031 ± 0.0511 1.0 24.00 −20.20 E+S0 9 0.99 ± 0.02 −0.055 ± 0.018 0.027 ± 0.015 0.43 ± 0.04 −0.100 ± 0.033 0.049 ± 0.0271 1.0 24.00 −20.20 E 6 0.98 ± 0.02 −0.045 ± 0.032 0.024 ± 0.023 0.42 ± 0.04 −0.082 ± 0.058 0.044 ± 0.0422 1.0 24.00 −20.20 E+S0 9 0.99 ± 0.02 −0.055 ± 0.017 0.027 ± 0.015 0.43 ± 0.04 −0.100 ± 0.031 0.049 ± 0.0272 1.0 24.00 −20.20 E 6 0.98 ± 0.02 −0.046 ± 0.033 0.025 ± 0.023 0.42 ± 0.04 −0.084 ± 0.060 0.045 ± 0.042
Note. Footnotes a, b, c, d, and e as in Table 3.
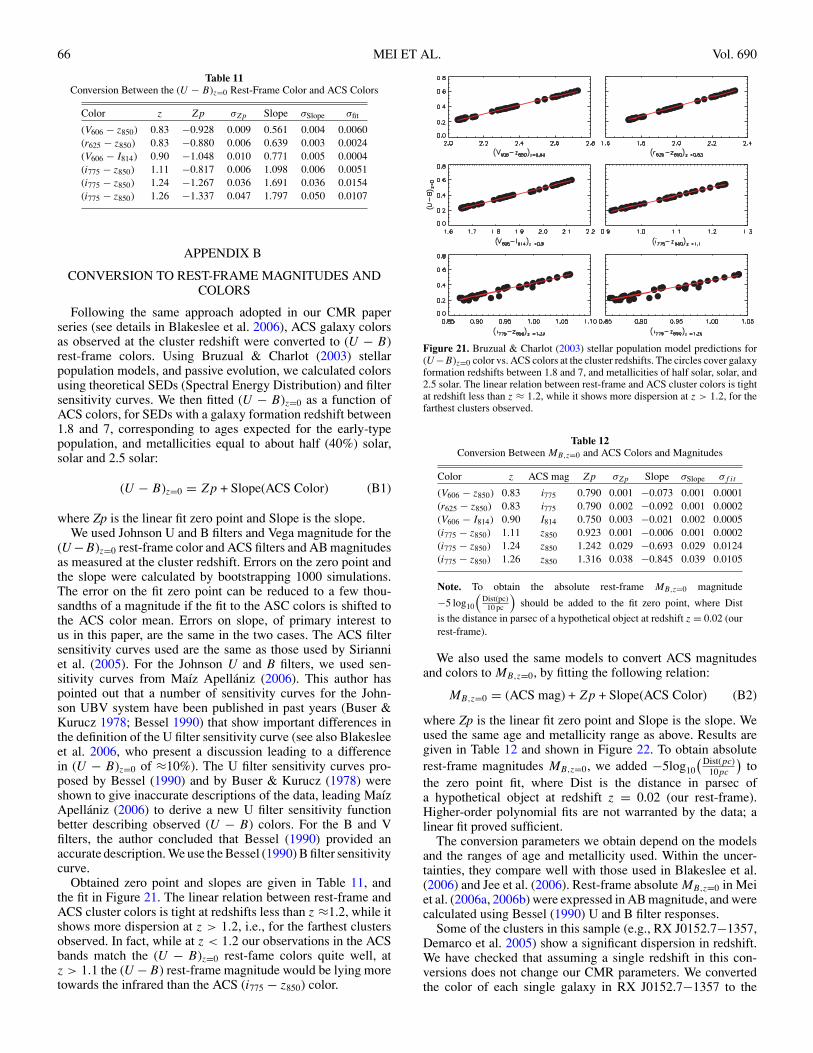
66 MEI ET AL. Vol. 690
Table 11Conversion Between the (U − B)z=0 Rest-Frame Color and ACS Colors
Color z Zp σZp Slope σSlope σfit
(V606 − z850) 0.83 −0.928 0.009 0.561 0.004 0.0060(r625 − z850) 0.83 −0.880 0.006 0.639 0.003 0.0024(V606 − I814) 0.90 −1.048 0.010 0.771 0.005 0.0004(i775 − z850) 1.11 −0.817 0.006 1.098 0.006 0.0051(i775 − z850) 1.24 −1.267 0.036 1.691 0.036 0.0154(i775 − z850) 1.26 −1.337 0.047 1.797 0.050 0.0107
APPENDIX B
CONVERSION TO REST-FRAME MAGNITUDES ANDCOLORS
Following the same approach adopted in our CMR paperseries (see details in Blakeslee et al. 2006), ACS galaxy colorsas observed at the cluster redshift were converted to (U − B)rest-frame colors. Using Bruzual & Charlot (2003) stellarpopulation models, and passive evolution, we calculated colorsusing theoretical SEDs (Spectral Energy Distribution) and filtersensitivity curves. We then fitted (U − B)z=0 as a function ofACS colors, for SEDs with a galaxy formation redshift between1.8 and 7, corresponding to ages expected for the early-typepopulation, and metallicities equal to about half (40%) solar,solar and 2.5 solar:
(U − B)z=0 = Zp + Slope(ACS Color) (B1)
where Zp is the linear fit zero point and Slope is the slope.We used Johnson U and B filters and Vega magnitude for the
(U −B)z=0 rest-frame color and ACS filters and AB magnitudesas measured at the cluster redshift. Errors on the zero point andthe slope were calculated by bootstrapping 1000 simulations.The error on the fit zero point can be reduced to a few thou-sandths of a magnitude if the fit to the ASC colors is shifted tothe ACS color mean. Errors on slope, of primary interest tous in this paper, are the same in the two cases. The ACS filtersensitivity curves used are the same as those used by Sirianniet al. (2005). For the Johnson U and B filters, we used sen-sitivity curves from Maız Apellaniz (2006). This author haspointed out that a number of sensitivity curves for the John-son UBV system have been published in past years (Buser &Kurucz 1978; Bessel 1990) that show important differences inthe definition of the U filter sensitivity curve (see also Blakesleeet al. 2006, who present a discussion leading to a differencein (U − B)z=0 of ≈10%). The U filter sensitivity curves pro-posed by Bessel (1990) and by Buser & Kurucz (1978) wereshown to give inaccurate descriptions of the data, leading MaızApellaniz (2006) to derive a new U filter sensitivity functionbetter describing observed (U − B) colors. For the B and Vfilters, the author concluded that Bessel (1990) provided anaccurate description. We use the Bessel (1990) B filter sensitivitycurve.
Obtained zero point and slopes are given in Table 11, andthe fit in Figure 21. The linear relation between rest-frame andACS cluster colors is tight at redshifts less than z ≈1.2, while itshows more dispersion at z > 1.2, i.e., for the farthest clustersobserved. In fact, while at z < 1.2 our observations in the ACSbands match the (U − B)z=0 rest-fame colors quite well, atz > 1.1 the (U −B) rest-frame magnitude would be lying moretowards the infrared than the ACS (i775 − z850) color.
Figure 21. Bruzual & Charlot (2003) stellar population model predictions for(U −B)z=0 color vs. ACS colors at the cluster redshifts. The circles cover galaxyformation redshifts between 1.8 and 7, and metallicities of half solar, solar, and2.5 solar. The linear relation between rest-frame and ACS cluster colors is tightat redshift less than z ≈ 1.2, while it shows more dispersion at z > 1.2, for thefarthest clusters observed.
Table 12Conversion Between MB,z=0 and ACS Colors and Magnitudes
Color z ACS mag Zp σZp Slope σSlope σf it
(V606 − z850) 0.83 i775 0.790 0.001 −0.073 0.001 0.0001(r625 − z850) 0.83 i775 0.790 0.002 −0.092 0.001 0.0002(V606 − I814) 0.90 I814 0.750 0.003 −0.021 0.002 0.0005(i775 − z850) 1.11 z850 0.923 0.001 −0.006 0.001 0.0002(i775 − z850) 1.24 z850 1.242 0.029 −0.693 0.029 0.0124(i775 − z850) 1.26 z850 1.316 0.038 −0.845 0.039 0.0105
Note. To obtain the absolute rest-frame MB,z=0 magnitude
−5 log10
(Dist(pc)
10 pc
)should be added to the fit zero point, where Dist
is the distance in parsec of a hypothetical object at redshift z = 0.02 (ourrest-frame).
We also used the same models to convert ACS magnitudesand colors to MB,z=0, by fitting the following relation:
MB,z=0 = (ACS mag) + Zp + Slope(ACS Color) (B2)
where Zp is the linear fit zero point and Slope is the slope. Weused the same age and metallicity range as above. Results aregiven in Table 12 and shown in Figure 22. To obtain absoluterest-frame magnitudes MB,z=0, we added −5log10
(Dist(pc)10pc
)to
the zero point fit, where Dist is the distance in parsec ofa hypothetical object at redshift z = 0.02 (our rest-frame).Higher-order polynomial fits are not warranted by the data; alinear fit proved sufficient.
The conversion parameters we obtain depend on the modelsand the ranges of age and metallicity used. Within the uncer-tainties, they compare well with those used in Blakeslee et al.(2006) and Jee et al. (2006). Rest-frame absolute MB,z=0 in Meiet al. (2006a, 2006b) were expressed in AB magnitude, and werecalculated using Bessel (1990) U and B filter responses.
Some of the clusters in this sample (e.g., RX J0152.7−1357,Demarco et al. 2005) show a significant dispersion in redshift.We have checked that assuming a single redshift in this con-versions does not change our CMR parameters. We convertedthe color of each single galaxy in RX J0152.7−1357 to the
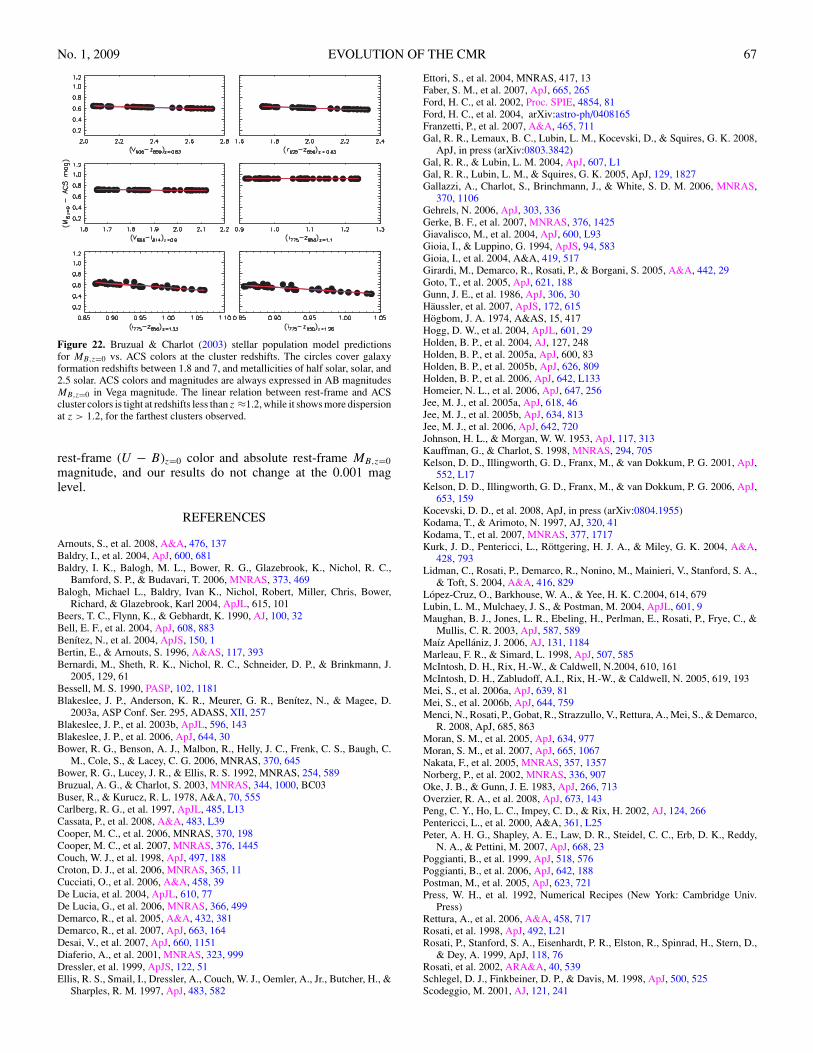
No. 1, 2009 EVOLUTION OF THE CMR 67
Figure 22. Bruzual & Charlot (2003) stellar population model predictionsfor MB,z=0 vs. ACS colors at the cluster redshifts. The circles cover galaxyformation redshifts between 1.8 and 7, and metallicities of half solar, solar, and2.5 solar. ACS colors and magnitudes are always expressed in AB magnitudesMB,z=0 in Vega magnitude. The linear relation between rest-frame and ACScluster colors is tight at redshifts less than z ≈1.2, while it shows more dispersionat z > 1.2, for the farthest clusters observed.
rest-frame (U − B)z=0 color and absolute rest-frame MB,z=0magnitude, and our results do not change at the 0.001 maglevel.
REFERENCES
Arnouts, S., et al. 2008, A&A, 476, 137Baldry, I., et al. 2004, ApJ, 600, 681Baldry, I. K., Balogh, M. L., Bower, R. G., Glazebrook, K., Nichol, R. C.,
Bamford, S. P., & Budavari, T. 2006, MNRAS, 373, 469Balogh, Michael L., Baldry, Ivan K., Nichol, Robert, Miller, Chris, Bower,
Richard, & Glazebrook, Karl 2004, ApJL, 615, 101Beers, T. C., Flynn, K., & Gebhardt, K. 1990, AJ, 100, 32Bell, E. F., et al. 2004, ApJ, 608, 883Benıtez, N., et al. 2004, ApJS, 150, 1Bertin, E., & Arnouts, S. 1996, A&AS, 117, 393Bernardi, M., Sheth, R. K., Nichol, R. C., Schneider, D. P., & Brinkmann, J.
2005, 129, 61Bessell, M. S. 1990, PASP, 102, 1181Blakeslee, J. P., Anderson, K. R., Meurer, G. R., Benıtez, N., & Magee, D.
2003a, ASP Conf. Ser. 295, ADASS, XII, 257Blakeslee, J. P., et al. 2003b, ApJL, 596, 143Blakeslee, J. P., et al. 2006, ApJ, 644, 30Bower, R. G., Benson, A. J., Malbon, R., Helly, J. C., Frenk, C. S., Baugh, C.
M., Cole, S., & Lacey, C. G. 2006, MNRAS, 370, 645Bower, R. G., Lucey, J. R., & Ellis, R. S. 1992, MNRAS, 254, 589Bruzual, A. G., & Charlot, S. 2003, MNRAS, 344, 1000, BC03Buser, R., & Kurucz, R. L. 1978, A&A, 70, 555Carlberg, R. G., et al. 1997, ApJL, 485, L13Cassata, P., et al. 2008, A&A, 483, L39Cooper, M. C., et al. 2006, MNRAS, 370, 198Cooper, M. C., et al. 2007, MNRAS, 376, 1445Couch, W. J., et al. 1998, ApJ, 497, 188Croton, D. J., et al. 2006, MNRAS, 365, 11Cucciati, O., et al. 2006, A&A, 458, 39De Lucia, et al. 2004, ApJL, 610, 77De Lucia, G., et al. 2006, MNRAS, 366, 499Demarco, R., et al. 2005, A&A, 432, 381Demarco, R., et al. 2007, ApJ, 663, 164Desai, V., et al. 2007, ApJ, 660, 1151Diaferio, A., et al. 2001, MNRAS, 323, 999Dressler, et al. 1999, ApJS, 122, 51Ellis, R. S., Smail, I., Dressler, A., Couch, W. J., Oemler, A., Jr., Butcher, H., &
Sharples, R. M. 1997, ApJ, 483, 582
Ettori, S., et al. 2004, MNRAS, 417, 13Faber, S. M., et al. 2007, ApJ, 665, 265Ford, H. C., et al. 2002, Proc. SPIE, 4854, 81Ford, H. C., et al. 2004, arXiv:astro-ph/0408165Franzetti, P., et al. 2007, A&A, 465, 711Gal, R. R., Lemaux, B. C., Lubin, L. M., Kocevski, D., & Squires, G. K. 2008,
ApJ, in press (arXiv:0803.3842)Gal, R. R., & Lubin, L. M. 2004, ApJ, 607, L1Gal, R. R., Lubin, L. M., & Squires, G. K. 2005, ApJ, 129, 1827Gallazzi, A., Charlot, S., Brinchmann, J., & White, S. D. M. 2006, MNRAS,
370, 1106Gehrels, N. 2006, ApJ, 303, 336Gerke, B. F., et al. 2007, MNRAS, 376, 1425Giavalisco, M., et al. 2004, ApJ, 600, L93Gioia, I., & Luppino, G. 1994, ApJS, 94, 583Gioia, I., et al. 2004, A&A, 419, 517Girardi, M., Demarco, R., Rosati, P., & Borgani, S. 2005, A&A, 442, 29Goto, T., et al. 2005, ApJ, 621, 188Gunn, J. E., et al. 1986, ApJ, 306, 30Haussler, et al. 2007, ApJS, 172, 615Hogbom, J. A. 1974, A&AS, 15, 417Hogg, D. W., et al. 2004, ApJL, 601, 29Holden, B. P., et al. 2004, AJ, 127, 248Holden, B. P., et al. 2005a, ApJ, 600, 83Holden, B. P., et al. 2005b, ApJ, 626, 809Holden, B. P., et al. 2006, ApJ, 642, L133Homeier, N. L., et al. 2006, ApJ, 647, 256Jee, M. J., et al. 2005a, ApJ, 618, 46Jee, M. J., et al. 2005b, ApJ, 634, 813Jee, M. J., et al. 2006, ApJ, 642, 720Johnson, H. L., & Morgan, W. W. 1953, ApJ, 117, 313Kauffman, G., & Charlot, S. 1998, MNRAS, 294, 705Kelson, D. D., Illingworth, G. D., Franx, M., & van Dokkum, P. G. 2001, ApJ,
552, L17Kelson, D. D., Illingworth, G. D., Franx, M., & van Dokkum, P. G. 2006, ApJ,
653, 159Kocevski, D. D., et al. 2008, ApJ, in press (arXiv:0804.1955)Kodama, T., & Arimoto, N. 1997, AJ, 320, 41Kodama, T., et al. 2007, MNRAS, 377, 1717Kurk, J. D., Pentericci, L., Rottgering, H. J. A., & Miley, G. K. 2004, A&A,
428, 793Lidman, C., Rosati, P., Demarco, R., Nonino, M., Mainieri, V., Stanford, S. A.,
& Toft, S. 2004, A&A, 416, 829Lopez-Cruz, O., Barkhouse, W. A., & Yee, H. K. C.2004, 614, 679Lubin, L. M., Mulchaey, J. S., & Postman, M. 2004, ApJL, 601, 9Maughan, B. J., Jones, L. R., Ebeling, H., Perlman, E., Rosati, P., Frye, C., &
Mullis, C. R. 2003, ApJ, 587, 589Maız Apellaniz, J. 2006, AJ, 131, 1184Marleau, F. R., & Simard, L. 1998, ApJ, 507, 585McIntosh, D. H., Rix, H.-W., & Caldwell, N.2004, 610, 161McIntosh, D. H., Zabludoff, A.I., Rix, H.-W., & Caldwell, N. 2005, 619, 193Mei, S., et al. 2006a, ApJ, 639, 81Mei, S., et al. 2006b, ApJ, 644, 759Menci, N., Rosati, P., Gobat, R., Strazzullo, V., Rettura, A., Mei, S., & Demarco,
R. 2008, ApJ, 685, 863Moran, S. M., et al. 2005, ApJ, 634, 977Moran, S. M., et al. 2007, ApJ, 665, 1067Nakata, F., et al. 2005, MNRAS, 357, 1357Norberg, P., et al. 2002, MNRAS, 336, 907Oke, J. B., & Gunn, J. E. 1983, ApJ, 266, 713Overzier, R. A., et al. 2008, ApJ, 673, 143Peng, C. Y., Ho, L. C., Impey, C. D., & Rix, H. 2002, AJ, 124, 266Pentericci, L., et al. 2000, A&A, 361, L25Peter, A. H. G., Shapley, A. E., Law, D. R., Steidel, C. C., Erb, D. K., Reddy,
N. A., & Pettini, M. 2007, ApJ, 668, 23Poggianti, B., et al. 1999, ApJ, 518, 576Poggianti, B., et al. 2006, ApJ, 642, 188Postman, M., et al. 2005, ApJ, 623, 721Press, W. H., et al. 1992, Numerical Recipes (New York: Cambridge Univ.
Press)Rettura, A., et al. 2006, A&A, 458, 717Rosati, et al. 1998, ApJ, 492, L21Rosati, P., Stanford, S. A., Eisenhardt, P. R., Elston, R., Spinrad, H., Stern, D.,
& Dey, A. 1999, ApJ, 118, 76Rosati, et al. 2002, ARA&A, 40, 539Schlegel, D. J., Finkbeiner, D. P., & Davis, M. 1998, ApJ, 500, 525Scodeggio, M. 2001, AJ, 121, 241
68 MEI ET AL. Vol. 690
Sirianni, M., et al. 2005, PASP, 117, 1049Smith, G. P., et al. 2005, ApJ, 620, 78Spergel, D. N., et al. 2007, ApJS, 170, 377Springel, V., et al. 2005, Nature, 435, 629Stanford, S. A., Eisenhardt, P. R., & Dickinson, M. 1998, ApJ, 492, 461Stanford, S. A., Elston, R., Eisenhardt, P. R., Spinrad, H., Stern, D., & Dey, A.
1997, AJ, 114, 2232Stanford, S. A., Holden, B., Rosati, P., Tozzi, P., Borgani, S., Eisenhardt, P. R.,
& Spinrad, H. 2001,, 552, 502Stanford, S. A., et al. 2006, ApJ, 646, L13Steidel, C. C., Adelberger, K. L., Dickinson, M., Giavalisco, M., Pettini, M., &
Kellogg, M. 1998, ApJ, 492, 428Steidel, C. C., Adelberger, K. L., Shapley, A. E., Erb, D. K., Reddy, N. A., &
Pettini, M. 2005, ApJ, 626, 44Tanaka, M., Kodama, T., Arimoto, N., Okamura, S., Umetsu, K., Shimasaku,
K., Tanaka, I., & Yamada, T. 2005, MNRAS, 362, 268Tanaka, M., et al. 2007, MNRAS, 377, 1206
Tanaka, M., et al. 2008, A&A, in pressThomas, D., et al. 2005, ApJ, 621, 673Tran, K. H., et al. 2005, ApJ, 627, L25Tran, K. H., et al. 2007, ApJ, 661, 750van der Wel, A., et al. 2007, ApJ, 670, 206van Dokkum, P. 2005, AJ, 130, 2647van Dokkum, P. G., & Franx, M. 2001, ApJ, 553, 90van Dokkum, P. G., Franx, M., Kelson, D. D., Illingworth, G. D., Fisher, D., &
Fabricant, D. 1998, ApJ, 500, 714van Dokkum, P., et al. 2000, ApJ, 541, 95Venemans, B. P., et al. 2002, ApJ, 569, L11Venemans, B. P., et al. 2007, A&A, 461, 823Wake, et al. 2005, ApJ, 627, 186Willmer, C. N. A., et al. 2006, ApJ, 647, 853Wu, et al. 1999, ApJ, 524, 22York, D. G., et al. 2000, AJ, 120, 1579Zirm, A., et al. 2008, ApJ, 680, 224