evolution of nbh and convergence with maternal health presentation…massee bateman director, saving...
TRANSCRIPT
Massee BatemanMassee BatemanDirector, Saving Newborn Lives, Save the ChildrenFunded by the Bill & Melinda Gates Foundation
Global Maternal Health ConferenceGlobal Maternal Health ConferenceSeptember 2010
Evolution of NBH and convergence with maternal health
Outline
1.
The Situation
2.
Decade Evolution of Newborn Health
3.
Convergence with Maternal Health
The Situation
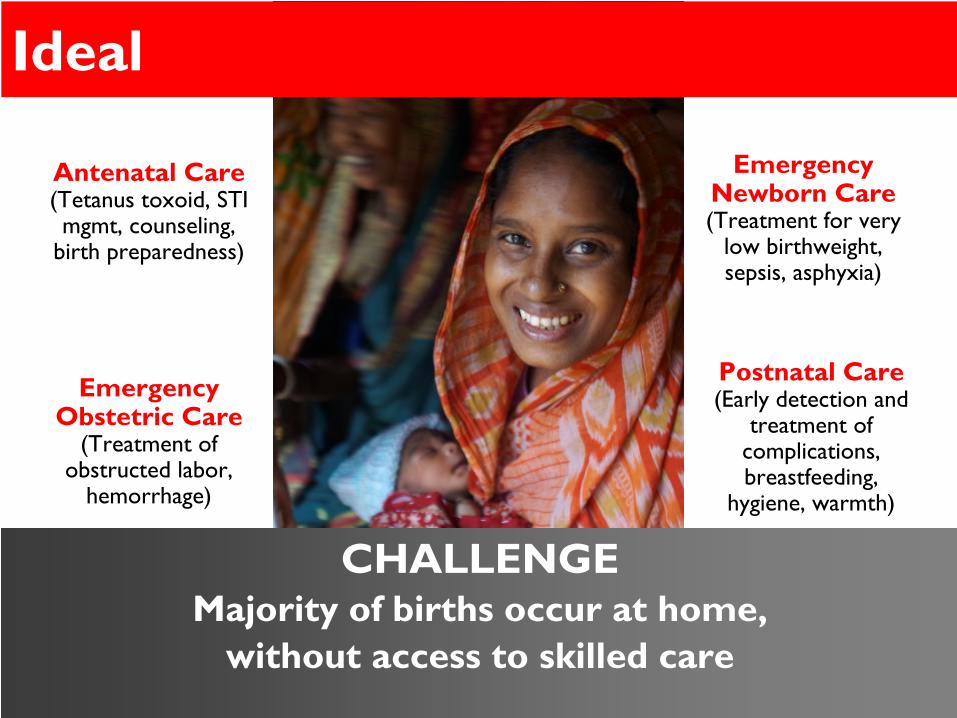
Ideal
CHALLENGEMajority of births occur at home,
without access to skilled care
Antenatal Care
(Tetanus toxoid, STI mgmt, counseling,
birth preparedness)
Emergency Obstetric Care
(Treatment of
obstructed labor, hemorrhage)
Emergency Newborn Care
(Treatment for very
low birthweight, sepsis, asphyxia)
Postnatal Care
(Early detection and
treatment of complications, breastfeeding,
hygiene, warmth)
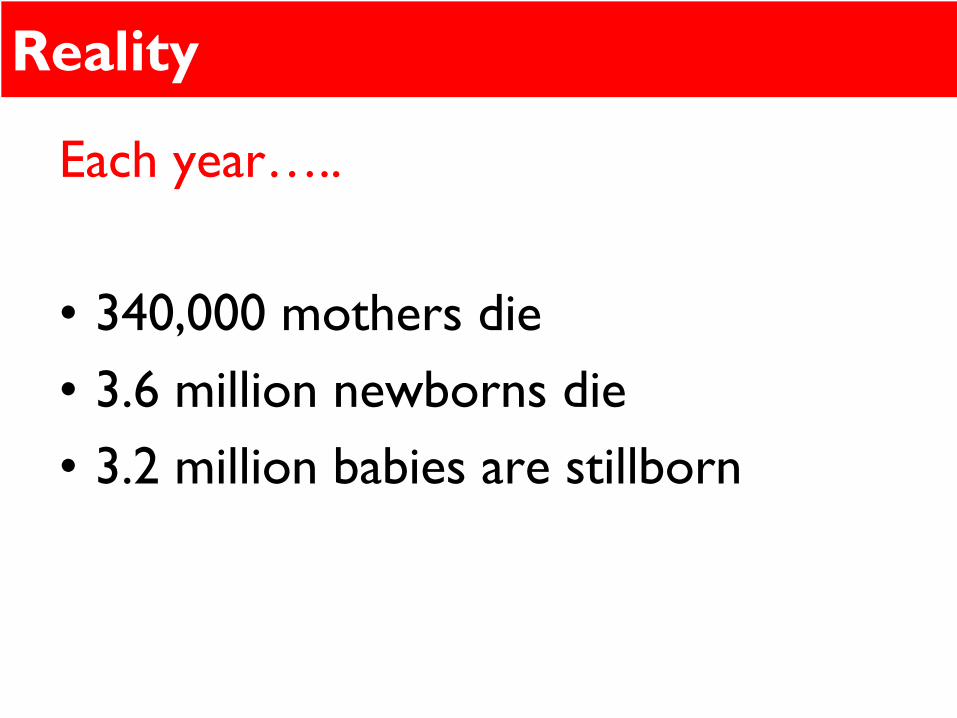
Reality
Each year…..
•
340,000 mothers die•
3.6 million newborns die
•
3.2 million babies are stillborn
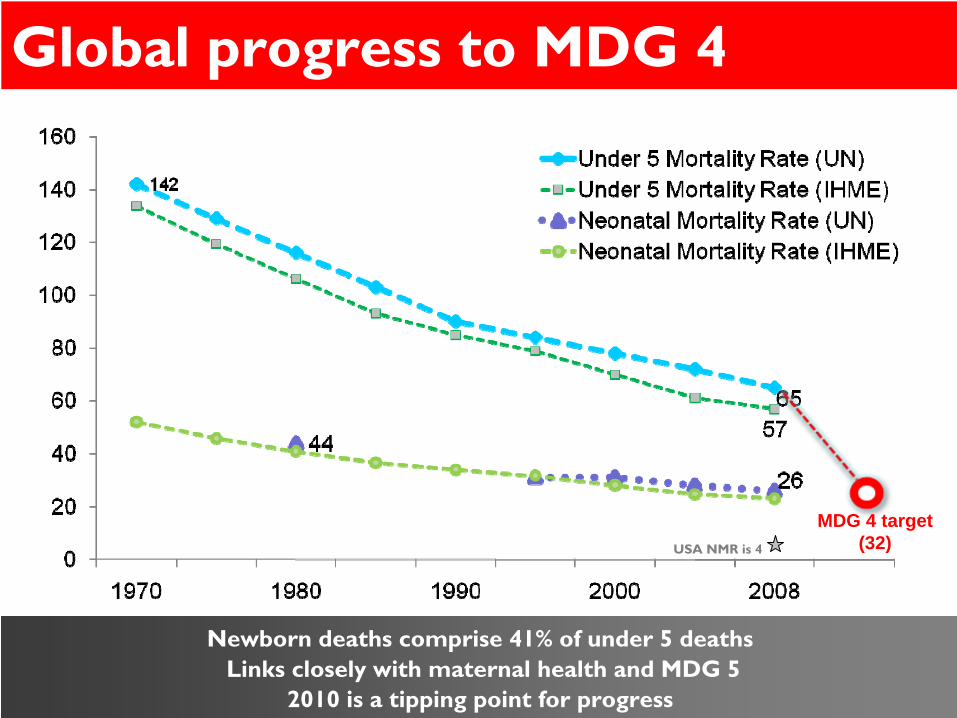
Global progress to MDG 4
MDG 4 target (32)
Ref: Lawn, Kerber et al BJOG 2009 updated with data for 2008 from UN Child Mortality Group, WHO//CHERG and IHME (Rajaratnam J eta l 2010)
Newborn deaths comprise 41% of under 5 deathsLinks closely with maternal health and MDG 5
2010 is a tipping point for progress
USA NMR is 4
Decade Evolution of Newborn Health
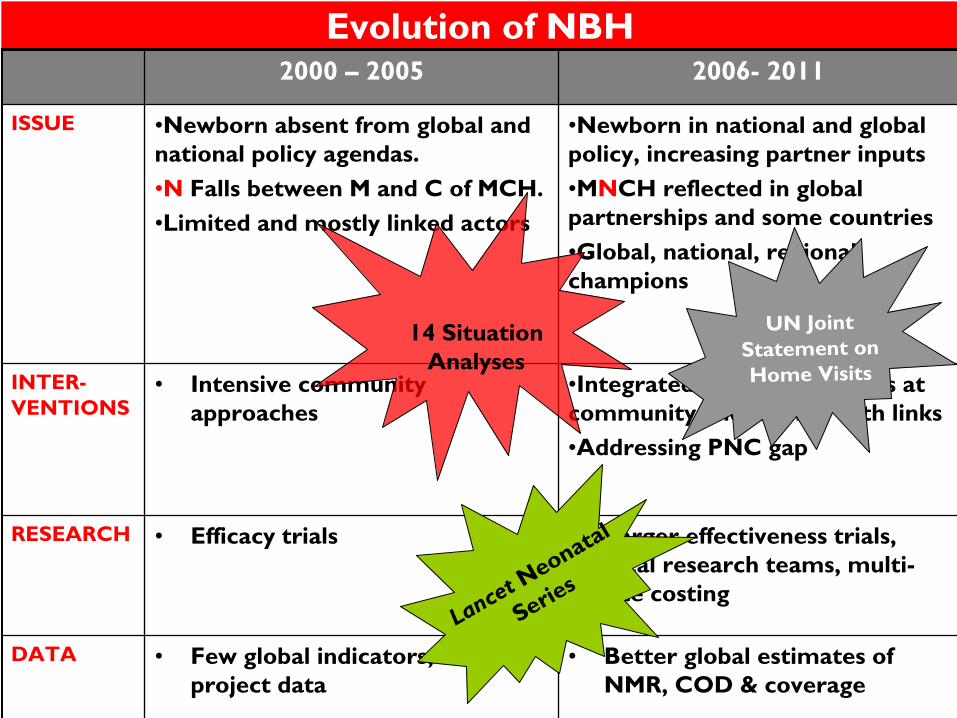
Evolution of NBH2000 –
2005 2006-
2011
ISSUE •Newborn absent from global and national policy agendas. •N
Falls between M and C of MCH.•Limited and mostly linked actors
•Newborn in national and global policy, increasing partner inputs•MNCH reflected in global partnerships and some countries•Global, national, regional champions
INTER-
VENTIONS
•
Intensive community approaches
•Integrated MNCH programs at community and facility, with links•Addressing PNC gap
RESEARCH •
Efficacy trials •
Larger effectiveness trials, local research teams, multi-
site costing
DATA •
Few global indicators, limited project data
•
Better global estimates of NMR, COD & coverage
Lancet Neonatal
Series
UN Joint Statement on Home Visits
14 Situation Analyses
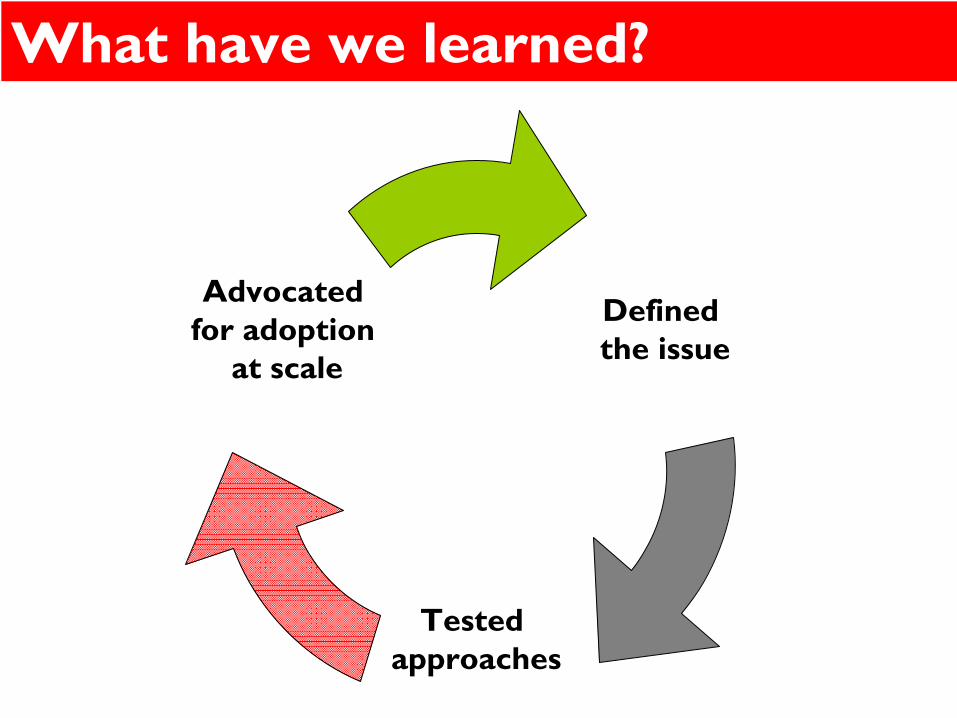
What have we learned?
Defined the issue
Tested approaches
Advocated for adoption
at scale
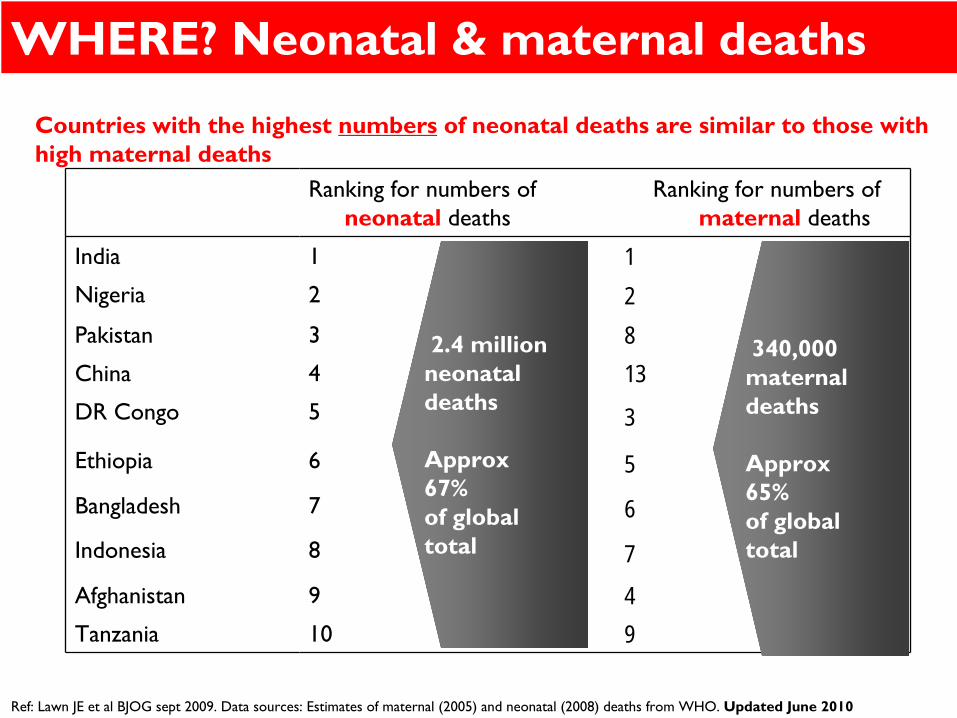
WHERE? Neonatal & maternal deaths
Ranking for numbers of neonatal
deathsRanking for numbers of
maternal deaths
India 1 1Nigeria 2 2Pakistan 3 8China 4 13DR Congo 5 3
Ethiopia 6 5Bangladesh 7 6Indonesia 8 7Afghanistan 9 4Tanzania 10 9
2.4 million neonatal deaths
Approx 67% of global total
340,000 maternal deaths
Approx 65% of global total
Ref: Lawn JE et al BJOG sept
2009. Data sources: Estimates of maternal (2005) and neonatal (2008) deaths from WHO. Updated June 2010
Countries with the highest numbers
of neonatal deaths are similar to those with high maternal deaths
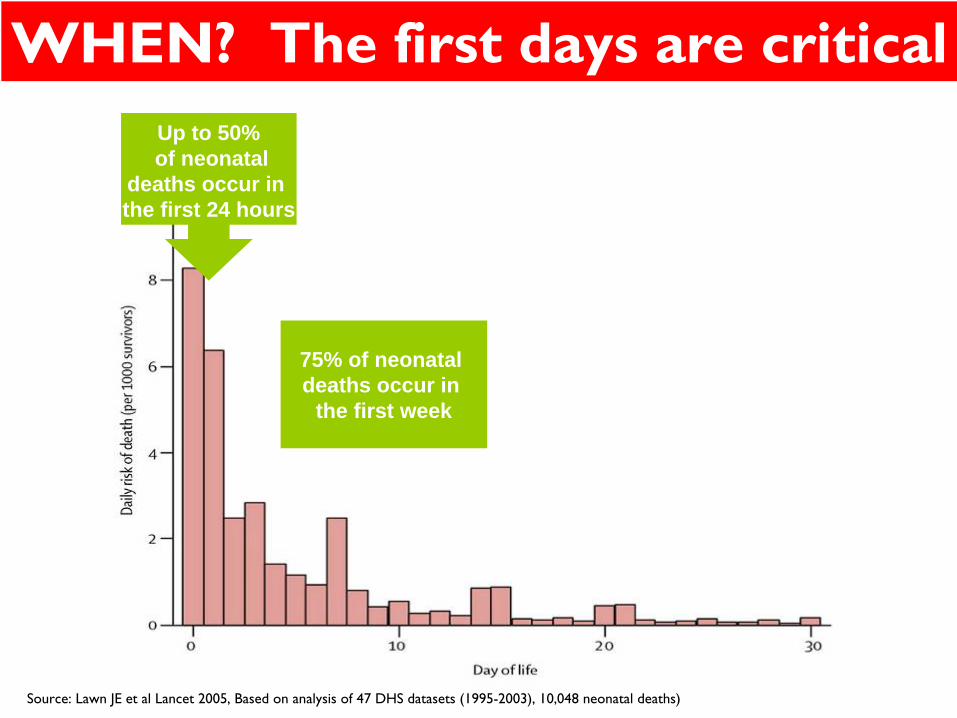
WHEN? The first days are criticalUp to 50%of neonatal
deaths occur in the first 24 hours
Source: Lawn JE et al Lancet 2005, Based on analysis of 47 DHS datasets (1995-2003), 10,048 neonatal deaths)
75% of neonatal deaths occur in
the first week
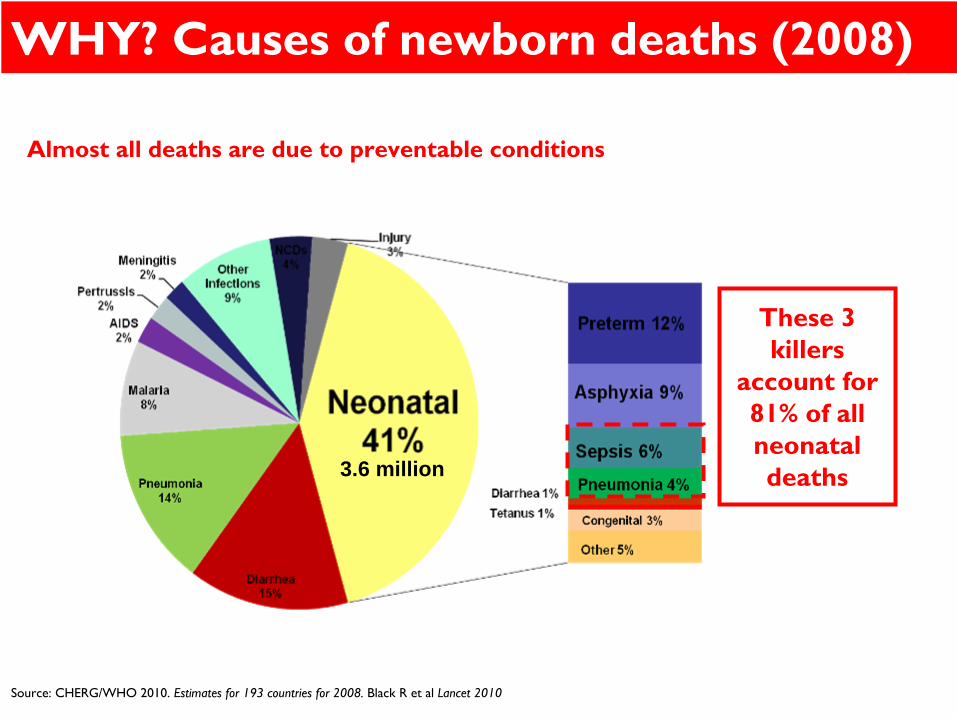
WHY? Causes of newborn deaths (2008)
These 3 killers
account for 81% of all neonatal deaths3.6 million
Source: CHERG/WHO 2010. Estimates for 193 countries for 2008. Black R et al Lancet 2010
Almost all deaths are due to preventable conditions
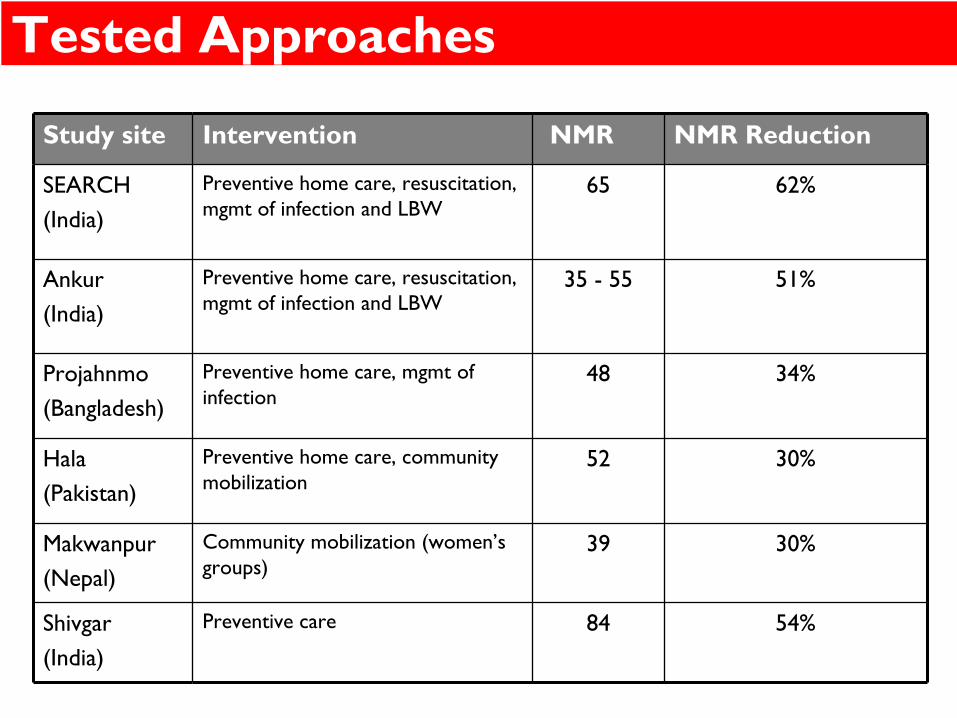
Tested Approaches
Study site Intervention NMR NMR Reduction
SEARCH (India)
Preventive home care, resuscitation, mgmt of infection and LBW
65 62%
Ankur(India)
Preventive home care, resuscitation, mgmt of infection and LBW
35 -
55 51%
Projahnmo(Bangladesh)
Preventive home care, mgmt of infection
48 34%
Hala(Pakistan)
Preventive home care, community mobilization
52 30%
Makwanpur(Nepal)
Community mobilization (women’s groups)
39 30%
Shivgar(India)
Preventive care 84 54%
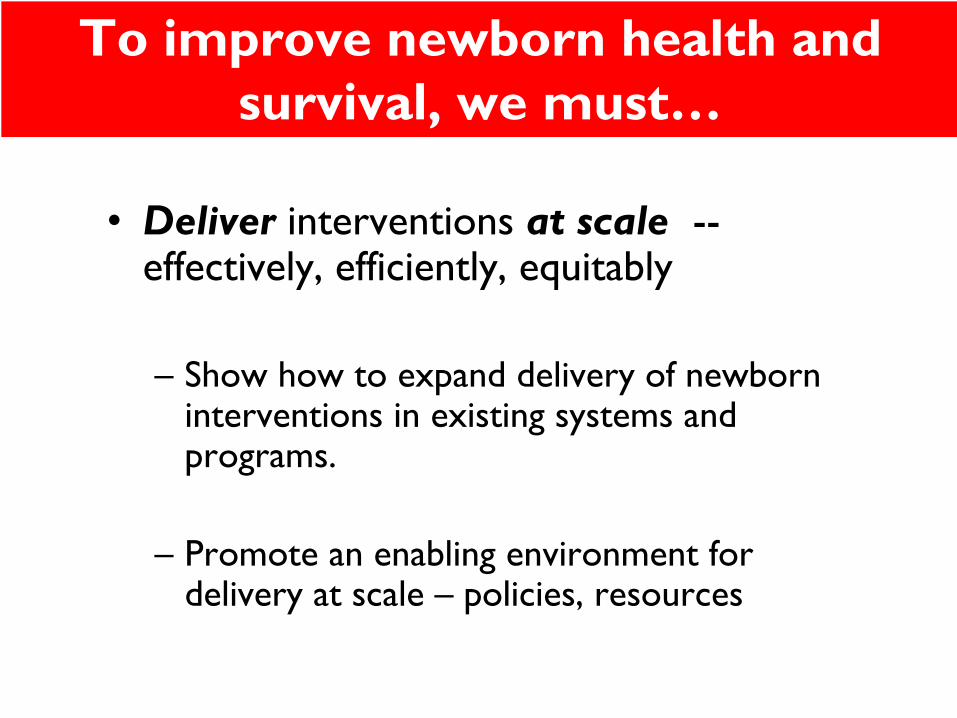
To improve newborn health and survival, we must…
•
Deliver
interventions at scale
-- effectively, efficiently, equitably
–
Show how to expand delivery of newborn interventions in existing systems and programs.
–
Promote an enabling environment for delivery at scale –
policies, resources
Convergence with Maternal Health
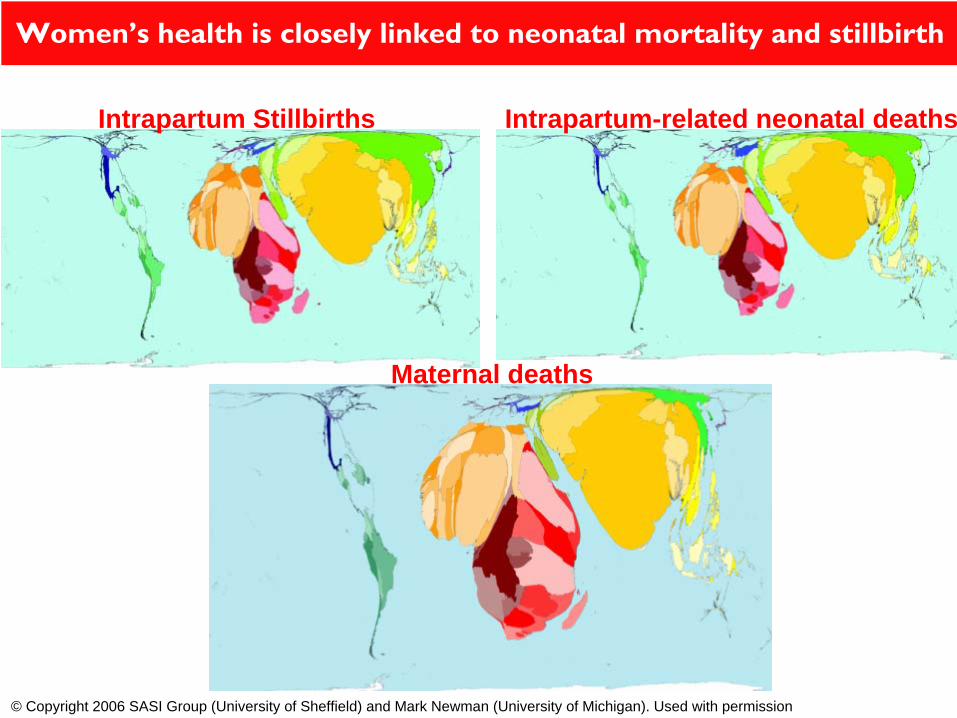
Intrapartum Stillbirths Intrapartum-related neonatal deaths
Maternal deaths
© Copyright 2006 SASI Group (University of Sheffield) and Mark Newman (University of Michigan). Used with permission
Women’s health is closely linked to neonatal mortality and stillbirth
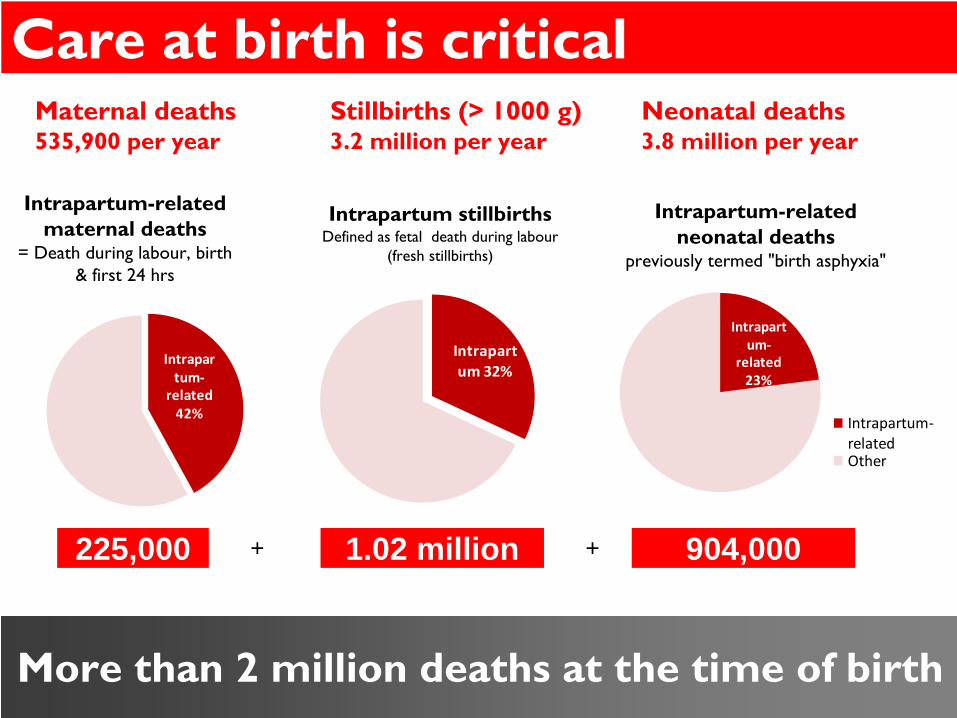
Care at birth is critical
Intrapartum‐
related 42%
Intrapartum 32%
Intrapartum‐
related 23%
Intrapartum‐relatedOther
Data sources: Maternal deaths: WHO/UNICEF/UNFPA estimates, Hill K et al, 2007. Timing of maternal deaths based on Li XF et al, 1996.Stillbirths: Stanton et al, 2006 Intrapartum stillbirth rate Lawn JE et al 2005. Neonatal deaths: WHO (UNICEF 2009 [2]. Intrapartum-related neonatal deaths based on CHERG/WHO estimates updated for 2009 using neonatal mortality and revised neonatal cause specific estimates for Countdown 2008[91] based on methods from Lawn et al., 2006
Maternal deaths535,900 per year
Stillbirths (> 1000 g)3.2 million per year
Neonatal deaths3.8 million per year
Intrapartum-related maternal deaths
= Death during labour, birth & first 24 hrs
Intrapartum-related neonatal deaths
previously termed "birth asphyxia"
Intrapartum
stillbirthsDefined as fetal death during labour
(fresh stillbirths)
Source: Lawn JE et al, IJGO 2009
225,000 1.02 million 904,000+ +
More than 2 million deaths at the time of birth
Missed Opportunities
Slow progress especially for South Asia and sub Saharan Africa
-
access to care and human
resources are major gap
Two track process1.
Seize missed opportunities to improve care for births already in facilities
2.
Bridge the gap for 60 million non facility births
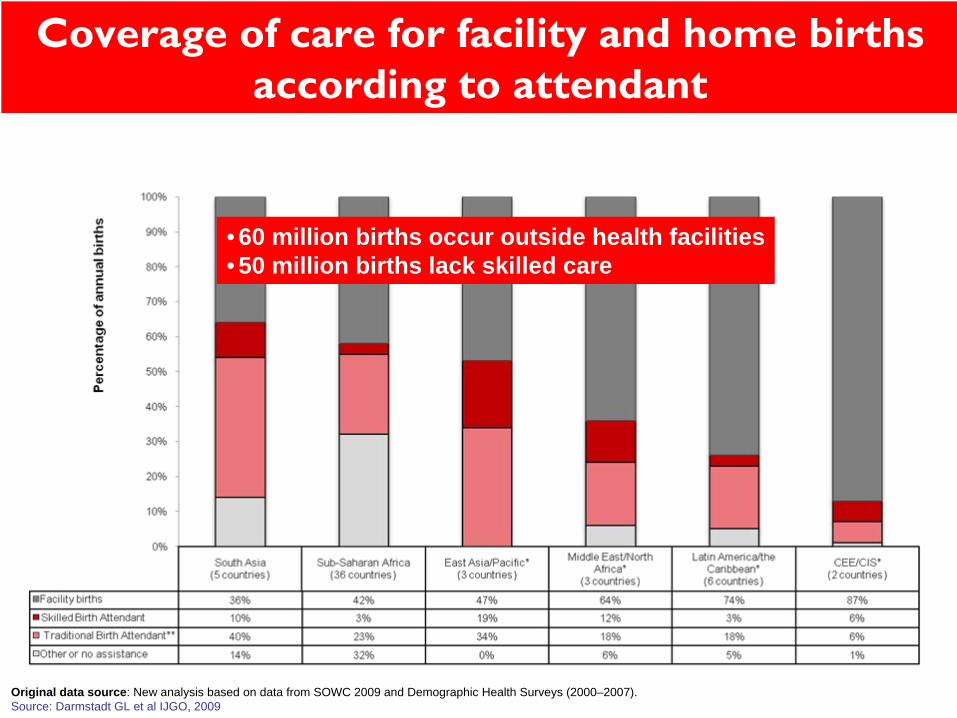
Coverage of care for facility and home births according to attendant
• 60 million births occur outside health facilities• 50 million births lack skilled care
Original data source: New analysis based on data from SOWC 2009 and Demographic Health Surveys (2000–2007). Source: Darmstadt GL et al IJGO, 2009
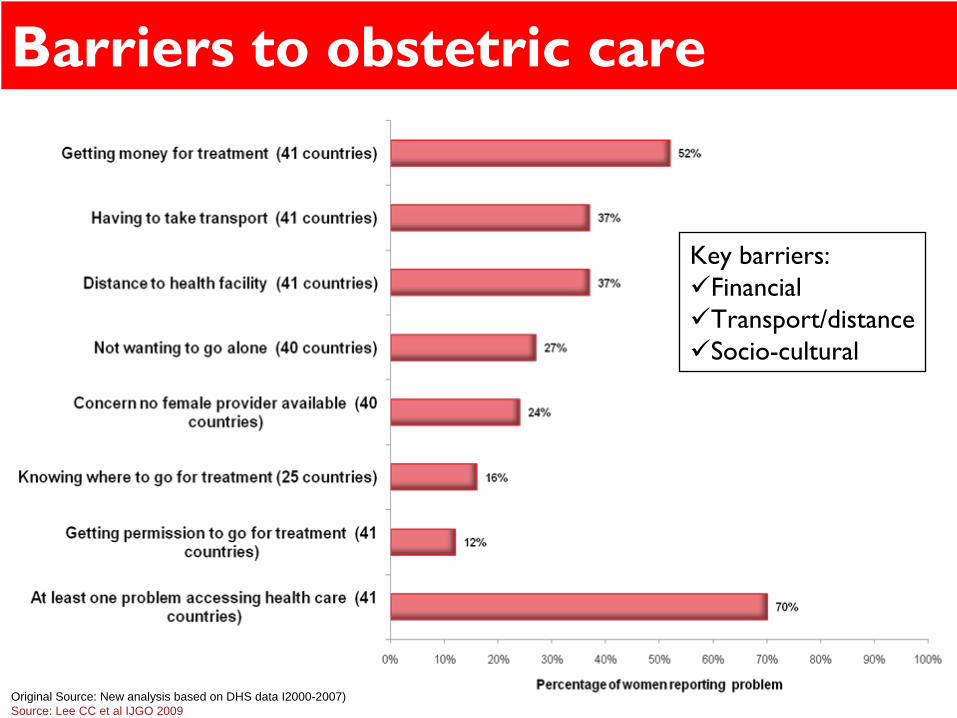
Barriers to obstetric care
Key barriers:FinancialTransport/distanceSocio-cultural
Original Source: New analysis based on DHS data I2000-2007)Source: Lee CC et al IJGO 2009
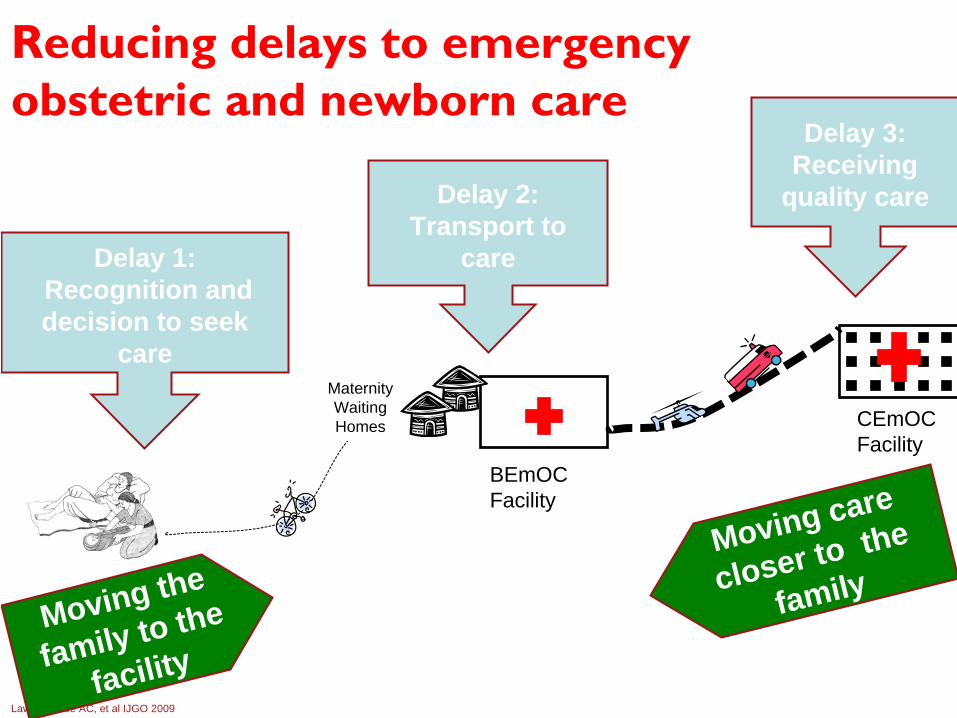
Lawn JE, Lee AC, et al IJGO 2009
CEmOCFacility
BEmOCFacility
Maternity Waiting Homes
Reducing delays to emergency obstetric and newborn care
Delay 1:Recognition and decision to seek
care
Delay 2: Transport to
care
Delay 3: Receiving
quality care
Moving the
family to the
facility
Moving care
closer to the
family
Lawn JE, Lee AC, et al IJGO 2009
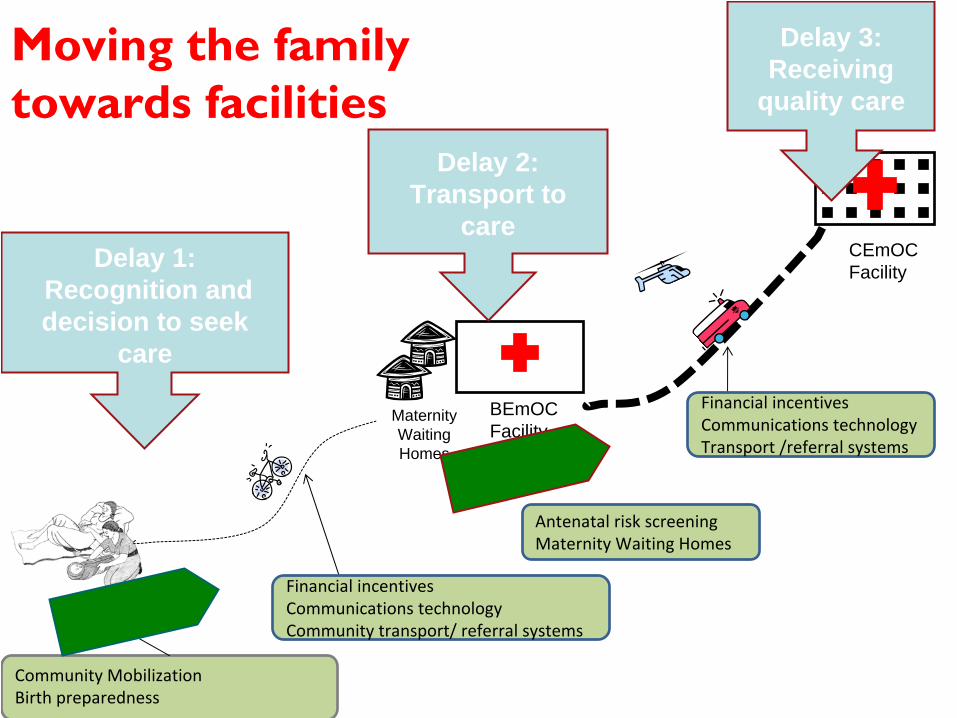
Moving the family towards facilities
CEmOCFacility
Community MobilizationBirth preparedness
BEmOCFacility
Maternity Waiting Homes
Financial incentivesCommunications technologyCommunity transport/ referral systems
Antenatal risk screeningMaternity Waiting Homes
Financial incentivesCommunications technology Transport /referral systems
Delay 1:Recognition and decision to seek
care
Delay 2: Transport to
care
Delay 3: Receiving
quality care
•
(some sort of conclusion?)

THANK YOU
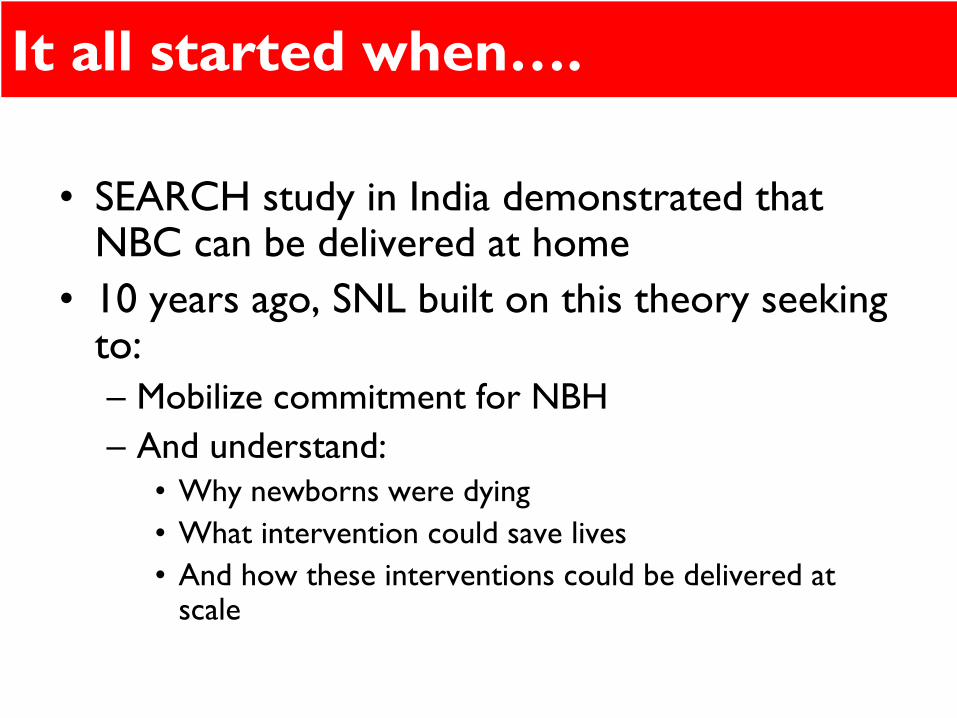
It all started when….
•
SEARCH study in India demonstrated that NBC can be delivered at home
•
10 years ago, SNL built on this theory seeking to:–
Mobilize commitment for NBH
–
And understand: •
Why newborns were dying
•
What intervention could save lives•
And how these interventions could be delivered at scale
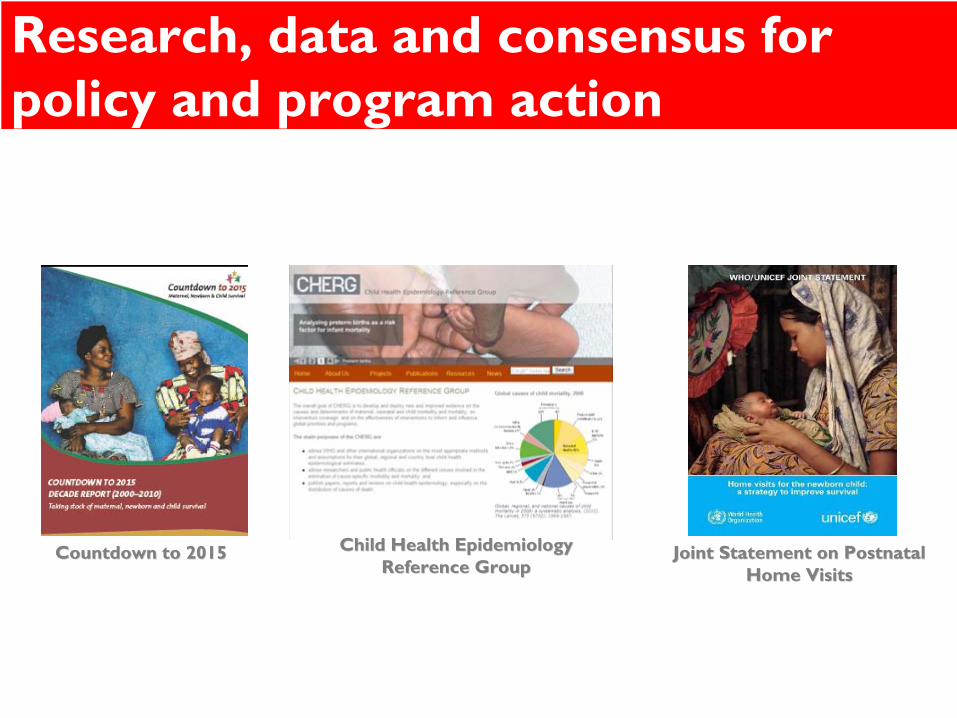
Research, data and consensus for policy and program action
Countdown to 2015Countdown to 2015 Child Health Epidemiology Child Health Epidemiology Reference GroupReference Group
Joint Statement on Postnatal Joint Statement on Postnatal Home VisitsHome Visits
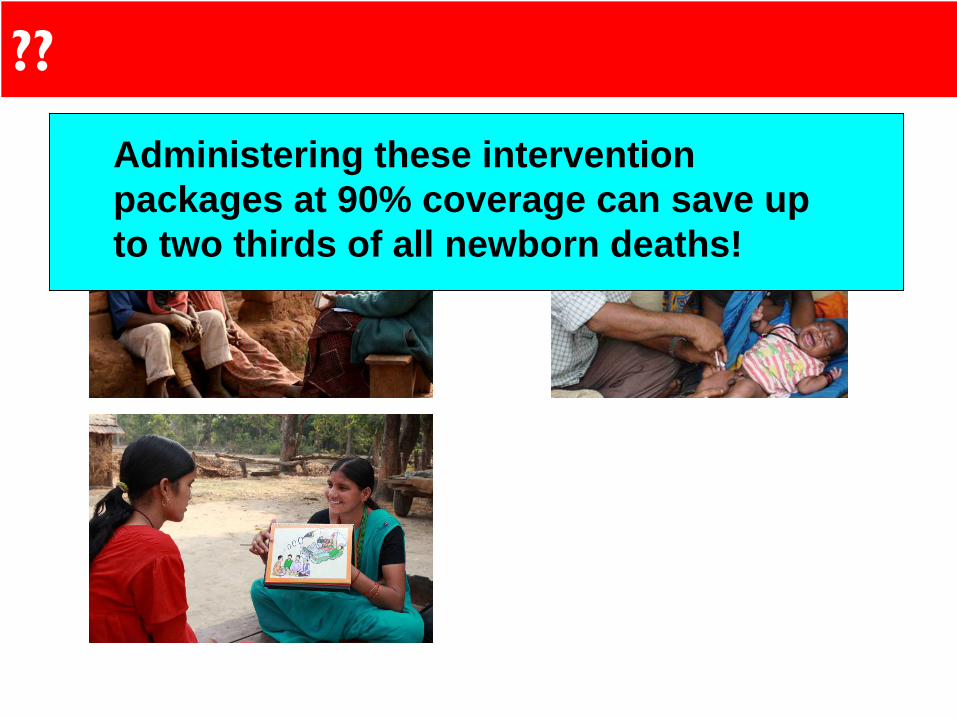
??
Administering these intervention packages at 90% coverage can save up to two thirds of all newborn deaths!
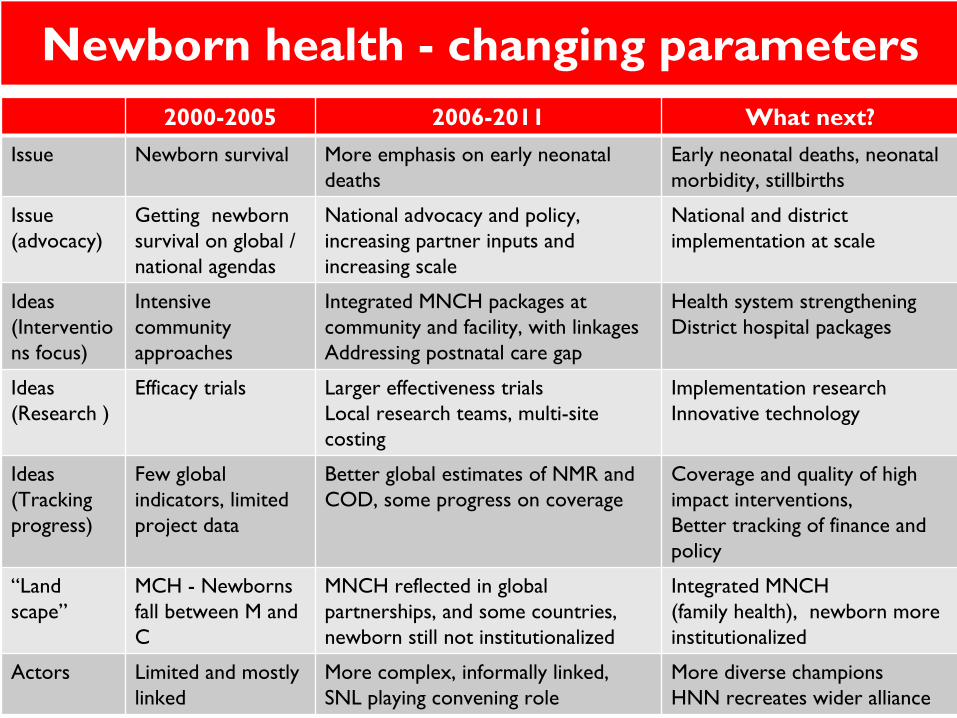
Newborn health -
changing parameters 2000-2005 2006-2011 What next?
Issue Newborn survival More emphasis on early neonatal deaths
Early neonatal deaths, neonatal morbidity, stillbirths
Issue(advocacy)
Getting newborn survival on global / national agendas
National advocacy and policy, increasing partner inputs and increasing scale
National and district implementation at scale
Ideas (Interventio
ns focus)
Intensive community approaches
Integrated MNCH packages at community and facility, with linkagesAddressing postnatal care gap
Health system strengtheningDistrict hospital packages
Ideas(Research )
Efficacy trials Larger effectiveness trialsLocal research teams, multi-site costing
Implementation researchInnovative technology
Ideas (Tracking progress)
Few global indicators, limited project data
Better global estimates of NMR and COD, some progress on coverage
Coverage and quality of high impact interventions, Better tracking of finance and policy
“Land scape”
MCH -
Newborns fall between M and C
MNCH reflected in global partnerships, and some countries, newborn still not institutionalized
Integrated MNCH(family health), newborn more institutionalized
Actors Limited and mostly linked
More complex, informally linked, SNL playing convening role
More diverse championsHNN recreates wider alliance
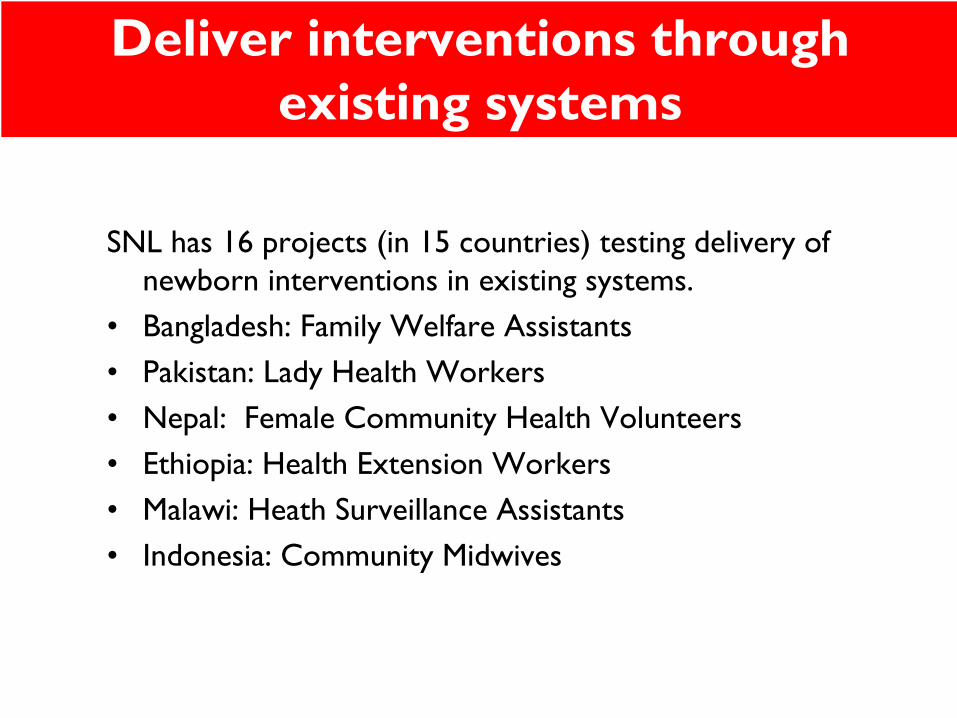
Deliver interventions through existing systems
SNL has 16 projects (in 15 countries) testing delivery of newborn interventions in existing systems.
•
Bangladesh: Family Welfare Assistants•
Pakistan: Lady Health Workers
•
Nepal: Female Community Health Volunteers•
Ethiopia: Health Extension Workers
•
Malawi: Heath Surveillance Assistants•
Indonesia: Community Midwives
•
Antenatal Care (Tetanus Toxoid, STI Mgmt, Counseling, Birth Preparedness)
•
Emergency Obstetric Care (obstructed labor; hemorrhage)
•
Emergency Newborn Care (very low birthweight; sepsis; asphyxia)
•
Postnatal Care (Early detection and treatment of complications, Breastfeeding, Hygiene, Warmth)