evidence review of the trophic status of the milford haven
TRANSCRIPT

Page 1 of 53 www.naturalresourceswales.gov.uk
Executive Summary The purpose of this report is to provide an overview of the available evidence relating to the trophic status of the Milford Haven waterway and to recommend whether a case for designation as a Polluted Water (Eutrophic) should be made under the terms of the Nitrates Directive. The report reviews available data and compliance with other relevant European directives. The EC Nitrates Directive (91/676/EEC) requires that waters which are eutrophic due to nitrates derived from agricultural sources, or are at risk of becoming so unless preventative action is taken, must be identified as Polluted Waters (Eutrophic) and areas of land draining into these waters, and which contribute to their nitrogen pollution, must be designated as Nitrate Vulnerable Zones (NVZs). Opportunistic macroalgae, phytoplankton and nutrient data have been reviewed in this and previous studies undertaken for the Nitrates, Urban Waste Water Treatment and Water Framework (WFD) directives. Milford Haven waterway is at Moderate status and hypernutrified compared to WFD nutrient standards. Phytoplankton blooms do not occur in the waterway, but within the sheltered bays and inlets there is widespread and often dense growth of opportunistic macroalgae species, primarily Ulva sp. Evidence from WFD monitoring in the Milford Haven Inner water body shows that dissolved inorganic nitrogen (DIN) levels are Moderate and this is reflected in the opportunistic macroalgae classification, which also achieves Moderate status. Therefore, this transitional water body is currently failing to meet Good status, which is required for WFD compliance by 2027. The WFD DIN classification demonstrates that the waters of the Milford Haven Outer water body are also at Moderate status and are hyper-nutrified according to WFD standards, but assessments did not demonstrate failures of phytoplankton or opportunistic macroalgae quality elements at water body level. There is localised evidence of impacts from excessive macroalgal growth on eelgrass and saltmarsh habitats but this is not reflected in overall water body classifications for these elements, which achieve at least Good status in both water bodies. There are classification data available for benthic invertebrate communities, but these have been generated using sub tidal samples and hence are not from areas of opportunistic macroalgae growth so are not of relevance to this assessment. The vast majority of the DIN entering the waterway from the catchment area comes from agricultural land. Only ~8% of the DIN load is attributable to continuous point sources such as sewage treatment plants and industrial discharges, while other potential sources such as intermittent discharges and other urban sources are believed to be relatively insignificant. A higher proportion of the dissolved inorganic phosphorus (DIP) load (~42%) comes from continuous point sources. Previous modelling studies have indicated that both nitrogen and phosphorus concentrations may be important in controlling algal growth, depending on location within the waterway, time of year, weather and tidal state. However,

Page 2 of 53 www.naturalresourceswales.gov.uk
based on the observational data, it was suggested that, on balance, nitrogen limitation is more likely. There is no evidence of an increasing trend in nutrient (DIN or DIP) loads entering the waterway or nutrient concentrations within the waterway. Minimum data requirements for each parameter considered in this assessment have been achieved in all cases. On the balance of evidence available, there is evidence in all three categories for the designation of the Milford Haven Inner water body. For Milford Haven Outer water body, there is evidence of nutrient failures and more localised “Category II” response parameter impacts, however these Category II impacts are not reflected in the overall classification for opportunistic macroalgae in the Outer water body. Evidence of Category III secondary response parameters to nutrient enrichment are present within both water bodies however it should be noted that this evidence is limited. There is also evidence of opportunistic macroalgal growth impacting upon water use including fishing activities and navigation. It should be considered that there is no quantifiable method for the analysis and reporting of such evidence and it is mostly anecdotal, however it is still of relevance and should be taken into account.
Summary of available evidence
Milford Haven Inner
Category I: Nutrient enrichment: WFD DIN failure Category II: Response Parameters: WFD Opportunistic Macroalgae failure Category III: Secondary response parameters: High percentages of anoxia in surface sediments; impacts of eutrophication on water use i.e. fishing activities, navigation and cooling water processes at Pembroke Power Station, evidence of localised impacts to seagrass and pioneer saltmarsh; this is not reflected in water body level classifications.
Milford Haven Outer
Category I: Nutrient enrichment: WFD DIN failure Category II: Response Parameters: localised areas of opportunistic macroalgae blooms in sheltered inlets and embayments but this is not reflected in classification at water body level. Category III: Secondary response parameters: High percentages of anoxia in surface sediments; impacts of eutrophication on water use i.e. fishing activities and navigation, evidence of localised impacts to pioneer saltmarsh; this is not reflected in water body level classifications.
It is recommended that a case for designation under the provisions of the Nitrates Directive should be made for the catchment area for the Milford Haven Inner water body. This is supported by evidence in all three of the categories that this assessment is based upon, however it should be noted that Category III evidence is limited. For the Outer water body there is also evidence to suggest the waters are hypernutrified (it is failing for DIN) however the Category II evidence does not

Page 3 of 53 www.naturalresourceswales.gov.uk
support a case for designation as macroalgal growth is more localised in the Outer water body and it is not failing for opportunistic macroalgae or phytoplankton. It is therefore recommended that monitoring for the Outer water body is continued and the outputs are reviewed at the next 4-yearly review.

Page 4 of 53 www.naturalresourceswales.gov.uk
Contents 1. Introduction ...................................................................................................................... 5
2. Overview of Eutrophication in EU Directives .................................................................... 7
3. Overview of Assessment Methodology .......................................................................... 10
4. Trophic Status Assessment ......................................................................................... 122
4.1. Nutrients ................................................................................................................ 122
4.1.1. Nutrient trends ................................................................................................ 122
4.1.2. Nutrient source apportionment ........................................................................ 244
4.2. Overview of WFD .................................................................................................. 344
4.3. Causative Parameters – elevated nutrients ........................................................... 355
4.3.1. WFD DIN classifications ................................................................................. 355
4.3.2. Factors Controlling Algal Growth .................................................................... 377
4.4. Category II Response Parameters – evidence of algal growth .............................. 388
4.4.1. Opportunistic Macroalgae data used in 2015 WFD Classification .................. 388
4.4.2. Phytoplankton data used in 2015 Classification .............................................. 444
4.4.3. Additional Data Used in the Assessment of Category II response parameters.................................................................................................................................. 455
4.5. Category III – Secondary and other effects – evidence of undesirable ecological disturbance ................................................................................................................... 466
5. Conclusion ..................................................................................................................... 50
6. References .................................................................................................................... 52

Page 5 of 53 www.naturalresourceswales.gov.uk
1. Introduction The aim of this report is to provide an overview of the available evidence relating to the trophic status of the Milford Haven waterway and to recommend whether a case for designation as a Polluted Water (Eutrophic) should be made under the terms of the Nitrates Directive. The report reviews available data and compliance with other relevant European Directives. The EC Nitrates Directive (91/676/EEC) requires that waters which are eutrophic due to nitrates derived from agricultural sources, or at risk of becoming so unless preventative action is taken, must be identified as Polluted Waters (Eutrophic) and areas of land draining into these waters, and which contribute to their nitrogen pollution, must be designated as Nitrate Vulnerable Zones (NVZs). The Milford Haven waterway is a ria estuary (drowned river valley) comprising a central waterway with numerous shallow embayments, tributaries and pills. It is the largest estuary in Wales and the catchment area comprises a large proportion of Pembrokeshire (Fig.1). For WFD purposes, the waterway is divided into two separate water bodies: Milford Haven Inner, a transitional water body, and Milford Haven Outer, a coastal water body. The entire Milford Haven waterway is within the Pembrokeshire Marine Special Area of Conservation (PMSAC), and has been afforded the highest legal protection currently available by achieving this status under the provisions of the Habitats Directive. It is considered one of the best areas in the UK for a number of habitats and species, all of which can be affected by diffuse pollution impacting upon water quality. Nutrient enrichment has been cited as a threat to the integrity of PMSAC. There are 71 WFD fresh water bodies adjudged to comprise the catchment area of the Milford Haven Waterway. Nutrient enrichment and morphological impact on fish communities are cited as the main problems affecting WFD compliance in these freshwater bodies (WFD Catchment Summary). Agricultural land is considered to be the primary source of diffuse pollutants impacting upon water quality within the catchment area. There has been increasing concern over the existing problems around opportunistic macroalgal growth on the inter-tidal mudflats and sand flats within the sheltered bays and inlets of the waterway. This was first expressed in a report by CCW (2009a), which raised concern of evidence of eutrophication, particularly opportunistic macroalgal growth, and questioned whether impacts of excess nutrients had been overlooked in previous years. This report prompted the Environment Agency to consider whether a case for designation should be made under the terms of the Urban Waste Water Treatment Directive (UWWTD) and Nitrates Directive (ND), based on the evidence available at the time. The Milford Haven waterway was first reviewed as a candidate Polluted Water in 2009.This review concluded that there was insufficient evidence to support a proposal for designation (Robinson, 2009a) but it was recommended that monitoring should continue and its candidacy reviewed again when further evidence was available.

Page 6 of 53 www.naturalresourceswales.gov.uk
Fig.1 Map showing the Milford Haven Inner and Outer water bodies and their catchment areas
Page 7 of 53 www.naturalresourceswales.gov.uk
In 2014, NRW produced a report entitled “Environmental Pressures on the Milford Haven Waterway”, which had a particular focus on nutrients. The report highlighted that the waterway contains elevated levels of nutrients originating from diffuse pollution within the catchment and that analysis of monitoring data demonstrated the waterway was hypernutrified compared to WFD nutrient standards. Based upon the evidence used to inform this report, it was subsequently decided that the Milford Haven waterway catchment area was to be considered further for designation as a Polluted Water (Eutrophic) under the provisions of the Nitrates Directive and stakeholders were notified of this risk later in 2014. Eutrophication is defined as “the enrichment of water by nitrogen compounds, causing an accelerated growth of algae and higher forms of plant life to produce an undesirable disturbance to the balance of organisms present in the water and to the quality of the water concerned”. The meaning of the term “eutrophic” is inferred from the definition of eutrophication set out in the Nitrates Directive.
2. Overview of Eutrophication in EU Directives Eutrophication is addressed in several EU policies. The main anthropogenic sources of nutrient loadings were addressed in two directives implemented in 1991: The UWWTD and ND. The UWWTD (91/271/EEC) addressed the major point sources; the Nitrates Directive dealt with diffuse pollution of nitrogen from agriculture. Both directives provide measures to combat eutrophication. Neither directive has a specific framework for the monitoring and assessment of water quality. In 2000, the WFD (2000/60/EC) introduced a comprehensive ecological status assessment of all surface waters, based on a number of quality elements. The WFD provided the basis for a clear and detailed assessment of trophic status, and provided the potential for a more consistent and integrated approach to managing nutrient inputs to water taking fully into account the requirements of previous EU legislation (CIS, 2009). Additionally, the EU Marine Strategy Framework Directive (2008/56/EC) aims to achieve or maintain “good environmental status” including the minimisation of eutrophication in marine waters. A number of EC directives require Member States to monitor parameters relevant to eutrophication, however only the UWWTD and ND have an explicit requirement to assess eutrophication; the former through the identification of “sensitive areas” and the latter through the identification of “polluted waters” and subsequent designation of NVZs (CIS, 2009). The WFD supports both these directives in its provisions for protected areas and additionally has a specific requirement to assess trophic status when classifying surface waters. Unlike the UWWTD and ND, the WFD has a specific framework for the

Page 8 of 53 www.naturalresourceswales.gov.uk
assessment of elements of water quality which has been formally consulted upon, and published.

Page 9 of 53 www.naturalresourceswales.gov.uk
Table 1, General Overview of requirements for EC directives regarding eutrophication. Adapted from CIS, 2009 Directive
Requirement to assess eutrophication
Minimum monitoring requirements relevant to eutrophication
WFD UWWTD Nitrates Directive Bathing Water Directive Marine Strategy Framework Directive
Included in the classification of Ecological Status where nutrient enrichment affects biological and physic-chemical quality elements Protected Areas support and uphold requirements of UWWTD and Nitrates Directive In order to identify sensitive areas under Annex IIA(a) criteria (i.e. water bodies that are eutrophic or may become eutrophic in the near future if protective action is not taken) In order to identify “polluted waters” and to designate their catchment area as nitrate vulnerable zones As part of the obligations under this directive, bathing water profiles have to be established. When the bathing water profile indicates a tendency for proliferation of macro-algae and/or marine phytoplankton, investigations are undertaken to determine their acceptability and health risks and adequate management measures shall be taken, including information to the public. Included in assessment of environmental status based on “good” environmental status concept Complementarity with WFD in “coastal waters”, hence no MSFD specific issues in those waters as
Phytoplankton (6 months), aquatic flora (3 yrs), macro invertebrates (3 yrs), fish (3 yrs) Physico-chemical quality elements (3 months) Review of the existing sensitive areas and designation of new ones at least every 4 years (Article 5 (6)) A review of the eutrophic state of fresh waters, estuaries and coastal waters should be made every four years. When establishing, reviewing and updating bathing water profiles, adequate use shall be made of data obtained from monitoring and assessments carried our pursuant to Directive 2000/60/EC. A monitoring programme will be established by each Member State, taking account of the information needs derived from their development of the earlier elements of their marine strategies (initial assessment, determination of good environmental status, identification

Page 10 of 53 www.naturalresourceswales.gov.uk
Habitats Directive
regards assessment of eutrophication If threatening protected habitats or species
of environmental targets and indicators) None
Available guidance (CIS, 2009) states that the results of the WFD ecological status assessment should be considered in reviews of the designation of NVZs in accordance with the Nitrates Directive. Ultimately, the assessment should lead to a comparable and consistent conclusion across the relevant Directives.
3. Overview of Assessment Methodology While there is no specified methodology for assessing eutrophication in the context of the Nitrates Directive, eutrophication is determined according to criteria including nutrient concentrations together with direct effects (excessive algal growth and other biological parameters) and indirect effects (European Commission, 2009). The criteria are both quantitative and qualitative and reflect scientific understanding of the process and effects of eutrophication. They are broken down into the following three categories:
I. Category I –Causative parameters –elevated nutrients
II. Category II –Response parameters – evidence of algal growth
III. Category III – Secondary and other effects – evidence of undesirable
ecological disturbance
I. Category I – Causative Parameters – elevated nutrients
In the context of the Nitrates Directive, a water body is only considered to be polluted if sufficient nitrate is present to promote eutrophication in addition to any phosphorus enrichment.
Indicative thresholds for nutrients have been established based on where WFD DIN standards are exceeded in order to decide if waters are enriched by nutrients.
Data on nutrient loads from different sources, derived by modelling and other methods, are also collated to confirm whether agriculture is making a significant contribution.
II. Category II –Response parameters – evidence of algal growth

Page 11 of 53 www.naturalresourceswales.gov.uk
The impacts of elevated nutrient concentrations on the plant life in waters are considered in this stage of the assessment. The changes assessed include:
• increased abundance and biomass of algae (phytoplankton and/or opportunistic macroalgae) and/or higher plants;
• Changes to species composition; • exceptional algal blooms
III. Category III – Secondary and other effects – evidence of undesirable ecological
disturbance
Criteria considered in this stage of the assessment include effects on other flora and fauna such as substantial changes in zoobenthos biomass and shifts in species composition, weed smothering saltmarsh/ eelgrass. These could include:
• the effects on other flora and fauna • Formation of algal scums • impacts of eutrophication on water use e.g. recreation, navigation,
conservation value • Oxygen deficiency - anoxia in surface sediments
A case for designation is considered to exist where it is found firstly that the Category I criteria are exceeded and some (or all) of the Category II and III criteria are exceeded, or may be exceeded, taking into account the influence of relevant environmental factors and considering the overall weight of evidence. Evidence in all three categories is normally required for a successful designation case. This requirement may be reduced for sites “at risk” of eutrophication but good evidence of the risk would be required (Robinson, 2009a).
The assessment is not possible with reference to absolute numeric criteria alone. A number of symptoms are considered in order using a structured framework, to come to a judgement taking into account the weight of evidence, as to whether the water body is suffering an “undesirable disturbance” or may do so without preventative action. This report follows the assessment methodology as listed above in terms of assessing available information. WFD classifications for the relevant biological elements are taken into account in this report, as required. Data representative of the whole waterway has been considered where available. Data has been gathered over a long enough time period to avoid distortion due to particular climatic influences in any given year – at least the minimum data requirement is achieved in all data sets used to inform this report (see Table 1).

Page 12 of 53 www.naturalresourceswales.gov.uk
4. Trophic Status Assessment
4.1. Nutrients
4.1.1. Nutrient trends
Temporal trends in nutrients data were analysed for all available data at the following monitoring locations, as shown in Fig 1:
5 mid-channel monitoring locations in the Milford Haven Waterway, monitored from 1998 to 2015
Western and Eastern Cleddau rivers near tidal limits, routinely monitored from 1992 or earlier (see Table 2 for more details)
Table 2. Long-term sampling points in the Western and Eastern Cleddaus
As shown in Table 2, sampling stopped at sampling point 32401 (Eastern Cleddau at Canaston Gauging Station) in 2001 for health & safety reasons and was moved approximately 500m downstream to 88181 (Eastern Cleddau at Canaston Road Bridge). Data sets from these two sampling points were merged, given their close proximity and absence of any significant input between them. Note that the Western and Eastern Cleddaus contribute approximately 51% of the dissolved inorganic nitrogen (DIN) load and 32% of the dissolved inorganic phosphorus (DIP) load to the Milford Haven Waterway (excluding exchange with seawater). Other river inputs contribute 38% and 32% of the DIN and DIP loads respectively (see Section 4.1.2) and are therefore significant, but no other individual river input contributes more than 4% of either the DIN or DIP load, so long-term trends for these other rivers have not been assessed.
Sample
point Description Description/comments
32803 W.Cleddau at Prendergast Gauging Station Upstream of Pelcomb Brook. Data from 1976
120000 W Cleddau "Source" d/s Pelcomb Brook Potable abstraction point. Data from 1992
32804 W.Cleddau at New Bridge, H'west Data from 1992
32401 E Cleddau at Canaston Gauging Station Data from 1992 to 2001 (sampling moved to 88181)
88181 E.Cleddau at Canaston Road Bridge Data from 2001
120010 E Cleddau "Source" d/s Narberth Brook Potable abstraction point. Data from 1992

Page 13 of 53 www.naturalresourceswales.gov.uk
All the above data were retrieved from the Environment Agency's water quality data archive (WIMS) and plotted in Microsoft Excel to identify any long-term trends in DIN and DIP.

Page 14 of 53 www.naturalresourceswales.gov.uk
Fig.2 sampling points used for trend analysis

Page 15 of 53 www.naturalresourceswales.gov.uk
Time series plots for the 5 sampling points in the Milford Haven waterway are shown in figs 3 to 7. These plots did not indicate an overall linear trend in either DIN or DIP for any of the sampling points in the Milford Haven since 1998. However, there did appear to be a period of elevated DIN and DIP concentrations between 2007 and 2011 at all of these sites. DIN and DIP concentrations did not appear to drop as low during the summer months in those years, but this was at least partly due to higher laboratory detection limits during this period.
Fig.3 Time series plot of DIN and DIP at Milford Haven Waterway sampling point 39658 (in Outer Haven water body – see Fig.1)
0
0.01
0.02
0.03
0.04
0.05
0.06
0.000
0.200
0.400
0.600
0.800
1.000
1.200
DIP
mg/
l
DIN
mg/
l
Axis Title
Sampling point 39658
DIN DIP

Page 16 of 53 www.naturalresourceswales.gov.uk
Fig.4 Time series plot of DIN and DIP at Milford Haven Waterway sampling point 39659 (in Inner Haven water body – see Fig.1)
0
0.01
0.02
0.03
0.04
0.05
0.06
0.000
0.200
0.400
0.600
0.800
1.000
1.200
1.400
DIP
mg/
l
DIN
mg/
l
Axis Title
Sampling point 39659
DIN DIP

Page 17 of 53 www.naturalresourceswales.gov.uk
Fig.5 Time series plot of DIN and DIP at Milford Haven Waterway sampling point 39660 (in Inner Haven water body – see Fig.1)
0
0.01
0.02
0.03
0.04
0.05
0.06
0.07
0.08
0.000
0.500
1.000
1.500
2.000
2.500
DIP
mg/
l
DIN
mg/
l
Axis Title
Sampling point 39660
DIN DIP

Page 18 of 53 www.naturalresourceswales.gov.uk
Fig.6 Time series plot of DIN and DIP at Milford Haven Waterway sampling point 39661 (in Inner Haven water body – see Fig.1)
0
0.01
0.02
0.03
0.04
0.05
0.06
0.07
0.08
0.09
0.1
0.000
0.500
1.000
1.500
2.000
2.500
3.000
3.500
DIP
mg/
l
DIN
mg/
l
Axis Title
Sampling point 39661
DIN DIP

Page 19 of 53 www.naturalresourceswales.gov.uk
Fig.7 Time series plot of DIN and DIP at Milford Haven Waterway sampling point 39662 (in Inner Haven water body – see Fig.1)
Further data analysis in Aardvark (WRc software) showed a significant seasonal pattern in nitrate concentrations at all five of the long-term sampling points within the waterway, with a reduction in concentrations in the summer, probably due to combination of lower freshwater load and higher algal uptake (Fig.8). No significant seasonal pattern for orthophosphate (DIP) was identified at any of these five sites.
0
0.02
0.04
0.06
0.08
0.1
0.12
0.000
0.500
1.000
1.500
2.000
2.500
3.000
3.500
4.000
DIP
mg/
l
DIN
mg/
l
Axis Title
Sampling point 39662
DIN DIP

Page 20 of 53 www.naturalresourceswales.gov.uk
Fig.8 Seasonal model of nitrate at sampling point 39659
Time series plots for the sampling points in the Western and Eastern Cleddaus are shown in figs 9 and 10 respectively. Sampling points 32803 (Western) and 32401/88181 (Eastern) were chosen for inclusion in this report as they had the most complete long-term data sets. Time series plots for alternative sampling points, as shown in Table 2, can be found in Appendix 1. The time series plot for the Western Cleddau at 32803 did not show an overall linear increase or decrease in DIN or DIP from 1976 to 2015, although there did appear to be periods of increasing and decreasing DIN and DIP concentrations within this period; these step changes are explained in more detail in Natural Resources Wales (2014). The average DIN and DIP concentrations in the last 5 years were within the same range as the respective long-term averages from 1976 to 2015.

Page 21 of 53 www.naturalresourceswales.gov.uk
Fig.9 Time series plot of DIN and DIP (orthophosphate) in the Western Cleddau at sampling point 32803
The time series plot for the Eastern Cleddau at 32401/88181 did not show an overall linear increase or decrease in DIN or DIP from 1992 to 2015, but on the Western Cleddau there were periods of increasing and decreasing DIN and DIP concentrations within this period (see Natural Resources Wales (2014) for more in-depth analysis). Note that the laboratory’s limit of detection for orthophosphate increased to 0.02 mg/l in 2005, which made it difficult to compare results before and after this change. This was less of an issue in the Western Cleddau because orthophosphate concentrations were generally higher, so there were fewer values below the new limit of detection (0.02mg/l). The average DIN concentration in the Eastern Cleddau in the last 5 years (2.16 mg/l) was lower than the long-term average from 1992 to 2015 (2.66 mg/l).
0.000
0.050
0.100
0.150
0.200
0.250
0
1
2
3
4
5
6
7
8
9
10
02
-Ju
n-7
6
02
-Ju
n-7
8
02
-Ju
n-8
0
02
-Ju
n-8
2
02
-Ju
n-8
4
02
-Ju
n-8
6
02
-Ju
n-8
8
02
-Ju
n-9
0
02
-Ju
n-9
2
02
-Ju
n-9
4
02
-Ju
n-9
6
02
-Ju
n-9
8
02
-Ju
n-0
0
02
-Ju
n-0
2
02
-Ju
n-0
4
02
-Ju
n-0
6
02
-Ju
n-0
8
02
-Ju
n-1
0
02
-Ju
n-1
2
02
-Ju
n-1
4
ort
ho
ph
osp
hat
e m
g/l
DIN
mg/
l
Sampling point 32803 Western Cleddau at Prendergast Gauging Station
DIN Orthophosphate, reactive as P

Page 22 of 53 www.naturalresourceswales.gov.uk
Fig.10 Time series plot of DIN and DIP (orthophosphate) in the Eastern Cleddau at sampling points 32301 (to Feb 2001) and 88181 (from Feb 2002)
More in-depth analysis is available for the waterway and Cleddau data sets, and also for the 5 largest direct STW discharges to the Milford Haven Waterway, for data up to and including 2013 (Natural Resources Wales, 2014). The 2014 report highlighted significant reductions in nutrient concentrations (especially DIP) from the five largest sewage treatment works (STWs) discharging directly to the waterway or estuary system. An examination of the data since 2013 did not highlight any significant further improvements to these discharges.
There was an overall gradient of decreasing mean DIN and DIP concentrations and increasing salinity from the upper estuary to the mouth of the waterway (Figs. 11 and 12). This gradient was steeper for DIN than for DIP, indicating that DIN concentrations in the upper estuary were more significantly enhanced than DIP compared with background concentrations in coastal waters, assuming conservative mixing. Average winter DIN and DIP concentrations were higher than annual averages, presumably due to increased uptake by plants in the summer and lower loads in summer.
0.000
0.050
0.100
0.150
0.200
0.250
0.300
0.000
1.000
2.000
3.000
4.000
5.000
6.000
7.000
8.000
09
-Dec
-92
09
-Dec
-93
09
-Dec
-94
09
-Dec
-95
09
-Dec
-96
09
-Dec
-97
09
-Dec
-98
09
-Dec
-99
09
-Dec
-00
09
-Dec
-01
09
-Dec
-02
09
-Dec
-03
09
-Dec
-04
09
-Dec
-05
09
-Dec
-06
09
-Dec
-07
09
-Dec
-08
09
-Dec
-09
09
-Dec
-10
09
-Dec
-11
09
-Dec
-12
09
-Dec
-13
09
-Dec
-14
ort
ho
ph
osp
hat
e m
g/l
DIN
mg/
l
Date
Sampling points 32401 (to Feb01) and 88181 (from Feb02) Eastern Cleddau
DIN Orthophosphate, reactive as P

Page 23 of 53 www.naturalresourceswales.gov.uk
Fig.11 Average Dissolved Inorganic Nitrogen (DIN) concentrations and salinity in the Milford Haven Waterway from 2009 to 2012 (see Fig.2 for sampling point locations)
0
5
10
15
20
25
30
35
0
0.2
0.4
0.6
0.8
1
1.2
1.4
39658 (OuterHaven)
39659 39660 39661 39662 (InnerHaven)
Salin
ity
pp
t
DIN
mg/
l
Sampling point
DIN mg/l DIN winter mg/l Salinity ppt

Page 24 of 53 www.naturalresourceswales.gov.uk
Fig.12 Average Dissolved Inorganic Phosphorus (DIP) concentrations and salinity in the Milford Haven Waterway from 2009 to 2012 (see Fig.2 for sampling point locations)
4.1.2. Nutrient source apportionment
Monitoring data and other available information were reviewed to apportion sources of nitrogen and phosphorus entering the Milford Haven waterway, not including exchange with seawater. Nutrient loads were calculated for the following:
Eastern and Western Cleddau rivers, calculated by multiplying individual nutrient concentrations by mean daily flow on the day of sampling, as recorded at the main gauging stations.
River Carew, Cosheston Pill, River Cresswell, Llangwm Pill and Sandy Haven Pill, obtained from simultaneous water quality sampling and flow gauging.
Cartlett Brook, Pembroke River and Castle Pill, calculated by multiplying mean observed concentrations by estimated mean flow obtained using Low Flows Enterprise software.
Other river/stream inputs (see Table 3), calculated by multiplying mean observed concentrations by estimated mean flow based on catchment area.
The remaining catchment area not captured by water quality monitoring, calculated using the average nutrient yield (load per area) for the monitored catchment area.
0
5
10
15
20
25
30
35
0
0.005
0.01
0.015
0.02
0.025
0.03
39658 (OuterHaven)
39659 39660 39661 39662 (InnerHaven)
Salin
ity
pp
t
DIN
mg/
l
Sampling point
DIP mg/l DIP winter mg/l Salinity ppt

Page 25 of 53 www.naturalresourceswales.gov.uk
Sewage treatment works effluents that discharge either directly to the waterway or downstream of the lowest river sampling points (see Table 3), calculated by multiplying mean nutrient concentrations by observed mean daily flows.
By default, the above calculations were based on the 5-year period from April 2010 to March 2015. However, all data sets were first plotted in Excel and visually checked for step changes, outliers and missing data before selecting suitable time periods that were deemed to be representative of the current conditions. The only notable observed step change in water quality within this time period was at Pembroke Dock STW, which received phosphate removal from 2012; therefore only data from 2012 onwards were used for this discharge. All raw and processed data and calculations are shown in Appendix 2. In the absence of any changes to permit conditions or any other significant changes, the estimated contributions to the nutrient loads to the waterway from Environmental Permitting Regulation (EPR) installations, including discharges to water and the input via aerial emissions, were obtained from a previous study (Natural Resources Wales, 2014). These installations include two Liquefied Natural Gas (LNG) terminals, Pembroke Power Station and the Murco and Valero oil refineries. The results of the nutrient source apportionment study are summarised in Table 3 and in figs 13 to 16.

Page 26 of 53 www.naturalresourceswales.gov.uk
Table 3 Nutrient inputs to the Milford Haven waterway, ranked by dissolved inorganic nitrogen (DIN) load.
Sampling
point Source Type
Mean
flow l/s
DIN
mg/l DIN kg/d
DIP
mg/l DIP kg/d
32803 Western Cleddau (u/s Pelcomb Brook) River/stream 6904 3.78 2350 0.04 27.71
N/A Area downstream of all sampling points Diffuse inputs 3729 3.62 1168 0.06 18.76
88181 Eastern Cleddau (u/s Narberth Brook) River/stream 6366 2.18 1159 0.03 15.37
85008 Cartlett Brook River/stream 790 4.15 284 0.08 5.21
84240 Winterton Marsh Stream River/stream 356 6.42 197 0.10 2.99
33244 Westfield Pill River/stream 376 4.75 154 0.07 2.38
85001 Merlins Brook River/stream 584 2.79 141 0.06 2.96
100058 Merlin's Bridge STW STW discharge 96 16.88 140 2.03 16.79
85007 Pelcomb Brook River/stream 377 4.14 135 0.09 2.81
33230 River Cresswell River/stream 704 2.23 128 0.07 2.88
33233 Sandy Haven Pill River/stream 307 3.78 126 0.04 1.18
32407 Narberth Brook River/stream 378 3.70 121 0.03 1.11
N/A Total from all 5 EPR installations Point sources No data No data 100 No data No data
39301 Pembroke Dock STW STW discharge 109 9.64 90 0.39 4.04
34547 Pembroke River River/stream 330 2.77 79 0.03 0.96
81246 Hubberston Pill River/stream 178 4.91 76 0.08 1.29
34222 Millin Pill River/stream 311 2.46 66 0.05 1.29
86505 Milton Brook River/stream 142 4.06 50 0.04 0.52
100484 Milford Haven STW STW discharge 33 15.01 42 2.50 7.08
33231 Llangwm Pill River/stream 81 5.82 42 0.05 0.36
39430 Commons Stream River/stream 65 5.86 33 0.04 0.24
32475 River Carew River/stream 238 1.30 24 0.03 0.98
33232 Castle Pill River/stream 82 3.33 24 0.05 0.35
33219 E.Cleddau trib d/s Narberth Brook River/stream 153 1.76 23 0.03 0.40
100070 Neyland STW STW discharge 15 18.02 23 1.94 2.47
33218 Penglyn Brook River/stream 76 3.22 21 0.15 0.96
100062 Narberth West STW STW discharge 13 15.97 18 2.17 2.42
32691 Cosheston Pill River/stream 50 2.67 12 0.05 0.31
100046 Llangwm STW STW discharge 10 12.30 11 3.36 2.97
100032 Hook STW STW discharge 4 26.21 9 4.23 1.48
100035 Johnston STW STW discharge 6 No data 8 5.78 2.96
100030 Herbrandston STW STW discharge 2 No data 3 2.12 0.43
100033 Hundleton STW STW discharge 3 13.09 3 1.54 0.34
100003 Angle STW STW discharge 2 15.74 3 2.71 0.44
100018 Cosheston STW STW discharge 3 9.25 2 1.57 0.38
100008 Burton Ferry STW STW discharge 1 20.48 2 4.71 0.43
Total kg/day 6867 133
Total kg/year 2,508,188 48,540
Page 27 of 53 www.naturalresourceswales.gov.uk
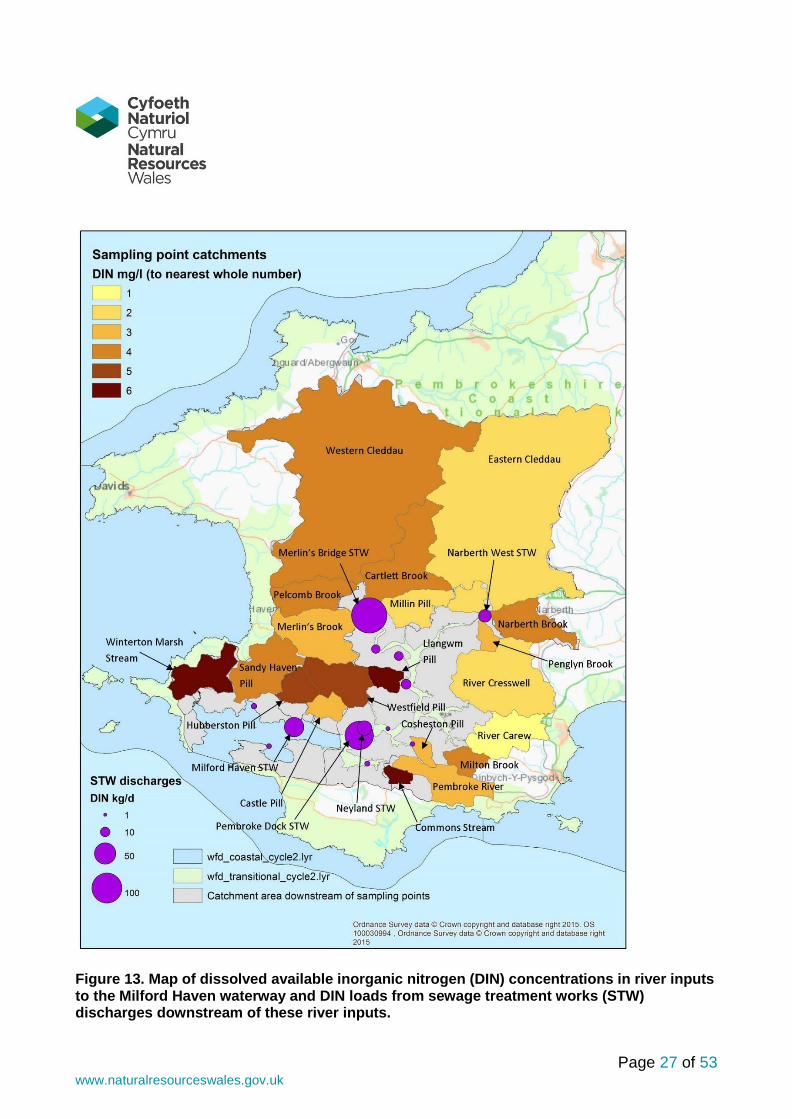
Figure 13. Map of dissolved available inorganic nitrogen (DIN) concentrations in river inputs to the Milford Haven waterway and DIN loads from sewage treatment works (STW) discharges downstream of these river inputs.

Page 28 of 53 www.naturalresourceswales.gov.uk
Figure 14. Map of dissolved available inorganic phosphorus (DIP) concentrations in river inputs to the Milford Haven waterway and DIN loads from sewage treatment works (STW) discharges downstream of these river inputs.

Page 29 of 53 www.naturalresourceswales.gov.uk
Fig.13 indicates that 93% of the DIN load to the waterway comes from the catchment, as opposed to the direct discharges from STWs and EPR-installation discharges. The direct STWs contribute 5% of the DIN load, while EPR-installation industries contribute 2% as a worst-case scenario, including the contribution from their aerial emissions.
Fig.15 Dissolved inorganic nitrogen (DIN) loads to the Milford Haven Waterway
Fig.16 indicates that direct STW discharges account for 32% of the DIP load to the waterway, with the remainder (68%) coming from river/catchment inputs. The largest STW contributions come from Merlin’s Bridge (13%), Milford Haven (5%) and Pembroke Dock (3%) STWs. The contribution from STWs is lower than that estimated in previous studies (Edwards, 2005; Natural Resources Wales, 2014), with the largest reductions coming from Milford Haven and Pembroke Dock STWs. The reduced contribution from STWs since 2005 can partially be attributed to improved effluent quality at the STWs, notably the commencement of phosphorus removal at Pembroke Dock STW in 2012.
W.Cleddau (u/s Pelcomb Brook)
34%
E.Cleddau (u/s Narberth Brook)
17%
Cartlett Brook4%
Other river/stream inputs38%
Direct STW discharges5%
EPR installations2%

Page 30 of 53 www.naturalresourceswales.gov.uk
Fig.16 Dissolved inorganic phosphorus (DIP) loads to the Milford Haven Waterway
The total nitrogen and phosphorus loads to the waterway calculated in this study are 2508 tonnes N/year and 48.5 tonnes P/year. Figures from ADAS (2012) suggest a total load of 2017 tonnes N/year from agricultural land in the catchment, equivalent to 80% of the total N load estimated in this report from all sources, or 87% of the total if direct discharges to the waterway are excluded. However, both the ADAS figure and the estimates in this report are based on a number of assumptions, different time periods and limited data, so any direct comparisons between figures from the two studies should be treated with caution. The total DIN and DIP load estimates in this study are higher than reported in previous studies (Edwards, 2005; Natural Resources Wales, 2014). This is partly due to increased data availability for the smaller catchments that drain directly into the waterway. Previous nutrient yield estimates for these catchments were based on the average nutrient yields for the rest of the Milford Haven catchment. However, recent monitoring data have shown that some of these catchments (e.g. Winterton Marsh Stream and Llangwm Pill) have elevated nutrient yields compared with the rest of the catchment, so the previous reports may have underestimated their contribution. The estimated DIN load from the Western Cleddau is also higher than in the previous reports, but this is due to higher flows rather than higher DIN concentrations and may therefore simply reflect the influence of stochastic variation in
W.Cleddau (u/s Pelcomb Brook)
21%
E.Cleddau (u/s Narberth Brook)
11%
Cartlett Brook4%Other river/stream
inputs32%
Merlin's Bridge STW13%
Pembroke Dock STW3%
Milford Haven STW5% Other direct STW
discharges11%

Page 31 of 53 www.naturalresourceswales.gov.uk
the weather. This data review has not identified an overall deterioration in water quality in the rivers, STWs or receiving water bodies since the previous reports. River inputs include contributions from point (continuous and intermittent) and diffuse (urban and rural) sources within the catchment area. The following method has been used to apportion the load from point and diffuse contributions in the catchment. The 13 “direct” STWs included in the above source apportionment account for ~82% of the total population equivalent (PE) of all of 44 STWs in the Milford Haven catchment area (based on data provided by Dwr Cymru Welsh Water (DCWW)). If it is assumed that the remaining 21 “indirect” DCWW STWs (i.e. STWs that are upstream of the river sampling points used in this report) have a similar nutrient load per PE as the direct discharges (excluding Pembroke Dock, which has P removal), an estimate can be made of the nutrient contribution from these indirect STWs. Based on this method, figs 17 and 18 show an alternative nutrient source apportionment including all 44 STWs in the catchment area.
Fig.17 Dissolved inorganic nitrogen (DIN) loads to the Milford Haven Waterway, including indirect STWs from the whole catchment area (note that “continuous” includes EPR installations, which may be intermittent)
Continuous point sources
8%
Other92%

Page 32 of 53 www.naturalresourceswales.gov.uk
Fig.18 Dissolved inorganic phosphorus (DIP) loads to the Milford Haven Waterway, including indirect STWs from the whole catchment area
The contribution from combined sewer overflows to the annual nutrient loads discharged to rivers from urban areas is generally insignificant compared with loads from treatment plants (Schütze et al, 2002). Furthermore, the catchment area is predominantly rural, so diffuse urban pollution is also likely to be relatively insignificant compared with the total DIN load to the waterway. Therefore, it is likely that the vast majority of the “other” nutrient loads shown in figs 17 and 18 are comprised of drainage from agricultural land.
The nutrient source apportionment results are further summarised in Table 4.
Continuous point sources
42%
Other58%

Page 33 of 53 www.naturalresourceswales.gov.uk
Table 4. Summary of nutrient loads
Dissolved inorganic nitrogen (DIN)
Dissolved inorganic phosphorus (DIP)
Total EPR permitted water discharge 800 kg/day (292,000 kg/yr)
Not specified
Actual EPR discharge (upper estimate)* ≈ 100 kg/day (≈ 36,500 kg/yr)
No data
Estimated load from aerial emissions* (kg/yr)
9,745 No data
Direct STW discharges (kg/yr) 129,561 15,288
Indirect STW discharges (kg/yr)** 29,497 5,058
Losses from agricultural land (kg/yr)*** 2,018,582 No data
Total load to waterway (kg/yr)**** 2,508,188 48,540
*from EPR-installations in the catchment (Natural Resources Wales, 2014) **upstream of river sampling points used in this report ***Adas, 2012 ****Sum of all river/catchment inputs and direct discharges
The percentage contribution to the total DIN load to the Milford Haven waterway that is derived from agricultural land can be calculated in two ways from the data presented in this report:
1. Express the losses from agricultural land, as reported by ADAS (2012), as a
percentage of the total DIN load to the waterway, as calculated in this report. This
method gives a percentage contribution of ~80% from agricultural land.
2. Estimate the contribution from all non-agricultural sources and subtract this figure
from the total DIN load to the waterway. If it is assumed that intermittent point
sources, other non-STW or non-DCWW point sources and diffuse urban run-off are
insignificant, this method gives a percentage contribution of ~92% from diffuse rural
sources (predominantly agricultural land).

Page 34 of 53 www.naturalresourceswales.gov.uk
As previously mentioned, the first of the above methods may be unreliable as the ADAS figure is not directly comparable to the NRW monitoring data presented in this report. The result will therefore be highly sensitive to the assumptions made for the calculation of the total DIN load to the waterway.
4.2. Overview of WFD
The WFD requires a management plan for each river basin to be developed every six years. The plans are based on a detailed analysis of the impacts of human activity on the water environment and incorporate a programme of measures to improve water bodies where required. The Milford Haven waterway is incorporated in the Western Wales River Basin District. For WFD assessment purposes, the waterway has been subdivided into two separate water bodies: Milford Haven Inner (a transitional water body) and Milford Haven Outer (a coastal water body). The boundary between the two lies just west of the mouth of Pembroke River. Milford Haven Inner at mean low water spring has an available intertidal habitat (AIH – the intertidal area considered to be suitable for opportunistic macroalgal growth) of approximately 900 hectares. Milford Haven Outer at mean low water spring has an intertidal habitat of approximately 300 hectares. The AIH calculated for WFD purposes is shown in Figure 19.
To carry out a WFD biological assessment, each biological quality element (BQE) is required to give a definition of the health of that element in the water body. The health is assessed by comparing the measured conditions (observed value) against reference conditions (minimally disturbed). This is reported as an Ecological Quality Ratio (EQR). EQR is divided into five ecological status classes (High, Good, Moderate, Poor and Bad) that are defined by changes in the biological community in response to disturbance. Once the EQR score and ecological status class have been calculated, an assessment of the confidence of the classification must also be made (WFDUK, 2012).
Formal classifications were produced in 2015, at the end of the second Water Framework Directive (WFD) River Basin Management Cycle, which gave ecological and chemical status for all Transitional and Coastal (TraC) water bodies in England and Wales based on a number of elements. For most of the elements Milford Haven Inner and Outer had classifications of Good or High status. However, both water bodies had a classification of “Moderate” for DIN. WFD operates on a “one out all out” approach, so the overall status for Milford Haven Inner and Outer was reported as Moderate (less than Good status) based on the DIN classification; in the Inner water body, opportunistic macroalgae also drives the overall status to Moderate. Under WFD, all water bodies with less than Good status require an investigation to be carried out to identify reasons for failure and a programme of measures put in place to achieve Good status.

Page 35 of 53 www.naturalresourceswales.gov.uk
Table 5. Summary of Milford Haven WFD 2015 classifications used to inform the assessment
Biological Quality Element
Milford Haven Inner
Confidence of classification
Milford Haven Outer
Confidence of classification
DIN Moderate High confidence it is less than Good
Moderate
High confidence it is less than Good
Opportunistic Macroalgae
Moderate High confidence it is less than Good
Good High confidence it is Good or better
Phytoplankton Saltmarsh Seagrass
High High High
High confidence it is Good or better High confidence it is Good or better High confidence it is Good or better
High Good High
High confidence it is Good or better
High confidence it is Good or better High confidence it is Good or better
Overall Moderate Moderate
4.3. Causative Parameters – elevated nutrients
4.3.1. WFD DIN classifications
4.3.1.1. Milford Haven Inner DIN Classification
The DIN classification for 2015 was Moderate, with high confidence in this classification output. This was based on 186 samples from nine sample stations collected from 2008 – 2015. DIN concentrations ranged from 17.90 to 228.57 µmol with the average DIN concentration value being 74.63 µmol. The DIN data for Milford Haven Inner have remained relatively stable over time, with no significant differences between years.

Page 36 of 53 www.naturalresourceswales.gov.uk
Fig. 19. DIN data used in 2015 Classification with WFD status class boundaries– Milford Haven Inner
4.3.1.2. Milford Haven Outer DIN Classification
The 2015 DIN classification for Milford Haven Outer was based on 106 samples from 5 sites collected between 2008 and 2015. DIN concentrations ranged from to 6.97µmol to 83.88 µmol with an average of 25.72 µmol; salinity ranged from 21.74 to 35.12 ppt. The 2015 DIN classification for Milford Haven Outer was Moderate, with a high level of confidence in this classification output due to the large number of samples available. Given that the catchment area of the Milford Haven Inner water body comprises approximately 89% of the catchment area of the entire waterway, DIN inputs into Milford Haven Inner water body are the main reason that the Outer water body fails for DIN. However, the catchments draining directly to the Outer water body may have higher than average nutrient yields (load per area) than the Milford Haven catchment area as a whole (see Sections 4.1.1 and 4.1.2), so their contribution to nutrient availability within bays and inlets in the Outer water body may be significant.
0
50
100
150
200
250
0 5 10 15 20 25 30 35 40
DIN
(u
mo
l)
Salinity (ppt)
Poor
Moderate
Good
High

Page 37 of 53 www.naturalresourceswales.gov.uk
Fig. 20. DIN data used in 2015 Classification with WFD status class boundaries– Milford Haven Outer
4.3.2. Factors Controlling Algal Growth
Nitrogen is often assumed to be the limiting nutrient for algal growth in coastal waters, while phosphorus is often assumed to be the limiting nutrient in freshwater. Factors limiting algal growth in estuaries are more difficult to identify, due to temporal and spatial variations in salinity, nutrient ratios, water depth, turbidity and other factors. This is especially true for macroalgae, as a complex range of interacting factors are likely to influence its growth, including available inter-tidal habitat and nutrients within the sediment. Nitrogen and phosphorus are utilised for algal production at an atomic ratio of approximately 16:1 (Redfield 1958) although this ratio may vary between species. Therefore, if the ratio of N:P in water differs from 16:1, the nutrient in the shortest supply is likely to limit algal growth. N:P ratios in the Milford Haven waterway are highly variable, both spatially and temporally, and may be much greater or less than 16:1. As such, algal growth may be limited by either N or P at different times and locations within the waterway. In 2011, Environment Agency Wales commissioned Cefas to model the impact of nutrient inputs to the Milford Haven waterway and the likely effectiveness of nutrient removal
0
10
20
30
40
50
60
70
80
90
100
20 22 24 26 28 30 32 34 36
DIN
(u
mo
l)
Salinity (ppt)
Poor
Moderate
Good
High

Page 38 of 53 www.naturalresourceswales.gov.uk
scenarios in controlling macroalgal and phytoplankton growth (Aldridge et al, 2011). Cefas used the dynamic Combined Phytoplankton and Macroalgal (dCPM) model (Aldridge, et al, 2010a, b) which treats a water body as a single well-mixed box with direct nutrients inputs and exchanges of chlorophyll and nutrients with coastal waters. A supplement report was produced in February 2012 using an enhanced version of the model and more detailed analysis of the water quality data (Aldridge et al, 2012). The main conclusions from the model outputs were as follows: For phytoplankton, light was predicted to be the limiting factor during spring, autumn and winter. In summer, phosphorus was predicted to be the main limiting nutrient for both the inner and outer estuary. Macroalgal growth appeared to be constrained primarily by availability of habitat and secondarily, in the inner estuary particularly, by phosphorus limitation. For nitrogen, direct loadings from rivers and STWs are the dominant sources. Sea water entering the waterway is predicted to be the main source of phosphorus in the estuary as a whole. This is due to the higher volume of sea water compared with fresh water, although sea water will have a diluting effect on nutrient concentrations. Changes of ±25% to direct nutrient loadings of N and P were predicted to give rise to relative changes in average summer chlorophyll concentrations in the range ±6% and to relative changes in average summer macroalgal biomass in the range ±9%. An analysis of summer nutrient concentrations was not able to establish clear evidence for nitrogen limitation, nor did it suggest regular phosphorus limitation. However, based on the observational data, it was suggested that, on balance, nitrogen limitation is more likely and it was recommended that the model predictions of phosphorus limitation be treated with caution.
4.4. Category II Response Parameters – evidence of algal growth
Phytoplankton, phytobenthos and macroalgae derive their nutrients from the water column and under the right conditions can colonise, grow and reproduce quickly. As a consequence they tend to respond rapidly to changes in nutrient concentrations.
4.4.1. Opportunistic Macroalgae data used in 2015 WFD Classification
4.4.1.1. Milford Haven Inner Opportunistic Macroalgae Classification
An opportunistic algal species is considered to be able to take advantage of conditions in which other species often struggle to survive or compete. Due to high rates of nutrient uptake and enhanced reproductive capability, they can prevent or stunt growth of perennial

Page 39 of 53 www.naturalresourceswales.gov.uk
algae by excessive abundance and competition for space. Blooms form principally of species of Ulva (including taxa formerly known as Enteromorpha), Chaetomorpha or Cladophora. All potential bloom-forming species occur naturally within intertidal ecosystems (Abbott & Hollenberg, 1976), however the formation of opportunistic macroalgal blooms is considered indicative of anthropogenically elevated nutrient levels when they grow to nuisance proportions. It is apparent that there is an opportunistic macroalgae issue within the Milford Haven Inner water body. Large algal mats consisting primarily of Ulva sp. cover areas of available intertidal habitat within the water body. Opportunistic macroalgae surveys were carried out for WFD monitoring purposes in Milford Haven Inner water body during 2009, 2011, 2012 and 2014. True Colour Aerial imagery was gathered in addition to ground truthing quadrat surveys to obtain information on affected area (AA), biomass, percentage cover and entrainment of opportunistic macroalgae.
Fig. 21. Opportunistic macroalgae at Cosheston Pill, 2012, the most impacted inlet within the Inner water body, during peak growth period. It should be noted that this photograph demonstrates opportunistic macroalgal growth at its most prolific.
During 2012 a high intensity Compact Airborne Spectral Imager (CASI) aerial survey was conducted and associated ground truthing was carried out. This was done primarily to provide a data set with high associated confidence to inform considerations under the UWWT and Nitrates directives, but the data were also used for WFD classifications. Due to adverse weather conditions and limited opportunity to gather data within the survey window, CASI aerial imagery could only be gathered for part of the water body (no aerial

Page 40 of 53 www.naturalresourceswales.gov.uk
imagery was gathered upstream of Garron Pill) resulting in only a partial survey. The AIH for the water body was amended to reflect this proportionately when classifications were generated. An accuracy assessment comparing CASI methods with ‘true colour’ photography interpretations demonstrated that CASI survey interpretation methods give a much lower error than the ‘true colour’ photography interpretations (Geomatics Group, 2011). It is therefore likely that the amount of opportunistic macroalgae predicted by the 2012 CASI survey is closer to the actual amount present than that predicted by the ‘true colour’ photography interpretation. This study also showed that the total area of opportunistic macroalgae predicted by the ‘true colour’ interpretation was 15-20% less than that predicted by the CASI interpretation. This should be noted when considering the classifications as presented in Table 6 below.
There are several metrics that contribute towards overall classification for the WFD opportunistic macroalgae tool. These metrics include: percentage cover of the AIH, total extent of area covered by algal mats (affected area, or AA), biomass (g per m²), and percentage of quadrats containing entrained algae (WFDUK, 2012). The data to support these classifications for the Milford Haven water bodies is summarised in Appendix 3. The metrics are equally weighted and when combined, describe the degree of opportunistic macroalgal growth in sedimentary intertidal areas due to nutrient pressure. The tool has been specifically designed to identify the impact on macroalgae from nutrients and organic enrichment and should detect signs of eutrophication (WFDUK, 2012)

Page 41 of 53 www.naturalresourceswales.gov.uk
Table 6. Summary of opportunistic macroalgae monitoring in Milford Haven Inner 2009 - 2014
Year Method AA (hectares)
Average biomass per m² of AA, wet weight (g)
AA/AIH (%) Entrained macroalgae (%)
Classification
Classification
2009 True Colour Aerial Photography
114.24
1049.71
12.85 14.01 Moderate
Moderate
2011 True Colour Aerial Photography
147.36
1377.33
16.53 0 Good*
Good
2012 2014
Compact Airborne Spectral Imager (CASI) True Colour Aerial Photography
219.47 140.5
1538.78
1199.19
40.8** 0 Moderate 15.61 3.81 Moderate
Moderate
*The classification for 2011 is “Good” but the EQR is 0.61 therefore very close to the Good/Moderate boundary (0.60); further supporting information can be found in Appendix 3 ** As aerial imagery was not obtained for the entire water body (adverse weather conditions meant that the area upstream of the Carew River was not captured) an amended AIH value of 537.5 hectares was used to represent the area of Milford Haven captured by CASI in 2012. The total AIH value for Milford Haven Inner water body is 900.36 hectares. The overall classification for opportunistic macroalgae within the Milford Haven Inner water body is Moderate. These results indicate adverse ecological effects, resulting from DIN failures within the water body.
4.4.1.2. Milford Haven Outer Opportunistic Macroalgae Classification
Opportunistic macroalgae monitoring in Milford Haven Outer was undertaken in 2009, 2011, 2012 and 2014. A summary of the results is given in Table 7. It should be noted that the 2012 survey took place in September which is considered to be late in the survey season.

Page 42 of 53 www.naturalresourceswales.gov.uk
The overall classification for opportunistic macroalgae based on data from 2008 to 2015 is Good with high confidence in this classification. The macroalgae monitoring data indicate that there is no adverse ecological effect of the DIN failure in Milford Haven Outer at water body level and that macroalgal growth is below the threshold values that denote eutrophication. However, it is apparent from the monitoring data that opportunistic macroalgae are present in the more sheltered bays and inlets in Milford Haven Outer water body.
Table 7. Summary of opportunistic macroalgae monitoring in Milford Haven Outer 2009 - 2014
Year Method AA (hectares)
Average biomass per m²
of AA, wet weight (g)
AA/AIH (%)
Entrained Classification Macroalgae (%)
2009 True Colour Aerial Photography
49.44
350.81
16.19
2.8 Good
2011 True Colour Aerial Photography
63.18
924.99
20.69
0 Good
2012 Compact Airborne Spectral Imager (CASI)
56.56
572.18
18.52
0 Good
2014 True Colour Aerial Imagery
96.4
489.04 31.57 0 Good

Page 43 of 53 www.naturalresourceswales.gov.uk
Fig. 22. Available Intertidal Habitat (AIH) within the Milford Haven waterway. Habitat included in the AIH value consists of mud, muddy sand, sandy mud, stony mud and mussel beds, from mean high water spring to mean low water spring. Habitat excluded from the AIH value includes areas of permanent rock, cobbles, saltmarsh (excluding pioneer saltmarsh), highly exposed sandy, highly coarse sediments and other highly mobile sediments.

Page 44 of 53 www.naturalresourceswales.gov.uk
Fig. 23. Opportunistic Macroalgae cover within the Milford Haven waterway, 2014
4.4.2. Phytoplankton data used in 2015 Classification
4.4.2.1. Milford Haven Inner Phytoplankton Classification
Monitoring results in Milford Haven Inner water body from 2010 to 2015 demonstrate that the water body classifies as High (better than Good) status for phytoplankton. This is based on 79 samples taken from 6 sites collected from 2007 to 2014. The confidence of classification status being ‘Good or better’ for phytoplankton is 100%. This classification output confirms there is not an issue with phytoplankton blooms within the water body and that chlorophyll concentrations are generally low and do not exceed a salinity-adjusted standard representing a significant bloom. This classification demonstrates that phytoplankton is clearly not a problem in the Milford Haven waterway.

Page 45 of 53 www.naturalresourceswales.gov.uk
4.4.2.2. Milford Haven Outer Phytoplankton Classification
The 2015 phytoplankton classification for Milford Haven Outer was based on 71 samples from 4 sites collected between 2007 and 2014. The overall phytoplankton classification (including metrics Chlorophyll a, Elevated Counts and Seasonal Succession) is ‘High’ with high confidence. The phytoplankton monitoring and subsequent classification demonstrates that phytoplankton blooms are not of concern and chlorophyll concentrations are within the standard for coastal waters. The phytoplankton monitoring does not indicate an adverse ecological effect of the DIN failure in Milford Haven Outer.
4.4.3. Additional Data Used in the Assessment of Category II response parameters
4.4.3.1. Opportunistic macroalgae seasonal biomass survey
In order to further substantiate the evidence base of excessive algal growth attributable to eutrophication, seasonal biomass surveys have been established within the waterway at two sample stations in Pembroke River and one at Cosheston Pill within Milford Haven Inner water body. The surveys consist of quadrat data including biomass and percentage cover estimations being gathered for alternating months over the entire year for a minimum of three years. The first of these surveys commenced in September 2012 and they continue to be carried out. UKTAG Guidance (2007) states that 'consistent algae cover over the winter months in excess of 50g/m² would trigger concern'. Overwintering surveys found average biomass values did not regularly exceed this threshold, aside from one occurrence at Pembroke River West in January 2013. CCW have previously expressed concerns relating to opportunistic macroalgae persisting over the winter months, as cited in the 2009 Report (CCW, 2009(a)).
4.4.3.2. Further reports and historical studies
A report by CCW (2009b) contains aerial photographs of some bays and inlets showing between year comparisons of opportunistic macroalgal growth, including Langwm, Garron Pill and Sandy Haven, from 1983 – 2006.This demonstrates there has been a long standing presence of opportunistic macroalgae at some locations within the Milford Haven waterway even though there is only quantitative data available in more recent years (from 2007 onwards).
Various ground-based photos collected by the EA from 2007 onwards show opportunistic macroalgae growth on the intertidal areas in some locations within the waterway.
CCW photographs taken between 2007 and 2013 are available demonstrating affected areas from the same vantage points year-on-year.

Page 46 of 53 www.naturalresourceswales.gov.uk
Dissolved oxygen data from the Milford Haven waterway gathered for WFD purposes showed no evidence of oxygen depletion or supersaturation as a result of algal blooms.
4.5. Category III – Secondary and other effects – evidence of undesirable ecological disturbance
WFD opportunistic macroalgae survey results have shown that high percentages of quadrats contain anoxic layers within 2cm of the surface. 2014 data show the percentage of quadrats demonstrating anoxia as 76.7% and 73.3% for Milford Haven Inner and Milford Haven Outer water bodies respectively. Anoxia was consistently present throughout macroalgae beds with similar values between years, e.g. at Pembroke River. Anoxia is indicative of disturbance to the underlying benthos however it should be noted that there is no available quantitative data on the underlying benthic communities.
In some areas within the Milford Haven waterway, the nationally protected eel grass Zostera noltei is being outcompeted by opportunistic macroalgae. According to surveyors, in some locations eelgrass and opportunistic macroalgae coexist without encroachment but elsewhere it is apparent the opportunistic macroalgae is outcompeting the eelgrass and dead or decaying eelgrass has been found underneath the opportunistic macroalgae. However this is not reflected in the overall WFD classifications and eelgrass is currently classifying as “High” in both water bodies.

Page 47 of 53 www.naturalresourceswales.gov.uk
Figure 24: Opportunistic macroalgae growing over Zostera noltei (dwarf eelgrass); Pembroke River at Pennar, within the Inner water body, 2014
In some areas, there is evidence of opportunistic macroalgae growing over pioneer saltmarsh. This has not been systematically quantified and overall classifications for saltmarsh do not reflect this pressure however there photographic evidence exists from areas where pioneer saltmarsh and opportunistic macroalgae are both present.

Page 48 of 53 www.naturalresourceswales.gov.uk
Figure 25: Opportunistic macroalgae growing over Salicornia spp. (pioneer saltmarsh) at Angle, 2014

Page 49 of 53 www.naturalresourceswales.gov.uk
Table 8. Evidence of undesirable disturbance attributable to eutrophication Date/ frequency of occurrence
Reporter
Description of occurrence
Annually Unknown Annually 2009 Annually (2014/2015)
Bill Hurst, Habourmaster, Milford Haven Port Authority complaint via Welsh Government Fisheries Advisory Group to NRW Milford Haven Water Ranger CCW RWE
Reports of detached rafts of opportunistic macroalgae getting entangled in propellers of boats and interfering with boating activities. Reports of detached rafts of opportunistic macroalgae interfering with fishing – fishermen have complained about net clogging Reported occurrences of opportunistic macroalgae rafts accumulating on slipways in the Inner Haven Report containing images of detached rafts of decomposing opportunistic macroalgae smothering saltmarsh habitat.
There has been a reported presence of detached opportunistic macroalgae accumulating at the cooling water intake at Pembroke Power Station, within Milford Haven Inner water body. In the 2 full years of station operations there appears to be a pattern emerging with regards to algae ingress at the intake. During spring/early summer detached macroalgae was present at the intake in increasing volumes, this then eases and is replaced during late summer/ autumn with increasing volumes of seagrass. The exact volumes varied from day to day, anecdotally it is thought that increased volumes of both appear to be related to spring tides and wind direction, although this has not been systematically documented. Volumes of opportunistic macroalgae required the operators to increase visits to the intake to manually remove the weed from the cooling water system, but this has been done relatively easily and to date, no operational issues have arisen as a result.

Page 50 of 53 www.naturalresourceswales.gov.uk
5. Conclusion Opportunistic macroalgae, phytoplankton and nutrients data have been reviewed in this and previous studies undertaken for UWWT and Nitrates Directives and WFD. Milford Haven waterway is at Moderate status and hypernutrified compared to WFD nutrient standards. Phytoplankton blooms do not occur in the waterway, but within the sheltered bays and inlets there is widespread and often dense growth of opportunistic macroalgae species, primarily Ulva sp. Evidence from WFD monitoring in the Milford Haven Inner water body shows that dissolved inorganic nitrogen (DIN) levels are Moderate and this is reflected in the opportunistic macroalgae classification, which also is at Moderate status. Therefore, this transitional water body is currently failing to meet Good status, which is required for WFD compliance by 2027. The WFD DIN classification demonstrates that the waters of the Milford Haven Outer water body are also at Moderate status hyper-nutrified according to WFD standards, but assessments did not demonstrate failures of phytoplankton or opportunistic macroalgae quality elements at water body level. There is localised evidence of impacts from excessive macroalgal growth on eelgrass and saltmarsh habitats but this is not reflected in overall water body classifications for these elements, which achieve at least Good status in both water bodies. No data have been collected regarding potential impacts to the underlying benthic invertebrate communities as these data are costly to gather and resources were not available to do so. There are classification data available for benthic invertebrate communities, but these have been generated using sub tidal samples and hence are not from areas of opportunistic macroalgae occurrence so are not of relevance to this assessment. Most of the DIN entering the waterway from the catchment area comes from agricultural land, whereas only ~8% of the DIN load is attributable to continuous point sources such as sewage treatment plants and industrial discharges. A higher proportion of the dissolved inorganic phosphorus (DIP) load (~42%) comes from continuous point sources. Previous modelling studies have indicated that both nitrogen and phosphorus concentrations may be important in controlling algal growth, depending on location within the waterway, time of year, weather and tidal state. However, based on the observational data, it was suggested that, on balance, nitrogen limitation is more likely. There is no evidence of an increasing trend in nutrient (DIN or DIP) loads entering the waterway or nutrient concentrations within the waterway. Minimum data requirements for each parameter considered in this assessment have been achieved in all cases. On the balance of evidence available, there is evidence in all three categories for the designation of the Milford Haven Inner water body. For Milford Haven Outer water body, there is evidence of nutrient failures and more localised “Category II” response parameter impacts, however these Category II impacts are not reflected in the overall classification for opportunistic macroalgae in the Outer water body. Evidence of

Page 51 of 53 www.naturalresourceswales.gov.uk
Category III secondary response parameters to nutrient enrichment are present within both water bodies, however it is acknowledged this evidence is limited.
Summary of available evidence
Milford Haven Inner
Category I: Nutrient enrichment: WFD DIN failure Category II: Response Parameters: WFD Opportunistic Macroalgae failure Category III: Secondary response parameters: High percentages of anoxia in surface sediments; impacts of eutrophication on water use i.e. fishing activities, navigation and cooling water processes at Pembroke Power Station, evidence of localised impacts to seagrass and pioneer saltmarsh; this is not reflected in water body level classifications.
Milford Haven Outer
Category I: Nutrient enrichment: WFD DIN failure Category II: Response Parameters: localised issues of opportunistic macroalgae blooms in sheltered inlets and embayments but this is not reflected in classification at water body level. Category III: Secondary response parameters: High percentages of anoxia in surface sediments; impacts of eutrophication on water use i.e. fishing activities and navigation, evidence of localised impacts to pioneer saltmarsh; this is not reflected in water body level classifications.
It is recommended that a case for designation under the provisions of the Nitrates Directive should be made for the catchment area draining into the Milford Haven Inner water body. This is supported by evidence in all three of the categories that this assessment is based upon, however it should be noted that Category III evidence is limited. For the Outer Water body there is also evidence to suggest the waters are hypernutrified (it is failing for DIN) however the Category II evidence does not support a case for designation as macroalgal growth is more localised in the Outer water body and it is not failing for opportunistic macroalgae or phytoplankton. It is therefore recommended that monitoring of the Outer water body is continued and reviewed at the next 4-yearly review period. Water bodies may remain at Moderate status for a long time after pressures have been reduced, due to delayed soil leaching/runoff response, internal loading and/or time-lagged response in the biological quality elements.

Page 52 of 53 www.naturalresourceswales.gov.uk
6. References Abbott, I.A. & Hollenberg, G.J. (1976). Marine Algae of California. Stanford University Press, Stanford, California, 827.
Adas Uk Ltd, (2012). Nitrogen inputs in the Milford Haven catchment. Submitted to RPS Group.
Aldridge J.N., P. Tett, S.J. Painting, E. Capuzzo, D.K. Mills, (2010)a. The dynamic Combined Phytoplankton and Macroalgae (CPM) Model: User Guide. Contract C3290 Report, Environment Agency.
Aldridge J.N. , P. Tett, S.J. Painting, E. Capuzzo, D.K. Mills,(2010)b. The dynamic Combined Phytoplankton and Macroalgae (CPM) Model: Technical Report. Contract C3290 Report, Environment Agency.
Aldridge. J, Painting. S., (2011). Milford Haven: Modelling assessment. Version 6. Environment Agency.
Aldridge. J, Foden. J, Painting, S., (2012). Milford Haven: Modelling assessment. Supplement report. Version 6. Environment Agency.
Countryside Council for Wales (2009a). Advice provided by the Countryside Council for Wales in Fulfilment of Regulation 33 of the Conservation (Natural Habitats &C) Regulations 1994.
Countryside Council for Wales (2009b). Milford Haven Waterway, Pembrokeshire, Water Quality Issues – Ecological Indicators and photographic Evidence of Excess Nutrients.
Edwards, P. (2005). An assessment of eutrophication risks and impacts in the Milford Haven Waterway. Environment Agency Wales Report No. EATW/05/03.
Environment Agency Guidance: Monitoring & Assessment for Eutrophic Designations under the Urban Waste Water Treatment Directive and the Nitrates Directive. Guidance number 23_06
Environment Agency Guidance (June 2011): Method Statement for Nitrate Vulnerable Zone review.
Environment Agency Report: A preliminary assessment of candidate eutrophic designations under the Nitrate and Urban Waste Water Treatment Directives in South Wales. Sally Richardson. Technical memo no: TMW09_07

Page 53 of 53 www.naturalresourceswales.gov.uk
Environment Agency Report: An updated assessment of eutrophication risks and impacts in the Milford Haven Waterway 2009. Ruth Mitchell. Technical memo no: TMW09_10
Environment Agency Report: Interpretation of Green macroalgae extent, Geomatics Group, 2011. Crispin Hambidge and Kyle Brown. Memo no: PM_1125
European Commission. Common Implementation Strategy for the Water Framework Directive (2000/60/EC) Guidance Document 23. Guidance Document on Eutrophication Assessment in the Context of European Water Policies. 2009.
Natural Resources Wales (2014) Environmental Pressures on the Milford Haven Waterway, Report reference A&R/SW/14/1
Redfield, A.C. (1958).The biological control of chemical factors in the environment. American Scientist 46, 205-221
Robinson, K., 2009a. Milford Haven Waterway, Pembrokeshire. Evidence of eutrophication and recommendation for/against making a case for designation as a sensitive area/polluted water
Schütze, M., Butler, D. & Beck, B.M. (2002) Modelling, Simulation and Control of Urban Wastewater Systems. Springer-Verlag London 2002.
Tett, P., Gowen, R., Mills, D., Fernandes, T., Gilpin, L., Huxham, M., Kennington, K., Read, P., Service, M., Wilkinson, M., Malcolm, S., Defining and detecting undesirable disturbance in the context of eutrophication. Marine Pollution Bulletin 55 (2007)282-297.
UKTAG. Marine Task Team. Marine Nutrients Thresholds and Turbidity. 2 February 2007
WFDUK, 2012. Practitioners Guide to the Opportunistic Macroalgal Blooming Tool Version 08. 071212