evidence review group report commissioned by the nhs r&d
TRANSCRIPT
Page 1 of 84
Evidence Review Group Report commissioned by the NHS R&D Programme on behalf of NICE
Prucalopride for the treatment of women with chronic constipation in whom standard laxative regimens have failed to provide
adequate relief
Produced by West Midlands Health Technology Assessment Collaboration
Authors Mary Pennant, Systematic reviewer Rosa Orlando, Health economist Pelham Barton, Senior lecturer in health economics Sue Bayliss, Information specialist Kristina Routh, Public Health Specialist Registrar Catherine Meads, Senior lecturer in HTA
Correspondence to Mary Pennant Department of Public health, Epidemiology & Biostatistics University of Birmingham Edgbaston, Birmingham B15 2TT Email [email protected]
Date completed 10th June 2010
Source of funding: This report was commissioned by the NIHR HTA Programme as project number 09/99/01 Declared competing interests of the authors: none Acknowledgements Ellen Sainsbury – administrator, Linda Briscoe – Project Manager, Dr Jason Goh – Consultant Gastroenterologist. Responsibility for report The views expressed in this report are those of the authors and not necessarily those of the NIHR HTA Programme or the National Institute for Health and Clinical Excellence. This report should be referenced as follows: Pennant M, Orlando R, Barton P, Bayliss S, Routh K, Meads C. Prucalopride for the treatment of chronic constipation in women: A Single Technology Appraisal. WMHTAC, University of Birmingham 2010 Contributions of authors Pennant, Routh, Meads – critical appraisal of clinical effectiveness, Orlando, Barton, critical appraisal of economic modelling, Bayliss – searches, all - writing the report
Copyright 2010 Queen's Printer and Controller of HMSO. All rights reserved.

Page 2 of 84
Copyright 2010 Queen's Printer and Controller of HMSO. All rights reserved.

Page 3 of 84
Contents 1 SUMMARY .................................................................. 5
1.1 Scope of the submission .................................................................... 5 1.2 Summary of submitted clinical effectiveness evidence ...................... 5 1.3 Summary of submitted cost effectiveness evidence .......................... 6 1.4 Commentary on the robustness of submitted evidence ..................... 6
1.4.1 Strengths .................................................................................... 6 1.4.2 Weaknesses ............................................................................... 7 1.4.3 Areas of uncertainty .................................................................... 8
1.5 Key issues ......................................................................................... 9 2 BACKGROUND .......................................................... 9
2.1 Critique of manufacturer’s description of underlying health problem . 9 2.2 Critique of manufacturer’s overview of current service provision ..... 11 3 Critique of manufacturer’s definition of decision
problem .......................................................................... 12 3.1 Population ........................................................................................ 12 3.2 Intervention ...................................................................................... 13 3.3 Comparators .................................................................................... 13 3.4 Outcomes ........................................................................................ 14 3.5 Time frame ...................................................................................... 14 3.6 Other relevant factors ...................................................................... 15
4 CLINICAL EFFECTIVENESS ................................... 15 4.1 Critique of manufacturer’s approach ................................................ 15
4.1.1 Description of manufacturers search strategy .......................... 15 4.1.2 Inclusion/exclusion criteria used for study selection ................. 16 4.1.3 Included and excluded studies ................................................. 17 4.1.4 Details of any relevant studies that were not included .............. 19 4.1.5 Description and critique of manufacturers approach to validity assessment ............................................................................................. 20 4.1.6 Description and critique of manufacturers outcome selection .. 20 4.1.7 Describe and critique of the statistical approach used .............. 21 4.1.8 Summary statement ................................................................. 21
4.2 Summary of submitted evidence ..................................................... 22 4.2.1 Summary of results ................................................................... 22 4.2.2 Critique of submitted evidence syntheses ................................ 38 4.2.3 Summary .................................................................................. 47
5 ECONOMIC EVALUATION ....................................... 48 5.1 Overview of manufacturer’s economic evaluation ........................... 50
5.1.1 Natural history .......................................................................... 51 5.1.2 Treatment effectiveness within the submission ........................ 51 5.1.3 Health related quality of life ...................................................... 54 5.1.4 Resources and costs ................................................................ 57 5.1.5 Discounting ............................................................................... 57 5.1.6 Sensitivity analyses .................................................................. 57 5.1.7 Model validation........................................................................ 57
5.2 Critique of approach used ................................................................ 58 5.3 Results included in manufacturer’s submission ............................... 63
Copyright 2010 Queen's Printer and Controller of HMSO. All rights reserved.
Page 4 of 84
5.4 Validity of results ............................................................................. 66 5.5 Summary of uncertainties and issues .............................................. 67
6 Additional work undertaken by the ERG ............... 68 6.1 Simplifying the model....................................................................... 68 6.2 Alternative model runs completed ................................................... 69
7 Discussion ................................................................ 73 7.1 Summary of clinical effectiveness issues ......................................... 74 7.2 Summary of cost effectiveness issues ............................................. 75 7.3 Implications for research .................................................................. 76 Appendix 1: Additional ERG searches ....................................................... 77
Appendix 2: Quality Assessment using ScHARR-TAG economic modelling checklist ..................................... 79
Copyright 2010 Queen's Printer and Controller of HMSO. All rights reserved.
Page 5 of 84
1 SUMMARY
1.1 Scope of the submission
The NICE scope of this project was to assess the clinical effectiveness and
cost effectiveness of prucalopride in the treatment of chronic constipation in
women in whom laxatives fail to provide adequate relief.
1.2 Summary of submitted clinical effectiveness evidence
There were 36 trials/studies listed and information from nine of these was
used to inform the clinical effectiveness part of the submission. Trial
participants were adult and elderly men and women with chronic constipation.
It appears that many participants in these trials had not failed previous
laxative use and the spread of baseline predicted EQ-5D scores suggested
than all patients were unlikely to have had severe chronic constipation. The
intervention in the studies was oral prucalopride at dose 1mg, 2mg or 4mg per
day and the comparators were placebo or a different dose of prucalopride.
Rescue treatment with a laxative (bisacodyl) or an enema was used in both
arms of the pivotal RCTs. Outcome results given were spontaneous complete
bowel movements (SCBMs), spontaneous bowel movements (SBMs),
bisacodyl/enema use, symptoms (including PAC-Sym), quality of life (PAC-
QOL, SF-36) and adverse events. The primary outcome was the proportion of
patients with average ≥3 SCBMs/week at weeks 4 and 12 and there was a
statistically significant improvement in this outcome in the 2mg prucalopride
arm (licensed dose in adult women) compared to placebo for adults in the
three pivotal RCTs (INT-6, USA-11, USA-13). Although two RCTs used to
inform the economic model were in elderly patients, only one was fully
described in the submission (INT-12) and this did not show a significant
improvement in the primary outcome measure of the proportion of patients
with ≥3 SCBMs/week at week 4 in the 1mg prucalopride arm (licensed dose in
elderly women) compared to placebo.
Copyright 2010 Queen's Printer and Controller of HMSO. All rights reserved.

Page 6 of 84
1.3 Summary of submitted cost effectiveness evidence
There were no published economic evaluations of prucalopride in chronic
constipation. A de novo cost effectiveness model was submitted. This model
had a one year time horizon and stated that it estimated increased costs and
QALY gain from the use of prucalopride in a population for whom laxative
treatment had failed. The only cost included in the model was the cost of
prucalopride: it was assumed that other costs would be at least as high
without prucalopride as with prucalopride, and therefore the costing
assumption was stated to be conservative. QALY gains were estimated by a
range of regression equations. Two different stopping rules were applied to
determine whether patients had responded to treatment. Non-responders at 4
weeks were assumed to stop treatment at 4 weeks, and to have gained no
benefit from the treatment. The model structure calculated an ICER for a large
number of simulated individual patients: the variation here is a mixture of
parameter uncertainty and variability in individual patient characteristics. The
quoted ICERs were based on two separate patient groups: Adults (under 65)
at a dose of 2mg daily, and Elderly (over 65) at a dose of 1mg daily. Overall
ICERs were given as well as the ICERs for these two groups separately. The
manufacturer’s base case result using the primary clinical endpoint of at least
3 spontaneous complete bowel movements (SCBM) per week gave an overall
ICER of £15,700/QALY (£16,800/QALY for adults, £11,700/QALY for elderly).
Using the secondary endpoint (an increase of at least 1 SCBM per week)
gave reported ICERs of £18,000/QALY overall (£18,000/QALY for adults,
£15,800/QALY for elderly).
1.4 Commentary on the robustness of submitted evidence
1.4.1 Strengths
There is a considerable quantity of clinical effectiveness evidence in adults
that consistently suggests an improvement in constipation from prucalopride
compared to placebo. Some of the prucalopride RCTs are available as peer-
reviewed publications.
Prucalopride is a relatively inexpensive drug at £2.13 per 2mg tablet.
Copyright 2010 Queen's Printer and Controller of HMSO. All rights reserved.
Page 7 of 84
1.4.2 Weaknesses
There are a number of weaknesses in the clinical evidence and the economic
modelling
• The trials were conducted in adults rather than women only and it
appears that the licence was based on a post-hoc subgroup analysis.
There were approximately 10% of men and 90% of women in the
pivotal RCTs.
• It appears that many patients responded to the use of bisacodyl
treatment during the trials. Therefore many patients did not appear to
be laxative-refractory and so do not fall into the licensed indication.
• Results for adverse events were only given where they affected more
than 5% of participants in any arm of the pivotal trials. Therefore, rarer
serious side effects, such as cardiovascular events, might be missed.
• EQ-5D was not measured in the pivotal trials and no literature on EQ-
5D results were available for chronic constipation. SF-36 was
measured but this was not used in the economic modelling. Most of the
SF-36 results for the pivotal trials showed no significant differences. A
disease-specific quality of life measure was used instead (PAC-QOL)
which was then converted to EQ-5D using a mapping equation. This
mapping equation appears to have been specifically developed for
prucalopride.
• A large number of scenarios were explored in the economic model but
these were not described in the submission.
• The design of the economic model has a number of weaknesses.
• The probabilistic sensitivity analysis (PSA) is based on a mixture of
patient variability (in terms of baseline EQ-5D) and parameter
uncertainty (in terms of regression coefficients). The ICERs reported in
the submission are the 50% points from this PSA and not based on the
mean results, although the difference is small.
• No account has been taken of adverse events
• Some results were only given in terms of the overall population. It is
important to separate the two age groups: adult and elderly
Copyright 2010 Queen's Printer and Controller of HMSO. All rights reserved.

Page 8 of 84
• The model only allowed for variation in the response rate and mean
treatment rates to be addressed through the “compliance” figure.
Uncertainty in this figure was not included in the probabilistic analysis.
• No explicit allowance was made for withdrawal from treatment at any
time after 4 weeks.
1.4.3 Areas of uncertainty
• Since trials were not conducted in the appropriate type of patients, it is
uncertain how effective prucalopride is in the patient group for which it
is licensed: women who are refractory to laxatives.
• It is uncertain how effective prucalopride is compared to the other
comparators specified in the NICE scope decision problem, i.e.
invasive procedures and bowel surgery.
• The relative long-term effectiveness of prucalopride compared to
placebo is uncertain. The effectiveness results suggested a small
comparative reduction in effectiveness between 4 and 12 weeks. High
rates of patient drop-out from extension studies were likely to give an
optimistic estimate of long-term effectiveness. Extension studies were
only in patients given prucalopride (and not placebo) so no comparative
evidence is available beyond 12 weeks.
• No meta-analysis of trial results was conducted, yet “pooling of clinical
data” was conducted for the economic modelling. It is uncertain how
this was done.
• It is uncertain how the differences in trial populations compared to the
scope of the appraisal would affect cost-effectiveness. However, if 20%
of participants in the pivotal trials had not previously used laxatives,
they would be more likely to respond to any treatment, compared to
those who had tried a number of previous laxatives. Therefore, the
effectiveness would appear to be greater, which would improve the
cost effectiveness.
• It is unclear how using the SF-36 results would have affected the cost
effectiveness estimates. As there were mostly no significant differences
in SF-36 results for the pivotal trials, it is possible that the calculated
cost effectiveness results would have been higher.
Copyright 2010 Queen's Printer and Controller of HMSO. All rights reserved.
Page 9 of 84
• The clinical effectiveness results actually used in the economic
modelling are unclear, as several of the studies used in the model (INT-
1, INT-2, USA-3, GBR-4, FRA-1, USA-26) are not fully described in the
submission.
• The assumption that the last measured QALY gain is sustained for the
rest of the year is not tested in the model
1.5 Key issues
• It is likely that the effectiveness of prucalopride has been
overestimated, due to issues to do with patient selection, comparator
used, outcomes used or not used and extension study issues in the
trials and studies where this information was made available.
• There are unsubstantiated assumptions relating to the long-term (52
weeks) effectiveness of prucalopride.
• There is a lack of transparency around patients and trial and study
results used to inform the economic model
• The data used for mapping effectiveness to EQ-5D was not made
available.
• If the regression results are to be believed, it is possible that
prucalopride is cost-effective. However, the lack of transparency in the
results from the 10 prucalopride trials and studies feeding into the
economic model and the lack of transparency over the EQ-5D mapping
means that it is not possible to establish a more accurate estimate of
cost effectiveness.
2 BACKGROUND
2.1 Critique of manufacturer’s description of underlying health problem
Section 2 (pg 18-21) of the submission gives an adequate description of the
aetiology of chronic constipation. The submission briefly describes the
different underlying causes and then gives the definition of chronic
constipation as classified according to the Rome III criteria. These criteria are
Copyright 2010 Queen's Printer and Controller of HMSO. All rights reserved.

Page 10 of 84
the presence of two or more of the following symptoms for at least three
months with symptom onset at least six months prior to diagnosis:
• Straining during at least 25% of defecations;
• Lumpy or hard stools in at least 25% of defecations;
• Sensation of incomplete evacuation for at least 25% of defecations;
• Sensation of anorectal obstruction/blockage for at least 25% of
defecations;
• Manual manoeuvres to facilitate at least 25% of defecations (e.g., digital
evacuation, support of the pelvic floor);
• Fewer than 3 defecations per week.
These criteria define chronic constipation but the description of underlying
health problem lacks further detail on the aetiology of disease in the specific
group of patients for whom prucalopride may be indicated: those with chronic
constipation that is refractory to laxative treatment. Although there may not be
clearly defined criteria for the classification of these types of patients, a better
distinction could have been drawn between those suffering from chronic
constipation in whom laxative treatments bring some degree of success and
those patients in whom a range of types of laxatives have been tried with no
success. These patients, in whom prucalopride may be a last option to avoid
invasive treatments, have more severe disease than the general population
with chronic constipation and this distinction should have been made clear in
the description of the underlying health problem.
In the submission (p 19) it is assumed that10% of constipation patients are
dissatisfied or refractory to laxatives. This suggests that people who are
dissatisfied with laxatives should be considered as those who are refractory to
laxitives. The prucalopride SPC lists the indication as “women in whom
laxatives fail to provide adequate relief”. It may be more appropriate to
consider just those patients who are refractory to a number of laxatives, in
whom there are no other treatments available.
Copyright 2010 Queen's Printer and Controller of HMSO. All rights reserved.

Page 11 of 84
2.2 Critique of manufacturer’s overview of current service provision
The introduction section of the submission is not referenced and it is therefore
unclear on what basis assertions have been made. Details of the conventional
clinical pathway for patients with chronic constipation are not properly
described and there is no description of the classes and specific types of
laxative treatment that are used in current practice. This would have been
helpful in order to give a clear impression of the patients that would be eligible
for treatment with prucalopride (licensed for those failing previous laxative
treatments).
In the British National Formulary 20101
• Bulk-forming laxatives – Relieve constipation by increasing faecal mass
which stimulates peristalsis. These laxatives include ispaghula husk,
methylcellulose and sterculia.
laxatives and bowel cleansing
preparations are divided into five classes as follows:
• Stimulant laxatives – increase intestinal motility and include bisacodyl,
dantron, docusate sodium, glycerol, senna and sodium picosulfate.
• Faecal softeners - Act by softening faeces. They can also lubricate the
faecal matter, enabling it to pass more easily through the intestine and
include Arachis oil and liquid paraffin.
• Osmotic laxatives – These increase the amount of water in the large
bowel, either by drawing fluid from the body into the bowel or by
retaining the fluid with which they were administered. Osmotic laxatives
can be administered orally, for example lactulose, macrogols and
magnesium salts or as rectal solutions, for example phosphates and
sodium citrate (enemas).
• Peripheral opioid-receptor antagonists – for people with opioid-induced
constipation in palliative care, for example methylnaltrexone.
Bulk-forming laxatives may be the safest type of laxatives for long-term use
because their action is similar to the natural action of fibre in food. People 1 Anon. British National Formulary 59. BMJ Group/ Parmaceutical Press, London 2010.
Copyright 2010 Queen's Printer and Controller of HMSO. All rights reserved.

Page 12 of 84
need to drink plenty of water when taking these laxatives because the bulky
stools may otherwise eventually block the intestine. Side effects of bulk-
forming laxatives may include excess intestinal gas, abdominal pain and
bloating.
3 Critique of manufacturer’s definition of decision problem
This critique of the manufacturer’s definition of the decision problem relates to
the manufacturer’s statement of the decision problem in comparison with the
scope set out by NICE. A discussion of the appropriateness of populations,
interventions, comparators and outcomes used for the submission and the
included prucalopride trials can be found in the ‘critique of submitted evidence
synthesis’ (section 4.2.2.1) part of this report.
3.1 Population
In the NICE scope, the population is defined as: “Women with chronic
constipation in whom standard laxative regimens have failed to provide
adequate relief and for whom more invasive procedures such as direct rectal
intervention, are being considered” whereas, in the submission, this is
amended to: “Women with chronic constipation in whom standard laxative
regimens have failed to provide adequate relief.”
In clinical practice, following failure of treatments with laxatives, treatment
strategies may vary between patients. However, for most patients, if all
laxative strategies have been tried, direct rectal intervention is likely to be
considered. Although the decision problem is not inaccurate, the change
made from the scope to the decision problem relaxes the scope’s emphasis
that the patients for consideration in this submission should be those that
have undergone numerous laxative treatments and end-of-the-line measures
are being considered.
However, as discussed later in the critique of submitted evidence (see section
4.2.2), of greater concern in relation to the population is that patients in the
Copyright 2010 Queen's Printer and Controller of HMSO. All rights reserved.
Page 13 of 84
included trials do not meet the requirements of the decision problem and do
not reflect patients for whom this drug is licensed.
3.2 Intervention
The technology is Prucalopride (trade name Resolor). Prucalopride is not
considered to fall into one of the five classes of laxative treatments. It belongs
to a subgroup of drugs that act on serotonin receptors (serotonin (5-HT4)
receptor agonist) that act on the colon to stimulate motility. It has marketing
authorisation for the symptomatic treatment of chronic constipation in women
in whom laxatives fail to provide adequate relief but is not licensed in men.
However, since it does not appear to have a hormone-related mode of action,
it is unclear why there would be a different level of effectiveness in men. It is
licensed at doses of 1mg in adult women and elderly women (over 65) and
2mg in adult women.
3.3 Comparators
The comparators outlined in the scope were a) standard therapy without
prucalopride, b) invasive procedures such as rectal interventions (including
enemas, suppositories and manual evacuation), c) bowel surgery. In the
submission decision problem, this is reduced to only a) standard therapy
without prucalopride.
The justification in the submission for removal of invasive procedures and
bowel surgery as comparators is that these are not direct comparators.
However, after failure with all laxative treatments, it is likely that more invasive
treatments would be used (personal communication, Dr J Goh, Queen
Elisabeth Hospital Birmingham, May 2010) and the removal of these
procedures as comparators appears unjustified. However, of greater concern
is that the comparator used in the trials on which this submission is based
does not fit the decision problem, as discussed later in this report (section
4.2.2).
Copyright 2010 Queen's Printer and Controller of HMSO. All rights reserved.
Page 14 of 84
3.4 Outcomes
No significant changes in outcomes were made in the decision problem from
those set out in the scope.
In the decision problem, a cut off of ≥3 spontaneous complete bowel
movements (SCBM) per week is used as a primary outcome measure and this
may be justified since ≥3 bowel movements per week is considered to be
within normal limits. However, the term ‘spontaneous’ describes bowel
movements that are considered not to be brought about by laxative treatment
or an enema. The use of this criterion may be a flaw in the trials in this
submission because it could result in an overestimation of the effectiveness of
prucalopride. This is discussed in the critique of clinical effectiveness (section
4.2.2.1).
In the scope, quality of life is specified as an outcome. In the submission
decision problem, a more specific measure of quality of life is given (PAC-
QOL). Relief of symptoms of chronic constipation and quality of life were to be
measured using the PAC-Sym and PAC-QOL questionnaires. These
questionnaires provide detailed information on symptoms and quality of life,
especially related to constipation. The submission decision problem specifies
the use of PAC-QOL results only, but the trials included in the submission also
measured SF-36 (see section 4).
The decision problem states that adverse events were to be presented in the
submission and the manufacturer particularly state that cardiovascular and
central nervous system-related events would be highlighted. Although the
decision problem was appropriate, full results for adverse events were not
presented and this is discussed in section 4.1.6 (Description and critique of
manufacturer’s outcome selection).
3.5 Time frame
The time frame used in the economic model is 52 weeks. Data is extrapolated
from 12 week trials and, in some cases, results from 4 week trials are
extrapolated to 52 weeks. This is justified on page 118 of the manufacturer’s
submission:
Copyright 2010 Queen's Printer and Controller of HMSO. All rights reserved.

Page 15 of 84
Observational study data collected in adult female patients for an additional 40
weeks beyond the initial trial period emphasised the patients satisfaction with
prucalopride therapy was maintained over the initial year (52 weeks) of
prucalopride therapy in adult female patients.
However, it does not appear to have been appropriate to make this
assumption based on data from the single-arm extension studies. Three long-
term studies (INT-10, INT-17, USA-22), containing mixed groups of patients
from different clinical trials, form the basis for this assumption. These studies
are appraised in section 4.2.2 of this report. The use of this data was
inappropriate because:
1) No information is available for patients receiving placebo treatment and
assumptions cannot therefore be made about long-term comparative
effectiveness and, more importantly,
2) The high attrition from these studies (average >50% at 12 months) was
likely to have resulted in biased data since patients who were more satisfied
with their treatment were more likely to remain in the studies.
3.6 Other relevant factors
None identified.
4 CLINICAL EFFECTIVENESS
4.1 Critique of manufacturer’s approach
4.1.1 Description of manufacturers search strategy
The submission section 9.2 Appendix 2 Search strategy for section 5.1
(Identification of studies) states that “a systematic review was not performed
as part of this submission.” Thus no strategies were submitted.
As a result of submitting clarification questions the ERG was informed that an
in-house database (The Prucalopride Clinical Development Database of
Movetis) was searched for phase II-III placebo-controlled studies.
Copyright 2010 Queen's Printer and Controller of HMSO. All rights reserved.

Page 16 of 84
The manufacturer also stated in response to the clarification questions that
searches on MEDLINE and ClinicalTrials.gov using the keyword prucalopride
failed to identify any additional trials on prucalopride.
Having clarified that some searches were in fact conducted but given that
these appeared to be quite limited (the ERG would suggest at least searching
EMBASE and CENTRAL in addition, and including synonym name Resolor in
the strategy), the ERG carried out their own searches (see Appendix 1) and
the results were examined by the ERG team. However, as the manufacturer
had not referenced the studies used in the submission it was difficult to
establish whether any additional references were found.
4.1.2 Inclusion/exclusion criteria used for study selection
No formal inclusion/exclusion criteria for study selection are stated in the
submission. This information would normally be expected in the sections
where manufacturers are requested to give information on how they identified
studies and their methods of study selection (section 5.1 and 5.2).
However, in part of the ‘context’ section (paragraph 2, page 20), the patient
group that is described as forming the basis for the submission is defined. The
four criteria for defining the target population for prucalopride in this
submission are:
1. Onset of symptoms at least 6 months prior to diagnosis
2. Should have tried at least one laxative with unsatisfactory symptomatic
response
3. Fewer then three satisfactory defecations per week on laxative treatment
4. Breakthrough symptoms on laxative treatment must included two or more
of the following in at least 20% of defecations: A) Straining, B) Lumpy or
hard stools, C) Sensation of incomplete evacuation, D) Sensation of
anorectal obstruction/blockage
These criteria do not appear to fit the patient population in the licensed
indication because:
Copyright 2010 Queen's Printer and Controller of HMSO. All rights reserved.
Page 17 of 84
1) The target population, patients with severe chronic constipation who have
undergone a variety of unsuccessful treatments, are likely to have been
undergoing treatment for far longer than 6 months and this cut off is likely to
be too short.
2) To define the population as only having necessarily taken one type of
laxative treatment is inappropriate since the target population for this guidance
are patients that have failed on a range of previous laxative medications. In
normal clinical practice, numerous treatments would be applied before a
patient is defined as not responding to laxative treatment.
3) Patients having one or two defecations per week whilst on laxative
treatment are likely to be having beneficial effects from laxatives. This
definition is therefore inappropriate since it is likely to include patients who
have not truly failed previous laxative treatment and these patients are outside
of the intended scope for this submission.
4) The criteria used to define failure of previous laxative treatments (see A-D
above) are inappropriate because two of these criteria alone would be unlikely
to be sufficient evidence of treatment failure with laxatives.
4.1.3 Included and excluded studies
A table of identified phase II and phase III trials and other studies is given on
page 27 of the submission. Identified studies are shown below (see Table 1)
but it was not possible to tell for some of these whether they are RCTs or
other study designs. Of these trials and studies, nine are described in the
submission and data from ten are used to inform the economic model.
However, trials and studies used to inform the economic model do not fully
correspond with those described in the submission. Table 1 below shows all
the identified trials and studies and indicates which were fully described and
which were used for the economic model. It appears that five used for the
economic model are not fully described in the submission (INT-1, INT-2 and
USA-3 (phase II dose response studies), FRA-1 (subjects with objective
chronic constipation) and GBR-4 (phase II study, 1mg prucalopride).
Copyright 2010 Queen's Printer and Controller of HMSO. All rights reserved.

Page 18 of 84
Table 1. Trials and studies identified in the submission Trial/Study
Type of trial/study Identified in
submission
Described in
submission
Used to inform
economic model
Dose-response trials INT-1
INT-2
USA-3
INT-1
INT-2
USA-3
Pivotal trials - Phase III,
double-blind, placebo-
controlled trials
INT-6
USA-11
USA-13
INT-6
USA-11
USA-13
INT-6
USA-11
USA-13
Other phase II/III, double-
blind, placebo-controlled trials
USA-25
USA-28
BEL-6
GBR-4
FRA-1 Part 1
USA-21
NED-13
NED-2
USA-28
GBR-4
FRA-1 Part 1
Phase II/III, double-blind,
placebo-controlled , trials in
elderly patients
USA-26
INT-12
INT-12
USA-26
INT-12
Phase II/III open-label studies
in patients with chronic
constipation
INT-10
USA-22
BEL-8
INT-3
INT-4
NED-4
FRA-1 Part 2
INT-13
SWE-2
INT-10
USA-22
FRA-1 Part 2
Phase II/III double-blind,
placebo-controlled, trials in
patients with opioid-induced
USA-8
INT-14
INT-8
INT-8
Copyright 2010 Queen's Printer and Controller of HMSO. All rights reserved.

Page 19 of 84
chronic constipation USA-27
Phase II open-label studies in
patients with opioid-induced
chronic constipation
INT-17 INT-17
Phase II trials in patients with
multiple sclerosis or spinal
cord injury
BEL-18
DEN-2
INT-9
Phase II, double-blind,
placebo-controlled trial in
subjects with chronic intestinal
pseudo-obstruction
GBR-7
Phase II, double-blind,
placebo-controlled trials with
i.v./s.c. formulations for the
treatment of postoperative
ileus in patients undergoing
major abdominal surgery of
elective partial colectomies
GER-1
USA-5
It is unclear why some trials in the number series are missing. Three trials
were identified by the manufacturers as being ‘pivotal’ (INT-6, USA-11, USA-
13) and these trials form the basis for much of the assessment of clinical
effectiveness. However, the rationale for the particular focus on these three
trials is not given.
4.1.4 Details of any relevant studies that were not included
A systematic search for randomised controlled trials was conducted to identify
any additional studies to those included in the current submission (see section
4.1.1 and appendix 1). However, since no references were given for
indentified trials/studies in the submission, it was not possible to cross match
with the ERG’s systematic search. A true assessment of whether any relevant
trials/studies were not included was therefore not possible.
Copyright 2010 Queen's Printer and Controller of HMSO. All rights reserved.

Page 20 of 84
Details of trials identified in the submission that were not then described or
used to inform the economic model are given in Table 1 (see also table 1 on
pages 27-31 of the submission). Since these trials and studies were not used
in the submission, they may be considered to be excluded. However, five of
the ten trials included for economic modelling are also not fully described in
the submission (no full description of study methodology and no baseline
characteristics or study findings).
4.1.5 Description and critique of manufacturers approach to validity assessment
The manufacturer gives details of the methods used in the trials described in
the submission (see submission tables 4-7, pgs 36-38). Critical appraisal was
conducted for the three pivotal trials (submission table 24, pg 58). This
included items of study quality related to randomisation, allocation
concealment, baseline similarity, blinding of care providers, participants and
outcome assessors, differential attrition, selective outcome reporting and
intention to treat analysis. The quality assessment method appears to have
been satisfactory. However, this was only applied to the three pivotal trials
and not to the other trials and other studies that are listed in the submission
and to those used to inform the economic model.
4.1.6 Description and critique of manufacturers outcome selection
The primary outcomes of the trials selected by the manufacturer were similar
to those outlined in the decision problem and, in this respect, selected
outcomes are satisfactory. The use of the SCBM outcome in trials may have
been inappropriate but this is discussed later in section 4.2.2.1 of this report.
However, one outcome listed in the decision problem, adverse events, was
not listed as an outcome measure. Findings for adverse events in one safety
study (USA-26) and for the other nine trials described in the submission are
presented in the submission but these were only given for events occurring in
≥5% of patients. On request of the ERG, full details of adverse events
occurring in five of the trials were provided.
Copyright 2010 Queen's Printer and Controller of HMSO. All rights reserved.

Page 21 of 84
4.1.7 Describe and critique of the statistical approach used
For many of the presented results, statistical analysis was not applied and
results of trials were simply presented separately. Results from three pivotal
trials were “pooled” in order to inform the summary statements (pg 25-26 of
the submission) but full pooled results and statistical tests conducted across
the three pivotal trials were not presented.
It was stated that “A meta-analysis was not considered appropriate for this
submission as there are no active comparators to prucalopride” (p79) but, in
response to questions for clarification, manufacturers state that, “If the pooling
of clinical data as required for regulatory submissions is considered as meta-
analysis, we indeed performed meta-analyses.”
It was stated that, “For the first 12 weeks of the economic model for adults an
analysis of individual patient level data is undertaken for all female patients
treated with 2mg dose of prucalopride.” On further clarification, manufacturers
confirmed that an individual patient data analysis was in fact not conducted.
Patient data from trials was used to inform baseline utility values that were
mapped across the representative UK population (oral communication from
manufacturers, May 2010). Change in utility was calculated from regression
equations that used data collected from clinical trials (see page 123 of
submission).
4.1.8 Summary statement
Despite being a non-systematic search, relevant studies appear to have been
identified in the submission. The ERG presumes that the majority of data from
relevant studies is included in the submission. However, the included studies
do not appear to match the decision problem in terms of the population under
investigation or the comparator. Although the included trials do appear to
match the decision problem in terms of the outcomes assessed, these
outcomes may introduce bias.
Copyright 2010 Queen's Printer and Controller of HMSO. All rights reserved.

Page 22 of 84
4.2 Summary of submitted evidence
4.2.1 Summary of results
In the clinical effectiveness section, evidence was submitted on nine trials:
three pivotal trials in adults (18-65 years) (INT-6, USA-11, USA-13), one trial
in elderly patients (>65 years) (INT-12), one trial in patients with opioid-
induced constipation (INT-8), one retreatment study (USA-28) (4mg
prucalopride/day) and three extended, single-arm, observational studies (INT-
10, USA-22, INT17) (see Table 1).
Data from three dose-response trials (INT-1, INT-2, USA-3), one trial in elderly
patients (USA-26) and two ‘other’ phase II trials (FRA-1, GBR-4) are used to
inform the model but no methods or results for these trials are detailed in the
submission.
The outcomes considered in the NICE scope are given below for the studies
detailed in the submission that were relevant to the proposed indication.
Results for the study in patients with opioid-induced constipation and the
retreatment study (4mg prucalopride/day) are not presented in this ERG
report since patients with opioid-induced chronic constipation and
prucalopride taken at 4mg/day are not in the current licensed indication.
Results for adverse events in the trials for which full data was supplied on
request from the manufacturers (three pivotal trials in adults, one retreatment
study and one trial in elderly patients) are also given.
4.2.1.1 Effectiveness in the general adult population: Pivotal trials
Data from three trials considered to be pivotal were used to inform the
assessment of clinical effectiveness in the adult female population. Adult
patients in these trials were those with a history of chronic constipation and
were largely dissatisfied with previous laxative treatments. Before the start of
the intervention, all patients underwent a two-week run-in period where no
laxative medication (except for rescue medication) was allowed. Patients were
then randomised to receive prucalopride (2 or 4mg) or placebo. On both
treatment arms, if patients had not had a bowel movement for ≥3 days, rescue
Copyright 2010 Queen's Printer and Controller of HMSO. All rights reserved.

Page 23 of 84
medication could be requested. This consisted of a single dose of 15mg
bisacodyl. If this was unsuccessful, the dose could be increased and, if there
was still no success, an enema could be used. Patients were followed up for
12 weeks and data was collected at 4 and 12-week time points. Outcome
measures in these trials were similar to those in the NICE scope and the
decision problem.
Summary of results:
Over 12 weeks, for the 2mg prucalopride group, in the three pivotal trials:
Spontaneous Complete Bowel Movements (SCBM).
All trials showed significantly more patients with mean of ≥3 SCBM per
week for prucalopride compared to placebo.
All trials showed significantly greater mean number of SCBM per week for
prucalopride compared to placebo.
Symptoms
2 out of 3 trials showed significantly greater improvements in PAC SYM
symptoms score for prucalopride compared to placebo.
Quality of life
All trials showed significantly greater improvement in PAC-QOL quality of
life score for prucalopride compared to placebo.
No trials showed significantly greater improvement in SF-36 PCS quality of
life score for prucalopride compared to placebo.
No trials showed significantly greater improvement in SF-36 MCS quality
of life score for prucalopride compared to placebo
Since, in most cases, pooled results across trials were not given in the
submission, weighted pooled results have been calculated by the ERG. These
were weighted by study size and calculated using excel (no statistical testing
was conducted by the ERG). Results for the pivotal trials for the outcomes
given in the NICE scope are given below:
a) Number of patients with mean ≥3 SCBMs per week
Copyright 2010 Queen's Printer and Controller of HMSO. All rights reserved.

Page 24 of 84
Measurements for pivotal trials were taken during the run-in period and at
weeks 4 and 12. Pooled results for the number of patients with a mean
number of ≥3 SCBM per week are calculated during the periods of weeks 1-4
and weeks 1-12.
Table 2. Number (percentage) patients with mean ≥3 SCBMs per week for all patients in pivotal trials (INT-6, USA-11, USA-13)
Trial Time point Prucalopride 2mg Placebo
INT-6 (Tack 2009) Weeks 1-4 56/236 (23.7%)*** 25/240 (10.4%)
Weeks 1-12 46/236 (19.5%)** 23/240 (9.6%)
USA-11 (Camilleri
2008)
Weeks 1-4 61/190 (32.1%)*** 19/193 (9.8%)
Weeks 1-12 55/190 (28.9%)*** 25/193 (13.0%)
USA-13 (Quigley
2009)
Weeks 1-4 61/209 (29.2%)*** 24/208 (11.5%)
Weeks 1-12 50/209 (23.9%)** 25/207 (12.1%) $Pooled results
Weeks 1-4 28.0% 10.6%
Weeks 1-12 23.8% 11.4% ***p<0.001 compared to placebo
**p<0.01 compared to placebo
$As calculated by the ERG
In the ERG questions for clarification, the manufacturer was asked to confirm
whether men, and patients who were satisfied with their previous treatments,
were included in these trial results. The manufacturer confirmed that this was
the case and provided the following results for mean ≥3 SCBM per week for
female patients who were not satisfied with their previous laxative treatment:
Table 2b Number (percentage) patients with mean ≥3 SCBM per week, combined pivotal trial results, subgroup analysis: women only, not satisfied with previous treatment
Time-point
Placebo PRU 2 mg
N n (%) N n (%)
Female n (%)
Run-in 466 2 (0.4) 451 4 (0.9)
Weeks-1-4 468 39 (8.3) 452 138 (30.5)
Weeks 1-12 468 44 (9.4) 452 109 (24.1)
Copyright 2010 Queen's Printer and Controller of HMSO. All rights reserved.

Page 25 of 84
b) Number of patients with mean increase of ≥ 1 SCBM per week
Measurements for the three pivotal trials were taken during the run-in period
and at weeks 4 and 12. Results for the number of patients with a mean
increase of ≥1 SCBM per week are calculated during the periods of weeks 1-4
and weeks 1-12.
Table 3. Number (percentage) patients with mean increase of ≥1 SCBMs per week for all patients in pivotal trials (INT-6, USA-11, USA-13)
Trial Time point Prucalopride 2mg Placebo
INT-6 (Tack 2009) Weeks 1-4 93/227 (41.0%)*** 49/235 (20.9%)
Weeks 1-12 86/226 (38.1%)*** 49/234 (20.9%)
USA-11 (Camilleri
2008)
Weeks 1-4 100/177 (56.5%)*** 46/189 (24.3%)
Weeks 1-12 89/177 (50.3%)*** 49/189 (25.9%)
USA-13 (Quigley
2009)
Weeks 1-4 102/209 (48.8%)*** 53/208 (25.5%)
Weeks 1-12 89/209 (42.6%)*** 57/207 (27.5%) $Pooled results
Weeks 1-4 48.2% 23.4%
Weeks 1-12 43.2% 24.6% ***p<0.001 compared to placebo
$As calculated by the ERG
c) Mean number of spontaneous complete bowel movements per week
Measurements were taken during the run-in period (counted as baseline) and
at weeks 4 and 12. Results for the mean number of SCBM per week are
calculated during the periods of weeks 1-4 and weeks 1-12 (mean change
from baseline is displayed in brackets).
Copyright 2010 Queen's Printer and Controller of HMSO. All rights reserved.
Page 26 of 84
Table 4. Mean number (mean change from baseline) of SCBMs per week for all patients in pivotal trials (INT-6, USA-11, USA-13)
Trial Time point Prucalopride 2mg Placebo
INT-6 (Tack
2009)
Weeks 1-4 1.7 (1.4)*** n=236 0.9 (0.5) n=240
Weeks 1-12 1.6 (1.2)*** n=236 1.0 (0.5) n=240
USA-11 (Camilleri
2008)
Weeks 1-4 2.5 (2.1)*** n=190 1.1 (0.7) n=193
Weeks 1-12 2.3 (1.9)*** n=190 1.3 (0.8) n=193
USA-13 (Quigley
2009)
Weeks 1-4 2.1 (1.6)*** n=209 1.0 (0.6) n=208
Weeks 1-12 1.9 (1.5)*** n=209 1.2 (0.8) n=207 $Pooled results (weighted by study size)
Weeks 1-4 2.1 (1.7) 1.0 (0.6)
Weeks 1-12 1.9 (1.5) 1.2 (0.7) ***p<0.001 compared to placebo **p<0.01 compared to placebo
$As calculated by the ERG
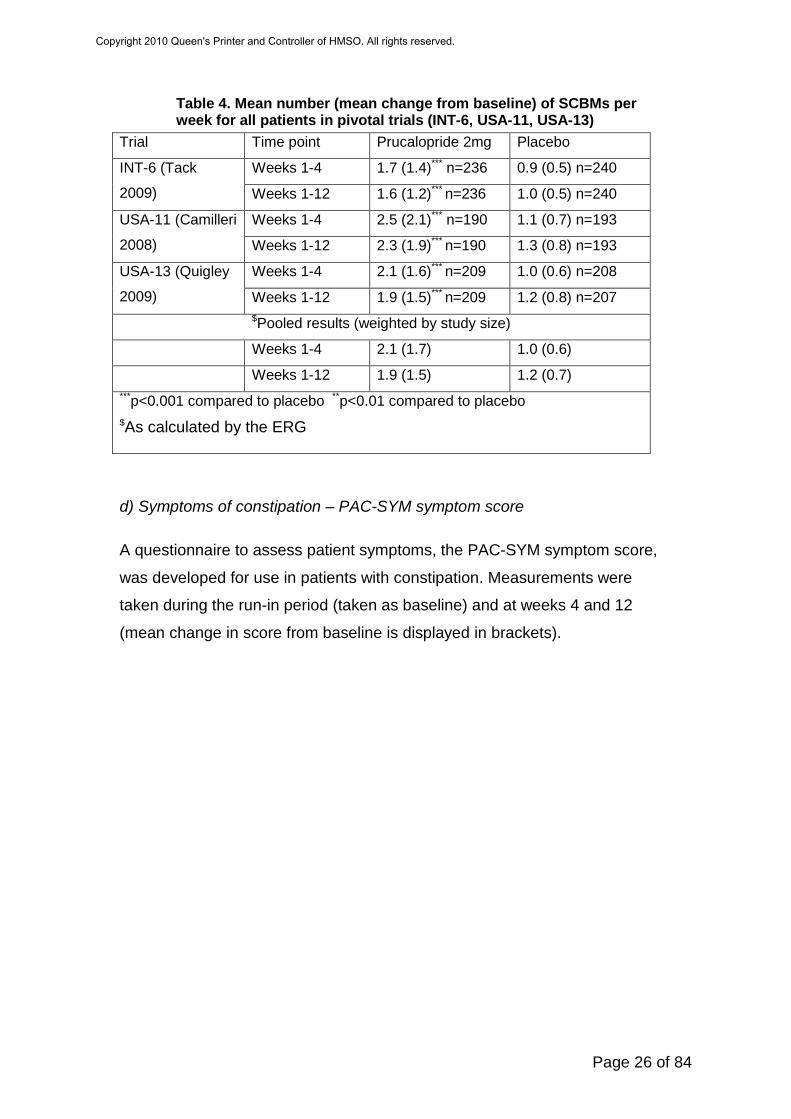
d) Symptoms of constipation – PAC-SYM symptom score
A questionnaire to assess patient symptoms, the PAC-SYM symptom score,
was developed for use in patients with constipation. Measurements were
taken during the run-in period (taken as baseline) and at weeks 4 and 12
(mean change in score from baseline is displayed in brackets).
Copyright 2010 Queen's Printer and Controller of HMSO. All rights reserved.
Page 27 of 84
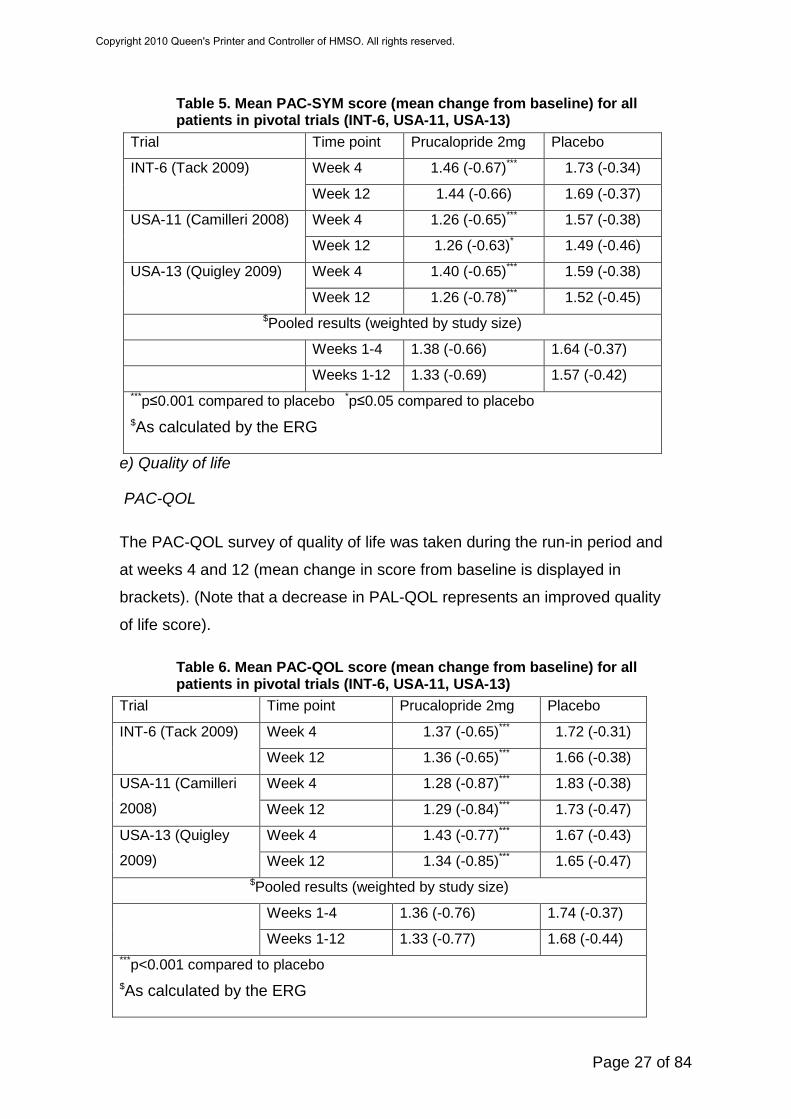
Table 5. Mean PAC-SYM score (mean change from baseline) for all patients in pivotal trials (INT-6, USA-11, USA-13)
Trial Time point Prucalopride 2mg Placebo
INT-6 (Tack 2009) Week 4 1.46 (-0.67)*** 1.73 (-0.34)
Week 12 1.44 (-0.66) 1.69 (-0.37)
USA-11 (Camilleri 2008) Week 4 1.26 (-0.65)*** 1.57 (-0.38)
Week 12 1.26 (-0.63)* 1.49 (-0.46)
USA-13 (Quigley 2009) Week 4 1.40 (-0.65)*** 1.59 (-0.38)
Week 12 1.26 (-0.78)*** 1.52 (-0.45) $Pooled results (weighted by study size)
Weeks 1-4 1.38 (-0.66) 1.64 (-0.37)
Weeks 1-12 1.33 (-0.69) 1.57 (-0.42) ***p≤0.001 compared to placebo *p≤0.05 compared to placebo
$As calculated by the ERG
e) Quality of life
PAC-QOL
The PAC-QOL survey of quality of life was taken during the run-in period and
at weeks 4 and 12 (mean change in score from baseline is displayed in
brackets). (Note that a decrease in PAL-QOL represents an improved quality
of life score).
Table 6. Mean PAC-QOL score (mean change from baseline) for all patients in pivotal trials (INT-6, USA-11, USA-13)
Trial Time point Prucalopride 2mg Placebo
INT-6 (Tack 2009) Week 4 1.37 (-0.65)*** 1.72 (-0.31)
Week 12 1.36 (-0.65)*** 1.66 (-0.38)
USA-11 (Camilleri
2008)
Week 4 1.28 (-0.87)*** 1.83 (-0.38)
Week 12 1.29 (-0.84)*** 1.73 (-0.47)
USA-13 (Quigley
2009)
Week 4 1.43 (-0.77)*** 1.67 (-0.43)
Week 12 1.34 (-0.85)*** 1.65 (-0.47) $Pooled results (weighted by study size)
Weeks 1-4 1.36 (-0.76) 1.74 (-0.37)
Weeks 1-12 1.33 (-0.77) 1.68 (-0.44) ***p<0.001 compared to placebo
$As calculated by the ERG
Copyright 2010 Queen's Printer and Controller of HMSO. All rights reserved.

Page 28 of 84
SF-36 PCS and MCS
Measurements of SF-36 PCS were taken during the run-in period and at
weeks 4 and 12 (mean change in score from baseline is displayed in
brackets).
Table 7. Mean SF-36 PCS score (mean change from baseline) for all patients in pivotal trials (INT-6, USA-11, USA-13)
Trial Time point Prucalopride 2mg
Placebo
INT-6 (Tack 2009) Week 4 46.7 (2.6)* 44.9 (1.1)
Week 12 46.3 (2.1) 45.6 (1.8)
USA-11 (Camilleri
2008)
Week 4 48.5 (2.3) 47.1 (0.9)
Week 12 49.4 (2.7) 47.9 (1.4)
USA-13 (Quigley
2009)
Week 4 48.9 (2.5) 48.7 (1.6)
Week 12 49.1 (2.7) 49.4 (2.5) $Pooled results (weighted by study size)
Weeks 1-4 48.0 (2.5) 46.8 (1.2)
Weeks 1-12 48.2 (2.5) 47.5 (1.9) *p≤0.05 compared to placebo $As calculated by the ERG
Surveys of SF-36 MCS were taken during the run-in period and at weeks 4
and 12 (mean change in score from baseline is displayed in brackets).
Table 8. Mean SF-36 MCS score (mean change from baseline) for all patients in pivotal trials (INT-6, USA-11, USA-13)
Trial Time point Prucalopride 2mg Placebo
INT-6 (Tack 2009) Week 4 46.4 (2.2) 45.9 (0.7)
Week 12 47.6 (3.2) 46.1 (1.5)
USA-11 (Camilleri
2008)
Week 4 48.8 (3.5) 46.7 (1.3)
Week 12 48.0 (2.1) 47.3 (2.0)
USA-13 (Quigley
2009)
Week 4 47.6 (2.7) 47.4 (1.3)
Week 12 48.6 (3.4) 47.3 (1.4) $Pooled results (weighted by study size)
Weeks 1-4 47.5 (2.8) 46.6 (1.1)
Weeks 1-12 48.1 (2.9) 46.9 (1.6) *p≤0.05 compared to placebo $As calculated by the ERG
Copyright 2010 Queen's Printer and Controller of HMSO. All rights reserved.
Page 29 of 84
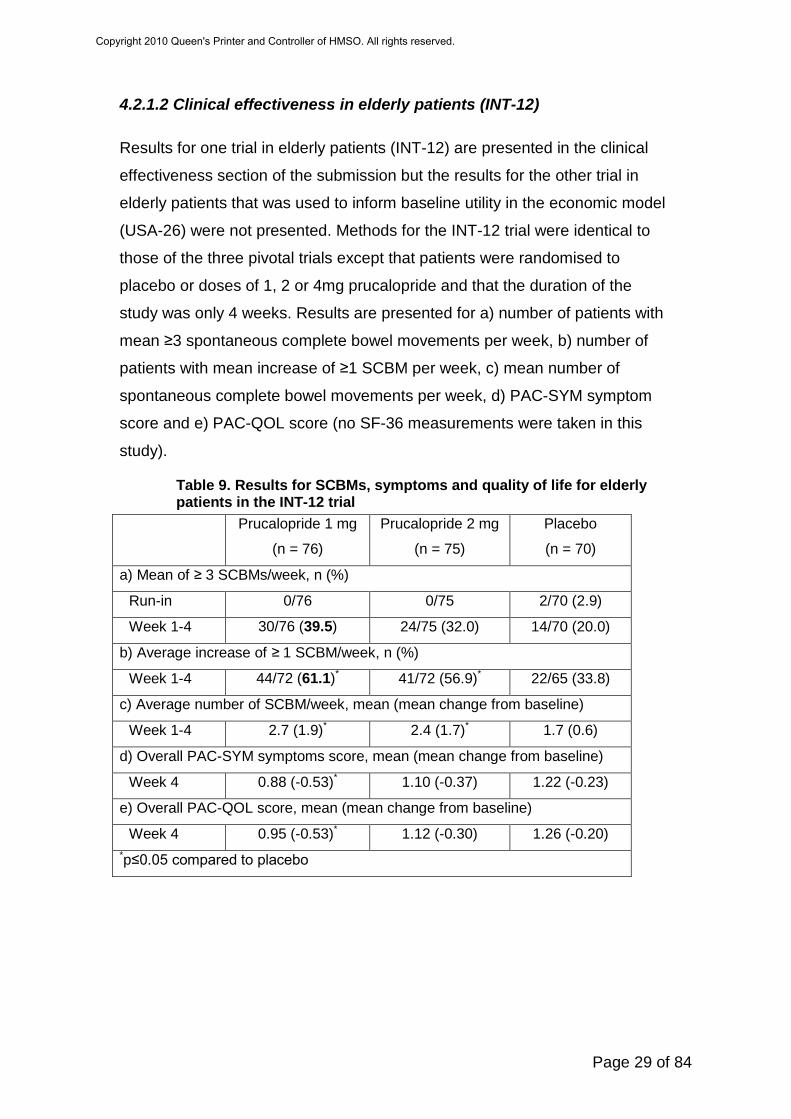
4.2.1.2 Clinical effectiveness in elderly patients (INT-12)
Results for one trial in elderly patients (INT-12) are presented in the clinical
effectiveness section of the submission but the results for the other trial in
elderly patients that was used to inform baseline utility in the economic model
(USA-26) were not presented. Methods for the INT-12 trial were identical to
those of the three pivotal trials except that patients were randomised to
placebo or doses of 1, 2 or 4mg prucalopride and that the duration of the
study was only 4 weeks. Results are presented for a) number of patients with
mean ≥3 spontaneous complete bowel movements per week, b) number of
patients with mean increase of ≥1 SCBM per week, c) mean number of
spontaneous complete bowel movements per week, d) PAC-SYM symptom
score and e) PAC-QOL score (no SF-36 measurements were taken in this
study).
Table 9. Results for SCBMs, symptoms and quality of life for elderly patients in the INT-12 trial
Prucalopride 1 mg
(n = 76)
Prucalopride 2 mg
(n = 75)
Placebo
(n = 70)
a) Mean of ≥ 3 SCBMs/week, n (%)
Run-in 0/76 0/75 2/70 (2.9)
Week 1-4 30/76 (39.5) 24/75 (32.0) 14/70 (20.0)
b) Average increase of ≥ 1 SCBM/week, n (%)
Week 1-4 44/72 (61.1)* 41/72 (56.9)* 22/65 (33.8)
c) Average number of SCBM/week, mean (mean change from baseline)
Week 1-4 2.7 (1.9)* 2.4 (1.7)* 1.7 (0.6)
d) Overall PAC-SYM symptoms score, mean (mean change from baseline)
Week 4 0.88 (-0.53)* 1.10 (-0.37) 1.22 (-0.23)
e) Overall PAC-QOL score, mean (mean change from baseline)
Week 4 0.95 (-0.53)* 1.12 (-0.30) 1.26 (-0.20) *p≤0.05 compared to placebo
Copyright 2010 Queen's Printer and Controller of HMSO. All rights reserved.

Page 30 of 84
4.2.1.3 Long-term efficacy
Three studies were designed to assess the long-term tolerability and safety of
prucalopride. These were single arm studies and were made up of patients
who had completed the following studies:
1) INT-10 – Patients from INT-6 (pivotal trial) and INT-12 (elderly patient trial)
2) USA-22 – Patients from USA-3 (phase II, does response trial), USA-11 and
USA-13 (pivotal trials), USA-21 (phase II ‘other’ dose response trial), USA-25
(phase III, ‘other’ dose titration trial), USA-27 (opioid-induced chronic
constipation trial), USA-28 (phase III retreatment trial).
3) INT-17 – INT-8 and INT-14 (both opioid-induced chronic constipation trials)
INT 10, USA-22 and INT-17 lasted for 24, 36 and 12 months respectively. All
patients received prucalopride during these studies but some of these patients
had received placebo in their previous studies. Doses ranged from 0-4mg. Full
details of results are not given in the submission but the following summary
statements were made:
Copyright 2010 Queen's Printer and Controller of HMSO. All rights reserved.

Page 31 of 84
Table 10: Summary of efficacy results for long term, single arm studies (INT-10, USA-22, INT-17)
INT-10 PAC-QOL
• There was statistically significant improvement from baseline in total and individual PAC-QOL scores at all time-points
• The mean (SE) improvement in total PAC-QOL satisfaction subscale score at month 3 was –1.14 (0.054), –1.41 (0.062) at month 12 and –1.68 (0.132) at month 21
• Mean decrease from baseline in total and individual items of PAC-QOL satisfaction subscale scores were maximal at month 21, ranging from –1.39 to –1.86
• 54.9% patients had an improvement in total PAC-QOL satisfaction subscale score ≥ 1 on a 5-point scale at month 3, this proportion increased to 65.3% at month 12 and 72.0% at month 21
• Results showed that patient’s satisfaction with his/her bowel function and treatment improved over time when receiving treatment with 2 mg to 4 mg prucalopride for a long-term period
Patient’s Daily Diary • Mean daily dose of prucalopride was 2.56 mg (range 0-4 mg) during the
entire study period. For the first 11 weeks of the study 2 mg was the more frequent pattern of use, from week 15 onwards 4 mg became more common
• Use of laxatives decreased during prucalopride treatment, the decrease was more pronounced in patients who previously received placebo
USA-22 PAC-QOL • There was statistically significant improvement from baseline in total and
individual PAC-QOL scores at all time-points • The mean (SE) improvement in total PAC-QOL satisfaction subscale score
at month 3 was –1.04 (0.040), –1.38 (0.059) at month 12 and –1.33 (0.099) at month 21
• Mean decrease from baseline in total and individual items of PAC-QOL satisfaction subscale scores were maximal at month 15 or month 18, ranging from –1.27 to –1.61
• 50.8% patients had an improvement in total PAC-QOL satisfaction subscale score ≥ 1 on a 5-point scale at month 3, this proportion increased to 65.3% at month 12 and 61.9% at month 21
• Results showed that patient’s satisfaction with his/her bowel function and treatment improved over time when receiving treatment with 2 mg to 4 mg prucalopride for a long-term period
Patient’s Daily Diary • The most frequent weekly pattern of prucalopride use was 4 mg daily for 5
days or more • Use of laxatives decreased during prucalopride treatment, generally the
decrease was more pronounced in patients who previously received placebo
Copyright 2010 Queen's Printer and Controller of HMSO. All rights reserved.

Page 32 of 84
INT-17 PAC-QOL
• There was improvement from baseline in total and individual PAC-QOL scores at all time-points
• 45.3% patients had an improvement in total PAC-QOL satisfaction subscale score ≥ 1 on a 5-point scale at month 1, this proportion improved further throughout the study
• The mean (SE) improvement in total PAC-QOL satisfaction subscale score at month 1 was –0.95 (0.134), –0.85 (0.149) at month 3 and –1.17 (0.195) at month 6
• Results showed that patient’s satisfaction with his/her bowel function and treatment improved over time when receiving treatment with 1 mg to 4 mg prucalopride for a long-term period
Patient’s Daily Diary • Generally patients use of laxatives decreased during prucalopride
treatment, the decrease was more pronounced in patients who previously received placebo
• The proportion of patients who indicated that treatment was moderately to extremely effective was high at month 1 (69.8%) and remained high throughout the study 66.7% at month 3, 68.8% at month 6 and 90.0% at month 9 (although only a small number of patients had data at month 9)
• At month 1, 39.1% of patients had no or mild constipation, 35.6% at month 3, 38.8% at month 6 and 60% at month 9, compared with 7.9% of patients at baseline
• The percentage of patients that indicated they were bothered by their constipation decreased from 60.7% at baseline to 29.9% at month 1, 34.2% at month 3 and 26.5% at month 6
Satisfaction scores at 12 months from these trials were used to justify the
assumption of the sustained effectiveness of prucalopride from 12 to 52
weeks for the economic model. However, at 12 months, on average, <50% of
patients remained in these trials (table 11 below (Table 38 on p82 of
submission) shows patient disposition over time). These studies were
continued until all patients had dropped out and although discontinuations
were mainly due to “the decision of the previous sponsor (JRF) to stop the
prucalopride developmental program worldwide”, many patients also dropped
out due to insufficient response (17%), withdrawal of consent (15%) and
adverse events (8%). Full details of reasons for discontinuation are given
below (table 12, Table 39 on p82 of submission).
Copyright 2010 Queen's Printer and Controller of HMSO. All rights reserved.

Page 33 of 84
Table 11: Patient disposition over time (PRU-INT-10, PRU-USA-22, PRU-INT-17) Number of
patients ongoing
with data
PRU-INT-10 PRU-USA-22 PRU-INT-17
Previously
on placebo
(N=224)
Previously
on prucalopride
(N=469)
Previously
on placebo
(N=656)
Previously
on prucalopride
(N=1119)
Previously
on placebo
(N=31)
Previously
on prucalopride
(N=65)
Month 3 208 (92.9) 440 (93.8) 578 (88.1) 1007 (90.0) 29 (93.5) 60 (92.3)
Month 6 171 (76.3) 351 (74.8) 405 (61.7) 726 (64.9) 23 (74.2) 53 (81.5)
Month 9 151 (67.4) 312 (66.5) 301 (45.9) 555 (49.6) 17 (54.8) 35 (53.8)
Month 12 134 (59.8) 276 (58.8) 200 (30.5) 409 (36.6) 5 (16.1) 7 (10.8)
Month 15 105 (46.9) 199 (42.4) 161 (24.5) 339 (30.3) 0 0
Month 18 80 (35.7) 132 (28.1) 116 (17.7) 264 (23.6) - -
Month 21 39 (17.4) 64 (13.6) 74 (11.3) 167 (14.9) - -
Month 24 18 (8.0) 21 (4.5) 12 (1.8) 18 (1.6) - -
Month 27 0 0 - - - -
Table 12: Patient demographic data and reasons for discontinuation (PRU-INT-10, PRU-USA-22, PRU-INT-17)
PRU-INT-10 PRU-USA-22 PRU-INT-17
Number of patients enrolled (M/F) 693 (100/593) 1775 (199/1576) 96 (33/63)
Mean age years (range) 50.8 (18-92) 47.2 (18-89) 52.4 (24-83)
Mean duration of treatment days
(range)
342.2 (1-733) 231.17 (1-721) 127.32 (2-286)
Discontinuations (n[%]) 658 (95) 1775 (100) 96 (100)
Insufficient response 119 (17) 316 (17.8) 12 (12.5)
Adverse event 70 (10) 140 (7.9)† 6 (6.3)
Withdrew consent 53 (8) 326 (18.4) 7 (7.3)
Lost to follow-up 29 (4) 209 (11.8) 1 (1.0)
Non-compliant 11 (2) 59 (3.3) 1 (1.0)
Ineligible to continue 4 (1) 17 (1.0) -
Asymptomatic/cured 3 (<1) 13 (<1) -
Death 1 (<1) - 4 (4.2)
Other 368 (53)‡ 695 (39.2)‡ 65 (67.7)‡ †Three deaths included ‡Mostly discontinuation due to the decision of previous sponsor (JRF) to stop the prucalopride developmental program worldwide
Copyright 2010 Queen's Printer and Controller of HMSO. All rights reserved.

Page 34 of 84
4.2.1.4 Adverse events
One RCT that was specifically designed to assess the safety of treatment with
prucalopride is presented in the submission (USA 26). This was a four-week
trial of safety/tolerability in elderly patients (>65 years) living in a nursing
facility. Results are only presented for types of adverse events occurring in
≥5% of patients in the trial. In a similar way, safety results for the three pivotal
trials (INT-6, USA-11, USA-13), the other trial in elderly patients (INT-12), the
trial in patients with opioid-induced constipation, the retreatment study (USA-
28) and the long-term, single arm studies (INT-10, USA-22, INT-17) are
presented only for types of adverse events occurring in ≥5% of patients in the
trials. The ERG therefore requested full results for all adverse events and
results for the three pivotal trials (INT-10, USA-22, INT-17), one study in
elderly patients (INT-12) and one re-treatment study (USA-28) were provided.
Across these five trials/studies there were higher total numbers of subjects
with adverse events for patients taking prucalopride compared to patients on
placebo treatment. Across all trials/studies, there were higher numbers of
gastrointestinal disorders, nervous system disorders, general disorders and
administration, renal and urinary disorders and metabolism and nutrition
disorders in the prucalopride arm of trials compared to placebo arms as
highlighted in Table 13 below. There were no consistent differences in the
prevalence of cardiac disorders across trials/studies.
Copyright 2010 Queen's Printer and Controller of HMSO. All rights reserved.

Page 35 of 84
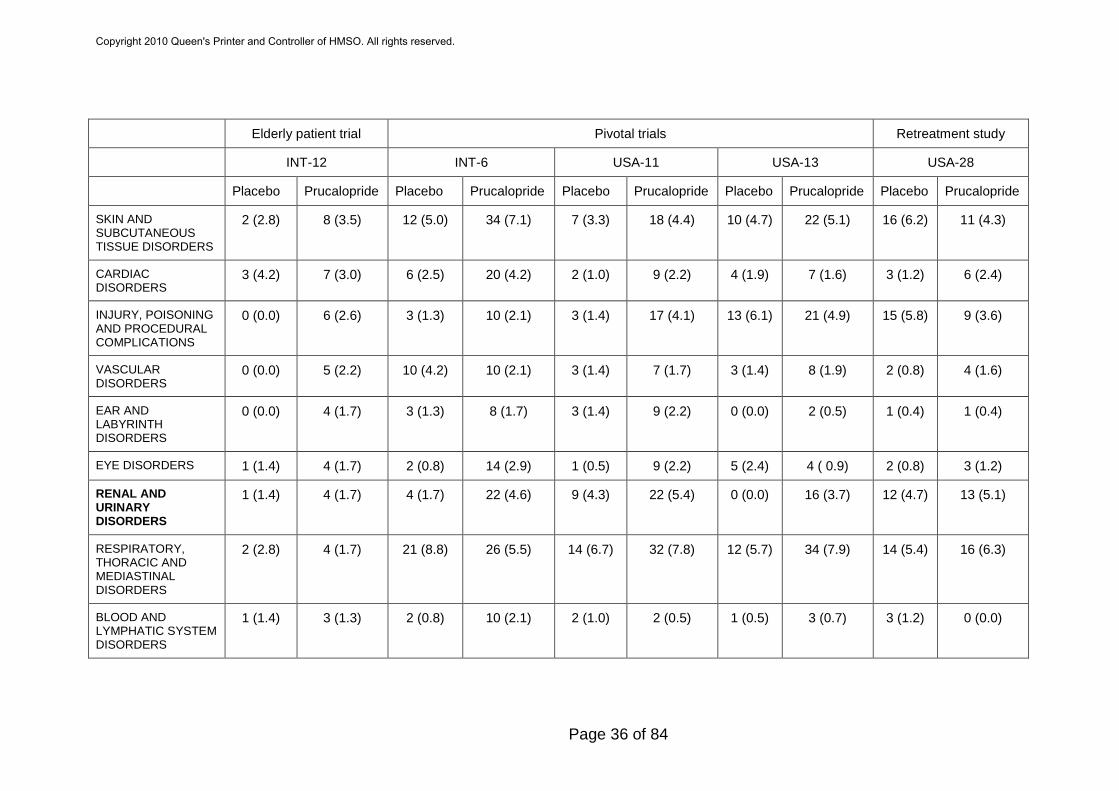
Table 13: Number (percentage) of adverse events in elderly patient (INT-12) and pivotal (INT-6, USA-11, USA-13) trials and a retreatment (USA-28) study
Elderly patient trial Pivotal trials Retreatment study
INT-12 INT-6 USA-11 USA-13 USA-28
Placebo Prucalopride Placebo Prucalopride Placebo Prucalopride Placebo Prucalopride Placebo Prucalopride
TOTAL NO. SUBJ. WITH ADVERSE EVENT
32 (44.4) 104 (45.0) 161 (67.1)
348 (73.1) 149 (71.3)
326 (79.3) 140 (66.0)
336 (78.3) 171 (66.5)
196 (77.5)
GASTROINTESTINAL DISORDERS
6 (8.3) 38 (16.5) 96 (40.0) 225 (47.3) 80 (38.3) 211 (51.3) 53 (25.0)
189 (44.1) 84 (32.7)
128 (50.6)
MUSCULOSKELETAL AND CONNECTIVE TISSUE DIS
6 (8.3) 20 (8.7) 22 (9.2) 57 (12.0) 26 (12.4) 50 (12.2) 26 (12.3)
52 (12.1) 22 (8.6) 20 (7.9)
NERVOUS SYSTEM DISORDERS
6 (8.3) 19 (8.2) 49 (20.4) 160 (33.6) 35 (16.7) 148 (36.0) 41 (19.3)
126 (29.4) 39 (15.2)
87 (34.4)
GENERAL DISORDERS AND ADMINISTRATION SITE
4 (5.6) 15 (6.5) 25 (10.4) 62 (13.0) 16 (7.7) 47 (11.4) 8 (3.8) 43 (10.0) 16 (6.2) 20 (7.9)
INFECTIONS AND INFESTATIONS
7 (9.7) 15 ( 6.5) 61 (25.4) 97 (20.4) 45 (21.5) 105 (25.5) 51 (24.1)
119 (27.7) 55 (21.4)
57 (22.5)
INVESTIGATIONS 6 (8.3) 11 (4.8) 13 (5.4) 47 (9.9) 22 (10.5) 50 (12.2) 14 (6.6) 31 (7.2) 26 (10.1)
29 (11.5)
Copyright 2010 Queen's Printer and Controller of HMSO. All rights reserved.
Page 36 of 84
Elderly patient trial Pivotal trials Retreatment study
INT-12 INT-6 USA-11 USA-13 USA-28
Placebo Prucalopride Placebo Prucalopride Placebo Prucalopride Placebo Prucalopride Placebo Prucalopride
SKIN AND SUBCUTANEOUS TISSUE DISORDERS
2 (2.8) 8 (3.5) 12 (5.0) 34 (7.1) 7 (3.3) 18 (4.4) 10 (4.7) 22 (5.1) 16 (6.2) 11 (4.3)
CARDIAC DISORDERS
3 (4.2) 7 (3.0) 6 (2.5) 20 (4.2) 2 (1.0) 9 (2.2) 4 (1.9) 7 (1.6) 3 (1.2) 6 (2.4)
INJURY, POISONING AND PROCEDURAL COMPLICATIONS
0 (0.0) 6 (2.6) 3 (1.3) 10 (2.1) 3 (1.4) 17 (4.1) 13 (6.1) 21 (4.9) 15 (5.8) 9 (3.6)
VASCULAR DISORDERS
0 (0.0) 5 (2.2) 10 (4.2) 10 (2.1) 3 (1.4) 7 (1.7) 3 (1.4) 8 (1.9) 2 (0.8) 4 (1.6)
EAR AND LABYRINTH DISORDERS
0 (0.0) 4 (1.7) 3 (1.3) 8 (1.7) 3 (1.4) 9 (2.2) 0 (0.0) 2 (0.5) 1 (0.4) 1 (0.4)
EYE DISORDERS 1 (1.4) 4 (1.7) 2 (0.8) 14 (2.9) 1 (0.5) 9 (2.2) 5 (2.4) 4 ( 0.9) 2 (0.8) 3 (1.2)
RENAL AND URINARY DISORDERS
1 (1.4) 4 (1.7) 4 (1.7) 22 (4.6) 9 (4.3) 22 (5.4) 0 (0.0) 16 (3.7) 12 (4.7) 13 (5.1)
RESPIRATORY, THORACIC AND MEDIASTINAL DISORDERS
2 (2.8) 4 (1.7) 21 (8.8) 26 (5.5) 14 (6.7) 32 (7.8) 12 (5.7) 34 (7.9) 14 (5.4) 16 (6.3)
BLOOD AND LYMPHATIC SYSTEM DISORDERS
1 (1.4) 3 (1.3) 2 (0.8) 10 (2.1) 2 (1.0) 2 (0.5) 1 (0.5) 3 (0.7) 3 (1.2) 0 (0.0)
Copyright 2010 Queen's Printer and Controller of HMSO. All rights reserved.

Page 37 of 84
Elderly patient trial Pivotal trials Retreatment study
INT-12 INT-6 USA-11 USA-13 USA-28
Placebo Prucalopride Placebo Prucalopride Placebo Prucalopride Placebo Prucalopride Placebo Prucalopride
METABOLISM AND NUTRITION DISORDERS
0 (0.0) 2 (0.9) 6 (2.5) 17 (3.6) 7 (3.3) 18 (4.4) 1 (0.5) 15 (3.5) 5 (1.9) 11 (4.3)
PSYCHIATRIC DISORDERS
2 (2.8) 2 (0.9) 11 (4.6) 22 (4.6) 10 (4.8) 25 (6.1) 8 (3.8) 20 (4.7) 10 (3.9) 8 (3.2)
REPRODUCTIVE SYSTEM AND BREAST DISORDERS
1 (1.4) 2 (0.9) 5 (2.1) 16 (3.4) 6 (2.9) 16 (3.9) 5 (2.4) 7 (1.6) 13 (5.1) 7 (2.8)
SURGICAL AND MEDICAL PROCEDURES
0 (0.0) 1 (0.4) 4 (1.7) 4 (0.8) 7 (3.3) 15 (3.6) 5 (2.4) 13 (3.0) 9 (3.5) 4 (1.6)
IMMUNE SYSTEM DISORDERS
1 (1.4) 0 (0.0) 1 (0.4) 2 (0.4) 1 (0.5) 4 (1.0) 4 (1.9) 1 (0.2) 3 (1.2) 1 (0.4)
HEPATOBILIARY DISORDERS
0 (0.0) 1 (0.2)
NEOPLASMS BENIGN, MALIGNANT AND UNSPEC.
0 (0.0) 1 (0.2) 3 (1.4) 1 (0.2) 0 (0.0) 3 (0.7) 1 (0.4) 4 (1.6)
ENDOCRINE DISORDERS
1 (0.5) 0 (0.0) 1 (0.4) 1 (0.4)
Copyright 2010 Queen's Printer and Controller of HMSO. All rights reserved.
Page 38 of 84
4.2.2 Critique of submitted evidence syntheses
The following critique first looks at the quality of the trials used for the
summary of the clinical effectiveness of prucalopride and then considers the
way that this trial information has been incorporated into the economic model.
4.2.2.1 Critique of trials in the clinical effectiveness section
4.2.2.1.1 Pivotal trials
There are several issues associated with the trial evidence on which this
submission is based and these are discussed below:
Patients
It appears that the patients studied in the pivotal trials were not those with
laxative-refractory chronic constipation as per the licensed indication. This is
evidenced in a number of ways:
1) Before the trials, in response to the question “overall assessment of
therapeutic efficacy of previous treatment of constipation”, across the three
pivotal trials, 17.0% of patients answered that they had found their previous
treatment adequate. The types of patients for whom prucalopride is indicated,
those with severe chronic constipation and refractory to laxative treatments,
would be extremely unlikely to have found previous treatments adequate.
Additionally, even amongst patients finding previous treatments inadequate
(as presented by manufacturers in clarification responses, table 2b of this
report), there are likely to be many for whom laxatives are continuing to give
some benefits and may not be true candidates for treatment with prucalopride.
2) Bisacodyl was used as a rescue medication in all three pivotal trials and
findings suggest that it was effective. Results for the total number of bowel
movements (induced by all causes), were not available in publications or the
initial manufacturer’s submission but were supplied by the manufacturer on
request. The average number of bowel movements (BM) per week induced by
bisacodyl/enemas (spontaneous BM minus all BM) was 1.34 in weeks 1-4 and
Copyright 2010 Queen's Printer and Controller of HMSO. All rights reserved.
Page 39 of 84
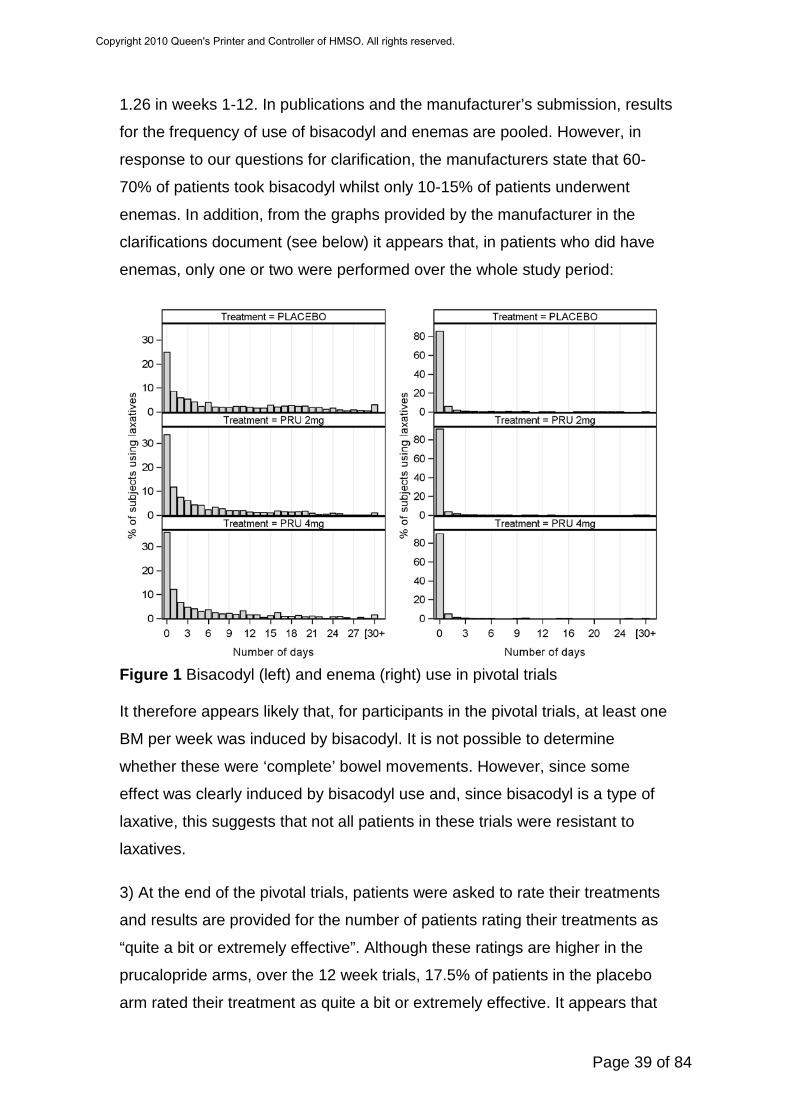
1.26 in weeks 1-12. In publications and the manufacturer’s submission, results
for the frequency of use of bisacodyl and enemas are pooled. However, in
response to our questions for clarification, the manufacturers state that 60-
70% of patients took bisacodyl whilst only 10-15% of patients underwent
enemas. In addition, from the graphs provided by the manufacturer in the
clarifications document (see below) it appears that, in patients who did have
enemas, only one or two were performed over the whole study period:
Figure 1 Bisacodyl (left) and enema (right) use in pivotal trials It therefore appears likely that, for participants in the pivotal trials, at least one
BM per week was induced by bisacodyl. It is not possible to determine
whether these were ‘complete’ bowel movements. However, since some
effect was clearly induced by bisacodyl use and, since bisacodyl is a type of
laxative, this suggests that not all patients in these trials were resistant to
laxatives.
3) At the end of the pivotal trials, patients were asked to rate their treatments
and results are provided for the number of patients rating their treatments as
“quite a bit or extremely effective”. Although these ratings are higher in the
prucalopride arms, over the 12 week trials, 17.5% of patients in the placebo
arm rated their treatment as quite a bit or extremely effective. It appears that
Copyright 2010 Queen's Printer and Controller of HMSO. All rights reserved.

Page 40 of 84
these patients either a) required little medical intervention or b) responded to
laxative (bisacodyl) treatment. This further suggests that patients in these
trials did not all have severe chronic constipation and trial results are unlikely
to properly reflect results for prucalopride in the proposed indication.
Comparator group
The comparator group in the pivotal trials was inappropriate on two counts:
I) If the population under investigation are assumed to be those with severe
chronic constipation who have failed on all previous laxative therapy, a
placebo group may be an appropriate comparator. However, even with this
assumption, the placebo comparator in the pivotal trials is biased because of
the rescue medication and how the outcomes were counted. In both the
placebo and prucalopride arms of these trials, rescue treatment with
biscodyl/enema is given. Any bowel movements that occurred due to these
treatments were considered to be non-spontaneous and were discounted from
the count of SCBMs (the primary outcomes for these studies). Since the
placebo group will naturally receive more rescue therapy than the
prucalopride group, this introduced bias. From information supplied by the
manufacturer, it is evident that the number of non-spontaneous bowel
movements that were discounted from the placebo group was higher than the
number discounted from the prucalopride group. An average of 1.7 non-
spontaneous bowel movements per week were deducted from the placebo
group compared to 1.0 per week in the prucalopride group and this was likely
to have led to an overestimation of the comparative effectiveness of
prucalopride.
II) If the actual patient populations in these trials is considered (many patients
were likely to have been responsive to laxative treatment), a placebo is not an
appropriate comparator. An appropriate comparator may have been a variety
of laxative treatments, at the discretion of the treating clinician. In these trials,
if patients did not have bowel movements for ≥3 consecutive days, rescue
treatment of a single dose of bisacodyl was prescribed. The use of limited
access to a single laxative treatment does not represent clinical practice in the
Copyright 2010 Queen's Printer and Controller of HMSO. All rights reserved.

Page 41 of 84
general group of patients with chronic constipation and, in this respect, the
comparator group is also inappropriate.
Outcomes
The primary outcome in these trials, ≥3 spontaneous complete bowel
movements (SCBM) per week, was likely to have given a biased impression
of the effectiveness of prucalopride. BMs occurring within 24 hours of rescue
medication in either the placebo or prucalopride arm were discounted.
However, as would be anticipated, patients receiving placebo required more
courses of rescue treatment compared to those receiving prucalopride and
this resulted in a greater number of discounted BMs in the placebo arm. On
request, manufacturers supplied data for the total number of SBMs and BMs
and, from these results, it can be determined that, over 12 weeks, 1.74 non-
spontaneous BMs per week were discounted from the placebo group
compared to 1.03 non-spontaneous BMs in the 2mg prucalopride group.
Since this discounting is more than 50% higher in the placebo group, this was
likely to have had some impact on the apparent effectiveness of prucalopride
compared to placebo.
4.2.2.1.2 Trials in elderly patients
Elderly patients may suffer chronic constipation but the causes may be
different in this type of population. Elderly people are more likely to have
constipation secondary to other causes such as poor diet, limited physical
exercise and other medications. Two trials of elderly patients are used to
inform the economic modelling but details for only one of these trials is given
in the submission (INT-12).
Patients
Although patients with constipation due to secondary factors were excluded, it
seems likely that, as with the pivotal trials, the patient group were not
restricted only to those warranting treatment with prucalopride. In the INT-12
trial, 21% of patients assessed their previous treatment as adequate
suggesting that they had not previously failed laxative treatment. Also, it
appears that treatment arms may not have been balanced at baseline since
Copyright 2010 Queen's Printer and Controller of HMSO. All rights reserved.
Page 42 of 84
28.6% of the patients in the 2mg prucalopride group rated their previous
treatment as adequate compared to 12.7% of patients in the placebo group.
As for the pivotal trials, bisacodyl was used as a rescue therapy and, similarly,
the use of a laxative as the rescue therapy suggests that these patients were
still responsive to laxative treatment. Post-intervention, 16% of patients in the
placebo group rated their treatment as “quite a bit or extremely effective”,
suggesting that many patients had found the rescue therapy (laxative
treatment) to be effective.
Comparator
As with the pivotal studies (section 4.2.2.1.1, ‘Comparator’), the comparator
group in the trial of elderly patients could be seen to be inappropriate
because: 1) the placebo group was disadvantaged by the selection of only
spontaneous BMs. Greater discounting of BMs from the comparator
compared to the prucalopride arms was likely to have resulted in bias in the
results. 2) Since the general chronic constipation elderly population were the
group being considered, an appropriate comparator treatment would have
been laxatives. However, the rescue medication on the trial was too restrictive
to be a true representation of laxative use in clinical practice.
Outcomes
See as previously described in the critique of the pivotal trials.
4.2.2.1.3 Long-term studies
The use of this study data to inform the assumption that prucalopride
maintains the same comparative advantage in quality of life from 12-52 weeks
in the economic model is likely to have been inappropriate for a number of
reasons.
Patients
Patients in the long-term studies of efficacy and safety (INT-10, USA-22, INT-
17) were those who had previously taken part in prucalopride trials. It is
unclear how participants from those trials were selected for follow-up studies
and baseline data for these patients is not given in the manufacturer’s
submission. However, it appears likely that, as with the pivotal trials, these
Copyright 2010 Queen's Printer and Controller of HMSO. All rights reserved.
Page 43 of 84
patients were not necessarily refractory to laxative treatment. The patient
group in these studies is a mixture of elderly patients and those with opioid-
induced chronic constipation and the results have not been separated.
As discussed below (section 4.2.2.2), the high rate of attrition of patients from
these studies (>50% at 12 months) was likely to have resulted in a patient
group continuing with treatment who were relatively more satisfied with their
treatment compared to those dropping out and who were therefore not
representative of all patients treated with prucalopride.
Comparator
No comparator group was used in these open-label studies. However, these
results have been used to justify the assumption that the improvement in
quality of life in patients on prucalopride compared to those on placebo
treatment is maintained at 52 weeks. The absence of placebo data for this
period of time invalidates this assumption because it is not possible to
determine quality of life at 52 weeks in patients receiving placebo treatment.
4.2.2.2 Clinical effectiveness evidence used to inform the economic
model
There are problems associated with the trials presented in this submission
but, of greater importance is the effectiveness data that was used to inform
the economic model and the way that this data has been applied. In order to
inform the economic model, patient results from certain trials were selected.
This was used to determine baseline quality of life (EQ-5D) and change from
baseline appears to have been determined using mean changes in quality of
life in the selected patients of the selected trials. Several issues lie around the
estimate of effectiveness used for the economic model:
1) It is apparent that many of the patients with data used to inform the
economic model did not have laxative-refractory chronic constipation. Patient
data from the pivotal trials formed a major part of data for economic modelling
and, as discussed above (section 4.2.2.1.1), it appears that many of these
patients were still responsive to laxative treatment. At baseline, some patients
were satisfied with their current treatments and, in many patients, bisacodyl
Copyright 2010 Queen's Printer and Controller of HMSO. All rights reserved.

Page 44 of 84
was effective as a rescue therapy, suggesting that patients were unlikely to be
representative of those in the licensed indication.
Precise details of which patients, from which trials, that were used to inform
the model, were not given in the submission. Upon request for further
information about the source of patient data, a histogram of simulated
baseline EQ-5D scores for adult (18-65) and elderly (≥65) patient data was
provided by the manufacturers:
Figure 2 Baseline EQ-5D scores for adults (18-65) patient data used in the
economic model
Copyright 2010 Queen's Printer and Controller of HMSO. All rights reserved.

Page 45 of 84
Figure 3 Baseline EQ-5D scores for elderly patient data used in the economic
model
The ERG does not have research evidence to determine whether these
baseline EQ-5D scores are likely to represent patients with severe, laxative-
refractory, chronic constipation. However, the wide range of baseline scores
suggests that this was not a homogenous group. If those at the lower end of
the spectrum are assumed to be patients with severe chronic constipation that
have failed to respond to all other treatments, it is reasonable to assume that
those at the higher end of the spectrum tend in some way to be less severe
cases. The distributions are skewed towards the higher end and some values
are above 90. It would therefore appear likely that many patients whose data
was used to inform the economic model did not have chronic constipation that
could be classed as severe and may not fall in the category of those who may
be eligible for treatment with prucalopride.
2) The comparator group in the model is inappropriate because a key
assumption of the economic model (pg 130 of the submission) is that
“Placebo data from the prucalopride clinical trial were taken as an
approximation for the efficacy of response for patients on laxatives.” If the
model is considering laxative treatment as the comparator to prucalopride, the
comparator data taken from trials is inappropriate. Placebo rescue therapy
was not equivalent to laxative treatment that would be used in clinical practice
Copyright 2010 Queen's Printer and Controller of HMSO. All rights reserved.

Page 46 of 84
since it was limited to one laxative and patients had restricted access to that
treatment.
3) As discussed above, certain selected trials, and certain selected patient
results from those trials, were used to inform the economic model (Table 53
pg 124 of the submission) but there is no justification for why these trials, and
why particular patients from these trials, were selected. There is no way of
discerning whether appropriate information has been used to inform the
economic model.
4) There is no description of five of the trials that have contributed data to the
economic model and no results from these trials are given in the submission.
5) The model assumption that the relative advantage in quality of life in
prucalopride patients at the end of study follow up is maintained at 52 weeks
is inappropriate. Trials used as the basis for this assumption had, on average,
>50% attrition at 12 months and the reasons for discontinuation included
insufficient response (17%), withdrawal of consent (15%) and adverse events
(8%). In the three pivotal trials, for all SCBM and quality of life measures,
there were decreases in efficacy from 1-4 to 1-12 weeks compared to the
placebo suggesting that, in fact, effectiveness was likely to decrease with
time. In the long-term studies, considering that many patients were likely to
have dropped out due to dissatisfaction, patients remaining in the trial were
likely to have been those that were relatively more satisfied. These trials
therefore give a biased reflection of long-term patient satisfaction and it is not
possible to judge whether patient satisfaction would have been maintained at
12 months.
The assumption of maintenance of quality of life up to 52 weeks is also not
valid due to the lack of data for long-term patient satisfaction in the placebo
group. If relative quality of life is to be compared, follow-up data in the placebo
group would also be required.
Additionally, patients in these long-term follow-up trials included patients that
were not refractory to laxatives and patient groups were mixtures of adult and
elderly patients and patients with opioid-induced constipation.
Copyright 2010 Queen's Printer and Controller of HMSO. All rights reserved.
Page 47 of 84
6) The submission states that individual patient results were used to inform
the model. However, manufacturers later clarified that this was not the case.
Patient data from trials was used to inform baseline EQ-5D data for the model
by mapping them onto UK population data. Changes in EQ-5D were informed
by results of relevant trials. However, this process is not transparent and it is
still unclear what information and what assumptions were used to inform the
effectiveness results in the economic model.
7) In order to generate EQ-5D data for the economic model, data from PAC-
QOL and PAC-Sym were extrapolated to EQ-5D. This was done by first
establishing the relationship between PAC and SF-36 data within patients.
The known relationship between SF-36 and EQ-5D was then used to
extrapolate PAC data directly to EQ-5D and the following equation was used:
EQ-5D = 97.7-9.8 (PAC-QOL) (see page 225 of the submission)
It appears that the SF-36 data did not directly contribute to EQ-5D scores
although these results were available from the trials. Sensitivity analysis could
have been conducted to examine model results when EQ-5D data was
derived directly from SF-36 data since this is a validated method.
4.2.3 Summary
This submission is based on trials that do not properly inform on the
effectiveness of prucalopride in the laxative-refractory patients for whom this
drug has marketing authorisation. Results from these trials have not been
incorporated into the economic model in a transparent way.
Copyright 2010 Queen's Printer and Controller of HMSO. All rights reserved.

Page 48 of 84
5 ECONOMIC EVALUATION
5.0.0. Manufacturer’s search strategy
Search for cost effectiveness studies
Although a Search strategy for cost effectiveness studies was included in
section 9.10 (appendix 10 of the submission), neither the date on which the
search was conducted nor the date span of the search were included in the
initial submission (both required by the NICE template) and it was not obvious
on which database this was run (format suggested MEDLINE 1950-2010).
Further information provided post clarification questions established that both
MEDLINE and EMBASE were searched from 2000-2009, as was NHS EED
(the ERG assumes the same dates were used). No cost effectiveness
analyses relating to the specific patient group were located.
The strategy does not include a detailed cost filter, but simply uses the term
(cost*). Line 3 was redundant and would be captured by line 4. The searches
used a combination of text word and index terms (MeSH) and used Boolean
operators. No language limit appears to have been employed, which is
inconsistent with the searches in submission appendix 12 (measurement and
valuation of health effects) which were limited to English language.
Following clarification questions, it transpired that more resources had been
searched than first stated but, as the range of search terms used was limited,
the ERG ran further searches (see appendix 1) using the Haynes cost filter.
No additional relevant references were found.
Search strategy for measurement and valuation of health effects
The search strategy for measurement and valuation of health effects is given
in section 9.12 of the submission (appendix 12). Manufacturers searched via
PubMED which they stated would cover MEDLINE which in turn includes
Cochrane and the manufacturer states that the searches were carried out on
19 March 2010 and cover the period January 1990 – March 2010.
Although MEDLINE does include the Cochrane CDSR database it does not
cover DARE, HTA, NHS EED or the CENTRAL database which all form part
Copyright 2010 Queen's Printer and Controller of HMSO. All rights reserved.

Page 49 of 84
of the Cochrane Library. So the manufacturers may have unwittingly
introduced bias to the searches. They did not state they had searched
EMBASE which covers more European-based journals and a wider range of
pharmaceutical-related resources than MEDLINE, which again may have
been advisable. (Alternatively they may have searched it but omitted to report
this, as EMBASE was included in the cost effectiveness and resource
identification measurement and valuation searches (see submission appendix
13)).
In submission section 9.12.4, the search strategy detailed does indeed
combine free text and MeSH terms using Boolean operators. It covered a
comprehensive range of terms likely to capture matters relating to
measurement and valuation of health effects. The search terms used to
describe the condition were limited (the manufacturer acknowledges this in
section 9.12.6) and the decision not to search on the free text term
constipation will necessarily have restricted the yield of this search (just 25
references). There is a 52% overlap between the studies located by the cost
search (9.10.4) and this search, which is not surprising given the overlap of
the topic areas. The decision to make these searches relatively narrow and
limit by date and language may have been driven by time-constraints and
concern over the size of the topic area.
The ERG ran some more comprehensive strategies to locate cost-
effectiveness and measurement/valuation of health effects (see appendix 6.1)
and the results (152 unduplicated refs) were screened for relevance.
However, no relevant references were located.
Search strategy for resource identification, measurement and valuation The search strategy for resource identification, measurement and valuation is
given in submission section 9.13 (Appendix 13). The initial submission stated
that a comprehensive literature search was undertaken to identify economic
literature relevant to the therapeutic area. Although it states that the search
strategy used and literature identified are outlined at the end of this section, it
is not clear whether this means section 9.13 or section 6.5. In any case, there
did not appear to be anything relevant in section 6.5 or at the end of 9.13. It is
Copyright 2010 Queen's Printer and Controller of HMSO. All rights reserved.

Page 50 of 84
possible that this statement should have referred to appendix 10 and
appendix 12 of the submission.
As regards resource identification, measurement and valuation, the
manufacturer stated that “such searches were not applicable because
resource use data were not available for prucalopride and hence no search
was undertaken. The remaining sections are therefore not considered
applicable.” In response to clarification questions, the manufacturer stated that
a detailed search was undertaken of MEDLINE and EMBASE from 2000
onwards to identify potential changes in resource use resulting from effective
control of the symptoms of chronic constipation and that the resource analysis
emphasised that patients suffering ineffectively treated chronic constipation
impose significant costs on the NHS. They went on to state “unfortunately the
Prucalopride trials did not collect resource data and hence direct evidence
from the trials was unavailable to support resource savings from the use of
Prucalopride”
No search terms were provided for the searches to identify potential changes
in resource use so the ERG assume that, as no additional strategies were
provided, this literature was derived from the cost-effectiveness and
measurement and valuation of health effects searches (sections 9.10 and
9.12 of the submission). The ERG searches located a range of literature on
costs incurred by patients suffering from severe constipation and the
manufacturer commented on the evidence found from this type of literature in
their reply to clarification questions (referring to significant costs imposed on
the NHS by such patients). They go on to state, however, that the
prucalopride trials did not collect resource data, so they made a conservative
assumption that no savings would result from effectively controlling the
symptoms of chronic constipation and resource analysis was therefore entirely
confined to acquisition costs of prucalopride.
5.1 Overview of manufacturer’s economic evaluation
Including 1-page summary of structure, assumptions and sources, with
signposting to tables with numerical inputs and their distributions where
appropriate.
Copyright 2010 Queen's Printer and Controller of HMSO. All rights reserved.

Page 51 of 84
5.1.1 Natural history
Chronic constipation can become a public health concern when it is not
adequately controlled with current laxatives. Chronic constipation inflicts a
heavy burden to the patients (in terms of an impaired psychological well-being
and overall quality of life (QOL)), to the society (due to work absenteeism) and
to the health system (due to the substantial and inefficient health resource use
by patients who remain dissatisfied and often unsuccessfully seek an
alternative treatment that may provide better relief for their constipation). This
translates into frequent visits to the treating physician and the unnecessary
performance of expensive diagnostic procedures to rule out other causes of
constipation. The majority of patients with constipation are managed in
primary care.
Prucalopride is intended to be used in those patients for whom laxatives have
been identified as being ineffective or inadequate. The outcome in the trials
was the number of Spontaneous Complete Bowel Movements (SCBM) per
week. Patients who reached ≥3SCBM per week were considered responders
to the treatment of prucalopride. As the manufacturer did not build a Markov
model, it was difficult to see the clinical pathway for patients.
5.1.2 Treatment effectiveness within the submission
The model submitted by Movetis is a de novo economic evaluation designed
to evaluate the cost effectiveness of treatment with prucalopride (plus rescue
medication) in two separate female populations: adults (18-65 years, 2
mg/daily dosage) and elderly (65+ years, 1mg/daily dosage). In both groups
the comparator was placebo (plus rescue medication).
Copyright 2010 Queen's Printer and Controller of HMSO. All rights reserved.

Page 52 of 84
The following chart was included in the description of the model that was
provided by the manufacturer.
Figure 4 Figure 8 (p118) of manufacturers submission, entitled “Costs and
outcomes of constipation treatment – decision tree analysis, UK model”
RCT results were collected for the 2 mg dosage population (<65 years) for 12
weeks, while 1mg dosage population (>65 years) results were collected for a
period of four weeks. For the following months up to one year observational
study results were collected. It was found that patient satisfaction was
maintained over the year in patients who continued to take prucalopride. It
Copyright 2010 Queen's Printer and Controller of HMSO. All rights reserved.

Page 53 of 84
was stated on p130 of the submission that “Patient drop out due to lack of
efficacy after 12 weeks was low (< 5%)” but that is contradicted by table 38 of
the submission on p82 showing high rates of dropout between 40-90% and
table 39 showing that ~17% dropped out from insufficient response (tables 11
and 12 of this report). The time-points in the model are 4-weeks, 12-weeks
and 52-weeks. Treatment outcome was the frequency of spontaneous
complete bowel movements (SCBM). A patient who experienced 3 or more
SCBM in one week was defined as having achieved normalised bowel
movements and hence categorised as being a “responder”. Patients who
achieved “normality” in bowel movements were considered responders in this
context and were reassessed after 12 weeks to ensure that treatment
effectiveness was sustained. In patients who did not maintain the target
treatment response of 3 or more SCBMs, treatment was discontinued.
The manufacturer provided in the clarifications responses an illustrative graph
generated by the model in the base case situation with actual utility scores on
the vertical axis (scale goes from 78 to 90) and weeks 4, 12 and 52 on the
horizontal axis. The top line (yellow) is treated responder, next line (red)
treated but not responder and lowest line (blue) is not treated. Both
prucalopride groups start at the same utility level with a mean index score of
82.22 (on a scale where full health is scored at 100). The group of patients not
treated with prucalopride do get slightly better between 0 to 12 weeks; this is
explained by Movetis to be typical of a placebo effect. The adult group was
assessed at weeks 4 and 12, the improvement between week 0 and week 12
was taken to be sustained to week 52. The elderly group was assessed at
week 4 and the improvement at week 4 was taken to be sustained to week 52.
Copyright 2010 Queen's Printer and Controller of HMSO. All rights reserved.

Page 54 of 84
Figure 5 Changes in EQ-SD generated by the economic model in the base
case situation
5.1.3 Health related quality of life
EQ-5D outcomes were not collected directly in the prucalopride trials, they
collected SF-36 and PAC-QOL together at various time points, obtaining 5488
sets of values altogether. SF-36 has been mapped onto the EQ-5D index in a
previously published paper by Rowen et al 20092
2 Rowen D, Brazier J, Roberts J. Mapping SF-36 onto the EQ-5D index: how reliable is the relationship? Health and Quality of Life Outcomes 2009;7(27):1-9
where EQ-5D was
estimated for each SF36 sample using a generalised least squares model.
The prucalopride model then used a mapping process to convert PAC-QOL to
EQ-5D which was carried out by Haycox et al, whose paper was included in
the submission (see appendix 14 starting on p216 “The economic evaluation
of Prucalopride in Chronic Constipation”)..
Copyright 2010 Queen's Printer and Controller of HMSO. All rights reserved.

Page 55 of 84
The estimated equation for deriving EQ-5D from PAC-QOL was:
EQ-5D = 97.7 – 9.8 (PAC-QOL)
Note that the PAC-QOL is an inverse measure from 1 (mild symptoms) to 4
(severe symptoms). A patient suffering from severe chronic constipation (4)
would map onto an EQ-5D score of 0.585 (on the 0 - 1 EQ-5D scale). This is
illustrated by the diagram below, from the Haycox et al paper in appendix 14,
p222.
Figure 6 Relationship between PAC-QOL quality of life score and EQ-5D
Also please note that the EQ-5D estimate of severe chronic constipation of
0.585 contrasts with the baseline EQ-5D scores provided in the clarifications
document and reproduced in figures 2 and 3 of this ERG report.
A chart representative of the mapping process, provided by the manufacturer,
is shown below. It is similar to the diagram from p224 of the Haycox et al
paper, but enlarged, and it does not have any explanatory comment:
Copyright 2010 Queen's Printer and Controller of HMSO. All rights reserved.

Page 56 of 84
Figure 7 Mapping process of PAC-QOL to EQ-5D
Copyright 2010 Queen's Printer and Controller of HMSO. All rights reserved.

Page 57 of 84
5.1.4 Resources and costs
The only resource/cost incorporated into the economic model is the full list
price of prucalopride to the NHS (cost of prucalopride: 2mg tablet is priced at
£2.13 and 1mg tablet at £1.38). The clinical trials did not collect data on
resources used.
5.1.5 Discounting
The time frame used in the model covered a period of 12 months so
discounting has not been applied.
5.1.6 Sensitivity analyses
Sensitivity Analysis was presented on alternative response:
• ≥ 3 SCBMs (spontaneous complete bowel movements) per week
• an increase of ≥1 SCBM per week
Both response analyses were carried out for all female patients, adult female
and elderly female. No other sensitivity analysis results were presented in the
original submission. Some further scenarios were included in the clarification
document.
5.1.7 Model validation
The manufacturer’s submission (submission pp 152-153) describes in detail a
validation process relating to the mapping of quality of life scores. For the rest
of the model, the following remarks were made (see p153 of the submission):
Design of the economic model focused on keeping the structure as simple as
possible, providing a structure which aligned as closely with real world clinical
practice as possible. The first step in the process was to identify the effect of
treatment upon a patient’s quality of life, and how this compared with current
practice. One particular issue was the lack of any specific evidence relating to
the treatment of chronic constipation. Whilst laxative use is widespread,
readily available over the counter and inexpensive, the inclusion criteria for
the evaluation of prucalopride defines patients who are both unresponsive to
current medication and who have suffered from constipation for longer than
Copyright 2010 Queen's Printer and Controller of HMSO. All rights reserved.

Page 58 of 84
six months.
5.2 Critique of approach used
The only cost incorporated in the model is the acquisition cost of prucalopride.
It is assumed that other NHS costs will be at least as high for the comparator
arm as for prucalopride. Therefore, the decision not to include these costs is
described as a conservative approach. This may well be the case for routine
NHS costs, but it is not clear that adverse event costs are no higher with
prucalopride than without, bearing in mind that there were more adverse
events in the prucalopride arm than placebo arm of the trials (see table 13 of
this ERG report).
For outcomes, it was assumed that non-responders do not benefit from
prucalopride treatment. Quality of life gained by responders was estimated by
one of eight different regression equations, which varied according to all
possible combinations of three factors:
• Use of primary endpoint from trials (responders have at least 3 SCBM
per week) or secondary endpoint (responders have an increase of at
least 1 SCBM per week);
• Inclusion of all patients or only those who answered “yes” to the
question relating to previous laxative treatment;
• Treatment effect dependent or not dependent on baseline EQ-5D.
These regression equations were applied to a dataset including EQ-5D scores
inferred from the mapping process. The dependent variable is the mapped
EQ-5D at 4 weeks or 12 weeks. Again, no account was taken of adverse
events.
The manufacturers used an unconventional approach to the cost-
effectiveness calculation. However, their approach is equivalent to the more
conventional approach. To see this equivalence, it is helpful to start from the
Copyright 2010 Queen's Printer and Controller of HMSO. All rights reserved.

Page 59 of 84
“conventional” approach. The figure below shows a decision tree in which
those on treatment are classified as responders or non-responders.
Copyright 2010 Queen's Printer and Controller of HMSO. All rights reserved.

Page 60 of 84
patient
prucalopride
responder
non-responder
no treatment
Cost Outcome
Cost per responder
Cost pernon-responder
No cost
QALY gain
No QALY gain
No QALY gain
Figure 8 Decision tree for prucalopride treatment
Since the only cost included in the model is the cost of prucalopride, there is a
zero cost for the comparator arm, which can be taken as “no treatment”.
Therefore the mean difference in cost per patient treated is given as:
( ) ( ) ( ) ( ).responder-non per costrate response-nonresponder per costrate response ×+×
The manufacturer’s response to clarification questions confirmed that non-
responders were assumed to have no QALY gain compared to those not
treated. Therefore the mean QALY gain per patient treated is simply:
( ) ( ).responder per gainQALY meanrate response ×
The conventional calculation of the ICER divides the mean difference in cost
by the mean QALY gain. Therefore the incremental cost-effectiveness ratio
(ICER) can be calculated as:
( ) ( ) ( ) ( )( ) ( ) ( ) ( ) ,
0rate response-nonresponder per gainQALY meanrate responseresponder-non per costrate response-nonresponder per costrate response×+×
×+×
which simplifies to:
( ) ( ) ( ) ( )( ) ( ) .
responder per gainQALY meanrate responseresponder-non per costrate response-nonresponder per costrate response
××+×
Copyright 2010 Queen's Printer and Controller of HMSO. All rights reserved.
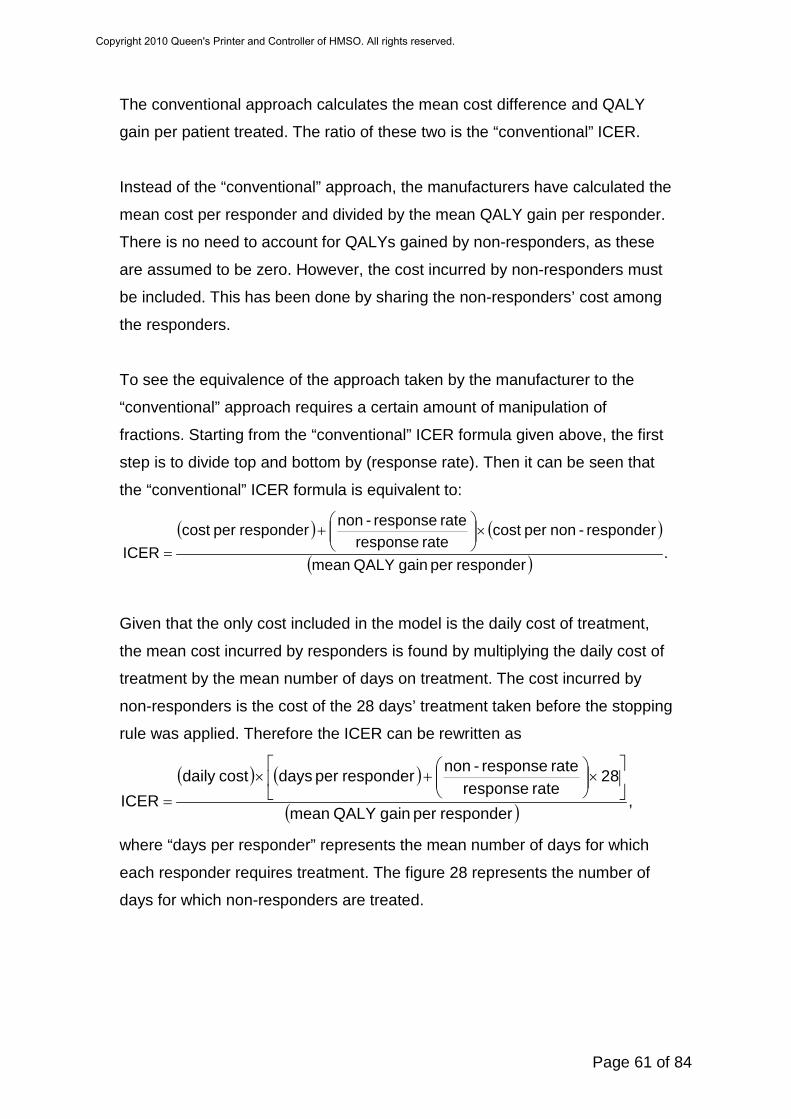
Page 61 of 84
The conventional approach calculates the mean cost difference and QALY
gain per patient treated. The ratio of these two is the “conventional” ICER.
Instead of the “conventional” approach, the manufacturers have calculated the
mean cost per responder and divided by the mean QALY gain per responder.
There is no need to account for QALYs gained by non-responders, as these
are assumed to be zero. However, the cost incurred by non-responders must
be included. This has been done by sharing the non-responders’ cost among
the responders.
To see the equivalence of the approach taken by the manufacturer to the
“conventional” approach requires a certain amount of manipulation of
fractions. Starting from the “conventional” ICER formula given above, the first
step is to divide top and bottom by (response rate). Then it can be seen that
the “conventional” ICER formula is equivalent to:
( ) ( )
( ) .responder per gainQALY mean
responder-non per costrate response
rate response-nonresponder per costICER
×
+
=
Given that the only cost included in the model is the daily cost of treatment,
the mean cost incurred by responders is found by multiplying the daily cost of
treatment by the mean number of days on treatment. The cost incurred by
non-responders is the cost of the 28 days’ treatment taken before the stopping
rule was applied. Therefore the ICER can be rewritten as
( ) ( )
( ) ,responder per gainQALY mean
82rate response
rate response-nonresponder per dayscostdaily ICER
×
+×
=
where “days per responder” represents the mean number of days for which
each responder requires treatment. The figure 28 represents the number of
days for which non-responders are treated.
Copyright 2010 Queen's Printer and Controller of HMSO. All rights reserved.

Page 62 of 84
Now it is a mathematical identity that:
[ ] [ ]
×
+×=
×+
×=×+××=×+365365
365365
365365
1365 CBACBACBACBA
.365365
365
×+×=
CBA
Taking A as (days per responder), B as ,rate response
rate response-non
and C as 28,
we have:
( )
( ) .responder per gainQALY mean
36582
rate responserate response-non
365responder per days365costdaily
ICER
×
+
××
=
The expression inside the square brackets in the formula immediately above
is described in the model as “compliance”. For example, suppose that
responders themselves use an average of 210 days’ treatment per year and
that there are two non-responders for every responder. Then the “compliance”
is calculated as %.73365266
365282
365210
≈=×+
It should be stressed that “compliance” here does not relate to the fraction of
patients who take the medication, but rather to the fraction of a year’s
medication overall taken by responders, increased by adding the non-
responders’ medication to the responders. For this reason, the “compliance”
figure can be over 100%.
In the manufacturers’ model, the “compliance” figure as defined above is used
as an input to the model, and the additional cost per patient is then calculated
as ( ) ( )."compliance"365costdaily ××
QALY gains per responder are estimated by starting with a distribution of
baseline EQ-5D scores, which have been designed to match the population
observed in the trials. Then the quality of life gain was calculated using only
(at most) three terms from the regression equation: the coefficients relating to
Copyright 2010 Queen's Printer and Controller of HMSO. All rights reserved.

Page 63 of 84
treatment, responder, and baseline adjustment for treatment. The last of these
coefficients was fixed at zero in some of the models. Instead of using the point
estimates of these coefficients, independent samples were taken each time
from normal distributions using the standard error from the regression
analysis. This means that the distribution of QALY gain includes a mix of first-
order uncertainty (or patient variability) reflected in the sampling of baseline
EQ-5D scores and second-order uncertainty (or parameter uncertainty)
reflected in the sampling for the regression coefficients.
From this “mixed” sampling, a curve described as a cost-effectiveness
acceptability curve (CEAC) can be constructed. However, this curve is not a
true CEAC as usually understood, because of the mixture of patient variability
with parameter uncertainty.
The manufacturer’s model then produces an average incremental cost, an
average QALY gained, and an “average” ICER. In the original submission, the
average ICERs quoted represented a 50% point on the “CEAC”. In some of
the clarification responses, the ICER has been correctly calculated as the ratio
of the average incremental cost and the average QALY gained.
However, it should be remembered that, in effect, the average incremental
cost given by the manufacturer is a “cost per responder”, sharing the non-
responders’ treatment costs among the responders. The average QALY
gained is also per responder, with no adjustment required. The ratio of these
is indeed equal to the “conventional” ICER, subject to the various assumptions
that have been made in the modelling.
5.3 Results included in manufacturer’s submission
The following results were taken directly from the manufacturer’s original
submission (see p147-8 of the submission):
As there is only a single intervention compared to placebo (equivalent to
standard care) the ICERs and CEACs represent a simple comparison between
Copyright 2010 Queen's Printer and Controller of HMSO. All rights reserved.
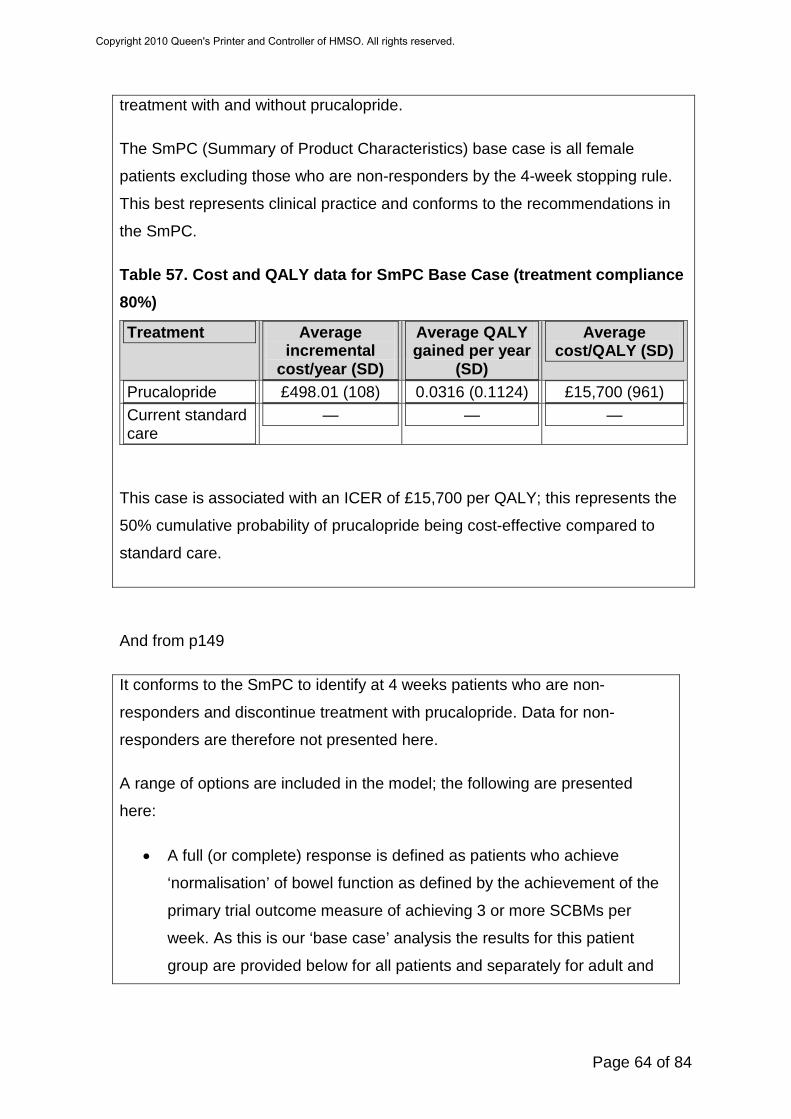
Page 64 of 84
treatment with and without prucalopride.
The SmPC (Summary of Product Characteristics) base case is all female
patients excluding those who are non-responders by the 4-week stopping rule.
This best represents clinical practice and conforms to the recommendations in
the SmPC.
Table 57. Cost and QALY data for SmPC Base Case (treatment compliance 80%)
Treatment Average incremental
cost/year (SD)
Average QALY gained per year
(SD)
Average cost/QALY (SD)
Prucalopride £498.01 (108) 0.0316 (0.1124) £15,700 (961) Current standard care
— — —
This case is associated with an ICER of £15,700 per QALY; this represents the
50% cumulative probability of prucalopride being cost-effective compared to
standard care.
And from p149
It conforms to the SmPC to identify at 4 weeks patients who are non-
responders and discontinue treatment with prucalopride. Data for non-
responders are therefore not presented here.
A range of options are included in the model; the following are presented
here:
• A full (or complete) response is defined as patients who achieve
‘normalisation’ of bowel function as defined by the achievement of the
primary trial outcome measure of achieving 3 or more SCBMs per
week. As this is our ‘base case’ analysis the results for this patient
group are provided below for all patients and separately for adult and
Copyright 2010 Queen's Printer and Controller of HMSO. All rights reserved.

Page 65 of 84
elderly patients. Cost/QALY results for this analysis are in Table 58:
Table 58. Cost and QALY data for ≥3 SCBM responders (primary clinical endpoint)
≥3 SCBM responders
Average incremental
cost/year (SD)
Average QALY gained per year
(SD)
Average cost/QALY (SD)
All females £498.01 (108) 0.0316 (0.1124) £15,700 (961) Adult females £622.00 (0) 0.0369 (0.0450) £16,800 (—) Elderly females £403 (0) 0.0342 (0.1495) £11,700 (—)
And from p150:
All patients who achieved an additional bowel movement per week were
designated as partial responders and the cost-effectiveness of treating all
such patients was analysed. Analysis of the relationship between partial
responders on medication (PROMs) and this partial outcome measure
emphasises that patients who achieve an additional SCBM per week also
experience significant improvements in PROMs. Cost and QALY data are in
Table 59.
Table 59. Cost and QALY data for partial responders (≥1 improvement in SCBM responders = secondary clinical endpoint)
≥1 SCBM responders
Average incremental cost/year (SD)
Average QALY gained per year (SD)
Average cost/QALY (SD)
All females £498 (108) 0.0277 (0.1133) £18,000 (934) Adult females £622 (0) 0.0342 (0.0430) £18,000 (—) Elderly females £403 (0) 0.0255 (0.1466) £15,815 (—)
Both of the cases analysed (≥3 and ≥1improvement in SCBMs/week)
emphasise the cost-effectiveness of prucalopride in treating patients who are
assessed as achieving three or more SCBMs after the initial four weeks of
therapy.
Copyright 2010 Queen's Printer and Controller of HMSO. All rights reserved.

Page 66 of 84
Some more results were added in the response to clarification questions:
The new Excel version of the health economic model also includes a scenario
for continuation of treatment in patients who meet the secondary endpoint of
an increase of 1 SCBM per week with an improvement in HRQoL. An
analysis of patient data that meet this scenario shows an average qaly gain of
0.038 at an average cost per qaly gain of £13,277.
At four weeks (28 days) it is realistic and possible to identify patients who gain
no benefit from treatment with prucalopride and discontinue treatment. The
model considers both responders and non responders. Non-responders cease
treatment at 4 weeks and the cost of the initial four weeks is incorporated into
the acquisition costs of the responders. The costs of non-responders are
therefore included in the responder analysis
The costs and QALYs of ignoring the stopping rule (i.e. aggregating
responders and non responders) is included as scenario four in the new
version of the health economic model. The average qaly gain in this scenario
is 0.014 at an average cost per qaly gained of £34,606
5.4 Validity of results
As noted in Section 5.2, the average incremental cost and QALY are not
those calculated per patient treated, but are in fact per responder, sharing the
cost of treatment for non-responders among the responders’ costs. The
average cost/QALY (ICER) values are in many cases taken from the 50% of
the “cost-effectiveness acceptability curves” derived using a mixture of patient
variability and parameter uncertainty.
Once the structure of the model and its Excel coding had been understood,
the ERG was able to verify the results quoted in Section 5.3 of this report.
One error was found in the response to clarification questions. This appears to
have been a simple copying error affecting one cell of the spreadsheet. The
effect was to change the ICER for the first new scenario from the quoted
figure of £13,277/QALY to around £17,500/QALY. It should also be noted that
Copyright 2010 Queen's Printer and Controller of HMSO. All rights reserved.

Page 67 of 84
the use of random numbers in the model means that final ICERs are only
reliable to within an error range of about £200/QALY.
A more important point in relation to the results quoted is that many of them
relate to a combined population consisting of Adult women (defined as under
65 years of age) and Elderly women (defined as over 65 years of age). The
dose of prucalopride was different for the two groups (2mg per day for the
Adult group and 1mg per day for the Elderly group). It does not seem
appropriate to combine these groups, and it is the view of the ERG that the
results separated by age groups are more appropriate.
A key input to the model is the set of regression analysis results. It has not
been possible to verify these. Subject to that important proviso, the ERG is
satisfied that the model gives a fair reflection of the assumptions used to build
it.
5.5 Summary of uncertainties and issues
The main limitations of the analysis are as follows:
• It has not been possible to verify the regression equations used to
determine the treatment effects in the model. This includes both the
clinical effectiveness and the mapping of patient outcomes to EQ-5D.
• No account has been taken of adverse events.
• Some results were only given in terms of the overall population. It is
important to separate the two age groups: adult and elderly.
• The model only allowed for variation in the response rate and mean
treatment rates to be addressed through the “compliance” figure.
Uncertainty in this figure was not included in the probabilistic analysis.
• No explicit allowance was made for withdrawal from treatment at any
time after 4 weeks.
• The assumption that the last measured QALY gain is sustained for the
rest of the year is not tested in the model.
The first three of these issues have been addressed through additional work
undertaken by the ERG, which is described in the following section.
Copyright 2010 Queen's Printer and Controller of HMSO. All rights reserved.

Page 68 of 84
6 Additional work undertaken by the ERG
A number of alternative analyses on the model have been carried out. The
aim of these is to test the effect of changes to various assumptions contained
within the manufacturer’s submission. It is important to note that the results
here do not in any way represent the ERG’s view of the “correct” ICER.
Throughout this section, separate analysis has been carried out for the two
age groups: Adult (Under 65: dose 2mg per day) and Elderly (Over 65: dose
1mg per day).
6.1 Simplifying the model
The model as supplied uses a very large number of replications (nearly
40,000). Despite this, the estimates of the ICER are still not completely stable.
Results from repeated runs differ by hundreds of pounds per QALY. Given the
near linearity of the model, the point estimate of the ICER should be equal to
that obtained using the point estimates of the regression coefficients and the
mean baseline QALY. The only nonlinearity in the model relates to multiplying
the individual baseline QALY estimates by sampled values of the “treated
baseline adjustment”. Since these samplings are independent, and the model
is linear in each of these parameters individually, the point estimate of the
ICER can indeed be calculated from the mean values of the model
parameters. This was verified by actually comparing the results from the full
model with this approach.
Once the model had been made deterministic, it could easily be restructured
so that response rates and mean days treatment for responders could be
made into separate inputs to the model, instead of being combined in the
“compliance” parameter. Again, the restructuring was verified by comparing
the two versions of the model.
Given the limited time available for this report once the manufacturer’s model
had been fully understood, it was felt by the ERG that deterministic results
varying the appropriate parameters would be sufficient to show the key
uncertainties in the model.
Copyright 2010 Queen's Printer and Controller of HMSO. All rights reserved.

Page 69 of 84
6.2 Alternative model runs completed
The ERG carried out the following alternative model runs. Each was repeated
for Adult (under 65) and Elderly (over 65) groups separately, using all eight of
the regression equations provided by the manufacturer. As noted in Section
5.2 of this report, these equations vary according to all possible combinations
of three factors:
• Use of primary endpoint from trials (responders have at least 3 SCBM
per week) or secondary endpoint (responders have an increase of at
least 1 SCBM per week);
• Inclusion of all patients or only those who answered “yes” to the
laxative question;
• Treatment effect dependent or not dependent on baseline EQ-5D.
The model runs completed were as follows:
1. Based on the simplified version of the manufacturer’s model, using the
“compliance” figure as a main driver of the cost.
2. Using an assumption that responders would take treatment for a mean
of 220 days (based on the manufacturer’s submission page 140), and
response rates taken from pooled estimates of the 4 week response
rate at the appropriate dose calculated in the effectiveness review. The
numbers used were as shown below in Table 14
3. As 2, but assuming that all responders would take the treatment for the
full 365 days in the year modelled.
4. As adverse events were not included in the model, we have attempted
to allow for the possibility that adverse events may be higher in the
treatment arm than the comparator. This was done by increasing costs
by 5% and reducing QALY gain by 5% compared to number 2.
5. Given that it was not possible to verify the regression equations, we
have provided a range of model runs in which the effectiveness was
reduced uniformly. This model run reduced the overall effectiveness
(QALY gain) by 25% compared to number 2.
Copyright 2010 Queen's Printer and Controller of HMSO. All rights reserved.

Page 70 of 84
6. For the same reason as number 5, overall QALY gain reduced by 50%
compared to number 2.
7. Again for the same reason, overall QALY gain reduced by 75%
compared to number 2.
Table 14: Response rates used for the analysis performed by the ERG Population Endpoint Value used Taken from
Adult ≥3 SCBM per week 28.0% Table 2 (p 21 )
Adult ≥1 SCBM increase per week
48.2% Table 3 (p 22 )
Elderly ≥3 SCBM per week 39.5% Table 9 (p 26)
Elderly ≥1 SCBM increase per week
61.1% Table 9 (p 26)
The results of these model runs are summarised in Table 15 and Table 16 for
Adult and Elderly groups respectively. It can be seen that there is not much
difference between the results using the various different regression
equations, shown in different columns in the tables. Using pooled response
rates made no difference to the results for the Adult group with the primary
endpoint. The “compliance” figure used in the manufacturer’s base case was
consistent with this pooled response rate. The same compliance figure was
used for all other results in the first analysis. Replacing by the higher response
rates from the pooled analysis reduced the ICER somewhat. This is because
the cost incurred by non-responders contributes proportionately less to the
overall cost.
Assuming that all responders take treatment for the full year makes a
substantial increase to the ICER. The only other scenarios in which the ICER
was substantially increased were those in which a large reduction was made
in the assumed effectiveness of the treatment.
Copyright 2010 Queen's Printer and Controller of HMSO. All rights reserved.
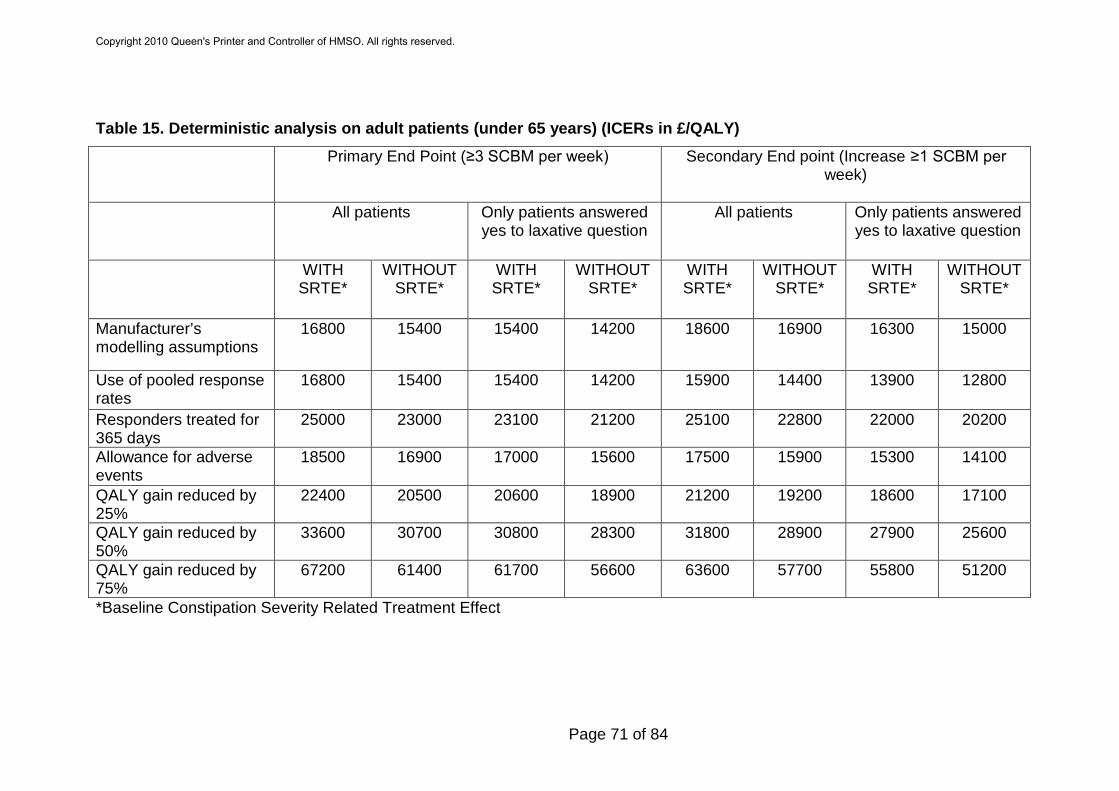
Page 71 of 84
Table 15. Deterministic analysis on adult patients (under 65 years) (ICERs in £/QALY)
Primary End Point (≥3 SCBM per week)
Secondary End point (Increase ≥1 SCBM per week)
All patients Only patients answered
yes to laxative question
All patients
Only patients answered yes to laxative question
WITH
SRTE* WITHOUT
SRTE*
WITH SRTE*
WITHOUT SRTE*
WITH SRTE*
WITHOUT SRTE*
WITH SRTE*
WITHOUT SRTE*
Manufacturer’s modelling assumptions
16800 15400 15400 14200 18600 16900 16300 15000
Use of pooled response rates
16800 15400 15400 14200 15900 14400 13900 12800
Responders treated for 365 days
25000 23000 23100 21200 25100 22800 22000 20200
Allowance for adverse events
18500 16900 17000 15600 17500 15900 15300 14100
QALY gain reduced by 25%
22400 20500 20600 18900 21200 19200 18600 17100
QALY gain reduced by 50%
33600 30700 30800 28300 31800 28900 27900 25600
QALY gain reduced by 75%
67200 61400 61700 56600 63600 57700 55800 51200
*Baseline Constipation Severity Related Treatment Effect
Copyright 2010 Queen's Printer and Controller of HMSO. All rights reserved.

Page 72 of 84
Table 16. Deterministic analysis on elderly patients (over 65 years) (ICERs in £/QALY)
Primary End Point (≥3 SCBM per week)
Secondary End point (Increase ≥1 SCBM per week)
All patients Only patients answered yes to laxative question
All patients
Only patients answered yes to laxative question
WITH SRTE*
WITHOUT SRTE*
WITH SRTE*
WITHOUT SRTE*
WITH SRTE*
WITHOUT SRTE*
WITH SRTE*
WITHOUT SRTE*
Manufacturer’s modelling assumptions
13800 14800 11800 12600 17500 18700 14900 16200
Use of pooled response rates
12400 13300 10600 11400 14200 15200 12100 13200
Responders treated for 365 days
19200 20700 16500 17700 22900 24500 19500 21300
Allowance for adverse events
13600 14700 11700 12500 15700 16800 13400 14600
QALY gain reduced by 25%
16500 17800 14200 15200 19000 20300 16200 17600
QALY gain reduced by 50%
24800 26700 21300 22800 28500 30500 24300 26500
QALY gain reduced by 75%
49500 53300 42600 45500 56900 61000 48600 52900
*Baseline Constipation Severity Related Treatment Effect
Copyright 2010 Queen's Printer and Controller of HMSO. All rights reserved.

Page 73 of 84
7 Discussion
There were 36 trials/studies listed and nine of these were fully described in
the submission. A different selection of 10 trials and studies were used to
inform the economic model but five of these were not described in the
submission.
In the trials that were described, participants were adult and elderly men and
women with chronic constipation. It appears that many participants in these
trials had not failed previous laxative use and the spread of baseline predicted
EQ-5D scores suggested than all patients were unlikely to have had severe
chronic constipation. In the three pivotal trials, 17.0% of patients at baseline
answered that they had found their previous treatment adequate. The types of
patients for whom prucalopride is indicated, those with severe chronic
constipation and refractory to laxative treatments, would be unlikely to have
found previous treatments adequate. Therefore, the patients studied in the
pivotal trials were not those with laxative-refractory chronic constipation as per
the licensed indication.
The intervention in the studies was oral prucalopride at doses of 1mg, 2mg or
4mg per day and the comparators were placebo or a different dose of
prucalopride. Outcome results given were spontaneous complete bowel
movements (SCBMs), spontaneous bowel movements (SBMs),
bisacodyl/enema use, symptoms (including PAC-Sym), quality of life (PAC-
QOL, SF-36) and adverse events. The primary outcome was the proportion of
patients with ≥3 SCBMs/week over weeks 1-4 and 1-12. There was a
statistically significant improvement in this outcome in the 2mg prucalopride
arm (licensed dose in adult women) compared to placebo for adults in the
three pivotal RCTs (INT-6, USA-11, USA-13). Although two RCTs used to
inform the economic model were in elderly patients, only one was fully
described in the submission (INT-12) and this did not show a significant
improvement in the primary outcome measure of the proportion of patients
Copyright 2010 Queen's Printer and Controller of HMSO. All rights reserved.

Page 74 of 84
with average ≥3 SCBMs/week at week 4 in the 1mg prucalopride arm
(licensed dose in elderly women) compared to placebo.
Rescue treatment with a laxative (bisacodyl) or an enema was used in both
arms of the three pivotal RCTs in adults. Any bowel movements that occurred
due to these treatments were considered to be non-spontaneous and were
discounted from the count of SCBMs (the primary outcomes for these
studies). From information supplied by the manufacturer, it is evident that the
number of non-spontaneous bowel movements that were discounted from the
placebo was higher than the number discounted from the prucalopride group.
7.1 Summary of clinical effectiveness issues
• It is apparent that many of the patients did not have laxative-refractory
chronic constipation.
• The comparator group in trials was inappropriate. It was neither a true
placebo or a proper representation of treatment with laxatives.
• No justification was given for why particular trials and particular patients
from these trials were selected to inform the economic model.
• No description or results for five of the trials that have contributed data
to the economic model are given in the submission.
• The assumption that effectiveness data can be extrapolated to one
year is unjustified.
• There is a lack of transparency around the data and assumptions that
have been used to inform effectiveness results in the economic model.
• There is a lack of transparency around the calculation of EQ-5D
scores.
Taking all of the clinical effectiveness issues together, it appears that the
estimate of the clinical effectiveness used in the economic modelling is likely
to be an overestimate, but, due to lack of transparency, the magnitude of
overestimation is uncertain.
Copyright 2010 Queen's Printer and Controller of HMSO. All rights reserved.

Page 75 of 84
7.2 Summary of cost effectiveness issues
The cost effectiveness analysis is based on a new model supplied by the
manufacturer. The main limitations of the analysis are as follows:
• It has not been possible to verify the regression equations used to
determine the treatment effects in the model. This includes both the
clinical effectiveness and the mapping of patient outcomes to EQ-5D
• No account has been taken of adverse events
• Some results were only given in terms of the overall population. It is
important to separate the two age groups: adult and elderly
• The model only allowed for variation in the response rate and mean
treatment rates to be addressed through the “compliance” figure.
Uncertainty in this figure was not included in the probabilistic analysis.
• No explicit allowance was made for withdrawal from treatment at any
time after 4 weeks.
• The assumption that the last measured QALY gain is sustained for the
rest of the year is not tested in the model.
The first three of these issues have been addressed through additional work
undertaken by the ERG. The results of the ERG reanalyses are summarised
in Table 17
Copyright 2010 Queen's Printer and Controller of HMSO. All rights reserved.

Page 76 of 84
Table 17. Summary of ERG reanalysis (ICERs in £/QALY)
Scenarios Adults Elderly
Manufacturer’s modelling assumptions
14200 to 18600 11800 to 18700
Use of pooled response rates
14200 to 16800 10600 to 15200
Responders treated for 365 days
20200 to 25100 16500 to 24500
Allowance for adverse events
14100 to 18500 11700 to 16800
QALY gain reduced by 25% 17100 to 22400 14200 to 20300
QALY gain reduced by 50% 25600 to 33600 21300 to 30500
QALY gain reduced by 75% 51200 to 67200 42600 to 61000
7.3 Implications for research
The main research question to be addressed is the clinical effectiveness of
prucalopride in adults with chronic constipation in whom standard laxatives
have failed to provide adequate relief, and for whom more invasive
procedures, such as direct rectal intervention, are being considered. A 12-
month trial in these patients would be useful. Prucalopride should be
compared to current treatment (such as direct rectal intervention) in this
patient group and the trial should measure costs and EQ-5D so that a direct
estimate of quality of life can be made.
Copyright 2010 Queen's Printer and Controller of HMSO. All rights reserved.

Page 77 of 84
Appendix 1: Additional ERG searches
Database: Cochrane Library (Wiley) 2010 Issue 5 (CDSR) Search strategy: #1 prucalopride #2 resolor #3 #1 or #2 Database: Cochrane Library (Wiley) 2010 Issue 2 (CENTRAL, NHS EED, HTA) Search strategy: #1 prucalopride #2 resolor #3 #1 or #2 Database: MEDLINE (Ovid) 1950 to May Week 2 2010 Search Strategy: 1 prucalopride.mp. or exp prucalopride/ 2 resolor.mp. 3 or/1-2 4 limit 3 to "therapy (sensitivity)" Database: EMBASE (Ovid) 1980 to 2010 Week 19 Search Strategy: 1 prucalopride.mp. or exp prucalopride/ 2 resolor.mp. 3 or/1-2 4 limit 3 to "treatment (2 or more terms high sensitivity)" 5 chronic constipation.mp. or chronic constipation/ 6 4 and 5 Database: MEDLINE (Ovid) 1950 to May Week 2 2010 Search Strategy: 1 prucalopride.mp. or exp prucalopride/ 2 resolor.mp. 3 or/1-2 4 limit 3 to “costs” (sensitivity) 5 chronic constipation.mp. 6 limit 5 to "costs (sensitivity)" 7 4 or 6 Database: MEDLINE (Ovid) 1950 to May Week 2 2010 Search Strategy: 1 prucalopride.mp. or exp prucalopride/ 2 resolor.mp. 3 or/1-2 4 limit 3 to "economics (sensitivity)"
Copyright 2010 Queen's Printer and Controller of HMSO. All rights reserved.

Page 78 of 84
Database: EMBASE (Ovid) 1980 to 2010 Week 19 Search Strategy: 1 prucalopride.mp. or exp prucalopride/ 2 resolor.mp. 3 or/1-2 4 limit 3 to "economics (2 or more terms high sensitivity)" Database: MEDLINE (Ovid) 1950 to May Week 2 2010 Search Strategy: 1 prucalopride.mp. or exp prucalopride/ 2 resolor.mp. 3 or/1-2 4 limit 3 to "therapy (sensitivity)" 5 from 4 keep 1-44 6 chronic constipation.mp. 7 decision support techniques/ 8 markov.mp. 9 exp models economic/ 10 decision analysis.mp. 11 cost benefit analysis/ 12 or/7-11 13 6 and 12 14 3 and 12 15 13 or 14 Database: MEDLINE (Ovid) 1950 to May Week 2 2010 Search Strategy: 1 prucalopride.mp. or exp prucalopride/ 2 resolor.mp. 3 or/1-2 4 chronic constipation.mp. 5 3 or 4 6 quality of life/ 7 life style/ 8 health status/ 9 health status indicators/ 10 or/6-9 11 5 and 10
Copyright 2010 Queen's Printer and Controller of HMSO. All rights reserved.

Page 79 of 84
Appendix 2: Quality Assessment using ScHARR-TAG economic modelling checklist
Factor Appraisal
Title Prucalopride (Resolor®) for the treatment of women with chronic
constipation in whom standard laxative regimens have failed to
provide adequate relief
A statement of the problem
What is the incremental cost-effectiveness of Prucalopride compared
to standard care for treating chronic constipated patients?
A discussion of the need for modelling
Modelling is required for the following reasons:
• To calculate the probability that the treatment is cost-effective
at different ICER thresholds
• To extrapolate changes in outcomes over the year during the
follow-up period of the clinical trials.
• To obtain comparable outcomes in the population treated
with prucalopride and not treated, in terms of generic quality
of life (QALYs) measures.
• To test the robustness of conclusions to changes in primary
end point (reaching ≥3 SCBM per week) and secondary end
point (reaching ≥1 improvement in SCBM per week).
Assessment by ERG: The decision to use modelling was
appropriate given the data constraints.
A description of the relevant factors and outcomes
Relevant factors and outcomes are the following:
• Two groups of patient level data are used: adult (<65 years,
2mg tablet daily-dosage) and elderly (>65 years 1mg tablet
daily-dosage).
• The EQ-5D baseline of these two groups of patients is the
result of the extension of a gamma distribution (carried out
for a list of clinical trials incorporated into the model) on a
larger (synthetic) sample of 38650 patients.
• Responders are considered to be those who reach the
primary end point of ≥3SCBM (spontaneous complete bowel
movements) per week, or, in an alternative analysis, the
secondary end point of ≥1SCBM improvement.
• The variables used in the model to calculate the EQ-5D
Copyright 2010 Queen's Printer and Controller of HMSO. All rights reserved.
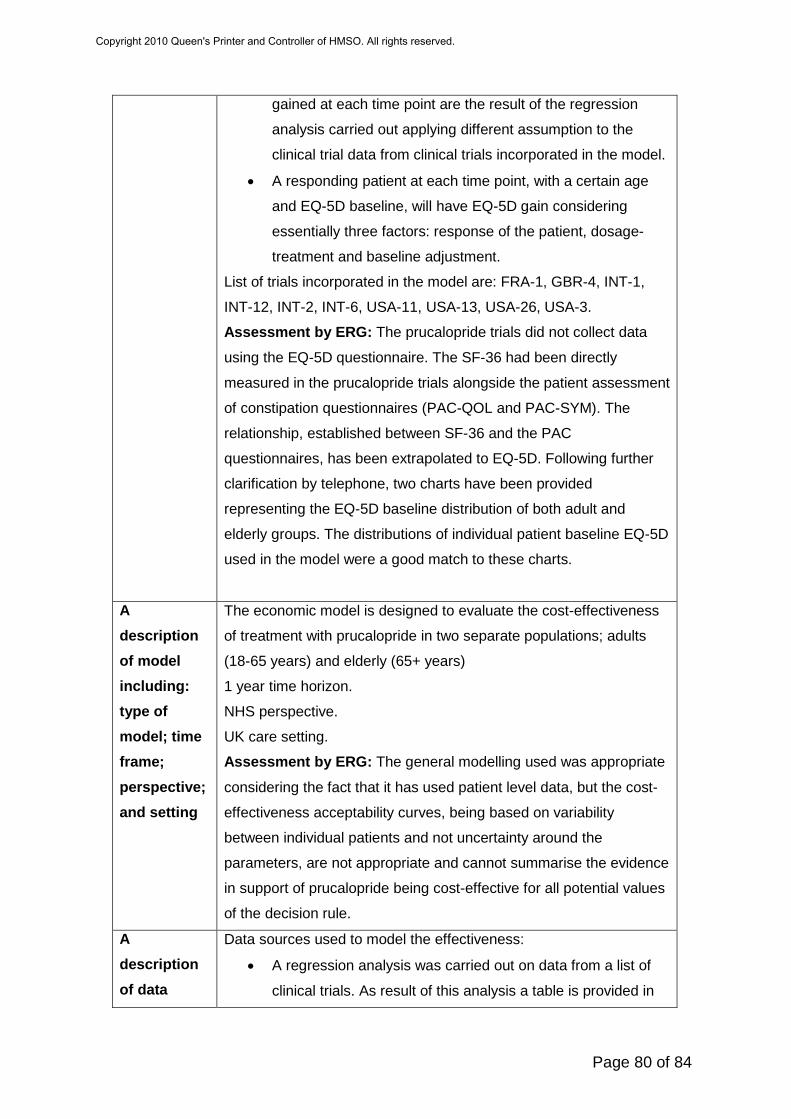
Page 80 of 84
gained at each time point are the result of the regression
analysis carried out applying different assumption to the
clinical trial data from clinical trials incorporated in the model.
• A responding patient at each time point, with a certain age
and EQ-5D baseline, will have EQ-5D gain considering
essentially three factors: response of the patient, dosage-
treatment and baseline adjustment.
List of trials incorporated in the model are: FRA-1, GBR-4, INT-1,
INT-12, INT-2, INT-6, USA-11, USA-13, USA-26, USA-3.
Assessment by ERG: The prucalopride trials did not collect data
using the EQ-5D questionnaire. The SF-36 had been directly
measured in the prucalopride trials alongside the patient assessment
of constipation questionnaires (PAC-QOL and PAC-SYM). The
relationship, established between SF-36 and the PAC
questionnaires, has been extrapolated to EQ-5D. Following further
clarification by telephone, two charts have been provided
representing the EQ-5D baseline distribution of both adult and
elderly groups. The distributions of individual patient baseline EQ-5D
used in the model were a good match to these charts.
A description of model including: type of model; time frame; perspective; and setting
The economic model is designed to evaluate the cost-effectiveness
of treatment with prucalopride in two separate populations; adults
(18-65 years) and elderly (65+ years)
1 year time horizon.
NHS perspective.
UK care setting.
Assessment by ERG: The general modelling used was appropriate
considering the fact that it has used patient level data, but the cost-
effectiveness acceptability curves, being based on variability
between individual patients and not uncertainty around the
parameters, are not appropriate and cannot summarise the evidence
in support of prucalopride being cost-effective for all potential values
of the decision rule.
A description of data
Data sources used to model the effectiveness:
• A regression analysis was carried out on data from a list of
clinical trials. As result of this analysis a table is provided in
Copyright 2010 Queen's Printer and Controller of HMSO. All rights reserved.

Page 81 of 84
sources, with description of respective strengths and weaknesses
the submission, containing the variables applied in the
model.
• The analysis carried out was per-responder; each individual
patient with a certain baseline characteristic will have a
specific incremental EQ-5D depending on the variables of the
model extrapolated by the clinical trials used in the
regression analysis.
• Only the acquisition cost of prucalopride was incorporated in
the model since no other costs-resources were collected
during the trials.
From the list of studies included in the model only one is the pivotal
trial for elderly patients (INT-12) and three of them are pivotal for
adult patients (INT-6, USA-13, USA-11)
Assessment by ERG: The clinical trials data have been pooled
together and being used to run the regression analysis. No
information on the pooling process has been provided; no meta-
analysis has been carried out either.
Key assumptions relating to model structure and data stated
• Only the acquisition cost of prucalopride is considered in the
model. It is assumed that responders take the treatment for an
average of 220 days through the year and that non-responders
stop the treatment after 28 days.
• The EQ-5D baseline is considered to be the placebo data from
the prucalopride clinical trial. This assumption was undertaken
because the target patient population for prucalopride had
already failed on laxatives and subsequently expressed their
dissatisfaction with laxatives.
• The adverse event profile of prucalopride looks quite similar to
that of placebo. So adverse events are not included in the model.
Assessment by ERG: The broad structural assumptions used in
modelling were appropriate. However it does not allow for
constructing any uncertainly around the mean of the cost. Data on
QALYs gained were collected at 4 weeks and 12 weeks. The
incremental QALYs at 4 weeks is applied across the first month of
treatment and the incremental QALYs at 12 weeks is applied across
the same for the 11 remaining months of the year. No explicit
allowance is made for patients stopping treatment later than 4
Copyright 2010 Queen's Printer and Controller of HMSO. All rights reserved.

Page 82 of 84
weeks.
It has been assumed that non-responders have no QALY gain.
Instead of calculating average costs and QALYs per patient treated,
the average QALYs per responder have been calculated. For costs,
the average cost is in effect the total cost (across all patients)
divided by the number of responders. While this means that the
ICER eventually calculated is the correct ICER given the
assumptions in the model, the average costs and QALYs do not
carry the obvious meaning.
Disease specific factors included within modelling (Items to be specified in conjunction with expert clinical input)
• Two subgroup analyses were undertaken in the model for
adults and elderly patients, in order to reflect the clinical trials
dosage response data.
• Having not collected any resources used during the clinical
trials, it was considered preferable not to add any additional
GP and specialist visits for the placebo group.
Validation The mapping analysis has been extensively reviewed by Dr
Antonieta Medina Lara (senior research fellow) at the University of
Liverpool, external validation process was undertaken with Professor
John Brazier from ScHARR (University of Sheffield). The approach,
analysis and results of the mapping process have been accepted for
publication in the journal Pharmacoeconomics.
Results The results reported in the submission consider
• Average incremental cost/year (SD) = £498.01 (108)
all female patients
responders:
• Average QALY gained per year (SD) = £0.0316 (0.1124)
• Average cost/QALY (SD) = £15,700 (961)
Two further analyses on two groups of female patients (adult and
elderly) were presented; those analyses were considered for
patients who achieved the primary end point (≥3SCBM per week)
Copyright 2010 Queen's Printer and Controller of HMSO. All rights reserved.
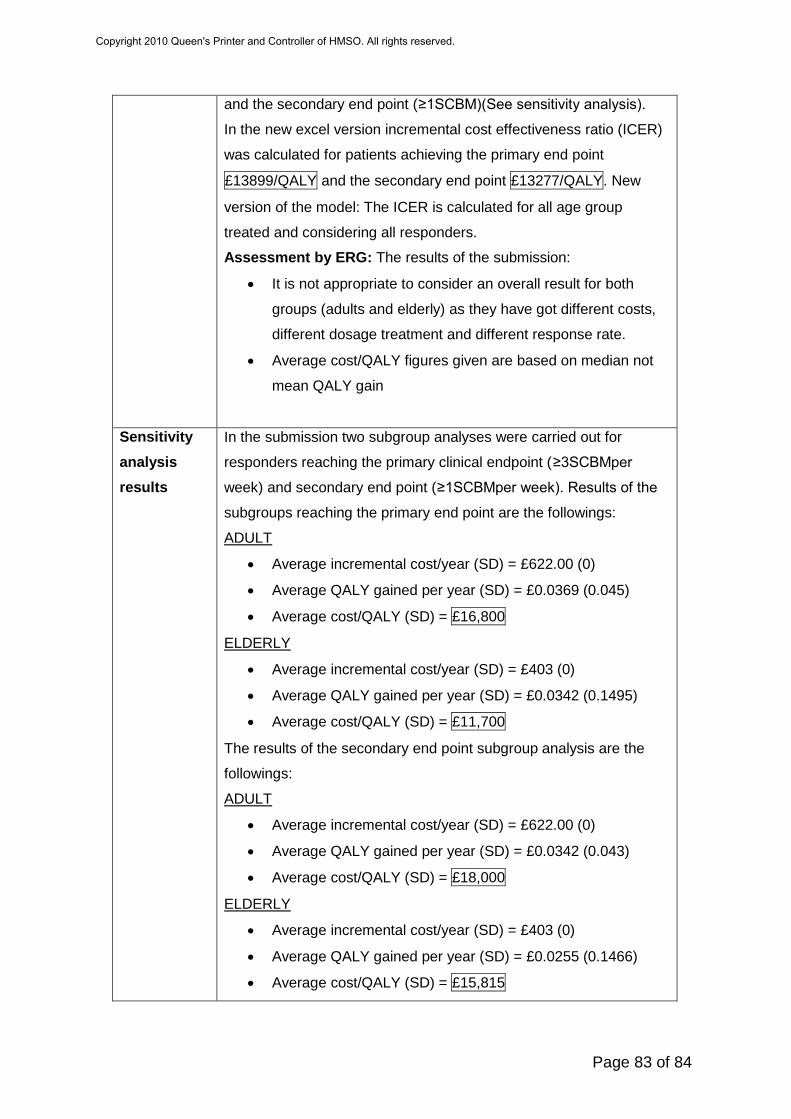
Page 83 of 84
and the secondary end point (≥1SCBM)(See sensitivity analysis).
In the new excel version incremental cost effectiveness ratio (ICER)
was calculated for patients achieving the primary end point
£13899/QALY and the secondary end point £13277/QALY. New
version of the model: The ICER is calculated for all age group
treated and considering all responders.
Assessment by ERG: The results of the submission:
• It is not appropriate to consider an overall result for both
groups (adults and elderly) as they have got different costs,
different dosage treatment and different response rate.
• Average cost/QALY figures given are based on median not
mean QALY gain
Sensitivity analysis results
In the submission two subgroup analyses were carried out for
responders reaching the primary clinical endpoint (≥3SCBMper
week) and secondary end point (≥1SCBMper week). Results of the
subgroups reaching the primary end point are the followings:
• Average incremental cost/year (SD) = £622.00 (0)
ADULT
• Average QALY gained per year (SD) = £0.0369 (0.045)
• Average cost/QALY (SD) = £16,800
• Average incremental cost/year (SD) = £403 (0)
ELDERLY
• Average QALY gained per year (SD) = £0.0342 (0.1495)
• Average cost/QALY (SD) = £11,700
The results of the secondary end point subgroup analysis are the
followings:
• Average incremental cost/year (SD) = £622.00 (0)
ADULT
• Average QALY gained per year (SD) = £0.0342 (0.043)
• Average cost/QALY (SD) = £18,000
• Average incremental cost/year (SD) = £403 (0)
ELDERLY
• Average QALY gained per year (SD) = £0.0255 (0.1466)
• Average cost/QALY (SD) = £15,815
Copyright 2010 Queen's Printer and Controller of HMSO. All rights reserved.

Page 84 of 84
In the new version of excel costs and QALYs of ignoring the
stopping rule are presented (i.e. aggregating responders and non
responders). The scenario that describes this is scenario four
(responders defined as ≥3SCBM, without baseline constipation
severity related treatment effect). The average QALY gained is
0.014 at an average cost per QALY gained of £34,606.
Copyright 2010 Queen's Printer and Controller of HMSO. All rights reserved.