evidence of positive selection on a class iadh locus · the american journal of human genetics...
TRANSCRIPT

www.ajhg.org The American Journal of Human Genetics Volume 80 March 2007 441
ARTICLE
Evidence of Positive Selection on a Class I ADH LocusYi Han,* Sheng Gu,* Hiroki Oota,† Michael V. Osier,‡ Andrew J. Pakstis, William C. Speed,Judith R. Kidd, and Kenneth K. Kidd
The alcohol dehydrogenase (ADH) family of enzymes catalyzes the reversible oxidation of alcohol to acetaldehyde. SevenADH genes exist in a segment of ∼370 kb on 4q21. Products of the three class I ADH genes that share 95% sequenceidentity are believed to play the major role in the first step of ethanol metabolism. Because the common belief thatselection has operated at the ADH1B*47His allele in East Asian populations lacks direct biological or statistical evidence,we used genomic data to test the hypothesis. Data consisted of 54 single-nucleotide polymorphisms (SNPs) across theADH clusters in a global sampling of 42 populations. Both the Fst statistic and the long-range haplotype (LRH) testprovided positive evidence of selection in several East Asian populations. The ADH1B Arg47His functional polymorphismhas the highest Fst of the 54 SNPs in the ADH cluster, and it is significantly above the mean Fst of 382 presumably neutralsites tested on the same 42 population samples. The LRH test that uses cores including that site and extending on bothsides also gives significant evidence of positive selection in some East Asian populations for a specific haplotype carryingthe ADH1B*47His allele. Interestingly, this haplotype is present at a high frequency in only some East Asian populations,whereas the specific allele also exists in other East Asian populations and in the Near East and Europe but does not showevidence of selection with use of the LRH test. Although the ADH1B*47His allele conveys a well-confirmed protectionagainst alcoholism, that modern phenotypic manifestation does not easily translate into a positive selective force, andthe nature of that selective force, in the past and/or currently, remains speculative.
From the Department of Genetics, School of Medicine, Yale University, New Haven, CTReceived July 14, 2006; accepted for publication January 5, 2007; electronically published January 30, 2007.Address for correspondence and reprints: Dr. Kenneth K. Kidd, 333 Cedar Street, School of Medicine, Yale University, SHM I-353, New Haven, CT
06510. E-mail: [email protected]* These two authors contributed equally to this work.† Present affiliation: Department of Integrated Biosciences, University of Tokyo, Kashiwa, Japan.‡ Present affiliation: College of Sciences, Biological Sciences, Rochester Institute of Technology, Rochester, NY.
Am. J. Hum. Genet. 2007;80:441–456. � 2007 by The American Society of Human Genetics. All rights reserved. 0002-9297/2007/8003-0006$15.00DOI: 10.1086/512485
The metabolism of alcohol can significantly influence hu-man drinking behaviors and the development of alcohol-ism (also called “alcohol dependence” [MIM %103780]),alcohol use disorder, and other alcohol-induced organdamage.1 Most ethanol digestion occurs through a two-step oxidation: alcohol to acetaldehyde and acetaldehydeto acetate. These steps are catalyzed mainly by alcoholdehydrogenase and acetaldehyde dehydrogenase 2, re-spectively. Various geographic regions have different fre-quencies for the genetic polymorphisms in the genes(ADH1B [MIM %103720], ADH1C [MIM %103730], andALDH2 [MIM %100650]) for the primary enzymes.2–6
Alcoholism is a multifactorial disorder. It has been clearfor some time that ADH variants common in East Asiaaffect the risk of developing alcoholism.7–12 Two genome-wide linkage studies—Collaborative Studies on Geneticsof Alcoholism of populations of European ancestry13,14 andNational Institute on Alcohol Abuse and Alcoholism stud-ies of Amerindian populations15—both support the ge-netic linkage between alcoholism and a region on chro-mosome 4 encompassing the ADH genes.
Human ADH genes are located in an ∼370-kb cluster onthe long arm of chromosome 4. On the basis of gene ex-pression and sequence alignment, the seven distinct genesrelate to the five enzyme classes as follows: class I, ADH1A(MIM %103700), ADH1B, and ADH1C; class II, ADH4 (MIM
%103740); class III, ADH5 (MIM %103710); class IV, ADH7(MIM %600086); and class V, ADH6 (MIM %103735). Thethree class I ADH genes are closely clustered on an ∼77-kb region on chromosome 4 (4q21), flanked upstream(telomeric) ∼60 kb by ADH7 and ∼50 kb downstream (cen-tromeric) by ADH6 (fig. 1).
The protective effect against alcoholism of the ADH1B*47His (previously named “ADH2*2”) allele in East Asianpopulations is one of the most studied and confirmed as-sociations of a genetic polymorphism and a complex be-havior.16 In fact, three functional polymorphisms at classI ADH genes—ADH1B Arg47His and ADH1C Arg271Glnand Ile349Val—are in strong linkage disequilibrium (LD),17
and the variants ADH1B*47His and ADH1C*271Gln&349Val (previously named “ADH3*2”) produce enzymeswith higher Vmax enzyme activity for alcohol oxidation.The haplotype with these three variants shows higher fre-quency in nonalcoholics than in alcoholics in many EastAsian populations, including Han Chinese,4,7,17,18 Japa-nese,19,20 and Koreans,10 making it difficult to attribute theeffect to any single site. In addition, the evidence thatsupports the protective role of ADH1B*47His is not limitedto East Asian populations; it has been extended to Euro-pean,21 Jewish,22 and European Australian23 populations,in which it is much less frequent than in East Asian pop-ulations. The observed protective effect of the ADH1C*

442 The American Journal of Human Genetics Volume 80 March 2007 www.ajhg.org
Figure 1. Map of the 54 SNPs that cover the ADH7, ADH1C, ADH1B, ADH1A, and ADH4 genes on chromosome 4. SNPs within eachlocus are shown in an enlarged box with segmented border, whereas SNPs in intergenic regions are listed beside the chromosomesegment. The different scales of distance measurement are shown. SNPs are numbered as mentioned in the text.
349Ile allele is attributable to its strong LD with theADH1B*47His allele in East Asian populations9,17 but ap-pears to have an association with alcoholism in other pop-ulations in the absence of the ADH1B*47His allele.24–26
There has been a general belief that selection has op-erated on these alleles,27–31 because (1) mutations affectingthe two sequential steps in ethanol metabolism are bothcommon only in East Asia, and (2) the mutations have areinforcing effect of increased acetaldehyde that is be-lieved to be responsible for the flushing response to eth-anol intake. Although suggestive, this evidence is hardlyproof that selection has operated in East Asia.
Osier et al.27 studied nine SNPs in the class I region ofADH. To provide a better understanding of both geneticdiversity and the nature of LD in the class I ADH cluster,we examined additional populations for the SNPs theystudied (fig. 1) and additional SNPs in all populations. Wegenotyped individuals from 42 global populations, for atotal of 54 SNPs across most of the ADH region.
Positive selection can leave various detectable signaturesin the genome. As many have argued,6,32–34 an unusuallyhigh Fst can be the signature of selection operating in oneregion of the world. The LRH test determines whetherthere has been a rapid rise in haplotype frequency, whichcan also be a signature of evolutionarily recent positive
selection.35 Given the general belief that the Arg47Hispolymorphism in the ADH1B polypeptide has been thesubject of selection in East Asia, we applied both tests toour data, to search for a genomic signature of selectionat ADH1B, with a focus on that polymorphism and EastAsian populations. The analyses of these data providestrong evidence of selection, but the selective force is stillnot known.
Material and MethodsPopulation Samples
We typed 2,250 individuals from a global sample of 42 popula-tions. According to population ancestry and geographic locations,these 42 populations are categorized into nine groups: 9 African,3 southwest Asian, 9 European, 2 northwestern Asian, 8 EastAsian, 2 Pacific Island, 1 eastern Siberian, 4 North American, and4 South American. The naming convention and geographic cat-egorization of these populations is shown in table 1. Sample de-scriptions and sample sizes can be found in the Allele FrequencyDatabase (ALFRED) by searching on the population names.
DNA samples were extracted from lymphoblastoid cell linesthat have been established and/or grown in the Yale Universitylaboratory of J.R.K. and K.K.K. The methods of transformation,cell culture, and DNA purification have been described else-where.36,37 For most samples, all volunteers were apparently nor-

www.ajhg.org The American Journal of Human Genetics Volume 80 March 2007 443
Table 1. Naming Conventions and Geographic Categorization of 42 Populations
Group Population(s) in Each Group
Africa Biaka (BIA), Mbuti (MBU), Yoruba (YOR), Ibo, Hausa (HAS), Chagga (CGA), Masai (MAS), Ethiopian Jews (ETJ), and AfricanAmerican (AAM)
Southwestern Asia Yemenite Jews (YMJ), Druze (DRU), and Samaritans (SAM)Europe Adygei (ADY), Chuvash (CHV), Russians from Archangelsk (RUA), Russians from Vologda (RUV), Ashkenazi Jews (ASH), Finns
(FIN), Danes (DAN), Irish (IRI), and European Americans (EAM)Northwestern Asia Komi Zyriane (KMZ), and Khanty (KTY)East Asia Chinese from San Francisco (CHS), Chinese from Taiwan (CHT), Hakka (HKA), Koreans (KOR), Japanese (JPN), Ami, Atayal
(ATL), and Cambodians (CBD)Pacific Islands Nasioi (NAS) and Micronesians (MIC)Siberia Yakut (YAK)North America Cheyenne (CHY), Pima-Arizona (PMA), Pima-Mexico (PMM), and Maya (MAY)South America Quechua (QUE), Ticuna (TIC), Rondonian Surui (SUR), and Karitiana (KAR)
mal and healthy, with no diagnosis of alcoholism or related dis-orders. Taiwan samples contained some subjects with an alco-holism diagnosis.17 All samples were collected after receipt ofappropriate informed consent and relevant institutional reviewboard approval.
Polymorphic Sites
The 54 SNPs studied extend across ∼350 kb and cover five ADHgenes (ADH7, ADH1C, ADH1B, ADH1A, and ADH4) and the in-tergenic regions. We selected those 54 SNPs on the basis of twomajor criteria: (1) they have sufficient (�0.1) heterozygosities tobe used as informative DNA markers for our haplotype analyses,and (2) the SNP density can reach at least 1 SNP per 6 kb, es-pecially in and around the class I ADH cluster. We obtained theinformation for most of the 54 SNPs from the dbSNP databaseand the UCSC Genome Browser. Ten SNPs came from the AppliedBiosystems (ABI) TaqMan Drug Metabolism Enzyme genotypingassays, and four SNPs in the class I ADH cluster—ADH1B Arg47His(rs1229984), ADH1B RsaI (rs2066701), ADH1C Ile349Val (rs698),and ADH1C HaeIII (rs1693425)—were already included in theearlier studies in our laboratory.27 The dbSNP numbers, the AL-FRED numbers, and relative locations of all SNPs are listed intable 2 and figure 1. TaqMan was the main genotyping method,with a small subset of SNPs genotyped with fluorescence polar-ization (FP) and PCR-based RFLP methods, as noted; some werefrom the series of Drug Metabolism Assays from ABI. SNP het-erozygosity in all populations was checked using HAPLOT.38 Seeappendix A for details of marker-typing information.
Ancestral Allele Inference
The ancestral states of several sites were described elsewhere.27,41
We determined the ancestral states of the remaining SNPs byusing the same methods, same primers, or TaqMan probes togenotype genomic DNA for nonhuman primates: three chim-panzees (Pan troglodytes), three gibbons (Hylobates), three gorillas(Gorilla gorilla), three orangutans (Pongo pygmaeus), and three bon-obos (Pan paniscus).
Statistical Analyses
Genotypes and allele frequencies for each individual site werecalculated by direct gene counting, under the assumption of co-dominant inheritance. Fst values, as
2j,
p q
were calculated with the program DISTANCE. Maximum-likeli-hood estimates of haplotype frequencies were calculated from theindividual multisite typing results of individuals in each popu-lation, with the program HAPLO.42
We examined the extended haplotype homozygosity (EHH)35
and relative EHH (REHH)35 for all 54 SNPs, using two core regionsdefined by the ADH1B*47His allele and incorporating SNPs flank-ing both sides, on the basis of the Fst results. We initially examinedthe EHH and REHH for all 54 SNPs, using SNPs within the ADH1Bgene (SNPs 34–38 in fig. 1) as the core region. On the basis ofthose results and the Fst results, we then examined the upstreamregion as the core (SNPs 31–34). EHH is defined as the probabilitythat two randomly chosen chromosomes carrying a tested corehaplotype are homozygous at all SNPs for the entire interval fromthe core region to the distance x. REHH is defined as the ratio ofthe EHH of the tested core haplotype to the EHH of the groupedset of core haplotypes at the region not including the tested corehaplotype.35
To determine whether the high REHH observed in East Asianpopulations is significant, simulations with different parameterinputs were performed to provide reference REHH values. Thethree models for simulations were a population that experienceda bottleneck and a sudden expansion, a population that experi-enced a bottleneck and an exponential growth, and a populationwith a constant size. The schemas for the simulations are illus-trated in figure 2. After simulated REHH data points had beenobtained, they were categorized into 20 bins on the basis of thehaplotype frequency, and then 50th, 75th, and 95th percentilelines were drawn. Observed REHH values were thus comparedwith percentile lines for evidence of selection. P values were ob-tained by first binning the simulated data into 20 bins on thebasis of the core-haplotype frequency, then by log-transformingthe REHH values in each bin to approach normality, and thenby calculating the mean and SD. Observed values !.05 were con-sidered significant.
ResultsAllele Frequency
The allele frequencies for all polymorphisms for all 42populations are available on the ALFRED Web site and areretrievable with use of the numbers listed in table 2. Ofthe allele frequencies evaluated, 10.6%42 # 54 p 2,268were fixed and 5.5% had heterozygosity !0.05. Of theHardy-Weinberg equilibrium (HWE) tests, 1.7% resultedin a P value of .01–.05, and 0.4% fell below the .01 sig-nificance level. These percentages are below the expecta-

444 The American Journal of Human Genetics Volume 80 March 2007 www.ajhg.org
Table 2. Spacing, Typing Method, and Reference Numbersfor Allele Frequencies for the 54 SNPs in the ADH Region
SNPa
dbSNPNumber
Distance toNext SNP
(bp)
TaqMan AssayNumber or
Typing MethodALFREDNumber
1 rs17537595 286 E_ADH7TATA SI001742O2 rs1154469 6,510 C_8934015 SI000879Y3 rs1573496 7,808 E_rs1573496 S1001660N4 rs971074 2,265 C_11942306 SI000881R5 rs1154458 3,613 RFLP SI000231G6 rs2851011 109 C_16129902 SI001204H7 rs284784 1,897 C_1492617 SI000878X8 rs284786 710 C_714911 SI000877W9 rs729147 3,574 FP SI001207K10 rs969804 2,356 C_8933988 SI001466R11 rs2083687 4,551 C_11349421 S1001661O12 rs17028973 3,024 E_rs17028973 S1001662P13 rs1583977 5,224 E_rs1583977 SI001741N14 rs1442487 6,750 E_rs1442487 S1001663Q15 rs2646012 4,630 E_rs2646012 S1001664R16 rs10516439 4,477 C_11349382 S1001665S17 rs10017136 3,266 E_rs10017136 S1001666T18 rs4513578 10,267 E_rs4513578 S1001667U19 rs2165671 5,874 E_rs2165671 S1001669W20 rs980972 4,988 C_2688547 SI001465Q21 rs1789924 6,096 C_2688538 S1001670O22 rs283413 1,363 C_26457440 SI001429Q23 rs1693427 456 C_2688511 SI001273N24 rs1789915 238 C_2688509 SI001435N25 rs2241894 21 C_2688508 SI001440J26 rs1693425 2,147 RFLP SI000227L27 rs1693482 3,176 RFLP SI000735P28 rs698 3,805 RFLP SI000228M29 rs1789896 6,565 C_2688487 SI001464P30 rs1789891 6,100 C_8829540 S1001671P31 rs3811801 874 C_27519856 S1001672Q32 rs6810842 436 E_rs6810842 S1001673R33 rs1159918 3,690 C_2688471 SI001212G34 rs1229984 207 RFLP SI000229N35 rs4147536 114 E_rs4147536 S1001674S36 rs2075633 585 E_rs2075633 S1001675T37 rs2066701 3,219 RFLP SI000002C38 rs2862993 6,728 C_25939834 SI001451L39 rs1042026 10,683 C_2688455 S1001676U40 rs1587264 4,350 E_rs1587264 S1001677V41 rs1229966 1,647 C_8829451 SI001272M42 rs4147532 939 E_rs4147532 S1001678W43 rs931635 3,269 RFLP SI000737R44 rs1229967 5,839 E_rs1229967 S1001679X45 rs975833 1,230 C_2688428 SI001271L46 rs3819197 5,236 FP SI000738S47 rs683731 8,897 C_2688425 S1001680P48 rs1230025 120,750 C_8829387 S1001681Q49 rs1800760 117 C_276457248 SI001443M50 rs1800759 17,095 C_8829281 SI001444N51 rs1126671 602 C_11941799 SI001447Q52 rs1126672 2,238 C_11941798 SI001448R53 rs1042364 35,564 C_9523707 SI001450K54 rs1154400 … C_11349123 SI001449S
a As numbered in figure 1.
Figure 2. Flow charts illustrating the demographic model usedfor the simulations. Top, Population constant at size 10,000 untilit experienced a brief bottleneck 3,000 generations ago, whichdropped the population size to 2,000.29 Then the population wasconstant at size 2,000 until 500 generations ago (on the basis ofthe rough estimates that the Neolithic period started 9,000–10,000 years ago in East Asia and that the generation length is20 years, the upper bound of 500 generations was used in thissimulation), when it expanded suddenly by a factor of 50. The Ne
(effective population size) for the entire period (3,000 genera-tions) for this model is ∼2,400. Middle, Population constant atsize 10,000 until it experienced a brief bottleneck 3,000 gener-ations ago, which dropped the population size to 2,000.29 Thenthe population was constant at size 2,000 until 500 generationsago (the same estimation as for the first model), when it expandedexponentially to the current size of 100,000. The Ne for the entireperiod (3,000 generations) for this model is ∼2,300. Bottom, Modelof the unlikely demographic of a population with a constant sizeof 10,000.

www.ajhg.org The American Journal of Human Genetics Volume 80 March 2007 445
Figure 3. The pairwise comparison of allele frequencies in four ADH subregions among all 42 populations. The color scheme is basedon the correlation of allele frequencies between each pair of populations, with bright red representing complete correlation ( 1)2r pand dark blue representing no correlation ( ). Both horizontal and vertical axes represent the same 42 populations in the same2r p 0order as in figures 5 and 10. Generally speaking, the correlation level among populations within the same geographic location tendsto be strong. Occasionally, the strong correlation can extend across geographic regions, such as in the intergenic region ADH7–class IADH (strong correlation extends through Africa, southwestern Asia, and Europe) and downstream of class I ADH (strong correlationextends through southwestern Asia, Europe, and East Asia). Class I ADH, which is of particular interest to our positive-selection study,shows an allele-frequency correlation pattern that makes East Asian populations distinct from those of the rest of the world. Populationsare ordered from Africa (1–9), southwestern Asia (10–12), Europe (13–21), northwestern Asia (22–23), East Asia (24–31), Pacific Islands(32–33), northeastern Siberia (34), North America (35–38), and South America (39–42).
tion of chance deviation from HWE. To provide an over-view of allele-frequency similarity among and within eachgeographic region, pairwise correlations between differentpopulations were examined. Allele-frequency similarity, aspairwise between populations, was examined for four2rsubsections of the ADH region. Only for the intergenicregion upstream of the class I cluster and especially forthe class I cluster (at ) does one see great similarity2r 1 0.90among the East Asian populations and distinct differencesfrom populations in all other parts of the world (fig. 3).This supports our focus on the ADH1B locus and theADH1B*47His allele in East Asian populations.
Fst Value
Figure 4 plots the Fst values of the 54 SNPs calculated forthe 42 populations. To provide a better context for thedifferent Fst values, we calculated Fst values on the same42 population samples for 382 presumably neutral sites atother loci not linked to the ADH cluster. This set of 382sites in the same 42 populations has a mean (SD) Fst valueof 0.143 (0.074). The highest Fst value among the 54 ADHregion sites was for ADH1B Arg47His (square in fig. 2),which is 4.53 SDs above the mean. The second highest Fst
value was observed for the SNP rs3811801 (triangle in fig.

446 The American Journal of Human Genetics Volume 80 March 2007 www.ajhg.org
Figure 4. Average Fst values of 42 populations for 54 SNPs, ordered as in table 1 (not to scale). The Mean Fst value of 382 referencesites in 42 populations is represented with a discontinuous dotted line. The 25th, 75th, 90th, and 99th percentiles based on thosedata are represented with dotted lines. The bracket for each ADH gene includes all SNPs within each gene. SNP 34, ADH1B Arg47His,has the highest Fst value (unblackened square); SNP 31, rs3811801, has the second highest Fst value (unblackened triangle); SNPs 36,37, and 39, which also have an Fst value 199th percentile, are represented by an asterisk (*).
4), which is 4.26 SDs above the mean. Three other highlysignificant values were observed for three other nearbySNPs—rs2075633, rs2066701, and rs1042026 (asterisk infig. 4)—on the other side of the Arg47His site.
An East Asian–Prominent Haplotype at ADH1B
Among the 54 SNPs studied, there are 5 SNPs within theextent of ADH1B: ADH1B Arg47His, rs4147536, rs2075633,rs2066701 (RsaI), and Val204Val (SNPs 34–38 in fig. 1). Weanalyzed the 5-SNP haplotype-distribution pattern in 42populations. Of 32 (25) possible haplotypes, 18 were es-timated to have nonzero values, and 10 of those 18 hap-lotypes were observed at a frequency of at least 5% in atleast one population in our samples. Those 10 haplotypesaccount for 196% of all chromosomes in all 42 studiedpopulations. Frequencies for each population are given onthe ALFRED Web site and are graphed in figure 5. Theancestral haplotype, based on typing the primates, is1CA1G (data not shown) and has a frequency of at least27% in all non–East Asian populations except Samaritans(SAM) (8%) and Micronesians (MIC) (12%). There are twoother haplotypes that are frequent in most populations:1CG2G and 1AA1G. Haplotype 1CG2G is rare in NativeAmerican and African populations, but it occurs at ∼20%in Europeans and varies from 3% to 24% in East Asians;haplotype 1AA1G is nearly globally frequent, except insome East Asian populations. Haplotype 2CG2G is thedominant haplotype in East Asia, whereas it is very rarely
observed in the rest of the world. Among all eight EastAsian populations, haplotype 2CG2G has a minimum fre-quency of 62%, except in Cambodians (CBD) (34%).Therefore, we consider 2CG2G to be an East Asian–prom-inent haplotype and our initial focus in LRH analyses.
However, on the basis of the initial results and the highFst values extending upstream of ADH1B, we also exam-ined the core haplotype defined by the ADH1B*47His al-lele and the three SNPs extending upstream to and in-cluding rs3811801. The global pattern of this haplotypealso shows an East Asian–prominent haplotype (see the“Discussion” section).
EHH and REHH
Initially, we applied the LRH method to study positiveselection on the East Asian–prominent haplotype 2CG2G,which includes the functional variant ADH1B*47His (al-lele 2 at the first site). The primary rationale of the LRHtest is that, under the assumption of neutral evolution,common alleles need an extended period to reach highfrequencies in the population; as a function of time, theLD surrounding those alleles will decay because of recom-bination and mutations. But, under positive selection, wecan observe a geographic region–specific high-frequencyhaplotype that has become common over a short periodof time, such that recombination has not had sufficienttime to break down the selected haplotype. In this study,according to both the correlation results stated above and

www.ajhg.org The American Journal of Human Genetics Volume 80 March 2007 447
Figure 5. The haplotype pattern of SNPs 34–38 (ADH1B Arg47His, rs4147536, rs2075633, RsaI, and Val204Val) within the ADH1B genefor 42 populations. Populations are grouped by geographic region, with regions roughly in order of distance from Africa: Africa (includingAAM), southwestern Asia, Europe, northwestern Asia, East Asia, Pacific, eastern Siberia, North America, and South America. Haplotype2CG2G is prominent in East Asian populations (except CBD) but is barely seen in the rest of the world (with a few exceptions, such asNAS, MIC, etc.).
the criteria proposed by Yu et al.,43 we defined the coreregion of 4.1 kb at ADH1B on the basis of the five SNPs(SNPs 34–38 in fig. 1) within the ADH1B gene that definedthe East Asian–prominent haplotype (see above). Then,we added increasingly distant SNPs, extending 33 SNPs(∼117 kb) upstream to ADH7 and 15 SNPs (∼225 kb) down-stream to ADH5, to study the decay of LD from each corehaplotype. We plotted the haplotype-bifurcationdiagrams35
for eight East Asian populations (fig. 6). In each haplotype-bifurcation diagram, the root stands for a core haplotype.In general, a diagram with thinner and a greater numberof branches from the root visualizes the decay of LD onthe core haplotype, and a core haplotype under positiveselection has long-range LD and high frequency in somepopulations. So a core under positive selection will be vi-sualized in the diagram with a large root and a predom-inant thick line that extends a long distance. At a mini-mum threshold of 7%, the core region of 54 SNPs definedtwo haplotypes in Atayal (ATL); three haplotypes in Jap-anese (JPN), Chinese from Taiwan (CHT), Ami, and Hakka(HKA); and four haplotypes in Koreans (KOR), Chinesefrom San Francisco (CHS), and CBD. Except CBD, in theseven other East Asian populations, haplotype 2CG2G,which includes the proved protective variant ADH1B*
47His at the first SNP of this core region, is visualized withan extended predominance of one thick branch in thehaplotype-bifurcation diagram, which clearly suggests long-range LD.
The EHH and REHH of major core haplotypes (�9%)were plotted against the distance away from the core forall the eight populations (fig. 7A). The EHH of the 2CG2Gcore haplotype (which has the highest frequency in thosepopulations) decays more slowly than does that of othercore haplotypes in HKA, JPN, KOR, CHS, and CHT but notin our Ami, ATL, and CBD populations. We also foundthat CBD, Ami, and ATL differed from the other East Asianpopulations in allele frequency and haplotype frequencyin ALDH2 studies6 and studies of several other loci44 forthe same population samples. The EHH (2CG2G as thecore haplotype) upstream of the core extends ∼100 kb ata minimal level of 0.6 in JPN and KOR. In CHS and CHT,the EHH upstream of the core maintains a minimal levelof only 0.45, for a distance of 80 kb. The EHH of HKA isbetween 0.45 and 0.6. However, Ami, ATL, and CBD haveEHH that barely stays above 0.4 for an extension of 40kb. Although some core haplotypes other than 2CG2G doshow an even higher level of EHH (upstream of the core),the low core-haplotype frequencies put the results in ques-

448 The American Journal of Human Genetics Volume 80 March 2007 www.ajhg.org
Figure 6. Haplotype-bifurcation diagrams for each core haplotype with at least 7% frequency at the ADH1B gene region for eightEast Asian populations. The core haplotype 2CG2G shows unusual long-range homozygosity in all East Asia populations except CBD.
tion. The EHH results downstream of the core are less in-formative, because those rarer core haplotypes have valueseither higher than or indistinguishable from the those ofhaplotype 2CG2G, despite the fact that the EHH of thedownstream region seems to decrease at a much slowerrate and to extend farther than upstream of the core, asseen in figure 5. Obviously, the REHH values of 2CG2Gdownstream of the core stay around 1 and are not distin-guishable from the results of other core haplotypes. TheREHH values upstream of the core suggest that the stron-gest evidence of selection occurs in KOR, because theREHH continues to increase, and it reaches 2.0 at ∼36 kb,reaches 4.0 at ∼80 kb, and hits 8.0 by 100 kb. JPN alsoshow a signature of selection, since the REHH increasesto 2.0 quickly and slowly goes up to 4.0 after 80 kb. Al-though HKA, CHS, and CHT do not show evidence ofselection as strong as JPN and KOR, because their REHHvalues stay at no more than 1.8 for 80 kb, they do showa slow continuous increase of REHH over distance. Com-pared with the REHH of other core haplotypes, the REHHof 2CG2G is significantly higher in these three popula-tions. Thus, selection could be considered to have oper-ated in these populations. Consistent with the EHH ob-servations, Ami, ATL, and CBD show no signs of selection,since the REHH values of 2CG2G in these three popula-tions barely exceed 1. In addition, several core haplotypesother than 2CG2G show high REHH levels in these three
populations. Thus, in Ami, ATL, and CBD, there is no clearevidence that selection operates uniquely on 2CG2G.
From previous studies,29,44,45 we know that JPN, KOR,CHS, CHT, and HKA are very similar genetically. Therefore,it might be possible to pool these five populations foranalyses.35 The increased sample size of pooled popula-tions would lead to a more robust statistical inference.Thus, we applied the Fisher’s exact test46 to test the sim-ilarity of these five populations; they did not differ sig-nificantly with respect to core-haplotype frequencies, inagreement with the very small genetic distances amongthese samples determined on the basis of large numbersof loci.29,44,45 However, neither Ami, ATL, nor CBD showssimilarity in core-haplotype components with the abovefive populations, also in agreement with large genetic dis-tances between these and the other five.29,44,45 Therefore,we could pool only JPN, KOR, CHS, CHT, and HKA forfurther analysis. Figure 7B shows the EHH and REHH plotsof core haplotypes (minimum threshold of 0.09) for thepooled populations. The results definitely show the foot-print of positive selection for 2CG2G.
To test further for positive selection within the ADH1Bregion, for all core haplotypes, we plotted the REHHagainst their allele frequencies, using the method pro-posed by Sabeti et al.35 First, we plotted REHH values ofeach possible core haplotype at the ∼117-kb proximal dis-tance against its allele frequencies for 42 populations and

www.ajhg.org The American Journal of Human Genetics Volume 80 March 2007 449
Figure 7. A, EHH and REHH plots of core haplotypes covering SNPs 34–38 in all eight East Asian populations. The EHH and REHHvalues are plotted against the physical distance extending both upstream and downstream of the selected core region. Only corehaplotypes with frequency 19% are shown. The EHH and REHH curves based on the core haplotype of interest, 2CG2G, are colored andsymbolized in different populations, whereas curves of other core haplotypes are presented in gray. JPN and KOR have the highest EHHand REHH values and the longest extension of high levels upstream of the core, whereas CBD has the lowest values and the shortestextension from the core. The low REHH values of the downstream region seem to negate the possibility of selection operating onvariation in that direction, despite the corresponding high EHH levels. B, EHH and REHH plots of core haplotypes covering SNPs 34–38 in the pooled five East Asian populations (JPN, KOR, CHS, CHT, and HKA). The region upstream of the core haplotype 2CG2G showshigher EHH levels over distance (compared with the other core haplotypes) and even significantly higher REHH levels.
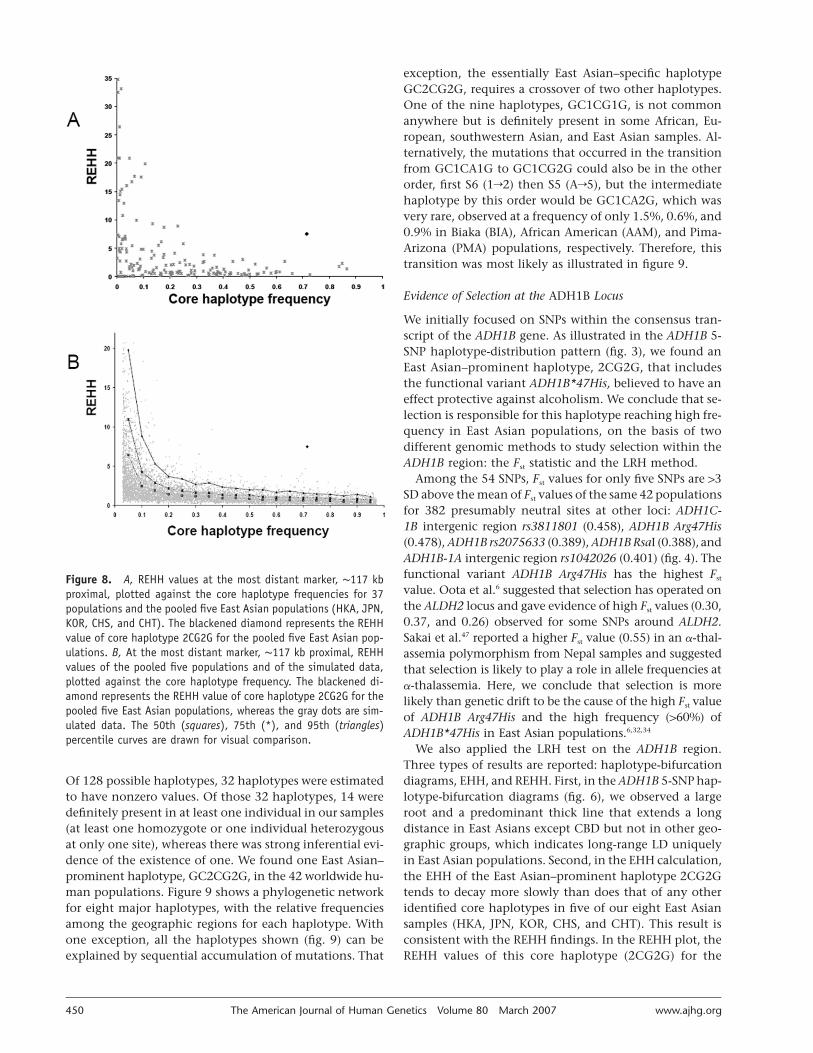
plotted values for the five East Asian populations pooledtogether (HKA, JPN, KOR, CHS, and CHT) in figure 8A.The REHH of the core haplotype 2CG2G for the pooledfive East Asian populations is 7.498, which seems to bean outlier from the distribution of all available data points.To formally test whether our observation is a deviationfrom evolutionary neutrality, we simulated 1,000 popula-tions under each of three variable neutral assumptions (fig.2), and we compared the REHH of core haplotype 2CG2Gof the pooled five East Asian populations with those sim-ulations in figure 8B. The deviation from the simulationresults is highly significant (P values at the 117-kb prox-imal marker are as follows: for constant-sized population,
; for bottleneck and sudden expansion,�7P p 7 # 10 P p; for bottleneck and exponential growth,�52.73 # 10 P p
). The REHH of the core haplotype 2CG2G in�57.64 # 10those pooled populations is significantly higher than thesimulated results at its corresponding haplotype frequency.
DiscussionHaplotype-Evolution Tree
We observed one East Asian–prominent haplotype for thefive SNPs within ADH1B (fig. 5). We are interested, notonly in the factors responsible for generating the EastAsian–prominent haplotype and whether selection oc-curred in the ADH1B region, but also in haplotype evo-lution. We added two additional SNPs (rs6810842 andrs1159918) upstream of ADH1B to the five SNPs withinADH1B, for a total of seven SNPs in a haplotype analysis.
450 The American Journal of Human Genetics Volume 80 March 2007 www.ajhg.org
Figure 8. A, REHH values at the most distant marker, ∼117 kbproximal, plotted against the core haplotype frequencies for 37populations and the pooled five East Asian populations (HKA, JPN,KOR, CHS, and CHT). The blackened diamond represents the REHHvalue of core haplotype 2CG2G for the pooled five East Asian pop-ulations. B, At the most distant marker, ∼117 kb proximal, REHHvalues of the pooled five populations and of the simulated data,plotted against the core haplotype frequency. The blackened di-amond represents the REHH value of core haplotype 2CG2G for thepooled five East Asian populations, whereas the gray dots are sim-ulated data. The 50th (squares), 75th (*), and 95th (triangles)percentile curves are drawn for visual comparison.
Of 128 possible haplotypes, 32 haplotypes were estimatedto have nonzero values. Of those 32 haplotypes, 14 weredefinitely present in at least one individual in our samples(at least one homozygote or one individual heterozygousat only one site), whereas there was strong inferential evi-dence of the existence of one. We found one East Asian–prominent haplotype, GC2CG2G, in the 42 worldwide hu-man populations. Figure 9 shows a phylogenetic networkfor eight major haplotypes, with the relative frequenciesamong the geographic regions for each haplotype. Withone exception, all the haplotypes shown (fig. 9) can beexplained by sequential accumulation of mutations. That
exception, the essentially East Asian–specific haplotypeGC2CG2G, requires a crossover of two other haplotypes.One of the nine haplotypes, GC1CG1G, is not commonanywhere but is definitely present in some African, Eu-ropean, southwestern Asian, and East Asian samples. Al-ternatively, the mutations that occurred in the transitionfrom GC1CA1G to GC1CG2G could also be in the otherorder, first S6 (1r2) then S5 (Ar5), but the intermediatehaplotype by this order would be GC1CA2G, which wasvery rare, observed at a frequency of only 1.5%, 0.6%, and0.9% in Biaka (BIA), African American (AAM), and Pima-Arizona (PMA) populations, respectively. Therefore, thistransition was most likely as illustrated in figure 9.
Evidence of Selection at the ADH1B Locus
We initially focused on SNPs within the consensus tran-script of the ADH1B gene. As illustrated in the ADH1B 5-SNP haplotype-distribution pattern (fig. 3), we found anEast Asian–prominent haplotype, 2CG2G, that includesthe functional variant ADH1B*47His, believed to have aneffect protective against alcoholism. We conclude that se-lection is responsible for this haplotype reaching high fre-quency in East Asian populations, on the basis of twodifferent genomic methods to study selection within theADH1B region: the Fst statistic and the LRH method.
Among the 54 SNPs, Fst values for only five SNPs are 13SD above the mean of Fst values of the same 42 populationsfor 382 presumably neutral sites at other loci: ADH1C-1B intergenic region rs3811801 (0.458), ADH1B Arg47His(0.478), ADH1B rs2075633 (0.389), ADH1B RsaI (0.388), andADH1B-1A intergenic region rs1042026 (0.401) (fig. 4). Thefunctional variant ADH1B Arg47His has the highest Fst
value. Oota et al.6 suggested that selection has operated onthe ALDH2 locus and gave evidence of high Fst values (0.30,0.37, and 0.26) observed for some SNPs around ALDH2.Sakai et al.47 reported a higher Fst value (0.55) in an a-thal-assemia polymorphism from Nepal samples and suggestedthat selection is likely to play a role in allele frequencies ata-thalassemia. Here, we conclude that selection is morelikely than genetic drift to be the cause of the high Fst valueof ADH1B Arg47His and the high frequency (160%) ofADH1B*47His in East Asian populations.6,32,34
We also applied the LRH test on the ADH1B region.Three types of results are reported: haplotype-bifurcationdiagrams, EHH, and REHH. First, in the ADH1B 5-SNP hap-lotype-bifurcation diagrams (fig. 6), we observed a largeroot and a predominant thick line that extends a longdistance in East Asians except CBD but not in other geo-graphic groups, which indicates long-range LD uniquelyin East Asian populations. Second, in the EHH calculation,the EHH of the East Asian–prominent haplotype 2CG2Gtends to decay more slowly than does that of any otheridentified core haplotypes in five of our eight East Asiansamples (HKA, JPN, KOR, CHS, and CHT). This result isconsistent with the REHH findings. In the REHH plot, theREHH values of this core haplotype (2CG2G) for the

www.ajhg.org The American Journal of Human Genetics Volume 80 March 2007 451
Figure 9. Phylogenetic network of eight major haplotypes of seven SNPs for ADH1B. The seven SNPs are rs6810842 (S1), rs1159918(S2), ADH1B Arg47His (S3), rs4147536 (S4), rs2075633 (S5), RsaI (S6), and Val204Val (S7). All haplotypes in this figure are observedwith frequency 15% and are definitely present in at least one individual in our samples. The pie charts represent the haplotypes, andthe segments of the pie charts show the proportions of the haplotypes that occurred in each geographic region. This network is startedfrom the ancestral haplotype GA1CA1G. Each arrow represents a single base mutation for the site indicated beside the arrow. The EastAsian–specific haplotype GC2GC2G is included in the network; this haplotype was likely generated by recombination between haplotypeGC2CA1G, occurring predominantly in southwestern Asia, and haplotype GC1CG2G, occurring much more broadly.
pooled five East Asian populations is statistically distinctfrom other populations and from our simulation data un-der neutral assumptions (fig. 8). The REHH value of corehaplotype 2CG2G for the pooled five East Asian popula-tions is 7.498 at a frequency of 0.715; the P values of thedeviation of this REHH from the simulated data are muchmore significant than that for the SCA2 haplotype (mostcommon in Utah residents with European ancestry, with∼39% frequency; REHH ∼13)48 and that for the G6PD hap-lotype (most common in Africa, with ∼18% frequency;REHH ∼7) (for constant-sized population, ; forP ! .0008expansion, ; for bottleneck, ).35 The lat-P ! .0006 P ! .0008ter two loci have been considered to show strong signalsof positive selection. We have also done the calculationsfor the five populations individually and have REHH val-ues ranging from 2.562 to 12.585, with P values all sig-nificant, at !.05 (data not shown).
Our observations from the Fst statistic and the LRH testlead to very interesting findings. The SNP rs3811801, whichis 5 kb upstream of the functional variant and outside theADH1B locus, has the second highest Fst value (fig. 4). Inaddition, the REHH shows a strong increase over distanceonly upstream of the core we defined in figure 7. There-fore, selection might operate on the upstream part of thegene instead of directly on the core we have selected. Thus,we defined a new core region from rs3811801 to ADH1B*47His. The global haplotype pattern (fig. 10) shows an East
Asian–prominent haplotype, AGC2. Within East Asia, fivepopulations (KOR, JPN, CHS, CHT, and HKA) have highfrequencies (�46%) of this haplotype, whereas Ami, ATL,and CBD have relatively lower frequencies (�16%). Out-side East Asia, this haplotype occurs only at low frequencyin a few populations (Adygei [ADY], Chuvash [CHV], andAshkenazi Jews [ASH]) or at moderate frequency in onepopulation (Yakut [YAK]). Compared with the haplotype2CG2G presented in figure 5, this plot illustrates moreclearly the difference between the five populations (KOR,JPN, CHS, CHT, and HKA) and the other three (Ami, ATL,and CBD) within East Asia.
We therefore applied the LRH test to the new core region(fig. 11). Since Ami, ATL, and CBD have a frequency !16%for haplotype AGC2, the occasional high EHH or REHHvalues obtained in these populations could be misleading.For example, our sample of CBD is 25 individuals. The11.1% frequency means that there are 2 # 25 # 11.1%(≈6) haplotype sequences containing AGC2. Such a smallnumber brings potentially large sampling errors and thusis not very informative. Therefore, we focus on those fivepopulations (KOR, JPN, CHS, CHT, and HKA) that have aminimum frequency of 0.50 for AGC2. The sample sizesin these populations have a range of 41–60 individuals (or82–120 chromosomes). Thus, the EHH and REHH calcu-lations in these five populations would be reliable andinformative. Compared with haplotype 2CG2G (fig. 5),

452 The American Journal of Human Genetics Volume 80 March 2007 www.ajhg.org
Figure 10. Haplotype pattern of SNPs 31–34 (rs3811801, rs6810842, rs1159918, and ADH1B Arg47His) for 42 populations. Abbreviationsare shown in table 1.
these five populations show higher consistency in EHHshape (we still focus on the upstream of the core). EHHstays at a higher level and extends farther away from thecore (all extend 75 kb above 0.8 and 90 kb above 0.6). TheREHH result is consistent with previous findings: KORshows the strongest footprint of selection, and JPN is sim-ilar. HKA, CHS, and CHT show relatively weaker evidenceof selection (fig. 11).
Although there seems no doubt that selection does havean effect on the ADH1B region in East Asia, the exactlocation at which the selective force directly operates isdebatable. The SNP rs3811801 is suspected to lie in a reg-ulatory region upstream of ADH1B. If this is true, it couldbe the primary target of the selective force, and certainlythe adjacent functional variant would be affected. Alter-natively, the two variants may be operating epistatically.This additional upstream SNP appears to modify the evo-lutionary scheme in figure 7 by adding an additional GrAmutation deriving from the East Asian–prominent recom-binant haplotype at the bottom of the figure.
It seems unlikely that the selection was recent and as-sociated with alcoholism, the modern phenotypic mani-festation of the polymorphism. Goldman and Enoch28 sug-gested that the genetic variations in the ALDH and ADHgenes were selectively maintained and suggested two plau-sible selective forces that could predate the invention ofbrewing: mycotoxins and infectious disease. Mycotoxins,
from toxin-producing fungi found in moldy rice, can beconverted by the host ALDH enzymes from protoxin totoxin, and the effects of mycotoxins can be further po-tentiated by ethanol. If the incidence of hepatic diseasefound in many East Asians, especially JPN, is related tothe consumption of mycotoxins, then individuals carry-ing the deficient ALDH2*2 variant with lowered alcoholconsumption would be selectively favored. The infectiousagents—some anaerobes and microaerophiles in severalbacterial and protozoan diseases—are susceptible to acetal-dehyde levels. Individuals with deficient ALDH2*2 canproduce high enough levels of acetaldehyde to inhibitthe growth of those anaerobes or another parasite, whichthereby confers a selective advantage. Similarly, certainfunctional polymorphisms in ADH enzymes that causedifferent efficiency in converting ethanol to acetaldehydecould also be protective, but that has not been sufficientlytested. We have applied various simulation models for thepotential magnitude of selection—if the simulation as-sumes a semidominant effect, the selection coefficient hasto be at least 0.03 for the allele frequency of the selectedallele (ADH1B*47His) to be promoted from 0.005 initially(approximately assumed) to 0.63 currently (based on ourgenotyping data) within 500 generations; if the simulationassumes dominant or recessive effect, the selection coef-ficient would be necessarily weaker or stronger than 0.03.However, there are many uncertainties—for example, we

Figure 11. EHH (left) and REHH (right) plots of core haplotypes covering SNPs 31–34 in all eight East Asian populations. EHH and REHH curves based on the core haplotype ofinterest, AGC2, are colored and symbolized in different populations, whereas curves of other core haplotypes are presented in gray. Because of the low core-haplotype frequencies,CBD, Ami, and ATL show unexpectedly high EHH (even REHH) levels. The other five populations show similar levels of EHH values (upstream) over distance. KOR and JPN show thehighest REHH values (upstream), in agreement with the observations from figure 7A.

454 The American Journal of Human Genetics Volume 80 March 2007 www.ajhg.org
have no information on the initial allele frequency, onhow strong the actual selection was or on what kind ofselection (dominant, semidominant, or recessive) actuallyoccurred.
In conclusion, these data and analyses provide stronggenomic evidence that selection has operated on theADH1B gene in East Asia populations to increase one hap-lotype of the gene to high frequency. This provides thefirst strong evidence supporting the prevalent belief thatsuch selection has operated. However, the nature of theselection force and the time period during which it didoperate are both unknown. Biological studies to betterunderstand the broader metabolic consequences of thepolymorphisms in regulatory and protein coding se-quences of ADH1B are needed to determine the nature ofthe selection. Once the historical demographies of the rel-evant populations are better understood, more-sophisti-cated simulations may better define the magnitude of thetiming of the selection. Finally, additional molecular data,including STRPs, about additional populations in East Asiaare also needed.
Acknowledgments
This work was funded in part by National Institute of Healthgrants AA09379 and GM57672 (to K.K.K.) and National ScienceFoundation grant BCS-9912-28 (to J.R.K.). We thank reviewers fortheir helpful comments for our revision of the manuscript, andwe thank Roy Capper, Andrew R. Dyer, and Valeria Ruggeri fortheir excellent technical help. We also acknowledge and thankthe following people who helped assemble the samples from thediverse populations: F. L. Black, L. L. Cavalli-Sforza, K. Dumars,J. Friedlaender, K. Kendler, W. Knowler, F. Oronsaye, J. Parnas, L.Peltonen, L. O. Schulz, D. Upson, E. L. Grigorenko, S. L. B. Kajuna,N. J. Karoma, J. J. Kim, S. Kungulilo, R. B. Lu, A. Odunsi, F. Okon-ofua, O. V. Zhukova, and K. Weiss. In addition, some of the celllines were obtained from the National Laboratory for the Geneticsof Israeli Populations at Tel Aviv University, and the AAM sampleswere obtained from the Coriell Institute for Medical Research.Special thanks are due to the many hundreds of individuals whovolunteered to give blood samples for studies such as this. With-out such participation of individuals from diverse parts of theworld, we would be unable to obtain a true picture of the geneticvariation in our species.
Appendix A
Marker Typing and Ascertainment
The discovery and typing method for the ADH1C HaeIIIsite (SNP 26) was described elsewhere.27 ADH1A AluI (SNP43) was discovered by comparing the sequences of thecontig we assembled with published sequences for ADH1Aand then confirming that the observed nucleotide differ-ence is a polymorphism by digestion of PCR products fromour standard panel with restriction enzyme AluI. Typingprimers were generated using flanking sequences from thiscontig. Our standard panel consists of 10 individuals: 1Lisongo, 1 BIA, 1 Yoruba, 2 CHT, 1 Dane, 1 Russian, 1 ADY,
1 Cheyenne, and 1 PMA. The ADH1A BccI site (SNP 46)was discovered by resequencing ADH1A intron 8 with useof two primers (A1IN8UP1 and A1IN8DW2) for the 10individuals in the standard panel. We designed the PCRprimers (A1IN8UP1 and A1BccIDW) appropriate for theFP method.39 The program mfold40 predicted a secondarystructure that would likely inhibit the primer-extensionreaction. Therefore, we introduced an artificial mismatchin the downstream primer to disrupt the secondary struc-ture. We designed detection primer A1BccITUP for the sin-gle-nucleotide base extension giving very tight homo- andheterozygote genotype clusters. Sequences of primersnoted above are available from the authors. Most markerswere typed by TaqMan with use of standard protocols. TheTaqMan assay numbers are listed in table 1. Other markerswere selected from dbSNP (the AB catalogue), to provideinformative coverage across much of the upstream half ofthe cluster. These markers have diverse historical discov-eries that are largely unknown.
The ADH1B Arg47His (SNP 34), ADH1B RsaI (SNP 37),and ADH1C Ile349Val (SNP 28) polymorphisms were typedas described elsewhere.17 For markers not typed by Taq-Man, PCR conditions were optimized using gradient PCRin 96-well plates (total volume 25 ml), and amplificationswere done in 384-well plates (total volume: 10 ml). Thegenomic DNA and PCR and restriction enzyme reactionmixtures were dispensed by a TOMTEC Workstation, andthe reactions were performed on a PTC-225 Peltier Ther-mal Cycler (MK Research). The PCR products were digestedwith appropriate enzymes following the manufacturers’protocols. The digestion patterns were detected using 2%regular agarose gels. The FP genotyping was read on anLJL BioSystem Analyst. The TaqMan genotyping was readon an ABI PRISM 7900HT Sequence Detection System. Werepeated the typing of markers with failed or unclear typ-ings until the proportion of typed individuals was 195%in each population.
Web Resources
The URLs for data presented herein are as follows:
ALFRED, http://alfred.med.yale.edu/dbSNP, http://www.ncbi.nlm.nih.gov/projects/SNP/Online Mendelian Inheritance in Man (OMIM), http://www.ncbi
.nlm.nih.gov/Omim/ (for alcohol dependence, ADH1B, ADH1C,ALDH2, ADH1A, ADH4, ADH5, ADH7, and ADH6)
UCSC Genome Browser, http://genome.ucsc.edu/cgi-bin/hgGateway
References
1. Ramchandani VA, Bosron WF, Li TK (2001) Research advancesin ethanol metabolism. Pathol Biol (Paris) 49:676–682
2. Yoshida A, Hsu LC, Yasunami M (1991) Genetics of humanalcohol-metabolizing enzymes. Prog Nucleic Acid Res Mol Biol40:255–287
3. Agarwal DP, Goedde HW (1992) Pharmacogenetics of alcoholmetabolism and alcoholism. Pharmacogenetics 2:48–62
4. Osier MV, Pakstis AJ, Goldman D, Edenberg HJ, Kidd JR, Kidd
www.ajhg.org The American Journal of Human Genetics Volume 80 March 2007 455
KK (2002) A proline-threonine substitution in codon 351 ofADH1C is common in Native Americans. Alcohol Clin ExpRes 26:1759–1763
5. Mulligan CJ, Robin RW, Osier MV, Sambuughin N, GoldfarbLG, Kittles RA, Hesselbrock D, Goldman D, Long JC (2003)Allelic variation at alcohol metabolism genes (ADH1B, ADH1C,ALDH2) and alcohol dependence in an American Indian pop-ulation. Hum Genet 113:325–336
6. Oota H, Pakstis AJ, Bonne-Tamir B, Goldman D, GrigorenkoE, Kajuna SL, Karoma NJ, Kungulilo S, Lu RB, Odunsi K, et al(2004) The evolution and population genetics of the ALDH2locus: random genetic drift, selection, and low levels of re-combination. Ann Hum Genet 68:93–109
7. Thomasson HR, Edenberg HJ, Crabb DW, Mai XL, Jerome RE,Li TK, Wang SP, Lin YT, Lu RB, Yin SJ (1991) Alcohol andaldehyde dehydrogenase genotypes and alcoholism in Chi-nese men. Am J Hum Genet 48:677–681
8. Thomasson HR, Crabb DW, Edenberg HJ, Li TK, Hwu HG,Chen CC, Yeh EK, Yin SJ (1994) Low frequency of the ADH2*2allele among Atayal natives of Taiwan with alcohol use dis-orders. Alcohol Clin Exp Res 18:640–643
9. Chen C-C, Lu R-B, Chen Y-C, Wang M-F, Chang Y-C, Li T-K,Yin S-J (1999) Interaction between the functional polymor-phisms of the alcohol-metabolism genes in protection againstalcoholism. Am J Hum Genet 65:795–807
10. Shen YC, Fan JH, Edenberg HJ, Li TK, Cui YH, Wang YF, TianCH, Zhou CF, Zhou RL, Wang J, et al (1997) Polymorphismof ADH and ALDH genes among four ethnic groups in Chinaand effects upon the risk for alcoholism. Alcohol Clin ExpRes 21:1272–1277
11. Higuchi S, Matsushita S, Murayama M, Takagi S, Hayashida M(1995) Alcohol and aldehyde dehydrogenase polymorphismsand the risk for alcoholism. Am J Psychiatry 152:1219–1221
12. Muramatsu T, Wang ZC, Fang YR, Hu KB, Yan H, Yamada K,Higuchi S, Harada S, Kono H (1995) Alcohol and aldehydedehydrogenase genotypes and drinking behavior of Chineseliving in Shanghai. Hum Genet 96:151–154
13. Reich T, Edenberg HJ, Goate A, Williams JT, Rice JP, Van Eer-dewegh P, Foroud T, Hesselbrock V, Schuckit MA, Bucholz K,et al (1998) Genome-wide search for genes affecting the riskfor alcohol dependence. Am J Med Genet 81:207–215
14. Saccone NL, Kwon JM, Corbett J, Goate A, Rochberg N, Ed-enberg HJ, Foroud T, Li TK, Begleiter H, Reich T, et al (2000)A genome screen of maximum number of drinks as an al-coholism phenotype. Am J Med Genet 96:632–637
15. Long JC, Knowler WC, Hanson RL, Robin RW, Urbanek M,Moore E, Bennett PH, Goldman D (1998) Evidence for geneticlinkage to alcohol dependence on chromosomes 4 and 11from an autosome-wide scan in an American Indian popu-lation. Am J Med Genet 81:216–221
16. Uhl GR (2004) Molecular genetic underpinnings of humansubstance abuse vulnerability: likely contributions to under-standing addiction as a mnemonic process. Neuropharma-cology Suppl 47 1:140–147
17. Osier M, Pakstis AJ, Kidd JR, Lee J-F, Yin S-J, Ko H-C, EdenbergHJ, Lu R-B, Kidd KK (1999) Linkage disequilibrium at theADH2 and ADH3 loci and risk of alcoholism. Am J Hum Genet64:1147–1157
18. Chen WJ, Loh EW, Hsu YP, Chen CC, Yu JM, Cheng AT (1996)Alcohol-metabolising genes and alcoholism among Taiwa-nese Han men: independent effect of ADH2, ADH3 andALDH2. Br J Psychiatry 168:762–767
19. Higuchi S (1994) Polymorphisms of ethanol metabolizing en-zyme genes and alcoholism. Alcohol Alcohol Suppl 2:29–34
20. Higuchi S, Matsushita S, Imazeki H, Kinoshita T, Takagi S,Kono H (1994) Aldehyde dehydrogenase genotypes in Japa-nese alcoholics. Lancet 343:741–742
21. Borras E, Coutelle C, Rosell A, Fernandez-Muixi F, Broch M,Crosas B, Hjelmqvist L, Lorenzo A, Gutierrez C, Santos M, etal (2000) Genetic polymorphism of alcohol dehydrogenasein Europeans: the ADH2*2 allele decreases the risk for alco-holism and is associated with ADH3*1. Hepatology 31:984–989
22. Neumark YD, Friedlander Y, Thomasson HR, Li TK (1998)Association of the ADH2*2 allele with reduced ethanol con-sumption in Jewish men in Israel: a pilot study. J Stud Alcohol59:133–139
23. Whitfield JB, Nightingale BN, Bucholz KK, Madden PA, HeathAC, Martin NG (1998) ADH genotypes and alcohol use anddependence in Europeans. Alcohol Clin Exp Res 22:1463–1469
24. Konishi T, Calvillo M, Leng AS, Feng J, Lee T, Lee H, SmithJL, Sial SH, Berman N, French S, et al (2003) The ADH3*2 andCYP2E1 c2 alleles increase the risk of alcoholism in MexicanAmerican men. Exp Mol Pathol 74:183–189
25. Tiemersma EW, Wark PA, Ocke MC, Bunschoten A, OttenMH, Kok FJ, Kampman E (2003) Alcohol consumption, al-cohol dehydrogenase 3 polymorphism, and colorectal ade-nomas. Cancer Epidemiol Biomarkers Prev 12:419–425
26. Cichoz-Lach H, Partycka J, Nesina I, Celinski K, Slomka M,Wojcierowski J (2006) Genetic polymorphism of alcohol de-hydrogenase 3 in alcohol liver cirrhosis and in alcoholchronic pancreatitis. Alcohol Alcohol 41:14–17
27. Osier MV, Pakstis AJ, Soodyall H, Comas D, Goldman D,Odunsi A, Okonofua F, Parnas J, Schulz LO, Bertranpetit J, etal (2002) A global perspective on genetic variation at the ADHgenes reveals unusual patterns of linkage disequilibrium anddiversity. Am J Hum Genet 71:84–99
28. Goldman D, Enoch MA (1990) Genetic epidemiology of eth-anol metabolic enzymes: a role for selection. World Rev NutrDiet 63:143–160
29. Kidd KK, Pakstis AJ, Speed WC, Kidd JR (2004) Understandinghuman DNA sequence variation. J Hered 95:406–420
30. Voight BF, Kudaravalli S, Wen X, Pritchard JK (2006) A mapof recent positive selection in the human genome. PLoS Biol4:e72
31. Endo T, Ikeo K, Gojobori T (1996) Large-scale search for geneson which positive selection may operate. Mol Biol Evol 13:685–690
32. Norman PJ, Cook MA, Carey BS, Carrington CV, Verity DH,Hameed K, Ramdath DD, Chandanayingyong D, Leppert M,Stephens HA, et al (2004) SNP haplotypes and allele fre-quencies show evidence for disruptive and balancing selec-tion in the human leukocyte receptor complex. Immuno-genetics 56:225–237
33. Hu XS, He F (2005) Background selection and populationdifferentiation. J Theor Biol 235:207–219
34. Walsh EC, Sabeti P, Hutcheson HB, Fry B, Schaffner SF, deBakker PI, Varilly P, Palma AA, Roy J, Cooper R, et al (2006)Searching for signals of evolutionary selection in 168 genesrelated to immune function. Hum Genet 119:92–102
35. Sabeti PC, Reich DE, Higgins JM, Levine HZ, Richter DJ,Schaffner SF, Gabriel SB, Platko JV, Patterson NJ, McDonaldGJ, et al (2002) Detecting recent positive selection in the

456 The American Journal of Human Genetics Volume 80 March 2007 www.ajhg.org
human genome from haplotype structure. Nature 419:832–837
36. Anderson MA, Gusella JF (1984) Use of cyclosporin A in es-tablishing Epstein-Barr virus-transformed human lympho-blastoid cell lines. In Vitro 20:856–858
37. Sambrook J, Fritsch EF, Maniatis T (1989) Quantitation ofDNA and RNA. In: Ford N, Nolan C, Ferguson M (eds) Mo-lecular cloning: a laboratory manual, 2nd ed. Cold SpringHarbor Laboratory Press, Cold Spring Harbor, NY
38. Gu S, Pakstis AJ, Kidd KK (2005) HAPLOT: a graphical com-parison of haplotype blocks, tagSNP sets and SNP variationfor multiple populations. Bioinformatics 21:3938–3939
39. Chen X, Levine L, Kowk PY (1999) Fluorescence polarizationin homogeneous nucleic acid analysis. Genome Res 9:492–498
40. SantaLucia J Jr (1998) A unified view of polymer, dumbbell,and oligonucleotide DNA nearest-neighbor thermodynamics.Proc Natl Acad Sci USA 95:1460–1465
41. Han Y, Oota H, Osier MV, Pakstis AJ, Speed WC, Odunsi A,Okonofua F, Kajuna SL, Karoma NJ, Kungulilo S, et al (2005)Considerable haplotype diversity within the 23 kb encom-passing the ADH7 gene. Alcohol Clin Exp Res 29:2091–2100
42. Hawley ME, Kidd KK (1995) HAPLO: a program using the EM
algorithm to estimate the frequencies of multi-site haplo-types. J Hered 86:409–411
43. Yu F, Sabeti PC, Hardenbol P, Fu Q, Fry B, Lu X, Ghose S, VegaR, Perez A, Pasternak S, et al (2005) Positive selection of apre-expansion CAG repeat of the human SCA2 gene. PLoSGenet 1:e41
44. Kim J, Verdu P, Pakstis AJ, Speed WC, Kidd JR, Kidd KK (2005)Use of autosomal loci for clustering individuals and popu-lations of East Asian origin. Hum Genet 117:511–519
45. Tishkoff SA, Kidd KK (2004) Implications of biogeographyof human populations for “race” and medicine. Nat GenetSuppl 11 36:S21–S27
46. Raymond M, Rousset F (1995) An exact test for populationdifferentiation. Evolution 49:1280–1283
47. Sakai Y, Kobayashi S, Shibata H, Furuumi H, Endo T, Fu-charoen S, Hamano S, Acharya GP, Kawasaki T, Fukumaki Y(2000) Molecular analysis of a-thalassemia in Nepal: corre-lation with malaria endemicity. J Hum Genet 45:127–132
48. Yu F, Sabeti PC, Hardenbol P, Fu Q, Fry B, Lu X, Ghose S, VegaR, Perez A, Pasternak S, et al (2005) Positive selection of apre-expansion CAG repeat of the human SCA2 gene. PLoSGenet 1:e41