evidence of horizontal and vertical transport of water in ... · of the brazilian meteorological...
TRANSCRIPT

Atmos. Chem. Phys., 16, 12273–12286, 2016www.atmos-chem-phys.net/16/12273/2016/doi:10.5194/acp-16-12273-2016© Author(s) 2016. CC Attribution 3.0 License.
Evidence of horizontal and vertical transport of water in theSouthern Hemisphere tropical tropopause layer (TTL) fromhigh-resolution balloon observationsSergey M. Khaykin1, Jean-Pierre Pommereau1, Emmanuel D. Riviere2, Gerhard Held3,*, Felix Ploeger4,Melanie Ghysels2,a, Nadir Amarouche5, Jean-Paul Vernier6,7, Frank G. Wienhold8, and Dmitry Ionov9
1LATMOS, CNRS, Université de Versailles St Quentin, Guyancourt, France2GSMA, Université de Reims Champagne Ardenne and CNRS, Reims, France3Instituto de Pesquisas Meteorológicas (IPMet), UNESP, Bauru, S.P., Brazil4Forschungszentrum Jülich, IEK-7, Jülich, Germany5Division Technique de l’INSU, CNRS, Meudon, France6Science Systems and Applications, Inc, Hampton, Virginia, USA7NASA Langley Research Center, Hampton, Virginia, USA8ETH Zurich, Institute for Atmospheric and Climate Science, Zurich, Switzerland9St. Petersburg State University, St. Petersburg, Russian Federationanow at: National Institute of Standards and Technology, Gaithersburg, MD, USA*retired
Correspondence to: Sergey M. Khaykin ([email protected])
Received: 8 July 2016 – Published in Atmos. Chem. Phys. Discuss.: 18 July 2016Revised: 13 September 2016 – Accepted: 19 September 2016 – Published: 29 September 2016
Abstract. High-resolution in situ balloon measurements ofwater vapour, aerosol, methane and temperature in the up-per tropical tropopause layer (TTL) and lower stratosphereare used to evaluate the processes affecting the stratosphericwater budget: horizontal transport (in-mixing) and hydrationby cross-tropopause overshooting updrafts. The obtained insitu evidence of these phenomena are analysed using satel-lite observations by Aura MLS (Microwave Limb Sounder)and CALIPSO (Cloud-Aerosol Lidar and Infrared PathfinderSatellite Observation) together with trajectory and transportmodelling performed using CLaMS (Chemical LagrangianModel of the Stratosphere) and HYSPLIT (Hybrid Single-Particle Lagrangian Integrated Trajectory) model.
Balloon soundings were conducted during March 2012in Bauru, Brazil (22.3◦ S) in the frame of the TRO-Picocampaign for studying the impact of convective overshoot-ing on the stratospheric water budget. The balloon payloadsincluded two stratospheric hygrometers: FLASH-B (Fluo-rescence Lyman-Alpha Stratospheric Hygrometer for Bal-loon) and Pico-SDLA instrument as well as COBALD (Com-
pact Optical Backscatter Aerosol Detector) sondes, comple-mented by Vaisala RS92 radiosondes. Water vapour verticalprofiles obtained independently by the two stratospheric hy-grometers are in excellent agreement, ensuring credibility ofthe vertical structures observed.
A signature of in-mixing is inferred from a series of ver-tical profiles, showing coincident enhancements in watervapour (of up to 0.5 ppmv) and aerosol at the 425 K (18.5 km)level. Trajectory analysis unambiguously links these fea-tures to intrusions from the Southern Hemisphere extrat-ropical stratosphere, containing more water and aerosol, asdemonstrated by MLS and CALIPSO global observations.The in-mixing is successfully reproduced by CLaMS simula-tions, showing a relatively moist filament extending to 20◦ S.A signature of local cross-tropopause transport of water isobserved in a particular sounding, performed on a convec-tive day and revealing water vapour enhancements of up to0.6 ppmv as high as the 404 K (17.8 km) level. These areshown to originate from convective overshoots upwind de-tected by an S-band weather radar operating locally in Bauru.
Published by Copernicus Publications on behalf of the European Geosciences Union.

12274 S. M. Khaykin et al.: Evidence of horizontal and vertical transport of water
The accurate in situ observations uncover two indepen-dent moisture pathways into the tropical lower stratosphere,which are hardly detectable by space-borne sounders. We ar-gue that the moistening by horizontal transport is limited bythe weak meridional gradients of water, whereas the fast con-vective cross-tropopause transport, largely missed by globalmodels, can have a substantial effect, at least at a regionalscale.
1 Introduction
The tropical tropopause layer (TTL) is a region of transitionbetween tropospheric convective and stratospheric radiativeregimes. Extending between the main level of convective out-flow (∼ 14 km) and the maximum level reachable by con-vection (18–19 km), the TTL sets the boundary conditionsfor the composition of air entering the global stratosphere(Fueglistaler et al., 2009). Accurate knowledge of the TTLphysical processes and their interplay is thus of key impor-tance for understanding climate change (Randel and Jensen,2013). The role of stratospheric water vapour in global sur-face climate is now well recognised (Solomon et al., 2010;Riese et al., 2012; Dessler et al., 2013), evoking the need tobetter constrain the TTL processes governing the entry levelof stratospheric water vapour.
There are three transport processes controlling the watervapour abundance in the TTL, thereby setting the globalstratospheric water budget: (1) slow ascent in the upwardbranch of the Brewer–Dobson circulation leading to dehy-dration of air passing through the coldest regions of the TTL(2) fast cross-tropopause vertical transport (convective over-shooting) and (3) quasi-horizontal transport from the extra-tropics (in-mixing). The dehydration (freeze-drying) alongthe slow ascent or advection occurs primarily in the west-ern Pacific and maritime continent (“cold trap” hypothe-sis) – a region of large-scale slow ascent and cold TTLanomaly (Holton and Gettelman, 2001), where the cold-pointtropopause (CPT) temperatures experience minimum duringaustral summer (Gettelman and Forster, 2002).
While the dehydration process followed by upward andpoleward transport of dry air is generally deemed to be ofprimary importance for the mean stratospheric water concen-tration and seasonality, the effect of overshooting convectionon the TTL water vapour (dehydration vs. moistening andthe net effect) has been under debate for many years (Randeland Jensen, 2013). There is a growing amount of observa-tional evidence that overshooting convection, injecting ma-terial directly into the uppermost TTL has a moistening ef-fect on the lower stratosphere (Kelly et al., 1993; Corti etal., 2008; Khaykin et al., 2009; de Reus et al., 2009; Schilleret al., 2009; Sargent et al., 2014). Consistent with the ob-servations, simulations of overshooting events using cloud-resolving modelling show significant localised moistening of
the lower stratosphere (Chaboureau et al., 2007; Jensen etal., 2007; Grosvenor et al., 2007; Chemel et al., 2009; Liuet al., 2010). A dehydrating effect of overshooting may oc-cur only if the TTL is initially supersaturated with respect toice, as concluded by Jensen et al. (2007). In contrast to that,Randel et al. (2015) found that enhanced tropospheric con-vection within Asian and North American monsoons leadsto reduced stratospheric water vapour. While upscaling theovershooting events and quantifying their net effect on watervapour remains a difficult task, various space-borne obser-vations suggest that the most vigorous convection, capableof direct transport of material into the lower stratosphere, ismostly restricted to the tropical land regions (Liu and Zipser,2005; Ricaud et al., 2009; Iwasaki et al., 2010; Bergman etal., 2012; Khaykin et al., 2013a; Carminati et al., 2014).
Another important contributor to the composition of theTTL is the horizontal (isentropic) transport from the extra-tropical lower stratosphere (in-mixing), the significance ofwhich is pointed out in a number of model- and observation-based studies (Marcy et al., 2007; Konopka et al., 2009;Homan et al., 2010; Ploeger et al., 2012; Sargent et al., 2014).The in-mixing into the TTL is mostly driven by the anti-cyclonic circulation of the large monsoon systems in bothhemispheres. The strongest Asian monsoon is considered re-sponsible for the boreal summer maximum of in-mixing fromthe Northern Hemisphere (Konopka et al., 2009), whereas inthe Southern Hemisphere, the in-mixing peaks in February(Ploeger et al., 2012). The net fraction of in-mixed air variesbetween 5 and 20 % according to Ploeger et al. (2012) andappears most apparent in tracers with stratospheric originsand strong latitudinal gradients, such as O3 and HCl (Marcyet al., 2007). Based on the transport model simulations, theeffect of in-mixing on stratospheric water is expected to belimited due to a small latitudinal gradient of this trace gas,although this inference has not been yet verified observation-ally.
Transport processes influencing the TTL composition, bethey slow ascent, fast overshooting or horizontal in-mixing,have been mainly studied using trajectory and mesoscalemodelling, whereas in situ observational evidence, indis-pensable to constrain the models, is lacking. Satellite obser-vations, providing a global perspective, are not capable ofresolving kilometre-scale vertical distribution of gases in theTTL, thus missing the signatures of transport processes.
This paper presents in situ observational evidence of thecoexistence of the two out of three transport mechanisms de-scribed above – convective overshooting and in-mixing de-tected by accurate high-resolution balloon-borne measure-ments of water vapour, methane and aerosol in the TTLabove Bauru, Brazil (22◦ S) in March 2012. Satellite mea-surements, radar acquisitions and trajectory/transport mod-elling are used to interpret the origin of vertical structuresobserved in situ. The paper is organised as follows: Sect. 2provides a description of experimental set-up, instrumenta-tion used and models exploited. Sections 3 and 4 describe the
Atmos. Chem. Phys., 16, 12273–12286, 2016 www.atmos-chem-phys.net/16/12273/2016/

S. M. Khaykin et al.: Evidence of horizontal and vertical transport of water 12275
observations of horizontal and vertical transport signaturesrespectively. Section 5 discusses the relative importance ofboth transport mechanisms and summarises the paper.
2 Experimental set-up, instrumentation and modelling
A French-funded project named TRO-Pico aimed at char-acterising the variability and frequency of convective wa-ter injections, their contribution at the regional wet seasontimescale and improving the understanding of their role withrespect to the cold trap at a wider scale. The project in-cluded two intensive balloon campaigns held in February–March 2012 and January–February 2013 under the auspicesof the Brazilian Meteorological Research Institute (IPMet),Universidade Estadual Paulista (UNESP), located in Bauru,São Paolo, Brazil (22.36◦ S, 49.03◦W). The present studyis based on the balloon experiments conducted during thefirst deployment in 2012, which included seven flights ofRaven Aerostrar zero pressure plastic balloons of 500 and1500 m3 and six flights of Totex 1200 g rubber balloons.The plastic balloon payloads included Pico-SDLA instru-ments for water vapour and methane measurements whereasthe rubber balloons were carrying lightweight FLASH-Band COBALD sondes for measurement of water vapour andaerosol backscatter respectively. The thermodynamical datawere provided by Vaisala RS92 radiosondes integrated in thepayload.
On 13 March 2012, a rubber balloon payload (FLASH-B+COBALD) was flown in parallel with a plastic bal-loon payload (Pico-SDLA H2O), which provided quasi-simultaneous measurements of water vapour using two hy-grometers. Point-by-point intercomparison of the obtainedwater vapour profiles (Ghysels et al., 2016) showed excel-lent agreement with a mean difference above 15 km of 0.5 %(0.02± 0.21 ppmv).
2.1 Balloon-borne in situ instruments
Fluorescence Lyman-Alpha Stratospheric Hygrometer forBalloon (FLASH-B) is a compact lightweight sonde de-veloped at the Central Aerological Observatory of Roshy-dromet, Russia for water vapour measurements in the uppertroposphere and stratosphere (Yushkov et al., 1998). The in-strument uses an open coaxial optical layout, where the anal-ysed volume is located outside the instrument. This allowsthe size of the instrument to be reduced to a small sondewith a total weight of about 1 kg including batteries but re-stricts its application to night-time. The typical precision ofthe hygrometer in the stratosphere is 5–6 %, whereas the to-tal uncertainty, including the calibration error is estimated tobe below 10 %. This estimate is rather conservative as sug-gested by comparisons with other water vapour instruments,showing discrepancies below 5 % (Khaykin et al., 2013b).Here we use the data averaged over 4 s, resulting in a ver-
tical resolution of 20 m during ascent and 50 m during theparachuted descent in the lower stratosphere. The detectionlimit is 0.1 ppmv. The flight configuration of FLASH-B, inwhich the analysed volume is located beneath the downward-looking optics, causes self-contamination due to water out-gassing from the instrument and eddy diffusion above about70 hPa during ascent when the contribution of water resid-ing on the instrument walls becomes comparable to the am-bient vapour pressure. By contrast, the descent measure-ments at the bottom of the flight train in undisturbed air arecontamination-free throughout the stratosphere (Khaykin etal., 2013b).
Pico-SDLA H2O and CH4 are lightweight infrared spec-trometers measuring in situ water vapour at 2.63 µm andmethane at 3.24 µm respectively by direct absorption spec-troscopy (Durry et al., 2008; Ghysels et al., 2011). The op-tical path length for water vapour and methane measure-ments are 1 and 3.6 m respectively in ambient air. Duringthe campaign the mass of these spectrometers with the elec-tronic parts and the mechanical protections was less than 9 kg(Pico-SDLA H2O) and around 15 kg (Pico-SDLA CH4). Theuncertainty of the measurements is defined by the signal-to-noise ratio of the spectra, the polynomial order for baselinefitting, the number of points chosen for the interpolation, thequality of the spectroscopic parameters and the temperatureand pressure measurement accuracy. The total uncertainty ofwater vapour measurements ranges from 7.5 to 3.5 % in theTTL. The total uncertainty of methane measurements rangesfrom 3.5 to 5 % between 15 and 22 km (Ghysels et al., 2014).
Compact Optical Backscatter Aerosol Detector(COBALD) is a compact balloon-borne backscatter in-strument developed in the group led by Prof. Thomas Peterat ETH Zurich. With a total weight of approximately 550 gincluding batteries, COBALD measures molecular, aerosoland cloud particle backscatter in the atmosphere from theground to the level of balloon burst. COBALD sondes havebeen applied for studies of cirrus clouds (Brabec et al.,2012; Cirisan et al., 2014) volcanic aerosol (Bukowiecki etal., 2011) and non-volcanic aerosol (Vernier et al., 2015).The instrument makes use of two LEDs of 250 mW opticalpower each emitting light at 455 and 940 nm wavelengths.To register the backscattered light, a silicone photodiodeis placed between the LEDs, and the associated opticsestablishes an overlap region at distances larger than 0.5 min front of the instrument. The instrument is designed fornight-time use only, as solar radiation saturates the detector.Radiosonde pressure and temperature are used to calculatethe molecular backscatter, which is then used to infer thescattering ratio (SR) as total signal referenced to molecularcontribution. The SR profiles are binned to 1 hPa pressureintervals to reduce measurement noise, which typicallyincreases in the stratosphere. While the SR is not quantifiedabsolutely, the analysis of the entire sounding profile leadsto an absolute error interval of 5 % with precision betterthan 1 % in the lower stratosphere (Vernier et al., 2015).
www.atmos-chem-phys.net/16/12273/2016/ Atmos. Chem. Phys., 16, 12273–12286, 2016

12276 S. M. Khaykin et al.: Evidence of horizontal and vertical transport of water
By definition, the aerosol contribution to the SR (aerosolscattering ratio) is given as a surplus with respect to unity,i.e. SR− 1.
2.2 Remote sensing instruments
An S-band weather radar of IPMet was continuously oper-ating at the campaign site and provided information on theecho top heights. The IPMet radar has a 2◦ beam width anda range of 450 km for surveillance, but when operated in vol-ume scan mode every 7.5 min, it is limited to 240 km, witha radial resolution of 250 m and 1◦ in azimuth, recording re-flectivities, spectral width and radial velocities at 16 eleva-tions between 0.3 and 45◦.
The Microwave Limb Sounder (MLS) instrument,launched in 2004 on board the Aura satellite, is designedto measure a number of chemical species and temperatureand provides over 3500 vertical profiles per day evenly dis-tributed between 82◦ S to 82◦ N. Here we use the version 4.2water vapour profiles described by Livesey et al. (2015) whoreport, for the lower to middle stratosphere, a vertical reso-lution of 2.8–3.2 km, a horizontal resolution of 198–290 km,an accuracy of 4–9 % and a precision of 6–15 %. The datascreening criteria specified by Livesey et al. (2015) have beenapplied to the data.
Cloud-Aerosol Lidar with Orthogonal Polarization(CALIOP) is a primary instrument on board the CALIPSOsatellite, in operation since 2006 (Winker et al., 2009) andproviding backscatter coefficients at 532 and 1064 nm. Thevertical resolution of CALIOP varies with altitude, from30 m in the lower troposphere to 180 m in the stratosphere.In this study we use the CALIOP night-time 532 nm level 1Bversion 4.0 product for computing zonal-mean scatteringratios after discarding the South Atlantic magnetic anomalyzone. The data are post-processed using a treatment de-scribed by Vernier et al. (2009) and cloud-cleared in theupper troposphere using a depolarisation ratio threshold of5 %.
2.3 Trajectory and transport modelling
For tracking the origin of air masses sampled in situ by theballoons, we use the models HYSPLIT and CLaMS. HYS-PLIT (Hybrid Single-Particle Lagrangian Integrated Trajec-tory) model (Stein et al., 2015) was fed by GDAS (GlobalData Assimilation System) reanalysis provided at 0.5◦× 0.5◦
grid and 55σ -pressure levels between the surface and 10 hPa.The trajectories are calculated using altitude as the verti-cal coordinate, with the vertical velocity deduced from theGDAS meteorological fields. CLaMS (Chemical LagrangianModel of the Stratosphere) is a modular Chemistry TransportModel (CTM) developed at Forschungszentrum Jülich, Ger-many (McKenna et al., 2002). The model transport is drivenby the meteorological fields from the European Centre forMedium-range Weather Forecasts (ECMWF) ERA-Interim
reanalysis (Dee et al., 2011). The trajectories are calculatedusing potential temperature as the vertical coordinate, withthe (diabatic) vertical velocity deduced from the forecast to-tal diabatic heating rate (Andrews et al., 1987, Eq. 3.1.3e).Small-scale atmospheric mixing is parameterised in the La-grangian model CLaMS in relation to shear and strain ratesin the large-scale flow, such that the mixing occurs in regionsof strong flow deformations. Further details about CLaMSsimulation used here are given by Pommrich et al. (2014).
3 Evidence of horizontal transport (in-mixing)
3.1 Detection of in-mixing signatures
Five balloon measurements of water vapour (FLASH-B andPico-SDLA) and aerosol (COBALD) conducted over a pe-riod between 11 and 16 March 2012 revealed a recurring300–500 m-thick layer of enhanced water vapour and aerosolconcentration centred at the 425 K potential temperaturelevel (∼ 18.5 km). The amplitude of enhancements reached15 % (0.5 ppmv) in water vapour mixing ratio and 29 % inaerosol scattering ratio. A methane vertical profile obtainedby the Pico-SDLA instrument on 14 March revealed a re-duction of CH4 mixing ratio by 100 ppbv (∼−6 %) at thesame level. Figure 1 displays the vertical profiles of watervapour (solid red) and scattering ratio (solid green) obtainedon 13 March, when the layer had the largest thickness andamplitude of enhancement. The methane profile (solid blue)obtained on 14 March, featuring a local minimum in thecorresponding layer, is also displayed in Fig. 1. Note thatthe altitude and amplitude of the water vapour enhancementare identical to those reported by the Pico-SDLA hygrom-eter (see Sect. 2 and Ghysels et al., 2016). Two other localmaxima in water vapour, detected by FLASH-B at 404 and386 K, do not have corresponding enhancements in SR andare not observed in other flights. These features are discussedin Sect. 4. The nearest matching MLS water vapour pro-file (red/black squares), acquired on the same night,∼ 50 kmaway from the sounding location, is also provided in Fig. 1. Itdemonstrates a good agreement with the coincident balloonmeasurements, although the subkilometre vertical structuresare expectedly missed by MLS.
COBALD backscatter measurements were converted to532 nm for comparison with CALIPSO after deduction ofthe Angstrom exponent from 455 and 940 nm COBALDchannels, similarly to Vernier et al. (2015). The zonally andmonthly averaged SR profile from CALIPSO (green/blackcircles), showing a step-like increase in scattering ratiojust above the upper boundary of TTL, is consistent withCOBALD profile; however the enhancement at 425 K is onlyseen in COBALD local observation. This suggests a limitedspatio-temporal extent of the observed feature.
Atmos. Chem. Phys., 16, 12273–12286, 2016 www.atmos-chem-phys.net/16/12273/2016/

S. M. Khaykin et al.: Evidence of horizontal and vertical transport of water 12277
Figure 1. Vertical profiles of scattering ratio from COBALD (solidgreen, 13 March) and CALIPSO (green/black circles, Februaryzonal mean), water vapour from FLASH-B (solid red, 13 March)and MLS (red/black squares, 13 March), methane (solid blue, Pico-SDLA on 14 March). Horizontal dotted lines mark the lower and up-per boundaries of the water/aerosol-enriched and methane-depletedlayer. Horizontal dashed line marks the lapse rate tropopause (LRT)level. The circles and triangles indicate the altitude levels, fromwhere CLaMS back trajectories were initialised (same conventionfor the markers is used in Fig. 2). See text for detail.
3.2 Satellite perspective and trajectory modelling
The origin of the observed layer is investigated using CLaMStrajectories initialised at eight levels within and around thelayer – these levels are marked by circles and triangles inFig. 1. The same convention for markers is used in Fig. 2, dis-playing the latitudinal locations of the air masses from withinand outside the layer 15 days prior to the 13 March sounding.Trajectory analysis suggests that the water/aerosol-enrichedlayer originates from the extratropical stratospheric over-world (θ > 380 K), as opposed to the layers directly belowand above, which are traced back from within the SouthernHemisphere tropics. The transport from middle and high lat-itudes is of quasi-isentropic nature as the isentropes shown inFig. 2 suggest.
The latitude–altitude distribution of water vapour fromMLS displayed in Fig. 2 explains the enhanced humidityof the layer: the extratropical stratosphere around the 440 Klevel contains about 20 % more water than the tropical lowerstratosphere. Indeed, the mixing ratio of 4.2 ppmv measuredin situ within the layer is fully compatible with MLS zonal-mean values at the source locations. The same interpretationis applicable to the enhanced aerosol in situ readings in thelayer: higher aerosol load (SR> 1.07) of the southern mid-latitude stratosphere is evident.
The water vapour minimum throughout the TTL, as seenby MLS in February, is associated with dehydration ofair parcels advected through the “cold trap” predominantlyabove the western Pacific region (Holton and Gettelman,2001). The increase of LS water towards high latitudes is
Figure 2. Latitude–altitude section of monthly zonal mean MLSwater vapour (a) and CALIPSO scattering ratio (b). Larger mark-ers (circles and triangles) indicate the location of the sampled airmasses 15 days prior to balloon sounding on 13 March (sameconvention as in Fig. 1) Smaller markers indicate the locationswhere trajectories were initialised. Circles denote the trajectoriesinitialised from the WV/SR enhancement; triangles denote trajecto-ries initialised at levels below and above. The isentropes (white con-tours) and the lapse rate (LR) tropopause (grey curve) were calcu-lated using zonally averaged COSMIC GPS radio-occultation mea-surements (Anthes et al., 2008).
commonly associated with the diabatic subsidence of air –enriched with water through methane oxidation – in the de-scending branch of Brewer–Dobson circulation. For this rea-son the extratropical stratosphere contains more water vapourand less methane. The latitude distribution of aerosol load,featuring a minimum in the TTL and midlatitude lowermoststratosphere, can be explained by cross-tropopause transportof clean tropospheric air (cleansing) during the austral sum-mer convective season (Vernier et al., 2011).
3.3 CLaMS transport simulation
The in-mixing of extratropical air – as suggested by the tra-jectory analysis – is precisely demonstrated by the watervapour fields simulated by CLaMS. Figure 3a displays theCLaMS water vapour at 420 K above South America andSouth Atlantic ocean. The simulation reports water mixingratios below 3 ppmv wherever the winds are easterly, that ismainly within the tropical belt, where water vapour is de-
www.atmos-chem-phys.net/16/12273/2016/ Atmos. Chem. Phys., 16, 12273–12286, 2016

12278 S. M. Khaykin et al.: Evidence of horizontal and vertical transport of water
Figure 3. CLaMS simulated fields of water vapour for 13 March (a) and methane for 14 March (b) with ERA-Interim winds superimposed.A filament of water-rich and methane-poor air extending above the sounding location (marked by the triangle) is clearly visible.
pleted by “cold trap” dehydration. South of 40◦ S, strongwesterly winds and higher mixing ratios (> 4 ppmv) prevail.The ERA-Interim wind fields in Fig. 3 show an enhancedmeridional wind component above the South Atlantic, re-lated to a Rossby wave breaking event (as suggested by ERA-Interim potential vorticity fields, not shown), which supplieshumid high-latitude air up to 40◦ S, where it is entrained bythe tropical zonal flow. As a result, a moist filament, severalthousand kilometres long and only a few hundred kilome-tres thick, is formed. The filament extends sharply above thesounding location on 13 March.
Over the following days, as suggested by the model sim-ulations (not shown), the filament weakens, mixes out withthe ambient drier air and vanishes completely by 17 March.According to CLaMS, the intrusion was most prominent on13 March, which is fully compatible with the balloon sound-ings that showed a maximum amplitude of water enhance-ment at 420–430 K on 13 March. Simulation of methanefields (Fig. 3b) at this level reveals a corresponding filamentof methane-poor air, which is compatible with the in situmethane profile of 14 March, showing a subtle reduction ofmethane mixing ratio at the 425 K level. A notable anticor-relation between the water and methane fields is expectablesince photochemical oxidation of methane in the stratosphereyields water vapour. The age of air inside the filament – asestimated using CLaMS – is 18 months on average, which issubstantially older than the tropical belt air, with mean ageof about 7–8 months.
4 Evidence of vertical transport of water(overshooting)
In the previous section we showed that the enhancements inwater vapour and aerosol at 425± 5 K, detected in a series ofsuccessive soundings and corresponding to methane reduc-tion feature, can be unambiguously attributed to long-rangehorizontal transport (in-mixing). However, this interpretation
does not hold for the two other water vapour enhancements at404 and 386 K – specific to a single sounding, which promptsus to seek for another origin of these features.
4.1 Hydration signatures
Figure 4 displays water vapour and temperature profilesobtained by Pico-SDLA (balloon descent) and FLASH-B (ascent and descent) successively in time in the quasi-simultaneous soundings of 13 March. The levels of inter-est, at which the FLASH-B descent profile showed sharp en-hancements, are marked by dashed lines with an indicationof time when these levels were sampled. The FLASH-B as-cent profile is limited to below 18.7 km as the measurementsabove that level are affected by water outgassing, which in-troduces a positive bias (with respect to the clean descentmeasurement) increasing with altitude (Sect. 2.1).
The Pico-SDLA descent profile (Fig. 4a) shows a 240 m-thick humid layer centred at 404 K (17.8 km, 82 hPa,22:06 UTC) with an amplitude of enhancement of 0.6 ppmv.The amplitude is estimated as a difference between the peakvalue of the enhancement and a mean value over the under-lying and overlying 300 m-thick layers. In the ascent pro-file of FLASH-B (Fig. 4b), the enhancement at 404 K isdiscernible; however its amplitude (∼ 0.2 ppmv) is close tothe detection limit of the instrument (0.1 ppmv). The de-scent profile of FLASH-B (Fig. 4c) reveals two sharp en-hancements, both around 200 m-thick: at 404 K (0.5 ppmv)and a smaller one (0.4 ppmv) at 386 K (17.1 km, 93 hPa,23:46 UTC). The lower layer has a lower amplitude of en-hancement (0.2 ppmv) in the FLASH-B ascent profile andis barely discernible in the Pico-SDLA descent profile. Notethat given the balloon flight trajectories, the horizontal dis-tance between the detections of humid layers by Pico-SDLAand FLASH-B does not exceed 30 km and 100 min, whereasFLASH-B ascent and descent measurements at 17–18 km al-titude are only 10 km and 30 min apart.
Atmos. Chem. Phys., 16, 12273–12286, 2016 www.atmos-chem-phys.net/16/12273/2016/

S. M. Khaykin et al.: Evidence of horizontal and vertical transport of water 12279
Figure 4. Water vapour (blue) and temperature (black) vertical profiles obtained successively in time on 13 March by (a) Pico-SDLA ondescent, (b) FLASH-B on ascent (outgassing-biased part removed), (c) FLASH-B on descent. The cyan and green curves in the right-handpanel indicate relative humidity with respect to ice (RHi, top axis, FLASH/RS92) and scattering ratio at 532 nm (SR, bottom axis, COBALD).The horizontal dashed lines mark the levels where hydrated layers in (c) were sampled with indication of the sampling time (UTC). The thindashed line indicates the level of lapse rate tropopause (LRT, 376 K).
Notable variability of water vapour vertical structure ona scale of a few tens of kilometres (minutes) indicates localprocesses such as overshooting convection, capable of inject-ing water above the tropopause. Throughout the paper we re-fer to the term “overshooting” with regard to the mass trans-port across the lapse rate tropopause (LRT). The LRT altitudeon 13 March inferred from the FLASH-B sounding (RS92)amounted to 16.4 km.
4.2 Convective activity on 13 March
An extremely weak pressure gradient over south-easternBrazil, combined with the equally weak upper air circulation,provided an ideal situation for convective activity over theState of São Paulo on 13 March. Isolated thunderstorms firstdeveloped in the south-east sector of the IPMet radar aroundnoon, local time (UTC− 3 h), but quickly consolidated intolarge multicellular complexes, with several cells overshoot-ing into the lower stratosphere during the later afternoon. Asequence of radar echo top images (240 km range, reflec-tivity threshold 10 dBZ) between 10:00 and 15:00 UTC, ac-quired every 7.5 min, revealed over 10 different convectivecells reaching above 17 km.
Shown in Fig. 5 is a composite radar image including allecho tops reaching above 15–17 km (see Sect. 4.4 for inter-pretation of the echo top altitudes) detected by the radar on13 March in the upwind quadrant of the soundings. Whereasthe convective cloud systems hosting the overshooting cellsextended for over 100 km, the areas of radar echoes above17 km were limited to a few tens of kilometres or less in di-ameter. The lifetime of overshooting cells, emerging sporad-ically above the “mother cloud”, was typically limited to twosuccessive radar volume scans, i.e. 15–29 min.
Given the position of the overshooting cells relative to theballoon soundings and the weak wind velocity in the TTL
Figure 5. Composite radar image of all convective cells reachingabove 15 km detected on 13 March by IPMet radar in the upwindquadrant of Bauru. Black arrows tag the overshooting cells poten-tially responsible for the hydrated layers shown in Fig. 4 with indi-cation of the UTC of their detection by radar. White arrows repre-sent the mean wind field between 100 and 70 hPa from ERA-Interimreanalysis (18:00 UTC). Blue lines indicate the balloon trajectories(FLASH-B dark blue, Pico-SDLA light blue).
(< 5 m s−1), one can assume that the cells closest to Bauru(e.g. those tagged by black arrows in Fig. 5) are more likelyto affect the composition of air sampled by the balloons.
Figure 6 displays the temporally resolved cumulative areaof all overshooting cloud tops observed on 13 March withinthe quantitative detection range of the IPMet radar (240 km).The peak of the overshooting area around 17:00 local time,which is consistent with a typical diurnal cycle of convectionabove land (Liu and Zipser, 2005), is remarkable. The max-
www.atmos-chem-phys.net/16/12273/2016/ Atmos. Chem. Phys., 16, 12273–12286, 2016

12280 S. M. Khaykin et al.: Evidence of horizontal and vertical transport of water
Figure 6. Temporal evolution of cumulative overshooting area atdifferent levels of TTL recorded by IPMet radar on 13 March withinits 240 km range (10 dBZ reflectivity threshold). The black starsmark the timing of overshooting cells shown in Figs. 5 and 7.
imum convective activity was recorded at 17:30 local time(14:30 UTC), when the total area of cloud tops above 17 and16 km reached 100 and 200 km2 respectively. For compari-son, the combined overshooting area of the two small cellsclosest to Bauru (marked by arrows in Fig. 5 and by stars inFig. 6) constitutes only about 4 % of the daily maximum oftotal cloud area above 16 km.
4.3 Overshoot tracking
The overshooting cells potentially responsible for the waterenhancements were identified using HYSPLIT backward tra-jectories (not shown) and a sequence of radar echo top im-ages. The hydrated air parcels sampled at 404 and 386 Kwere traced backward in time, through the radar scans se-quence, until a parcel’s trajectory matched in space and timewith a convective cell reaching above 16 km. Two differentconvective cells, Cell 1 occurring at 16:46 UTC and Cell 2at 17:38 UTC (marked by black arrows in Fig. 5) with over-shooting tops located at 45 and 32 km respectively upwindfrom the FLASH-B sampling location (49 and 37 km fromPico-SDLA), were identified for both hydrated layers. Itshould be noted that the trajectory calculations strongly de-pend on the accuracy of the wind fields in the meteorologicaldata fed into the model. This becomes particularly impor-tant when the tracked target (overshooting cell in this case)is smaller than a grid cell of meteorological data field. We at-tempt to compensate for this uncertainty by computing an en-semble of trajectories to estimate the dispersion of air parcelsaffected by overshooting convection.
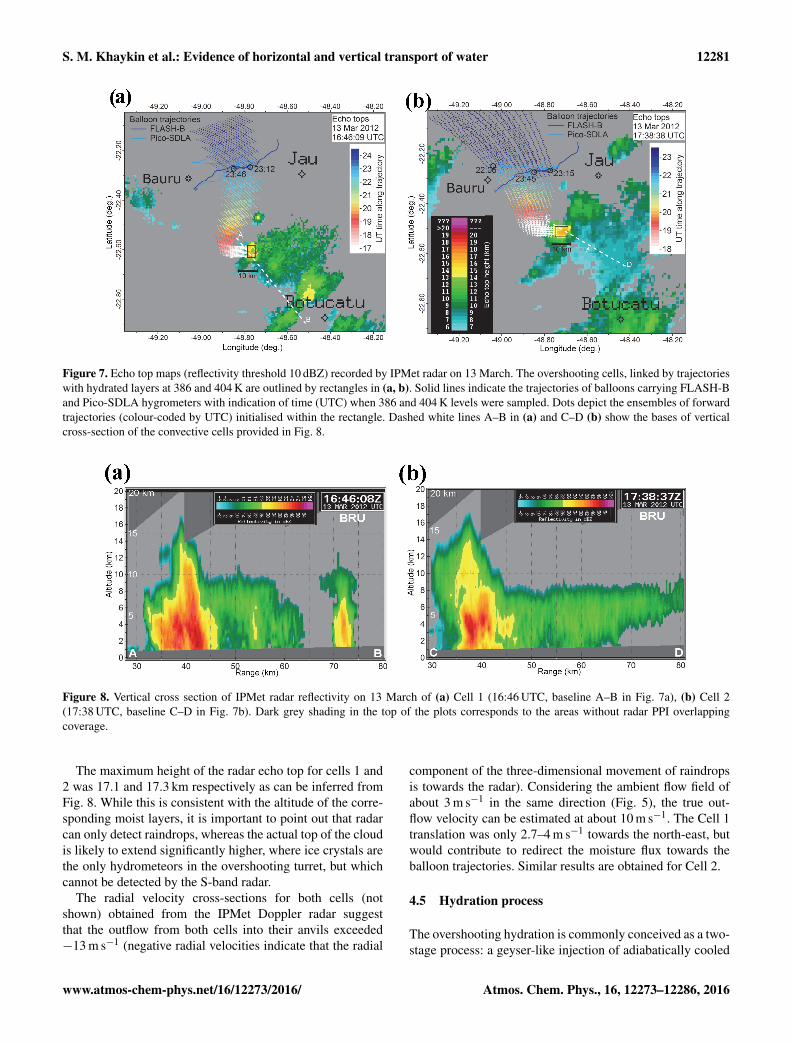
Figure 7 shows two blow-ups of the radar echo top im-ages, where the overshooting cells, presumably responsiblefor the hydrated layers, are outlined with black rectangles.Superimposed on each radar image is an ensemble of 144 for-ward trajectories initialised within the rectangles at four lev-els corresponding to the vertical extent of the hydrated lay-ers and spaced vertically by 50 m. The trajectory ensembles,colour-coded by UTC, show the spatio-temporal evolutionof the plumes of overshooting cells. Note that the altitude ex-cursions of the air parcels did not exceed 200 m accordingto HYSPLIT simulations. The locations where the hydrated
layers were sampled are marked with circles along FLASH-B and Pico-SDLA balloon flight trajectories.
Cell 2, linked at 404 K to the hydrated layer by trajecto-ries (Fig. 7b) had a lifetime of two radar scans and a diame-ter of less than 10 km. Its plume, as suggested by the trajec-tory ensemble, reached the sounding locations by 22:00 UTCand covered all three sampling locations where the hydratedlayers were detected. The FLASH-B ascent sampling at23:15 UTC is located on the edge of the plume, which mayexplain the subtlety of the corresponding water vapour en-hancement (Fig. 4b). Cell 1, linked with the hydrated layerat 386 K (Fig. 7a), had yet smaller size and a lifetime lim-ited to a single radar scan. Its plume had a smaller dispersionand covered the FLASH-B sampling locations only, which islikely why the hydrated layer at 386 K was not unambigu-ously detected by Pico-SDLA (Fig. 4a).
Overall, the above analysis suggests a relation between thehydrated layers and convective overshoots upwind, which oc-curs 5–6 h before the soundings. The question is – could anyother overshooting cells in the upwind area be responsible forthe hydrated layers? As can be seen in Fig. 5, the overshoot-ing cells at 16:46 and 17:38 UTC are remarkably smaller thanthe other ones occurring upwind on that day; however theERA-Interim wind velocities in the 100–70 hPa layer (shownas white vectors in Fig. 5) of the order of 5 m s−1 or lesswould not allow more distant overshoots to be transported intime to the sounding location. For example, the plumes oftwo larger cells detected south of Botucatu (Fig. 5) wouldhave reached the sounding locations several hours after themeasurements were taken. On the previous day (12 March) amedium-sized overshooting cell was detected about 200 kmsouth-east of Bauru at 14:16 UTC (not shown); however itslocation and timing do not allow us to link it with the sound-ing location using trajectories. Therefore we are led to con-clude that the two small overshooting cells of 13 March clos-est to the measurement location are the most likely sourcesof the hydrated layers. That said, we cannot entirely rule outthe contribution from other convective cells because fastersubgrid-scale winds, unresolved by the reanalysis, may existaround the strong convection.
4.4 Overshooting top altitude
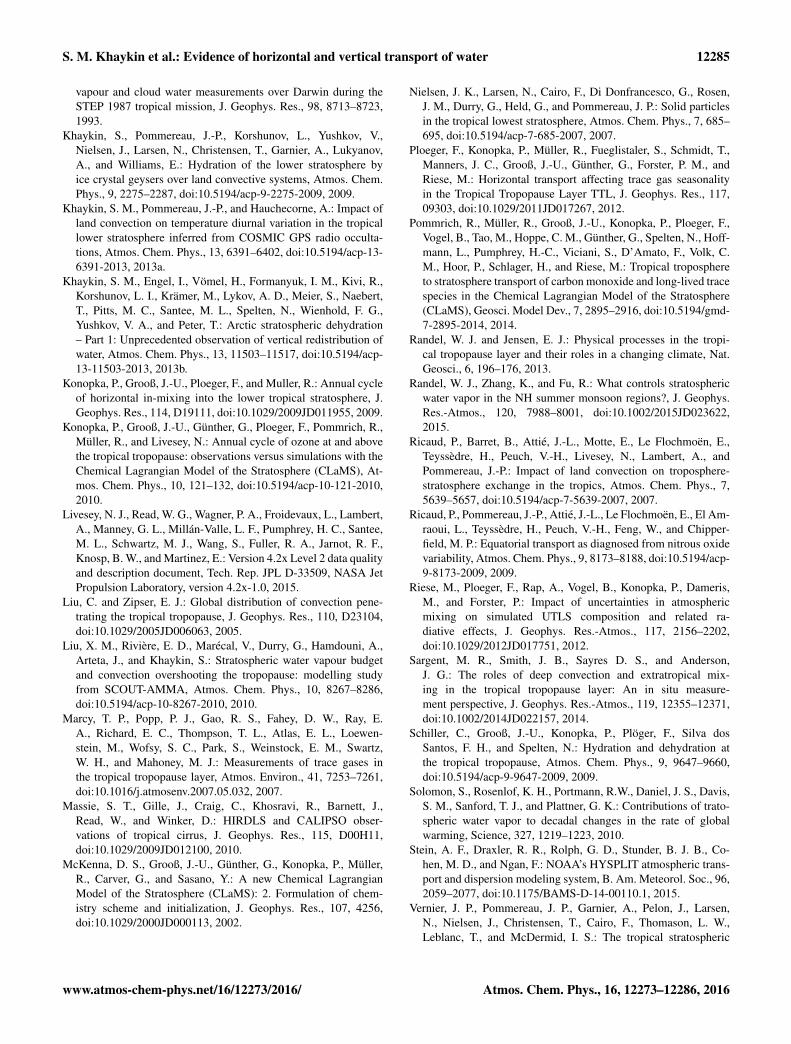
The two overshooting cells shown in Fig. 7 are characterisedby extremely strong updrafts, facilitating their rapid verti-cal growth. Figure 8 shows Cell 1 and Cell 2 vertical cross-sections, highlighting the complexity of the cell structure andairflow. The vertical cuts were made along the base lines A–Band C–D (shown in Fig. 7a and b) using a reflectivity thresh-old of −6 dBZ (cf. 10 dBZ in Figs. 5 and 7) to enhance thesensitivity in the near range (the −2 dBZ contour is visibleup to a range of 40 km). The maximum reflectivity was 52.8and 54.2 dBZ in Cell 1 and Cell 2 respectively, typical forsevere tropical storms, likely to produce hail on the ground.
Atmos. Chem. Phys., 16, 12273–12286, 2016 www.atmos-chem-phys.net/16/12273/2016/
S. M. Khaykin et al.: Evidence of horizontal and vertical transport of water 12281
Figure 7. Echo top maps (reflectivity threshold 10 dBZ) recorded by IPMet radar on 13 March. The overshooting cells, linked by trajectorieswith hydrated layers at 386 and 404 K are outlined by rectangles in (a, b). Solid lines indicate the trajectories of balloons carrying FLASH-Band Pico-SDLA hygrometers with indication of time (UTC) when 386 and 404 K levels were sampled. Dots depict the ensembles of forwardtrajectories (colour-coded by UTC) initialised within the rectangle. Dashed white lines A–B in (a) and C–D (b) show the bases of verticalcross-section of the convective cells provided in Fig. 8.
Figure 8. Vertical cross section of IPMet radar reflectivity on 13 March of (a) Cell 1 (16:46 UTC, baseline A–B in Fig. 7a), (b) Cell 2(17:38 UTC, baseline C–D in Fig. 7b). Dark grey shading in the top of the plots corresponds to the areas without radar PPI overlappingcoverage.
The maximum height of the radar echo top for cells 1 and2 was 17.1 and 17.3 km respectively as can be inferred fromFig. 8. While this is consistent with the altitude of the corre-sponding moist layers, it is important to point out that radarcan only detect raindrops, whereas the actual top of the cloudis likely to extend significantly higher, where ice crystals arethe only hydrometeors in the overshooting turret, but whichcannot be detected by the S-band radar.
The radial velocity cross-sections for both cells (notshown) obtained from the IPMet Doppler radar suggestthat the outflow from both cells into their anvils exceeded−13 m s−1 (negative radial velocities indicate that the radial
component of the three-dimensional movement of raindropsis towards the radar). Considering the ambient flow field ofabout 3 m s−1 in the same direction (Fig. 5), the true out-flow velocity can be estimated at about 10 m s−1. The Cell 1translation was only 2.7–4 m s−1 towards the north-east, butwould contribute to redirect the moisture flux towards theballoon trajectories. Similar results are obtained for Cell 2.
4.5 Hydration process
The overshooting hydration is commonly conceived as a two-stage process: a geyser-like injection of adiabatically cooled
www.atmos-chem-phys.net/16/12273/2016/ Atmos. Chem. Phys., 16, 12273–12286, 2016

12282 S. M. Khaykin et al.: Evidence of horizontal and vertical transport of water
air (Danielsen, 1993; Jensen et al., 2007) together with iceparticles (Nielsen et al., 2007; Corti et al., 2008) that furthersediment out and/or sublimate, thereby locally increasing thewater vapour amount at the level of detrainment (Khaykinet al., 2009; Schiller et al., 2009). Small cooling features(∼−1 K) corresponding to the hydrated layer at 404 K arediscernible in Fig. 4; however the backscatter measurementsduring that flight (green curve in Fig. 4c) do not provide anyindication for the presence of ice particles in the hydratedlayers. Apparently, the ice detrained from convective up-drafts has fully sublimated (or partly precipitated) before theplume was sampled. Indeed, the minimum saturation mixingratio in the TTL – as derived from radiosonde data from theFLASH-B flight – amounted to 8.5 ppmv at 404 K (whichtranslates into 47 % relative humidity over ice – RHi, cyancurve in Fig. 4c), implying that the air was far from satura-tion conditions.
It should be kept in mind that subsaturation of air at andabove the level of detrainment is a prerequisite for hydra-tion of the stratosphere through overshooting. If the TTLabove the level of detrainment is close to saturation, thestratospheric hydration is possible only if the humid air isinjected above the temperature minimum (CPT), otherwiseany amount of additional water in excess of the minimumsaturation would freeze out as it rises into the stratosphere.Furthermore, if TTL is initially supersaturated, an overshootcan lead to dehydration as the excess vapour condenses onthe ice crystals (Jensen et al., 2007). In a generalized case,an overshoot must surpass the CPT level to ultimately hy-drate the stratosphere; however if CPT is well below the sat-uration – as is the case here – any overshoot above the levelof zero radiative heating (LZRH,∼ 360 K, Fuegustaler et al.,2009) can potentially hydrate the stratosphere. In the case of13 March, sounding CPT is found at 387 K (17.3 km), whichis slightly above the lower humid layer (386 K) but well be-low the upper humid layer (404 K).
The observation of overshooting hydration presented herecan be compared to a similar case captured by a bal-loon sounding conducted during monsoon season in westernAfrica (Khaykin et al., 2009). However, in that case, a watervapour enhancement of 1.1 ppmv was observed together witha layer of ice particles in subsaturated air (56 % RHi) above acloud anvil at 392 K (17.6 km altitude), indicating the ongo-ing sublimation of ice. A small cooling signature and a dip inozone within the moist layer were also observed. The anal-ysis of local radar acquisitions in Africa suggested that theice was injected by a nearby upwind overshooting cell, 30–60 min before the detection – a much shorter time intervalthan that (5–6 h) in the present case.
5 Discussion and summary
High-resolution balloon-borne measurements of watervapour and aerosol reported here provide insights into the
processes controlling the composition and structure of theTTL. The credibility of water vapour measurements ex-ploited is confirmed by the excellent agreement betweenFLASH-B and Pico-SDLA hygrometers (Ghysels et al.,2016), capturing identical vertical structures. The analysisprovided above links the observed fine structures of TTLwater vapour with two independent and concurrent transportprocesses – in-mixing from the extratropical stratosphere andconvective hydration – both reflected by local enhancementsof water vapour mixing ratio of similar amplitude. Remark-ably, the signatures of both transport pathways, verticallyspaced by only a few hundreds of metres, were coexistingin the same balloon profile.
The interpretation of the observed structures and their at-tribution to different transport pathways into the TTL wasbased on the use of satellite and ground-based radar obser-vations together with back trajectories and transport mod-elling. CLaMS simulation precisely reproduces the signa-ture of in-mixing from the extratropical LS, reflected in themeasurements as coincident water vapour enhancement andmethane depletion at 420–430 K. Both vertical and tempo-ral extents of the observed features are fully consistent withthose suggested by CLaMS simulation, revealing an intru-sion of water-rich and methane-poor air within an elon-gated filament. The coincident local maximum of scatteringratio was interpreted using CALIPSO observations, show-ing larger aerosol load in the extratropical LS compared tothe clean TTL. Although coincident enhancements in watervapour and aerosol can be in principle interpreted as a resultof convective injection of ice particles and their partial subli-mation, the argumentation provided above strongly supportsthe idea of horizontal in-mixing as being the cause.
The effect of in-mixing on the TTL composition and itsseasonality is known to be most apparent in tracers of strato-spheric origin and with strong meridional gradients in thelower stratosphere (Ploeger et al., 2012). Indeed, in-mixingwas found to contribute considerably to the annual cycle ofozone above the tropical tropopause (Konopka et al., 2009,2010). At the same time, the effect of in-mixing on theTTL water vapour seasonality is expected to be small at thetropics-wide scale (Ploeger et al., 2012). The in situ evi-dence of water vapour enhancement of 15 % in a 500 m-thicklayer due to in-mixing – as reported in this study – can nei-ther dispute nor support the above inference. Hence, we canonly conclude that the intrusion of midlatitude air (containingslightly more water and slightly less methane) into the up-permost TTL predicted by CLaMS is fully confirmed by themeasurements provided here. We note also that the manifes-tation of this transport pathway in water vapour and methanehas never been previously evidenced by observations.
A less expected phenomenon evidenced by our observa-tions is the effect of in-mixing on aerosol content of the TTLin the absence of volcanic eruptions injecting sulfur into thestratosphere. While a local maximum of aerosol SR at lowerstratospheric levels is a typical signature of volcanic plume,
Atmos. Chem. Phys., 16, 12273–12286, 2016 www.atmos-chem-phys.net/16/12273/2016/

S. M. Khaykin et al.: Evidence of horizontal and vertical transport of water 12283
in our case it is conditioned by a higher stratospheric back-ground aerosol load at midlatitudes with respect to the cleanTTL in March, that is after the austral summer convectiveseason, when systematic injections of clean tropospheric airreduce the aerosol abundance throughout the TTL (Vernier etal., 2011).
The fast cross-tropopause transport of clean air by over-shooting has been shown to have a global-scale effect onthe stratospheric aerosol budget (Vernier et al., 2011). Re-gional effects of overshooting have been detected in vari-ous tropospheric tracers, such as N2O, CH4 and CO (Ricaudet al., 2007, 2009). Carminati et al. (2014) used MLS day-time and night-time observations to investigate the diurnalcycle of water vapour, cloud ice-water and temperature. Theyfound a daytime moistening of the TTL and LS (up to 6 %)over southern tropical land during austral summer, whichwas attributed to convective hydration. According to Iwasakiet al. (2010), the total number of overshoots penetrating the380 K level across the tropical belt is 7× 10⁶ per year as in-ferred from CALIPSO and CloudSat radar observations. Ahydration of about 100 t per event was estimated from thesedata. The frequency of clouds above 390 K was estimated tobe 5–10 % by Massie et al. (2010) using High ResolutionDynamic Limb Sounder (HIRDLS) and CALIPSO observa-tions.
It should be noted that MLS, CALIPSO, CloudSat andHIRDLS, all operating within the A-TRAIN constellation,only sample local times around 01:30 and 13:30, and there-fore miss the strong late-afternoon peak of convective activ-ity above tropical continents. Another important factor, hin-dering observation of convective moistening, is the broadvertical resolution of MLS profiles, which completely missthe hydration signatures, manifesting themselves at subkilo-metre vertical extent. On the modelling side, CTM simula-tions (like the one reported here), being capable of capturingfine structures due to horizontal transport, do not reproduceovershooting hydration signatures which originate from iso-lated convective systems. Presently, the localised deep con-vection and its impact on TTL composition and temperaturecan only be reliably simulated using non-hydrostatic cloud-resolving models. Extrapolation of these results to regionalor global scale remains a great challenge, partly due to thelack of observational constraints (Randel and Jensen, 2013).Indeed, the number of in situ observations of moisteningabove 390 K is limited to only a few case studies, all quotedin the introduction. The lack of in situ evidence of moisteningcould be explained by (i) overall lack of high-quality in situobservations of TTL water vapour; (ii) logistical complexityof field operations in the regions of most vigorous convec-tion (e.g. central Africa, Amazonian region or maritime con-tinent) and (iii) difficulty (or impossibility) of balloon andaircraft operations near convective storms.
In this study we report new in situ evidence of convectivehydration up to the 404 K level, detected as a 200–250 m-thick enhancements of water vapour by up to 0.6 ppmv
(18 %). Such a petty feature can hardly be used to support theimportance of convective hydration. However, as we pointout above, these tiny enhancements owe their existence tovery small convective cells with overshooting area of a fewsquare kilometres only and are remarkably smaller than otherovershooting clouds observed on that day. Their cumulativeeffect on TTL water vapour may be substantial.
Interestingly, in our case the in-mixing from the extratrop-ical stratosphere manifests itself in water vapour in a wayvery similar to what can be expected from convective hydra-tion: the amplitude of enhancement in water vapour amountsto ∼ 0.5 ppmv for both horizontal and vertical transport sig-natures. However the moistening effect of in-mixing on thetropical LS is limited by the small meridional gradient of wa-ter vapour and can hardly exceed 0.5–0.7 ppmv. In contrast tothat, the convective hydration of LS, which has a global effectproportional to overshoot frequency and intensity, should belimited only by the temperature at the level of injection. Thisway, a relatively warm TTL/LS above the continents, host-ing the most vigorous convection, provides favourable con-ditions for the convective hydration of LS.
6 Data availability
The following satellite data used in this studyare publicly available: CALIPSO, https://eosweb.larc.nasa.gov/project/calipso/calipso_table; MLS,http://mls.jpl.nasa.gov/products/h2o_product.php; COS-MIC, http://cdaac-www.cosmic.ucar.edu/cdaac/. The datafrom the balloon experiments can be obtained by contactingthe principal author.
Acknowledgements. This work and the TRO-picoproject (http://www.univ-reims.eu/minisite_134/tro-pico/homepage-presentation-of-the-project,12171,21885.html) weresupported by the French Agence Nationale de la Recherche (ANR)under contract ANR-2010-BLAN-609-01 and H2020 ARISE2project (ref. 653980, http://arise-project.eu/). We express oursincere gratitude to the personnel of IPMet for providing aninfrastructure and manpower, especially for their invaluable helpwith the balloon operation during the campaign. We also thankthree anonymous reviewers for useful remarks that helped toimprove the article.
Edited by: E. JensenReviewed by: three anonymous referees
References
Andrews, D. G., Holton, J. R., and Leovy, C. B.: Middle Atmo-spheric Dynamics, Academic Press, New-York, 489 pp., 1987.
Anthes, R. A., Bernhardt, P. A., Chen, Y., Cucurull, L., Dymond, K.F., Ector, D., Healy, S. B., Ho, S.-P., Hunt, D. C., Kuo, Y.-H., Liu,H., Manning, K., McCormick, C., Meehan, T. K., Randel, W. J.,
www.atmos-chem-phys.net/16/12273/2016/ Atmos. Chem. Phys., 16, 12273–12286, 2016

12284 S. M. Khaykin et al.: Evidence of horizontal and vertical transport of water
Rocken, C., Schreiner, W. S., Sokolovskiy, S. V., Syndergaard,S., Thompson, D. C., Trenberth, K. E., Wee, T.-K., Yen, N. L.,and Zeng, Z.: The COSMIC/FORMOSAT-3 Mission: Early Re-sults, B. Am. Meteorol. Soc., 89, 313–333, doi:10.1175/BAMS-89-3-313, 2008.
Bergman, J. W., Jensen, E. J., Pfister, L., and Yang, Q.: Seasonal dif-ferences of vertical-transport efficiency in the tropical tropopauselayer: On the interplay between tropical deep convection, large-scale vertical ascent, and horizontal circulations, J. Geophys.Res., 117, D05302, doi:10.1029/2011JD016992, 2012.
Brabec, M., Wienhold, F. G., Luo, B. P., Vömel, H., Immler, F.,Steiner, P., Hausammann, E., Weers, U., and Peter, T.: Particlebackscatter and relative humidity measured across cirrus cloudsand comparison with microphysical cirrus modelling, Atmos.Chem. Phys., 12, 9135–9148, doi:10.5194/acp-12-9135-2012,2012.
Bukowiecki, N., Zieger, P., Weingartner, E., Jurányi, Z., Gysel, M.,Neininger, B., Schneider, B., Hueglin, C., Ulrich, A., Wichser,A., Henne, S., Brunner, D., Kaegi, R., Schwikowski, M., To-bler, L., Wienhold, F. G., Engel, I., Buchmann, B., Peter, T., andBaltensperger, U.: Ground-based and airborne in-situ measure-ments of the Eyjafjallajökull volcanic aerosol plume in Switzer-land in spring 2010, Atmos. Chem. Phys., 11, 10011–10030,doi:10.5194/acp-11-10011-2011, 2011.
Carminati, F., Ricaud, P., Pommereau, J.-P., Rivière, E., Khaykin,S., Attié, J.-L., and Warner, J.: Impact of tropical land convec-tion on the water vapour budget in the tropical tropopause layer,Atmos. Chem. Phys., 14, 6195–6211, doi:10.5194/acp-14-6195-2014, 2014.
Cirisan, A., Luo, B. P., Engel, I., Wienhold, F. G., Sprenger, M.,Krieger, U. K., Weers, U., Romanens, G., Levrat, G., Jeannet, P.,Ruffieux, D., Philipona, R., Calpini, B., Spichtinger, P., and Pe-ter, T.: Balloon-borne match measurements of midlatitude cirrusclouds, Atmos. Chem. Phys., 14, 7341–7365, doi:10.5194/acp-14-7341-2014, 2014.
Chaboureau, J.-P., Cammas, J.-P., Duron, J., Mascart, P. J., Sitnikov,N. M., and Voessing, H.-J.: A numerical study of tropical cross-tropopause transport by convective overshoots, Atmos. Chem.Phys., 7, 1731–1740, doi:10.5194/acp-7-1731-2007, 2007.
Chemel, C., Russo, M. R., Pyle, J. A., Sokhi, R. S., and Schiller, C.:Quantifying the imprint of a severe hector thunderstorm duringACTIVE/SCOUT-O3 onto the water content in the upper tropo-sphere/lower stratosphere, Mon. Weather Rev., 137, 2493–2514,doi:10.1175/2008MWR2666.1, 2009.
Corti, T., Luo, B. P., de Reus, M., Brunner, D., Cairo, F., Ma-honey, M. J., Martucci, G., Matthey, R., Mitev, V., dos Santos,F. H., Schiller, C., Shur, G., Sitnikov, N. M., Spelten, N., Voss-ing, H. J., Borrmann, S., and Peter, T.: Unprecedented evidencefor deep convection hydrating the tropical stratosphere, Geophys.Res. Lett., 35, L10810, doi:10.1029/2008GL033641, 2008.
Danielsen, E. F.: In situ evidence of rapid, vertical, irreversibletransport of lower tropospheric air into the lower stratosphere byconvective cloud turrets and by large scale up welling in tropicalcyclones, J. Geophys. Res., 98, 8665–8681, 1993.
Dee, D. P., Uppala, S. M., Simmons, A. J., Berrisford, P., Poli,P., Kobayashi, S., Andrae, U., Balmaseda, M. A., Balsamo, G.,Bauer, P., Bechtold, P., Beljaars, A. C. M., van de Berg, L., Bid-lot, J., Bormann, N., Delsol, C., Dragani, R., Fuentes, M., Geer,A. J., Haimberger, L., Healy, S. B., Hersbach, H., Holm, E. V.,
Isaksen, L., Kallberg, P., Kohler, M., Matricardi, M., McNally,A. P., Monge-Sanz, B. M., Morcrette, J.-J., Park, B.-K., Peubey,C., de Rosnay, P., Tavolato, C., Thepaut, J.-N., and Vitart, F.: TheERA-Interim reanalysis: configuration and performance of thedata assimilation system, Q. J. Roy. Meteor. Soc., 137, 553–597,doi:10.1002/qj.828, 2011.
de Reus, M., Borrmann, S., Bansemer, A., Heymsfield, A. J.,Weigel, R., Schiller, C., Mitev, V., Frey, W., Kunkel, D., Kürten,A., Curtius, J., Sitnikov, N. M., Ulanovsky, A., and Raveg-nani, F.: Evidence for ice particles in the tropical stratospherefrom in-situ measurements, Atmos. Chem. Phys., 9, 6775–6792,doi:10.5194/acp-9-6775-2009, 2009.
Dessler, A. E., Schoeberl, M. R., Wang, T., Davis, S. M., andRosenlof, K. H.: Stratospheric water vapor feedback, P. Natl.Acad. Sci. USA, 110, 8087–18091, 2013.
Durry, G., Amarouche, N., Joly, L., Liu, X., Parvitte, B., and Zen-inari, V.: Laser diode spectroscopy of H2O at 2.63 µm for atmo-spheric applications, Appl. Phys. B, 90, 573–580, 2008.
Fueglistaler, S., Dessler, A. E., Dunkerton, T. J., Folkins, I., Fu, Q.,and Mote, P. W.: The tropical tropopause layer, Rev. Geophys.,47, RG1004, doi:10.1029/2008RG000267, 2009.
Gettelman, A. and Forster, P. M.: A climatology of the tropicaltropopause layer, J. Meteorol. Soc. Jpn., 80, 911–924, 2002.
Ghysels, M., Gomez, L., Cousin, J., Amarouche, N., Jost, H., andDurry, G.: Spectroscopy of CH4 with a Difference FrequencyGeneration laser at 3.3 micron for atmospheric applications,Appl. Phys. B, 104, 989–1000, 2011.
Ghysels, M., Gomez, L., Cousin, J., Tran, H., and Durry, G.: Tem-perature dependence of air-broadening, air-narrowing and line-mixing coefficients of the methane (R(6), ν3) manifold for at-mospheric applications, J. Quant. Spectrosc. Ra., 133, 206–216,2014.
Ghysels, M., Riviere, E. D., Khaykin, S., Stoeffler, C., Amarouche,N., Pommereau, J.-P., Held, G., and Durry, G.: Intercomparisonof in situ water vapor balloon-borne measurements from Pico-SDLA H2O and FLASH-B in the tropical UTLS, Atmos. Meas.Tech., 9, 1207–1219, doi:10.5194/amt-9-1207-2016, 2016.
Grosvenor, D. P., Choularton, T. W., Coe, H., and Held, G.: Astudy of the effect of overshooting deep convection on the wa-ter content of the TTL and lower stratosphere from Cloud Re-solving Model simulations, Atmos. Chem. Phys., 7, 4977–5002,doi:10.5194/acp-7-4977-2007, 2007.
Holton, J. R. and Gettelman, A.: Horizontal transport and the dehy-dration of the stratosphere, Geophys. Res. Lett., 28, 2799–2802,2001.
Homan, C. D., Volk, C. M., Kuhn, A. C., Werner, A., Baehr, J., Vi-ciani, S., Ulanovski, A., and Ravegnani, F.: Tracer measurementsin the tropical tropopause layer during the AMMA/SCOUT-O3 aircraft campaign, Atmos. Chem. Phys., 10, 3615–3627,doi:10.5194/acp-10-3615-2010, 2010.
Iwasaki, S., Shibata, T., Nakamoto, J., Okamoto, H., Ishimoto, H.,and Kubota, H.: Characteristics of deep convection measured byusing the A-train constellation, J. Geophys. Res., 115, D06207,doi:10.1029/2009JD013000, 2010.
Jensen, E. J., Ackerman, A. S., Smith J. A.: Can overshooting con-vection dehydrate the tropical tropopause layer?, J. Geophys.Res., 112, D11209, doi:10.1029/2006JD007943, 2007.
Kelly, K. K., Proffitt, M. H., Chan, K. R., Loewenstein, M.,Podolske, J. R., Strahan, S. E., Wilson, J. C., and Kley, D.: Water
Atmos. Chem. Phys., 16, 12273–12286, 2016 www.atmos-chem-phys.net/16/12273/2016/
S. M. Khaykin et al.: Evidence of horizontal and vertical transport of water 12285
vapour and cloud water measurements over Darwin during theSTEP 1987 tropical mission, J. Geophys. Res., 98, 8713–8723,1993.
Khaykin, S., Pommereau, J.-P., Korshunov, L., Yushkov, V.,Nielsen, J., Larsen, N., Christensen, T., Garnier, A., Lukyanov,A., and Williams, E.: Hydration of the lower stratosphere byice crystal geysers over land convective systems, Atmos. Chem.Phys., 9, 2275–2287, doi:10.5194/acp-9-2275-2009, 2009.
Khaykin, S. M., Pommereau, J.-P., and Hauchecorne, A.: Impact ofland convection on temperature diurnal variation in the tropicallower stratosphere inferred from COSMIC GPS radio occulta-tions, Atmos. Chem. Phys., 13, 6391–6402, doi:10.5194/acp-13-6391-2013, 2013a.
Khaykin, S. M., Engel, I., Vömel, H., Formanyuk, I. M., Kivi, R.,Korshunov, L. I., Krämer, M., Lykov, A. D., Meier, S., Naebert,T., Pitts, M. C., Santee, M. L., Spelten, N., Wienhold, F. G.,Yushkov, V. A., and Peter, T.: Arctic stratospheric dehydration– Part 1: Unprecedented observation of vertical redistribution ofwater, Atmos. Chem. Phys., 13, 11503–11517, doi:10.5194/acp-13-11503-2013, 2013b.
Konopka, P., Grooß, J.-U., Ploeger, F., and Muller, R.: Annual cycleof horizontal in-mixing into the lower tropical stratosphere, J.Geophys. Res., 114, D19111, doi:10.1029/2009JD011955, 2009.
Konopka, P., Grooß, J.-U., Günther, G., Ploeger, F., Pommrich, R.,Müller, R., and Livesey, N.: Annual cycle of ozone at and abovethe tropical tropopause: observations versus simulations with theChemical Lagrangian Model of the Stratosphere (CLaMS), At-mos. Chem. Phys., 10, 121–132, doi:10.5194/acp-10-121-2010,2010.
Livesey, N. J., Read, W. G., Wagner, P. A., Froidevaux, L., Lambert,A., Manney, G. L., Millán-Valle, L. F., Pumphrey, H. C., Santee,M. L., Schwartz, M. J., Wang, S., Fuller, R. A., Jarnot, R. F.,Knosp, B. W., and Martinez, E.: Version 4.2x Level 2 data qualityand description document, Tech. Rep. JPL D-33509, NASA JetPropulsion Laboratory, version 4.2x-1.0, 2015.
Liu, C. and Zipser, E. J.: Global distribution of convection pene-trating the tropical tropopause, J. Geophys. Res., 110, D23104,doi:10.1029/2005JD006063, 2005.
Liu, X. M., Rivière, E. D., Marécal, V., Durry, G., Hamdouni, A.,Arteta, J., and Khaykin, S.: Stratospheric water vapour budgetand convection overshooting the tropopause: modelling studyfrom SCOUT-AMMA, Atmos. Chem. Phys., 10, 8267–8286,doi:10.5194/acp-10-8267-2010, 2010.
Marcy, T. P., Popp, P. J., Gao, R. S., Fahey, D. W., Ray, E.A., Richard, E. C., Thompson, T. L., Atlas, E. L., Loewen-stein, M., Wofsy, S. C., Park, S., Weinstock, E. M., Swartz,W. H., and Mahoney, M. J.: Measurements of trace gases inthe tropical tropopause layer, Atmos. Environ., 41, 7253–7261,doi:10.1016/j.atmosenv.2007.05.032, 2007.
Massie, S. T., Gille, J., Craig, C., Khosravi, R., Barnett, J.,Read, W., and Winker, D.: HIRDLS and CALIPSO obser-vations of tropical cirrus, J. Geophys. Res., 115, D00H11,doi:10.1029/2009JD012100, 2010.
McKenna, D. S., Grooß, J.-U., Günther, G., Konopka, P., Müller,R., Carver, G., and Sasano, Y.: A new Chemical LagrangianModel of the Stratosphere (CLaMS): 2. Formulation of chem-istry scheme and initialization, J. Geophys. Res., 107, 4256,doi:10.1029/2000JD000113, 2002.
Nielsen, J. K., Larsen, N., Cairo, F., Di Donfrancesco, G., Rosen,J. M., Durry, G., Held, G., and Pommereau, J. P.: Solid particlesin the tropical lowest stratosphere, Atmos. Chem. Phys., 7, 685–695, doi:10.5194/acp-7-685-2007, 2007.
Ploeger, F., Konopka, P., Müller, R., Fueglistaler, S., Schmidt, T.,Manners, J. C., Grooß, J.-U., Günther, G., Forster, P. M., andRiese, M.: Horizontal transport affecting trace gas seasonalityin the Tropical Tropopause Layer TTL, J. Geophys. Res., 117,09303, doi:10.1029/2011JD017267, 2012.
Pommrich, R., Müller, R., Grooß, J.-U., Konopka, P., Ploeger, F.,Vogel, B., Tao, M., Hoppe, C. M., Günther, G., Spelten, N., Hoff-mann, L., Pumphrey, H.-C., Viciani, S., D’Amato, F., Volk, C.M., Hoor, P., Schlager, H., and Riese, M.: Tropical troposphereto stratosphere transport of carbon monoxide and long-lived tracespecies in the Chemical Lagrangian Model of the Stratosphere(CLaMS), Geosci. Model Dev., 7, 2895–2916, doi:10.5194/gmd-7-2895-2014, 2014.
Randel, W. J. and Jensen, E. J.: Physical processes in the tropi-cal tropopause layer and their roles in a changing climate, Nat.Geosci., 6, 196–176, 2013.
Randel, W. J., Zhang, K., and Fu, R.: What controls stratosphericwater vapor in the NH summer monsoon regions?, J. Geophys.Res.-Atmos., 120, 7988–8001, doi:10.1002/2015JD023622,2015.
Ricaud, P., Barret, B., Attié, J.-L., Motte, E., Le Flochmoën, E.,Teyssèdre, H., Peuch, V.-H., Livesey, N., Lambert, A., andPommereau, J.-P.: Impact of land convection on troposphere-stratosphere exchange in the tropics, Atmos. Chem. Phys., 7,5639–5657, doi:10.5194/acp-7-5639-2007, 2007.
Ricaud, P., Pommereau, J.-P., Attié, J.-L., Le Flochmoën, E., El Am-raoui, L., Teyssèdre, H., Peuch, V.-H., Feng, W., and Chipper-field, M. P.: Equatorial transport as diagnosed from nitrous oxidevariability, Atmos. Chem. Phys., 9, 8173–8188, doi:10.5194/acp-9-8173-2009, 2009.
Riese, M., Ploeger, F., Rap, A., Vogel, B., Konopka, P., Dameris,M., and Forster, P.: Impact of uncertainties in atmosphericmixing on simulated UTLS composition and related ra-diative effects, J. Geophys. Res.-Atmos., 117, 2156–2202,doi:10.1029/2012JD017751, 2012.
Sargent, M. R., Smith, J. B., Sayres D. S., and Anderson,J. G.: The roles of deep convection and extratropical mix-ing in the tropical tropopause layer: An in situ measure-ment perspective, J. Geophys. Res.-Atmos., 119, 12355–12371,doi:10.1002/2014JD022157, 2014.
Schiller, C., Grooß, J.-U., Konopka, P., Plöger, F., Silva dosSantos, F. H., and Spelten, N.: Hydration and dehydration atthe tropical tropopause, Atmos. Chem. Phys., 9, 9647–9660,doi:10.5194/acp-9-9647-2009, 2009.
Solomon, S., Rosenlof, K. H., Portmann, R.W., Daniel, J. S., Davis,S. M., Sanford, T. J., and Plattner, G. K.: Contributions of trato-spheric water vapor to decadal changes in the rate of globalwarming, Science, 327, 1219–1223, 2010.
Stein, A. F., Draxler, R. R., Rolph, G. D., Stunder, B. J. B., Co-hen, M. D., and Ngan, F.: NOAA’s HYSPLIT atmospheric trans-port and dispersion modeling system, B. Am. Meteorol. Soc., 96,2059–2077, doi:10.1175/BAMS-D-14-00110.1, 2015.
Vernier, J. P., Pommereau, J. P., Garnier, A., Pelon, J., Larsen,N., Nielsen, J., Christensen, T., Cairo, F., Thomason, L. W.,Leblanc, T., and McDermid, I. S.: The tropical stratospheric
www.atmos-chem-phys.net/16/12273/2016/ Atmos. Chem. Phys., 16, 12273–12286, 2016
12286 S. M. Khaykin et al.: Evidence of horizontal and vertical transport of water
aerosol layer from CALIPSO lidar observations, J. Geophys.Res., 114, D00H10, doi:10.1029/2009JD011946, 2009.
Vernier, J.-P., Pommereau, J.-P., Thomason, L. W., Pelon, J., Gar-nier, A., Deshler, T., Jumelet, J., and Nielsen, J. K.: Overshoot-ing of clean tropospheric air in the tropical lower stratosphereas seen by the CALIPSO lidar, Atmos. Chem. Phys., 11, 9683–9696, doi:10.5194/acp-11-9683-2011, 2011.
Vernier, J.-P., Fairlie, T. D., Natarajan, M., Wienhold, F. G.,Bian, J., Martinsson, B. G., Crumeyrolle, S., Thomason, L.W., and Bedka, K.: Increase in upper tropospheric and lowerstratospheric aerosol levels and its potential connection withAsian Pollution, J. Geophys. Res.-Atmos., 120, 1608–1619,doi:10.1002/2014JD022372, 2015.
Winker, D. M., Vaughan, M. A., Omar, A. H., Hu, Y., Pow-ell, K. A., Liu, Z., Hunt, W. H., and Young, S. A.:Overview of the CALIPSO Mission and CALIOP Data Pro-cessing Algorithms, J. Atmos. Ocean. Tech., 26, 2310–2323,doi:10.1175/2009JTECHA1281.1, 2009.
Yushkov, V., Astakhov V., and Merkulov, S.: Optical balloonhygrometer for upper-troposphere and stratosphere water va-por measurements, in: Proceedings SPIE 3501, Optical RemoteSensing of the Atmosphere and Clouds, Beijing, China, 14September 1998, 439–445, 1998.
Atmos. Chem. Phys., 16, 12273–12286, 2016 www.atmos-chem-phys.net/16/12273/2016/