evidence from oxygen-18 exchange measurements for steps involving a weak acid and a slow chemical...
TRANSCRIPT
6908 Biochemistry 1989, 28, 6908-6914
Evidence from l8O Exchange Measurements for Steps Involving a Weak Acid and a Slow Chemical Transformation in the Mechanism of Phosphorylation of the
Gastric H+,K+-ATPase by Inorganic Phosphate?
Larry D. Faller* and Ruben A. Diaz The Center for Ulcer Research and Education, Department of Medicine, UCLA School of Medicine and Veterans
Received December 5, 1988: Revised Manuscript Received April 17, 1989 Administration Hospital Center, Los Angeles, California 90073
ABSTRACT: Phosphorylation of the gastric H,K-ATPase by Pi has been studied by measuring the P180j1604-, distribution as a function of time at different H’, K’, and [l80]Pi concentrations. The advantage of isotope exchange measurements is that the P180j1604-, distribution depends on the relative rates of HOH loss to form the phosphoenzyme intermediate and Pi dissociation from the enzyme. Therefore, l80 exchange is a sensitive probe of mechanism. K+ increases the exchange rate (uex) but does not affect the partition coefficient (P,) that determines the P180j1604-j distribution. Conversely, H+ inhibits exchange. A single P, describes the data at every pH, but the value increases from 0.04 at pH 8 to 0.64 at pH 5.5. u,, depends hyperbolically on [Pilo. K,,, for Pi does not depend on pH, and P, does not depend on [Pilo. Individual rate constants in the phosphorylation mechanism are estimated. Formation of the E.Pi complex that looses HOH is 1-2 orders of magnitude slower at p H 5.5 than a t p H 8 and is not diffusion controlled. The observed change in P, with p H is compatible with catalysis occurring by a different mechanism when a group with pK, = 7.2 is protonated. Slower than diffusion-controlled formation of the E.Pi complex that splits out HOH is evidence for a relatively slow, unimolecular chemical transformation involving an additional intermediate in the phosphorylation mechanism, such as a protein conformational change.
T e Mgz+-dependent, H’-transporting, and Kt-stimulated adenosine-5’-triphosphatase (H,K-ATPase)’ isolated from gastric epithelia also catalyzes I 8 0 exchange between Pi and HOH (Faller & Elgavish, 1984). The ionic requirements for isotope exchange, inhibition of the reaction, and the exchange rate are all compatible with catalysis of medium* I8O exchange via the same phosphoenzyme intermediate implicated in ca- talysis of ATP hydrolysis. Therefore, isotope exchange is an alternative way of studying the terminal steps in the overall catalytic mechanism. The advantage of l 8 0 exchange is that information about the reaction pathway, as well as the phosphorylation rate, can be obtained from measurements of the P180j1604-, distribution as a function of time.
The effects of Pi concentration and of the transported ions, H+ and K’, on catalysis of medium l 8 0 exchange by the gastric H,K-ATPase have been studied. Two principal ex- perimental observations are reported. First, the P180j1604-, distribution changes dramatically with pH. This result was communicated earlier in an abstract (Faller, 1987). Second, the rate of formation of the enzyme-inorganic phosphate complex that looses water to form the covalent phosphoenzyme intermediate decreases with pH, becoming slower than dif- fusion controlled. These results are interpreted as evidence for steps involving a weak acid and a relatively slow chemical transformation in the phosphorylation mechanism.
EXPERIMENTAL PROCEDURES
Materials H,K-ATPase. Microsomal vesicles rich in H,K-ATPase
were isolated from hog stomachs and purified by zonal cen- trifugation as previously described (Faller, 1989b). The
tThis work was supportedby National Science Foundation Grants DMB 83-09756 and 87-04525 and U.S. Public Health Service Grant DK 36873.
0006-2960/89/0428-6908$01.50/0
specific activity of enzyme in broken vesicles from the lighter fraction averaged 148 f 23 pmol mg-’ h-I ( n = 4). The phosphorylation capacity of the preparation is 1.5 f 0.3 nmol mg-l (Faller et al., 1983). The stoichiometry of nucleotide and inhibitor binding is approximately twice the maximum phosphorylation level (Faller, 1989a) but still less than half the theoretical stoichiometry for a 114-kDa protein (Shull & Lingrel, 1986). Nevertheless, strict linearity between specific ATPase activity and the l 8 0 exchange rate indicates that neither unassociated low molecular weight polypeptides in the preparation nor inactive 114-kDa proteins affect the reactivity of functional H,K-ATPase molecules (Faller & Elgavish, 1984). A single partition coefficient for I8O exchange was measured at every pH in this study, providing additional ev- idence for homogeneity of the enzyme that turns over.
Labeled Pi. [‘80]Pi was prepared as described by Boyer and co-workers (Hackney et al., 1980; Stempel & Boyer, 1986). Briefly, phosphorus pentachloride was reacted in a dry box with a 20-fold excess of >98.5% enriched HI8OH. After neutralization with imidazole and recovery of the unreacted H180H by vacuum transfer, phosphoric acid was isolated from the reaction mixture by chromatography on an AGl-X4 ion
’ Abbreviations: H,K-ATPase, Mg2+-dependent, Hc-transporting, and K+-stimulated ATPase (EC 3.6.1.3); Na,K-ATPase, Mg2+-depend- ent and Na+- and Kc-stimulated ATPase; Ca-ATPase, Ca2+- and Mgz+-dependent ATPase; SR, sarcoplasmic reticulum; MES, 2-(N- morpho1ino)ethanesulfonic acid; DMSO, dimethyl sulfoxide; TNP-ATP, 2’,3’-0- [ (2,4,6-trinitrophenyl)cyclohexadienylidine]-ATP; FITC, fluor- escein 5’-isothiocyanate; proflavin, 3,6-diaminoacridine; vanadate, H2V- 04-; Pi, inorganic phosphate; [‘solpi, ‘*O-enriched Pi; P1sO/’604-j (0 5 j 5 4), I8O isotopomers of Pi; AE, average isotope enrichment; SA, specific activity; MW, molecular mass; GCMS, gas chromatography- mass spectrometry; NMR, nuclear magnetic resonance.
“Medium” exchange is used to contrast isotope exchange between medium Pi and HOH with “intermediate” exchange, in which the Pi is generated in situ as an intermediate in the hydrolysis of ATP.
0 1989 American Chemical Society
I8O Exchange Studies of Gastric H,K-ATPase
exchange column. The product is stored as the lyophilized sodium salt. GCMS analysis indicated 89.0% P1804, 10.5% P18031601, and 0.5% P18021602 and NMR analysis gave 89.1% PI8O4 and 10.9% P18031601, which correspond to average isotope enrichments3 of 97.1% and 97.3% respectively.
Reagents. Ultrapure, dry PCls was obtained from Alfa Products and >98.5% I80-enriched HI80H from Stohler/ KOR. Vanadate-free ATP and pNPP were purchased from Sigma. D20 from Aldrich Chemical Co. was used. All other reagents were of the highest grade available.
Methods Protein. The protein (Po) in gastric vesicle suspensions was
quantified (pg mL-’) by the biuret reaction with bovine serum albumin as a standard (Lowry et al., 1951).
Inorganic Phosphate. The amount of Pi in [‘80]Pi stock solutions, or formed as a function of time during catalysis of ATP hydrolysis, was quantified by forming the phospho- molybdate complex, extracting into butyl acetate, and com- paring the absorbance at 320 nm to the absorbance of extracts from standard KH2P04 solutions (Yoda & Hokin, 1970). The distribution of l 8 0 in inorganic phosphate was measured by NMR or GCMS.
NMR. NMR spectra were obtained with a 1 1.75-T Bruker instrument at a frequency of 202.5 MHz for 31P by averaging 48 free induction decays over 197 s and calculating the Fourier transform. Substituting a I8O atom for a l60 atom in Pi causes a 4.5-Hz chemical shift. The individual peaks were base line resolved, so the percentage contribution of each of the five P180j160,j species to the spectrum could be evaluated directly from the peak heights.
The advantage of the 31P NMR method for analyzing the distribution of I8O in Pi (Cohn & Hu, 1978) is that isotope exchange can be followed in real time. [180]Pi adjusted to pH 7.4 was passed through a Chelex 100 column to remove paramagnetic ions, and the concentration of Pi in the stock solution was measured; 2.5 mL of reaction mixture (see figure legends for compositions) containing 10-20 mM [l80]Pi in a 10 mm diameter quartz NMR tube was adjusted to the desired pH. After the initial distribution of I8O in Pi was measured, exchange was initiated by adding a small aliquot of enzyme, and the reaction was followed by remeasuring the isotope distribution at approximately 15-min intervals. The disad- vantage of NMR is that millimolar concentrations of Pi are required for analysis because of the low sensitivity of the phosphorus nucleus.
GCMS. The disadvantage of GCMS is that the reaction must be quenched and the Pi isolated for analysis, so it is impractical to determine as many time points as in an NMR experiment. The advantage of measuring the isotope distri- bution by mass spectrometry is that as little as 50 nmol of [180]Pi can be analyzed. Exchange was initiated by adding enzyme to a large enough volume of assay solution to contain L 150 nmol of [I8O]Pi. The reaction was quenched with an equal volume of methanol, and the [l80]Pi was isolated by ion exchange chromatography.
The procedure developed by Stempel and Boyer (1986) was used to measure the P180,1604-, distribution. Briefly, the volatile triethyl phosphate formed by reaction with diazoethane was chromatographed on a J & W Scientific Inc. DB-WAX megabore column and analyzed with a Hewlett-Packard 5995 mass spectrometer operated in the specific-ion monitoring mode. The instrument was tuned for optimal detection of the fully protonated diethyl phosphate fragments ranging in mass
AE = xjP180j’604-j/4xjP180j1604-j (0 5 j 5 4).
Biochemistry, Vol. 28, No. 17, 1989 6909
A T P
HOPI: ‘
P;.
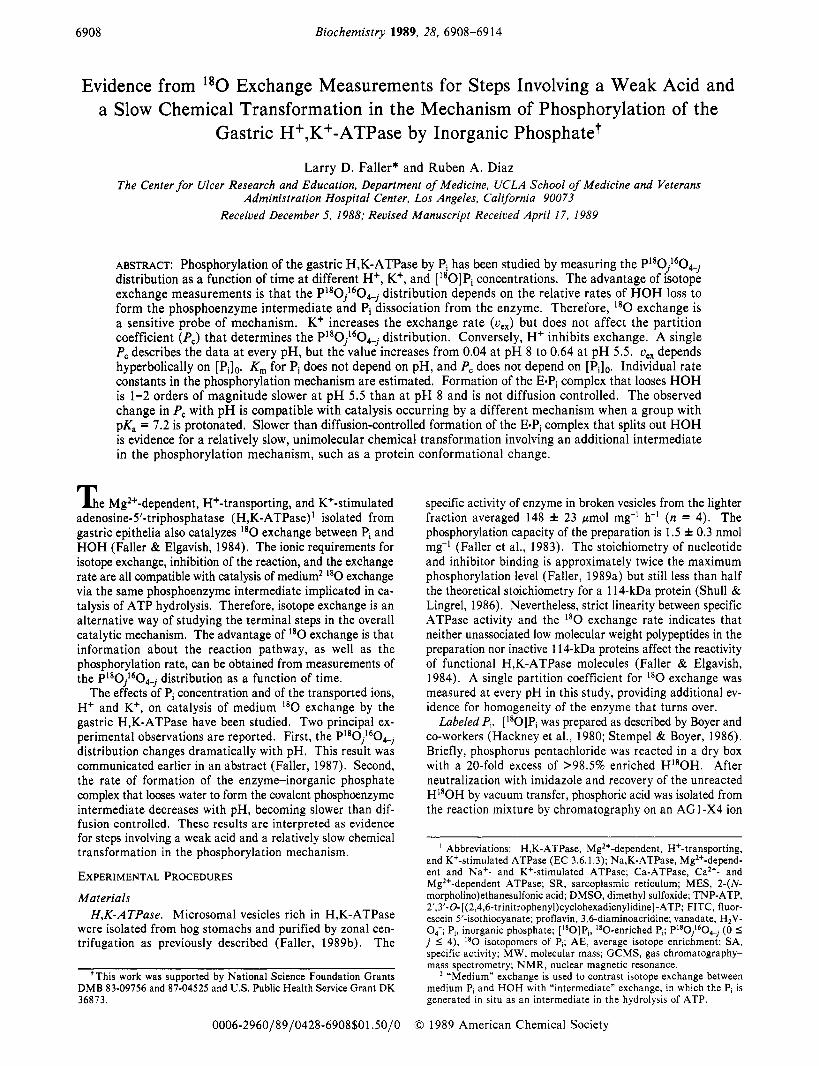
HOH FIGURE 1: Conformational model of catalysis and transport. Two enzyme conformations can explain coupled, vectorial transport (Jencks, 1980). This is shown diagrammatically for the H,K-ATPase. The “high-energy” conformer (E,) reacts with ATP and ADP. Its transport site is exposed to the cytosol (C) and binds H+ tighter than K+. Conversely, the “low-energy” conformer (E2) reacts with Pi and HOH. Its transport site is exposed to the lumen (L) and binds K+ tighter than H+. ‘*O (0) exchange is catalyzed by E*.
from 155 to 163. Correction for spillover from completely unprotonated diethyl phosphate was based on the contribution of mass 153 (about 5%) to the spectrum of a natural isotope abundance standard.
Data Analysis. Assuming free rotation of noncovalently bound Pi (E.Pi), the probability of the covalent phosphoenzyme intermediate (E-P) re-forming before Pi dissociates from the enzyme depends on the relative rates of water and Pi loss
and k-, steps in Figure 1). In the simplest case of a single reaction intermediate
k k E + Pi h E.Pi & E-P + HOH (1)
(2) P, is related to the pseudo-first-order rate constants (k’) for the disappearance of PI8O4 and AE by (Hackney & Boyer, 1978)
(3) k’(PI8O4) and k’(AE) were determined from semilogarithmic plots of percent PI8O4 and percent AE versus time. Hackney (1 980) has derived equations for calculating the percentage of each of the five P180j1604-j species as a function of time from P, and a first-order rate constant ( k ) defined by
k-I k-1
the partition coefficient (P,) is P, = k2/(k-1 + k2) (0 I P, I 1)
P, = (1/3)[4 - k’(PI804)/k’(AE)]
k = k’(P1804)/P, (4) The oxygen exchange rate (u,) is the rate at which the
second step in eq 1 reverses (Boyer et al., 1977): vex = k-z[E-P],, =
kex[Elo[Pilo/(Km + [Pilo) ([Pilo >> [El,) ( 5 ) [E-PI, is the steady-state phosphoenzyme concentration, and the exchange parameters are
kex = kZk-2/(k2 + k-2)
Km = k- lk-~/ [k l (k~ + k-dl
(6)
(7) The measured exchange rate is less than v, unless k-l >> kz, because re-forming E-P does not introduce water oxygens into medium Pi. u,, was evaluated from the measured rate of disappearance (u4) of the P1804 isotopomer (Hackney, 1980):
(8 )
and
u4 = k’(P’804)[Pi]O = (1 - Pc)u,, Best estimates of k,, and K, were obtained by a nonlinear
6910 Biochemistry, Vol. 28, No. 17, 1989 Faller and Diaz
t - 40.2 mi" t t - 3S.6 min t t - 27.2 min Y 751 i!
t t E W
25
4 3 2 1 0 4 3 2 1 0 4 3 2 1 0 NUMBER OF '80 ATOMS IN INORGANIC PHOSPHATE
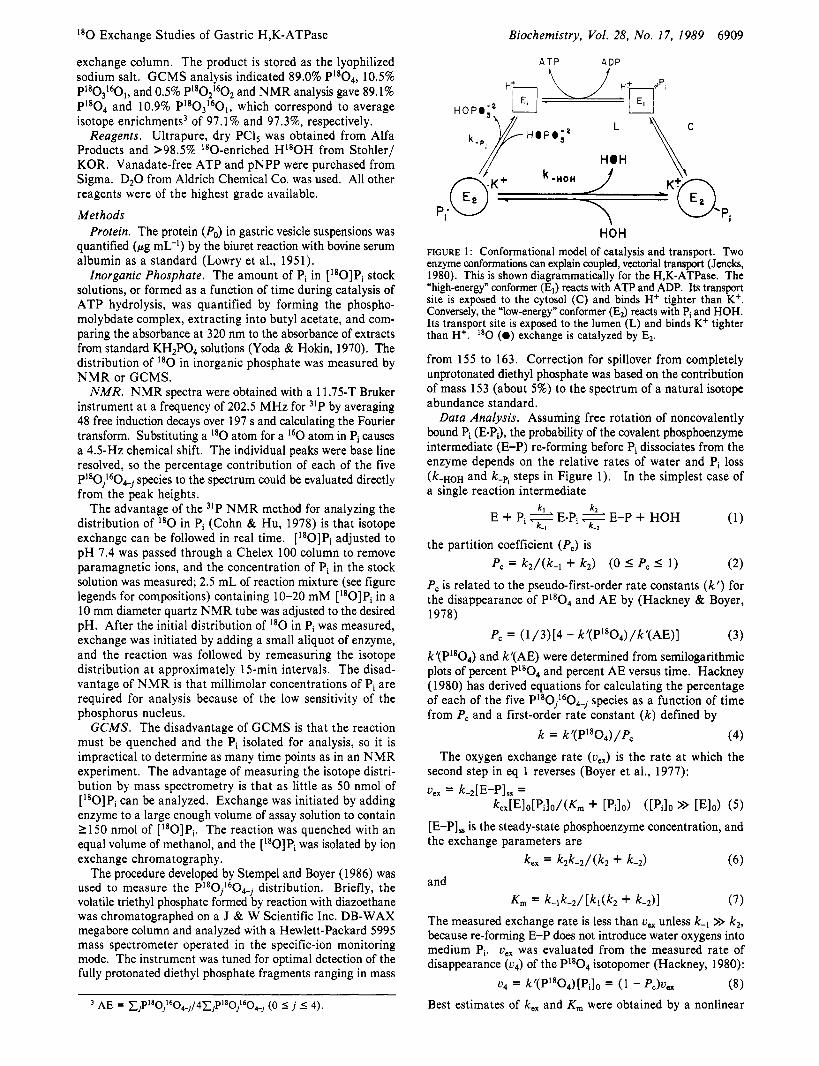
FIGURE 2: Effect of pH on P180jLs0,j distribution formed with time during catalysis of medium I8O exchange by H,K-ATPase. The 31P NMR spectrum of [I80]Pi was measured at pH 5.5 and 8.0. Other experimental conditions: 9.4 mM [I8O]Pi, 1 mM EDTA, 3 mM MgCI2, 7 mM KCl, 50% DzO, and 81 pg mL-l protein in 40 mM MES buffer (pH 5 . 5 ) or 75 pg mL-I protein in 40 mM imidazole buffer (pH 8.0), at 37 OC. In the figure, the percentage contribution of each isotopomer to the spectrum is represented in a bar graph. The individual bar graphs compare the distributions at pH 5.5 (diagonal filled bars) and pH 8.0 (unfilled bars) at the specified reaction times and comparable extents of reaction. The average isotope enrichment remaining after the longest time was 53.5% at pH 5.5 and 48.1% at pH 8.0.
least-squares fit of eq 8, with eq 5 substituted for u, and with P, fixed at the mean value, to measurements of k'(PI8O4) as a function of [Pilo.
k l was calculated from the ratio of the estimated exchange parameters (eq 6 and 7):
(9) If there really is only one intermediate in the formation of E-P, kl should approach the theoretical value for a diffusion-con- trolled bimolecular reaction.
RESULTS PlaOj60,i Distribution. There is a dramatic change in the
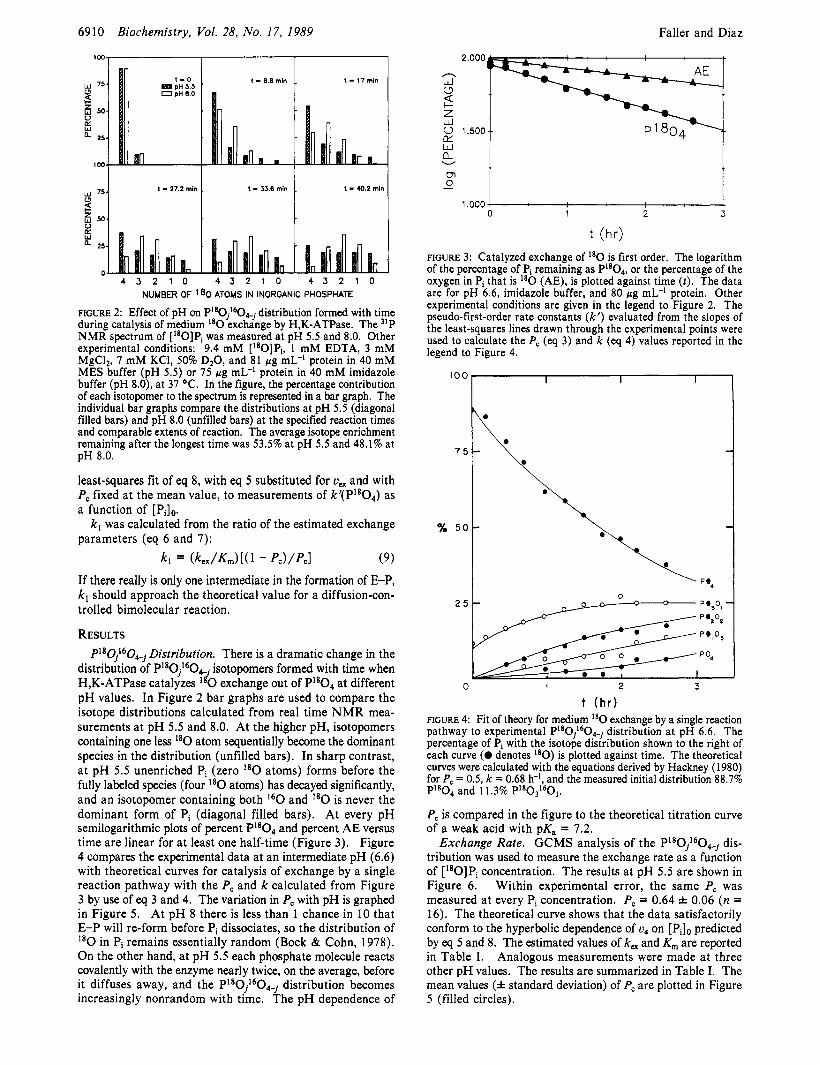
distribution of P1aOj160e. isotopomers formed with time when H,K-ATPase catalyzes exchange out of PI8O4 at different pH values. In Figure 2 bar graphs are used to compare the isotope distributions calculated from real time NMR mea- surements at pH 5.5 and 8.0. At the higher pH, isotopomers containing one less I80 atom sequentially become the dominant species in the distribution (unfilled bars). In sharp contrast, at pH 5.5 unenriched Pi (zero I8O atoms) forms before the fully labeled species (four I8O atoms) has decayed significantly, and an isotopomer containing both l60 and I8O is never the dominant form of Pi (diagonal filled bars). At every pH semilogarithmic plots of percent PIaO4 and percent AE versus time are linear for at least one half-time (Figure 3). Figure 4 compares the experimental data at an intermediate pH (6.6) with theoretical curves for catalysis of exchange by a single reaction pathway with the P, and k calculated from Figure 3 by use of eq 3 and 4. The variation in P, with pH is graphed in Figure 5. At pH 8 there is less than 1 chance in 10 that E-P will re-form before Pi dissociates, so the distribution of
in Pi remains essentially random (Bock & Cohn, 1978). On the other hand, at pH 5.5 each phosphate molecule reacts covalently with the enzyme nearly twice, on the average, before it diffuses away, and the PlaOj1604_, distribution becomes increasingly nonrandom with time. The pH dependence of
k~ = (kex/Km)[(l - Pc)/Pcl
W c3
Z W 0 1.500
1.000 4 4 0 1 2 3
FIGURE 3: Catalyzed exchange of I8O is first order. The logarithm of the percentage of Pi remaining as P1804, or the percentage of the oxygen in Pi that is I8O (AE), is plotted against time ( t ) . The data are for pH 6.6, imidazole buffer, and 80 pg mL-' protein. Other experimental conditions are given in the legend to Figure 2. The pseudo-first-order rate constants (k ' ) evaluated from the slopes of the least-squares lines drawn through the experimental points were used to calculate the P, (eq 3) and k (eq 4) values reported in the legend to Figure 4.
2 5 c
O I 2 3
t ( h r ) FIGURE 4: Fit of theory for medium "0 exchange by a single reaction pathway to experimental P180j160,4_j distribution at pH 6.6. The percentage of Pi with the isotope distribution shown to the right of each curve (0 denotes 180) is plotted against time. The theoretical curves were calculated with the equations derived by Hackney (1980) for P, = 0.5, k = 0.68 h-I, and the measured initial distribution 88.7% PI8O4 and 11.3% P18031601.
P, is compared in the figure to the theoretical titration curve of a weak acid with pK, = 7.2.
Exchange Rate. GCMS analysis of the P180i1604_, dis- tribution was used to measure the exchange rate as a function of [l8O]Pi concentration. The results at pH 5.5 are shown in Figure 6. Within experimental error, the same P, was measured at every Pi concentration. P, = 0.64 f 0.06 (n = 16). The theoretical curve shows that the data satisfactorily conform to the hyperbolic dependence of u4 on [Pilo predicted by eq 5 and 8. The estimated values of k, and K , are reported in Table I. Analogous measurements were made at three other pH values. The results are summarized in Table I. The mean values (* standard deviation) of P, are plotted in Figure 5 (filled circles).

Studies of Gastric H,K-ATPase Biochemistry, Vol. 28, No. 17, 1989 691 1 l80 Exchange
P C
0.7
0.6
0.5
0.4
0.3
0.2
0.1
0.0 5.5 6.0 6.5 7.0 7.5 8.0
FIGURE 5: P, for catalysis of medium "0 exchange by H,K-ATPase as a function of pH. The P, values denoted by unfilled circles (0) were calculated from real-time NMR measurements of the P180/'60.+ distribution. Experimental conditions: 30 I Po I 180 pg mL-', 9.4 mM ["'0]Pi, 1 mM EDTA, 3 mM MgC12, 7 mM KC1, and 50% D20 in 40 mM MES or imidazole buffer at 37 "C. The filled circles (0) indicate the mean and standard deviations (error bars) of P, values determined at different Pi concentrations by GCMS. See Figure 6 legend for experimental details. The filled triangle (A) is the mean * standard deviation (error bar) of experiments in which K+ was varied. Pc was calculated as described in the text. The solid line was calculated for titration of a weak acid with pK, = 7.2.
1251 h 01 . . .-
r 'L loo/ .-
'0 C 751
T ? 0 0 1 2 3 4 5 6 7 6
[Pi1 (mM) FIGURE 6: Variation of the exchange rate of the fully enriched iso- topomer (PL804) with Pi concentration. Specific rate (uq' = u4/P0) is plotted. The theoretical line is the least-squares fit of eq 5 and 8 to the experimental data with k = 382 h-' and K,,, = 1.7 mM. Ex- perimental conditions: 0.05 I [Pi] I 8 mM, 10-56 pg of protein mL-', 2 mM MgCI,, and 7 mM KCI in 40 mM MES buffer at pH 5.5 and 37 "C.
Table I: Summary of Exchange Parameters PH P, u ~ , ' ~ (bum01 mg-' h-I) K, (mM) R M S E ~ 5.5 0.64 382 1.7 5.1 7.0 0.33 55 1 2.0 12.8 7.4 0.21 988 1.1 30.2 8.0 0.04 760 3.5 12.2
(2.1 f 1.0)
a u , i = u4' (max)/(l - P,) = kex. bRoot mean square error.
The exchange rate a t a fixed [Pilo was measured as a function of K+ concentration. The results are shown in Figure 7. No attempt was made to calculate a theoretical curve, because the rate profile is bell-shaped. Therefore, the max- imum velocity is uncertain. Inactivation occurs a t such a high [K'] that nonspecific binding, as well as specific binding, and ionic strength effects could be contributing. P, = 0.19 f 0.03 ( n = 6 ) did not vary with K+ concentration. The mean value of P, (* standard deviation) is plotted in Figure 5 (filled triangle).
FIGURE 7: Dependence of I8O exchange rate on K+ concentration. The specific rate of P1804 disappearance (vi) is plotted against log [K']. Experimental conditions: 0.5 mM [180]Pi, 30 I Po I 150 pg mL-', 0.05 I [KCl] I 5 mM, and 2 mM MgC12 in 40 mM imidazole, pH 7.4, at 37 "C.
150 /
I ul E ,,,i \ /'. \
L 9' /'
a y/ 0 - 5 6 7 0 9
PH FIGURE 8: Effect of pH on ATPase activity of H,K-ATPase. Specific activity (SA) is plotted. Experimental conditions: 2 mM, ATP, 10-50 pg of protein mL-', 2 mM MgCI,, and 7 mM KCI in 40 mM MES or imidazole buffer at 37 "C.
Specific Activity. A bell-shaped response was also obtained when the catalyzed rate of ATP hydrolysis was measured as a function of pH. This result is shown in Figure 8. The dashed curve can be simulated by assuming successive ioni- zations activate and inactivate the enzyme. A range of ac- tivation and inactivation constants are possible, depending upon the maximum rate chosen.
DISCUSSION The H,K-ATPase is classified as an ElE2-type ATPase. The
distinguishing characteristic of these enzymes, which include the Na+ and Ca2+ pumps, is that they catalyze active transport by forming a covalent phosphoenzyme intermediate. The designation ElE2 is derived from the currently favored ex- planation of catalysis-transport coupling and ion translocation. Two enzyme conformations are postulated that bind the transported ions tightly from different sides of the membrane and catalyze different partial reactions. This is shown dia- grammatically in Figure l for transport of H+ and K+ ions. The scheme will not work if El-P can react with HOH, because then ATP hydrolysis would be catalyzed without accompanying transport of ions (Jencks, 1980). Therefore, one consequence of the model is that medium l 8 0 exchange is catalyzed exclusively by the E2 conformer of the enzyme. Predictable effects of the transported ions on the exchange reaction motivated the experiments reported in this study and provide a framework for discussing the results.
Effect of K+ on Medium l80 Exchange. The model predicts an increase in the medium exchange rate with K+ concen- tration, because tighter binding of K+ to E2 shifts the equi-

6912 Biochemistry, Vol. 28, No. 17, 1989 Faller and Diaz
Table 11: Comparison of k l with Some Previously Reported Second-Order Rate Constants: a + b 2 c kr
reaction PH kl (M-’ s-]) k f (M-’ s-]) k , (s-9 ref proflavin + proflavin proflavin + chymotrypsin vanadate + Na,K-ATPase vanadate + H,K-ATPase phosphate + H,K-ATPase 8.0
7.4 7.0 5.5
7.9 x 10⁸ 2.0 x 10⁶ Turner et ai., 1972 4.1 x 10⁷ 1.7 x 10³ Faller & Lafond, 1971 6.5 X lo4 3.3 x 10⁻³ Cantley et al., 1978 2.0 x 10⁴ 2.5 x lo-’ Faller et al., 1983
9.6 x 10⁵ this study 6.3 x 10⁵ 1.0 x 10⁵ 2.3 x 10⁴
librium between El and E2 increasing the fraction of the en- zyme in the conformer that reacts with Pi. P, should not change, because only the E2 conformer catalyzes exchange. These predictions are confirmed. Half-maximum exchange occurs at approximately 0.3 mM K+, but the actual activation constant could be higher because the reaction is inhibited above 7 mM K+ (Figure 7). P, is unaffected by K+ concentration (Figure 5, filled triangle). Inhibition of exchange above 7 mM K+ is not predicted by the model.
The ElE2 model’s explanation of K+ activation of exchange is supported by experimental evidence that K+ binding with Kd 1 0.3 mM causes conformational changes in the gastric H,K-ATPase. The reversibly bond fluorescent substrate analogue TNP-ATP reports a change in the enzyme’s con- formation induced by K+ with Kd = 3 mM (Faller, 1989b). K+ quenches the fluorescence of enzyme irreversibly inacti- vated by FITC with Kd = 0.25 mM (Jackson et al., 1983).
Effects of p H on Medium l80 Exchange. A decrease in the estimated maximum exchange rate (Table I, ue; = kex) with pH is predicted by the E1E2 model, since tighter H+ binding to E l decreases the fraction of the enzyme in the conformer that catalyzes medium l 8 0 exchange. This pre- diction is also confirmed. ue; at pH 5.5 is about 40% of the maximum value. In agreement with the sharper dependence of SA on pH shown in Figure 8, u4 (Equation 8) decreases more dramatically than u,’ because increasing [H’] increases P, (Table I). u4’ at pH 5.5 is about 15% of the maximum value. Inhibition of exchange above pH 7.4 is not predicted by the model.
Neither does the E1E2 model predict the inverse relationship between P, and pH reported in Figure 5. The only way a change in P, can be explained is by a different reaction mechanism, because P, is a ratio of rate constants (eq 2). The observed increase in P, with H+ concentration (Figure 5) indicates that k2 increases relative to k-l . Whether the dom- inant effect of protons is to increase the rate of phosphoenzyme formation or decrease the rate of Pi dissociation cannot be decided by measurements of the P180j1604-j distribution. Neither possibility could be explained by protons shifting the equilibrium between E, and E2, because only one conformer (E2) catalyzes I80 exchange according to the model. If the model were wrong and El catalyzed isotope exchange by a different mechanism, the result in Figure 4 would be unex- pected.
The observed dependence of the isotopomer distribution on time at intermediate pH values can be described by a single P, (Figure 4). Therefore, the continuous variation of P, with pH shown in Figure 5 must result from a reaction that is fast compared to the Pi off-rate. There are three limiting possi- bilities: (1) protonation of the substrate, (2) protonation of a group on the enzyme, or (3) rapid interconversion of El.Pi and E2-Pi. Only the third possibility is incompatible with the E,E2 model, because El would also have to catalyze exchange for P, to vary. It is the least likely explanation, since a con-
formational change both extensive enough to bind ions and then release them on different sides of a membrane and faster than the Pi off-rate is hard to envision.
The theoretical titration curve in Figure 5 shows that ion- ization of a weak acid with pK, = 7.2 could explain the ex- perimentally observed change in P, with pH. Since the second acid dissociation constant of Pi is 6.71 (Schwarzenbach & Geier, 1963), one possibility is that H2P042- and HP04- react by different mechanisms. This explanation is complicated by the coordination reaction of Mg2+ with Pi. The true substrate of the Ca-ATPase is the metal coordination complex (Cham- peil et al., 1985). The absolute formation constant of MgHP04 is 1.88 (Smith & Alberty, 1953), so the relative amounts of MgPi and Pi may have varied significantly in the measurements of exchange rate as a function of Pi concentration at the higher pH values investigated in this study. Nevertheless, eq 5 and 8 fit the rate data satisfactorily at every pH (Table I).
Hyperbolic variation of the measured exchange rate with total Pi concentration suggests that protonation of a weakly acidic group on the enzyme may be more important in ex- plaining the increase in P, with H+ (Figure 5) than protonation or metal coordination of Pi in the case of the H,K-ATPase. The obvious candidate is the imidazole side chain of histidine, but other functional groups may titrate near neutrality in a protein environment. Support for attributing the observed variation of P, with pH to ionization of a group on the enzyme is provided by studies of the effect of pH on phosphorylation of the H,K-ATPase by [Y-~~PIATP and subsequent breakdown of the phosphoenzyme intermediate (Stewart et al., 1981; Ljungstrom et al., 1984). The results were explained by ionization of a weakly acidic group on the enzyme, because K+ competed with H+ and H+ affected phosphorylation and dephosphorylation from different sides of the membrane.
Evidence for a Slow Step in the Catalytic Mechanism. The number of reactive sites is needed to calculate k , in units of M-’ s-I from eq 9 with the estimates of k,, K,, and P, reported in Table I. Since the level of 32P incorporation into the gastric H,K-ATPase from [32P]Pi has not been measured, the stoi- chiometry of E-P formation from ATP was used to calculate the k l values recorded in Table 11. A variety of inhibitors of the H,K-ATPase, including several substrate analogues, bind with twice the phosphorylation stoichiometry (Faller, 1989a), so the numbers quoted may be off by a factor of 2. Uncer- tainty about the active site stoichiometry cannot account for the observed trend in k , with pH.
In Table I1 the estimates of k , are compared to some measured forward rate constants ( k f ) . The reactions of pro- flavin are nearly diffusion controlled. That is, kf approaches the theoretical maximum value (k f ,D) for bimolecular asso- ciation of molecules that size and charge in solution (Eigen & Hammes, 1963). The measured k f will be less than k , , if diffusional encounter is followed by a slower chemical transformation. For example, it is clear an intermediate and a slow step are involved in formation of the noncovalent

lSO Exchange Studies of Gastric H,K-ATPase Biochemistry, Vol. 28, No. 17, 1989 6913
Table 111: Comparison of Estimated Rate Constants for H,K-ATPase with Published Values for Phosphorylation of the Ca-ATPase bv P; enzyme kl (M-l s-I) k-1 (s-’) k2 ( s - 9 k-2 (s-l) ref
H.K-ATPase 6.3 x 10⁵ 1.1 x 10³ 305 457 this studva Ca- ATPase 2.8 X 10’ 378 32 51 McIntosh & Boyer, 1983b
1.5 x 10⁴ 140 21 23 Pickart & Jencks, 1984e 2.0 x 10’ 300 250 0.8 ChamDell et al.. 1985“
“pH 7.4; [E-PI, = 0.6 nmol mg-I. bpH 6.5; 70% of the protein is enzyme; MW = 100 kDa. ‘pH 6.0. “pH 6.0; 15% DMSO.
complex between vanadate and the H,K-ATPase, because the half-time for the reverse reaction is 4.6 min.
The k , calculated with eq 9 is kf for formation of the E.Pi intermediate that loses HOH. The possibility that kf ap- proaches kf ,D at pH 8 cannot be excluded, because some of the information needed to calculate k , , for a reaction with an integral membrane protein, like the diffusion coefficient of membrane vesicle fragments, is unavailable. However, it is unlikely changes in charge or mobility with pH can account for the calculated decrease in k, . At pH 5.5, kl approximately equals kf for vanadate reaction with the enzyme. The decrease in k l with pH to a value smaller than expected for a collisional encounter is compatible with an additional step involving a slow chemical transformation and another intermediate in the catalytic mechanism.
One possibility for this additional step is a protein confor- mational change. There is experimental evidence Pi binding causes conformational changes in both the sodium and calcium pumps. For example, large enthalpy and entropy changes when Pi binds to the Na,K-ATPase (Kuriki et al., 1976), or Ca-ATPase (Epstein et al., 1980), were explained by a con- formational change. The authors proposed that the Pi binding energy is required to drive phosphorylation of an aspartyl group in these enzymes by Pi, because reaction of Pi with carboxylic acids is endergonic. The kl values found for the H,K-ATPase at the lower pH values fall in the range reported for the Ca- ATPase (Tables I1 and 111).
Comparison with Other E1E2 ATPases. The remaining rate constants in the simplest phosphorylation mechanism (eq 1) can also be estimated from the I 8 0 exchange data. k-2 can be obtained from the exchange rate by eq 5 , if [E-PI, is known. Then k2 can be calculated from eq 6 and k-, from eq 2. The steady-state level of E-P formed from Pi has not been measured, and there is only limited information about the steady-state concentration of E-P during ATP hydrolysis when K+ is present. Nevertheless, it is worthwhile to estimate the rate constants for phosphorylation of the H,K-ATPase by the scheme in eq 1 and compare them to values reported for phosphorylation of the Ca-ATPase by the same mechanism. The numbers quoted for the H,K-ATPase were calculated by assuming 40% of the available sites are phosphorylated in 7 mM KCl (Wallmark & Mardh, 1978).
The estimates of the rate constants for phosphorylation of the H,K-ATPase by Pi are compared with published values for the Ca-ATPase in Table 111. The agreement is quite good. Differences in the numerical values reported for the two en- zymes can be attributed partly to different assumptions about the number of reactive sites. For example, basing calculations for the H,K-ATPase on molecular weight, and assuming 70% of measured protein is enzyme, gives k l = 1.5 X lo5 M-’ s-l,
k-] = 1 . 1 X lo3 s-l, k2 = 76 s-I, and k-2 = 1 1 1 s-l. pH also affects the numerical values of the rate constants. The u,, versus pH profile of the Ca-ATPase is bell shaped. Taking an increase in u,, with pH and a change in phosphoenzyme level (de Meis, 1976) into account, k-2 varies from 17 s-* at pH 6 to 112 s-l at pH 7. P, increased from 0.02 at pH 7 to 0.33 at pH 5.4 (McIntosh & Boyer, 1983). The P180j1604_j distribution remains nearly random (0.01 I P, I 0.03) when
the Na,K-ATPase catalyzes medium exchange at pH 7.2. At pH 6.6 u,, is reduced 70%, and two to three oxygen atoms exchange per bound Pi (Dahms & Miara, 1983). This cor- responds to a P, between 0.8 and 0.9 and represents an even more dramatic change in mechanism with pH than found for the H,K-ATPase.
Summary. The conformational model of coupled, vectorial transport (Figure 1 ) predicts the effects of K+ on catalysis of medium l 8 0 exchange by the H,K-ATPase, except for the decrease in vex above 7 mM K’. It predicts the observed decrease in u, below pH 7.4 but not the decrease in vex above pH 7.4 or the measured change in P, with pH. Evidence for two new features of the catalytic mechanism of the H,K- ATPase is presented in this study. First, slower than diffu- sion-controlled formation of the E.Pi complex that exchanges I8O with HOH is consistent with a slow step involving an additional intermediate in the phosphorylation mechanism.
E + Pi + E*Pi + E’*Pi * E’-P + HOH
There is precedent from microcalorimetric studies (Kuriki et al., 1976; Epstein et al., 1980) for a conformational change with Pi binds to other E,E,-type enzymes that may be im- portant in explaining the energetics of phosphorylation by inorganic phosphate. Second, a single P, that depends on pH like a single-group titration (Figure 5) is evidence for par- ticipation of a weak acid in the reaction mechanism. This study is the first demonstration that the mechanism actually changes when a group is protonated, because faster phos- phorylation by ATP at low pH (Stewart et al., 1981; Ljung- strom et al., 1984) could be explained by an increase in the fraction of the enzyme in the El conformer that reacts with ATP.
ACKNOWLEDGMENTS We are indebted to Jane Strouse for help with the NMR
measurements, to Kerstin Stempel for instruction in the preparation of [l80]Pi and GCMS measurements, and to Professor Paul Boyer for his encouragement and many helpful discussions.
REFERENCES Bock, J. L., & Cohn, M. (1978) J. Biol. Chem. 253,
Boyer, P. D., de Meis, L., Carvalho, M., & Hackney, D. D.
Cantley, L. C., Jr., Cantley, L. G., & Josephson, L. (1978)
Champeil, Ph., Guillain, F., Venien, C., & Gingold, M. P.
Cohn, M., & Hu, A. (1978) Proc. Natl. Acad. Sci. U.S.A. 75,
Dahms, A. S . , & Miara, J. E. (1983) Curr. Top. Membr.
de Meis, L. (1976) J. Biol. Chem. 251, 2055-2062. Eigen, M., & Hammes, G. G. (1963) Adu. Enzymol. Relat.
Epstein, M., Kuriki, Y., Biltonen, R., & Racker, E. (1980)
4082-408 5 .
(1977) Biochemistry 16, 136-140.
J . Biol. Chem. 253, 7361-7368.
(1985) Biochemistry 24, 69-81.
200-203.
Transp. 19, 371-375.
Areas Mol. Biol. 25, 14-51.
Biochemistry 19, 5564-5568.

6914 Biochemistry 1989, 28, 69 14-6924
Faller, L. D. (1987) Biophys. J . 51, 3885a. Faller, L. D. (1989a) Biochemistry 28, 6771-6778. Faller, L. D. (1989b) Biochemistry (submitted for publication). Faller, L. D., & LaFond, R. E. (1971) Biochemistry 10,
Faller, L. D., Rabon, E., & Sachs, G. (1983) Biochemistry
Faller, L. D., & Elgavish, G. A. (1984) Biochemistry 23,
Hackney, D. D. (1980) J . Biol. Chem. 255, 5320-5328. Hackney, D. D., & Boyer, P. D. (1 978) Proc. Natl. Acad. Sci.
Hackney, D. D., Stempel, K. E., & Boyer, P. D. (1980)
Jackson, R. J., Mendlein, J., & Sachs, G. (1983) Biochim.
Jencks, W. P. (1980) Adv. Enzymol. Relat. Areas Mol. Biol.
Kuriki, Y . , Halsey, J., Biltonen, R., & Racker, E. (1976)
Ljungstrom, M., Vega, F. V., & March, S . (1984) Biochim.
1033-1 04 1.
22, 4676-4685.
6584-6590.
U.S.A. 75, 3133-3137.
Methods Enzymol. 64, 60-83.
Biophys. Acta 731, 9-15.
51, 75-106.
Biochemistry 15, 4956-4961,
Biophys. Acta 769, 220-230.
Lowry, 0. H., Rosenbrough, N. J., Farr, A. L., & Randall,
McIntosh, D. B., & Boyer, P. D. (1983) Biochemistry 22,
Pickart, C. M., & Jencks, W. P. (1984) J . Biol. Chem. 259,
Schwarzenbach, G., & Geier, G. (1963) Helv. Chim. Acta 46,
Shull, G. E., & Lingrel, J. B. (1986) J. Biol. Chem. 261,
Smith, R. M., & Alberty, R. A. (1956) J . Am. Chem. SOC.
Stempel, K. E., & Boyer, P. D. (1 986) Methods Enzymol. 126,
Stewart, B., Wallmark, B., & Sachs, G. (1981) J . Biol. Chem.
Turner, D. H., Flynn, G. W., Lundberg, S . K., Faller, L. D.,
Wallmark, B., & Mardh, S. (1979) J . Biol. Chem. 254,
Yoda, A,, & Hokin, L. E. (1980) Biochem. Biophys. Res.
R. J. (1951) J . Biol. Chem. 193, 265-275.
2867-2875.
1629-1643.
906-926.
16788-16791.
78, 2376-2380.
61 8-639.
256, 2682-2690.
& Sutin, N. (1972) Nature 239, 215-217.
11899-1 1902.
Commun. 40, 880-884.
Escherichia coli cAMP Receptor Protein: Evidence for Three Protein Conformational States with Different Promoter Binding Affinitiest
Tomasz Heyduk and James C. Lee* E . A. Doisy Department of Biochemistry, St. Louis University School of Medicine, I402 South Grand Boulevard, St . Louis,
Missouri 63104 Received February 27, 1989; Revised Manuscript Received May 5, I989
ABSTRACT: Cyclic A M P receptor protein (CRP) from Escherichia coli is assumed to exist in two states, namely, those represented by the free protein and that of the ligand-protein complex. To establish a quantitative structure-function relation between cAMP binding and the CAMP-induced conformational changes in the receptor, protein conformational change was quantitated as a function of cAMP concentration up to 10 mM. The protein conformation was monitored by four different methods at p H 7.8 and 23 OC, namely, rate of proteolytic digestion by subtilisin, rate of chemical modification of Cys- 178, tryptophan fluorescence, and fluorescence of the extrinsic fluorescence probe 8-anilino- 1 -naphthalenesulfonic acid (ANS) . Each of these techniques reveals a biphasic dependence of protein conformation on cAMP concentration. At low cAMP concentrations ranging from 0 to 200 pM, the rates of proteolytic digestion and that of Cys-178 modification increase, whereas the fluorescence intensity of the ANS-protein complex is quenched, and there is no change in the fluorescence intensity of the tryptophan residues in the protein. At higher cAMP concentrations, the rates of proteolytic and chemical modification of the protein decrease, while the fluorescence intensity of the ANS-protein complex is further quenched but there is an increase in the intensity of tryptophan fluorescence. These results show unequivocally that there are a t least three conformational states of the protein. The association constants for the formation of CRP-CAMP and CRP-(CAMP)~ complexes derived from conformational studies are in good agreement with those determined by equilibrium dialysis, nonequilibrium dialysis, and ultrafiltration. Therefore, the simplest explanation would be that the protein exhibits three conformational states, free C R P and two CAMP-dependent states, which correspond to the CRP-CAMP and CRP-(CAMP), complexes. The binding properties of CRP-CAMP and CRP- (CAMP), to the lac promoter were studied by using the gel retardation technique. At a high concentration of cAMP which favors the formation of the CRP-(CAMP)~ complex, binding of the protein to DNA is decreased. This, together with conformational data, strongly suggests that only the CRP-CAMP complex is active in specific DNA binding whereas C R P and CRP-(cAMP), are not.
c y c l i c AMP receptor protein (CRP)’ from Escherichia coli plays a key role in the regulation of expression of more than 20 genes in bacteria. The basic mechanism involves binding of CRP to the promoter regions of these genes. The formation
Supported by NIH Grants NS-14269 and DK-21489.
0006-2960/89/0428-69 14$01.50/0
of these CRP-DNA complexes is allosterically regulated by CAMP. There is ample evidence to indicate that binding of
I Abbreviations: CRP, cyclic AMP receptor protein; ANS, 8- anilino- 1-naphthalenesulfonic acid; DTNB, 5,5’-dithiobis(2-nitrobenzoic acid); TNB, 2-nitro-5-thiobenzoate; PMSF, phenylmethanesulfonyl fluoride; SDS, sodium dodecyl sulfate.
0 1989 American Chemical Society