evidence-based laboratory medicine: diagnostic performance
TRANSCRIPT
Evidence-based Laboratory Medicine:
Diagnostic Performance and ClinicalUtility of a Laboratory Test
Pieter Vermeersch, M.D. Ph.D.
Laboratory Medicine, UZ Leuven
DecideAssessFind

The Diagnostic Process
History and clinical examination
List of possible diagnoses
Decide which disorders to pursue
- Possibilistic: test for all possible diagnoses
- Probabilistic: first most likely diagnoses
- Prognostic: first most serious disorders if left undiagnosed
- Pragmatic: first most easily diagnosed disorders or responsive to treatment
EMB makes this diagnostic process more systematic and explicit which allows
evidence from clinical research to be incorporated

Test and treatment tresholds in the diagnostic process
0% 100%
Test
Treshold
Treatment
Treshold
Further testing requiredNo testing warranted Treatment commences
The Diagnostic Process
Role for laboratory testing

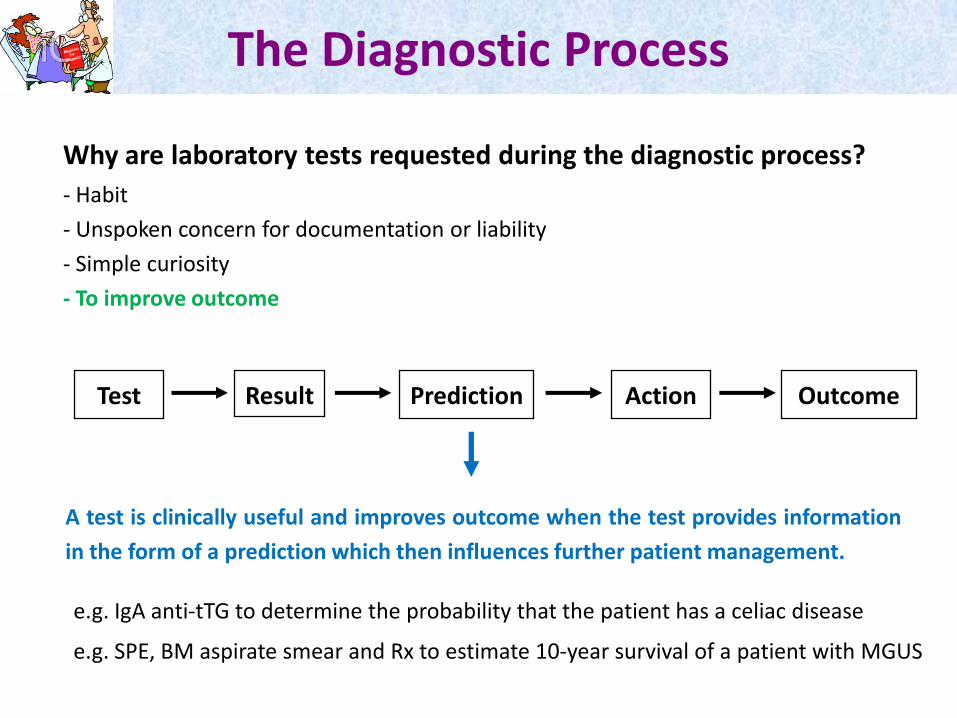
Why are laboratory tests requested during the diagnostic process?
- Habit
- Unspoken concern for documentation or liability
- Simple curiosity
- To improve outcome
The Diagnostic Process
Why are laboratory tests requested during the diagnostic process?
- Habit
- Unspoken concern for documentation or liability
- Simple curiosity
- To improve outcome
Test Result Prediction Action Outcome
A test is clinically useful and improves outcome when the test provides information
in the form of a prediction which then influences further patient management.
e.g. IgA anti-tTG to determine the probability that the patient has a celiac disease
e.g. SPE, BM aspirate smear and Rx to estimate 10-year survival of a patient with MGUS
The Diagnostic Process

Signal detection theory- A test is considered to have 2 fixed characteristics: sensitivity and specificity
- There are 4 possible outcomes for a dichotomous result: TP, TN, FP and FN
Test Operating Characteristics
Diseasepresent
Diseaseabsent
Test positive TP FP
Test negative FN TN
Sens=TP/TP+FNSpec=TN/TN+FP
- Sensitivity is the probability that a patient having the disease will test positive.
- Specificity is the probability that a patient not having the disease will test negative.
- Sensitivity and specificity are independent of the prevalence of the disease since they
are calculated within the group of diseased and non-diseased patients, respectively.

Signal detection theory- A test is considered to have 2 fixed characteristics: sensitivity and specificity
- There are 4 possible outcomes for a dichotomous result: TP, TN, FP and FN
Diseasepresent
Diseaseabsent
Test positive TP FP
Test negative FN TN
PPV=TP/TP+FP
NPV=TN/TN+FN
Test Operating Characteristics
- Clinicians are, however, not intrested in knowing the probability that a patient having
the disease will test positive. They want to know the probability that a patient will
have the disease if the test is positive.
- PPV estimates the probability that a patient will have the disease if he tests positive.
Since it is calculated within the whole group, it depends on the prevalence (not fixed).

Example- Analysis of the diagnostic performance of IgA anti-tTG for celiac disease in 591
patients that had an intestinal biopsy.
Diseasepresent
Diseaseabsent
Test positive 41 42
Test negative 2 506
Test Operating Characteristics
Sens=95.3% Spec=92.3%

Example- Analysis of the diagnostic performance of IgA anti-tTG for celiac disease in 591
patients that had an intestinal biopsy.
Diseasepresent
Diseaseabsent
Test positive 41 42
Test negative 2 506
Test Operating Characteristics
Sens=95.3% Spec=92.3%
PPV=49.3%
NPV=99.6%
PPV is only 49.3% because the prevalence or pre-test probability in our study group
was “only” 7.3%!
PPV and NPV depend on the prevalence and are only valid for patients with a pre-
test probability that is identical to the pre-test probability of the study group.

- The likelihood is independent of the prevalence since it is calculated within the group
of patients with/without the the disease.
Likelihood and likelihood ratio- The likelihood (LH) is the proportion of patients with/without the disease that have a
certain result. The sensitivity is the likelihood that a patient with the disease tests
positive.
Diseasepresent
Diseaseabsent
Test positive 0.953 0.077
Test negative 0.047 0.923
Pretest to posttest prbability
LR+=12.4
LR+=0.05
- The LR+ is the ratio of the proportion of individuals with the disease that have a test
result divided by the proportion of non-diseased individuals with the same test result.
- The LR indicates the change in pretest to posttest probability associated with a
specific result.

Likelihood and likelihood ratio- The likelihood (LH) is the proportion of patients with/without the disease that have a
certain result. The sensitivity is the likelihood that a patient with the disease tests
positive.
Diseasepresent
Diseaseabsent
Test positive 0.953 0.077
Test negative 0.047 0.923
LR+=12.4
LR+=0.05
Pretest to posttest prbability
LR Interpretation
1 No clinical value
2-5 or 0.2-0.5 Small difference, may be relevant in certain clinical settings
5-10 or 0.1-0.2 Modest, but substantial difference in pretest-posttest probability
>10 or <0.1 Clinically important differences in pretest-posttest probability
LR allows to evaluate the diagnostic performance of a laboratory test

Calculating the posttest probability- Posttest odds = pretest odds x LR (Bayesian Theorem)
pretest odds=pretest prob/(1-pretest prob); posttest prob=posttest odds/(1+posttest odds)
- Using the likelihood ratio, the posttest probability can be calculated for different
pretest probabilities.
0
0.2
0.4
0.6
0.8
1
0 0.2 0.4 0.6 0.8 1
Po
stt
est
pro
bab
ilit
y C
D
Pretest probability CD
tTG <7
tTG ≥7
Pretest to posttest prbability
Prev=7.3%
0.49
M1 M2 M3

Defining normality or excluding disease- Reference limits are traditionally defined using healthy volunteers (e.g. blood donors).
- This approach is appropriate for these parameters routine clinical chemistry
parameters such as AST, ALT, CK and LDH which are not specific for a certain disease
and are often determined as part of a routine work-out.
- The use of healthy volunteers can, however, cause problems for the interpretation of
laboratory test results.
Reference limits

Reference limits
Defining normality or excluding disease- Reference limits are traditionally defined using healthy volunteers (e.g. blood donors).
- This approach is appropriate for these parameters routine clinical chemistry
parameters such as AST, ALT, CK and LDH which are not specific for a certain disease
and are often determined as part of a routine work-out.
- The use of healthy volunteers can, however, cause problems for the interpretation of
laboratory test results.
- Specificity is higher in healthy volunteers than in hospitalized patients.
e.g. AxSYM anti-HCV EIA (product information sheet)
Heathy blood donors: 99.84%
Hospitalized patients: 99.60%
Prevalence HCV: 2%
Sensitivity AxSYM: 99.6%
PPV=92.7%
PPV=83.5%
- While specificity is independent of prevalence, it is dependent on the reference
population tested.
=> When possible, the control group should include individuals in whom the target
disease is suspected, but who lack this disease (“diseased control group”).

Reference limits
ExampleReference limits for immunoglobulins in the cryoprecipitate
IgA
(mg/L)
IgG
(mg/L)
IgM
(mg/L)
Diseased controls (n=110)
95th percentile 2 10 20
97.5th percentile 2 11 26
Maximum 3 17 34
Healthy volunteers (n=33)
Maximum <2 <6 9
- In contrast to AST and ALT which are performed as part of almost every routine
work-out, cryoglobulins are only requested in a limited number of patients with
possible cryoglobulin-related symptoms.

A cut-off can be choosen for different reasons
1) To optimize sensitivity and specificity using ROC-curve analysis
e.g. IgA anti-tTG for celiac disease
Reference limits
2) To optimize sensitivity (rule-out if negative)
e.g. HIV screening test
3) To optimize specificity (rule-in if positive)
e.g. HIV confirmation test
0
0.2
0.4
0.6
0.8
1
0 0.2 0.4 0.6 0.8 1
Sen
siti
vity
1-Specificity
sens x spec

Likelihood ratios for non-dichotomous results- For many tests, the probability that a patient has the disease is higher when the test
result is more abnormal.
- This additional information is lost when sensitivity and specificity are used.
- Likelihood and likelihood ratio, in contrast, allow to take this additional information
into acount.
Non-Dichotomous Outcome
0.05 2.0 64
319
0
100
200
300
400
0.0
0.2
0.4
0.6
0.8
1.0
tTG <7 tTG 7-20 tTG >20-100 tTG >100
Like
liho
od
Rat
io
Like
liho
od
LH CD+DH
LH non-CD
LR

Calculating posttest probability for non-dichotomous resultsAs for dichotomous results, the posttest probability can be calculated for different
pretest probabilities using the likelihood ratio for the different non-dichotomous
results.
0
0.2
0.4
0.6
0.8
1
0 0.2 0.4 0.6 0.8 1
Po
stte
st p
rob
abili
ty C
D
Pretest probability CD
tTG <7
tTG 7-20
tTG >20-100
tTG >100
Non-Dichotomous Outcome
Prev=7.3%
M1 M2 M3

Comparing different tests
Keep in mind that:1) Comparing the area under the curve does not take into account whether the cut-off
was correctly chosen.
2) Comparing sensitivity and specificity does not tell you anything about the“discriminating” power, the percentage of patients for which there is an importantchange in pretest to posttest probability.
2) An increase in analytical imprecision mainly affects specificity because of the largernumber of non-diseased patients.
0
0.2
0.4
0.6
0.8
1
0 0.2 0.4 0.6 0.8 1
Sen
siti
vity
1 - Specificity
Innova
Euroimmune

Dicriminating power
0.20
3.411.6
247
0
200
400
600
800
0.0
0.2
0.4
0.6
0.8
1.0
<15 15-<25 25-<50 >50
Like
liho
od
CD
non-CD
LR
0.13
0.8 7.7
594
0
200
400
600
800
0.0
0.2
0.4
0.6
0.8
1.0
<10 10-<20 20-30 >30
Like
liho
od
CD
non-CD
LR
Innova
Euroimmune
Sens: 84.4%Spec: 99.3%
Sens: 76.0%Spec: 98.7%

Based on: Price C.P. & Christenson R.H. EBLM: principles, practice, and outcomes, 2nd Ed.
Analytical imprecision
Effect of analytical imprecision on diagnostic performance- An increase in analytical imprecision mainly affects specificity because of the larger
number of non-diseased patients (e.g. modeling in 641 patients).
- From a population perspective, the effect of increased imprecision on ROC scores is
in general limited because only a limited number of individuals have results close to
the cut-off point. For the affected individuals, however, the effect is 100%!
Imprecision FP FN Sens Spec FPR
0% 0 0 100% 100% 0%
20% 1 3 99% 99% 1%
50% 11 8 98% 93% 7%
90% 20 13 97% 87% 13%
100% 22 14 97% 86% 14%
110% 24 15 97% 85% 15%
150% 30 19 96% 80% 20%
200% 36 24 95% 77% 23%
Routine assay

STARD Initiative
Standards for Reporting of Diagnostic Accuracy- Aims to improve the accuracy and completeness of reporting of studies of diagnostic
accuracy, to allow readers to assess the potential for bias in the study (internal
validity) and to evaluate its generalisability (external validity).
- Diagnostic studies with specific design features have been shown to be associated
with biased, optimistic estimates of diagnostic accuracy compared with studies
without such deficiencies.
- Complete and accurate reporting should allow the reader to detect the potential for
bias in the study and to assess the generalisability and applicability of the results.
- This includes a cross tabulation of the results of the index tests (including
indeterminate and missing results) by the results of the reference standard and, for
continuous results, the distribution of the test results by the results of the reference
standard.
http://www.stard-statement.org/

Communicating Diagnostic Accuracy
Results of a controlled study (Steurer J et al. BMJ 2002;324:824-826)
- 263 general practicioners, questionnaire with multiple choice questions
- Most GPS recognized the correct definitions for sensitivity (76%) and PPV (61%), butdid not apply them correctly to estimate the probability of disease.
Information providedAll GPs: prevalence 10% in women with abnl. bleedingGroup 1: no information on test accuracyGroup 2: test sens. (80%) and spec. (60%) Group 3: positive LR of 2 in non-technical language (“a positive result is obtained twice as frequently in
women with endometrial cancer than in women without this disease”)
Probability of endometrial cancer attributed by GPs to a possitive result from tranvaginal ultrasound scanning (“compatible with cancer”) in women with abnormal uterine bleeding

What do physicians Do?
Survey of 300 physicians (Reid M.C. et al. Am J. Med. 1998;104:374-80)-
- Bayesian transformation: 3% (pretest odds x (sens/1-spec) = posttest odds)
- ROC curve analysis: 1%
- Likelihood ratios: 1%
Specialty n Bayesian ROC curves LR
General Internal Medicine 50 5 1 1
Internal Medicine subsp. 50 2 0 1
Pediatrics 50 1 1 0
Genreal surgery 50 0 1 0
Family practice 50 0 0 0
Obstetrics/Gynaecology 50 0 0 0
Publication bias??
Am. J. Med. is the official journal of The Association of Professors of Medicine, comprised
of chairs of Dep. of internal medicine at more than 125 medical schools across the USA.
Impractical Lack of knowledge

DecideAssessFind
Questions?