evgeniia komarova, ziad abosteif, stefan guhl, and...
TRANSCRIPT

1
Evgeniia Komarova, Ziad Abosteif, Stefan Guhl, and Bernd Meyer Institute of Energy Process Engineering and Chemical Engineering, TU Freiberg 9th of June, 2015

1. Introduction: Background, Motivation and Objective
2. Experimental: Materials, Methods and Approaches
3. Results and Discussions
4. Summary: Conclusions and Achievements
2/25
Outline

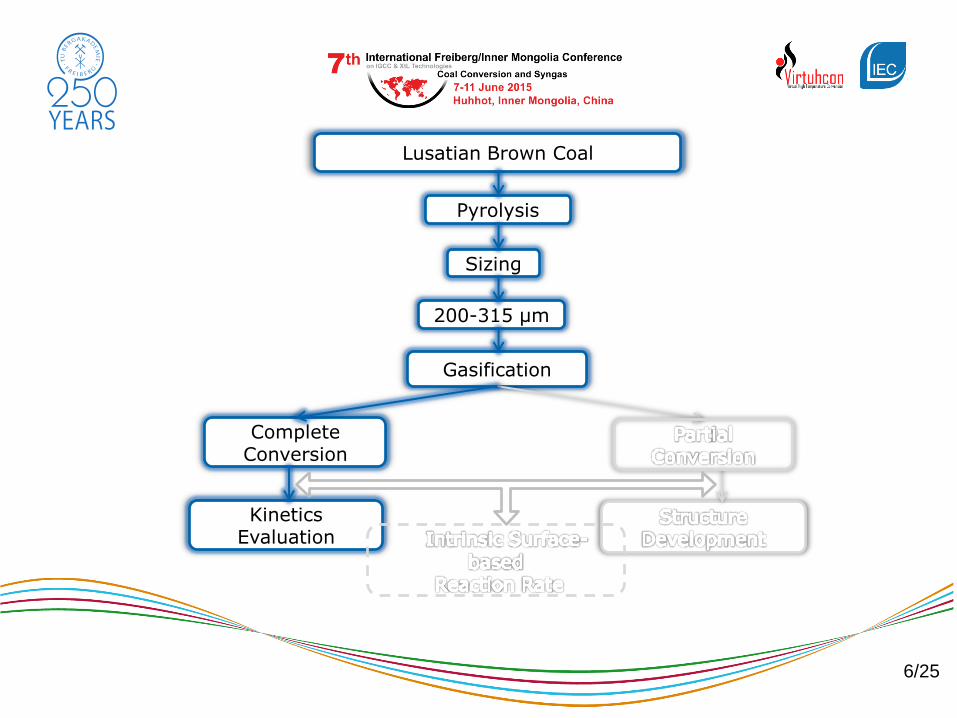
Lusatian Brown Coal
Pyrolysis
Sizing
200-315 µm
Gasification
Complete Conversion
Kinetics Evaluation
Structure Development
Introduction: Background, Motivation and Objective
Partial Conversion
3/25
„Virtuhcon“ – Virtual High Temperature Conversion

Lusatian Brown Coal
Pyrolysis
Sizing
200-315 µm
4/25

Experimental: Materials Pyrolysis conditions
Sample (bulk sample)
Ash, wt., % (db)
Volatile matter, wt., % (db)
Fixed Carbon, wt., % (db)
Lusatian brown coal 7.01 52.43 40.56
Sample (200-315µm)
Ash, wt., % (db)
Volatile matter, wt., % (db)
Fixed Carbon, wt., % (db)
Lusatian char 14.83 4.47 80.70
Before Pyrolysis:
After Pyrolysis:
Pyrolysis conditions: 1st step:
T = 600 °C (60 min); 2nd step:
T = 800 °C (60 min).
5/25
Lusatian Brown Coal
Pyrolysis
Sizing
200-315 µm
Gasification
Complete Conversion
Kinetics Evaluation
6/25

10 g char; T, °C - 800, 850, 900, 950; Inlet flow – N2/CO2;
C + CO2 = 2CO
The char conversion:
𝑋 𝑡 =𝑛CO t
𝑛CO total, -
Gasification reaction rate:
r =𝑑X
𝑑𝑡, 1/min
Specific reaction rate:
𝑟(𝑋) =1
1−𝑋
𝑑𝑋
𝑑𝑡*, g/g min
*Fan D, Zhu Z, Na Y, Lu Q. J Therm Anal Calorim 2013:599-607.
Experimental: Complete conversion experiments
7/25

Experimental: Kinetic evaluation
Model Model equations Theoretical background Shortcomings
RPM*
𝑑𝑋
𝑑𝑡= 𝑘RPM 1 − 𝑋 [1 − 𝜓 ln 1 − 𝑋 ]
12
2
𝜓1 − 𝜓 ln 1 − 𝑋 − 1 = 𝒌𝑹𝑷𝑴t
𝜓Xmax=
2
2 𝑙𝑛 1 − 𝑋max + 1 ;
Particle – sphere;
Pores – cylinders;
Reaction – everywhere on the pore surface;
Pores enlarge and then coalescence;
Maximum reaction rate peak.
No pore is destroyed;
No new pore is created.
VM**
𝑑𝑋
𝑑𝑡= 𝑘VM(1 − 𝑋)
−𝑙𝑛 1 − 𝑋 = 𝒌𝑽𝑴𝑡
Particle – sphere;
Reaction – in all possible positions uniformly throughout the entire char.
No structure changes;
Monotonically decreasing reaction rate.
SCM***
𝑑𝑋
𝑑𝑡= 𝑘SCM(1 − 𝑋)
23
3(1 − (1 − 𝑋)1/3) = 𝒌𝑺𝑪𝑴𝑡
Particle – spherical;
Structure – aggregation of non-porous grains;
Reaction – everywhere on the outer surface of the grains.
No structure changes;
Monotonically decreasing reaction rate.
*Bhatia SK, Perlmutter DD. AlChE 1980:379-386. **Lu GQ, Do DD. Carbon 1993: 247-263. *** Szekely J, Evans JW. Chem Eng Sci 1971: 1901-1913.
8/25

Results and Discussions Kinetic evaluation: Arrhenius Expression
Sample
Temp,°C
RPM VM SCM
𝑘RPM 𝜓Xmax
𝐸a,
kJ/mol
𝐴0, 1/min
𝑘VM 𝐸a,
kJ/mol 𝐴0,
1/min 𝑘SCM
𝐸a, kJ/mol
𝐴0, 1/min
Char
800 0.112 2.4
73.65 407
0.190
70.21 478
0.138
72.46 446 850 0.143 2.3 0.238 0.174
900 0.200 4.0 0.368 0.270 950 0.31 2.0 0.481 0.363
𝑘 𝑇 = 𝐴0𝑒−𝐸a/𝑅𝑇
Chemically controlled regime; Formal reaction order 𝑛 is 1. 𝐸a (29-280 kJ/mol) at low pressures and 800-1000 °C*
𝐸a (90-97 kJ/mol) using TGA at 800-950 °C**
*Ifran MF, Usman MR, Kusakabe K. Energy 2011: 12-40. ** Abosteif Z. Internal results of the research group (MPS).
9/25

RMSE*: The RPM – 1.1 % The VM – 5.9 %
RMSE: The RPM – 5.7 % The VM – 8.1 %
RMSE: The RPM – 2.6 % The VM – 7.5 %
RMSE: The RPM – 6.1 % The VM – 10.3 %
Results and Discussions Kinetic evaluation: Application of the kinetic models
*RMSE – Root Mean Square Error
10/25

Lusatian Brown Coal
Pyrolysis
Sizing
200-315µm
Gasification
Structure Development
Partial Conversion
11/25
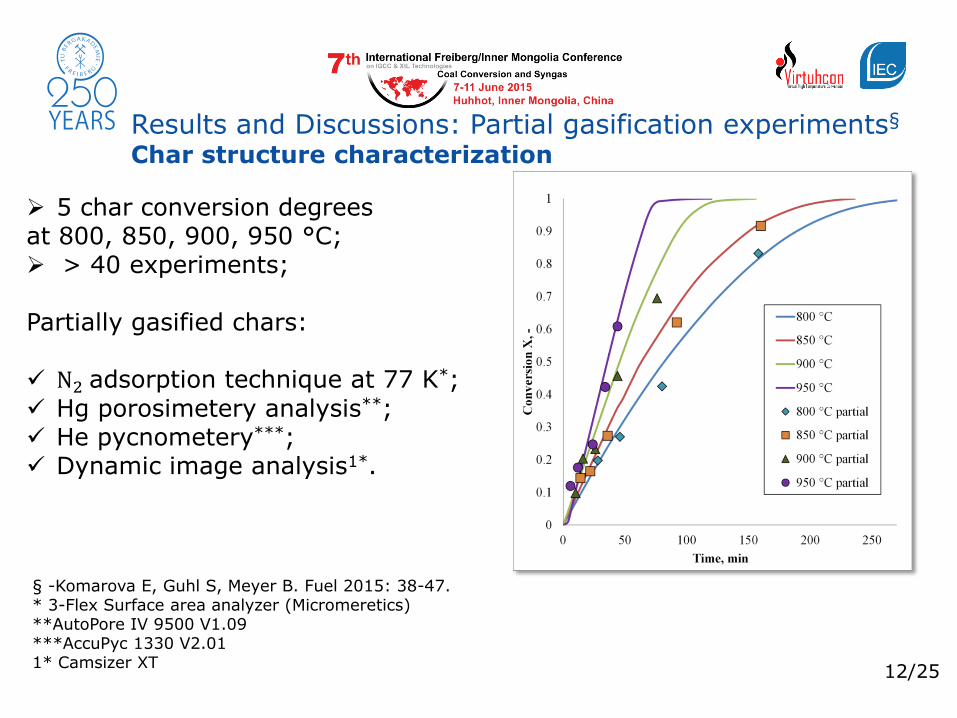
Results and Discussions: Partial gasification experiments§ Char structure characterization
5 char conversion degrees at 800, 850, 900, 950 °C; > 40 experiments; Partially gasified chars: N2 adsorption technique at 77 K*; Hg porosimetery analysis**; He pycnometery***; Dynamic image analysis1*.
§ -Komarova E, Guhl S, Meyer B. Fuel 2015: 38-47. * 3-Flex Surface area analyzer (Micromeretics) **AutoPore IV 9500 V1.09 ***AccuPyc 1330 V2.01 1* Camsizer XT
12/25

Results and Discussions: Char structure characterization 𝐍𝟐 adsorption technique at 77 K
Adsorption isotherms*: Combination of Type I and Type IV Micropores Mesopores
Initial sample: Mostly microporous
Partially gasified chars: Mesopores develop as reaction
proceeds Hysteresis*: H3 and H4 Types Slit/needle-like pores
*The IUPAC – International Union of Pure and Applied Chemistry 13/25

Results and Discussions: Char structure characterization Interpretation of adsorption isotherms
Total SA Micro SA Meso SA
BET** (Type II and IV) or Langmuir method (Type I)
t-plot (based on Total SA)
BJH***- method
Pores in coals/chars are divided into*: Micropores (between 0 and 2 nm); Mesopores (between 2 and 50 nm); Macropores (wider than 50 nm).
* The IUPAC – International Union of Pure and Applied Chemistry **BET – Brunauer-Emmet-Teller *** BJH – Barrett-Joyner-Hallend 14/25

Results and Discussions: Char structure characterization Micro- and mesopore SA development
800 °C (blue line): Increase of mesopore SA with carbon conversion X
to a greater extent;
850, 900 and 950 °C (red line): Increase of mesopore SA with carbon conversion X to a lesser extent.
800 °C (blue line): Slight increase of Micro SA at early X. 850, 900 and 950 °C (red line): Steep decrease of Micro SA at early X.
15/25

Results and Discussions: Char structure characterization Porosity distribution by Hg porosimetry
The share of micropores decreases; The share of mesopores increases; The share of macropores remains almost constant. Hg porosimetery analysis is consistent with the N2 adsorption technique results.
16/25

Results and Discussions: Char structure characterization True and apparent density development
𝝆𝐭𝐫𝐮𝐞 , ash content is constant 𝝆𝐚𝐩𝐩 , the volume of voids increases
17/25

Results and Discussions: Char structure characterization Total porosity and pore volume development
𝑉total =1
𝜌apparent−
1
𝜌true, cm3/g 𝜀 =
𝜌true−𝜌app
𝜌true∙ 100, %
18/25
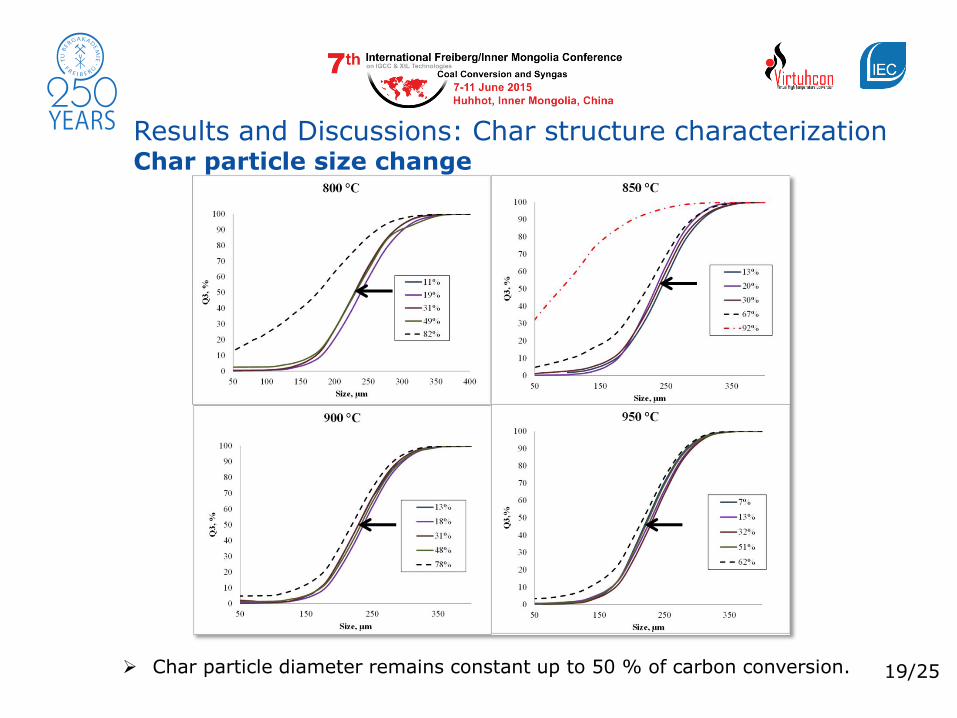
Results and Discussions: Char structure characterization Char particle size change
Char particle diameter remains constant up to 50 % of carbon conversion. 19/25

Initial sample
Results and Discussions: Char structure characterization
Image analysis, SEM at 900 °C
X=78 %
X=78 % Initial sample
x100
x1000
Small pieces
Cracks and ash layer
20/25

Results and Discussions: Char structure characterization Kinetic models assumptions vs. experimental results
Properties Experimental RPM VM SCM
𝑟
Decreases as reaction proceeds with unclear maximum reaction rate peak
Decreases with or without maximum reaction rate peak
Decreases linearly Decreases linearly
𝑑
Constant until 50% of X, then decreases.
Constant until the end of the reaction
Constant until the end of the reaction
Decreases gradually as
reaction proceeds
𝜌
𝜌𝑡𝑟𝑢𝑒:decreases linearly
𝜌𝑎𝑝𝑝.:increases
linearly
Gradual change Gradual change No change
𝜀 Increases linearly Gradual change Gradual change No change
21/25

Kinetics Evaluation
Structure Development
22/25

Results and Discussions: Kinetics vs. surface area Correlation of the specific reaction rate to the specific SA
Intrinsic (normalized) reaction rate:
𝒓𝒊𝒏𝒕𝒓 =𝒓(𝑿)
𝑺(𝑿)
∗, g/min m2
rintr (total); rintr (micro); rintr (meso) - assumed to be constant** (all the variations in SA).
*Wang M, Roberts DG, Kochanek MA, Harris DJ, Chang L, Li C. Energy and Fuels 2014:285-290. **Gil MV, Fermoso J, Pevida C, Rubiera F. Fuel Proces Techn 2010:1776-1781.
23/25

Results and Discussions: Kinetics vs. surface area Intrinsic reaction rate
Two competitive phenomena due to carbon conversion: 1.Slow reaction rate Carbon structure reordering (TT history). 2. Raise reaction rate Ash constituents (stronger catalytic activity). Possible dominating catalytic effect
24/25

Summary Principal Conclusions and Achievements
Gasification experiments were performed in a fluidized-bed type reactor;
Brown coal char gasification kinetics was evaluated using the RPM, the
VM and the SCM;
Char structure development with carbon conversion was extensively
investigated:
Strong development of mesopores was observed;
Mesopores developed from micropores;
𝜀 and 𝑉 increased linearly – temperature independent;
𝑑 remained constant up to 50 % of char conversion – temperature
independent.
The RPM agrees best with the experimental results, because it
considers the main char structure changes;
Gasification reaction rate correlates best with the SA of the new-
developing mesopores SA.
25/25

Acknowledgments This research has been funded by the Federal Ministry of Education and
Research of Germany in the framework of Virtuhcon (Project Number
03Z2FN12).
TU Bergakademie Freiberg
Institute of Energy Process Engineering and Chemical Engineering
09599 Freiberg – Germany
Phone: +49 3731 39-4217
Fax: +49 3731 39-4555
E-Mail: [email protected]
Web: www.iec.tu-freiberg.de