everything disc 363 research report · 1) leaders complete an everything disc® personality...
TRANSCRIPT

Everything DiSC 363® for Leaders
Research Report

Everything DiSC 363® for Leaders Research Report ©2016 by John Wiley & Sons, Inc. All rights reserved.
2
Introduction
Everything DiSC 363® for Leaders is a multi-rater assessment and profile that is designed to give participants
feedback on their leadership performance. The figure below shows the Everything DiSC® Leadership model that is
the foundation for Everything DiSC 363 for Leaders.
Figure 1. The Everything DiSC Leadership Model
The words around the circle represent eight leadership approaches. In the theoretical model, each approach is
most correlated with adjacent approaches and least correlated with opposite approaches. Three leadership
practices are assigned to each approach for a total of 24 practices, and these can be seen inside the circle. Again,
these practices are theoretically most correlated with practices within the same approach, then most highly
correlated with adjacent practices. Practices that sit opposite each other on the model are least correlated.
Completing the Assessment
An Everything DiSC 363 for Leaders report can only be generated if an assessment is completed by a leader and at
least one rater. Although there is some overlap in the assessment experience for both of these participants, they
Setting HighExpectations
Speaking UpAbout Problems
Improving
Methods
FindingO
pportunities
Stretching theBoundaries
Promoting
BoldAction
Mai
ntai
ning
Com
posu
re
Show
ing
Mod
esty
Bein
g
Fair-
Min
ded
BeingApproachable
AcknowledgingContributions
Creating a PositiveEnvironment
Staying Open
to InputShowing
Diplomacy
Facilitating
Dialogue
Show
ing
Enth
usia
smBuil
ding P
rofes
siona
l
Network
s
Rallying People to
Achieve Goals
Showing
Confidence
Focusingon Results
Communicating
with Clarity
Promoti
ng D
iscipl
ined
Analys
is
Prov
iding
a S
ense
of S
tabil
ity

Everything DiSC 363® for Leaders Research Report ©2016 by John Wiley & Sons, Inc. All rights reserved.
3
are different.
The Leader Assessment Experience
1) Leaders complete an Everything DiSC® personality assessment, which uses adaptive testing technology to
increase scoring certainty. Leaders respond to a series of statements (i.e., I am lively, I keep to myself) on
a five-point ordered response scale, indicating how much they agree with each statement. If necessary,
respondents are presented with additional items to attain a more accurate score. Results from this
portion of the assessment are not directly communicated to leaders in the profile but are reflected in
their narrative feedback. Information on the validation of this assessment is included in the Everything
DiSC Application Library Research Report.
2) Leaders are presented with 72 leadership behavior statements (e.g., “I propose new directions for the
group”). For each statement, they are asked to rate how often they demonstrate that behavior from 1
(never or almost never) to 7 (always or almost always). Results from this portion of the assessment are
used to calculate self-assessed performance scores on each of the eight approaches and 24 practices. The
rater also responds to these same statements.
The Rater Assessment Experience
1) Raters are presented with 72 leadership behavior statements with regard to the leader (e.g., “She
proposes new directions for the group”). For each statement, they are asked to rate how often the leader
demonstrates that behavior from 1 (never or almost never) to 7 (always or almost always). Results from
this portion of the assessment are used to calculate rater-assessed performance scores on each of the
eight approaches and 24 practices. Because the leader also responds to these same statements, it is
possible to show comparisons between self-assessed and rater-assessed performance scores. This
assessment is the main focus of this research report, and we will refer to it as the 363 for Leaders
assessment.
2) Raters are presented with 24 leadership behaviors (corresponding to the 24 leadership practices) and
asked if they would like to see the leader demonstrate these behaviors more often (e.g., “Do you think
she needs to be more active about finding new opportunities for the group?”). Raters may respond “Yes, a
lot more,” “Yes, a little more,” or “No.” After responding to each statement, participants are given the
option to select prewritten comments to give to the leader. Results from this portion of the assessment
are presented to the leader throughout his or her report. More specifically, the leader can see the
comments chosen by the raters, and the three behaviors that are requested most often are suggested as

Everything DiSC 363® for Leaders Research Report ©2016 by John Wiley & Sons, Inc. All rights reserved.
4
areas for development. Because this section is a straightforward survey and does not involve the
development of scales, it is not the focus of this validation report.
Development of the 363 for Leaders Assessment
Alpha Phase
In the first development phase, a content analysis of contemporary leadership literature was conducted to
identify leadership constructs that are relevant to the DiSC® model. Data on these concepts were then gathered by
asking participants who had just completed an online personality assessment to volunteer for research on a
leadership project. Participants were asked questions about their own leadership performance, as well as the
performance of leaders in their previous or current organizations. These data were used to identify and build
initial approach and practice scales, as well as to understand the psychometric relationships among these
leadership constructs. More than 26,000 participants were included in this stage of the research.
Beta Phase 1 (Exploratory)
In the first beta phase, an initial 363 for Leaders assessment was constructed for both leaders and raters. Leaders
from a wide range of industries completed their portion of the assessment. Raters for each leader were selected
by either the leader’s manager or an HR professional within the organization. After these data were collected,
they were analyzed. Based on this analysis, the Everything DiSC® Leadership model and scales were refined.
Beta Phase 2 (Confirmatory)
In the second beta phase, the refined assessment was again completed by leaders and raters from a wide range of
industries. Raters for each leader were selected by either the leader, the leader’s manager, or an HR professional
within the organization. Data from these participants were analyzed to evaluate the refined tool for reliability and
validity.
The Validation Process
Psychological instruments are used to measure abstract characteristics like intelligence, extroversion, and
honesty. So how do researchers evaluate these instruments? How do we know whether such tools provide
accurate information or just generate haphazard feedback that sounds believable? Simply put, if an instrument is
indeed useful and accurate, it should meet a variety of standards that have been established by the scientific
community. Validation is the process researchers use to assess the quality of a psychological instrument by testing
it against these standards. This paper is designed to help you understand these standards and see how Inscape’s
363 for Leaders assessment performs under examination.

Everything DiSC 363® for Leaders Research Report ©2016 by John Wiley & Sons, Inc. All rights reserved.
5
Validation asks two fundamental questions:
1. How reliable is the tool? That is, researchers ask if an instrument measures in a way that is consistent and
dependable. If the results from a tool contain a lot of random variation, it is less reliable.
2. How valid is the tool? That is, researchers ask if an instrument measures accurately. The more that a tool
measures what it proposes to measure, the more valid the tool is.
Note that no psychometric tool is perfectly reliable or perfectly valid. All psychological instruments are subject to
sources of error. Reliability and validity are seen as matters of degree on continuous scales, rather than
reliable/unreliable and valid/invalid on dichotomous scales. Consequently, it is more appropriate to ask, “How
much evidence is there for the reliability of this tool?” than, “Is this tool reliable?”
Sample
The results presented in this report are from a sample of 480 leaders. In all cases, leaders were rated by two or
more raters, with a median of six raters per leader. The total number of raters was 3,043. Demographics for
leaders in this sample are included in Appendix 1.
Scoring
Scores were calculated by averaging the total responses for all items on each scale. Since the responses range
from 1 to 7, so do the resulting scale scores. Each of the 24 practices contains three items, and each approach
contains three of those 24 practices. Therefore, each approach scale contains nine items. Means and standard
deviations for all scales are shown in Table 1.

Everything DiSC 363® for Leaders Research Report ©2016 by John Wiley & Sons, Inc. All rights reserved.
6
Table 1. Scale Means and Standard Deviations Other-Rated Self-Rated APPROACHES Mean SD Mean SD Pioneering 5.49 .73 5.35 .94 Energizing 5.53 .80 5.65 .94 Affirming 5.79 .77 5.80 .76 Inclusive 5.72 .78 5.50 .75 Humble 5.53 .74 5.46 .77 Deliberate 5.64 .69 5.56 .82 Resolute 5.65 .64 5.72 .84 Commanding 5.83 .68 5.64 .87 PRACTICES Finding Opportunities 5.56 .75 5.63 .96 Stretching the Boundaries 5.56 .76 5.17 1.26 Promoting Bold Action 5.35 .80 5.29 1.07 Showing Enthusiasm 5.62 .84 5.78 1.05 Building Professional Networks 5.59 .79 5.82 1.00 Rallying People to Achieve Goals 5.45 .86 5.57 .99 Being Approachable 6.00 .78 5.97 .84 Acknowledging Contributions 5.70 .85 5.69 .94 Creating a Positive Environment 5.66 .81 5.73 .86 Staying Open to Input 5.74 .81 5.45 1.05 Showing Diplomacy 5.83 .84 5.60 .84 Facilitating Dialogue 5.59 .77 5.46 .84 Maintaining Composure 5.63 .87 5.36 .99 Showing Modesty 5.43 .84 5.36 .99 Being Fair-Minded 5.53 .75 5.67 .83 Communicating with Clarity 5.68 .75 5.38 1.02 Promoting Disciplined Analysis 5.60 .68 5.66 .93 Providing a Sense of Stability 5.64 .79 5.62 .92 Setting High Expectations 5.57 .74 5.67 .93 Speaking Up about Problems 5.78 .63 5.96 .93 Improving Methods 5.65 .76 5.66 1.05 Showing Confidence 5.93 .69 5.63 .98 Taking Charge 5.75 .77 5.56 .99 Focusing on Results 5.81 .74 5.74 .97

Everything DiSC 363® for Leaders Research Report ©2016 by John Wiley & Sons, Inc. All rights reserved.
7
Internal Reliability
Internal reliability evaluates the degree of correlation among questions that profess to measure the same thing. In
other words, all of the items on a scale should be consistent with each other. A statistic called Cronbach’s Alpha
expresses the degree of correlation as a specific number, which typically varies between 0.0 and 1.0. If the value
of Alpha is 0.0, then there is no relationship among the items/statements on a given scale. On the other hand, if
all the statements in a questionnaire measure in an identical fashion, then the value of Alpha will be 1.0, which
indicates absolute internal consistency.
Cronbach’s Alpha is calculated separately for each of the tool’s scales. Each approach in the 363 for Leaders
assessment contains nine items, and each practice contains three items. The following guidelines are frequently
used to evaluate the quality of a scale’s internal reliability: Alpha values above .70 are generally considered
acceptable and satisfactory, Alpha values above .80 are usually considered quite good, and values above .90 are
considered to reflect exceptional internal consistency.
The scales used in the Everything DiSC® Leadership model demonstrate good-to-excellent internal consistency, as
shown by the Alpha values listed on Tables 2 and 3. For raters, all scales had an Alpha well above .80. Note that
coefficients are shown for individual raters and aggregated raters (i.e., mean scores calculated across raters on
each item before calculating Alpha). For leaders, three of the 32 scale Alphas fell below the preferred cutoff of
.70. Given that the focus of the 363 profile is on rater feedback and that these scales are reflecting self-
assessment, these less-than-desirable Alphas are within the tolerable range.
Table 2. Approach Scale Internal Reliabilities
ALPHA APPROACHES RATERS
LEADERS
Individual
Aggregated
Pioneering .95
.98 .90 Energizing .94
.96 .91
Affirming .96
.97 .89 Inclusive .96
.97 .83
Humble .94
.96 .88 Deliberate .95
.96 .89
Resolute .93
.95 .90 Commanding .94 .96 .93
Everything DiSC 363® for Leaders Research Report ©2016 by John Wiley & Sons, Inc. All rights reserved.
8
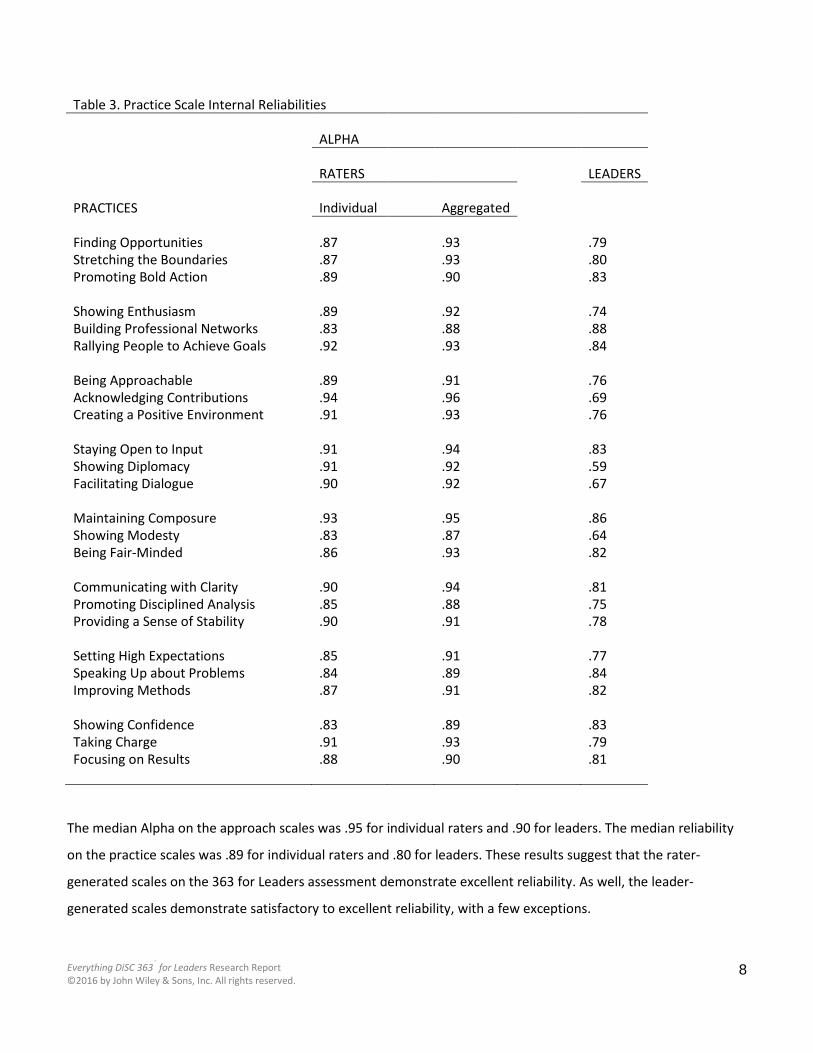
Table 3. Practice Scale Internal Reliabilities
ALPHA
RATERS
LEADERS
PRACTICES Individual
Aggregated
Finding Opportunities .87
.93
.79 Stretching the Boundaries .87
.93
.80
Promoting Bold Action .89
.90
.83
Showing Enthusiasm .89
.92
.74 Building Professional Networks .83
.88
.88
Rallying People to Achieve Goals .92
.93
.84
Being Approachable .89
.91
.76 Acknowledging Contributions .94
.96
.69
Creating a Positive Environment .91
.93
.76
Staying Open to Input .91
.94
.83 Showing Diplomacy .91
.92
.59
Facilitating Dialogue .90
.92
.67
Maintaining Composure .93
.95
.86 Showing Modesty .83
.87
.64
Being Fair-Minded .86
.93
.82
Communicating with Clarity .90
.94
.81 Promoting Disciplined Analysis .85
.88
.75
Providing a Sense of Stability .90
.91
.78
Setting High Expectations .85
.91
.77 Speaking Up about Problems .84
.89
.84
Improving Methods .87
.91
.82
Showing Confidence .83
.89
.83 Taking Charge .91
.93
.79
Focusing on Results .88
.90
.81
The median Alpha on the approach scales was .95 for individual raters and .90 for leaders. The median reliability
on the practice scales was .89 for individual raters and .80 for leaders. These results suggest that the rater-
generated scales on the 363 for Leaders assessment demonstrate excellent reliability. As well, the leader-
generated scales demonstrate satisfactory to excellent reliability, with a few exceptions.

Everything DiSC 363® for Leaders Research Report ©2016 by John Wiley & Sons, Inc. All rights reserved.
9
Inter-rater Reliability
Internal reliability evaluates the degree of agreement among raters. Interclass correlations were used to assess
inter-rater reliability as described by Ebel (1951). Coefficients above .40 are considered to reflect moderate
agreement. Those above .60 are considered to reflect substantial agreement. Those above .80 are considered to
reflect outstanding agreement.
For this analysis, a special sample was used. Raters were all direct reports of the person being rated. The number
of raters was 2,502, and the number of people being rated was 586. Reliability coefficients for the approach and
practice scales can be seen in Tables 4 and 5, respectively. These coefficients suggest that the 363 for Leaders
scales have substantial to outstanding inter-rater reliability. The median reliability for the approach and practice
scales were .78 and .76, respectively.
Table 4. Approach Scale Inter-rater Reliabilities Pioneering
.77
Energizing
.78 Affirming
.78
Inclusive
.76 Humble
.77
Deliberate
.79 Resolute
.81
Commanding .76

Everything DiSC 363® for Leaders Research Report ©2016 by John Wiley & Sons, Inc. All rights reserved.
10
Table 5. Practice Scale Inter-rater Reliabilities
Finding Opportunities .76 Stretching the Boundaries .77 Promoting Bold Action .73
Showing Enthusiasm .77 Building Professional Networks .74 Rallying People to Achieve Goals .74
Being Approachable .81 Acknowledging Contributions .73 Creating a Positive Environment .75
Staying Open to Input .75 Showing Diplomacy .76 Facilitating Dialogue .74
Maintaining Composure .77 Showing Modesty .73 Being Fair-Minded .74
Communicating with Clarity .78 Promoting Disciplined Analysis .77 Providing a Sense of Stability .75
Setting High Expectations .79 Speaking Up about Problems .76 Improving Methods .76
Showing Confidence .86 Taking Charge .79 Focusing on Results .80
Validity
Multidimensional Scaling Analyses
The Everything DiSC® Leadership model specifies a very specific set of relationships among its scales: It predicts
that the eight approach scales and 24 practice scales will form a circumplex. That is, they will be arranged in a
circular format at equal intervals. A statistical technique called multidimensional scaling analysis (MDS) is a highly
useful tool for examining the fit of the data to the conceptual model. First, this technique allows for a visual
inspection of the relationships among the eight approach scales or the 24 practice scales. Second, this technique
makes it possible to look at all of the scales simultaneously. In Figures 2 and 3, scales that are plotted closer
together have a stronger positive relationship. Scales that are farther apart are more dissimilar.

Everything DiSC 363® for Leaders Research Report ©2016 by John Wiley & Sons, Inc. All rights reserved.
11
As can be seen in Figure 2, the approach scales are arranged in the order that is expected by the Everything DiSC®
Leadership model. (Keep in mind that the original MDS rotation is presented below, and this rotation is arbitrary.)
Although the eight scales do not form a perfectly equidistant circle (as predicted by the model), this theoretical
ideal is nearly impossible to obtain with actual data. The actual distance between the scales, however, is roughly
equal, providing strong support for the model and its assessment.
Figure 2. MDS Analysis for the Approach Scales
The MDS results for the practice scales are shown in Figure 3. Again, the original MDS rotation is presented below,
and this rotation is arbitrary. Dashed lines have been added to help illustrate groups of scales that should
theoretically cluster. This figure offers support for the Everything DiSC Leadership model in several ways. First, the
scales are arranged in a circular fashion, and clusters of scales are ordered in the manner predicted by the model
(although the rotation is presented in a counter-clockwise fashion in this representation). Second, scales that
should theoretically cluster together in the model do cluster together. For example, the practice of Taking Charge
is located close to the practice of Showing Confidence, as predicted by the model. Third, clusters are spaced at
roughly equal distances around the circle, although not perfectly equidistant.

Everything DiSC 363® for Leaders Research Report ©2016 by John Wiley & Sons, Inc. All rights reserved.
12
Figure 3. MDS Analysis for the Practice Scales
Additionally, the S-stress for the approach data and the practice data were .013 and .081, respectively. The RSQ
values were .999 and .964, respectively. These values reflect the ability of a two-dimensional model to fit the
data. Lower S-stress values are preferred (with a minimum of 0), whereas higher RSQ values are preferred (with a
maximum of 1). S-stress values below .1 suggest an excellent fit of the data to a two-dimensional configuration.
All of the S-stress and RSQ values reported here suggest that a third dimension is not needed to explain the
relationship among these scales.
Scale Intercorrelations
By examining the intercorrelations among scales, we can measure with more precision how well the data fits the
Everything DiSC® Leadership model. The model proposes that adjacent scales (e.g., Commanding and Pioneering)
will have stronger positive correlations than opposite scales (e.g., Commanding and Inclusive). Further, if the data
are controlled for overall leadership ability, opposite scales are expected to have negative correlations. For
example, among leaders at the same skill level, leaders who are more Commanding than others are expected to
be less Inclusive. To control for overall leadership ability, scale scores were ipsatized for each leader. That is, each

Everything DiSC 363® for Leaders Research Report ©2016 by John Wiley & Sons, Inc. All rights reserved.
13
leader’s total average rating was calculated along with his or her total standard deviation across all items. The
total mean was subtracted from individual item means, and then this number was divided by the total standard
deviation. Ipsatized scale means were then calculated by summing ipsatized item scores for each scale. As a
result, each leader’s mean ipsatized scale score across all scales was zero. Ipsatized scale scores, then, represent
relative strengths for the individual. Table 6 shows the ipsatized and non-ipsatized correlations among the
approach scales.
Table 6. Approach Scale Intercorrelations
Pion
eerin
g
Ener
gizin
g
Affir
min
g
Incl
usiv
e
Hum
ble
Delib
erat
e
Reso
lute
Com
man
ding
Pioneering .85 .69 .62 .56 .65 .76 .81
Energizing .26 .85 .74 .63 .65 .65 .70
Affirming -.37 .34 .91 .81 .69 .52 .47
Inclusive -.53 -.13 .56 .89 .76 .52 .40
Humble -.57 -.52 .14 .52 .80 .55 .39
Deliberate -.43 -.57 -.34 .01 .29 .78 .63
Resolute .17 -.34 -.68 -.59 -.23 .26 .83
Commanding .42 .03 -.65 -.79 -.59 -.06 .56
Note: Ipsatized scales are shown below the diagonal and non-ipsatized scales are shown
above the diagonal.
Because the Everything DiSC® Leadership model proposes that the eight approach scales are arranged as a
circumplex, an even more strict set of statistical assumptions are required of the data. The pattern of correlations
for a given scale are expected to be arranged in a particular order. As seen in Table 7 below, the strongest
theoretical correlation for two given scales is labeled r1. The second strongest is labeled r2 , and so on. In this case,
r4 represents the correlation between two theoretically opposite scales. Consequently, r4 should be a reasonably

Everything DiSC 363® for Leaders Research Report ©2016 by John Wiley & Sons, Inc. All rights reserved.
14
strong negative correlation. For each scale, we should observe the following relationship if the scales do, in fact,
support a circumplex structure: r1 > r2 > r3 > r4.
Table 7. Expected Scale Intercorrelations.
Pion
eerin
g
Ener
gizin
g
Affir
min
g
Incl
usiv
e
Hum
ble
Delib
erat
e
Reso
lute
Com
man
ding
Pioneering 1 Energizing r1 1 Affirming r2 r1 1 Inclusive r3 r2 r1 1 Humble r4 r3 r2 r1 1 Deliberate r3 r4 r3 r2 r1 1 Resolute r2 r3 r4 r3 r2 r1 1 Commanding r1 r2 r3 r4 r3 r2 r1 1
Looking at Table 6, we do, in fact, observe a r1 > r2 > r3 > r4 pattern for each scale. In addition, we can examine the
magnitude of these correlations in comparison to the theoretically expected magnitudes. The predicted
magnitudes of r1 , r2 , r3 , r4 under a circumplex structure are listed in Table 8, as described by Wiggins (1995). The
“actual” rx values are the median correlations for a given rx. Although the actual and predicted values are not
exactly the same (a near impossible standard for practical purposes), the magnitude of the (ipsatized) actual and
predicted correlation values is quite similar, thus providing additional support for the Everything DiSC® Leadership
model and the 363 for Leaders assessment.
Table 8. Actual and Predicted Scale Relationships
r1 > r2 > r3 > r4 .84 > .71 > .58 > .53 Actual (non-ipsatized average) .40 > -.05 > -.50 > -.65 Actual (ipsatized average) .42 > .03 > -.36 > -.73 Predicted
Additionally, intercorrelations for the practice scales are shown in Table 9. Of the 24 practices, 21 demonstrated
their highest correlation with one of the other two practices assigned to the same approach.

Everything DiSC 363® for Leaders Research Report ©2016 by John Wiley & Sons, Inc. All rights reserved.
15
Table 9. Practice Scale Intercorrelations
Practices
Find
ing
Opp
ortu
nitie
s
Stre
tchi
ng th
e Bo
unda
ries
Prom
otin
g Bo
ld A
ctio
n
Show
ing
Enth
usia
sm
Build
ing
Prof
essio
nal N
etw
orks
Rally
ing
Peop
le to
Ach
ieve
Go
als
Bein
g Ap
proa
chab
le
Ackn
owle
dgin
g Co
ntrib
utio
ns
Crea
ting
a Po
sitiv
e En
viro
nmen
t
Stay
ing
Ope
n to
Inpu
t
Show
ing
Dipl
omac
y
Faci
litat
ing
Dial
ogue
Finding Opportunities .87 .85 .75 .68 .85 .56 .64 .69 .58 .51 .67 Stretching the Boundaries .51 .86 .77 .72 .85 .57 .65 .73 .59 .54 .67 Promoting Bold Action .50 .55 .75 .71 .83 .53 .58 .66 .54 .44 .61 Showing Enthusiasm .07 .12 .17 .78 .90 .72 .80 .84 .67 .66 .74 Building Professional
.06 .06 .16 .28 .78 .69 .75 .73 .56 .58 .62
Rallying People to Achieve
.28 .31 .36 .62 .22 .70 .79 .85 .69 .67 .77 Being Approachable -.29 -.32 -.20 .22 .28 .01 .80 .84 .79 .86 .79 Acknowledging
-.23 -.23 -.22 .33 .18 .23 .37 .89 .79 .83 .82
Creating a Positive
-.28 -.21 -.19 .37 .08 .33 .43 .53 .83 .87 .87 Staying Open to Input -.35 -.40 -.30 -.09 -.12 -.19 .36 .28 .27 .87 .92 Showing Diplomacy -.43 -.48 -.48 -.03 -.06 -.10 .57 .45 .50 .53 .86 Facilitating Dialogue -.25 -.32 -.27 -.03 -.12 -.05 .27 .28 .32 .68 .48 Maintaining Composure -.24 -.32 -.33 -.32 -.23 -.36 .22 -.03 .13 .21 .44 .14 Showing Modesty -.34 -.38 -.38 -.30 -.16 -.34 .12 .12 .08 .43 .40 .29 Being Fair-Minded -.39 -.43 -.47 -.40 -.34 -.48 .07 -.03 .04 .38 .34 .30 Communicating with
-.19 -.21 -.22 -.28 -.31 -.28 -.20 -.14 -.23 -.01 .05 -.02
Promoting Disciplined
-.11 -.16 -.29 -.58 -.39 -.49 -.36 -.33 -.36 -.06 -.12 -.02 Providing a Sense of
-.44 -.36 -.49 -.23 -.37 -.31 -.16 -.04 .01 .08 .12 .06
Setting High Expectations .19 .27 .08 -.21 -.10 -.14 -.48 -.34 -.50 -.46 -.54 -.46 Speaking Up about
.09 .17 .14 -.38 -.16 -.43 -.45 -.50 -.60 -.36 -.56 -.36
Improving Methods .04 .02 -.07 -.25 -.43 -.29 -.35 -.30 -.33 -.19 -.27 -.21 Showing Confidence .26 .38 .37 -.05 .06 -.06 -.41 -.46 -.53 -.54 -.70 -.52 Taking Charge .18 .30 .33 .02 .04 .06 -.42 -.41 -.40 -.52 -.65 -.50 Focusing on Results .30 .28 .18 .05 -.09 .14 -.44 -.37 -.41 -.50 -.56 -.45
Note: Ipsatized scales are shown below the diagonal and non-ipsatized scales are shown above the diagonal

Everything DiSC 363® for Leaders Research Report ©2016 by John Wiley & Sons, Inc. All rights reserved.
16
Table 9. Practice Scale Intercorrelations (continued)
Mai
ntai
ning
Com
posu
re
Show
ing
Mod
esty
Bein
g Fa
ir-M
inde
d
Com
mun
icat
ing
with
Cla
rity
Prom
otin
g Di
scip
lined
An
alys
is
Prov
idin
g a
Sens
e of
Sta
bilit
y
Sett
ing
High
Exp
ecta
tions
Spea
king
Up
Abou
t Pro
blem
s
Impr
ovin
g M
etho
ds
Show
ing
Conf
iden
ce
Taki
ng C
harg
e
Focu
sing
on R
esul
ts
Finding Opportunities .48 .46 .55 .58 .61 .59 .65 .71 .68 .62 .70 .79 Stretching the Boundaries .48 .51 .58 .60 .64 .64 .67 .75 .70 .65 .74 .80 Promoting Bold Action .42 .41 .48 .53 .51 .52 .55 .70 .61 .65 .74 .72 Showing Enthusiasm .50 .55 .59 .57 .50 .66 .48 .55 .61 .49 .62 .69 Building Professional
.45 .51 .50 .51 .50 .54 .52 .50 .55 .52 .62 .65
Rallying People to Achieve
.53 .57 .62 .61 .59 .68 .57 .60 .64 .53 .67 .77 Being Approachable .68 .65 .72 .52 .49 .62 .23 .42 .49 .21 .34 .45 Acknowledging
.60 .68 .71 .58 .56 .68 .38 .49 .55 .27 .42 .53
Creating a Positive
.72 .72 .79 .65 .64 .76 .39 .52 .63 .32 .49 .60 Staying Open to Input .69 .77 .84 .64 .63 .73 .30 .49 .58 .22 .35 .48 Showing Diplomacy .78 .78 .82 .63 .61 .72 .24 .38 .53 .11 .28 .43 Facilitating Dialogue .70 .76 .83 .69 .69 .76 .37 .55 .63 .29 .44 .56 Maintaining Composure .65 .78 .56 .59 .66 .24 .39 .53 .14 .28 .40 Showing Modesty .29 .75 .64 .66 .72 .28 .48 .58 .13 .31 .43 Being Fair-Minded .42 .35 .68 .76 .82 .40 .57 .67 .27 .42 .55 Communicating with
.04 .13 .11 .81 .82 .49 .68 .72 .44 .54 .59
Promoting Disciplined
.09 .21 .32 .40 .81 .58 .77 .76 .48 .58 .65 Providing a Sense of
.13 .25 .34 .41 .30 .53 .65 .78 .41 .54 .66
Setting High Expectations -.26 -.20 -.16 -.03 .22 -.04 .77 .60 .66 .67 .79 Speaking Up about
-.28 -.20 -.08 .10 .42 -.03 .47 .81 .79 .79 .78
Improving Methods -.06 .03 .08 .20 .29 .28 .20 .48 .54 .66 .72 Showing Confidence -.38 -.44 -.34 -.03 .09 -.19 .47 .58 .13 .81 .70 Taking Charge -.42 -.38 -.35 -.06 .04 -.12 .36 .49 .20 .67 .80 Focusing on Results -.36 -.35 -.29 -.07 .02 -.04 .53 .29 .24 .43 .51
Note: Ipsatized scales are shown below the diagonal and non-ipsatized scales are shown above the diagonal.

Everything DiSC 363® for Leaders Research Report ©2016 by John Wiley & Sons, Inc. All rights reserved.
17
With both ipsatized and non-ipsatized scales, the average correlations among scales in the same approach was
higher than the average correlation of individual scales with scales in adjacent approaches. As with the approach
scales, we do observe a r1 > r2 > r3 > r4 pattern for each cluster of practice scales.
Comparing Self and Other Ratings
The correlations among the self-rated scale scores and the other-rated scale scores are shown in Table 10.
Table 10. Correlation Between Self and Other Ratings
Self/Other Correlations
Approach Scales Pioneering .36 Energizing .50 Affirming .41 Inclusive .30 Humble .16 Deliberate .26 Resolute .34 Commanding .46 Practice Scales Finding Opportunities .31 Stretching the Boundaries .21 Promoting Bold Action .40 Showing Enthusiasm .48 Building Professional Networks .46 Rallying People to Achieve Goals .41 Being Approachable .35 Acknowledging Contributions .35 Creating a Positive Environment .35 Staying Open to Input .25 Showing Diplomacy .27 Facilitating Dialogue .19 Maintaining Composure .20 Showing Modesty .11 Being Fair-Minded .16 Communicating with Clarity .21 Promoting Disciplined Analysis .22 Providing a Sense of Stability .26 Setting High Expectations .34 Speaking Up about Problems .33 Improving Methods .21 Showing Confidence .50 Taking Charge .38 Focusing on Results .37

Everything DiSC 363® for Leaders Research Report ©2016 by John Wiley & Sons, Inc. All rights reserved.
18
These correlations show greater consensus on some scales than on others. Scales that measure outwardly
assertive behavior (e.g., Energizing and Commanding) demonstrate the highest correlations. Scales that measure
more subtle, perhaps inward behaviors, (e.g., Humble, Deliberate) show smaller correlations.
Analyses were also performed to examine the relationship between overall leadership ability and self-other
agreement. For each leader, an overall average rating was computed. Leaders were then divided into three
categories: the bottom 25%, the middle 50%, and the top 25%. Table 11 shows the correlations between self and
other ratings for each of the approach scales by overall leadership ability.
Interestingly, those leaders who received the lowest ratings show the highest correlations between self and other
ratings. Conversely, those with the highest ratings show the lowest correlations. It is possible that poorly-rated
leaders have more pronounced strengths and challenges and thus show more agreement (between self and other
ratings) in the relative magnitude of their leadership abilities.
Table 11. Correlation Between Self and Other Ratings by Overall Leadership Ability
Self/Other Correlation Scale Bottom
Middle
Top
Pioneering .52 .33 .09 Energizing .55 .44 .11 Affirming .53 .35 .03 Inclusive .45 .17 .14 Humble .37 .07 .15 Deliberate .46 .21 .20 Resolute .52 .37 .19 Commanding .64 .35 .33 Median .52 .28 .15
As shown in Table 12, further analyses suggest that lower-rated leaders overestimate their scores and higher-
rated leaders underestimate their scores, even though higher-rated leaders still rated themselves higher (mean
self-rating = 5.77) than lower-rated leaders (mean self-rating = 5.41). This difference of .36 in self-ratings,
however, is dwarfed by the difference between these same two groups in their ratings by others (1.49). These
findings suggest that leaders’ self-ratings improve slightly as their ability level increases, but not nearly at the
same rate as their ratings by others.

Everything DiSC 363® for Leaders Research Report ©2016 by John Wiley & Sons, Inc. All rights reserved.
19
Table 12. Overall Mean Ratings by Leadership Ability
Mean Rating Overall Rating
Other Rating Self Rating Difference
Bottom 25% 4.85 5.41 -0.56 Middle 50% 5.71 5.59 0.12 Top 25% 6.34 5.77 0.57
Correlations with Ratings of Leadership Effectiveness
Raters were asked to rate leaders on three global leadership effectiveness variables. The raters were asked to rate
the degree to which they agreed or disagreed with each of these three statements: “[This person] is a good
leader,” “[This person] is respected in the organization as a good leader,” and “I enjoy working with [this person].”
Each leader’s ratings on these questions were then correlated with his or her scores on the approach scales and
are included in Table 13.
Table 13. Correlation between Approach Scales and Overall Effectiveness
Outcome Variables
Approach Good Leader
Respected as Good Leader
Enjoy Working With
Pioneering .70 .66 .51
Energizing .72 .69 .57
Affirming .66 .65 .63
Inclusive .63 .64 .65
Humble .57 .61 .56
Deliberate .66 .69 .58
Resolute .60 .58 .42
Commanding .61 .58 .35
Everything DiSC 363® for Leaders Research Report ©2016 by John Wiley & Sons, Inc. All rights reserved.
20
All of the approach scales show sizable correlations with the first two effectiveness variables (i.e., ‘Good Leader’
and ‘Respected as a Good Leader’) and at least moderate correlations with the third variable (i.e., ‘Enjoy Working
With’). These findings suggest that the approaches do, in fact, have a strong relationship with perceived
leadership ability. It is not surprising that some approaches, like Commanding and Resolute, are less correlated
with relationship enjoyment, as these approaches are often correlated with personal attributes such as
aggressiveness and stubbornness.
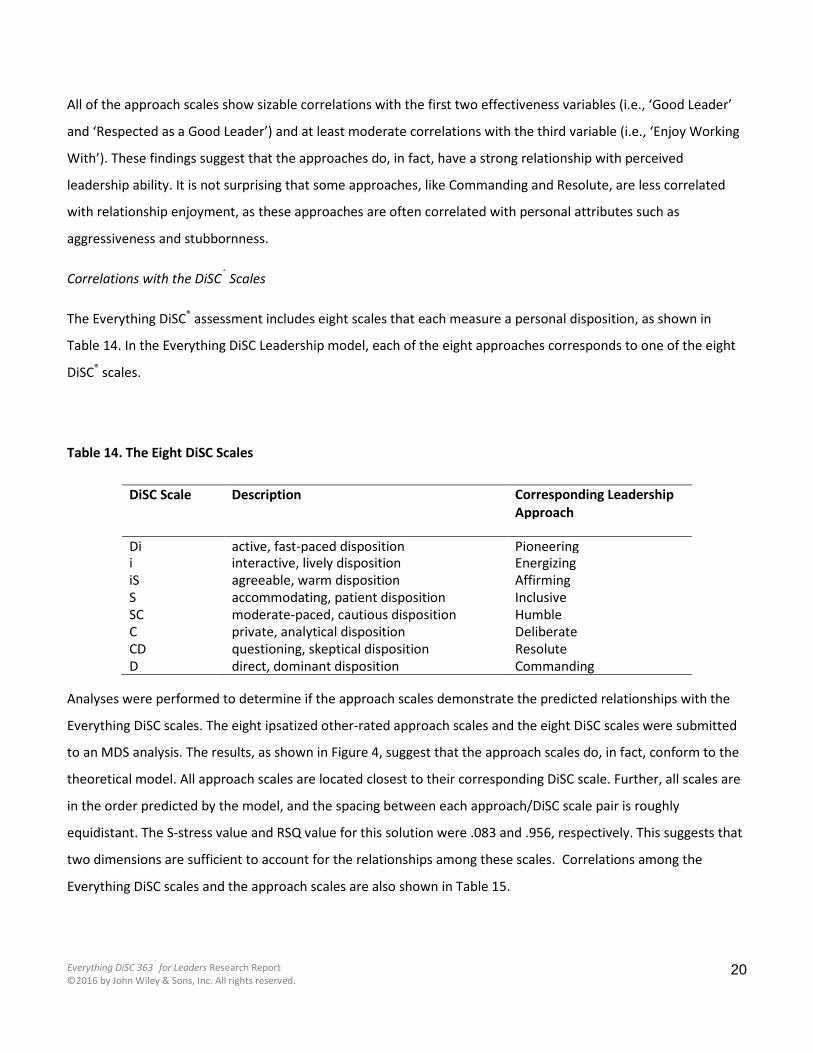
Correlations with the DiSC® Scales
The Everything DiSC® assessment includes eight scales that each measure a personal disposition, as shown in
Table 14. In the Everything DiSC Leadership model, each of the eight approaches corresponds to one of the eight
DiSC® scales.
Table 14. The Eight DiSC Scales
Analyses were performed to determine if the approach scales demonstrate the predicted relationships with the
Everything DiSC scales. The eight ipsatized other-rated approach scales and the eight DiSC scales were submitted
to an MDS analysis. The results, as shown in Figure 4, suggest that the approach scales do, in fact, conform to the
theoretical model. All approach scales are located closest to their corresponding DiSC scale. Further, all scales are
in the order predicted by the model, and the spacing between each approach/DiSC scale pair is roughly
equidistant. The S-stress value and RSQ value for this solution were .083 and .956, respectively. This suggests that
two dimensions are sufficient to account for the relationships among these scales. Correlations among the
Everything DiSC scales and the approach scales are also shown in Table 15.
DiSC Scale Description Corresponding Leadership Approach
Di active, fast-paced disposition Pioneering i interactive, lively disposition Energizing iS agreeable, warm disposition Affirming S accommodating, patient disposition Inclusive SC moderate-paced, cautious disposition Humble C private, analytical disposition Deliberate CD questioning, skeptical disposition Resolute D direct, dominant disposition Commanding

Everything DiSC 363® for Leaders Research Report ©2016 by John Wiley & Sons, Inc. All rights reserved.
21
Figure 4. MDS Results for Approach Scales and Everything DiSC® Scales.
Table 15. Correlations among Everything DiSC Scales and Approach Scales
DI scale
I scale
IS scale
S scale
SC scale
C scale
CD scale
D scale
Pioneering .41 .18 -.13 -.25 -.40 -.18 .05 .27 Energizing .44 .58 .30 -.11 -.41 -.52 -.31 .00 Affirming -.03 .31 .52 .34 .06 -.32 -.40 -.42 Inclusive -.29 -.10 .40 .49 .35 .01 -.23 -.52 Humble -.44 -.37 .11 .42 .49 .27 -.05 -.35 Deliberate -.41 -.50 -.24 .11 .37 .50 .22 -.04 Resolute -.01 -.21 -.49 -.41 -.06 .29 .38 .43 Commanding .29 .10 -.44 -.56 -.39 -.03 .33 .59
Note: Approach scales are ipsatized.

Everything DiSC 363® for Leaders Research Report ©2016 by John Wiley & Sons, Inc. All rights reserved.
22
Differences Based on Demographics
A series of ANOVAs were conducted to examine the degree to which scale scores were related to gender and
ethnicity. A special sample was used for this analysis, which included 594 men and 540 women. Total sample size
was 1134. Sample sizes for different ethnic groups were as follows: Asian American = 28, African American = 60,
Caucasian = 1009, Hispanic = 37.
With regard to gender, analyses showed that women received higher scores on all eight approach scales and all
24 practice scales. Differences, though statistically significant, were not large on a practical level. The median
difference for the approach scales was 0.20, and the median difference on the practice scales was 0.23. Across all
scales, differences ranged from 0.07 to 0.31.
With regard to ethnicity, statistically significant differences (p<=.05) were found on one of the approach scales
(i.e., Commanding (p=.03) and three of the practice scales (i.e., Speaking up about Problems (p=.006), Showing
Confidence (p=.03), and Taking Charge (p=.02)). On the Commanding scale, lower scores were achieved by Asian
Americans and higher scores were achieved by Hispanics. The difference between the highest and lowest mean
scores was 0.45. This pattern of differences was repeated for each of the three practice scales mentioned above.
Although this may reflect real population differences, it is also entirely possible that these observed differences
were related to small sample sizes of Asian Americans and Hispanics.
Summary
Analyses support the reliability of the 363 for Leaders assessment. The reliabilities for all eight approach scales
show excellent reliabilities for both the rater and leader groups. The practice scales show excellent reliability for
the rater groups and decent to good reliability for the leader group. Analyses also support the validity of the
Everything DiSC® Leadership model and the ability of the 363 for Leaders assessment to measure the scale in that
model. Multidimensional scaling results demonstrate that the approach and practice scales are arranged in a
manner consistent with the model. The proposed correlations among scales were also supported by scale
intercorrelations. In addition, the correlation among the approach scales and the eight DiSC® scales conforms to
the Everything DiSC Leadership model.

Everything DiSC 363® for Leaders Research Report ©2016 by John Wiley & Sons, Inc. All rights reserved.
23
Appendix 1. Validation Sample Demographics
Gender % Female 47 Male 53 Age 18 - 25 2 26 - 35 16 36 - 45 32 46 - 55 33 56 or older 18 Education College Graduate 47 Graduate/Professional Degree 33 High School Graduate 5 Some College 12 Some High School 1 Technical/Trade school 3 Ethnicity African American 5 Asian American 1 Caucasian 87 Hispanic 2 Native American 1 Other 4 Employment Executive 27 Mid-level Management 31 Professional 18 Supervisory 6 Other 17 Industrial
Business Services 14 Construction 4 Educational Services 8 Finance/Insurance/Real
12
Health Services 19 Hospitality 3 Manufacturing 14 Public Administration 3 Transportation/Utilities 2 Wholesale/Retail Trade 6 Other 16

Everything DiSC 363® for Leaders Research Report ©2016 by John Wiley & Sons, Inc. All rights reserved.
24
Appendix 2. References
Wiggins, J. S. (1995). Interpersonal adjective scales: Professional manual. Odessa, FL:
Psychological Assessment Resources, Inc.