evertz report front back cover 2017 rv the expanding internet protocol television (“iptv”)...
TRANSCRIPT

C
M
Y
CM
MY
CY
CMY
K
EVERTZ REPORT_Front_Back Cover_2017_RV.pdf 1 2017-09-07 9:38 PM

C
M
Y
CM
MY
CY
CMY
K
EVERTZ REPORT_Inside Front_Back Cover_CMKY_2017_RV2.pdf 1 2017-09-07 9:22 PM

1
52.960.2
64.366.9
73.7
13 14 15 16 17
EVERTZ TECHNOLOGIES LIMITED2017 ANNUAL REPORT
A LETTER TO FELLOW SHAREHOLDERSEvertz had a very successful Fiscal 2017, delivering technological innovation, operational excellence and a fifth consecutive revenue growth year. Evertz is a world leader in the video technology sector. Through product innovations and state of the art project deployments, Evertz is able to help its customers navigate and benefit from technology transitions and challenges in the market. Evertz has developed software defined IP, IT and virtualized public/private/hybrid “Cloud” based solutions which lead the industry.
In Fiscal 2017 Evertz generated record revenues. We maintained industry leading profitability and expanded our market while delivering significant value to shareholders. Highlights from the year include:
• Record annual revenues of $384 million;
• Earnings before taxes of $94 million;
• Annual investment in research and development increased 10% to $74 million;
• Our dedicated staff grew to 1,538;
• Year-end net cash and cash equivalents of $54 million;
• Distribution of excess cash flow through quarterly dividends totaling $0.72 per share during the year; and
• Return to shareholders of excess capital through a special dividend of $1.10 per share.
R&D INVESTMENTS OVER 5 YEARS$ millions
IP, IT & “CLOUD” BASED TECHNICAL TRANSITION EXPANDS MARKET Evertz foundation of unsurpassed video domain knowledge coupled with our commitment to the internal development of new leading edge technologies is a unique competitive advantage. In the past year alone, Evertz invested $74 million in R&D and over $317 million throughout the past five years. The annual investments fueled development activities within our core product portfolio and funded intensive longer term R&D initiatives, such as: high performance low latency IP networking technologies; our IT based and virtualized “Cloud” architectures; Playout & Content Management; DreamCatcher Replay & Production; and Compression and Media Transport Solutions. These initiatives are enabling our customers to efficiently transition to IP, IT and public/private/hybrid “Cloud” based solutions. We believe the hyper-scale EXE together with our modular Software Defined Video Networking (SDVN) platforms; inSITE big data analytics engine; DreamCatcher IP based replay and production suite; and the introduction of SDVN based AV distribution solutions through evertzAV, will significantly expand our addressable market and have a long-term benefit to Evertz customers and our shareholders.
VIDEO PROLIFERATION, UltraHD, LIVE CONTENT, TV EVERYWHERE & IP VIDEO Today our customers’ evolving needs are driven by an unsatiated global demand for high-definition television channels, more live content and by an increasing consumer appetite for high quality video delivered anywhere, anytime across a broad array of devices. Evertz solutions provide compelling advantages which enable our broadcast, cable, telco, IPTV, satellite, content creator and new media customers to address this increasingly complex video landscape.
EVERTZ REPORT_2017_PRINT_RV2.indd 1 2017-09-07 9:40 PM

2 EVERTZ TECHNOLOGIES LIMITED2017 ANNUAL REPORT
IP, IT & “CLOUD” LEADERSHIP - DESIGNED, DELIVERED AND DEPLOYED Evertz is at the forefront of the IP, IT and Virtualized “Cloud” technical transition for the broadcast and new media industry with an extensive 10/25/100 Gigabit Ethernet product portfolio leveraging Evertz Software Defined Video Networking solution with the industry’s leading orchestration and control. Evertz SDVN technology is deployed in industry leading facilities across the world. MAGNUM, Evertz’ orchestration and control application bridges the major components in a hybrid or all IP based facility including Evertz switch fabrics, media IP gateways, and traditional broadcast products. Evertz is designing, delivering and deploying the most advanced and innovative IP, IT and public/private/hybrid “Cloud” based solutions to help broadcast, new media, higher education and enterprise customers future-proof their facilities for the transitioning and growing landscape of television and high quality video anywhere, anytime on any device.
2015-2016 Emmy® Award for Technology & Engineering – Awarded by NATAS (“National Academy of Television Arts and Sciences”) in January 2017 to Evertz IP Based Production System / DreamCatcher, acknowledging Evertz’s industry leading work in Live Production Technology Beyond HD to Achieve Non-Interpolated Video for Instant Replay through the use of the company’s DreamCatcher Replay and Live Production Suite.
INDUSTRY RECOGNITION
TV Technology - 2017 Best of Show awards to Evertz’ Remote Production and DreamCatcher Live Editing Platforms.
Industry recognition for Evertz leadership and innovation this year included a prestigious 2017 IABM Game Changer Award for Evertz’ new public cloud playout and non-linear delivery solution built around the Mediator-X, Overture-RT LIVE, and Render-X systems. The solution has been developed in partnership with global media company Discovery Communications, who is working with Evertz to migrate its broadcast playout and channel origination to Amazon Web Services (AWS). This game changing solution enables virtualized playout in public, private, and hybrid cloud architectures giving media companies the agility and flexibility to dynamically scale their operations.
Evertz was named a Platinum Member of Canada’s 50 Best Managed Companies, which recognizes excellence in Canadian-owned and Canadian-managed companies. Canada’s 50 Best Managed Companies identifies Canadian corporate success through companies focused on their core vision, creating stakeholder value and excelling in the global economy.
FOUNDATION FOR GROWTH As a market leader, we make the tough choices to position Evertz for where the market is going, to extend our competitive lead, by providing our customers with clean, technologically superior solutions. As the market leader, we are well positioned with numerous, large exciting opportunities to capitalize on this in the coming year. Evertz is built upon the long term vision of generating value and sustainable success through continuous investment in technology while maintaining a vigilant focus on operating discipline.
We generate significant cash from operations and maintain a pristine balance sheet. We view this financial strength as a competitive advantage, providing flexibility and allowing us to deliver significant value to our shareholders through the continued payment of dividends, while adhering to our strategy of investment into new technologies.
EVERTZ REPORT_2017_PRINT_RV2.indd 2 2017-09-07 9:40 PM

3 EVERTZ TECHNOLOGIES LIMITED2017 ANNUAL REPORT
Douglas A. DeBruin Executive Chairman
Romolo Magarelli Director, President and Chief Executive Officer
EVOLVING & TRANSITIONING MARKETOur 2018 plan is to leverage and expand upon the high profile industry leading IP, IT installations and virtualized “Cloud” solutions Evertz has successfully deployed with key customers and gain broader adoption with the broadcast industry and within vertical markets.
Key customer deployments to build upon:
• IP based Software Defined Video Networking platforms;
• IT based workflow and virtualized “Cloud” services including the first-of-its-kind Public Cloud Playout;
• Media eXchange compression platform;
• DreamCatcher – IP based instant replay & live production suite; and
• evertzAV – network based, high quality audio visual solutions. These technologies provide superior solutions enabling our customers to address and implement complex multi-platform TV everywhere services and to efficiently transition to evolving IP & IT based solutions including virtualized “Cloud” services.
We are excited to enter fiscal 2018 with significant momentum of Evertz IP, IT & “Cloud” based solutions Designed, Delivered and Deployed with influential industry leaders across the world. As a leading innovator and one of the largest pure players in our technology sector, we believe Evertz is in a position of strength to deliver, to customers and to shareholders!
We would like to take this opportunity to thank our employees, channel partners, customers and shareholders for their continued support and we look forward to an exciting, successful future.
EVERTZ REPORT_2017_PRINT_RV2.indd 3 2017-09-07 9:40 PM

4 EVERTZ TECHNOLOGIES LIMITED2017 ANNUAL REPORT
THE FOLLOWING MANAGEMENT’S DISCUSSION AND ANALYSIS IS A REVIEW OF RESULTS OF THE OPERATIONS AND THE
LIQUIDITY AND CAPITAL RESOURCES OF THE COMPANY. IT SHOULD BE READ IN CONJUNCTION WITH THE SELECTED
CONSOLIDATED FINANCIAL INFORMATION AND OTHER DATA AND THE COMPANY’S CONSOLIDATED FINANCIAL STATEMENTS
AND THE ACCOMPANYING NOTES CONTAINED ON SEDAR. THE CONSOLIDATED FINANCIAL STATEMENTS OF THE COMPANY
ARE PREPARED IN ACCORDANCE WITH INTERNATIONAL FINANCIAL REPORTING STANDARDS (“IFRS”) AND ARE PRESENTED
IN CANADIAN DOLLARS. THE FISCAL YEAR OF THE COMPANY ENDS ON APRIL 30 OF EACH YEAR. CERTAIN INFORMATION
CONTAINED HEREIN IS FORWARD-LOOKING AND BASED UPON ASSUMPTIONS AND ANTICIPATED RESULTS THAT ARE SUBJECT
TO RISKS, UNCERTAINTIES AND OTHER FACTORS. SHOULD ONE OR MORE OF THESE UNCERTAINTIES MATERIALIZE OR SHOULD
THE UNDERLYING ASSUMPTIONS PROVE INCORRECT, ACTUAL RESULTS MAY VARY SIGNIFICANTLY FROM THOSE EXPECTED.
FORWARD-LOOKING STATEMENTS The report contains forward-looking statements reflecting Evertz’s objectives, estimates and expectations. Such forward-looking statements use words such as “may”, “will”, “expect”, “believe”, “anticipate”, “plan”, “intend”, “project”, “continue” and other similar terminology of a forward-looking nature or negatives of those terms.
Although management of the Company believes that the expectations reflected in such forward-looking statements are reasonable, all forward-looking statements address matters that involve known and unknown risks, uncertainties and other factors. Accordingly, there are or will be a number of significant factors which could cause the Company’s actual results, performance or achievements, or industry results to be materially different from any future results, performance or achievements expressed or implied by such forward-looking statements.
The report is based on information available to management on June 13, 2017.
MANAGEMENT’S DISCUSSION AND ANALYSISFor the Year ended April 30, 2017
EVERTZ REPORT_2017_PRINT.indd 4 2017-09-06 12:47 PM

5 EVERTZ TECHNOLOGIES LIMITED2017 ANNUAL REPORT
OVERVIEW Evertz is a leading solutions provider to the television broadcast, telecommunications and new-media industries. Founded in 1966, Evertz is a leading supplier of software, equipment and technology solutions to content creators, broadcasters, specialty channels and television service providers. Evertz designs, manufactures and markets video and audio infrastructure solutions for the production, post-production and transmission of television content. The Company’s solutions are purchased by content creators, broadcasters, specialty channels and television service providers to support their increasingly complex multi-channel digital and high definition television (“HDTV/Ultra HD”) and next generation high bandwidth low latency IP network environments and by telecommunications and new-media companies. The Company’s products allow its customers to generate additional revenue while reducing costs through the more efficient signal routing, distribution, monitoring and management of content as well as the automation of previously manual processes. The Company made early research and development investments to establish itself as the leading supplier to the broadcast industry addressing the ongoing technical transition to IP and IT based production, workflow and distribution systems helping to create more efficient and agile workflows enabling the proliferation of high quality video emerging Ultra HD, High Dynamic range initiatives. The Company has maintained its track record of rapid innovation; is a leader in the expanding Internet Protocol Television (“IPTV”) market and a leader in Software Defined Video Network (“SDVN”) technology. The Company is committed to maintaining its leadership position, and as such, a significant portion of the Company’s staff is focused on research and development to ensure that the Company’s products are at the forefront of the industry. This commitment contributes to the Company being consistently recognized as a leading broadcast and video networking industry innovator by its customers. SIGNIFICANT ACCOUNTING POLICIES Outlined below are those policies considered particularly significant: Basis of Measurement These financial statements have been prepared on the historical cost basis except for certain financial assets and liabilities which are stated at fair value. Historical cost is generally based on the fair value of the consideration given in exchange for assets. Functional and Presentation Currency These financial statements are presented in Canadian dollars, which is the Company’s functional currency. All financial information presented in Canadian dollars has been rounded to the nearest thousand, except per share amounts. Basis of Consolidation These financial statements incorporate the financial statements of the Company and entities controlled by the Company (its subsidiaries). Control is achieved where the Company has power over an entity, has exposure or rights to variable returns from its involvement with the entity and has the ability to use its power over the entity to affect the amount of the investor’s returns. The results of subsidiaries acquired or disposed of are included in the consolidated statements of earnings and comprehensive earnings from the effective date of acquisition of control and up to the effective date of disposal of control, as appropriate. Total comprehensive earnings of subsidiaries is attributed to the owners of the Company and to the non-controlling interests even if this results in the non-controlling interests having a deficit balance. All intra-Company transactions, balances, income and expenses are eliminated in full on consolidation.
5 EVERTZ TECHNOLOGIES LIMITED2017 ANNUAL REPORT
EVERTZ REPORT_2017_PRINT.indd 5 2017-09-06 12:47 PM

6 EVERTZ TECHNOLOGIES LIMITED2017 ANNUAL REPORT
MANAGEMENT’S DISCUSSION AND ANALYSIS (CONT’D)
Business CombinationsBusiness combinations are accounted for using the acquisition method. The cost of the acquisition is measured at the aggregate of the fair values, at the date of acquisition, of assets transferred, liabilities incurred or assumed, and equity instruments issued by the Company. The acquiree’s identifiable assets and liabilities assumed are recognized at their fair value at the acquisition date. Acquisition-related costs are recognized in earnings as incurred. Any contingent consideration is measured at fair value on date of the acquisition and is included as part of the consideration transferred. The fair value of the contingent consideration liability is re-measured at each reporting date with corresponding gain/loss recognized in earnings. The excess of the consideration over the fair value of the net identifiable assets and liabilities acquired is recorded as goodwill.
On an acquisition by acquisition basis, any non-controlling interest is measured either at the fair value of the non-controlling interest or at the fair value of the proportionate share of the net identifiable assets acquired. Goodwill arising on an acquisition of a business is carried at cost as established at the date of acquisition of the business less accumulated impairment losses, if any.
Revenue RecognitionRevenue is measured at the fair value of consideration received or receivable, net of discounts and after eliminating intercompany sales.
Where revenue arrangements have separately identifiable components, the consideration received or receivable is allocated to each identifiable component and the applicable revenue recognition criteria are applied to each of the components.
Revenue is derived from the sale of hardware and software solutions including related services, training and commissioning. Revenue from sales of hardware and software are recognized upon shipment, provided that the significant risks and rewards of ownership have been transferred to the customer, the Company retains neither continuing managerial involvement to the degree usually associated with ownership nor effective control over the goods sold, revenue can be reliably measured and its probable that the economic benefits will flow to the Company. Service revenue is recognized as services are performed.
Certain of the Company’s contracts are long-term in nature. When the outcome of the contract can be assessed reliably, the Company recognizes revenue on long-term contracts using the percentage of completion method, based on costs incurred relative to the estimated total contract costs. When the outcome of the contract cannot be assessed reliably contract costs incurred are immediately expensed and revenue is recognized only to the extent that costs are considered likely to be recovered.
Finance IncomeInterest revenue is recognized when it is probable that the economic benefits will flow to the Company and the amount of revenue can be measured reliably. Interest revenue is accrued on a time basis, by reference to the principal outstanding and at the effective interest rate applicable, which is the rate that exactly discounts estimated future cash receipts through the expected life of the financial asset to that asset’s net carrying amount on initial recognition.
Cash and Cash EquivalentsCash and cash equivalents include cash on hand and in the bank, net of outstanding bank overdrafts.
InventoriesInventories consist of raw materials and supplies, work in progress and finished goods. Inventories are stated at the lower of cost and net realizable value. Cost is determined on a weighted average basis and includes raw materials, the cost of direct labour applied to the product and the overhead expense.
Net realizable value represents the estimated selling price for inventories less all estimated costs of completion and costs necessary to make the sale.
EVERTZ REPORT_2017_PRINT.indd 6 2017-09-06 12:47 PM

7 EVERTZ TECHNOLOGIES LIMITED2017 ANNUAL REPORT
Property, Plant and EquipmentProperty, plant and equipment are stated at cost less accumulated depreciation and any recognized impairment loss. Where the costs of certain components of an item of property, plant and equipment are significant in relation to the total cost of the item, they are accounted for and depreciated separately. Depreciation expense is calculated based on depreciable amounts which is the cost of an asset less residual value and is recognized in earnings on a straight-line basis over the estimated useful life of the related asset. Borrowing costs are capitalized to the cost of qualifying assets that take a substantial period of time to be ready for their intended use.
The estimated useful lives are as follows:
Asset Basis RateOffice furniture and equipment Straight-line 10 yearsResearch and development equipment Straight-line 5 yearsMachinery and equipment Straight-line 5 - 15 yearsLeaseholds Straight-line 5 yearsBuilding Straight-line 10 - 40 yearsAirplanes Straight-line 10 - 20 years
The gain or loss arising on the disposal or retirement of an asset is determined as the difference between the sales proceeds and the carrying amount of the asset and is recognized in earnings.
The Company reviews the residual value, estimated useful life and the depreciation method at least annually.
Impairment of Non-Financial AssetsGoodwill is tested for impairment annually, or whenever events or changes in circumstances indicate that the carrying amount may be more than its recoverable amount. At each reporting period, the Company reviews the carrying amounts of its other non-financial assets to determine whether there is any indication that those assets have suffered an impairment loss. If any such indication exists, the recoverable amount of the asset is estimated in order to determine the extent of the impairment loss (if any). Where the asset does not generate cash inflows that are largely independent from other assets, the Company estimates the recoverable amount of the cash-generating unit (“CGU”) to which the asset belongs. Goodwill is allocated to a group of CGU’s based on the level at which it is monitored for internal reporting purposes.
Recoverable amount is the higher of fair value less costs to sell and value in use. In assessing value in use, the estimated future cash flows are discounted to their present value using a pre-tax discount rate that reflects current market assessments of the time value of money and the risks specific to the asset for which the estimates of future cash flows have not been adjusted.
If the recoverable amount of an asset or CGU is estimated to be less than its carrying amount, the carrying amount of the asset or CGU is reduced to its recoverable amount. An impairment loss relating to a CGU to which goodwill has been allocated, is allocated to the carrying amount of the goodwill first. An impairment loss is recognized immediately in earnings.
An impairment loss in respect of goodwill is not reversed. Where an impairment loss subsequently reverses for other non-financial assets, the carrying amount of the asset or CGU is increased to the revised estimate of its recoverable amount, but so that the increased carrying amount does not exceed the carrying amount that would have been determined had no impairment loss been recognized for the asset or CGU in prior years. A reversal of an impairment loss is recognized immediately in earnings.
EVERTZ REPORT_2017_PRINT.indd 7 2017-09-06 12:47 PM

8 EVERTZ TECHNOLOGIES LIMITED2017 ANNUAL REPORT
MANAGEMENT’S DISCUSSION AND ANALYSIS (CONT’D)
Intangible AssetsIntangible AssetsIntangible assets represent intellectual property acquired through business acquisitions and are recorded at cost less any impairment loss and are amortized using the straight–line method over a four–year period. The estimated useful life and amortization method are reviewed at the end of each reporting period.
Research and DevelopmentAll research and development expenditures are expensed as incurred unless a development project meets the criteria for capitalization. Development expenditures are capitalized only if development costs can be measured reliably, the product or process is technically and commercially feasible, future economic benefits are probable and the Company intends to and has sufficient resources to complete development and to use or sell the asset. No internally generated intangible assets have been recognized to date.
Research and development expenditures are recorded gross of investment tax credits and related government grants. Investment tax credits for scientific research and experimental development are recognized in the period the qualifying expenditures are incurred if there is reasonable assurance that they will be realized.
ProvisionsProvisions are recognized when the Company has a present obligation (legal or constructive) as a result of a past event, it is probable that the Company will be required to settle that obligation and a reliable estimate can be made of the amount of the obligation.
The amount recognized as a provision is the best estimate of the consideration required to settle the present obligation at the reporting period, taking into account the risks and uncertainties surrounding the obligation. Where a provision is measured using the cash flows estimated to settle the present obligation, its carrying amount is the present value of those cash flows.
When some or all of the economic benefits required to settle a provision are expected to be recovered from a third party, a receivable is recognized as an asset if it is virtually certain that reimbursement will be received and the amount of the receivable can be measured reliably.
Leasing Leases are classified as finance leases whenever the terms of the lease transfer substantially all the risks and rewards of ownership to the lessee. All other leases are classified as operating leases.
Assets held under finance leases are recognised as assets of the Company at their fair value or, if lower, at the present value of the minimum lease payments, each determined at the inception of the lease. The corresponding liability to the lessor is included in the statement of financial position as a finance lease obligation.
Rentals payable under operating leases are charged to earnings on a straight-line basis over the term of the relevant lease.
Foreign Currency TranslationThe individual financial statements of each subsidiary entity are presented in the currency of the primary economic environment in which the entity operates (its functional currency). For the purpose of the consolidated financial statements, the results and financial position of each group entity are presented in Canadian dollars (“CDN”), which is the functional currency of the parent Company and the presentation currency for the financial statements.
In preparing the financial statements of the individual entities, transactions in currencies other than the entity’s functional currency (foreign currencies) are recognized at the rates of exchange prevailing at the dates of the transactions. At the end of each reporting period, monetary items denominated in foreign currencies are retranslated at the rates prevailing at that date. Exchange differences are recognized in earnings in the period in which they arise. Non-monetary items that are measured in terms of historical cost in a foreign currency are not retranslated.
EVERTZ REPORT_2017_PRINT.indd 8 2017-09-06 12:47 PM

9 EVERTZ TECHNOLOGIES LIMITED2017 ANNUAL REPORT
For the purpose of presenting consolidated financial statements, the assets and liabilities of the Company’s foreign operations are expressed in Canadian dollars using exchange rates prevailing at the end of the reporting period. Income and expense items are translated at the average exchange rates for the period. Foreign currency gains and losses are recognized in other comprehensive earnings. The relevant amount in cumulative foreign currency translation adjustment is reclassified into earnings upon disposition or partial disposition of a foreign operation and attributed to non-controlling interests as appropriate.
Income TaxesCurrent TaxThe tax currently payable is based on taxable profit for the year. Taxable profit differs from net earnings as reported in the statement of earnings because it excludes items of income or expense that are taxable or deductible in other years and it further excludes items that are never taxable or deductible. The Company’s liability for current tax is calculated using tax rates that have been enacted or substantively enacted by the statement of financial position date.
Deferred TaxDeferred tax is the tax expected to be payable or recoverable on unused tax losses and credits, as well as differences between the carrying amounts of assets and liabilities in the financial statements and the corresponding tax bases used in the computation of taxable profit. Deferred tax liabilities are generally recognized for all taxable temporary differences and deferred tax assets are recognized to the extent that it is probable that taxable profits will be available against which unused tax losses, credits and other deductible temporary differences can be utilized. Such assets and liabilities are not recognized if the temporary difference arises from the initial recognition of goodwill or from the initial recognition (other than in a business combination) of other assets and liabilities in a transaction that affects neither the taxable profit nor the accounting profit.
The carrying amount of deferred tax assets is reviewed at each reporting period and reduced to the extent that it is no longer probable that sufficient taxable profits will be available to allow all or part of the asset to be recovered.
Deferred tax is calculated at the tax rates that are expected to apply in the period when the liability is settled or the asset is realized. The measurement of deferred tax liabilities and assets reflects the tax consequences that would follow from the manner in which the Company expects, at the end of the reporting period, to recover or settle the carrying amount of its assets and liabilities. Deferred tax is charged or credited to earnings, except when it relates to items charged or credited directly to other comprehensive earnings or equity, in which case the deferred tax is also dealt with in other comprehensive earnings or equity.
Share Based Compensation Equity settled share based payments to employees and others providing similar services are measured at the fair value of the equity instruments at the grant date. Details regarding the determination of the fair value of equity settled share based transactions are set out in note 13.
The fair value determined at the grant date of the equity settled share based payments is expensed on a straight-line basis over the vesting period of the option based on the Company’s estimate of the number of equity instruments that will eventually vest. At each reporting period, the Company revises its estimate of the number of equity instruments expected to vest. The impact of the revision of the original estimates, if any, is recognized in earnings such that the cumulative expense reflects the revised estimate, with a corresponding adjustment to share based payment reserve.
Cash settled share based earnings to employees or others providing similar services are measured at the fair value of the instruments at the grant date. The fair value is recognized as an expense with a corresponding increase in liabilities over the vesting period of the option grant. At each reporting period, the Company revises its estimate of fair value and the number of instruments expected to vest. The impact of the revision of the original estimates, if any, is recognized in earnings such that the cumulative expense reflects the revised estimate, with a corresponding adjustment to liabilities.
Earnings Per Share The Company presents basic and diluted earnings per share (“EPS”) data for its common shares. Basic EPS is calculated by dividing the net earnings attributable to shareholders by the weighted average number of common shares outstanding during the period. Diluted EPS is determined by adjusting the net earnings attributable to shareholders and the weighted average number of common shares outstanding for the effects of all potentially dilutive common shares, which is comprised of share options granted to employees with an exercise price below the average market price.
EVERTZ REPORT_2017_PRINT.indd 9 2017-09-06 12:47 PM

10 EVERTZ TECHNOLOGIES LIMITED2017 ANNUAL REPORT
MANAGEMENT’S DISCUSSION AND ANALYSIS (CONT’D)
Finance CostsFinance costs directly attributable to the acquisition, construction or production of qualifying assets, which are assets that necessarily take a substantial period of time to get ready for their intended use or sale, are added to the cost of those assets, until such time as the assets are substantially ready for their intended use or sale.
Investment income earned on the temporary investment of specific borrowings pending their expenditure on qualifying assets is deducted from the borrowing costs eligible for capitalisation.
All other finance costs are recognized in earnings in the period in which they are incurred.
Investment Tax CreditsThe Company is entitled to investment tax credits, which are earned as a percentage of eligible research and development expenditures incurred in each taxation year. Investment tax credits relate entirely to the Company’s research and development expenses in the consolidated statements of earnings but are presented separately in the consolidated statements of earnings for information purposes. Investment tax credits are recognized and recorded within income tax receivable or as a reduction of income tax payable, when there is reasonable assurance they will be received.
Financial Instruments The Company’s financial assets and liabilities which are initially recorded at fair value and subsequently measured based on their assigned classifications as follows:
Asset/Liability Category Measurement
Cash and cash equivalents Loans and receivables Amortized costTrade and other receivables Loans and receivables Amortized costTrade and other payables Other liabilities Amortized costLong term debt Other liabilities Amortized cost
Financial AssetsAll financial assets are initially measured at fair value, plus transaction costs, except for those financial assets classified as fair value through profit or loss, which are initially measured at fair value. Transaction costs in respect of financial instruments that are classified as fair value through profit or loss are recognized in earnings immediately. Transaction costs in respect of other financial instruments are included in the initial measurement of the financial instrument.
Financial assets are classified into the following specific categories: financial assets “at fair value through profit or loss” (“FVTPL”), “held-to-maturity” investments, “available-for-sale” (“AFS”) financial assets and “loans and receivables”. The classification depends on the nature and purpose of the financial assets and is determined at the time of initial recognition.
Financial assets at FVTPL are stated at fair value, with any gains or losses arising on re-measurement recognized in earnings.
Impairment of Financial AssetsFinancial assets, other than those at FVTPL, are assessed for indicators of impairment at each reporting period. Financial assets are impaired where there is objective evidence that, as a result of one or more events that occurred after the initial recognition of the financial asset, the estimated future cash flows of the investment have been affected. For certain categories of financial assets, such as trade and other receivables, assets that are assessed not to be impaired individually are, in addition, assessed for impairment on a collective basis. Objective evidence of impairment of a financial asset can include a significant or prolonged decline in the fair value of an asset, default or delinquency by a debtor, indication that a debtor will enter bankruptcy or financial re-organization or the disappearance of an active market for a security.
EVERTZ REPORT_2017_PRINT.indd 10 2017-09-06 12:47 PM

11 EVERTZ TECHNOLOGIES LIMITED2017 ANNUAL REPORT
For financial assets carried at amortized cost, the amount of the impairment is the difference between the asset’s carrying amount and the present value of estimated future cash flows, discounted at the financial asset’s original effective interest rate.
The carrying amount of the financial asset is reduced by the impairment loss directly for all financial assets with the exception of trade receivables, where the carrying amount is reduced through the use of an allowance account. When a trade receivable is considered uncollectible, it is written off against the allowance account. Subsequent recoveries of amounts previously written off are credited against the allowance account. Changes in the carrying amount of the allowance account are recognized in earnings.
Financial Liabilities and Equity Instruments Issued by the CompanyFinancial liabilities at FVTPL are stated at fair value, with any gains or losses arising on re-measurement recognized in earnings. The net gain or loss recognized in earnings incorporates any interest paid on the financial liability and is included in the “other income and expenses” line item in the consolidated statements of earnings. An equity instrument is any contract that evidences a residual interest in the assets of an entity after deducting all of its liabilities. Equity instruments issued by the Company are recognized at the proceeds received, net of direct issue costs.
Other financial liabilities, including long term debt, are initially measured at fair value, net of transaction costs. Other financial liabilities are subsequently measured at amortized cost using the effective interest method, with interest expense recognized on an effective yield basis. Use of Estimates and JudgmentsThe preparation of financial statements in conformity with IFRS requires management to make judgments, estimates and assumptions that affect the reported amounts of assets and liabilities and disclosure of contingent assets and liabilities at the date of the financial statements and the reported amounts of revenues and expenses during the year. Consequently, actual results could differ from those estimates. Those estimates and underlying assumptions are reviewed on an ongoing basis. Revisions to accounting estimates are recognized in the period in which the estimate is revised and in any future periods affected. Significant estimates include the determination of the allowance for doubtful accounts for trade receivables, provision for inventory obsolescence, the useful life of property, plant and equipment for depreciation, amortization and valuation of net recoverable amount of property, plant and equipment, determination of fair value for share based compensation, evaluating deferred income tax assets and liabilities, the determination of fair value of financial instruments and the likelihood of recoverability, and the determination of implied fair value of goodwill and implied fair value of assets and liabilities for purchase price allocation purposes and goodwill impairment test purposes.
Significant items requiring the use of judgment in application of accounting policies and assumptions include the determination of functional currencies, classification of financial instruments, classification of leases, application of the percentage of completion method on long-term contracts, degree of componentization applied when calculating amortization of property, plant and equipment, and identification of cash generating units for impairment testing purposes.
Operating SegmentsAn operating segment is a component of the Company that engages in business activities from which it may earn revenues and incur expenses, including revenues and expenses that relate to transactions with any of the Company’s other components. The Company reviewed its operations and determined that it operates a single reportable segment, the television broadcast equipment market. The single reportable operating segment derives its revenue from the sale of hardware and software solutions including related services, training and commissioning.
EVERTZ REPORT_2017_PRINT.indd 11 2017-09-06 12:47 PM

12 EVERTZ TECHNOLOGIES LIMITED2017 ANNUAL REPORT
MANAGEMENT’S DISCUSSION AND ANALYSIS (CONT’D)
CHANGES IN ACCOUNTING POLICIES NEW AND REVISED IFRSs ISSUED BUT NOT YET EFFECTIVE Following is a listing of amendments, revisions and new International Financial Reporting Standards issued but not yet effective. Unless otherwise indicated, earlier application is permitted. The Company has not yet determined the impact of the adoption of the following standards. Income TaxesIAS 12, Income Taxes was amended by the IASB in January, 2016 and clarifies the requirements for recognition of deferred tax assets arising from unrealized losses. Amendments to IAS 12 are effective for annual periods beginning on or after January 1, 2017. Statement of Cash FlowsIAS 7, Statement of Cash Flows was amended by the IASB in January, 2016 and increases disclosure requirements surrounding changes to financing related liabilities. Amendments to IAS 7 are effective for annual periods beginning on or after January 1, 2017. Financial InstrumentsIFRS 9, Financial instruments (“IFRS 9”) was issued by the IASB in July 2014 and will replace IAS 39, Financial Instruments: Recognition and Measurement (“IAS 39”). IFRS 9 introduces new requirements for the financial reporting of financial assets and financial liabilities. IFRS 9 is effective for annual periods beginning on or after January 1, 2018. RevenueIFRS 15, Revenue from contracts with customers (“IFRS 15”) was issued by the IASB in May 2014 and will replace IAS 11, Construction Contracts and IAS 18, Revenue. IFRS 15 specifies how and when revenue will be recognized. IFRS 15 is effective for annual periods beginning on or after January 1, 2018. LeasesIFRS 16, Leases (“IFRS 16”) was issued by the IASB in January 2016 and will replace IAS 17, Leases. IFRS 16 introduces a single accounting model for lessees to bring leases on-balance sheet while lessor accounting remains largely unchanged. IFRS 16 is effective for annual periods beginning on or after January 1, 2019.
EVERTZ REPORT_2017_PRINT.indd 12 2017-09-06 12:47 PM

13 EVERTZ TECHNOLOGIES LIMITED2017 ANNUAL REPORT
YEAR END HIGHLIGHTSRevenue was $384.4 million for the year ended April 30, 2017 an increase of $2.8 million, compared to $381.6 million for the year ended April 30, 2016. Revenue increased in the United States/Canada region by 6%.
For the year ended April 30, 2017, net earnings were $69.8 million a decrease from $70.9 million for the year ended April 30, 2016 and fully diluted earnings per share were $0.92 a decrease from $0.94 for the year ended April 30, 2016.
Gross margin during the year ended April 30, 2017 was 56.7% as compared to 57.0% for the year ended April 30, 2016.
Selling and administrative expenses for the year ended April 30, 2017 was $62.1 million as compared to the year ended April 30, 2016 of $61.0 million. As a percentage of revenue, selling and administrative expenses totaled 16.2% for the year ended April 30, 2017 as opposed to 16.0% for the year ended April 30, 2016.
Research and development (“R&D”) expenses were $73.7 million for the year ended April 30, 2017 as compared to $66.9 million for the year ended April 30, 2016.
Cash and cash equivalents were $54.3 million and working capital was $264.6 million as at April 30, 2017, after payment of dividends of $137.5 million including a special dividend of $83.1 million as compared to cash and cash equivalents of $123.1 million and working capital of $314.9 million as at April 30, 2016.
HIGHLIGHTS FROM THE FOURTH QUARTERRevenue increased by $10.4 million or 11% for the three months ended April 30, 2017 when compared to the same period ended April 30, 2016. Revenue increased in the United States/Canada region by 13%. Revenue increased in the International region by 8%.
Fully diluted EPS was $0.27 for the three months ended April 30, 2017 as compared to $0.11 for the period ended April 30, 2016.
Foreign exchange gain during the quarter was $4.1 million, predominately driven by the increase in value of the US dollar against the Canadian dollar since January 31, 2017.
Selling and administrative expenses increased by $0.2 million for the three months ended April 30, 2017 when compared to the same period ended April 30, 2016. Selling and administrative expenses were approximately 15.4% of revenue for the three months ended April 30, 2017 as compared to approximately 16.9% of revenue for the same period ended April 30, 2016.
Research and development expenses increased by $2.7 million for the three months ended April 30, 2017 when compared to the same period ended April 30, 2016. Research and development expenses represented approximately 18.7% of revenue for the three months ended April 30, 2017 as compared to approximately 17.9% for the same period ended April 30, 2016.
EVERTZ REPORT_2017_PRINT.indd 13 2017-09-06 12:47 PM

14 EVERTZ TECHNOLOGIES LIMITED2017 ANNUAL REPORT
MANAGEMENT’S DISCUSSION AND ANALYSIS (CONT’D)
SELECTED CONSOLIDATED FINANCIAL INFORMATION
(In thousands of dollars except earnings per share and share data)
Year Ended April 30,
2017 2016 2015
Revenue $ 384,432 $ 381,550 $ 363,606 Cost of goods sold 166,288 164,172 157,475 Gross margin 218,144 217,378 206,131 Expenses Selling and administrative 62,135 60,986 58,833 General 8,951 6,200 6,136 Research and development 73,699 66,892 64,332 Investment tax credits (9,362) (10,495) (10,263) Foreign exchange gain (9,887) (2,638) (1,411)
125,536 120,945 117,627 Earnings before undernoted 92,608 96,433 88,504
Finance income 1,321 772 830 Finance costs (242) (534) (240)Other income and expenses (141) 124 325 Earnings before income taxes 93,546 96,795 89,419 Provision for (recovery of) income taxes Current 25,160 24,582 25,154 Deferred (1,387) 1,327 (2,145)
23,773 25,909 23,009 Net earnings for the year $ 69,773 $ 70,886 $ 66,410
Net earnings attributable to non-controlling interest $ 613 $ 667 $ 910 Net earnings attributable to shareholders 69,160 70,219 65,500 Net earnings for the year $ 69,773 $ 70,886 $ 66,410
Earnings per share Basic $ 0.92 $ 0.94 $ 0.88 Diluted $ 0.92 $ 0.94 $ 0.87
EVERTZ REPORT_2017_PRINT.indd 14 2017-09-06 12:47 PM

15 EVERTZ TECHNOLOGIES LIMITED2017 ANNUAL REPORT
CONSOLIDATED BALANCE SHEET DATA
As at April 30,
2017 2016 2015
Cash and cash equivalents $ 54,274 $ 123,102 $ 100,681 Inventory $ 178,208 $ 155,957 $ 154,259 Working capital $ 264,586 $ 314,912 $ 294,895 Total assets $ 410,568 $ 448,314 $ 426,162 Shareholders' equity $ 317,830 $ 366,205 $ 353,471
Number of common shares outstanding: Basic 75,742,746 74,188,746 74,459,346 Fully-diluted 78,621,246 78,595,246 79,195,846
Weighted average number of shares outstanding: Basic 75,040,113 74,360,423 74,399,096 Fully-diluted 75,374,204 74,843,493 75,033,398
EVERTZ REPORT_2017_PRINT.indd 15 2017-09-06 12:47 PM

16 EVERTZ TECHNOLOGIES LIMITED2017 ANNUAL REPORT
MANAGEMENT’S DISCUSSION AND ANALYSIS (CONT’D)
SELECTED CONSOLIDATED FINANCIAL INFORMATION (CONTINUED)CONSOLIDATED STATEMENT OF OPERATIONS DATA
2017 2016 2015
Revenue 100.0% 100.0% 100.0%Cost of goods sold 43.3% 43.0% 43.3%Gross margin 56.7% 57.0% 56.7%Expenses Selling and administrative 16.2% 16.0% 16.2% General 2.2% 1.6% 1.6% Research and development 19.2% 17.5% 17.7% Investment tax credits (2.4%) (2.7%) (2.8%) Foreign exchange gain (2.6%) (0.7%) (0.4%)
32.6% 31.7% 32.3%Earnings before undernoted 24.1% 25.3% 24.4%
Finance income 0.3% 0.2% 0.2%Finance costs (0.1%) (0.1%) (0.1%)Other income and expenses 0.0% 0.0% 0.1%Earnings before income taxes 24.3% 25.4% 24.6%
Provision for (recovery of) income taxes Current 6.5% 6.4% 6.9% Deferred (0.4%) 0.4% (0.6%)
6.1% 6.8% 6.3%
Net earnings for the year 18.2% 18.6% 18.3%
Net earnings attributable to non-controlling interest 0.2% 0.2% 0.3%Net earnings attributable to shareholders 18.0% 18.4% 18.0%Net earnings for the year 18.2% 18.6% 18.3%
Earnings per share: Basic $ 0.92 $ 0.94 $ 0.88 Diluted $ 0.92 $ 0.94 $ 0.87
EVERTZ REPORT_2017_PRINT.indd 16 2017-09-06 12:47 PM

17 EVERTZ TECHNOLOGIES LIMITED2017 ANNUAL REPORT
REVENUE AND EXPENSESREVENUEThe Company generates revenue principally from the sale of software, equipment, and technology solutions to content creators, broadcasters, specialty channels and television service providers.
The Company markets and sells its products and services through both direct and indirect sales strategies. The Company’s direct sales efforts focus on large and complex end-user customers. These customers have long sales cycles typically ranging from four to eight months before an order may be received by the Company for fulfillment.
The Company monitors revenue performance in two main geographic regions: (i) United States/Canada and (ii) International.
The Company currently generates approximately 50% to 60% of its revenue in the United States/Canada. The Company recognizes the opportunity to more aggressively target markets in other geographic regions and intends to invest in personnel and infrastructure in those markets.
While a significant portion of the Company’s expenses are denominated in Canadian dollars, the Company collects substantially all of its revenues in currencies other than the Canadian dollar and therefore has significant exposure to fluctuations in foreign currencies, in particular the US dollar. Approximately 75% to 85% of the Company’s revenues are denominated in US dollars.
REVENUE
Year Ended April 30,
(In thousands of Canadian dollars) 2017 2016 2015
United States/Canada $ 229,082 $ 216,009 $ 204,453 International 155,350 165,541 159,153
$ 384,432 $ 381,550 $ 363,606
Total revenue for the year ended April 30, 2017 was $384.4 million, an increase of $2.8 million or 1% as compared to revenue of $381.6 million for the year ended April 30, 2016.
Revenue in the United States/Canada region was $229.1 million for the year ended April 30, 2017, an increase of $13.1 million or 6% when compared to revenue of $216.0 million for the year ended April 30, 2016.
Revenue in the International region was $155.4 million for the year ended April 30, 2017, a decrease of $10.2 million or 6% as compared to revenue of $165.6 million for the year ended April 30, 2016.
COST OF SALESCost of sales consists primarily of costs of manufacturing and assembly of products. A substantial portion of these costs is represented by components and compensation costs for the manufacture and assembly of products. Cost of sales also includes related overhead, certain depreciation, final assembly, quality assurance, inventory management and support costs. Cost of sales also includes the costs of providing services to clients, primarily the cost of service-related personnel.
GROSS MARGIN
Year Ended April 30,
(In thousands of Canadian dollars, except for percentages) 2017 2016 2015
Gross margin $ 218,144 $ 217,378 $ 206,131 Gross margin % of sales 56.7% 57.0% 56.7%
EVERTZ REPORT_2017_PRINT.indd 17 2017-09-06 12:47 PM

18 EVERTZ TECHNOLOGIES LIMITED2017 ANNUAL REPORT
MANAGEMENT’S DISCUSSION AND ANALYSIS (CONT’D)
Gross margin for the year ended April 30, 2017 was $218.1 million, compared to $217.4 million for the year ended April 30, 2016. As a percentage of revenue, the gross margin was 56.7% for the year ended April 30, 2017, as compared to 57.0% for the year ended April 30, 2016.
Gross margins vary depending on the product mix, geographic distribution and competitive pricing pressures and currency fluctuations. For the year ended April 30, 2017 the gross margin, as a percentage of revenue, was in the Company’s projected range. The pricing environment continues to be very competitive with substantial discounting by our competition.
The Company expects that it will continue to experience competitive pricing pressures. The Company continually seeks to build its products more efficiently and enhance the value of its product and service offerings in order to reduce the risk of declining gross margin associated with the competitive environment.
Operating ExpensesThe Company’s operating expenses consist of: (i) selling, administrative and general; (ii) research and development and (iii) foreign exchange.
Selling expenses primarily relate to remuneration of sales and technical personnel. Other significant cost components include trade show costs, advertising and promotional activities, demonstration material and sales support. Selling and administrative expenses relate primarily to remuneration costs of related personnel, legal and professional fees, occupancy and other corporate and overhead costs. The Company also records certain depreciation and share based compensation charges as general expenses. For the most part, selling, and administrative expenses are fixed in nature and do not fluctuate directly with revenue. The Company has certain selling expenses that tend to fluctuate in regards to the timing of trade shows.
The Company invests in research and development to maintain its position in the markets it currently serves and to enhance its product portfolio with new functionality and efficiencies. Although the Company’s research and development expenditures do not fluctuate directly with revenues, it monitors this spending in relation to revenues and adjusts expenditures when appropriate. Research and development expenditures consist primarily of personnel costs and material costs. Research and development expenses are presented on a gross basis (without deduction of research and development tax credits). Research and development tax credits associated with research and development expenditures are shown separately under research and development tax credits.
SELLING AND ADMINISTRATIVE
Year Ended April 30,
(In thousands of Canadian dollars, except for percentages) 2017 2016 2015
Selling and administrative $ 62,135 $ 60,986 $ 58,833 Selling and administrative % of sales 16.2% 16.0% 16.2%
Selling and administrative expenses excludes stock based compensation, operation of non-production property, plant and equipment, and amortization of intangibles. Selling and administrative expenses for the year ended April 30, 2017 were $62.1 million or 16.2% of revenue, as compared to selling and administrative expenses of $61.0 million or 16.0% of revenue for the year ended April 30, 2016. The increase of $1.1 million was predominantly a result of increased personnel costs.
Share Based CompensationIn March 2016, the Company adopted a restricted share unit (RSU) plan to attract, motivate and compensate persons who are integral to the growth and success of the Company. During the year ended April 30, 2017, share based compensation expense associated with the plan was $3.4 million.
RESEARCH AND DEVELOPMENT (R&D)
Year Ended April 30,
(In thousands of Canadian dollars, except for percentages) 2017 2016 2015
Research and development expenses $ 73,699 $ 66,892 $ 64,332 Research and development % of sales 19.2% 17.5% 17.7%
EVERTZ REPORT_2017_PRINT.indd 18 2017-09-06 12:47 PM

19 EVERTZ TECHNOLOGIES LIMITED2017 ANNUAL REPORT
For the year ended April 30, 2017, gross R&D expenses were $73.7 million, an increase of 10% or $6.8 million as compared to an expense of $66.9 million for the year ended April 30, 2016.
The increase of $6.8 million was predominantly a result of planned growth of R&D personnel, a corresponding increase in materials and additional rent and expenses associated with a new facility, partially offset by decreased translation costs associated with UK Sterling denominated expenses.
Foreign ExchangeFor the year ended April 30, 2017, the foreign exchange gain was $9.9 million, as compared to a foreign exchange gain for the year ended April 30, 2016 of $2.6 million. The current year gain was predominantly driven by the increase in the value of the US dollar against the Canadian dollar since April 30, 2016.
Finance Income, Finance Costs, Other Income and ExpensesFor the year ended April 30, 2017, finance income, finance costs, other income and expenses netted to a gain of $0.9 million.
LIQUIDITY AND CAPITAL RESOURCES Liquidity and Capital Resources
(In thousands of dollars except ratios) Year Ended April 30,
Key Balance Sheet Amounts and Ratios: 2017 2016
Cash and cash equivalents $ 54,274 $ 123,102 Working capital $ 264,586 $ 314,912 Long-term assets $ 62,347 $ 61,257 Long-term debt $ 733 $ 888 Days sales outstanding in accounts receivable 106 93
Statement of Cash Flow Summary
Year Ended April 30,
2017 2016
Operating activities $ 64,513 $ 91,181 Investing activities $ (11,182) $ (3,854)Financing activities $ (119,013) $ (59,439)Net (decrease) increase in cash $ (68,828) $ 22,421
Operating ActivitiesFor the year ended April 30, 2017, the Company generated cash from operations of $64.5 million, compared to cash generated of 91.2 million for the year ended April 30, 2016. Excluding the effects of the changes in non-cash working capital and current taxes, the Company generated cash from operations of $81.1 million for the year ended April 30, 2017 compared to $85.5 million for the year ended April 30, 2016.
Investing ActivitiesThe Company used cash for investing activities of $11.2 million for the year ended April 30, 2017 which was predominantly for the acquisition of capital assets.
Financing ActivitiesFor the year ended April 30, 2017, the Company used cash from financing activities of $119.0 million, which was principally driven by dividends paid of $137.5 million including a special dividend of $83.1 million, partially offset by the issuance of Capital Stock pursuant to the Company’s Stock Option Plan of $18.7 million.
EVERTZ REPORT_2017_PRINT.indd 19 2017-09-06 12:47 PM
$

20 EVERTZ TECHNOLOGIES LIMITED2017 ANNUAL REPORT
MANAGEMENT’S DISCUSSION AND ANALYSIS (CONT’D)
WORKING CAPITAL As at April 30, 2017, the Company had cash and cash equivalents of $54.3 million, compared to $123.1 million at April 30, 2016.
The Company had working capital of $264.6 million as at April 30, 2017 compared to $314.9 million as at April 30, 2016.
The Company believes that the current balance in cash and plus future cash flow from operations will be sufficient to finance growth and related investment and financing activities in the foreseeable future.
Day sales outstanding in accounts receivable were 106 days at April 30, 2017 as compared to 93 for April 30, 2016.
SHARE CAPITAL STRUCTUREAuthorized capital stock consists of an unlimited number of common and preferred shares.
Year Ended April 30,
2017 2016
Common shares 75,742,746 74,188,746Stock options granted and outstanding 2,878,500 4,406,500
FINANCIAL INSTRUMENTSThe Company’s financial instruments consist of cash and cash equivalents, trade and other receivables, trade and other payables and long term debt. Unless otherwise noted, it is management’s opinion that the Company is not exposed to significant interest or credit risks arising from these financial instruments. The Company estimates the fair value of these instruments approximates the carrying values as listed below.
Fair Values and Classification of Financial Instruments: The following summarizes the significant methods and assumptions used in estimating the fair values of financial instruments:
I. Quoted prices (unadjusted) in active markets for identical assets or liabilities.
II. Inputs other than quoted prices included in level I that are observable for the asset or liability, either directly or indirectly. Cash and cash equivalents, trade and other receivables, trade and other payables, and long-term debt fair value measurements have been measured within level II.
III. Inputs for the asset or liability that are not based on observable market data.
CONTRACTUAL OBLIGATIONSThe following table sets forth the Company’s contractual obligations as at April 30, 2017:
Payments Due by Period
(In thousands) TotalLess than
1 year 2-3 Years 4-5 Years Thereafter
Operating leases $ 20,872 $ 5,229 $ 6,472 $ 3,834 $ 5,337 Other long-term debt 1,013 280 412 321 -
$ 21,885 $ 5,509 $ 6,884 $ 4,155 $ 5,337
EVERTZ REPORT_2017_PRINT.indd 20 2017-09-06 12:47 PM

21 EVERTZ TECHNOLOGIES LIMITED2017 ANNUAL REPORT
OFF-BALANCE SHEET FINANCINGThe Company does not have any off-balance sheet arrangements.
RELATED PARTY TRANSACTIONSIn the normal course of business, we may enter into transactions with related parties. These transactions occur under market terms consistent with the terms of transactions with unrelated arms-length third parties. The Company continues to lease a premise from a company in which two shareholders’ each indirectly hold a 10% interest, continues to lease a facility from a company in which two shareholders each indirectly hold a 20% interest, continues to lease two facilities for manufacturing where two shareholders indirectly own 100% interest, continues to lease a facility from a company in which two shareholders each indirectly own a 35% interest, continues to lease a facility with a director who indirectly owns 100% and continues to lease a facility owned indirectly by two shareholders.
SELECTED CONSOLIDATED QUARTERLY FINANCIAL INFORMATIONThe following table sets out selected consolidated financial information for each of the eight quarters ended April 30, 2017. In the opinion of management, this information has been prepared on the same basis as the audited consolidated financial statements. The operating results for any quarter should not be relied upon as any indication of results for any future period.
Quarter Ending
(In thousands) 2017 2016 2015(Unaudited) Apr 30 Jan 31 Oct 31 July 31 Apr 30 Jan 31 Oct 31 July 31
Revenue $ 106,734 $ 91,080 $ 99,592 $ 87,026 $ 96,367 $ 99,754 $ 100,560 $ 84,869 Cost of goods sold 46,690 39,957 42,481 37,160 41,343 42,763 43,026 37,040 Gross margin $ 60,044 $ 51,123 $ 57,111 $ 49,866 $ 55,024 $ 56,991 $ 57,534 $ 47,829 Operating expenses 32,531 38,704 29,225 25,076 43,713 23,960 30,819 22,453 Earnings from operations $ 27,513 $ 12,419 $ 27,886 $ 24,790 $ 11,311 $ 33,031 $ 26,715 $ 25,376 Non-operating income (116) 359 363 332 (4) 200 168 (2)Earnings before taxes $ 27,397 $ 12,778 $ 28,249 $ 25,122 $ 11,307 $ 33,231 $ 26,883 $ 25,374 Net earnings $ 20,547 $ 9,637 $ 20,583 $ 18,393 $ 8,097 $ 24,225 $ 19,486 $ 18,411
Net earnings per share:
Basic $ 0.27 $ 0.13 $ 0.28 $ 0.25 $ 0.11 $ 0.33 $ 0.26 $ 0.25 Diluted $ 0.27 $ 0.13 $ 0.27 $ 0.25 $ 0.11 $ 0.32 $ 0.26 $ 0.25
Dividends per share $ 0.18 $ 1.28 $ 0.18 $ 0.18 $ 0.18 $ 0.18 $ 0.18 $ 0.18
The Companies revenue and corresponding earnings can vary from quarter to quarter depending on the delivery requirements of our customers. Our customers can be influenced by a variety of factors including upcoming sports or entertainment events as well as their access to capital. Net earnings represent net earnings attributable to shareholders.
EVERTZ REPORT_2017_PRINT.indd 21 2017-09-06 12:47 PM

22 EVERTZ TECHNOLOGIES LIMITED2017 ANNUAL REPORT
MANAGEMENT’S DISCUSSION AND ANALYSIS (CONT’D)
DISCLOSURE CONTROLS AND PROCEDURES Management, including the Chief Executive Officer and Chief Financial Officer, has evaluated the effectiveness of the Company’s disclosure controls and procedures (as defined in National Instrument 52-109 of the Canadian Securities Administrators) as of April 30, 2017.
Management has concluded that, as of April 30, 2017, the Company’s disclosure controls and procedures were effective to provide reasonable assurance that material information relating to the Company would be made known to them by others within the Company, particularly during the period in which this report was being prepared.
INTERNAL CONTROLS OVER FINANCIAL REPORTING Management is responsible for and has designed internal controls over financial reporting, or caused it to be designed under management’s supervision, to provide reasonable assurance regarding the reliability of financial reporting and the preparation of financial statements for external purposes in accordance with IFRS. Management has concluded that, as of April 30, 2017, the Company’s internal controls over financial reporting were effective to provide reasonable assurance regarding the reliability of financial reporting and the preparation of financial statements for external purposes in accordance with IFRS.
CHANGES IN INTERNAL CONTROLS OVER FINANCIAL REPORTINGThere have been no changes to the Company’s internal controls over financial reporting during the period ended April 30, 2017 that have materially affected, or reasonably likely to materially affect, its internal controls over financial reporting.
On May 15, 2013 the Committee of Sponsoring Organizations of the Treadway Commission (“COSO”) released Internal Control-Integrated Framework: 2013, which is an update to the internal control framework previously issued in 1992. Management is currently operating under the 1992 Framework and is transitioning to the updated Framework. While no significant changes to the Company’s internal control system are expected to result from the transition, any modifications to such expectation will be reported by the Company within the following MD&A.
OUTLOOKManagement expects on an annual basis that the Company’s revenues will continue to outpace industry growth. Gross margin percentages may vary depending on the mix of products sold, the Company’s success in winning more complete projects, utilization of manufacturing capacity and the competitiveness of the pricing environment. R&D will continue to be a key focus as the Company invests in new product development.
RISKS AND UNCERTAINTIESThe Company risk factors are outlined in our AIF filed on SEDAR.
EVERTZ REPORT_2017_PRINT.indd 22 2017-09-06 12:47 PM

23 EVERTZ TECHNOLOGIES LIMITED2017 ANNUAL REPORT
We have audited the accompanying consolidated financial statements of Evertz Technologies Limited, which comprise the consolidated statements of financial position as at April 30, 2017 and April 30, 2016, and the consolidated statements of changes in equity, consolidated statements of earnings, consolidated statements of comprehensive earnings, and consolidated statements of cash flows for the years then ended, and a summary of significant accounting policies and other explanatory information.
Management’s Responsibility for the Consolidated Financial StatementsManagement is responsible for the preparation and fair presentation of these consolidated financial statements in accordance with International Financial Reporting Standards, and for such internal control as management determines is necessary to enable the preparation of consolidated financial statements that are free from material misstatement, whether due to fraud or error.
Auditor’s ResponsibilityOur responsibility is to express an opinion on these consolidated financial statements based on our audits. We conducted our audits in accordance with Canadian generally accepted auditing standards. Those standards require that we comply with ethical requirements and plan and perform the audit to obtain reasonable assurance about whether the consolidated financial statements are free from material misstatement.
An audit involves performing procedures to obtain audit evidence about the amounts and disclosures in the consolidated financial statements. The procedures selected depend on the auditor's judgment, including the assessment of the risks of material misstatement of the consolidated financial statements, whether due to fraud or error. In making those risk assessments, the auditor considers internal control relevant to the entity's preparation and fair presentation of the consolidated financial statements in order to design audit procedures that are appropriate in the circumstances, but not for the purpose of expressing an opinion on the effectiveness of the entity's internal control. An audit also includes evaluating the appropriateness of accounting policies used and the reasonableness of accounting estimates made by management, as well as evaluating the overall presentation of the consolidated financial statements.
We believe that the audit evidence we have obtained in our audits is sufficient and appropriate to provide a basis for our audit opinion.
OpinionIn our opinion, the consolidated financial statements present fairly, in all material respects, the financial position of Evertz Technologies Limited as at April 30, 2017 and April 30, 2016, and its financial performance and its cash flows for the years then ended in accordance with International Financial Reporting Standards.
CHARTERED PROFESSIONAL ACCOUNTANTS LICENSED PUBLIC ACCOUNTANTS
June 13, 2017 Burlington, Ontario
INDEPENDENT AUDITOR’S REPORTTo the Shareholders of Evertz Technologies Limited
EVERTZ REPORT_2017_PRINT.indd 23 2017-09-06 12:47 PM

24 EVERTZ TECHNOLOGIES LIMITED2017 ANNUAL REPORT
(In thousands of Canadian dollars) April 30, 2017 April 30, 2016
ASSETSCurrent assets
Cash and cash equivalents $ 54,274 $ 123,102 Trade and other receivables (note 3) 111,664 97,435 Prepaid expenses 4,075 6,307 Inventories (note 4) 178,208 155,957 Income tax receivable (note 21) - 4,256
348,221 387,057
Property, plant and equipment (note 5) 44,152 42,971 Goodwill (note 6) 18,195 18,286
$ 410,568 $ 448,314
LIABILITIESCurrent liabilities
Trade and other payables $ 50,321 $ 49,815 Provisions (note 7) 3,817 3,563 Deferred revenue 28,272 18,529 Current portion of long term debt (note 8) 280 238 Income tax payable (note 21) 945 -
83,635 72,145
Long term debt (note 8) 733 888Deferred income taxes (note 21) 4,427 5,545
88,795 78,578
EQUITYCapital stock (note 9) 124,695 100,483 Share based payment reserve 10,091 13,835
Accumulated other comprehensive earnings 747 1,567 Retained earnings 182,297 250,320
183,044 251,887
Total equity attributable to shareholders 317,830 366,205 Non-controlling interest 3,943 3,531
321,773 369,736 $ 410,568 $ 448,314
See accompanying notes to the consolidated financial statements.
w
CONSOLIDATED STATEMENTS OF FINANCIAL POSITION As at April 30, 2017 and April 30, 2016
EVERTZ REPORT_2017_PRINT_RV2.indd 24 2017-09-07 9:40 PM

25 EVERTZ TECHNOLOGIES LIMITED2017 ANNUAL REPORT
CONSOLIDATED STATEMENTS OF CHANGES IN EQUITY Years ended April 30
Capital stock
Share- based
payment reserve
Accumulated other
comprehen-sive
earnings Retained earnings
Totalequity
attributable to
share-holders
Non-control-
linginterest
Total Equity
(In thousands of Canadian dollars)
Balance at April 30, 2015 $ 95,708 $ 12,418 $ 3,077 $ 242,268 $ 353,471 $ 3,389 $ 356,860
Net earnings for the year - - - 70,219 70,219 667 70,886Foreign currency translation adjustment - - (893) - (893) 100 (793)Disposal of a foreign operation - - (617) - (617) - (617)Total comprehensive earnings for the year $ - $ - $ (1,510) $ 70,219 $ 68,709 $ 767 $ 69,476 Dividends declared - - - (53,549) (53,549) (625) (54,174)Share based compensation expense - 2,604 - - 2,604 - 2,604 Exercise of employee stock options 4,371 - - - 4,371 - 4,371Transfer on stock option exercise 1,187 (1,187) - - - - - Repurchase of common shares (783) - - (8,618) (9,401) - (9,401)Balance at April 30, 2016 $ 100,483 $ 13,835 $ 1,567 $ 250,320 $ 366,205 $ 3,531 $ 369,736
Net earnings for the year - - - 69,160 69,160 613 69,773 Foreign currency translation adjustment - - (820) - (820) 149 (671)
Total comprehensive earnings for the year $ - $ - $ (820) $ 69,160 $ 68,340 $ 762 $ 69,102Dividends declared - - - (137,183) (137,183) (350) (137,533)Share based compensation expense - 1,767 - - 1,767 - 1,767 Exercise of employee stock options 18,701 - - - 18,701 - 18,701 Transfer on stock option exercise 5,511 (5,511) - - - - - Balance at April 30, 2017 $ 124,695 $ 10,091 $ 747 $ 182,297 $ 317,830 $ 3,943 $ 321,773
See accompanying notes to the consolidated financial statements.
EVERTZ REPORT_2017_PRINT.indd 25 2017-09-06 12:47 PM

26 EVERTZ TECHNOLOGIES LIMITED2017 ANNUAL REPORT
(In thousands of Canadian dollars, except per share amounts) 2017 2016
Revenue (note 10) $ 384,432 $ 381,550 Cost of goods sold 166,288 164,172 Gross margin 218,144 217,378
Expenses Selling, administrative and general (note 11) 71,086 67,186 Research and development 73,699 66,892 Investment tax credits (9,362) (10,495) Foreign exchange gain (9,887) (2,638)
125,536 120,945 92,608 96,433
Finance income 1,321 772 Finance costs (242) (534)Other income (expenses) (141) 124 Earnings before income taxes 93,546 96,795
Provision for (recovery of) income taxes Current (note 21) 25,160 24,582 Deferred (note 21) (1,387) 1,327
23,773 25,909
Net earnings for the year $ 69,773 $ 70,886
Net earnings attributable to non-controlling interest $ 613 $ 667 Net earnings attributable to shareholders 69,160 70,219 Net earnings for the year $ 69,773 $ 70,886
Earnings per share (note 20)
Basic $ 0.92 $ 0.94 Diluted $ 0.92 $ 0.94
See accompanying notes to the consolidated financial statements.
CONSOLIDATED STATEMENTS OF EARNINGS Years ended April 30
EVERTZ REPORT_2017_PRINT.indd 26 2017-09-06 12:47 PM

27 EVERTZ TECHNOLOGIES LIMITED2017 ANNUAL REPORT
CONSOLIDATED STATEMENTS OF COMPREHENSIVE EARNINGS Years ended April 30
(In thousands of Canadian dollars) 2017 2016
Net earnings for the year $ 69,773 $ 70,886
Items reclassified to net earnings: Disposal of a foreign operation
-
(617)
Items that may be reclassified to net earnings: Foreign currency translation adjustment
(671)
(793)
Comprehensive earnings $ 69,102 $ 69,476
Comprehensive earnings attributable to non-controlling interest $ 762 $ 767 Comprehensive earnings attributable to shareholders 68,340 68,709 Comprehensive earnings $ 69,102 $ 69,476
See accompanying notes to the consolidated financial statements.
EVERTZ REPORT_2017_PRINT.indd 27 2017-09-06 12:47 PM

28 EVERTZ TECHNOLOGIES LIMITED2017 ANNUAL REPORT
(In thousands of Canadian dollars) 2017 2016
Operating activitiesNet earnings for the year $ 69,773 $ 70,886 Add: Items not involving cash Depreciation of property, plant and equipment 10,957 10,637 (Gain) loss on disposal of property, plant and equipment (9) 30 Share-based compensation (note 13) 1,767 2,604 Interest expense 32 31 Deferred income tax (recovery) expense (1,387) 1,327
81,133 85,515 Current tax expenses, net of investment tax credits 15,798 14,087 Income taxes paid (10,562) (20,406)Changes in non-cash working capital items (note 12) (21,856) 11,985 Cash provided by operating activities 64,513 91,181
Investing activities Acquisition of property, plant and equipment (11,272) (4,023) Proceeds from disposal of property, plant and equipment 90 169 Cash used in investing activities (11,182) (3,854)
Financing activities Repayment of long term debt (149) (204) Interest paid (32) (31) Dividends paid (137,183) (53,549) Dividends paid by subsidiaries to non-controlling interests (350) (625) Capital stock repurchase (note 9) - (9,401) Capital stock issued 18,701 4,371 Cash used in financing activities (119,013) (59,439)
Effect of exchange rates on cash and cash equivalents (3,146) (5,467)
(Decrease) increase in cash and cash equivalents (68,828) 22,421 Cash and cash equivalents beginning of year 123,102 100,681 Cash and cash equivalents end of year $ 54,274 $ 123,102
See accompanying notes to the consolidated financial statements.
CONSOLIDATED STATEMENTS OF CASH FLOWSYears ended April 30
EVERTZ REPORT_2017_PRINT.indd 28 2017-09-06 12:47 PM

29 EVERTZ TECHNOLOGIES LIMITED2017 ANNUAL REPORT
NOTES TO THE CONSOLIDATED FINANCIAL STATEMENTS
Years ended April 30, 2017 and 2016 (In thousands of Canadian dollars, except for “number of common shares”, “number of options” and “per share” information)
EVERTZ TECHNOLOGIES LIMITED (“EVERTZ” OR THE “COMPANY”) IS INCORPORATED UNDER THE CANADA BUSINESS
CORPORATIONS ACT. THE COMPANY IS INCORPORATED AND DOMICILED IN CANADA AND THE REGISTERED HEAD OFFICE IS
LOCATED AT 5292 JOHN LUCAS DRIVE, BURLINGTON, ONTARIO, CANADA. THE COMPANY IS A LEADING SUPPLIER OF SOFTWARE,
EQUIPMENT AND TECHNOLOGY SOLUTIONS TO CONTENT CREATORS, BROADCASTERS, SPECIALTY CHANNELS AND TELEVISION
SERVICE PROVIDERS. THE COMPANY DESIGNS, MANUFACTURES AND DISTRIBUTES VIDEO AND AUDIO INFRASTRUCTURE
SOLUTIONS FOR THE PRODUCTION, POST–PRODUCTION, BROADCAST AND TELECOMMUNICATIONS MARKETS.
1. STATEMENT OF COMPLIANCEThese consolidated financial statements have been prepared in accordance with International Financial Reporting Standards (“IFRS”) as issued by the International Accounting Standards Board ("IASB").
These consolidated financial statements were authorized for issue by the Board of Directors on June 13, 2017.
2. SIGNIFICANT ACCOUNTING POLICIESOutlined below are those policies considered particularly significant:
Basis of MeasurementThese financial statements have been prepared on the historical cost basis except for certain financial assets and liabilities which are stated at fair value. Historical cost is generally based on the fair value of the consideration given in exchange for assets.
Functional and Presentation Currency These financial statements are presented in Canadian dollars, which is the Company’s functional currency. All financial information presented in Canadian dollars has been rounded to the nearest thousand, except per share amounts.
Basis of ConsolidationThese financial statements incorporate the financial statements of the Company and entities controlled by the Company (its subsidiaries). Control is achieved where the Company has power over an entity, has exposure or rights to variable returns from its involvement with the entity and has the ability to use its power over the entity to affect the amount of the investor’s returns.
The results of subsidiaries acquired or disposed of are included in the consolidated statements of earnings and comprehensive earnings from the effective date of acquisition of control and up to the effective date of disposal of control, as appropriate. Total comprehensive earnings of subsidiaries is attributed to the owners of the Company and to the non-controlling interests even if this results in the non-controlling interests having a deficit balance.
All intra-Company transactions, balances, income and expenses are eliminated in full on consolidation.
Business CombinationsBusiness combinations are accounted for using the acquisition method. The cost of the acquisition is measured at the aggregate of the fair values, at the date of acquisition, of assets transferred, liabilities incurred or assumed, and equity instruments issued by the Company. The acquiree’s identifiable assets and liabilities assumed are recognized at their fair value at the acquisition date. Acquisition-related costs are recognized in earnings as incurred. Any contingent consideration is measured at fair value on date of the acquisition and is included as part of the consideration transferred. The fair value of the contingent consideration liability is re-measured at each reporting date with corresponding gain/loss recognized in earnings. The excess of the consideration over the fair value of the net identifiable assets and liabilities acquired is recorded as goodwill.
On an acquisition by acquisition basis, any non-controlling interest is measured either at the fair value of the non-controlling interest or at the fair value of the proportionate share of the net identifiable assets acquired. Goodwill arising on an acquisition of a business is carried at cost as established at the date of acquisition of the business less accumulated impairment losses, if any.
EVERTZ REPORT_2017_PRINT.indd 29 2017-09-06 12:47 PM

30 EVERTZ TECHNOLOGIES LIMITED2017 ANNUAL REPORT
Revenue RecognitionRevenue is measured at the fair value of consideration received or receivable, net of discounts and after eliminating intercompany sales.
Where revenue arrangements have separately identifiable components, the consideration received or receivable is allocated to each identifiable component and the applicable revenue recognition criteria are applied to each of the components.
Revenue is derived from the sale of hardware and software solutions including related services, training and commissioning. Revenue from sales of hardware and software are recognized upon shipment, provided that the significant risks and rewards of ownership have been transferred to the customer, the Company retains neither continuing managerial involvement to the degree usually associated with ownership nor effective control over the goods sold, revenue can be reliably measured and its probable that the economic benefits will flow to the Company. Service revenue is recognized as services are performed.
Certain of the Company’s contracts are long-term in nature. When the outcome of the contract can be assessed reliably, the Company recognizes revenue on long-term contracts using the percentage of completion method, based on costs incurred relative to the estimated total contract costs. When the outcome of the contract cannot be assessed reliably contract costs incurred are immediately expensed and revenue is recognized only to the extent that costs are considered likely to be recovered.
Finance IncomeInterest revenue is recognized when it is probable that the economic benefits will flow to the Company and the amount of revenue can be measured reliably. Interest revenue is accrued on a time basis, by reference to the principal outstanding and at the effective interest rate applicable, which is the rate that exactly discounts estimated future cash receipts through the expected life of the financial asset to that asset’s net carrying amount on initial recognition.
Cash and Cash EquivalentsCash and cash equivalents include cash on hand and in the bank, net of outstanding bank overdrafts.
InventoriesInventories consist of raw materials and supplies, work in progress and finished goods. Inventories are stated at the lower of cost and net realizable value. Cost is determined on a weighted average basis and includes raw materials, the cost of direct labour applied to the product and the overhead expense.
Net realizable value represents the estimated selling price for inventories less all estimated costs of completion and costs necessary to make the sale.
Property, Plant and EquipmentProperty, plant and equipment are stated at cost less accumulated depreciation and any recognized impairment loss. Where the costs of certain components of an item of property, plant and equipment are significant in relation to the total cost of the item, they are accounted for and depreciated separately. Depreciation expense is calculated based on depreciable amounts which is the cost of an asset less residual value and is recognized in earnings on a straight-line basis over the estimated useful life of the related asset. Borrowing costs are capitalized to the cost of qualifying assets that take a substantial period of time to be ready for their intended use.
NOTES TO THE CONSOLIDATED FINANCIAL STATEMENTS (CONT’D)Years ended April 30, 2017 and 2016 (In thousands of Canadian dollars, except for “number of common shares”, “number of options” and “per share” information)
2. SIGNIFICANT ACCOUNTING POLICIES (CONTINUED)
EVERTZ REPORT_2017_PRINT.indd 30 2017-09-06 12:47 PM

31 EVERTZ TECHNOLOGIES LIMITED2017 ANNUAL REPORT
NOTES TO THE CONSOLIDATED FINANCIAL STATEMENTS (CONT’D)Years ended April 30, 2017 and 2016 (In thousands of Canadian dollars, except for “number of common shares”, “number of options” and “per share” information)
2. SIGNIFICANT ACCOUNTING POLICIES (CONTINUED) 2. SIGNIFICANT ACCOUNTING POLICIES (CONTINUED)
The estimated useful lives are as follows:
ASSET BASIS RATE
Office furniture and equipment Straight-line 10 yearsResearch and development equipment Straight-line 5 yearsMachinery and equipment Straight-line 5 - 15 yearsLeaseholds Straight-line 5 yearsBuilding Straight-line 10 - 40 yearsAirplanes Straight-line 10 - 20 years
The gain or loss arising on the disposal or retirement of an asset is determined as the difference between the sales proceeds and the carrying amount of the asset and is recognized in earnings.
The Company reviews the residual value, estimated useful life and the depreciation method at least annually.
Impairment of Non-Financial AssetsGoodwill is tested for impairment annually, or whenever events or changes in circumstances indicate that the carrying amount may be more than its recoverable amount. At each reporting period, the Company reviews the carrying amounts of its other non-financial assets to determine whether there is any indication that those assets have suffered an impairment loss. If any such indication exists, the recoverable amount of the asset is estimated in order to determine the extent of the impairment loss (if any). Where the asset does not generate cash inflows that are largely independent from other assets, the Company estimates the recoverable amount of the cash-generating unit (“CGU”) to which the asset belongs. Goodwill is allocated to a group of CGU’s based on the level at which it is monitored for internal reporting purposes.
Recoverable amount is the higher of fair value less costs to sell and value in use. In assessing value in use, the estimated future cash flows are discounted to their present value using a pre-tax discount rate that reflects current market assessments of the time value of money and the risks specific to the asset for which the estimates of future cash flows have not been adjusted.
If the recoverable amount of an asset or CGU is estimated to be less than its carrying amount, the carrying amount of the asset or CGU is reduced to its recoverable amount. An impairment loss relating to a CGU to which goodwill has been allocated, is allocated to the carrying amount of the goodwill first. An impairment loss is recognized immediately in earnings.
An impairment loss in respect of goodwill is not reversed. Where an impairment loss subsequently reverses for other non-financial assets, the carrying amount of the asset or CGU is increased to the revised estimate of its recoverable amount, but so that the increased carrying amount does not exceed the carrying amount that would have been determined had no impairment loss been recognized for the asset or CGU in prior years. A reversal of an impairment loss is recognized immediately in earnings.
Intangible AssetsIntangible AssetsIntangible assets represent intellectual property acquired through business acquisitions and are recorded at cost less any impairment loss and are amortized using the straight–line method over a four–year period. The estimated useful life and amortization method are reviewed at the end of each reporting period.
Research and DevelopmentAll research and development expenditures are expensed as incurred unless a development project meets the criteria for capitalization. Development expenditures are capitalized only if development costs can be measured reliably, the product or process is technically and commercially feasible, future economic benefits are probable and the Company intends to and has sufficient resources to complete development and to use or sell the asset. No internally generated intangible assets have been recognized to date.
EVERTZ REPORT_2017_PRINT.indd 31 2017-09-06 12:47 PM

32 EVERTZ TECHNOLOGIES LIMITED2017 ANNUAL REPORT
Research and development expenditures are recorded gross of investment tax credits and related government grants. Investment tax credits for scientific research and experimental development are recognized in the period the qualifying expenditures are incurred if there is reasonable assurance that they will be realized.
ProvisionsProvisions are recognized when the Company has a present obligation (legal or constructive) as a result of a past event, it is probable that the Company will be required to settle that obligation and a reliable estimate can be made of the amount of the obligation.
The amount recognized as a provision is the best estimate of the consideration required to settle the present obligation at the reporting period, taking into account the risks and uncertainties surrounding the obligation. Where a provision is measured using the cash flows estimated to settle the present obligation, its carrying amount is the present value of those cash flows.
When some or all of the economic benefits required to settle a provision are expected to be recovered from a third party, a receivable is recognized as an asset if it is virtually certain that reimbursement will be received and the amount of the receivable can be measured reliably.
LeasingLeases are classified as finance leases whenever the terms of the lease transfer substantially all the risks and rewards of ownership to the lessee. All other leases are classified as operating leases.
Assets held under finance leases are recognised as assets of the Company at their fair value or, if lower, at the present value of the minimum lease payments, each determined at the inception of the lease. The corresponding liability to the lessor is included in the statement of financial position as a finance lease obligation.
Rentals payable under operating leases are charged to earnings on a straight-line basis over the term of the relevant lease.
Foreign Currency TranslationThe individual financial statements of each subsidiary entity are presented in the currency of the primary economic environment in which the entity operates (its functional currency). For the purpose of the consolidated financial statements, the results and financial position of each group entity are presented in Canadian dollars (“CDN”), which is the functional currency of the parent Company and the presentation currency for the financial statements.
In preparing the financial statements of the individual entities, transactions in currencies other than the entity’s functional currency (foreign currencies) are recognized at the rates of exchange prevailing at the dates of the transactions. At the end of each reporting period, monetary items denominated in foreign currencies are retranslated at the rates prevailing at that date. Exchange differences are recognized in earnings in the period in which they arise. Non-monetary items that are measured in terms of historical cost in a foreign currency are not retranslated.
For the purpose of presenting consolidated financial statements, the assets and liabilities of the Company’s foreign operations are expressed in Canadian dollars using exchange rates prevailing at the end of the reporting period. Income and expense items are translated at the average exchange rates for the period. Foreign currency gains and losses are recognized in other comprehensive earnings. The relevant amount in cumulative foreign currency translation adjustment is reclassified into earnings upon disposition or partial disposition of a foreign operation and attributed to non-controlling interests as appropriate.
Income Taxes Current Tax The tax currently payable is based on taxable profit for the year. Taxable profit differs from net earnings as reported in the statement of earnings because it excludes items of income or expense that are taxable or deductible in other years and it further excludes items that are never taxable or deductible. The Company’s liability for current tax is calculated using tax rates that have been enacted or substantively enacted by the statement of financial position date.
NOTES TO THE CONSOLIDATED FINANCIAL STATEMENTS (CONT’D)Years ended April 30, 2017 and 2016 (In thousands of Canadian dollars, except for “number of common shares”, “number of options” and “per share” information)
2. SIGNIFICANT ACCOUNTING POLICIES (CONTINUED)
EVERTZ REPORT_2017_PRINT.indd 32 2017-09-06 12:47 PM

33 EVERTZ TECHNOLOGIES LIMITED2017 ANNUAL REPORT
NOTES TO THE CONSOLIDATED FINANCIAL STATEMENTS (CONT’D)Years ended April 30, 2017 and 2016 (In thousands of Canadian dollars, except for “number of common shares”, “number of options” and “per share” information)
Deferred TaxDeferred tax is the tax expected to be payable or recoverable on unused tax losses and credits, as well as differences between the carrying amounts of assets and liabilities in the financial statements and the corresponding tax bases used in the computation of taxable profit. Deferred tax liabilities are generally recognized for all taxable temporary differences and deferred tax assets are recognized to the extent that it is probable that taxable profits will be available against which unused tax losses, credits and other deductible temporary differences can be utilized. Such assets and liabilities are not recognized if the temporary difference arises from the initial recognition of goodwill or from the initial recognition (other than in a business combination) of other assets and liabilities in a transaction that affects neither the taxable profit nor the accounting profit.
The carrying amount of deferred tax assets is reviewed at each reporting period and reduced to the extent that it is no longer probable that sufficient taxable profits will be available to allow all or part of the asset to be recovered.
Deferred tax is calculated at the tax rates that are expected to apply in the period when the liability is settled or the asset is realized. The measurement of deferred tax liabilities and assets reflects the tax consequences that would follow from the manner in which the Company expects, at the end of the reporting period, to recover or settle the carrying amount of its assets and liabilities. Deferred tax is charged or credited to earnings, except when it relates to items charged or credited directly to other comprehensive earnings or equity, in which case the deferred tax is also dealt with in other comprehensive earnings or equity.
Share Based CompensationEquity settled share based payments to employees and others providing similar services are measured at the fair value of the equity instruments at the grant date. Details regarding the determination of the fair value of equity settled share based transactions are set out in note 13.
The fair value determined at the grant date of the equity settled share based payments is expensed on a straight-line basis over the vesting period of the option based on the Company’s estimate of the number of equity instruments that will eventually vest. At each reporting period, the Company revises its estimate of the number of equity instruments expected to vest. The impact of the revision of the original estimates, if any, is recognized in earnings such that the cumulative expense reflects the revised estimate, with a corresponding adjustment to share based payment reserve.
Cash settled share based earnings to employees or others providing similar services are measured at the fair value of the instruments at the grant date. The fair value is recognized as an expense with a corresponding increase in liabilities over the vesting period of the option grant. At each reporting period, the Company revises its estimate of fair value and the number of instruments expected to vest. The impact of the revision of the original estimates, if any, is recognized in earnings such that the cumulative expense reflects the revised estimate, with a corresponding adjustment to liabilities.
Earnings Per Share The Company presents basic and diluted earnings per share (“EPS”) data for its common shares. Basic EPS is calculated by dividing the net earnings attributable to shareholders by the weighted average number of common shares outstanding during the period. Diluted EPS is determined by adjusting the net earnings attributable to shareholders and the weighted average number of common shares outstanding for the effects of all potentially dilutive common shares, which is comprised of share options granted to employees with an exercise price below the average market price.
Finance CostsFinance costs directly attributable to the acquisition, construction or production of qualifying assets, which are assets that necessarily take a substantial period of time to get ready for their intended use or sale, are added to the cost of those assets, until such time as the assets are substantially ready for their intended use or sale.
Investment income earned on the temporary investment of specific borrowings pending their expenditure on qualifying assets is deducted from the borrowing costs eligible for capitalisation.
All other finance costs are recognized in earnings in the period in which they are incurred.
2. SIGNIFICANT ACCOUNTING POLICIES (CONTINUED)2. SIGNIFICANT ACCOUNTING POLICIES (CONTINUED)
EVERTZ REPORT_2017_PRINT.indd 33 2017-09-06 12:47 PM

34 EVERTZ TECHNOLOGIES LIMITED2017 ANNUAL REPORT
Investment Tax CreditsThe Company is entitled to investment tax credits, which are earned as a percentage of eligible research and development expenditures incurred in each taxation year. Investment tax credits relate entirely to the Company’s research and development expenses in the consolidated statements of earnings but are presented separately in the consolidated statements of earnings for information purposes. Investment tax credits are recognized and recorded within income tax receivable or as a reduction of income tax payable, when there is reasonable assurance they will be received.
Financial InstrumentsThe Company’s financial assets and liabilities which are initially recorded at fair value and subsequently measured based on their assigned classifications as follows:
Asset/Liability Category Measurement
Cash and cash equivalents Loans and receivables Amortized costTrade and other receivables Loans and receivables Amortized costTrade and other payables Other liabilities Amortized costLong term debt Other liabilities Amortized cost
Financial AssetsAll financial assets are initially measured at fair value, plus transaction costs, except for those financial assets classified as fair value through profit or loss, which are initially measured at fair value. Transaction costs in respect of financial instruments that are classified as fair value through profit or loss are recognized in earnings immediately. Transaction costs in respect of other financial instruments are included in the initial measurement of the financial instrument.
Financial assets are classified into the following specific categories: financial assets “at fair value through profit or loss” (“FVTPL”), “held-to-maturity” investments, “available-for-sale” (“AFS”) financial assets and “loans and receivables”. The classification depends on the nature and purpose of the financial assets and is determined at the time of initial recognition.
Financial assets at FVTPL are stated at fair value, with any gains or losses arising on re-measurement recognized in earnings. Impairment of Financial Assets Financial assets, other than those at FVTPL, are assessed for indicators of impairment at each reporting period. Financial assets are impaired where there is objective evidence that, as a result of one or more events that occurred after the initial recognition of the financial asset, the estimated future cash flows of the investment have been affected. For certain categories of financial assets, such as trade and other receivables, assets that are assessed not to be impaired individually are, in addition, assessed for impairment on a collective basis. Objective evidence of impairment of a financial asset can include a significant or prolonged decline in the fair value of an asset, default or delinquency by a debtor, indication that a debtor will enter bankruptcy or financial re-organization or the disappearance of an active market for a security.
For financial assets carried at amortized cost, the amount of the impairment is the difference between the asset’s carrying amount and the present value of estimated future cash flows, discounted at the financial asset’s original effective interest rate.
The carrying amount of the financial asset is reduced by the impairment loss directly for all financial assets with the exception of trade receivables, where the carrying amount is reduced through the use of an allowance account. When a trade receivable is considered uncollectible, it is written off against the allowance account. Subsequent recoveries of amounts previously written off are credited against the allowance account. Changes in the carrying amount of the allowance account are recognized in earnings.
NOTES TO THE CONSOLIDATED FINANCIAL STATEMENTS (CONT’D)Years ended April 30, 2017 and 2016 (In thousands of Canadian dollars, except for “number of common shares”, “number of options” and “per share” information)
2. SIGNIFICANT ACCOUNTING POLICIES (CONTINUED)
EVERTZ REPORT_2017_PRINT.indd 34 2017-09-06 12:47 PM

35 EVERTZ TECHNOLOGIES LIMITED2017 ANNUAL REPORT
NOTES TO THE CONSOLIDATED FINANCIAL STATEMENTS (CONT’D)Years ended April 30, 2017 and 2016 (In thousands of Canadian dollars, except for “number of common shares”, “number of options” and “per share” information)
Financial Liabilities and Equity Instruments Issued by the CompanyFinancial liabilities at FVTPL are stated at fair value, with any gains or losses arising on re-measurement recognized in earnings. The net gain or loss recognized in earnings incorporates any interest paid on the financial liability and is included in the “other income and expenses” line item in the consolidated statements of earnings.
An equity instrument is any contract that evidences a residual interest in the assets of an entity after deducting all of its liabilities. Equity instruments issued by the Company are recognized at the proceeds received, net of direct issue costs.
Other financial liabilities, including long term debt, are initially measured at fair value, net of transaction costs. Other financial liabilities are subsequently measured at amortized cost using the effective interest method, with interest expense recognized on an effective yield basis.
Use of Estimates and JudgmentsThe preparation of financial statements in conformity with IFRS requires management to make judgments, estimates and assumptions that affect the reported amounts of assets and liabilities and disclosure of contingent assets and liabilities at the date of the financial statements and the reported amounts of revenues and expenses during the year. Consequently, actual results could differ from those estimates. Those estimates and underlying assumptions are reviewed on an ongoing basis. Revisions to accounting estimates are recognized in the period in which the estimate is revised and in any future periods affected. Significant estimates include the determination of the allowance for doubtful accounts for trade receivables, provision for inventory obsolescence, the useful life of property, plant and equipment for depreciation, amortization and valuation of net recoverable amount of property, plant and equipment, determination of fair value for share based compensation, evaluating deferred income tax assets and liabilities, the determination of fair value of financial instruments and the likelihood of recoverability, and the determination of implied fair value of goodwill and implied fair value of assets and liabilities for purchase price allocation purposes and goodwill impairment test purposes.
Significant items requiring the use of judgment in application of accounting policies and assumptions include the determination of functional currencies, classification of financial instruments, classification of leases, application of the percentage of completion method on long-term contracts, degree of componentization applied when calculating amortization of property, plant and equipment, and identification of cash generating units for impairment testing purposes.
Operating SegmentsAn operating segment is a component of the Company that engages in business activities from which it may earn revenues and incur expenses, including revenues and expenses that relate to transactions with any of the Company’s other components. The Company reviewed its operations and determined that it operates a single reportable segment, the television broadcast equipment market. The single reportable operating segment derives its revenue from the sale of hardware and software solutions including related services, training and commissioning.
2. SIGNIFICANT ACCOUNTING POLICIES (CONTINUED)
EVERTZ REPORT_2017_PRINT.indd 35 2017-09-06 12:47 PM
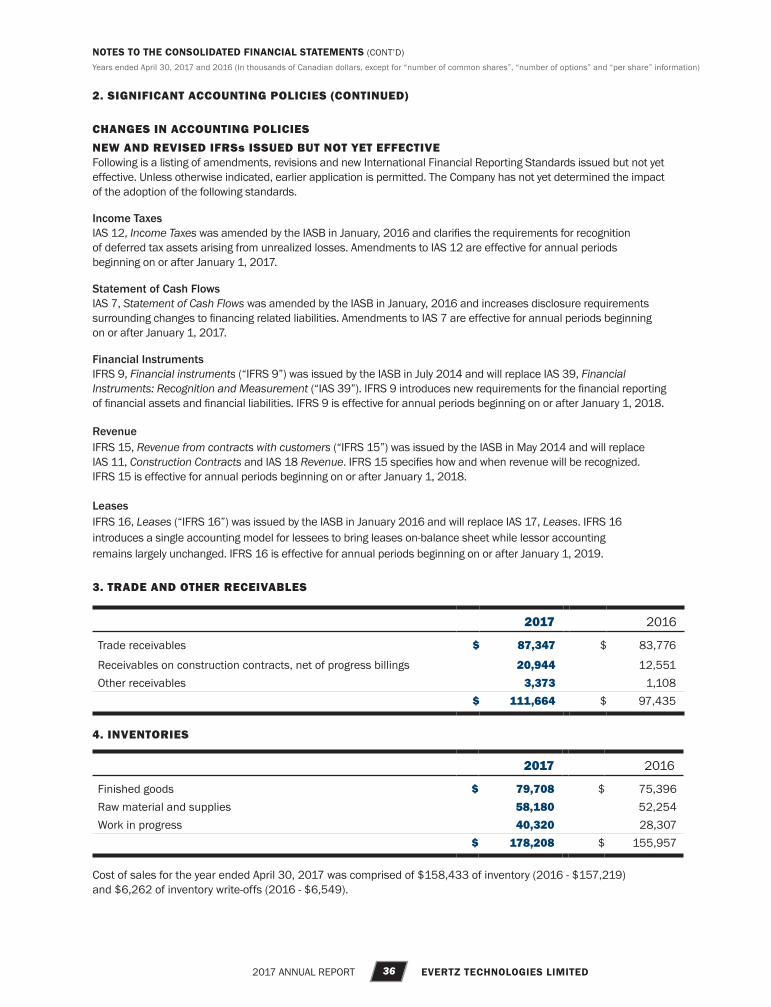
36 EVERTZ TECHNOLOGIES LIMITED2017 ANNUAL REPORT
CHANGES IN ACCOUNTING POLICIES NEW AND REVISED IFRSs ISSUED BUT NOT YET EFFECTIVE Following is a listing of amendments, revisions and new International Financial Reporting Standards issued but not yet effective. Unless otherwise indicated, earlier application is permitted. The Company has not yet determined the impact of the adoption of the following standards.
Income Taxes IAS 12, Income Taxes was amended by the IASB in January, 2016 and clarifies the requirements for recognition of deferred tax assets arising from unrealized losses. Amendments to IAS 12 are effective for annual periods beginning on or after January 1, 2017.
Statement of Cash Flows IAS 7, Statement of Cash Flows was amended by the IASB in January, 2016 and increases disclosure requirements surrounding changes to financing related liabilities. Amendments to IAS 7 are effective for annual periods beginning on or after January 1, 2017.
Financial Instruments IFRS 9, Financial instruments (“IFRS 9”) was issued by the IASB in July 2014 and will replace IAS 39, Financial Instruments: Recognition and Measurement (“IAS 39”). IFRS 9 introduces new requirements for the financial reporting of financial assets and financial liabilities. IFRS 9 is effective for annual periods beginning on or after January 1, 2018.
RevenueIFRS 15, Revenue from contracts with customers (“IFRS 15”) was issued by the IASB in May 2014 and will replace IAS 11, Construction Contracts and IAS 18 Revenue. IFRS 15 specifies how and when revenue will be recognized. IFRS 15 is effective for annual periods beginning on or after January 1, 2018.
LeasesIFRS 16, Leases (“IFRS 16”) was issued by the IASB in January 2016 and will replace IAS 17, Leases. IFRS 16 introduces a single accounting model for lessees to bring leases on-balance sheet while lessor accounting remains largely unchanged. IFRS 16 is effective for annual periods beginning on or after January 1, 2019.
3. TRADE AND OTHER RECEIVABLES
2017 2016
Trade receivables $ 87,347 $ 83,776
Receivables on construction contracts, net of progress billings 20,944 12,551 Other receivables 3,373 1,108
$ 111,664 $ 97,435
4. INVENTORIES
2017 2016
Finished goods $ 79,708 $ 75,396 Raw material and supplies 58,180 52,254 Work in progress 40,320 28,307
$ 178,208 $ 155,957
Cost of sales for the year ended April 30, 2017 was comprised of $158,433 of inventory (2016 - $157,219) and $6,262 of inventory write-offs (2016 - $6,549).
NOTES TO THE CONSOLIDATED FINANCIAL STATEMENTS (CONT’D)Years ended April 30, 2017 and 2016 (In thousands of Canadian dollars, except for “number of common shares”, “number of options” and “per share” information)
2. SIGNIFICANT ACCOUNTING POLICIES (CONTINUED)
EVERTZ REPORT_2017_PRINT.indd 36 2017-09-06 12:47 PM

37 EVERTZ TECHNOLOGIES LIMITED2017 ANNUAL REPORT
NOTES TO THE CONSOLIDATED FINANCIAL STATEMENTS (CONT’D)Years ended April 30, 2017 and 2016 (In thousands of Canadian dollars, except for “number of common shares”, “number of options” and “per share” information)
5. PROPERTY, PLANT AND EQUIPMENT
April 30, 2017 April 30, 2016
CostAccumulated Depreciation
Carrying Amount Cost
Accumulated Depreciation
Carrying Amount
Office furniture and equipment $ 3,685 $ 2,083 $ 1,602 $ 3,065 $ 1,783 $ 1,282 Research and development equipment 31,831 24,168 7,663 29,469 20,672 8,797 Airplanes 19,727 12,665 7,062 19,727 10,975 8,752 Machinery and equipment 56,482 43,395 13,087 51,787 39,226 12,561 Leaseholds 9,316 4,961 4,355 6,208 4,595 1,613 Land 2,388 - 2,388 2,238 - 2,238 Buildings 10,376 2,381 7,995 9,847 2,119 7,728
$ 133,805 $ 89,653 $ 44,152 $ 122,341 $ 79,370 $ 42,971
Officefurniture
and equip-ment
Research and
develop-ment
equip-ment Airplanes
Machin-ery
andequip-ment
Lease-holds Land Buildings Total
Cost
Balance as at April 30, 2015 $ 2,862 $ 29,046 $ 19,727 $ 48,970 $ 5,981 $ 2,215 $ 9,574 $ 118,375 Additions 375 475 - 2,928 232 - 13 4,023
Foreign exchange adjustments 56 (52) - 594 (5) 23 260 876 Disposals (228) - - (705) - - - (933)Balance as at April 30, 2016 $ 3,065 $ 29,469 $ 19,727 $ 51,787 $ 6,208 $ 2,238 $ 9,847 $ 122,341
Additions 624 2,632 - 4,475 3,483 - - 11,214 Foreign exchange adjustments (4) (159) - 588 14 150 529 1,118 Disposals - (111) - (368) (389) - - (868)Balance as at April 30, 2017 $ 3,685 $ 31,831 $ 19,727 $ 56,482 $ 9,316 $ 2,388 $ 10,376 $ 133,805
Accumulated Depreciation
Balance as at April 30, 2015 $ 1,707 $ 16,764 $ 9,274 $ 35,599 $ 4,088 $ - $ 1,863 $ 69,295 Depreciation for the year 321 4,035 1,701 3,897 507 - 176 10,637 Foreign exchange adjustments (18) (127) - 238 - - 80 173 Disposals (227) - - (508) - - - (735)
EVERTZ REPORT_2017_PRINT.indd 37 2017-09-06 12:47 PM

38 EVERTZ TECHNOLOGIES LIMITED2017 ANNUAL REPORT
Balance as at April 30, 2016 $ 1,783 $ 20,672 $ 10,975 $ 39,226 $ 4,595 $ - $ 2,119 $ 79,370 Depreciation for the year 304 3,691 1,690 4,349 755 - 168 10,957 Foreign exchange adjustments (4) (98) - 123 - - 94 115 Disposals - (97) - (303) (389) - - (789)Balance as at April 30, 2017 $ 2,083 $ 24,168 $ 12,665 $ 43,395 $ 4,961 $ - $ 2,381 $ 89,653
Carrying amounts
At April 30, 2016 $ 1,282 $ 8,797 $ 8,752 $ 12,561 $ 1,613 $ 2,238 $ 7,728 $ 42,971At April 30, 2017 $ 1,602 $ 7,663 $ 7,062 $ 13,087 $ 4,355 $ 2,388 $ 7,995 $ 44,152
6. GOODWILLThe changes in carrying amounts of goodwill are as follows:
Cost
Balance as at April 30, 2015 $ 18,313 Foreign exchange differences (27)Balance as at April 30, 2016 $ 18,286 Foreign exchange differences (91)
Balance as at April 30, 2017 $ 18,195
The Company performs an impairment test annually on April 30th or whenever there is an indication of impairment. For the purposes of testing for impairment, goodwill has been allocated to the following cash-generating units as follows:
April 30,
2017 2016
Evertz Microsystems Ltd. $ 12,459 $ 12,581 Holdtech Kft 5,346 5,346 ATCI 390 359
$ 18,195 $ 18,286
The key assumptions used in performing the impairment tests as at April 30, 2017 are as follows:
Method of determining recoverable amount: Discount Rate: Perpetual growth rate: Recoverable Amount Management’s past experience and future expectations of the business performance is used to make a best estimate of the expected revenue, earnings before interest, taxes, depreciation and amortization (“ EBITDA”) and operating cash flows for a five year period. Subsequent to the fifth year period the present value of the fifth year cash flows is calculated in perpetuity.
Discount RateThe discount rate applied is a pretax rate that reflects the time value of money and risk associated with the business.
NOTES TO THE CONSOLIDATED FINANCIAL STATEMENTS (CONT’D)Years ended April 30, 2017 and 2016 (In thousands of Canadian dollars, except for “number of common shares”, “number of options” and “per share” information)
Value in use 10.0% 1 - 4%
5. PROPERTY, PLANT AND EQUIPMENT (CONTINUED)
EVERTZ REPORT_2017_PRINT.indd 38 2017-09-06 12:47 PM

39 EVERTZ TECHNOLOGIES LIMITED2017 ANNUAL REPORT
NOTES TO THE CONSOLIDATED FINANCIAL STATEMENTS (CONT’D)Years ended April 30, 2017 and 2016 (In thousands of Canadian dollars, except for “number of common shares”, “number of options” and “per share” information)
Perpetual Growth RateThe perpetual growth rate is management’s current assessment of the long-term growth prospect of the Company in the jurisdictions in which it operates.
Sensitivity AnalysisManagement performs a sensitivity analysis on the key assumptions. The sensitivity analysis indicates reasonable changes to key assumptions will not result in an impairment loss.
7. PROVISIONS
Warranty and
Returns
Lease/ Retirement Obligations Total
Balance as at April 30, 2015 $ 2,111 $ 118 $ 2,229 Net additions 950 117 1,067 Foreign exchange differences 277 (10) 267 Balance as at April 30, 2016 $ 3,338 $ 225 $ 3,563
Net additions 128 126 254 Foreign exchange differences 4 (4) - Balance as at April 30, 2017 $ 3,470 $ 347 $ 3,817
Warranty and ReturnsThe provision relates to estimated future costs associated with warranty repairs and returns on hardware solutions. The provision is based on historical data associated with similar products. The warranty and returns are expected to be incurred within the next twelve months.
Lease/Retirement ObligationsThe provision relates to estimated restoration costs expected to be incurred upon the conclusion of Company leases.
8. LONG TERM DEBT a) Credit Facilities
The Company has the following credit facilities available:
1. Credit facility of $15,000 and a treasury risk management facility up to $10,000 available, bearing interest at prime, subject to certain covenants and secured by all Canadian based assets. Advances under these facilities bear interest at prime. There were no borrowings against either of these facilities as at April 30, 2017 or 2016.
2. Credit facility available of $705 bearing interest at WIBOR plus 1.4% per annum. There were no borrowings outstanding under this facility as at April 30, 2017 or 2016.
6. GOODWILL (CONTINUED)
EVERTZ REPORT_2017_PRINT.indd 39 2017-09-06 12:47 PM

40 EVERTZ TECHNOLOGIES LIMITED2017 ANNUAL REPORT
b) Long Term Debt
April 30, 2017
April 30,2016
1. Mortgage payable denominated in Euros, secured by buildings, bearing interest at LIBOR EUR three months fixed rate plus 1%, payable monthly, maturing in March 2021 with an option to end the contract prior to maturity upon payment of a penalty fee.
$ 880 $ 1,043
2. Other 133 83
Less current portion
$ 1,013280
$ 1,126 238
$ 733 $ 888
9. CAPITAL STOCKAuthorized capital stock consists of: Unlimited number of preferred shares Unlimited number of common shares
Number of Common
Shares Amount
Balance as at April 30, 2015 74,459,346 $ 95,708 Issued on exercise of stock options 337,500 4,371 Cancelled pursuant to NCIB (608,100) (783)Transferred on stock option exercise - 1,187 Balance as at April 30, 2016 74,188,746 $ 100,483
Issued on exercise of stock options 1,554,000 18,701 Transferred on stock option exercise - 5,511Balance as at April 30, 2017 75,742,746 $ 124,695
NOTES TO THE CONSOLIDATED FINANCIAL STATEMENTS (CONT’D)Years ended April 30, 2017 and 2016 (In thousands of Canadian dollars, except for “number of common shares”, “number of options” and “per share” information)
8. LONG TERM DEBT (CONTINUED)
Normal Course Issuer BidIn June 2015, the Company filed a Normal Course Issuer Bid (“NCIB”) with the TSX to repurchase, at the Company’s discretion, until June 28, 2016 up to 3,722,967 outstanding common shares on the open market or as otherwise permitted, subject to normal terms and limitations of such bids. The Company did not purchase and cancel any shares during the year (2016 – 608,100 common shares were purchased and cancelled at a weighted average price of $15.46).
Dividends Per ShareDuring the year, $1.82 in dividends per share were declared, including a special dividend of $1.10 per share (2016 - $0.72).
EVERTZ REPORT_2017_PRINT_RV2.indd 40 2017-09-07 9:40 PM

41 EVERTZ TECHNOLOGIES LIMITED2017 ANNUAL REPORT
NOTES TO THE CONSOLIDATED FINANCIAL STATEMENTS (CONT’D)Years ended April 30, 2017 and 2016 (In thousands of Canadian dollars, except for “number of common shares”, “number of options” and “per share” information)
10. REVENUE
2017 2016
Hardware, software including related services, training and commissioning $ 357,401 $ 352,563 Long term contract revenue 27,031 28,987
$ 384,432 $ 381,550
11. SELLING, ADMINISTRATIVE AND GENERAL EXPENSES
2017 2016
Selling and administrative $ 62,135 $ 60,986 Share-based compensation (note 13) 5,208 2,840 Depreciation of property, plant and equipment (non-production) 3,743 3,360
$ 71,086 $ 67,186
12. STATEMENT OF CASH FLOWSChanges in non–cash working capital items
2017 2016
Trade and other receivables $ (13,229) $ 24 Inventories (21,919) (901)Prepaid expenses 2,357 2,471 Trade and other payables 938 5,955 Deferred revenue 9,743 3,102 Provisions 254 1,334
$ (21,856) $ 11,985
13. SHARE BASED PAYMENTSStock Option PlanThe Company established, in June 2006, a stock option plan to attract, retain, motivate and compensate employees, officers and eligible directors who are integral to the growth and success of the Company. A number of shares equal to 10% of the Company’s outstanding common shares are to be reserved for issuance under the stock option plan.
The Board of Directors administers the stock option plan and will determine the terms of any options granted. The exercise price of an option is to be set by the Board of Directors at the time of grant but shall not be lower than the market price as defined in the option plan at the time of grant. The term of the option cannot exceed 10 years. Stock options currently granted normally fully vest and expire by the end of the fifth year.
EVERTZ REPORT_2017_PRINT.indd 41 2017-09-06 12:47 PM

42 EVERTZ TECHNOLOGIES LIMITED2017 ANNUAL REPORT
MANAGEMENT’S DISCUSSION AND ANALYSIS (CONT’D)
The changes in the number of outstanding share options are as follows:
Number of
Options
Weighted Average
Exercise Price
Balance as at April 30, 2015 4,736,500 $ 14.57 Granted 395,000 15.36 Exercised (337,500) 12.95 Forfeited (277,500) 14.25 Expired (110,000) 14.32 Balance as at April 30, 2016 4,406,500 $ 14.72
Granted 160,000 16.99 Exercised (1,554,000) 12.03 Forfeited (98,000) 15.97 Expired (36,000) 11.88 Balance as at April 30, 2017 2,878,500 $ 16.29
Stock options outstanding as at April 30, 2017 are:
Exercise Price
Weighted Average
Exercise Price
Number of Outstanding
Options
Weighted Average
Remaining Contractual
Life
Number of Options
Exercisable
Weighted Average
Exercise Price of Exercisable
Options
$ 13.84 - $14.14 $ 13.91 410,000 0.3 - $ - $ 15.00 - $16.82 $ 15.86 827,000 1.8 236,000 $ 16.24 $ 17.03 $ 17.03 1,456,000 1.4 873,600 $ 17.03 $ 17.19 - $18.07 $ 17.62 185,500 3.0 6,000 $ 15.00 Totals $ 16.29 2,878,500 1.9 1,115,600 $ 16.85
Restricted Share Unit PlanThe Company established, in March 2016, a restricted share unit (“RSU”) plan to provide an incentive to participants; including key executives of the Company, by rewarding such participants with equity-based compensation. Under the terms of the plan, RSU’s are issued to the participant with a vesting period of three years. On the vesting date, all RSU’s will be redeemed in cash at the fair market value at the date of vest plus any accrued dividends. The changes in the number of outstanding RSUs are as follows:
NOTES TO THE CONSOLIDATED FINANCIAL STATEMENTS (CONT’D)Years ended April 30, 2017 and 2016 (In thousands of Canadian dollars, except for “number of common shares”, “number of options” and “per share” information)
13. SHARE BASED PAYMENTS (CONTINUED)
Number of RSUs
Balance as at April 30, 2016 210,000
Granted 347,000Forfeited (10,500)Balance as at April 30, 2017 546,500
As at April 30 2017, the average remaining contractual life for outstanding RSUs is 2.0 years.
EVERTZ REPORT_2017_PRINT_RV2.indd 42 2017-09-07 9:40 PM

43 EVERTZ TECHNOLOGIES LIMITED2017 ANNUAL REPORT
NOTES TO THE CONSOLIDATED FINANCIAL STATEMENTS (CONT’D)Years ended April 30, 2017 and 2016 (In thousands of Canadian dollars, except for “number of common shares”, “number of options” and “per share” information)
Compensation expense Stock Option PlanThe share based compensation expense that has been charged against earnings over the fiscal period is $1,767 (2016 - $2,604). Compensation expense on grants during the year was calculated using the Black-Scholes option pricing model with the following weighted average assumptions:
April 30, 2017 April 30, 2016
Risk-free interest rate 1.05% 1.07%Dividend yield 4.24% 4.69%Expected life 5 years 5 yearsExpected volatility 16% 21%Weighted average grant-date fair value: Where the exercise price equaled the market price $ 1.16 $ 1.48
Expected volatility is based on historical share price volatility over the past 5 years of the Company. Share based compensation expense was calculated using a weighted average forfeiture rate of 24% (2016 – 23%).
Restricted Share Unit PlanThe share based compensation expense that has been charged against earnings over the fiscal period is $3,441 (2016 - $236). Share based compensation expense was calculated using a weighted average forfeiture rate of 3% (2016 – Nil). As at April 30, 2017, the total liability included within trade and other payables is $3,677 (2016 - $236). 14. COMMITMENTS AND CONTINGENCIES
Long Term Debt
Operating Leases
Total
2018 $ 280 $ 5,229 $ 5,509 2019 236 4,272 4,508 2020 176 2,200 2,376 2021 184 2,125 2,309 2022 137 1,709 1,846 Thereafter - 5,337 5,337 Balance as at April 30, 2017 $ 1,013 $ 20,872 $ 21,885
Total operating lease expense during the year was $4,099 (2016 - $3,899).
The Company has obtained documentary and standby letters of credit aggregating to a total of $8,399 (2016 - $5,779).
15. FINANCIAL INSTRUMENTS AND RISK MANAGEMENTThe Company’s financial instruments consist of cash and cash equivalents, trade and other receivables, trade and other payables and long term debt. Unless otherwise noted, it is management’s opinion that the Company is not exposed to significant interest or credit risks arising from these financial instruments.
(a) Fair values and classification of financial instruments: The Company estimates that the fair value of financial instruments approximates their carrying values. The following summarizes the significant methods and assumptions used in estimating the fair values of financial instruments:
13. SHARE BASED PAYMENTS (CONTINUED)
EVERTZ REPORT_2017_PRINT_RV2.indd 43 2017-09-07 9:40 PM

44 EVERTZ TECHNOLOGIES LIMITED2017 ANNUAL REPORT
I. Quoted prices (unadjusted) in active markets for identical assets or liabilities.
II. Inputs other than quoted prices included in level I that are observable for the asset or liability, either directly or indirectly. Cash and cash equivalents, trade and other receivables, trade and other payables, long term debt, and fair value disclosures have been determined using level II fair values.
III. Inputs for the asset or liability that are not based on observable market data.
(b) Financial risk management: The Company, through its financial assets and liabilities, is exposed to various risks. The following analysis provides a measurement of risks as at April 30, 2017:
Credit riskFinancial instruments that potentially subject the Company to concentrations of credit risk consist of cash and cash equivalents, and trade and other receivables the total of which is the maximum exposure to credit risk. The Company performs evaluations of the financial situations of its customers. Management does not believe that there is significant credit concentration or risk.
The Company sets up an allowance for doubtful accounts based on the credit risks of the individual customer and the customer history. Approximately 76% (2016 – 74%) of trade and other receivables are outstanding for less than 90 days as at April 30, 2017. The amounts owing over 90 days are individually evaluated and provided for where appropriate in the allowance for doubtful accounts. The trade and other receivables are presented as follows net of the allowance for doubtful accounts:
April 30, 2017 April 30, 2016
Trade and other receivables $ 120,885 $ 103,226 Allowance for doubtful accounts (9,221) (5,791)
$ 111,664 $ 97,435
The change in the allowance for doubtful accounts was as follows:
April 30, 2017 April 30, 2016
Balance at beginning of year $ 5,791 $ 4,833 Increase in allowance 3,392 705 Bad debt recaptured and write-offs (376) (1)Impact of variation in exchange rates 414 254 Balance at end of year $ 9,221 $ 5,791
Exchange Rate RiskThe Company transacts a significant portion of its business in U.S. dollars and is therefore exposed to currency fluctuations. U.S. dollar financial instruments are as follows:
April 30, 2017 April 30, 2016
Cash and cash equivalents $ 12,198 $ 41,068 Trade and other receivables 65,662 45,654 Trade and other payables (4,191) (3,501)
$ 73,669 $ 83,221
Based on the financial instruments as at April 30, 2017, a 5% change in the value of the U.S. dollar would result in a gain or loss of $3,683 in earnings before income tax.
NOTES TO THE CONSOLIDATED FINANCIAL STATEMENTS (CONT’D)Years ended April 30, 2017 and 2016 (In thousands of Canadian dollars, except for “number of common shares”, “number of options” and “per share” information)
15. FINANCIAL INSTRUMENTS AND RISK MANAGEMENT (CONTINUED)
EVERTZ REPORT_2017_PRINT.indd 44 2017-09-06 12:47 PM

45 EVERTZ TECHNOLOGIES LIMITED2017 ANNUAL REPORT
NOTES TO THE CONSOLIDATED FINANCIAL STATEMENTS (CONT’D)Years ended April 30, 2017 and 2016 (In thousands of Canadian dollars, except for “number of common shares”, “number of options” and “per share” information)
Liquidity RiskLiquidity risk is the risk that the Company will encounter difficulty in meeting obligations associated with its financial liabilities. The Company's primary source of liquidity is its cash reserves. The Company also maintains certain credit facilities to support short term funding of operations and trade finance. The Company believes it has sufficient available funds to meet current and foreseeable financial requirements. The Company expects to settle all current financial liabilities within the next year. Maturity of long term debt is disclosed in Note 14.
16. SEGMENTED INFORMATIONThe Company reviewed its operations and determined that it operates a single reportable segment, the television broadcast equipment market. The single reportable operating segment derives its revenues from the sale of hardware and software solutions including related services, training and commissioning.
Revenue 2017 2016
United States $ 210,087 $ 199,806 International 155,350 165,541 Canada 18,995 16,203
$ 384,432 $ 381,550
April 30, 2017 April 30, 2016
Property, Plant and
Equipment
Goodwill
Property, Plant and
Equipment
Goodwill
United States $ 10,486 $ 390 $ 11,813 $ 359 International 9,690 17,805 9,750 17,927 Canada 23,976 - 21,408 -
$ 44,152 $ 18,195 $ 42,971 $ 18,286
17. RELATED PARTY TRANSACTIONSBalances and transactions between the Company and its subsidiaries, which are related parties of the Company, have been eliminated on consolidation and are not disclosed in this note. Details of transactions between the Company and other related parties are disclosed below. Related Party Transactions Two shareholders each indirectly hold a 10% interest in the Company’s leased premises in Ontario. This lease expires in 2019 with a total of $1,605 committed over the remaining term. During the year, rent paid for the leased principal premises amounted to $864 (2016 – $845) with no outstanding amounts due as at April 30, 2017.
The Company also leases property where two shareholders indirectly own 100% interest. This lease expires in 2021 with a total of $1,121 committed over the remaining term. During the year, rent paid was $255 (2016 – $246) and with no outstanding amounts due as at April 30, 2017.
On December 1, 2008 the Company entered into an agreement with two shareholders who each indirectly hold a 20% interest in the Company’s leased premises in Ontario. This lease expires in 2018 with a total of $1,323 committed over the remaining term. During the year, rent paid for the leased principal premises amounted to $812 (2016 - $795) with no outstanding amounts due as at April 30, 2017.
15. FINANCIAL INSTRUMENTS AND RISK MANAGEMENT (CONTINUED)
EVERTZ REPORT_2017_PRINT.indd 45 2017-09-06 12:47 PM

46 EVERTZ TECHNOLOGIES LIMITED2017 ANNUAL REPORT
On May 1, 2009 the Company entered into a property lease agreement with two shareholders who each indirectly hold a 35% interest. This lease expires in 2019 with a total of $970 committed over the remaining term. During the year, rent paid was $462 (2016 - $462) with no outstanding amounts due as at April 30, 2017.
On December 15, 2013 the Company renewed a property lease agreement with a director who indirectly owns 100% interest. The lease expires in 2018 with a total of $235 committed over the remaining term. During the year, rent paid was $141 (2016 - $141) with no outstanding amounts due as at April 30, 2017.
On May 1, 2016 the Company entered into a property lease agreement with two shareholders who each hold an indirect interest. This lease expires in 2026 with a total of $9,080 committed over the remaining term. During the year, rent paid was $967 (2016 – Nil) with no outstanding amounts due as at April 30, 2017.
On August 1, 2016 the Company entered into a property lease agreement where two shareholders indirectly own 100% interest. This lease expires in 2026 with a total of $2,451 committed over the remaining term. During the year, rent paid was $182 (2016 – Nil) with no outstanding amounts due as at April 30, 2017.
These transactions were in the normal course of business and recorded at an exchange value established and agreed upon by related parties.
The remuneration of directors and other members of key management personnel for the years ended April 30, 2017 and April 30, 2016 are as follows:
2017 2016
Short-term salaries and benefits $ 4,840 $ 4,549 Share-based payments - 2,008
$ 4,840 $ 6,557
The total employee benefit expense was $119,703 (2016 - $106,749).
Subsidiaries: The Company has the following significant subsidiaries:
Company % Ownership Location
Evertz Microsystems Ltd. 100% CanadaEvertz USA 100% United StatesEvertz UK 100% United KingdomHoldtech Kft. 100% HungaryTech Digital Manufacturing Limited 100% Canada Truform Metal Fabrication Ltd. 75% Canada
NOTES TO THE CONSOLIDATED FINANCIAL STATEMENTS (CONT’D)Years ended April 30, 2017 and 2016 (In thousands of Canadian dollars, except for “number of common shares”, “number of options” and “per share” information)
17. RELATED PARTY TRANSACTIONS (CONTINUED)
EVERTZ REPORT_2017_PRINT.indd 46 2017-09-06 12:47 PM

47 EVERTZ TECHNOLOGIES LIMITED2017 ANNUAL REPORT
NOTES TO THE CONSOLIDATED FINANCIAL STATEMENTS (CONT’D)Years ended April 30, 2017 and 2016 (In thousands of Canadian dollars, except for “number of common shares”, “number of options” and “per share” information)
18. NON-CONTROLLING INTERESTSThe Company has non-controlling interests of 25% with Truform Metal Fabrication Ltd., located within Canada, 10% with Studiotech Poland located within Poland and 20% with ATCI, located within the USA. The table below summarizes the aggregate financial information relating to subsidiaries before eliminating entries, as no such subsidiary is individually significant.
April 30, 2017
April 30, 2016
Current assets $ 17,844 $ 16,114 Non-current assets 9,503 9,667 Current liabilities 3,146 4,292 Non-current liabilities 585 649 Equity attributable to shareholders 19,673 17,309 Non-controlling interest 3,943 3,531
April 30, 2017
April 30, 2016
Revenue $ 36,861 $ 40,930 Net earnings attributable to: Shareholders 2,174 2,971 Non-controlling interest 613 667
19. CAPITAL DISCLOSURESThe Company’s capital is composed of total equity attributable to shareholders which totals $317,830 (2016 - $366,205) as at April 30. The Company’s objective in managing capital is to ensure sufficient liquidity to finance increases in non-cash working capital, capital expenditures for capacity expansions, pursuit of selective acquisitions and the payment of quarterly dividends.
The Company takes a conservative approach towards financial leverage and management of financial risk and the Company currently satisfies their internal requirements.
The Company is not subject to any capital requirements imposed by a regulator.
20. EARNINGS PER SHARE
2017 2016
Weighted average common shares outstanding 75,040,113 74,360,423 Dilutive-effect of stock options 334,091 483,070 Diluted weighted average common shares outstanding 75,374,204 74,843,493
The weighted average number of diluted common shares excludes 185,500 options because they were anti-dilutive during the period (2016 – 1,659,500).
EVERTZ REPORT_2017_PRINT.indd 47 2017-09-06 12:47 PM

48 EVERTZ TECHNOLOGIES LIMITED2017 ANNUAL REPORT
21. INCOME TAXES The Company’s effective income tax rate differs from the statutory combined Canadian income tax rate as follows:
2017 2016
Expected income tax expense using statutory rates (25%, 2016 - 25%) $ 23,386 $ 24,199 Difference in foreign tax rates (46) 717 Benefit arising from a previously unrecognized tax loss (1,020) (440)Non-deductible stock based compensation 1,380 690 Items reclassified from accumulated other comprehensive income - (154)Other 73 897
$ 23,773 $ 25,909
Benefit arising from a previously unrecognized tax loss has been recognized in the year as a result of new business opportunities expected to result in taxable income in future years.
Components of deferred income taxes are summarized as follows:
April 30, 2017 April 30, 2016
Deferred income tax liabilities:Tax loss carried forward $ (1,347) $ (1,294)Research and development tax credits 1,748 1,936 Equipment tax vs accounting basis 5,742 7,130 Non-deductible reserves (1,716) (2,227)
$ 4,427 $ 5,545
As at April 30, 2017, the Company had $3,593 (2016 - $3,237) in tax losses for which no deferred tax asset has been recognized in the statement of financial position. Of these losses, $1,677 expire in 2025 while the remaining balance has no expiry.
The Company’s 2015 and 2016 Scientific Research and Experimental Development (“SR&ED”) tax claims are currently under audit by the Canada Revenue Agency. Prior SR&ED audits have resulted in approval of past claims, with any financial adjustments being insignificant. Although the outcome is uncertain, the Company is of the view that similar results are anticipated. 22. SUBSEQUENT EVENT On June 13, 2017 the Company declared a quarterly dividend of $0.18 with a record date of June 23, 2017 and a payment date of June 30, 2017.
NOTES TO THE CONSOLIDATED FINANCIAL STATEMENTS (CONT’D)Years ended April 30, 2017 and 2016 (In thousands of Canadian dollars, except for “number of common shares”, “number of options” and “per share” information)
EVERTZ REPORT_2017_PRINT.indd 48 2017-09-06 12:47 PM

49 EVERTZ TECHNOLOGIES LIMITED2017 ANNUAL REPORT
NOTES TO THE CONSOLIDATED FINANCIAL STATEMENTS (CONT’D)Years ended April 30, 2017 and 2016 (In thousands of Canadian dollars, except for “number of common shares”, “number of options” and “per share” information)
Consolidated Statement of Earnings Data
Year Ended April 30,
2017 2016 2015 2014 2013
Sales $ 384,432 $ 381,550 $ 363,606 $ 325,524 $ 316,305 Selling and administrative expenses 62,135 60,986 58,833 55,162 53,106 Research and development expenses 73,699 66,892 64,332 60,196 52,851 Earnings before income taxes 93,546 96,795 89,419 84,804 88,846 Net earnings 69,773 70,886 66,410 63,539 65,163Fully diluted EPS 0.92 0.94 0.87 0.85 0.88
Consolidated Balance Sheet Data
Year Ended April 30,
2017 2016 2015 2014 2013
Cash and instruments held for trading $ 54,274 $ 123,102 $ 100,681 $ 101,956 $ 220,668 Total assets 410,568 448,314 426,162 401,280 465,307 Shareholder’s equity 317,830 366,205 353,471 333,478 406,797 Number of common shares outstanding Basic 75,742,746 74,188,746 74,459,346 74,310,146 73,632,566 Fully-diluted 78,621,246 78,595,246 79,195,846 79,513,846 78,246,966
5-YEAR FINANCIAL HIGHLIGHTS(all amounts in thousands, except EPS and share amounts)
EVERTZ REPORT_2017_PRINT.indd 49 2017-09-06 12:47 PM

50 EVERTZ TECHNOLOGIES LIMITED2017 ANNUAL REPORT
DIRECTORS AND EXECUTIVE OFFICERSRomolo MagarelliDirector, President and Chief Executive Officer
Douglas DeBruin Executive Chairman
CORPORATE AND SHAREHOLDER INFORMATION
1 Member of the Audit Committee.2 Member of the Compensation Committee.
Vince Silvestri Vice-President of Software Systems
Kevin Hellam Vice-President of Global Delivery & Support
Dan Turow Vice-President of File Based Solutions
Paulo Francisco Vice-President of Engineering Evertz AV Division
Jeff Marks Vice-President of ManufacturingChristopher Colclough 1, 2
Director
Dr. Thomas Pistor 1
Director
Dr. Ian McWalter 1, 2
Director
Brian CampbellExecutive Vice-President, Business Development
Rakesh PatelChief Technology Officer, Director
Brian PiccioniDirector
Anthony GridleyChief Financial Officer
Eric FankhauserVice-President, Advanced Product Development
Joe CirincioneVice-President Sales – US Sports and Entertainment
Robert PeterVice-President International Operations
AUDITORSDeloitte LLPChartered Accountants 1005 Skyview Drive, Suite 202 Burlington, ON Canada L7P 5B1 T: (905) 315-6770
LEGAL COUNSEL Norton Rose Fulbright Canada LLP Royal Bank Plaza, South Tower 200 Bay Street, Suite 3800 PO Box 84, Toronto, ON Canada M5J 2Z4 T: (416) 216-4000
EXCHANGE LISTING The common shares of the Company are listed on the Toronto Stock Exchange under the symbol ET
INVESTOR RELATIONS Anthony Gridley Chief Financial Officer T: (905) 335-7580 email: [email protected]
ANNUAL SHAREHOLDERS MEETING 10:00 a.m. Thursday, October 12, 2017 1160 Sutton Drive Burlington, ON Canada L7L 6R6
REGISTRAR AND TRANSFER AGENT Computershare Investor Services Inc. 100 University Ave., 8th floor, North Tower Toronto, ON Canada M5J 2Y1 email: [email protected] T: 1-800-736-1755 www.computershare.com
EVERTZ REPORT_2017_PRINT.indd 50 2017-09-06 12:47 PM

C
M
Y
CM
MY
CY
CMY
K
EVERTZ REPORT_Inside Front_Back Cover_CMKY_2017_RV2.pdf 1 2017-09-07 9:22 PM

C
M
Y
CM
MY
CY
CMY
K
EVERTZ REPORT_Front_Back Cover_2017_RV.pdf 1 2017-09-07 9:38 PM