event-specific method for the detection of dried-killed...
TRANSCRIPT

EUR 24236 EN-2009
Event-specific Method for the Detection of Dried-killed Bacterial Biomass PT73 (TM) Derived from E. coli GM Strain AG3139
Using Real-time PCR Validation Report and Protocol
M. Mazzara, N. Foti, C. Savini, L. Bonfini, G. Van den Eede
The mission of the JRC-IHCP is to protect the interests and health of the consumer in the framework of EU legislation on chemicals, food, and consumer products by providing scientific and technical support including risk-benefit assessment and analysis of traceability. European Commission Joint Research Centre Institute for Health and Consumer Protection Contact information Address: Molecular Biology and Genomics Unit E-mail: [email protected] Tel.: +39 0332 789379 Fax: +39 0332 786159 http://ihcp.jrc.ec.europa.eu/ http://www.jrc.ec.europa.eu/ Legal Notice Neither the European Commission nor any person acting on behalf of the Commission is responsible for the use which might be made of this publication.
Europe Direct is a service to help you find answers to your questions about the European Union
Freephone number (*):
00 800 6 7 8 9 10 11
(*) Certain mobile telephone operators do not allow access to 00 800 numbers or these calls may be billed.
A great deal of additional information on the European Union is available on the Internet. It can be accessed through the Europa server http://europa.eu/ JRC56610 EUR 24236 EN ISBN 978-92-79-14981-8 ISSN 1018-5593 DOI 10.2788/58900 Luxembourg: Office for Official Publications of the European Communities © European Communities, 2009 Reproduction is authorised provided the source is acknowledged Printed in Italy
CRLVL04/08VR
Event-specific Method for the Detection of Dried-killed Bacterial Biomass PT73 (TM)
Derived from E. coli GM Strain AG3139 Using Real-time PCR
Validation Report
24 June 2009
Joint Research Centre Institute for Health and Consumer Protection
Molecular Biology and Genomics Unit
Executive Summary The JRC as Community Reference Laboratory for GM Food and Feed (CRL-GMFF), established by Regulation (EC) No 1829/2003, in collaboration with the European Network of GMO Laboratories (ENGL), has carried out a collaborative study to assess the performance of a qualitative event-specific method to detect the AG3139 transformation event in bacterial biomass derived from E. coli K-12 DNA. The collaborative trial was conducted according to internationally accepted guidelines (1, 2). In accordance with Regulation (EC) No 1829/2003 of 22 September 2003 “on genetically modified food and feed” and with Regulation (EC) No 641/2004 of 6 April 2004 “on detailed rules for the implementation of Regulation (EC) No 1829/2003”, Ajinomoto Eurolysine S.A.S. provided the detection method and the samples (genomic DNA from E. coli K-12 harbouring the AG3139 event, bacterial biomass derived thereof, genomic DNA from the parental organism E. coli K-12 MG1655, and plasmids as positive and negative control samples). The JRC prepared the validation samples. The collaborative trial involved twelve laboratories from eight European countries. The results of the international collaborative trial met the ENGL performance requirements (see Annex 1). The method is, therefore, considered applicable to the control and feed samples provided, in accordance with the requirements of Annex I-2.C.2 to Commission Regulation (EC) No 641/2004. The results of the collaborative study are made publicly available at http://gmo-crl.jrc.ec.europa.eu/.
CRL-GMFF: validation report bacterial biomass PT73 (TM) 1/23

CRLVL04/08VR
Report on Steps 1-3 of the Validation Process
Ajinomoto Eurolysine S.A.S. submitted the detection method and control samples for dried killed bacterial biomass PT73 (TM) containing event AG3139 under Article 8 and 20 of Regulation (EC) No 1829/2003 of the European Parliament and of the Council “on genetically modified food and feed”. The Community Reference Laboratory for GM Food and Feed (CRL-GMFF), following reception of the documentation and material, including control samples, (step 1 of the validation process) carried out the scientific assessment of documentation and data (step 2) in accordance with Commission Regulation (EC) No 641/2004 “on detailed rules for the implementation of Regulation (EC) No 1829/2003 of the European Parliament and of the Council as regards the application for the authorisation of new genetically modified food and feed, the notification of existing products and adventitious or technically unavoidable presence of genetically modified material which has benefited from a favourable risk evaluation” and according to its operational procedures (“Description of the CRL-GMFF Validation Process”, http://gmo-crl.jrc.ec.europa.eu/guidancedocs.htm). The scientific assessment focused on the method performance characteristics assessed against the applicable method acceptance criteria set out by the European Network of GMO Laboratories and listed in the “Definition of Minimum Performance Requirements for Analytical Methods of GMO Testing” (http://gmo-crl.jrc.ec.europa.eu/guidancedocs.htm) (see Annex 1 for a summary of method acceptance criteria and method performance requirements). During step 2, a scientific assessment was performed for bacterial biomass PT73 (TM) and positively concluded in July 2008. In July-September 2008, the CRL-GMFF experimentally verified the method characteristics (step 3, experimental testing of samples and methods) by assessing the method specificity, limit of detection (LOD) and dynamic range on feed sample on a weight basis and on the positive control sample on a genome copy number basis. The experiments were performed under repeatability conditions and demonstrated that the PCR efficiency, linearity, LOD and specificity were within the limits established by the ENGL. The DNA extraction module of the method was tested on samples of feed and a report is published on the CRL-GMFF website (http://gmo-crl.jrc.ec.europa.eu/statusofdoss.htm). A Technical Report summarising the results of tests carried out by the CRL-GMFF (step 3) is available on request.
CRL-GMFF: validation report bacterial biomass PT73 (TM) 3/23

CRLVL04/08VR
Content
1. INTRODUCTION................................................................................................ 5
2. LIST OF PARTICIPATING LABORATORIES ....................................................... 6
3. MATERIALS ....................................................................................................... 7
4. EXPERIMENTAL DESIGN................................................................................... 7
4.1. ACCURACY RATE AND DETECTION RANGE OF THE TMD SYSTEM FOR DETECTION OF EVENT
AG3139 IN BACTERIAL BIOMASS PT73 (TM) ....................................................................7 4.2. ACCURACY RATE AND DYNAMIC RANGE OF THE TMD SYSTEM FOR DETECTION OF EVENT AG3139
IN E. COLI K-12 EVENT AG3139 ...................................................................................8
5. METHOD............................................................................................................ 9
DESCRIPTION OF OPERATIONAL STEPS FOLLOWED ...............................................................9
6. DEVIATIONS REPORTED................................................................................. 10
7. SUMMARY OF RESULTS .................................................................................. 11
7.1. PERFORMANCE OF THE DETECTION METHOD ON BACTERIAL BIOMASS PT73 (TM) CONTAINING E. COLI K-12 EVENT AG3139 ........................................................................................ 11 Detection accuracy rate ......................................................................................... 11 Efficiency and linearity of the method ..................................................................... 12 7.2. ASSESSMENT OF METHOD PERFORMANCE REQUIREMENTS FOR DETECTION OF EVENT AG3139 IN
BACTERIAL BIOMASS PT73 (TM).................................................................................. 13 7.3. PERFORMANCE OF THE DETECTION METHOD ON DNA FROM CONTROL SAMPLE E. COLI K-12
EVENT AG3139 ...................................................................................................... 15 Detection accuracy rate ......................................................................................... 15 Efficiency and linearity of the method ..................................................................... 16 7.4. ASSESSMENT OF METHOD PERFORMANCE REQUIREMENTS FOR DETECTION OF EVENT AG3139 IN
E. COLI K-12 EVENT AG3139..................................................................................... 18
9. CONCLUSIONS ................................................................................................ 19
10. QUALITY ASSURANCE..................................................................................... 20
11. REFERENCES ................................................................................................... 20
12. ANNEX 1: METHOD ACCEPTANCE CRITERIA AND METHOD PERFORMANCE REQUIREMENTS AS SET BY THE EUROPEAN NETWORK OF GMO LABORATORIES (ENGL) .................................................................................. 21
CRL-GMFF: validation report bacterial biomass PT73 (TM) 4/23

CRLVL04/08VR
1. Introduction Ajinomoto Eurolysine S.A.S. submitted the detection method, control samples for E. coli K-12 GM event AG3139 (hereinafter referred to as ‘AG3139’) and samples of feed PT73 (TM) dried- killed bacterial biomass under Articles 8 and 20 of Regulation (EC) No 1829/2003 of the European Parliament and of the Council “on genetically modified food and feed”. The Joint Research Centre (JRC, Molecular Biology and Genomics Unit of the Institute for Health and Consumer Protection) as Community Reference Laboratory for GM Food and Feed (see Commission Regulation (EC) No 1829/2003) organised the international collaborative study for the event-specific method for the detection of event AG3139 in both the feed and the control samples. The study involved twelve laboratories among those listed in Annex II (“National reference laboratories assisting the CRL for testing and validation of methods for detection”) of Commission Regulation (EC) No 1981/2006 of 22 December 2006. Upon reception of method, samples and related data (step 1), the JRC carried out the assessment of the documentation (step 2) and the in-house evaluation of the method (step 3) according to the requirements of Commission Regulation (EC) No 641/2004 and following its operational procedures. The internal experimental evaluation of the method was carried out between July and August 2008. Following the evaluation of the data and the results of the internal laboratory tests, the international collaborative study was organised (step 4) and took place in October 2008. A method for DNA extraction from PT73 (TM) biomass, submitted by the applicant, was evaluated by the CRL-GMFF in order to confirm its performance characteristics. The protocol for DNA extraction is available at http://gmo-crl.jrc.ec.europa.eu/. The operational procedure of the collaborative study included the following modules:
• DNA extraction procedure to extract DNA from dried killed bacterial biomass of E. coli K-12 event AG3139. A report on the method testing is available at http://gmo-crl.jrc.ec.europa.eu/.
• Qualitative real-time PCR (Polymerase Chain Reaction). The method is an event-specific
real-time qualitative TaqMan® PCR procedure for the detection of event AG3139 DNA. The international collaborative study was carried out in accordance with the following internationally accepted guidelines: ISO 5725 (1994). The IUPAC “Protocol for the design, conduct and interpretation of method-performance
studies” (Horwitz, 1995).
CRL-GMFF: validation report bacterial biomass PT73 (TM) 5/23
CRLVL04/08VR
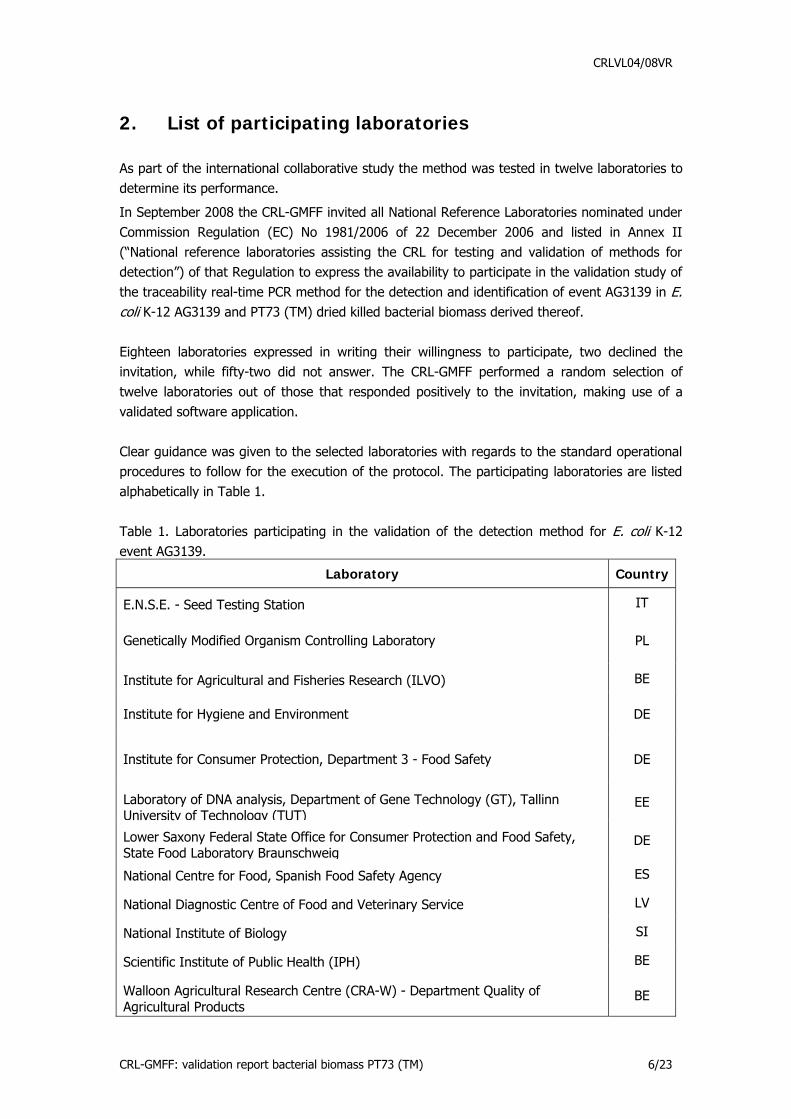
2. List of participating laboratories As part of the international collaborative study the method was tested in twelve laboratories to determine its performance.
In September 2008 the CRL-GMFF invited all National Reference Laboratories nominated under Commission Regulation (EC) No 1981/2006 of 22 December 2006 and listed in Annex II (“National reference laboratories assisting the CRL for testing and validation of methods for detection”) of that Regulation to express the availability to participate in the validation study of the traceability real-time PCR method for the detection and identification of event AG3139 in E. coli K-12 AG3139 and PT73 (TM) dried killed bacterial biomass derived thereof. Eighteen laboratories expressed in writing their willingness to participate, two declined the invitation, while fifty-two did not answer. The CRL-GMFF performed a random selection of twelve laboratories out of those that responded positively to the invitation, making use of a validated software application. Clear guidance was given to the selected laboratories with regards to the standard operational procedures to follow for the execution of the protocol. The participating laboratories are listed alphabetically in Table 1. Table 1. Laboratories participating in the validation of the detection method for E. coli K-12 event AG3139.
Laboratory Country
E.N.S.E. - Seed Testing Station IT
Genetically Modified Organism Controlling Laboratory PL
Institute for Agricultural and Fisheries Research (ILVO) BE
Institute for Hygiene and Environment DE
Institute for Consumer Protection, Department 3 - Food Safety DE
Laboratory of DNA analysis, Department of Gene Technology (GT), Tallinn University of Technology (TUT)
EE
Lower Saxony Federal State Office for Consumer Protection and Food Safety, State Food Laboratory Braunschweig
DE
National Centre for Food, Spanish Food Safety Agency ES
National Diagnostic Centre of Food and Veterinary Service LV
National Institute of Biology SI
Scientific Institute of Public Health (IPH) BE
Walloon Agricultural Research Centre (CRA-W) - Department Quality of Agricultural Products
BE
CRL-GMFF: validation report bacterial biomass PT73 (TM) 6/23
CRLVL04/08VR
3. Materials For the validation of the qualitative event-specific method, control samples consisted of: i) dried killed bacterial biomass PT73 (TM) made of cells of bacterial strain AG3139, and ii) genomic DNA extracted from E. coli K-12 event AG3139 were provided by the applicant in accordance to the provisions of Commission Regulation (EC) No 1829/2003, Art 2.11 [control sample defined as the GMO or its genetic material (positive sample) and the parental organism or its genetic material that has been used for the purpose of the genetic modification (negative sample)]. The control sample consisting of genomic DNA from bacterial strain AG3139 at the starting concentration of 26214 copies/μL was prepared by the CRL-GMFF. Samples of the dilution series were prepared by the participant laboratories using DNA stock solutions extracted from E. coli K-12 event AG3139 and the PT73 (TM) biomass. Participants received the following materials:
PT73 (TM) biomass (2 grams of finely ground powder). Internal Positive Control (200 µL of DNA solution at 10 ng/µL) extracted from the PT73
(TM) biomass. Genomic DNA of strain AG3139 (310 µL of DNA solution at 26214 copies/µL). Reaction reagents as follows:
universal PCR Master Mix (2x), two bottles: 5 mL each distilled sterile water, one tube: 15 mL
Primers and probes (1 tube each) as follows:
TMD system TMD-F (10 µM): 715 µL TMD-R (10 µM): 715 µL TMD-P (5 µM): 420 µL
4. Experimental design
The method module focusing on the testing of the qualitative real-time PCR was divided in two phases to assess the method performance in the detection of event AG3139 respectively in the feed sample PT73 (TM) and in the positive control sample E. coli K-12 event AG3139.
4.1. Accuracy rate and detection range of the TMD system for detection of event AG3139 in bacterial biomass PT73 (TM)
In the first phase of the collaborative study, four independent DNA extractions have been performed by each laboratory on the feed sample, the bacterial biomass PT73 (TM).
CRL-GMFF: validation report bacterial biomass PT73 (TM) 7/23
CRLVL04/08VR
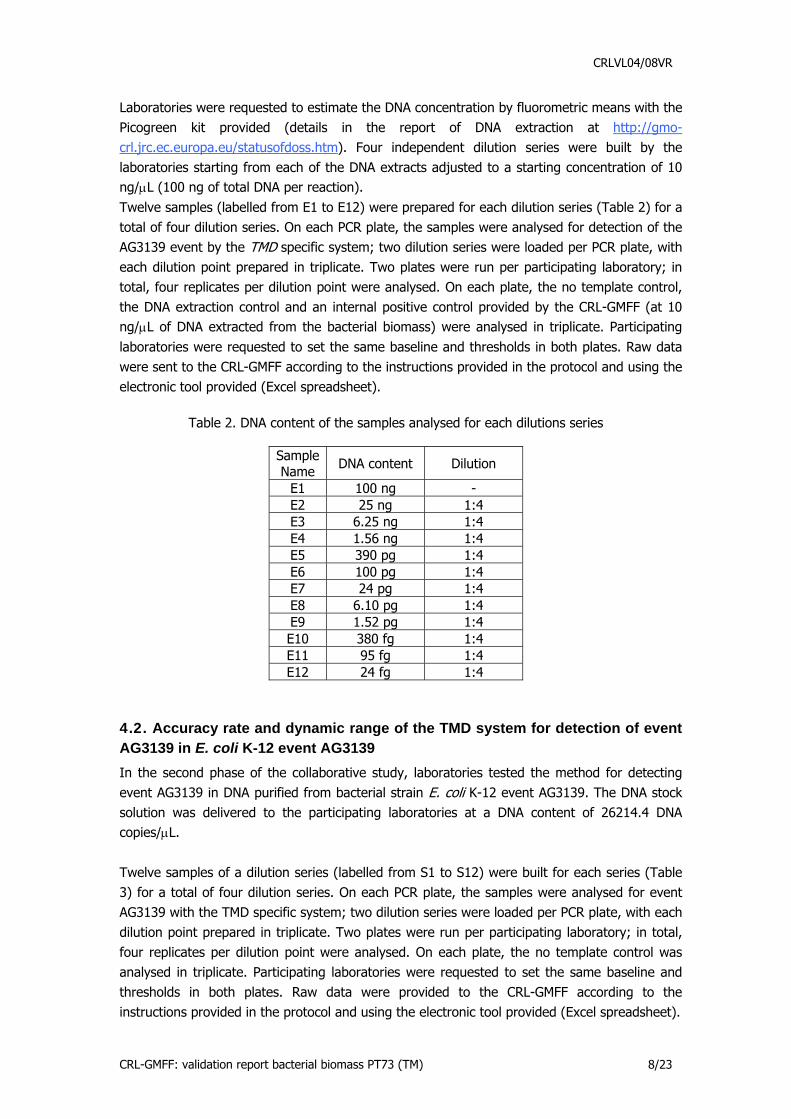
Laboratories were requested to estimate the DNA concentration by fluorometric means with the Picogreen kit provided (details in the report of DNA extraction at http://gmo-crl.jrc.ec.europa.eu/statusofdoss.htm). Four independent dilution series were built by the laboratories starting from each of the DNA extracts adjusted to a starting concentration of 10 ng/μL (100 ng of total DNA per reaction). Twelve samples (labelled from E1 to E12) were prepared for each dilution series (Table 2) for a total of four dilution series. On each PCR plate, the samples were analysed for detection of the AG3139 event by the TMD specific system; two dilution series were loaded per PCR plate, with each dilution point prepared in triplicate. Two plates were run per participating laboratory; in total, four replicates per dilution point were analysed. On each plate, the no template control, the DNA extraction control and an internal positive control provided by the CRL-GMFF (at 10 ng/μL of DNA extracted from the bacterial biomass) were analysed in triplicate. Participating laboratories were requested to set the same baseline and thresholds in both plates. Raw data were sent to the CRL-GMFF according to the instructions provided in the protocol and using the electronic tool provided (Excel spreadsheet).
Table 2. DNA content of the samples analysed for each dilutions series
Sample Name DNA content Dilution
E1 100 ng - E2 25 ng 1:4 E3 6.25 ng 1:4 E4 1.56 ng 1:4 E5 390 pg 1:4 E6 100 pg 1:4 E7 24 pg 1:4 E8 6.10 pg 1:4 E9 1.52 pg 1:4 E10 380 fg 1:4 E11 95 fg 1:4 E12 24 fg 1:4
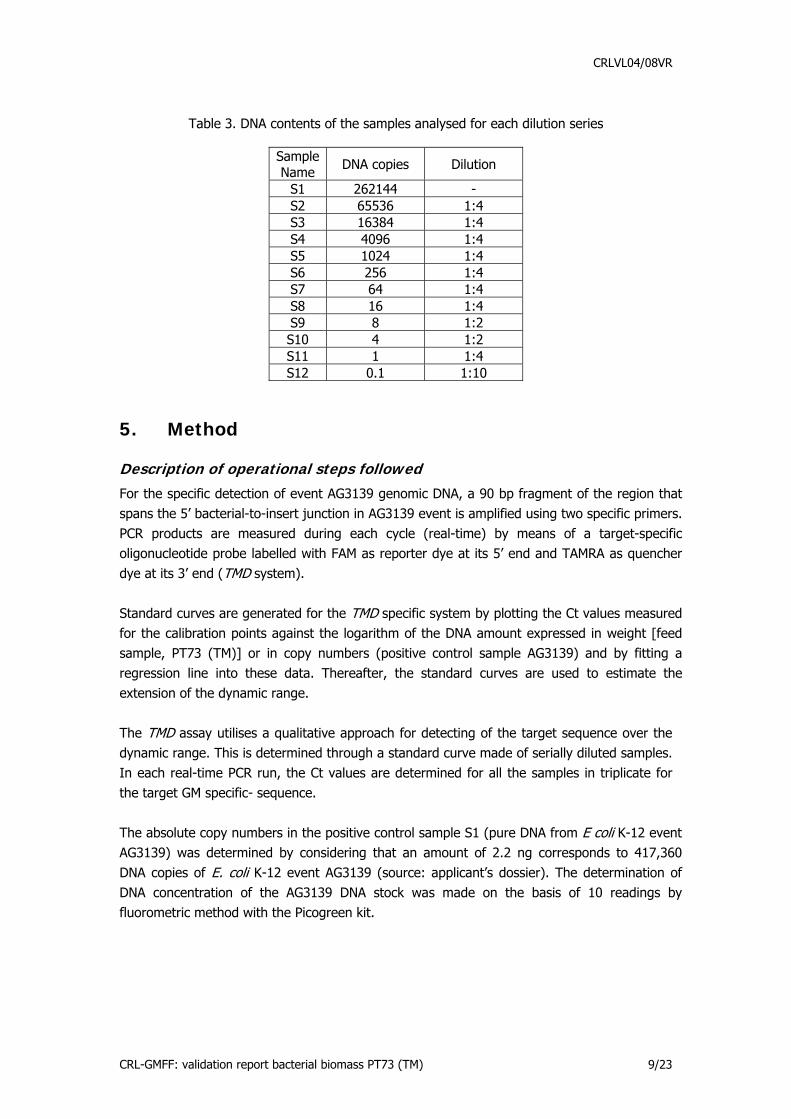
4.2. Accuracy rate and dynamic range of the TMD system for detection of event AG3139 in E. coli K-12 event AG3139 In the second phase of the collaborative study, laboratories tested the method for detecting event AG3139 in DNA purified from bacterial strain E. coli K-12 event AG3139. The DNA stock solution was delivered to the participating laboratories at a DNA content of 26214.4 DNA copies/μL. Twelve samples of a dilution series (labelled from S1 to S12) were built for each series (Table 3) for a total of four dilution series. On each PCR plate, the samples were analysed for event AG3139 with the TMD specific system; two dilution series were loaded per PCR plate, with each dilution point prepared in triplicate. Two plates were run per participating laboratory; in total, four replicates per dilution point were analysed. On each plate, the no template control was analysed in triplicate. Participating laboratories were requested to set the same baseline and thresholds in both plates. Raw data were provided to the CRL-GMFF according to the instructions provided in the protocol and using the electronic tool provided (Excel spreadsheet).
CRL-GMFF: validation report bacterial biomass PT73 (TM) 8/23
CRLVL04/08VR
Table 3. DNA contents of the samples analysed for each dilution series
Sample Name DNA copies Dilution
S1 262144 - S2 65536 1:4 S3 16384 1:4 S4 4096 1:4 S5 1024 1:4 S6 256 1:4 S7 64 1:4 S8 16 1:4 S9 8 1:2 S10 4 1:2 S11 1 1:4 S12 0.1 1:10
5. Method
Description of operational steps followed For the specific detection of event AG3139 genomic DNA, a 90 bp fragment of the region that spans the 5’ bacterial-to-insert junction in AG3139 event is amplified using two specific primers. PCR products are measured during each cycle (real-time) by means of a target-specific oligonucleotide probe labelled with FAM as reporter dye at its 5’ end and TAMRA as quencher dye at its 3’ end (TMD system). Standard curves are generated for the TMD specific system by plotting the Ct values measured for the calibration points against the logarithm of the DNA amount expressed in weight [feed sample, PT73 (TM)] or in copy numbers (positive control sample AG3139) and by fitting a regression line into these data. Thereafter, the standard curves are used to estimate the extension of the dynamic range. The TMD assay utilises a qualitative approach for detecting of the target sequence over the dynamic range. This is determined through a standard curve made of serially diluted samples. In each real-time PCR run, the Ct values are determined for all the samples in triplicate for the target GM specific- sequence. The absolute copy numbers in the positive control sample S1 (pure DNA from E coli K-12 event AG3139) was determined by considering that an amount of 2.2 ng corresponds to 417,360 DNA copies of E. coli K-12 event AG3139 (source: applicant’s dossier). The determination of DNA concentration of the AG3139 DNA stock was made on the basis of 10 readings by fluorometric method with the Picogreen kit.
CRL-GMFF: validation report bacterial biomass PT73 (TM) 9/23
CRLVL04/08VR
6. Deviations reported Eight laboratories reported no deviations from the protocol. One laboratory did not follow the indicated loading order for the “E” dilution series but introduced the correct Ct values for the corresponding samples in the excel spreadsheet for data analysis. One laboratory had to re-run one series of dilution “E” and one series of dilution “S”. One laboratory re-run plates A and B due to an error in the cycling program. One laboratory re-calculated reagents concentration to allocate a 20 μL volume in the wells of a 384 well plate with no consequences on the E dilution series but with a total DNA copy number of 209,712 instead of 262,140 in the S1 samples. The values for the slope of the regression line, efficiency and linearity were recalculated by the CRL-GMFF taking into account this deviation. One laboratory measured the DNA concentration of the DNA extracts from the feed sample PT73 (TM) via spectrophotometric instead of fluorometric means. This was a major protocol violation. The laboratory overestimated consistently the DNA content in the extracts compared to the remaining eleven laboratories (Report on DNA extraction method at http://gmo-crl.jrc.ec.europa.eu/); consequently, data from the dilution series EA to ED were not computed in data analysis for this laboratory.
CRL-GMFF: validation report bacterial biomass PT73 (TM) 10/23
CRLVL04/08VR
7. Summary of results
7.1. Performance of the detection method on bacterial biomass PT73 (TM) containing E. coli K-12 event AG3139
Detection accuracy rate
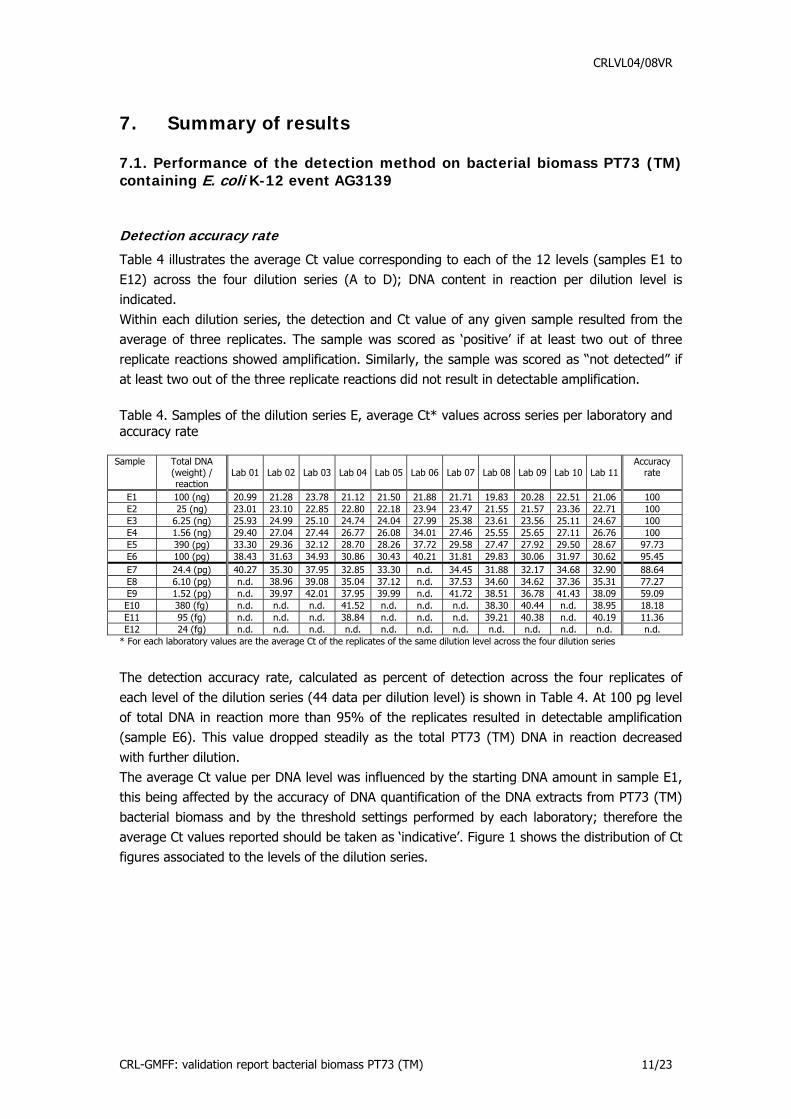
Table 4 illustrates the average Ct value corresponding to each of the 12 levels (samples E1 to E12) across the four dilution series (A to D); DNA content in reaction per dilution level is indicated. Within each dilution series, the detection and Ct value of any given sample resulted from the average of three replicates. The sample was scored as ‘positive’ if at least two out of three replicate reactions showed amplification. Similarly, the sample was scored as “not detected” if at least two out of the three replicate reactions did not result in detectable amplification. Table 4. Samples of the dilution series E, average Ct* values across series per laboratory and accuracy rate
Sample Total DNA (weight) / reaction
Lab 01 Lab 02 Lab 03 Lab 04 Lab 05 Lab 06 Lab 07 Lab 08 Lab 09 Lab 10 Lab 11 Accuracy
rate
E1 100 (ng) 20.99 21.28 23.78 21.12 21.50 21.88 21.71 19.83 20.28 22.51 21.06 100 E2 25 (ng) 23.01 23.10 22.85 22.80 22.18 23.94 23.47 21.55 21.57 23.36 22.71 100 E3 6.25 (ng) 25.93 24.99 25.10 24.74 24.04 27.99 25.38 23.61 23.56 25.11 24.67 100 E4 1.56 (ng) 29.40 27.04 27.44 26.77 26.08 34.01 27.46 25.55 25.65 27.11 26.76 100 E5 390 (pg) 33.30 29.36 32.12 28.70 28.26 37.72 29.58 27.47 27.92 29.50 28.67 97.73 E6 100 (pg) 38.43 31.63 34.93 30.86 30.43 40.21 31.81 29.83 30.06 31.97 30.62 95.45 E7 24.4 (pg) 40.27 35.30 37.95 32.85 33.30 n.d. 34.45 31.88 32.17 34.68 32.90 88.64 E8 6.10 (pg) n.d. 38.96 39.08 35.04 37.12 n.d. 37.53 34.60 34.62 37.36 35.31 77.27 E9 1.52 (pg) n.d. 39.97 42.01 37.95 39.99 n.d. 41.72 38.51 36.78 41.43 38.09 59.09 E10 380 (fg) n.d. n.d. n.d. 41.52 n.d. n.d. n.d. 38.30 40.44 n.d. 38.95 18.18 E11 95 (fg) n.d. n.d. n.d. 38.84 n.d. n.d. n.d. 39.21 40.38 n.d. 40.19 11.36 E12 24 (fg) n.d. n.d. n.d. n.d. n.d. n.d. n.d. n.d. n.d. n.d. n.d. n.d.
* For each laboratory values are the average Ct of the replicates of the same dilution level across the four dilution series
The detection accuracy rate, calculated as percent of detection across the four replicates of each level of the dilution series (44 data per dilution level) is shown in Table 4. At 100 pg level of total DNA in reaction more than 95% of the replicates resulted in detectable amplification (sample E6). This value dropped steadily as the total PT73 (TM) DNA in reaction decreased with further dilution. The average Ct value per DNA level was influenced by the starting DNA amount in sample E1, this being affected by the accuracy of DNA quantification of the DNA extracts from PT73 (TM) bacterial biomass and by the threshold settings performed by each laboratory; therefore the average Ct values reported should be taken as ‘indicative’. Figure 1 shows the distribution of Ct figures associated to the levels of the dilution series.
CRL-GMFF: validation report bacterial biomass PT73 (TM) 11/23
CRLVL04/08VR
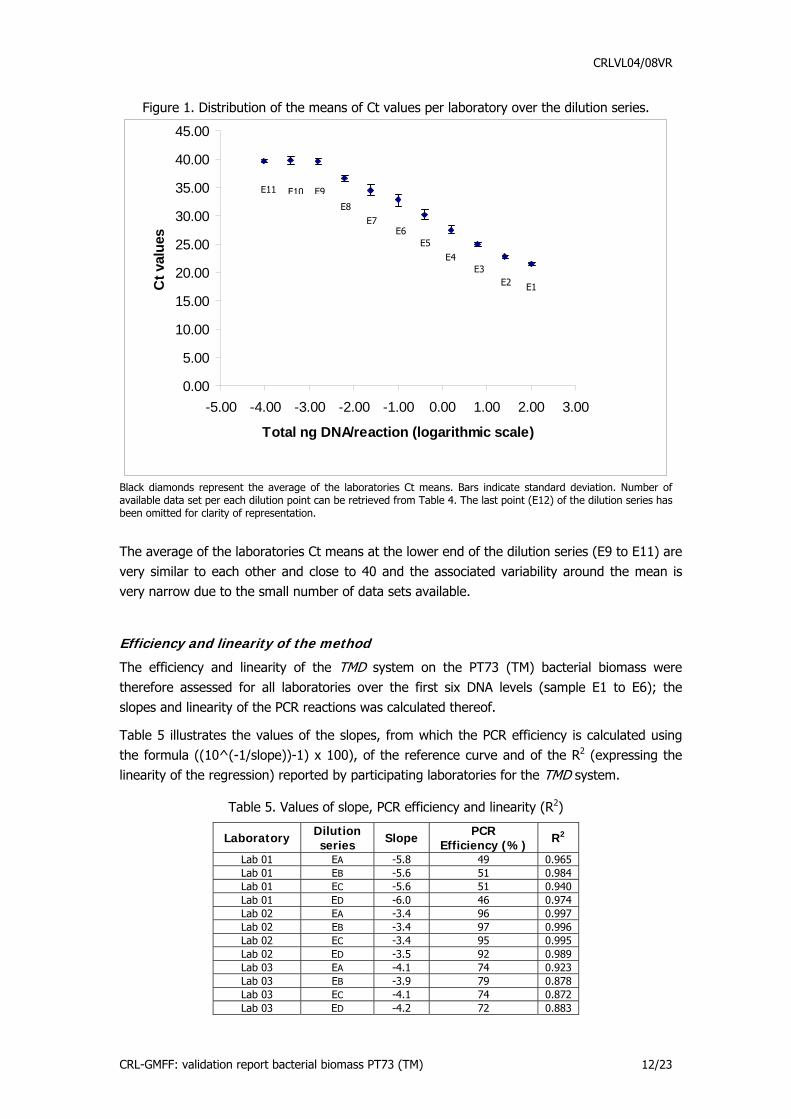
Figure 1. Distribution of the means of Ct values per laboratory over the dilution series.
0.00
5.00
10.00
15.00
20.00
25.00
30.00
35.00
40.00
45.00
-5.00 -4.00 -3.00 -2.00 -1.00 0.00 1.00 2.00 3.00
Total ng DNA/reaction (logarithmic scale)
Ct v
alue
s
E11 E10 E9
E8E7
E6E5
E4E3
E2 E1
Black diamonds represent the average of the laboratories Ct means. Bars indicate standard deviation. Number of available data set per each dilution point can be retrieved from Table 4. The last point (E12) of the dilution series has been omitted for clarity of representation.
The average of the laboratories Ct means at the lower end of the dilution series (E9 to E11) are very similar to each other and close to 40 and the associated variability around the mean is very narrow due to the small number of data sets available.
Efficiency and linearity of the method
The efficiency and linearity of the TMD system on the PT73 (TM) bacterial biomass were therefore assessed for all laboratories over the first six DNA levels (sample E1 to E6); the slopes and linearity of the PCR reactions was calculated thereof.
Table 5 illustrates the values of the slopes, from which the PCR efficiency is calculated using the formula ((10^(-1/slope))-1) x 100), of the reference curve and of the R2 (expressing the linearity of the regression) reported by participating laboratories for the TMD system.
Table 5. Values of slope, PCR efficiency and linearity (R2)
Laboratory Dilution series Slope PCR
Efficiency (%) R2
Lab 01 EA -5.8 49 0.965 Lab 01 EB -5.6 51 0.984 Lab 01 EC -5.6 51 0.940 Lab 01 ED -6.0 46 0.974 Lab 02 EA -3.4 96 0.997 Lab 02 EB -3.4 97 0.996 Lab 02 EC -3.4 95 0.995 Lab 02 ED -3.5 92 0.989 Lab 03 EA -4.1 74 0.923 Lab 03 EB -3.9 79 0.878 Lab 03 EC -4.1 74 0.872 Lab 03 ED -4.2 72 0.883
CRL-GMFF: validation report bacterial biomass PT73 (TM) 12/23

CRLVL04/08VR
Laboratory Dilution
series Slope PCR Efficiency (%) R2
Lab 04 EA -3.3 103 0.997 Lab 04 EB -3.3 102 0.997 Lab 04 EC -3.2 103 0.997 Lab 04 ED -3.2 104 0.998 Lab 05 EA -3.1 110 0.978 Lab 05 EB -3.2 106 0.984 Lab 05 EC -2.9 120 0.977 Lab 05 ED -3.1 110 0.981 Lab 06 EA -6.5 43 0.960 Lab 06 EB -5.9 47 0.970 Lab 06 EC -8.6 31 0.960 Lab 06 ED -7.3 37 0.904 Lab 07 EA -3.4 97 0.993 Lab 07 EB -3.4 96 0.996 Lab 07 EC -3.3 100 0.996 Lab 07 ED -3.3 99 0.998 Lab 08 EA -3.3 99 0.985 Lab 08 EB -3.3 99 0.992 Lab 08 EC -3.2 103 0.990 Lab 08 ED -3.3 101 0.992 Lab 09 EA -3.3 102 0.991 Lab 09 EB -3.4 95 0.994 Lab 09 EC -3.3 100 0.993 Lab 09 ED -3.3 103 0.994 Lab 10 EA -3.4 95 0.979 Lab 10 EB -3.0 114 0.966 Lab 10 EC -3.4 98 0.979 Lab 10 ED -3.0 115 0.982 Lab 11 EA -3.0 114 0.996 Lab 11 EB -3.1 109 0.995 Lab 11 EC -3.2 104 0.996 Lab 11 ED -3.5 95 0.998
With the exception of two laboratories the efficiencies calculated from the corresponding slopes ranged from more than 70% to around 120%. In most cases, the slopes of the regression lines for detection of AG3139 event in PT73 (TM) biomass extended from -3.0 to -4.2.
7.2. Assessment of method performance requirements for detection of event AG3139 in bacterial biomass PT73 (TM)
Further to the identification and removal of outlier laboratories according to ISO 5725-2, through Cochran and Grubbs tests based on the slope dataset, the mean value of the slope of the regression lines of the method of detection of event AG3139 in PT73 (TM) bacterial biomass (in the range from 100 ng to 100 pg of total DNA) was -3.37 with a relative repeatability standard deviation (RSDr) of 3.5% and a relative reproducibility standard deviation (RSDR) of 9.4% (Table 6).
CRL-GMFF: validation report bacterial biomass PT73 (TM) 13/23

CRLVL04/08VR
Table 6. Detection of AG3139 in PT73 (TM) bacterial biomass: summary of validation results for the slope
Laboratories having returned valid results 11
Samples per laboratory 4
Number of outliers 2
Reason for exclusion 1 C, 1G
Mean value of the slope -3.37
Relative repeatability standard deviation, RSDr (%) 3.5
Repeatability standard deviation 0.117
Relative reproducibility standard deviation, RSDR (%) 9.4
Reproducibility standard deviation 0.317
C = Cochran’s test; G = Grubbs’ test; identification and removal of outliers through Cochran and Grubbs tests, according to ISO 5725-2.
The PCR efficiency and the coefficient of determination, giving method linearity (R2), were subsequently analysed (Table 7) and evaluated according to the limits set by the ENGL document “Definition of Minimum Performance Requirements for Analytical Methods of GMO Testing” (http://gmo-crl.jrc.ec.europa.eu/guidancedocs.htm). The reaction efficiency was 99% with a limited variability (RSDr % of 5.25 and RSDR of 11%), thus within the ENGL requirements; the method linearity was 0.97, just below the lower limit of 0.98 indicated by the ENGL minimum acceptance criteria.
Table 7. Mean values, RSDr and RSDR for PCR efficiency and coefficient of determination
Efficiency R2
Number of data 36 36
Mean value 99 0.97
Relative repeatability standard deviation, RSDr (%) 5.2 1.5
Repeatability standard deviation 5.149 0.014
Relative reproducibility standard deviation, RSDR (%) 11 6.3
Reproducibility standard deviation 11.205 0.061
When the two outlying laboratories were excluded from the computation of the accuracy rate, this showed a far better performance (compare to Table 4), with the remaining laboratories detecting the target at a total DNA amount per reaction down to 6.1 pg (Table 8), close to 95% of the times (94.4%).
CRL-GMFF: validation report bacterial biomass PT73 (TM) 14/23

CRLVL04/08VR
Table 8. Samples of the dilution series E, average Ct* across series per laboratory and accuracy after identification and removal of outlying laboratories through Cochran and Grubbs tests, according to ISO 5725-2
Sample Total DNA (weight) / reaction
Lab 02 Lab 03 Lab 04 Lab 05 Lab 07 Lab 08 Lab 09 Lab 10 Lab 11 Accuracy rate
E1 100 (ng) 21.28 23.78 21.12 21.50 21.71 19.83 20.28 22.51 21.06 100 E2 25 (ng) 23.10 22.85 22.80 22.18 23.47 21.55 21.57 23.36 22.71 100 E3 6.25 (ng) 24.99 25.10 24.74 24.04 25.38 23.61 23.56 25.11 24.67 100 E4 1.56 (ng) 27.04 27.44 26.77 26.08 27.46 25.55 25.65 27.11 26.76 100 E5 390 (pg) 29.36 32.12 28.70 28.26 29.58 27.47 27.92 29.50 28.67 100 E6 100 (pg) 31.63 34.93 30.86 30.43 31.81 29.83 30.06 31.97 30.62 100 E7 24.4 (pg) 35.30 37.95 32.85 33.30 34.45 31.88 32.17 34.68 32.90 100 E8 6.10 (pg) 38.96 39.08 35.04 37.12 37.53 34.60 34.62 37.36 35.31 94.44 E9 1.52 (pg) 39.97 42.01 37.95 39.99 41.72 38.51 36.78 41.43 38.09 72.22 E10 380 (fg) n.d. n.d. 41.52 n.d. n.d. 38.30 40.44 n.d. 38.95 22.22 E11 95 (fg) n.d. n.d. 38.84 n.d. n.d. 39.21 40.38 n.d. 40.19 13.89 E12 24 (fg) n.d. n.d. n.d. n.d. n.d. n.d. n.d. n.d. n.d. 0
* For each laboratory values are the average Ct of the replicates of the same dilution level across the four dilution series
Overall, the data reported confirm the appropriate performance characteristics of the method proposed to detect E coli K-12 event AG3139 in feed material the dried killed bacterial biomass PT73 (TM).
7.3. Performance of the detection method on DNA from control sample E. coli K-12 event AG3139
Detection accuracy rate
Table 9 illustrates the average Ct value corresponding to each of the 12 levels (samples S1 to S12) across the four dilution series (A to D); the DNA content in copy number per dilution level is indicated. Within each dilution series, the Ct value of any given sample resulted from the average of three replicates. At least two out of three replicate reactions needed to show amplification for scoring the sample as ‘positive’. Similarly, whenever at least two out of the three replicate reactions did not result in detectable amplification, the result was considered negative, i.e. sample not detected (n.d.).
Table 9. Samples of the dilution series S, average Ct* across series per laboratory and accuracy rate
Sample DNA copies/ reaction Lab 01 Lab 02 Lab 03 Lab 04 Lab 05 Lab 06 Lab 07 Lab 08 Lab 09 Lab 10 Lab 11 Lab 12 Accuracy
rate S1 262144 21.09 20.81 20.99 20.12 20.36 19.19 20.71 19.72 19.60 21.83 20.77 21.66 100.00 S2 65536 23.04 22.84 23.88 22.09 22.00 21.26 22.66 21.55 21.60 23.98 22.75 23.65 100.00 S3 16384 25.47 24.87 25.81 24.06 24.05 24.76 24.64 23.53 23.74 26.14 24.76 25.79 100.00 S4 4096 28.37 27.11 28.47 26.13 26.12 31.00 26.80 25.66 25.98 28.27 26.92 28.01 100.00 S5 1024 30.72 29.37 30.90 28.10 28.27 35.01 28.93 27.68 27.89 30.48 29.00 31.29 100.00 S6 256 33.07 31.69 34.17 30.09 30.98 31.60 30.76 29.99 29.94 32.76 30.89 34.11 93.75 S7 64 35.02 34.06 36.40 32.06 32.62 34.36 32.80 32.25 32.24 35.04 33.04 36.86 93.75 S8 16 37.10 36.66 39.36 34.02 34.86 n.d. 35.04 34.34 34.66 37.11 35.31 40.18 89.58 S9 8 38.08 37.80 35.42 35.30 36.15 n.d. 37.45 35.30 35.90 38.09 36.65 40.01 81.25 S10 4 38.79 38.60 39.54 36.17 37.28 n.d. n.d. 36.94 36.64 39.54 37.54 39.88 68.75 S11 1 40.39 n.d. n.d. 37.79 n.d. n.d. n.d. 37.31 38.03 40.84 38.38 n.d. 25.00 S12 0.1 n.d. n.d. n.d. n.d. n.d. n.d. n.d. n.d. n.d. n.d. n.d. n.d. n.d. * For each laboratory values are the average of the replicates of the same level across the four dilution series
CRL-GMFF: validation report bacterial biomass PT73 (TM) 15/23
CRLVL04/08VR
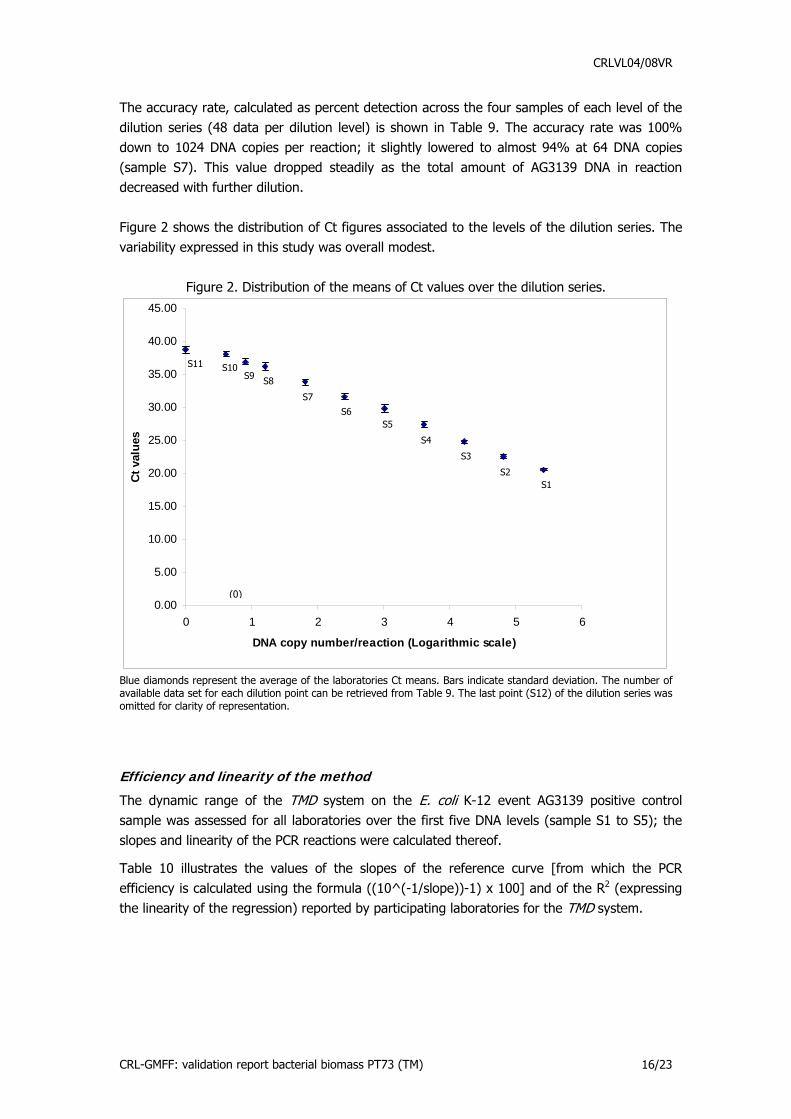
The accuracy rate, calculated as percent detection across the four samples of each level of the dilution series (48 data per dilution level) is shown in Table 9. The accuracy rate was 100% down to 1024 DNA copies per reaction; it slightly lowered to almost 94% at 64 DNA copies (sample S7). This value dropped steadily as the total amount of AG3139 DNA in reaction decreased with further dilution. Figure 2 shows the distribution of Ct figures associated to the levels of the dilution series. The variability expressed in this study was overall modest.
Figure 2. Distribution of the means of Ct values over the dilution series.
0.00
5.00
10.00
15.00
20.00
25.00
30.00
35.00
40.00
45.00
0 1 2 3 4 5 6
DNA copy number/reaction (Logarithmic scale)
Ct v
alue
s
(0)
S11 S10S9 S8
S7
S6S5
S4
S3
S2S1
Blue diamonds represent the average of the laboratories Ct means. Bars indicate standard deviation. The number of available data set for each dilution point can be retrieved from Table 9. The last point (S12) of the dilution series was omitted for clarity of representation.
Efficiency and linearity of the method
The dynamic range of the TMD system on the E. coli K-12 event AG3139 positive control sample was assessed for all laboratories over the first five DNA levels (sample S1 to S5); the slopes and linearity of the PCR reactions were calculated thereof.
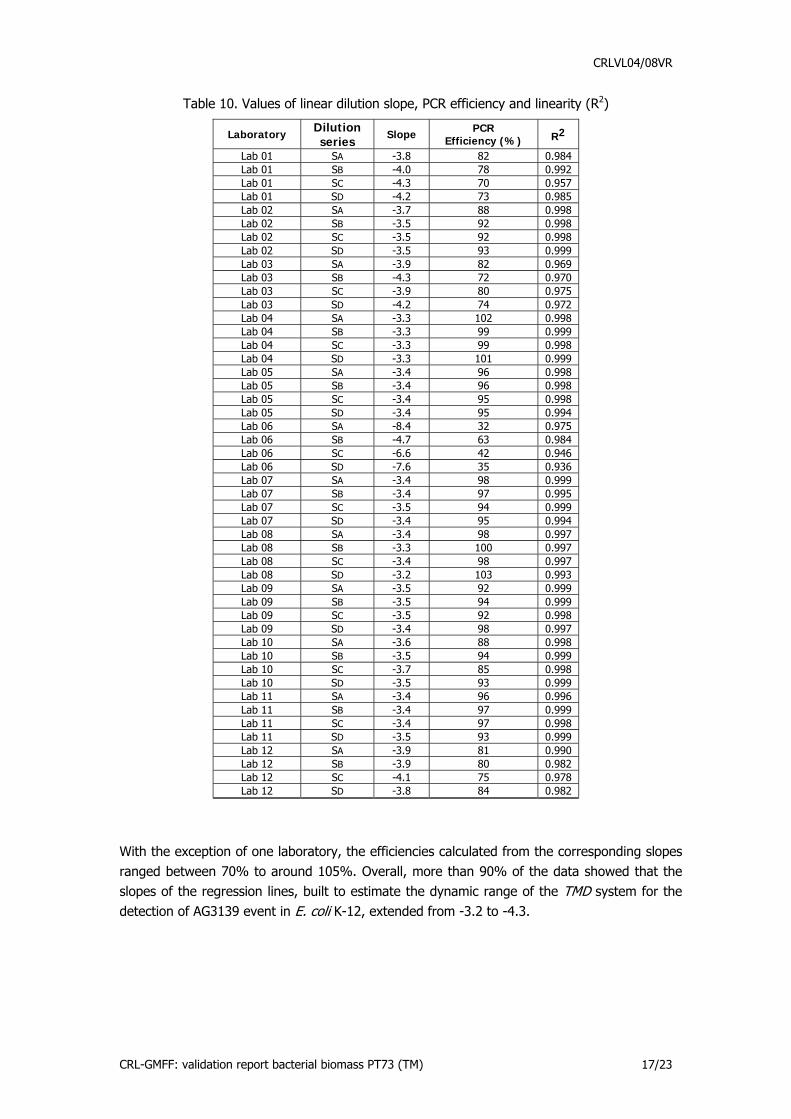
Table 10 illustrates the values of the slopes of the reference curve [from which the PCR efficiency is calculated using the formula ((10^(-1/slope))-1) x 100] and of the R2 (expressing the linearity of the regression) reported by participating laboratories for the TMD system.
CRL-GMFF: validation report bacterial biomass PT73 (TM) 16/23
CRLVL04/08VR
Table 10. Values of linear dilution slope, PCR efficiency and linearity (R2)
Laboratory Dilution series
Slope PCR Efficiency (%) R2
Lab 01 SA -3.8 82 0.984 Lab 01 SB -4.0 78 0.992 Lab 01 SC -4.3 70 0.957 Lab 01 SD -4.2 73 0.985 Lab 02 SA -3.7 88 0.998 Lab 02 SB -3.5 92 0.998 Lab 02 SC -3.5 92 0.998 Lab 02 SD -3.5 93 0.999 Lab 03 SA -3.9 82 0.969 Lab 03 SB -4.3 72 0.970 Lab 03 SC -3.9 80 0.975 Lab 03 SD -4.2 74 0.972 Lab 04 SA -3.3 102 0.998 Lab 04 SB -3.3 99 0.999 Lab 04 SC -3.3 99 0.998 Lab 04 SD -3.3 101 0.999 Lab 05 SA -3.4 96 0.998 Lab 05 SB -3.4 96 0.998 Lab 05 SC -3.4 95 0.998 Lab 05 SD -3.4 95 0.994 Lab 06 SA -8.4 32 0.975 Lab 06 SB -4.7 63 0.984 Lab 06 SC -6.6 42 0.946 Lab 06 SD -7.6 35 0.936 Lab 07 SA -3.4 98 0.999 Lab 07 SB -3.4 97 0.995 Lab 07 SC -3.5 94 0.999 Lab 07 SD -3.4 95 0.994 Lab 08 SA -3.4 98 0.997 Lab 08 SB -3.3 100 0.997 Lab 08 SC -3.4 98 0.997 Lab 08 SD -3.2 103 0.993 Lab 09 SA -3.5 92 0.999 Lab 09 SB -3.5 94 0.999 Lab 09 SC -3.5 92 0.998 Lab 09 SD -3.4 98 0.997 Lab 10 SA -3.6 88 0.998 Lab 10 SB -3.5 94 0.999 Lab 10 SC -3.7 85 0.998 Lab 10 SD -3.5 93 0.999 Lab 11 SA -3.4 96 0.996 Lab 11 SB -3.4 97 0.999 Lab 11 SC -3.4 97 0.998 Lab 11 SD -3.5 93 0.999 Lab 12 SA -3.9 81 0.990 Lab 12 SB -3.9 80 0.982 Lab 12 SC -4.1 75 0.978 Lab 12 SD -3.8 84 0.982
With the exception of one laboratory, the efficiencies calculated from the corresponding slopes ranged between 70% to around 105%. Overall, more than 90% of the data showed that the slopes of the regression lines, built to estimate the dynamic range of the TMD system for the detection of AG3139 event in E. coli K-12, extended from -3.2 to -4.3.
CRL-GMFF: validation report bacterial biomass PT73 (TM) 17/23
CRLVL04/08VR
7.4. Assessment of method performance requirements for detection of event AG3139 in E. coli K-12 event AG3139
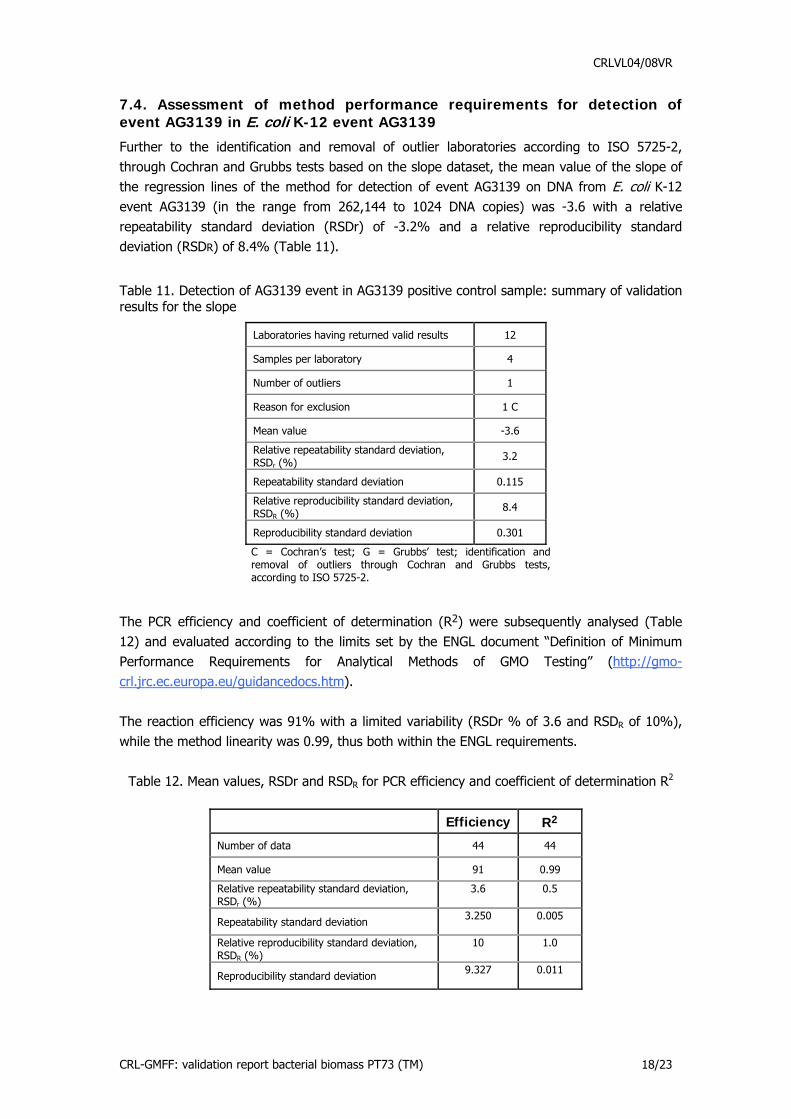
Further to the identification and removal of outlier laboratories according to ISO 5725-2, through Cochran and Grubbs tests based on the slope dataset, the mean value of the slope of the regression lines of the method for detection of event AG3139 on DNA from E. coli K-12 event AG3139 (in the range from 262,144 to 1024 DNA copies) was -3.6 with a relative repeatability standard deviation (RSDr) of -3.2% and a relative reproducibility standard deviation (RSDR) of 8.4% (Table 11).
Table 11. Detection of AG3139 event in AG3139 positive control sample: summary of validation results for the slope
Laboratories having returned valid results 12
Samples per laboratory 4
Number of outliers 1
Reason for exclusion 1 C
Mean value -3.6
Relative repeatability standard deviation, RSDr (%) 3.2
Repeatability standard deviation 0.115
Relative reproducibility standard deviation, RSDR (%) 8.4
Reproducibility standard deviation 0.301
C = Cochran’s test; G = Grubbs’ test; identification and removal of outliers through Cochran and Grubbs tests, according to ISO 5725-2.
The PCR efficiency and coefficient of determination (R2) were subsequently analysed (Table 12) and evaluated according to the limits set by the ENGL document “Definition of Minimum Performance Requirements for Analytical Methods of GMO Testing” (http://gmo-crl.jrc.ec.europa.eu/guidancedocs.htm). The reaction efficiency was 91% with a limited variability (RSDr % of 3.6 and RSDR of 10%), while the method linearity was 0.99, thus both within the ENGL requirements.
Table 12. Mean values, RSDr and RSDR for PCR efficiency and coefficient of determination R2
Efficiency R2
Number of data 44 44
Mean value 91 0.99
Relative repeatability standard deviation, RSDr (%)
3.6
0.5
Repeatability standard deviation 3.250
0.005
Relative reproducibility standard deviation, RSDR (%)
10
1.0
Reproducibility standard deviation 9.327
0.011
CRL-GMFF: validation report bacterial biomass PT73 (TM) 18/23
CRLVL04/08VR
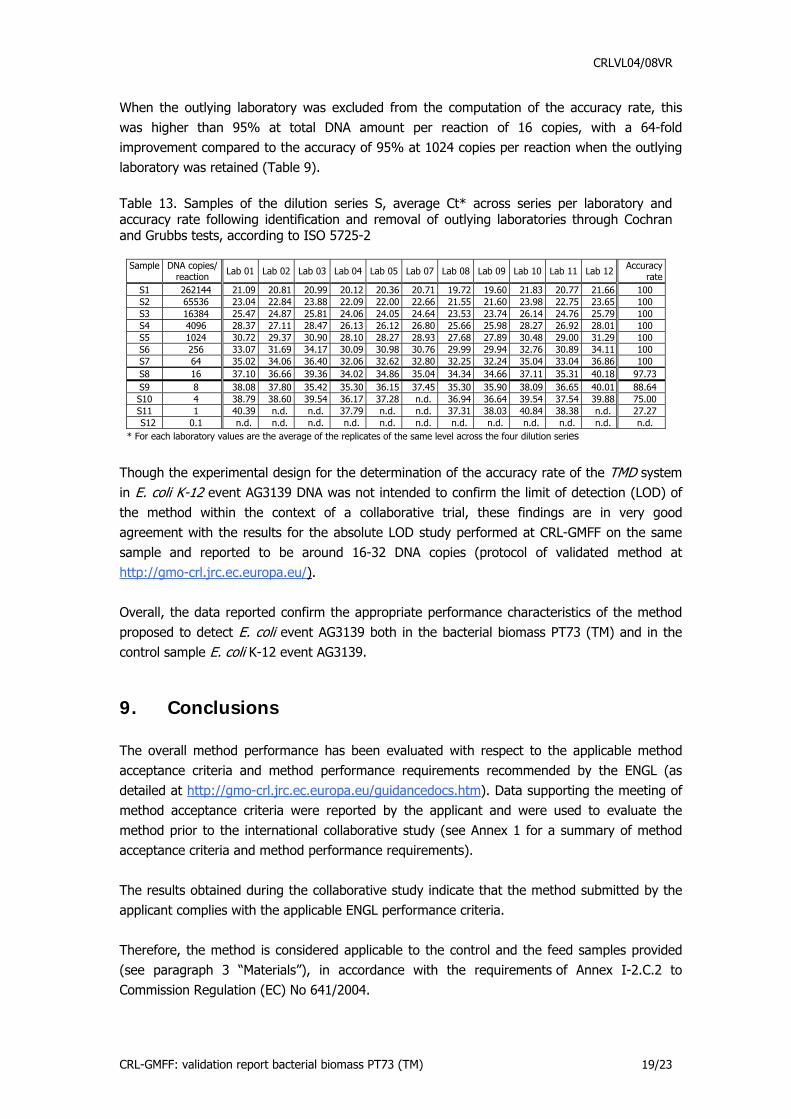
When the outlying laboratory was excluded from the computation of the accuracy rate, this was higher than 95% at total DNA amount per reaction of 16 copies, with a 64-fold improvement compared to the accuracy of 95% at 1024 copies per reaction when the outlying laboratory was retained (Table 9). Table 13. Samples of the dilution series S, average Ct* across series per laboratory and accuracy rate following identification and removal of outlying laboratories through Cochran and Grubbs tests, according to ISO 5725-2
Sample DNA copies/ reaction Lab 01 Lab 02 Lab 03 Lab 04 Lab 05 Lab 07 Lab 08 Lab 09 Lab 10 Lab 11 Lab 12 Accuracy
rateS1 262144 21.09 20.81 20.99 20.12 20.36 20.71 19.72 19.60 21.83 20.77 21.66 100 S2 65536 23.04 22.84 23.88 22.09 22.00 22.66 21.55 21.60 23.98 22.75 23.65 100 S3 16384 25.47 24.87 25.81 24.06 24.05 24.64 23.53 23.74 26.14 24.76 25.79 100 S4 4096 28.37 27.11 28.47 26.13 26.12 26.80 25.66 25.98 28.27 26.92 28.01 100 S5 1024 30.72 29.37 30.90 28.10 28.27 28.93 27.68 27.89 30.48 29.00 31.29 100 S6 256 33.07 31.69 34.17 30.09 30.98 30.76 29.99 29.94 32.76 30.89 34.11 100 S7 64 35.02 34.06 36.40 32.06 32.62 32.80 32.25 32.24 35.04 33.04 36.86 100 S8 16 37.10 36.66 39.36 34.02 34.86 35.04 34.34 34.66 37.11 35.31 40.18 97.73 S9 8 38.08 37.80 35.42 35.30 36.15 37.45 35.30 35.90 38.09 36.65 40.01 88.64 S10 4 38.79 38.60 39.54 36.17 37.28 n.d. 36.94 36.64 39.54 37.54 39.88 75.00 S11 1 40.39 n.d. n.d. 37.79 n.d. n.d. 37.31 38.03 40.84 38.38 n.d. 27.27 S12 0.1 n.d. n.d. n.d. n.d. n.d. n.d. n.d. n.d. n.d. n.d. n.d. n.d.
* For each laboratory values are the average of the replicates of the same level across the four dilution series
Though the experimental design for the determination of the accuracy rate of the TMD system in E. coli K-12 event AG3139 DNA was not intended to confirm the limit of detection (LOD) of the method within the context of a collaborative trial, these findings are in very good agreement with the results for the absolute LOD study performed at CRL-GMFF on the same sample and reported to be around 16-32 DNA copies (protocol of validated method at http://gmo-crl.jrc.ec.europa.eu/). Overall, the data reported confirm the appropriate performance characteristics of the method proposed to detect E. coli event AG3139 both in the bacterial biomass PT73 (TM) and in the control sample E. coli K-12 event AG3139.
9. Conclusions The overall method performance has been evaluated with respect to the applicable method acceptance criteria and method performance requirements recommended by the ENGL (as detailed at http://gmo-crl.jrc.ec.europa.eu/guidancedocs.htm). Data supporting the meeting of method acceptance criteria were reported by the applicant and were used to evaluate the method prior to the international collaborative study (see Annex 1 for a summary of method acceptance criteria and method performance requirements). The results obtained during the collaborative study indicate that the method submitted by the applicant complies with the applicable ENGL performance criteria. Therefore, the method is considered applicable to the control and the feed samples provided (see paragraph 3 “Materials”), in accordance with the requirements of Annex I-2.C.2 to Commission Regulation (EC) No 641/2004.
CRL-GMFF: validation report bacterial biomass PT73 (TM) 19/23
CRLVL04/08VR
10. Quality assurance The CRL-GMFF carries out all operations according to ISO 9001:2000 (certificate number: CH-32231) and ISO 17025:2005 (certificate number: DAC-PL-0459-06-00) [DNA extraction, qualitative and quantitative PCR in the area of Biology (DNA extraction and PCR method validation for the detection and identification of GMOs in food and feed materials)].
11. References
1. Horwitz W., 1995. Protocol for the design, conduct and interpretation of method performance studies, Pure and Appl. Chem, 67, 331-343.
2. International Standard (ISO) 5725, 1994. Accuracy (trueness and precision) of measurement methods and results. International Organization for Standardization, Genève, Switzerland.
CRL-GMFF: validation report bacterial biomass PT73 (TM) 20/23
CRLVL04/08VR
12. Annex 1: method acceptance criteria and method performance requirements as set by the European Network of GMO Laboratories (ENGL)
Method Acceptance Criteria should be fulfilled at the moment of submission of a method (Phase 1:
acceptance for the collaborative study).
Method Performance Requirements should be fulfilled in a collaborative study in order to consider the
method as fit for its purpose (Phase 2: evaluation of the collaborative study results).
Method Acceptance Criteria
Applicability
Definition: the description of analytes, matrices, and concentrations to which a method can be applied.
Acceptance Criterion: the applicability statement should provide information on the scope of the method
and include data for the indices listed below for the product/s for which the application is submitted. The
description should also include warnings to known interferences by other analytes, or inapplicability to
certain matrices and situations.
Practicability
Definition: the ease of operations, the feasibility and efficiency of implementation, the associated unitary
costs (e.g. Euro/sample) of the method.
Acceptance Criterion: the practicability statement should provide indication on the required equipment for
the application of the method with regards to the analysis per se and the sample preparation. An
indication of costs, timing, practical difficulties and any other factor that could be of importance for the
operators should be indicated.
Specificity
Definition: property of a method to respond exclusively to the characteristic or analyte of interest.
Acceptance Criterion: the method should be event-specific and be functional only with the GMO or GM
based product for which it was developed. This should be demonstrated by empirical results from testing
the method with non-target transgenic events and non-transgenic material. This testing should include
closely related events and cases where the limit of the detection is tested.
Dynamic Range
Definition: the range of concentrations over which the method performs in a linear manner with an
acceptable level of accuracy and precision.
Acceptance Criterion: the dynamic range of the method should include the 1/10 and at least 5 times the
target concentration. Target concentration is intended as the threshold relevant for legislative
CRL-GMFF: validation report bacterial biomass PT73 (TM) 21/23
CRLVL04/08VR
requirements. The acceptable level of accuracy and precision are described below. The range of the
standard curve(s) should allow testing of blind samples throughout the entire dynamic range, including
the lower (10%) and upper (500%) end.
Accuracy
Definition: the closeness of agreement between a test result and the accepted reference value.
Acceptance Criterion: the accuracy should be within ± 25% of the accepted reference value over the
whole dynamic range.
Amplification Efficiency
Definition: the rate of amplification that leads to a theoretical slope of – 3.32 with an efficiency of 100%
in each cycle. The efficiency of the reaction can be calculated by the following equation: Efficiency = [10(-
1/slope)] – 1
Acceptance Criterion: the average value of the slope of the standard curve should be in the range of (-
3.1 ≥ slope ≥ - 3.6)
R2 Coefficient
Definition: the R2 coefficient is the correlation coefficient of a standard curve obtained by linear regression
analysis.
Acceptance Criterion: the average value of R2 should be ≥ 0.98.
Repeatability Standard Deviation (RSDr)
Definition: the standard deviation of test results obtained under repeatability conditions. Repeatability
conditions are conditions where test results are obtained with the same method, on identical test items, in
the same laboratory, by the same operator, using the same equipment within short intervals of time.
Acceptance Criterion: the relative repeatability standard deviation should be below 25% over the whole
dynamic range of the method.
Note: estimates of repeatability submitted by the applicant should be obtained on a sufficient number of
test results, at least 15, as indicated in ISO 5725-3 (1994).
Limit of Quantitation (LOQ)
Definition: the limit of quantitation is the lowest amount or concentration of analyte in a sample that can
be reliably quantified with an acceptable level of precision and accuracy.
Acceptance Criterion: LOQ should be less than 1/10th of the value of the target concentration with an
RSDr ≤ 25%. Target concentration should be intended as the threshold relevant for legislative
requirements. The acceptable level of accuracy and precision are described below.
Limit of Detection (LOD)
Definition: the limit of detection is the lowest amount or concentration of analyte in a sample, which can
be reliably detected, but not necessarily quantified, as demonstrated by single laboratory validation.
CRL-GMFF: validation report bacterial biomass PT73 (TM) 22/23

CRLVL04/08VR
Acceptance Criterion: LOD should be less than 1/20th of the target concentration. Experimentally,
quantitative methods should detect the presence of the analyte at least 95% of the time at the LOD,
ensuring ≤ 5% false negative results. Target concentration should be intended as the threshold relevant
for legislative requirements.
Robustness
Definition: the robustness of a method is a measure of its capacity to remain unaffected by small, but
deliberate deviations from the experimental conditions described in the procedure.
Acceptance Criterion: the response of an assay with respect to these small variations should not deviate
more than ± 30%. Examples of factors that a robustness test could address are: use of different
instrument type, operator, brand of reagents, concentration of reagents, and temperature of reaction.
Method Performance Requirements
Dynamic Range
Definition: in the collaborative trial the dynamic range is the range of concentrations over which the
reproducibility and the trueness of the method are evaluated with respect to the requirements specified
below.
Acceptance Criterion: the dynamic range of the method should include the 1/10 and at least five times
the target concentration. Target concentration should be intended as the threshold relevant for legislative
requirements.
Reproducibility Standard Deviation (RSDR)
Definition: the standard deviation of test results obtained under reproducibility conditions. Reproducibility
conditions are conditions where test results are obtained with the same method, on identical test items, in
different laboratories, with different operators, using different equipment. Reproducibility standard
deviation describes the inter-laboratory variation.
Acceptance Criterion: the relative reproducibility standard deviation should be below 35% at the target
concentration and over the entire dynamic range. An RSDR < 50% is acceptable for concentrations below
0.2%.
Trueness
Definition: the closeness of agreement between the average value obtained from a large series of test
results and an accepted reference value. The measure of trueness is usually expressed in terms of bias.
Acceptance Criterion: the trueness should be within ± 25% of the accepted reference value over the
whole dynamic range.
CRL-GMFF: validation report bacterial biomass PT73 (TM) 23/23
CRLVL04/08VP
Event-specific Method for the Detection of Dried-killed Bacterial Biomass PT 73 (TM)
Derived from E. coli GM Strain AG3139 Using Real-time PCR
Protocol
24 June 2009
Joint Research Centre Institute for Health and Consumer Protection
Molecular Biology and Genomics Unit
Method development:
Ajinomoto Eurolysine S.A.S.
Collaborative trial:
Community Reference Laboratory for GM Food and Feed (CRL-GMFF)
Molecular Biology and Genomics Unit
CRL-GMFF: protocol bacterial biomass PT73 (TM) 1/13

CRLVL04/08VP
Content
1. GENERAL INFORMATION AND SUMMARY OF THE METHODOLOGY........................ 4
2. VALIDATION STATUS AND PERFORMANCE CHARACTERISTICS............................. 5
2.1 GENERAL ...................................................................................................................5 2.2 COLLABORATIVE TRIAL ...................................................................................................5 2.3 LIMIT OF DETECTION (LOD) ...........................................................................................5 2.4 MOLECULAR SPECIFICITY ................................................................................................5
3. PROCEDURE............................................................................................................. 6
3.1 GENERAL INSTRUCTIONS AND PRECAUTIONS ..................................................................6 3.2 REAL-TIME PCR FOR QUALITATIVE DETECTION OF EVENT AG3139 IN PT73 (TM) BACTERIAL
BIOMASS 7 3.2.1 General ..........................................................................................................7 3.2.2 Feed sample preparation ..............................................................................7 3.2.3 Control sample preparation ..........................................................................7 3.2.4 Real-time PCR set-up ....................................................................................8
3.3 DATA ANALYSIS .....................................................................................................9 3.4 CALCULATION OF RESULTS ......................................................................................10
4. MATERIALS ........................................................................................................ 10
4.1 EQUIPMENT ........................................................................................................10 4.2 REAGENTS .........................................................................................................10 4.3 PRIMERS AND PROBES ...........................................................................................10
ANNEX 1. DETERMINATION OF LIMIT DETECTION (LOD) AT THE CRL-GMFF.......... 11
A1 EXPERIMENTAL DESIGN .................................................................................................11 A.2 Optimum sample size for LOD determination ...............................................11 A.3 Results and conclusions.................................................................................12 A.4 References......................................................................................................13
CRL-GMFF: protocol bacterial biomass PT73 (TM) 3/13
CRLVL04/08VP
1. General information and summary of the methodology
This protocol describes an event-specific real-time qualitative TaqMan® PCR procedure for the:
a. traceability of the bacterial biomass ‘PT73 (TM)’ and for the b. detection of the E. coli GM strain ‘AG3139’.
The product PT73 (TM) consists of the dried killed cells of a genetically modified strain of Escherichia coli K-12 (E. coli K-12), named AG3139. The strain AG3139 has been constructed from a specific strain of E. coli K-12 – strain MG1655 - using conventional and modern techniques of genetic modifications. The purpose of the genetic modifications is to obtain a high production rate of L-threonine. Ajinomoto Eurolysine S.A.S. stated that to their knowledge no conventional counterpart to PT73 (TM) exists on the EU market, i.e. no bacterial biomass by-product of threonine production, consisting of conventional strain of E. coli K-12 used as feed material at the time of the method submission. Consequently, if the bacterial biomass PT73 (TM) is present in feeding stuffs it will always be 100% GM material and not a potential mixture of GM E. coli K12 biomass plus wild-type E. coli K-12 biomass: thus no relative quantification is possible for such product. As a consequence, a Real-time PCR based qualitative method has been proposed by the applicant and validated by the CRL-GMFF for the detection of PT73 (TM) product within the investigated dynamic range. The PCR assay was optimised for use in real-time PCR instruments for plastic reaction vessels. Glass capillaries are not recommended for the buffer composition described in this method. Template DNA extracted by means of a suitable method should be tested for quality and quantity prior to use in PCR assay. Tests for the presence of PCR inhibitors (e.g. monitor run of diluted series, use of DNA spikes) are recommended. For the specific detection of strain AG3139, a 90 bp fragment of the integration site of AG3139 corresponding to the border covering the 5’ flanking region of bacterial origin and the integration sequence inserted into the bacterial genome (insert to E. coli junction) is amplified using two specific primers. PCR products are measured at each cycle (real-time) by means of a target-specific oligonucleotide probe labeled with FAM dye and TAMRA as quencher dye. The primers/probe set targeting the event AG3139 is referred to as ‘TMD’. The measured fluorescence signal passes a threshold value after a certain number of cycles. This threshold cycle is called the “Ct” value. For detection of the event AG3139 DNA in a test sample, Ct values for the TMD system are determined for the sample.
CRL-GMFF: protocol bacterial biomass PT73 (TM) 4/13
CRLVL04/08VP
2. Validation status and performance characteristics
2.1 General
The method was optimised for suitable DNA extracted from feeding stuffs which may use the bacterial biomass PT73 (TM) as a component. The repeatability and reproducibility of the method was tested through an international collaborative ring trial using linearly diluted DNA samples from PT73 (TM) feed and from the control sample AG3139.
2.2 Collaborative trial
The method was validated in a collaborative study by the Joint Research Centre (JRC) of the European Commission. The study was undertaken with twelve participating laboratories in October 2008. Each participant received 2 grams of PT73 (TM) biomass ground to a fine powder. Four independent DNA extractions were performed by each laboratory. Extracted DNA was quantified by fluorimetric means and diluted to a working concentration of 10 ng/μL. Four 12-point dilution series (named EA to ED) were built thereof and each point of the dilution series was tested in triplicate with the TMD system. Similarly, four independent 12-point dilution series (named SA to SD) were built from the positive control sample ‘AG3139’ and each point of the dilution series was analysed in triplicate with the TMD system. A detailed validation report can be found at http://gmo-crl.jrc.ec.europa.eu/statusofdoss.htm.
2.3 Limit of detection (LOD)
According to the applicant, the absolute LOD of the method is 16 copies of AG3139 genomic DNA and 8 copies of a synthetic pUC-TMD plasmid containing the full amplicon cloned in pUC vector and suitable as qualitative positive control sample. The CRL-GMFF experimentally verified the absolute LOD of the method on AG3139 and found it to be between 32 and 16 copies of AG3139 genomic DNA. The CRL-GMFF also verified the LOD of the synthetic plasmid control sample pUC-TMD and found it to be between 8 and 4 copies.
2.4 Molecular specificity
According to the applicant, the method exploits a unique DNA sequence in the region of recombination between the insert and the bacterial genome; the sequence is specific to AG3139 E. coli and thus imparts event-specificity to the method.
CRL-GMFF: protocol bacterial biomass PT73 (TM) 5/13

CRLVL04/08VP
The specificity of the event-specific assay was experimentally tested by the applicant in real-time PCR against samples containing 10 ng of pUC19, 1000 copies of AG3139 and 1000 copies of pUC-TMD. Only the positive control AG3139 and pUC-TMD gave consistent amplifications with Ct figures less than 45. The CRL-GMFF further tested the PT73 (TM) specificity in real-time PCR against pUC19 and E. coli MG1655, parental organism for AG3139. No detectable amplifications were observed. Bioinformatics analysis indicated the bacterial origin of the oligonucleotide bases 1-52 of the amplicon and the vector origin for the remaining part of it, thus confirming the event specificity of the PT73 (TM) system. In addition, though in silico analysis found several partial matches particularly for the forward primer against GMO sequences maintained at JRC. No alert was raised for possible cross-reactivity of the PT73 (TM) system with other GMOs whose methods were submitted to the CRL-GMFF. 3. Procedure
3.1 General instructions and precautions
• The procedures require experience of working under sterile conditions.
• Laboratory organisation, e.g. “forward flow direction” during PCR-setup, should follow the guidelines given by relevant authorities, e.g. ISO 24276.
• PCR-reagents should be stored and handled in a separate room where no nucleic acids
(with exception of PCR primers or probes) or DNA degrading or modifying enzymes have been handled previously. All handling of PCR reagents and controls requires dedicated equipment, especially pipettes.
• All the equipment used should be sterilised prior to use and any residue of DNA has to
be removed. All material used (e.g. vials, containers, pipette tips, etc.) must be suitable for PCR and molecular biology applications. They must be DNase-free, DNA-free, sterile and unable to adsorb protein or DNA.
• Filter pipette tips protected against aerosol should be used.
• Powder-free gloves should be used and changed frequently.
• Laboratory benches and equipment should be cleaned periodically with 10% sodium hypochloride solution (bleach).
• Pipettes should be checked regularly for precision and calibrated, if necessary.
• All handling steps - unless specified otherwise - should be carried out at 0 - 4°C.
CRL-GMFF: protocol bacterial biomass PT73 (TM) 6/13
CRLVL04/08VP
• In order to avoid repeated freeze/thaw cycles aliquots should be prepared.
3.2 Real-time PCR for qualitative detection of event AG3139 in PT73 (TM) bacterial biomass
3.2.1 General
The use of maximum 100 ng of template DNA per reaction well is recommended. The method is developed for a total volume of 25 µL per reaction. 3.2.2 Feed sample preparation
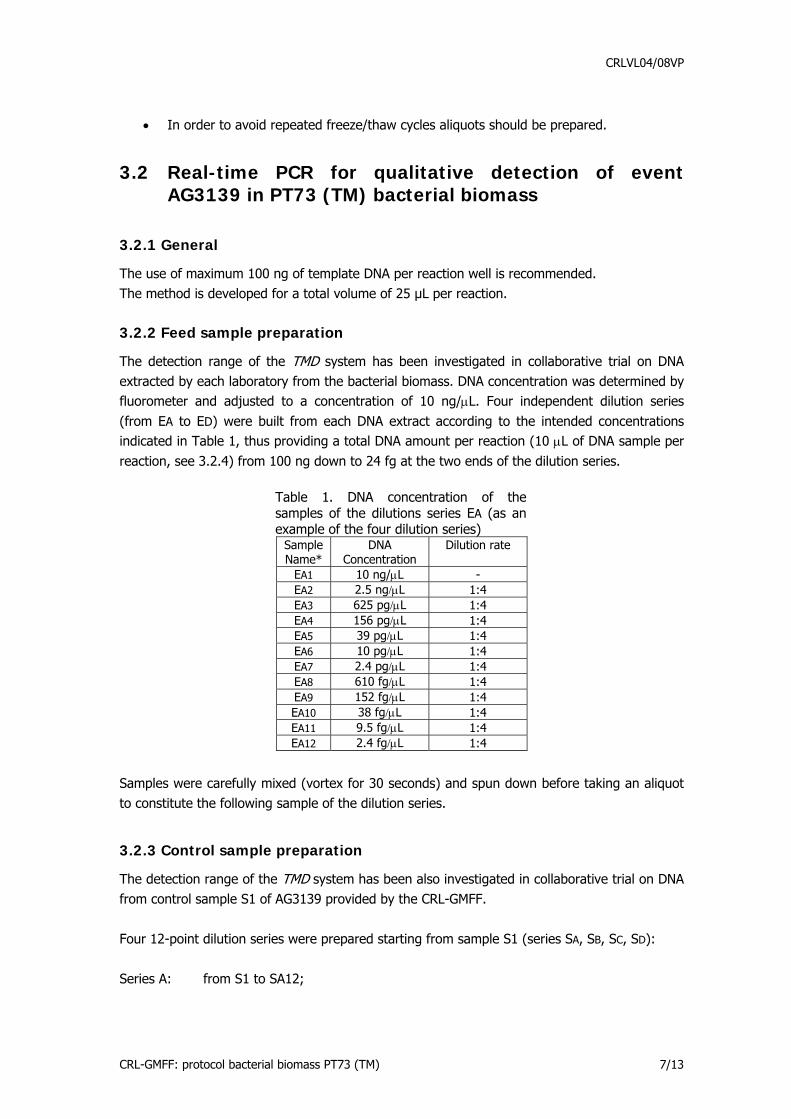
The detection range of the TMD system has been investigated in collaborative trial on DNA extracted by each laboratory from the bacterial biomass. DNA concentration was determined by fluorometer and adjusted to a concentration of 10 ng/μL. Four independent dilution series (from EA to ED) were built from each DNA extract according to the intended concentrations indicated in Table 1, thus providing a total DNA amount per reaction (10 μL of DNA sample per reaction, see 3.2.4) from 100 ng down to 24 fg at the two ends of the dilution series.
Table 1. DNA concentration of the samples of the dilutions series EA (as an example of the four dilution series)
Sample Name*
DNA Concentration
Dilution rate
EA1 10 ng/μL - EA2 2.5 ng/μL 1:4 EA3 625 pg/μL 1:4 EA4 156 pg/μL 1:4 EA5 39 pg/μL 1:4 EA6 10 pg/μL 1:4 EA7 2.4 pg/μL 1:4 EA8 610 fg/μL 1:4 EA9 152 fg/μL 1:4 EA10 38 fg/μL 1:4 EA11 9.5 fg/μL 1:4 EA12 2.4 fg/μL 1:4
Samples were carefully mixed (vortex for 30 seconds) and spun down before taking an aliquot to constitute the following sample of the dilution series.
3.2.3 Control sample preparation
The detection range of the TMD system has been also investigated in collaborative trial on DNA from control sample S1 of AG3139 provided by the CRL-GMFF. Four 12-point dilution series were prepared starting from sample S1 (series SA, SB, SC, SD): Series A: from S1 to SA12;
CRL-GMFF: protocol bacterial biomass PT73 (TM) 7/13

CRLVL04/08VP
Series B: from S1 to SB12; Series C: from S1 to SC12; Series D: from S1 to SD12. The DNA concentration of each sample of the four dilution series is reported in Table 2 for series SA as an example.
Table 2. DNA concentrations of the samples of the dilutions series SA (as an example of the four dilution series)
Sample Name*
Concentration (copies/μL)
Dilution rate
S1 26214 - SA2 6553 1:4 SA3 1638 1:4 SA4 410 1:4 SA5 102 1:4 SA6 26 1:4 SA7 6.4 1:4 SA8 1.6 1:4 SA9 0.8 1:2 SA10 0.4 1:2 SA11 0.1 1:4 SA12 0.01 1:10
3.2.4 Real-time PCR set-up
1. Thaw, mix gently and centrifuge the required amount of components needed for the run. Keep thawed reagents at 1-4°C on ice.
2. In one reaction tube (for the TMD system) on ice, add the following components (Table 3) in the order mentioned below (except DNA) to prepare the reaction mixture.
Table 3. Amplification reaction mixture in the final volume/concentration per reaction well for the TMD specific system.
Component Final concentration µL/reaction TaqMan® Universal PCR Master Mix (2x) Primer F (10 µM) Primer R (10 µM) Probe (5 µM) Template DNA (max 100 ng)
0.96x 439 nM 439 nM 146 nM
#
12.07 1.097 1.097 0.732 10.0
Total reaction volume: 25
3. Mix gently and centrifuge briefly.
CRL-GMFF: protocol bacterial biomass PT73 (TM) 8/13
CRLVL04/08VP
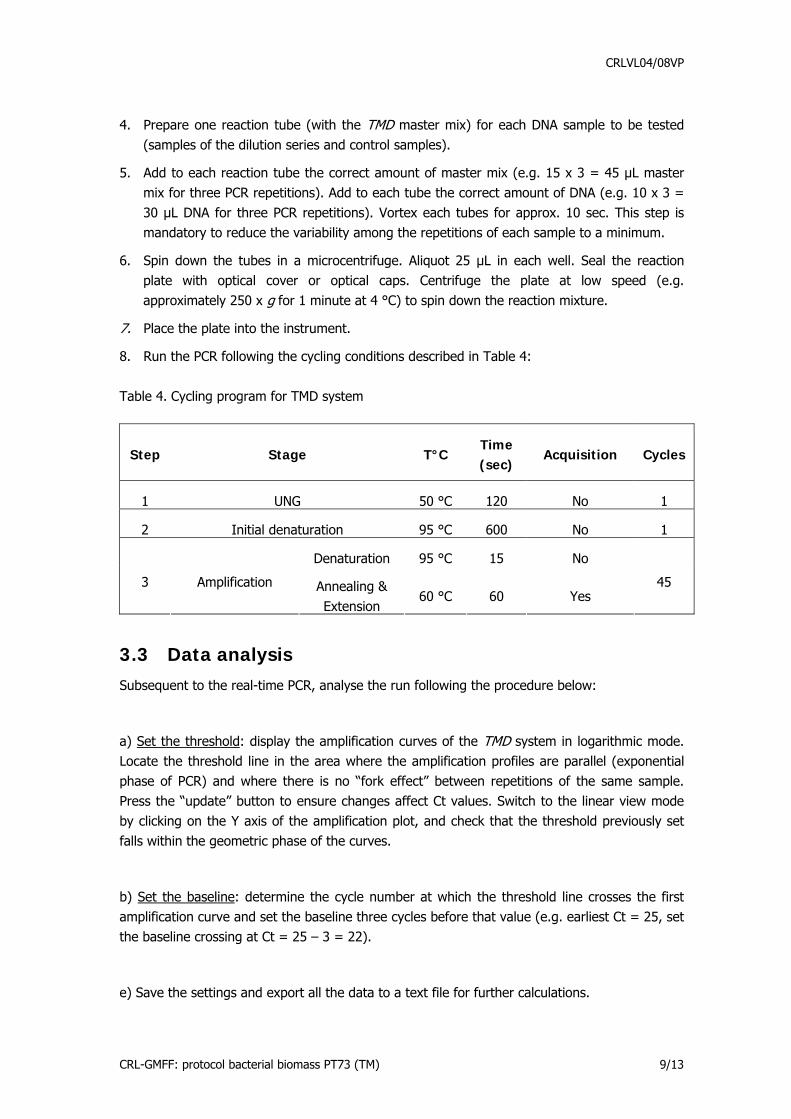
4. Prepare one reaction tube (with the TMD master mix) for each DNA sample to be tested (samples of the dilution series and control samples).
5. Add to each reaction tube the correct amount of master mix (e.g. 15 x 3 = 45 µL master mix for three PCR repetitions). Add to each tube the correct amount of DNA (e.g. 10 x 3 = 30 µL DNA for three PCR repetitions). Vortex each tubes for approx. 10 sec. This step is mandatory to reduce the variability among the repetitions of each sample to a minimum.
6. Spin down the tubes in a microcentrifuge. Aliquot 25 µL in each well. Seal the reaction plate with optical cover or optical caps. Centrifuge the plate at low speed (e.g. approximately 250 x g for 1 minute at 4 °C) to spin down the reaction mixture.
7. Place the plate into the instrument.
8. Run the PCR following the cycling conditions described in Table 4: Table 4. Cycling program for TMD system
Step Stage T°C Time (sec)
Acquisition Cycles
1 UNG 50 °C 120 No 1
2 Initial denaturation 95 °C 600 No 1
Denaturation 95 °C 15 No
3 Amplification Annealing & Extension
60 °C 60 Yes 45
3.3 Data analysis Subsequent to the real-time PCR, analyse the run following the procedure below:
a) Set the threshold: display the amplification curves of the TMD system in logarithmic mode. Locate the threshold line in the area where the amplification profiles are parallel (exponential phase of PCR) and where there is no “fork effect” between repetitions of the same sample. Press the “update” button to ensure changes affect Ct values. Switch to the linear view mode by clicking on the Y axis of the amplification plot, and check that the threshold previously set falls within the geometric phase of the curves.
b) Set the baseline: determine the cycle number at which the threshold line crosses the first amplification curve and set the baseline three cycles before that value (e.g. earliest Ct = 25, set the baseline crossing at Ct = 25 – 3 = 22).
e) Save the settings and export all the data to a text file for further calculations.
CRL-GMFF: protocol bacterial biomass PT73 (TM) 9/13

CRLVL04/08VP
3.4 Calculation of results After having defined a threshold value within the logarithmic phase of amplification as described above, the instrument’s software calculates the Ct-values for each reaction. The standard curves are generated for the TMD specific system by plotting the Ct values measured for the calibration points against the logarithm of the DNA amount (mass/volume for the dilution series of the feed sample and copy numbers for the dilution series of the control sample) and by fitting a linear regression line into these data. Thereafter, the standard curves are used to estimate the repeatability, reproducibility of the detection range and for the control sample the accuracy rate corresponding to the dilution points. 4. Materials
4.1 Equipment
• Real-time PCR instrument for plastic reaction vessels (glass capillaries are not
recommended for the described buffer composition) • Plastic reaction vessels suitable for real-time PCR instrument (enabling undisturbed
fluorescence detection) • Software for run analysis (mostly integrated in the software of the real-time PCR
instrument) • Centrifuge for plates and reaction tubes • Micropipettes • Vortex • Rack for reaction tubes • 1.5/2.0 mL reaction tubes
4.2 Reagents
• TaqMan® Universal PCR Master Mix (2X). Applied Biosystems Part No 4304437
4.3 Primers and Probes
Name Oligonucleotide DNA Sequence (5’ to 3’) TMD target sequence
Primer F 5’ – AAT ACC GTT AAA CGT AAA TTC TTT TTC TTT – 3’
Primer R 5’ – TCC TCC CGG TTT TTT TCG TA – 3’
probe 6-FAM 5' – AGA TCG AGT ATT CAT TCG GTG TAT TGA TTC ACT TGA – 3' TAMRA
CRL-GMFF: protocol bacterial biomass PT73 (TM) 10/13

CRLVL04/08VP
ANNEX 1. Determination of limit detection (LOD) at the CRL-GMFF
A1 Experimental design
The determination of the LOD has been carried out during the step 3 (experimental testing) of the CRL-GMFF validation process on DNA from the positive control sample event AG3139 and plasmid control sample pUC-TMD provided by Ajinomoto Eurolysine S.A.S., containing the 90 bp amplicon corresponding to the whole PCR fragment amplified from AG3139. The concentration of the positive control samples was estimated with the Picogreen kit by means of a Bio-rad fluorometer Versafluor as an average of ten readings. The starting point for the study of the LOD of the TMD system on AG3139 sample was set at 128 copies, based on the assumption that 1 ng of AG3139 genomic DNA corresponds to 189709 copies (from applicant’s dossier). Seven GM levels were built thereof by serial dilution. Similarly, a mirroring dilution series was built with the pUC-TMD plasmid control sample knowing that the plasmid is 3231 bp long and that the average molecular weight for a nucleotide pair is assumed to correspond to 660 Daltons. A.2 Optimum sample size for LOD determination
The optimal sample size (number of replicates n per assayed GM level) was estimated to determine the limit of detection (LOD), defined as the GM level (p) detected at least 95% of the time, thus ensuring ≤5% false negative results. The number n was estimated to generate a 0.95 confidence interval whose upper bound does not exceed 5%. For an accurate estimate of the 0.95 (1-α) confidence interval (depending on the degrees of freedom used to compute p), the F-distribution was used based on the relationship between such distribution and the binomial distribution (Fisher and Yates, 1963). The method is derived from Bliss (1967) and recently re-proposed by Zar (1999). According to this method, in a sample of n data, X of which showing the character of interest, confidence limits (L1: lower limit, L2: upper limit) of a proportion p are computed as follows:
( ) 2,1,2/1 1 νναFXnX
XL⋅+−+
=
( )( ) 2',1',2/
2',1',2/2 1
1
ννα
ννα
FXXnFX
L⋅++−
⋅+=
where the degrees of freedom ν1 and ν2 are:
( )121 +−⋅= Xnν X⋅= 22ν
and the degrees of freedom ‘ν1 and ‘ν2 are:
221' +=νν 212' −=νν
CRL-GMFF: protocol bacterial biomass PT73 (TM) 11/13

CRLVL04/08VP
Based on this method, with X = 1 and α = 0.05, L2 = 0.05 results from n = 100. As suggested by various statisticians (e.g. Cochran, 1977), the simplest approach to estimate the confidence interval of a sample proportion p, is the use of the normal distribution (z) and its standard deviation p · (1-p):
( )1
12/1 −
−⋅⋅−=
nppzpL α
( )1
12/2 −
−⋅⋅+=
nppzpL α
Based on this simplified approach, with X = 1 and α = 0.05, L2 = 0.05 results from n = 60, thus resulting in an experimental absolute LOD set at 59 positive tests (n - X) over 60 replicates Given the experimental design for a LOD study where it is required to test a large number of replicates in each sample characterised by defined analyte content (GM level) over a linearly decreasing series of concentrations, the Cochran approach was accepted as the most feasible. Hence, 60 replicates were tested with the GM-specific system in each of eight GM levels (Table A.1 and A.2) set up as serial dilutions. This resulted in running six PCR experiments for a total of 480 test items excluding controls per each control sample. A.3 Results and conclusions
The CRL-GMFF determined the LOD of the TMD system on event AG3139 (Table A.1.) and on plasmid control sample pUC-TMD (Table A.2.) according to the validated method and under the statistical considerations identified above.
Table A.1. GM-levels, Ct average and ratio of positive replicates for TMD system on AG3139 control sample
AG3139 copy number
Average Ct* / Standard deviation
Positive / Total amplifications
128 31.72 60/60 64 32.66 60/60 32 33.94 60/60 16 35.29 59/60 8 36.33 59/60 4 37.07 58/60 1 38.90 37/60
0.1 39.36 7/60 * available Cts were computed
CRL-GMFF: protocol bacterial biomass PT73 (TM) 12/13

CRLVL04/08VP
Table A.2. GM-levels, Ct average and ratio of positive replicates for TMD system on pUC-TMD control sample
AG3139 copy number
Average Ct* / Standard deviation
Positive / Total amplifications
128 30.93 60/60 64 32.06 60/60 32 33.04 60/60 16 34.07 60/60 8 35.09 60/60 4 35.94 60/60 1 38.46 52/60
0.1 39.46 10/60 * available Cts were computed
In conclusion, the LOD is estimated between 8 and 32 copies for the TMD system on event AG3139 and between 1 and 4 copies of plasmid pUC-TMD A.4 References
Bliss C.I., 1967. Statistical biology, Vol. 1. McGraw-Hill, New York, USA, 558 pp. Cochran, 1977. Sampling techniques, 3rd edition. John Wiley, New York, 428 pp. Fisher R.A., Yates F., 1963. Statistical tables for biological, agricultural and medical research,
6th edition. Hafner, New York, USA, 146 pp. Zar J.H., 1999. Biostatistical analysis, 4th edition. Prentice Hall, New Jersey, 663 pp.
CRL-GMFF: protocol bacterial biomass PT73 (TM) 13/13

CRLVL04/08XP
Report on the Validation of a DNA Extraction
Method for Dried-killed Bacterial Biomass
24 June 2009
Joint Research Centre
Institute for Health and Consumer Protection Molecular Biology and Genomics Unit
Method development:
Ajinomoto Eurolysine S.A.S.
Method testing and single laboratory validation:
Community Reference Laboratory for GM Food and Feed (CRL-GMFF) Molecular Biology and Genomics Unit
CRL-GMFF: dried killed bacterial biomass DNA extraction 1/19
CRLVL04/08XP
Content
1. INTRODUCTION....................................................................................................... 4
2. MATERIALS (EQUIPMENT/CHEMICALS/PLASTIC WARE)....................................... 4
2.1. EQUIPMENT.......................................................................................................... 4
2.2. CHEMICALS................................................................................................................4 2.3. SOLUTIONS................................................................................................................5 2.4. PLASTICWARE.............................................................................................................5 2.5. PRECAUTIONS.............................................................................................................6 2.6. ABBREVIATIONS ..........................................................................................................6
3. DESCRIPTION OF THE METHOD .............................................................................. 6
3.1. SAMPLING .................................................................................................................6 3.2. SCOPE AND APPLICABILITY .............................................................................................6 3.3. PRINCIPLE .................................................................................................................6 3.4. SAMPLES GRINDING PROCEDURE ......................................................................................7 3.5 EXTRACTION OF GENOMIC DNA FROM E. COLI BACTERIAL BIOMASS ............................................7
4. TESTING OF THE DNA EXTRACTION METHOD BY THE COMMUNITY REFERENCE LABORATORY FOR GM FOOD AND FEED ..................................................................... 8
4.1. PREPARATION OF SAMPLES .............................................................................................8 4.2. DNA EXTRACTION .......................................................................................................8 4.3. DNA CONCENTRATION, YIELD AND REPEATABILITY ................................................................8 4.4. FRAGMENTATION OF DNA..............................................................................................9 4.5. PURITY/ABSENCE OF PCR INHIBITORS ..............................................................................9
5. TESTING OF THE DNA EXTRACTION METHOD IN THE INTER-LABORATORY COLLABORATIVE STUDY............................................................................................ 12
5.1. LIST OF PARTICIPATING LABORATORIES............................................................................12 5.2. SAMPLES AND REAGENTS PROVIDED ................................................................................13 5.3. REAGENTS, MATERIALS AND EQUIPMENTS PROVIDED BY THE PARTICIPATING LABORATORY..............13 5.4. DNA EXTRACTION .....................................................................................................14 5.5. DEVIATIONS REPORTED ...............................................................................................14 5.7. ASSESSMENT OF METHOD PERFORMANCE ..........................................................................17
6. CONCLUSION......................................................................................................... 18
7. QUALITY ASSURANCE............................................................................................ 18
8. REFERENCES.......................................................................................................... 18
CRL-GMFF: dried killed bacterial biomass DNA extraction
3/19
CRLVL04/08XP
1. Introduction
This report describes the validation of a DNA extraction method to extract genomic DNA from dried-killed bacterial biomass and its applicability on the samples of food and feed provided by the applicant Ajinomoto Eurolysine S.A.S. This method can be used for the extraction of DNA from bacterial biomass consisting of the bacterial cells separated from the fermentation broth after the latter has been subject to an ‘inactivation treatment’, so that the final product does not contain viable cells and so that the size of the degraded recombinant DNA is reduced. According to the applicant, the method has been used to isolate and purify DNA from the biomass of product PT73 (TM), PT73 E. coli THR, PL73 (LM), PL 73 E. coli Lys and from a series of feed materials. The purpose of the DNA extraction method described is to provide DNA with purity suitable for real-time PCR based detection methods. This protocol is recommended to be executed by skilled laboratory personnel since hazardous chemicals and materials are exploited at some steps. It is strongly advised to take particular notice of all product safety recommendations and guidelines.
2. Materials (Equipment/Chemicals/Plastic ware)
2.1. Equipment The following equipment is used in the DNA extraction procedure described (equivalents may be used):
1. Blender 2. Balance 3. Vortex Mixer 4. Thermomixer 5. Rotator
6. Centrifuge (for 2 ml tube 12,000 rpm) 7. Fluorometer 8. Minicolumns (Promega) 9. Micropipettes 10. Rack for reaction tubes 11. Platform for real-time PCR and analysis software 12. Vacuum manifold
2.2. Chemicals
CRL-GMFF: dried killed bacterial biomass DNA extraction
4/19
CRLVL04/08XP
The following chemicals are used in the DNA extraction procedure described (equivalents may be used):
1. Tris-base (Sigma, T-1503) 2. Sodium chloride (Merck, 106404) 3. Na2EDTA*2H20 (Merck, 108418) 4. Sodium dodecyl sulphate, ‘SDS’ (Merck, 113760) 5. Hydrochloric acid (Merck, 100317) 6. Guanidine hydrochloride (Sigma, G-7153) 7. Proteinase K (Boehringer, 745723) 8. Chloroform (Lab-scan A 3505 E) 9. WizardTM resin and minicolumns (Promega, A 7280) 10. 2-Propanol (baker 8068) 11. DNAse free distilled sterile water 12. Picogreen dsDNA Quantitation Kit (Molecular probes P7589)
2.3. Solutions
The following buffers and solutions are used in the DNA extraction procedure described:
1. DNA Extraction Buffer (1xTNE), pH=8.0, 1000 mL (store at 2 – 10˚C) • 1,21 g Tris base (10 mmol/L Tris-HCl) • 744 mg Na2EDTA*2H20 (2 mmol/L EDTA) • 8.76 g NaCl (150 mmol/L NaCl) Add 6 mmol/L HCl to pH=8.0 10 g SDS (1% w/V SDS) DNAse free distilled sterile water to 1000 mL
2. Guanidine hydrochloride (5 mol/L)
3. Proteinase K (20 mg/mL) (store at -20 ˚C) 4. 2-Propanol (80% v/v) (store at room temperature)
2.4. Plasticware
• MicroAmp Optical 96-Well Reaction Plates
• Optical adhesive covers
• 1.5 mL DNAse free reaction tubes
• 2.0 mL DNAse free reaction tubes
• 5.0 (or 15.0) mL DNAse free reaction tubes
CRL-GMFF: dried killed bacterial biomass DNA extraction
5/19

CRLVL04/08XP
Note: All plasticware has to be sterile and free of DNases, RNases and nucleic acids.
2.5. Precautions
• Chloroform, isopropanol, hydrochloric acid (HCl), guanidine hydrochloride and
sodiumdodecylsulphate are hazardous chemicals; therefore, all manipulations have to be performed according to safety guidelines, under fume hood.
• All tubes and pipette tips have to be discarded as biological hazardous material.
2.6. Abbreviations
EDTA ethylenediaminetetraacetic acid HCl Chloridric acid NaCl Sodium chloride PCR polymerase chain reaction SDS sodiumdodecylsulphate TNE Tris, NaCl, EDTA Tris Tris(hydroxymethyl)aminomethane
3. Description of the method
3.1. Sampling
The feeding stuff PT73 (TM), consisting of dried-killed bacterial biomass derived from E. coli K-12 event AG3139, is 100% GM. To the applicant’s knowledge no bacterial biomass from E. coli is used as feed material. Therefore any detection of event AG3139 identifies 100% GM sample. As such, no sampling scheme can be enforced.
3.2. Scope and applicability
The method can be used to isolate and purify DNA from the bacterial dried-killed biomass. Application of the method to other matrices may require adaptation and possibly a further specific validation.
3.3. Principle
The basic principle of the DNA extraction procedure consists in first releasing into aqueous solution the DNA present into the matrix and then in further purifying it from PCR inhibitors. The first step of the extraction procedure involves the use of guanidine hydrochloride, a chaotropic agent, and proteinase K, followed by extraction with chloroform to remove contaminants such as lipophilic molecules and proteins. The extracted DNA is further purified using a Wizard resin and finally dissolved in distilled water.
CRL-GMFF: dried killed bacterial biomass DNA extraction
6/19
CRLVL04/08XP
3.4. Samples grinding procedure
Samples should be processed prior to extraction procedure. Possible methods of processing include a commercial blender.
3.5 Extraction of genomic DNA from E. coli bacterial biomass
Note: the protocol describes the DNA extraction procedure for one sample only. Two samples of 100 mg each are processed separately from step 1 to step 9 and pooled at step 10.
1. Weigh out 2 times 100 mg of the sample into two 2 mL tubes. 2. To each tube, add 860 µL of TNE extraction buffer, 100 µL of 5M Guanidine-HCl and 40
µL of Proteinase K. 3. Mix well by vortexing and incubate for 1 hour at 65 ºC in thermomixer. 4. Centrifuge the two 2 mL tubes at 12,000 rpm for 5 min and transfer 750 µL of the
supernatant to new 2 mL tubes containing 750 µL of chloroform. 5. Mix 10 min with the rotator. 6. Heat the Wizard™ resin 10 min at 37 ºC and mix before use. 7. Centrifuge the sample extract with chloroform for 2 min at 12,000 rpm. 8. Transfer 500 µL of the upper layer into new 2 mL tubes and add 500 µL of the WizardTM
resin (within 5 min following heating) in each tube. Mix by inverting. 9. Attach 1 syringe barrel to the extension of 1 Minicolumn. Insert the tip of the
minicolumn/syringe barrel assembly into the vacuum manifold. 10. Pour the two extracted samples (containing each 500 µL of Wizard resin and 500 µL of
supernatant) into the syringe barrel. Apply a vacuum to draw the solution through the Minicolumn. Break the vacuum to the minicolumn.
11. To wash the column, add 2 mL of 80% isopropanol to the syringe barrel, and re-apply the vacuum.
12. Dry the resin by applying a vacuum. After the solution has been completely aspirated continue to apply the vacuum for additional 30 seconds. Do not dry the resin any longer. To remove residual of isopropanol, put the minicolum into a 1.5 mL tube and centrifuge at 10,000 rpm for 2 min.
13. Transfer the minicolumn into a new 1.5 mL tube and apply 100 µL of sterile water pre-warmed at 65-70 ºC. Wait 1 min and elute the DNA solution by centrifugation at 12,000 rpm. Repeat the elution step with another 100 µL of pre-warmed water.
Store the DNA extract at -20 ºC. DNA concentration is determined by fluorometric measurement.
CRL-GMFF: dried killed bacterial biomass DNA extraction
7/19

CRLVL04/08XP
4. Testing of the DNA extraction method by the Community Reference Laboratory for GM Food and Feed The aim of the experimental testing was to verify that the DNA extraction method provides DNA of quantity and quality appropriate for the detection and identification of the event-specific analyte. The CRL-GMFF tested the method proposed by the applicant on samples of food and feed consisting of dried killed bacterial biomass. To assess the suitability of the DNA extraction method for real-time PCR analysis, the extracted DNA was tested using a qualitative PCR run on a real-time PCR equipment.
4.1. Preparation of samples
About 200 g of feed material were ground using a GRINDOMIX GM 200 (Retsch GmbH) mixer; sample was ground once at 8000 rpm for 10 sec and twice at 10000 rpm for 15 sec.
4.2. DNA extraction
DNA was extracted following the method described above (see section 3. “Description of the method”); the DNA extraction was carried out on 6 test portions (replicates).
4.3. DNA concentration, yield and repeatability
Concentration of the DNA extracted was determined by fluorescence detection using the PicoGreen dsDNA Quantitation Kit (Molecular Probes). Each DNA extract was measured twice, and the two values were averaged. DNA concentration was determined on the basis of a five point standard curve ranging from 1 to 500 ng/µL using a Biorad VersaFluor fluorometer. The DNA concentration for the six replicates is reported in the Table 1 below.
Table 1. DNA concentration (ng/μL) of six DNA samples extracted from PT73 (TM)
Sample Concentration (ng/μL)
1 328 2 294 3 313 4 298 5 327 6 308
CRL-GMFF: dried killed bacterial biomass DNA extraction
8/19
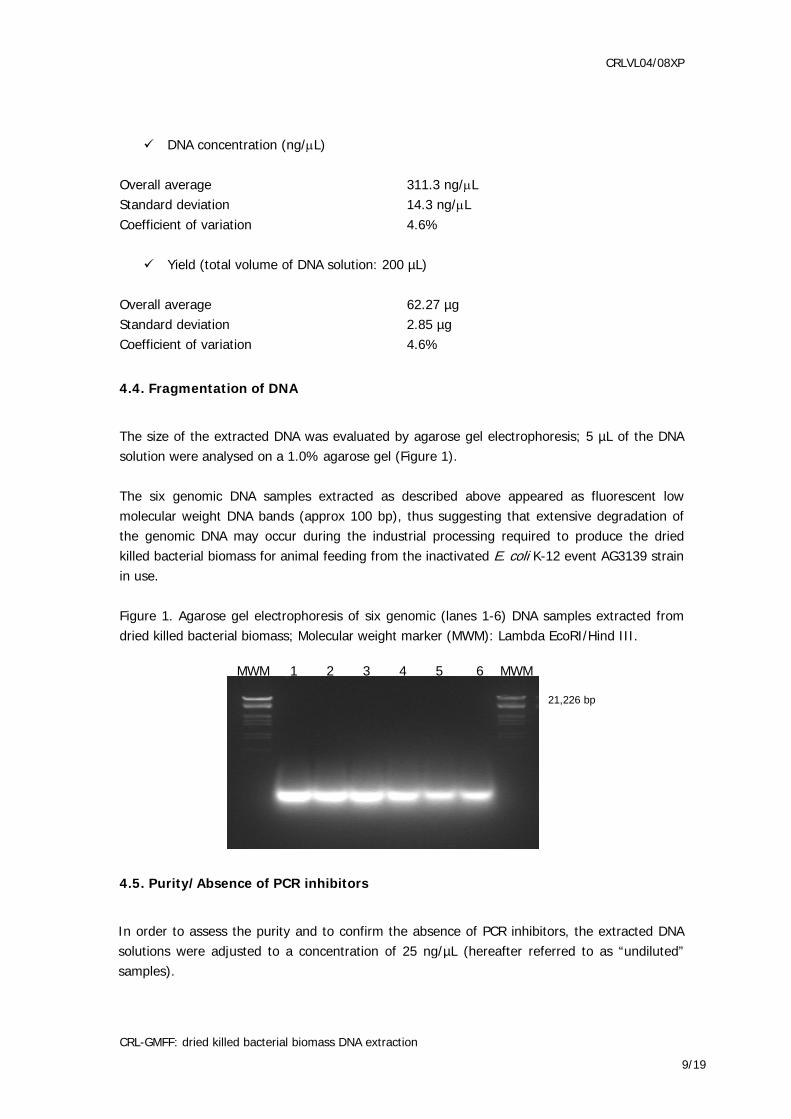
CRLVL04/08XP
DNA concentration (ng/μL)
Overall average 311.3 ng/μL Standard deviation 14.3 ng/μL Coefficient of variation 4.6%
Yield (total volume of DNA solution: 200 µL) Overall average 62.27 µg Standard deviation 2.85 µg Coefficient of variation 4.6%
4.4. Fragmentation of DNA
The size of the extracted DNA was evaluated by agarose gel electrophoresis; 5 µL of the DNA solution were analysed on a 1.0% agarose gel (Figure 1). The six genomic DNA samples extracted as described above appeared as fluorescent low molecular weight DNA bands (approx 100 bp), thus suggesting that extensive degradation of the genomic DNA may occur during the industrial processing required to produce the dried killed bacterial biomass for animal feeding from the inactivated E. coli K-12 event AG3139 strain in use. Figure 1. Agarose gel electrophoresis of six genomic (lanes 1-6) DNA samples extracted from dried killed bacterial biomass; Molecular weight marker (MWM): Lambda EcoRI/Hind III.
MWM 1 2 3 4 5 6 MWM 21,226 bp
4.5. Purity/Absence of PCR inhibitors
In order to assess the purity and to confirm the absence of PCR inhibitors, the extracted DNA solutions were adjusted to a concentration of 25 ng/µL (hereafter referred to as “undiluted” samples).
CRL-GMFF: dried killed bacterial biomass DNA extraction
9/19

CRLVL04/08XP
Subsequently fourfold serial dilutions of each extract were prepared with 0.2x TE buffer (1:4, 1:16, 1:64, 1:256) and analysed using a real-time PCR system detecting the TMD system (specific for a border region DNA sequence that spans the insert-to-E. coli junction of strain AG3139). The Ct values obtained for “undiluted” and diluted DNA samples are reported in Table 2. Table 2. Ct values of undiluted and fourfold serially diluted DNA extracts after amplification with the TMD system.
Diluted
DNA extract
Undiluted (25 ng/µL) 1:4 1:16 1:64 1:256
1 19.97 21.62 23.56 25.76 27.81 2 19.79 21.67 23.52 25.38 27.43 3 20.33 22.21 24.00 26.24 28.25 4 19.82 21.46 23.34 25.32 27.41 5 20.33 22.19 24.13 26.10 28.17 6 20.36 22.02 23.84 26.14 28.05
Table 3 below reports the comparison of extrapolated Ct values versus measured Ct values for all samples and the values of linearity (R2) and slope for all measurements. To measure inhibition, the Ct values of the four diluted samples were plotted against the logarithm of the dilution and the Ct value for the “undiluted” sample (25 ng/µL) was extrapolated from the equation calculated by linear regression. Subsequently the extrapolated Ct for the “undiluted” sample was compared with the measured Ct. The evaluation is carried out considering that PCR inhibitors are present if the measured Ct value for the “undiluted” sample is > 0.5 cycles compared the calculated Ct value (ΔCt > 0.5). In addition, the slope of the curve should be between -3.6 and -3.1. Table 3. Comparison of extrapolated Ct values versus measured Ct values (amplification of dried bacterial biomass TMD system).
DNA extraction R2 Slope* Ct extrapolated mean Ct
measured ΔCt**
1 0.997 -3.451 19.49 19.97 0.47 2 0.996 -3.179 19.72 19.79 0.07 3 0.997 -3.383 20.08 20.33 0.25 4 0.998 -3.294 19.42 19.82 0.39 5 0.995 -3.306 20.17 20.33 0.15 6 0.996 -3.390 19.91 20.36 0.45
*The expected slope for a PCR with 100% efficiency is -3.32
**delta Ct = abs (Ct extrapolated - Ct measured)
All ΔCt values of extrapolated versus measured Ct are < 0.5.
CRL-GMFF: dried killed bacterial biomass DNA extraction
10/19
CRLVL04/08XP
R2 of linear regression is > 0.99 for all DNA samples. The slopes of the curve are all between -3.1 and -3.6. In conclusion, the DNA extracted according to the method tested fulfilled the acceptance criteria.
CRL-GMFF: dried killed bacterial biomass DNA extraction
11/19
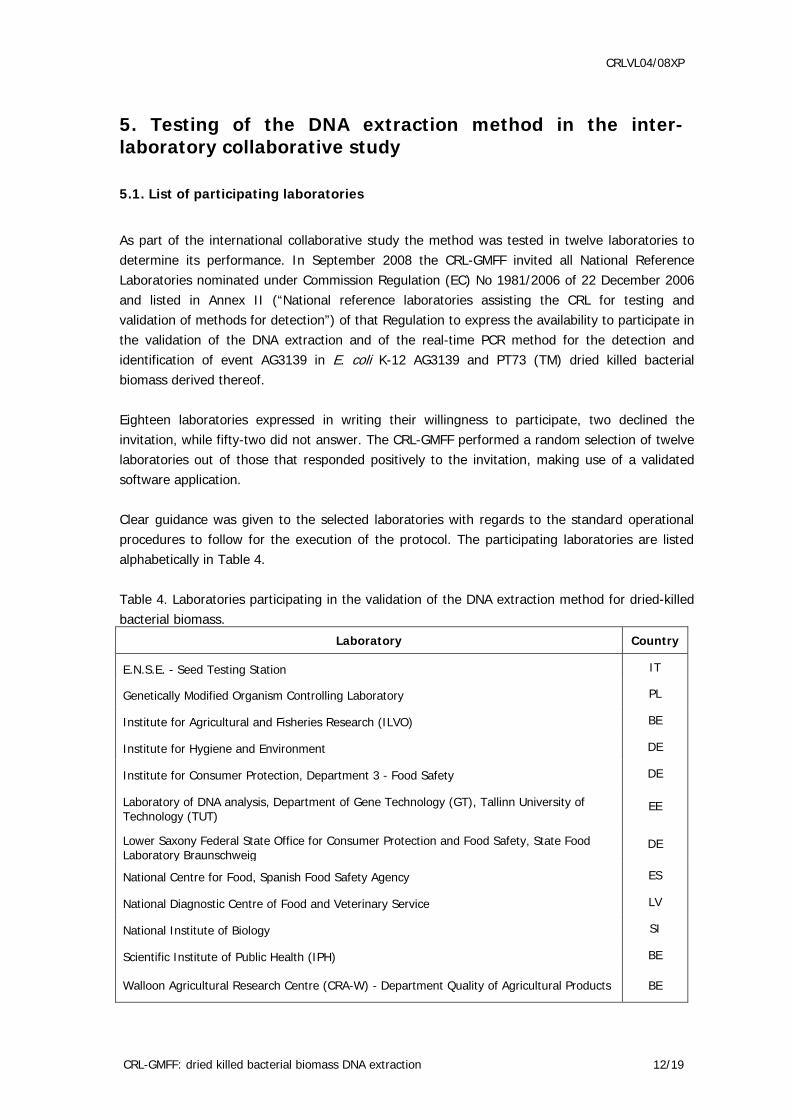
CRLVL04/08XP
5. Testing of the DNA extraction method in the inter-laboratory collaborative study
5.1. List of participating laboratories
As part of the international collaborative study the method was tested in twelve laboratories to determine its performance. In September 2008 the CRL-GMFF invited all National Reference Laboratories nominated under Commission Regulation (EC) No 1981/2006 of 22 December 2006 and listed in Annex II (“National reference laboratories assisting the CRL for testing and validation of methods for detection”) of that Regulation to express the availability to participate in the validation of the DNA extraction and of the real-time PCR method for the detection and identification of event AG3139 in E. coli K-12 AG3139 and PT73 (TM) dried killed bacterial biomass derived thereof. Eighteen laboratories expressed in writing their willingness to participate, two declined the invitation, while fifty-two did not answer. The CRL-GMFF performed a random selection of twelve laboratories out of those that responded positively to the invitation, making use of a validated software application. Clear guidance was given to the selected laboratories with regards to the standard operational procedures to follow for the execution of the protocol. The participating laboratories are listed alphabetically in Table 4. Table 4. Laboratories participating in the validation of the DNA extraction method for dried-killed bacterial biomass.
Laboratory Country
E.N.S.E. - Seed Testing Station IT
Genetically Modified Organism Controlling Laboratory PL
Institute for Agricultural and Fisheries Research (ILVO) BE
Institute for Hygiene and Environment DE
Institute for Consumer Protection, Department 3 - Food Safety DE
Laboratory of DNA analysis, Department of Gene Technology (GT), Tallinn University of Technology (TUT)
EE
Lower Saxony Federal State Office for Consumer Protection and Food Safety, State Food Laboratory Braunschweig
DE
National Centre for Food, Spanish Food Safety Agency ES
National Diagnostic Centre of Food and Veterinary Service LV
National Institute of Biology SI
Scientific Institute of Public Health (IPH) BE
Walloon Agricultural Research Centre (CRA-W) - Department Quality of Agricultural Products BE
CRL-GMFF: dried killed bacterial biomass DNA extraction 12/19
CRLVL04/08XP
The aim of the inter-laboratory collaborative study was to verify that the DNA extraction method provides DNA of suitable quantity and quality for the intended purpose. The participating laboratories listed in Table 4 tested the method proposed by the applicant on samples of feed consisting of dried killed bacterial biomass. To assess the suitability of the DNA extraction method for real-time PCR analysis, the extracted DNA was tested using the RT-PCR based event-specific method for the detection of E. coli K-12 event AG3139 (validated method available at http://gmo-crl.jrc.ec.europa.eu/).
5.2. Samples and reagents provided
A) Control and feed samples
PT73 (TM) biomass (2 grams of fine ground powder), labelled ‘0408PT73 TM’ Internal Positive Control IPC (200 µL of DNA solution) extracted from PT73 (TM) at 10
ng/µL
B) Material for DNA extraction procedure TNE extraction buffer, one tube 17.2 mL Guanidine hydrochloride 5 mol/L, one tube 2 mL Proteinase K, one tube 800 µL Wizard® resin, one tube 10 mL Minicolumns and syringe barrels, 10 units Distilled sterile water, one tube 15 mL Picogreen, one tube 240 µL Lambda Phage DNA, one tube 60 µL TE 20X, two tubes 2 mL
C) Reaction reagents
Universal PCR Master Mix (2x), two bottles: 5 mL each Primers and probes (1 tube each) as follows:
TMD system TMD-F (10 µM): 715 µL TMD-R (10 µM): 715 µL TMD-P (5 µM): 420 µL
5.3. Reagents, Materials and equipments provided by the participating laboratory
• Chloroform
• Isopropanol
• Fluorometer
• MicroAmp Optical 96-Well Reaction Plates
• Optical adhesive covers
CRL-GMFF: dried killed bacterial biomass DNA extraction 13/19
CRLVL04/08XP
• Micropipettes
• Rack for reaction tubes
• 1.5 mL DNAse free reaction tubes
• 2.0 mL DNAse free reaction tubes
• 5.0 (or 15.0) mL DNAse free reaction tubes
• Platform for real-time PCR and analysis software
• Standard bench top centrifuge with 1.5 mL reaction tubes rotor or standard microfuge
• Vortexer
• Rotator
• Thermomixer
• Vacuum manifold 5.4. DNA extraction
DNA was extracted following the method described above (see section 3. “Description of the method”); the DNA extraction was carried out on 4 test portions (replicates).
5.5. Deviations reported
Seven laboratories reported no deviations from the protocol. One laboratory used the centrifuge instead of vacuum manifold. One laboratory loaded each sample extract of step 10 of the extraction procedure into separate columns instead of first combining and then loading them into one column. Two laboratories found clumps of bacterial biomass powder in the respective tube and used only its finest part. One laboratory heated briefly at 65˚C the TNE buffer to dissolve some precipitate, One laboratory measured the DNA concentration of the DNA extracts from the feed sample via spectrophotometric instead of fluorometric means. DNA concentration resulted in evident overestimation. Minute contaminations of the extraction control sample with traces of DNA extracts from the bacterial biomass were noted in several laboratories and were likely due to high powder volatility.
CRL-GMFF: dried killed bacterial biomass DNA extraction 14/19

CRLVL04/08XP
5.6. DNA concentration, yield and repeatability Concentration of the DNA extracted was determined by fluorescence detection using the PicoGreen dsDNA Quantitation Kit (Molecular Probes). Each DNA extract was measured in triplicate according to the laboratory procedure, lambda phage DNA at 100 ng/μL was used as a control. Raw data were sent to the CRL-GMFF according to the instructions provided in the protocol and using the electronic tool provided (Excel spreadsheet). The DNA concentration for all samples is reported in Table 5 below. Table 5. DNA concentration (ng/μL) of the four replicate extracts obtained by all laboratories. PL1 PL2 PL3 PL4 PL5 PL6 PL7 PL8 PL9 PL10 PL11 PL12
EA 441 181 65 379 188 988 385 286 362 165 225 2446 EB 401 181 65 386 197 884 403 410 353 142 234 2712 EC 407 176 62 380 166 1014 391 231 373 144 244 3096 ED 385 171 63 375 178 1011 384 372 375 146 224 2347
Table 5 indicates that all laboratories were successful in extracting DNA from the four replicates of the PT73 (TM) feed sample. The DNA extraction yield was calculated for each DNA extraction performed by the participating laboratories considering a total volume of 200 μL per extract and a sample amount of 200 mg as referred to in paragraph 3.5. Figure 2 shows the data dispersion around the average for each laboratory.
CRL-GMFF: dried killed bacterial biomass DNA extraction 15/19
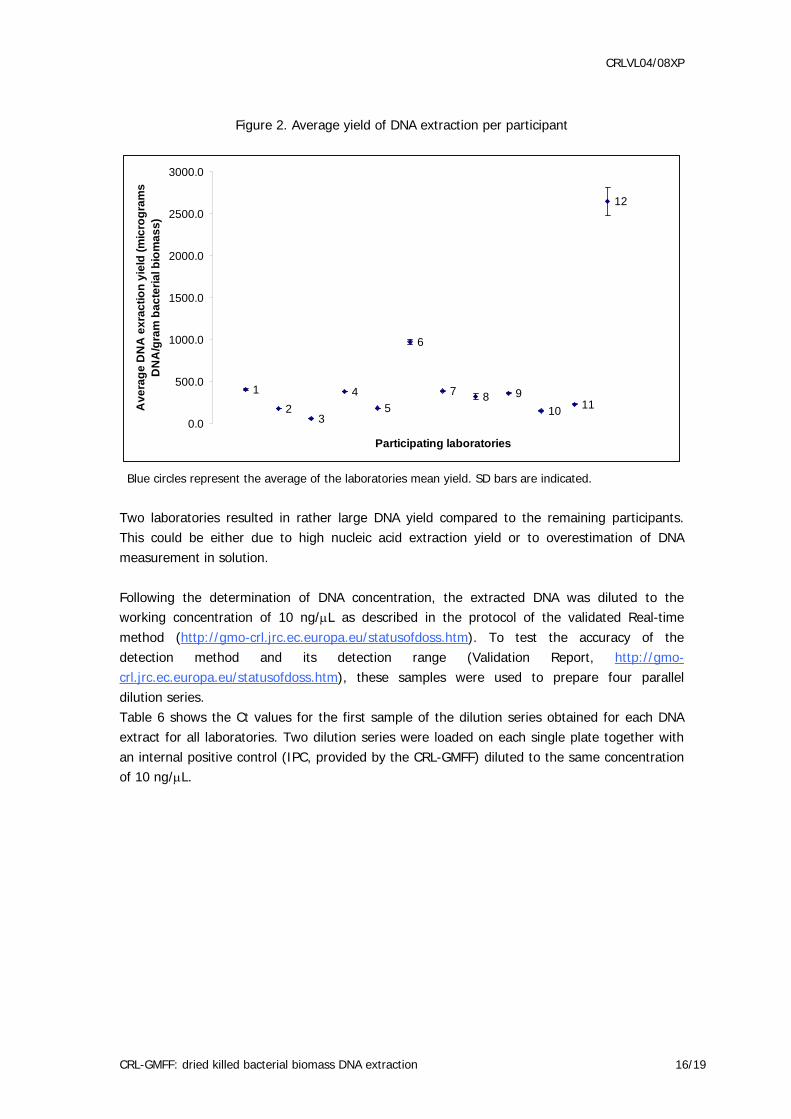
CRLVL04/08XP
Figure 2. Average yield of DNA extraction per participant
1
23
45
6
7 8 910 11
12
0.0
500.0
1000.0
1500.0
2000.0
2500.0
3000.0
Participating laboratories
Ave
rage
DN
A e
xrac
tion
yiel
d (m
icro
gram
s D
NA
/gra
m b
acte
rial b
iom
ass)
Blue circles represent the average of the laboratories mean yield. SD bars are indicated.
Two laboratories resulted in rather large DNA yield compared to the remaining participants. This could be either due to high nucleic acid extraction yield or to overestimation of DNA measurement in solution. Following the determination of DNA concentration, the extracted DNA was diluted to the working concentration of 10 ng/μL as described in the protocol of the validated Real-time method (http://gmo-crl.jrc.ec.europa.eu/statusofdoss.htm). To test the accuracy of the detection method and its detection range (Validation Report, http://gmo-crl.jrc.ec.europa.eu/statusofdoss.htm), these samples were used to prepare four parallel dilution series. Table 6 shows the Ct values for the first sample of the dilution series obtained for each DNA extract for all laboratories. Two dilution series were loaded on each single plate together with an internal positive control (IPC, provided by the CRL-GMFF) diluted to the same concentration of 10 ng/μL.
CRL-GMFF: dried killed bacterial biomass DNA extraction 16/19
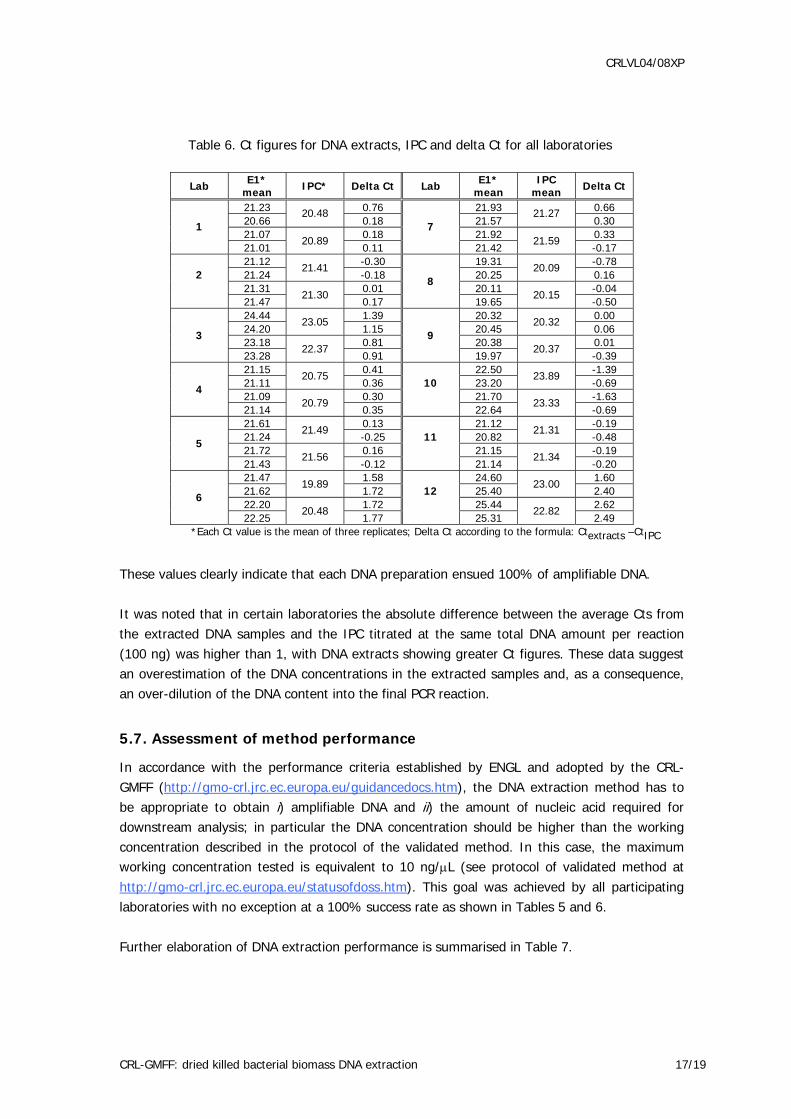
CRLVL04/08XP
Table 6. Ct figures for DNA extracts, IPC and delta Ct for all laboratories
Lab E1* mean IPC* Delta Ct Lab E1*
mean IPC
mean Delta Ct
21.23 0.76 21.93 0.66 20.66
20.48 0.18 21.57
21.27 0.30
21.07 0.18 21.92 0.33 1
21.01 20.89
0.11
7
21.42 21.59
-0.17 21.12 -0.30 19.31 -0.78 21.24
21.41 -0.18 20.25
20.09 0.16
21.31 0.01 20.11 -0.04 2
21.47 21.30
0.17
8
19.65 20.15
-0.50 24.44 1.39 20.32 0.00 24.20
23.05 1.15 20.45
20.32 0.06
23.18 0.81 20.38 0.01 3
23.28 22.37
0.91
9
19.97 20.37
-0.39 21.15 0.41 22.50 -1.39 21.11
20.75 0.36 23.20
23.89 -0.69
21.09 0.30 21.70 -1.63 4
21.14 20.79
0.35
10
22.64 23.33
-0.69 21.61 0.13 21.12 -0.19 21.24
21.49 -0.25 20.82
21.31 -0.48
21.72 0.16 21.15 -0.19 5
21.43 21.56
-0.12
11
21.14 21.34
-0.20 21.47 1.58 24.60 1.60 21.62
19.89 1.72 25.40
23.00 2.40
22.20 1.72 25.44 2.62 6
22.25 20.48
1.77
12
25.31 22.82
2.49 *Each Ct value is the mean of three replicates; Delta Ct according to the formula: Ctextracts –CtIPC
These values clearly indicate that each DNA preparation ensued 100% of amplifiable DNA. It was noted that in certain laboratories the absolute difference between the average Cts from the extracted DNA samples and the IPC titrated at the same total DNA amount per reaction (100 ng) was higher than 1, with DNA extracts showing greater Ct figures. These data suggest an overestimation of the DNA concentrations in the extracted samples and, as a consequence, an over-dilution of the DNA content into the final PCR reaction.
5.7. Assessment of method performance
In accordance with the performance criteria established by ENGL and adopted by the CRL-GMFF (http://gmo-crl.jrc.ec.europa.eu/guidancedocs.htm), the DNA extraction method has to be appropriate to obtain i) amplifiable DNA and ii) the amount of nucleic acid required for downstream analysis; in particular the DNA concentration should be higher than the working concentration described in the protocol of the validated method. In this case, the maximum working concentration tested is equivalent to 10 ng/μL (see protocol of validated method at http://gmo-crl.jrc.ec.europa.eu/statusofdoss.htm). This goal was achieved by all participating laboratories with no exception at a 100% success rate as shown in Tables 5 and 6. Further elaboration of DNA extraction performance is summarised in Table 7.
CRL-GMFF: dried killed bacterial biomass DNA extraction 17/19
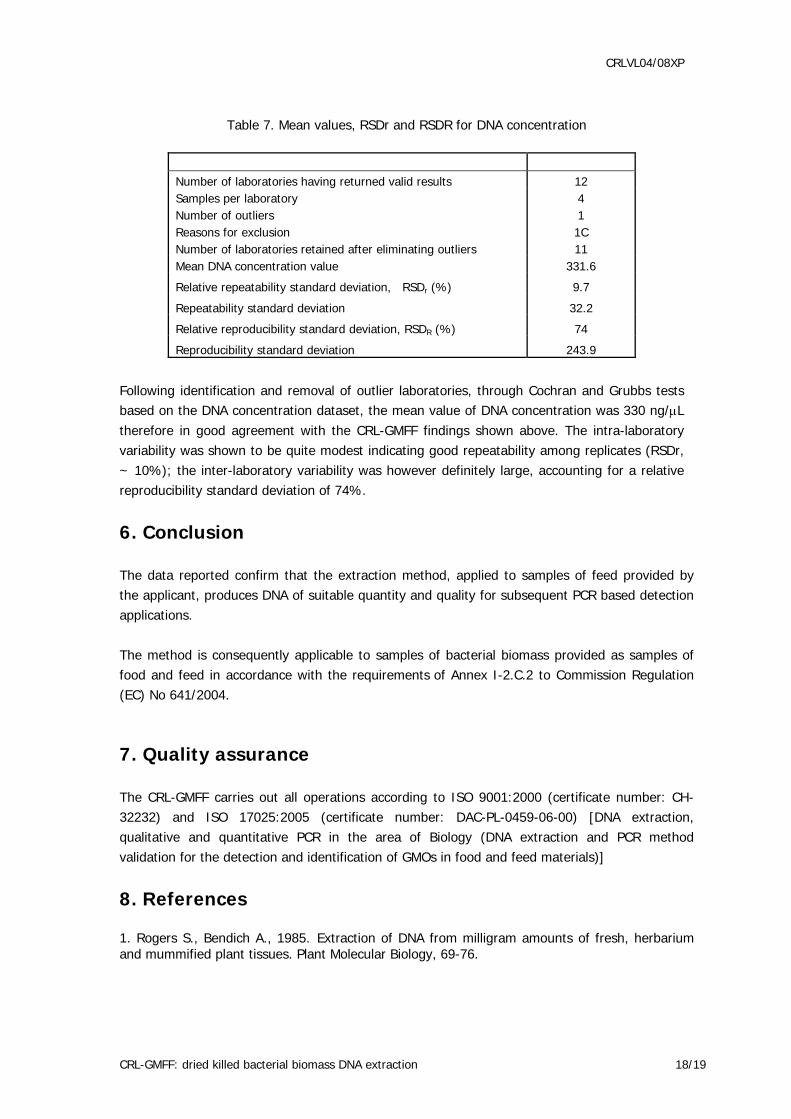
CRLVL04/08XP
Table 7. Mean values, RSDr and RSDR for DNA concentration
Number of laboratories having returned valid results 12 Samples per laboratory 4 Number of outliers 1 Reasons for exclusion 1C Number of laboratories retained after eliminating outliers 11 Mean DNA concentration value 331.6
Relative repeatability standard deviation, RSDr (%) 9.7
Repeatability standard deviation 32.2
Relative reproducibility standard deviation, RSDR (%) 74
Reproducibility standard deviation 243.9
Following identification and removal of outlier laboratories, through Cochran and Grubbs tests based on the DNA concentration dataset, the mean value of DNA concentration was 330 ng/μL therefore in good agreement with the CRL-GMFF findings shown above. The intra-laboratory variability was shown to be quite modest indicating good repeatability among replicates (RSDr, ~ 10%); the inter-laboratory variability was however definitely large, accounting for a relative reproducibility standard deviation of 74%.
6. Conclusion The data reported confirm that the extraction method, applied to samples of feed provided by the applicant, produces DNA of suitable quantity and quality for subsequent PCR based detection applications. The method is consequently applicable to samples of bacterial biomass provided as samples of food and feed in accordance with the requirements of Annex I-2.C.2 to Commission Regulation (EC) No 641/2004.
7. Quality assurance The CRL-GMFF carries out all operations according to ISO 9001:2000 (certificate number: CH-32232) and ISO 17025:2005 (certificate number: DAC-PL-0459-06-00) [DNA extraction, qualitative and quantitative PCR in the area of Biology (DNA extraction and PCR method validation for the detection and identification of GMOs in food and feed materials)]
8. References 1. Rogers S., Bendich A., 1985. Extraction of DNA from milligram amounts of fresh, herbarium and mummified plant tissues. Plant Molecular Biology, 69-76.
CRL-GMFF: dried killed bacterial biomass DNA extraction 18/19

CRLVL04/08XP
2. Sambrook J. and Russell D. W., 2001. Molecular Cloning. A laboratory manual. Third edition. Cold Spring Harbor Laboratory Press.
CRL-GMFF: dried killed bacterial biomass DNA extraction 19/19

European Commission EUR 24236 EN – Joint Research Centre – Institute for Health and Consumer Protection Title: Event-specific Method for the Detection of Dried-killed Bacterial Biomass PT73 (TM) Derived from E. coli GM Strain AG3139 Using Real-time PCR Author(s): M. Mazzara, N. Foti, C. Savini, L. Bonfini, G. Van den Eede Luxembourg: Office for Official Publications of the European Communities 2009 – 55 pp. – 21 x 29.7 cm EUR – Scientific and Technical Research series – ISSN 1018-5593 ISBN 978-92-79-14981-8 DOI 10.2788/58900 Abstract The JRC as Community Reference Laboratory for GM Food and Feed (CRL-GMFF), established by Regulation (EC) No 1829/2003, in collaboration with the European Network of GMO Laboratories (ENGL), has carried out a collaborative study to assess the performance of a qualitative event-specific method to detect the AG3139 transformation event in bacterial biomass derived from E. coli K-12 DNA. The collaborative trial was conducted according to internationally accepted guidelines (1, 2). In accordance with Regulation (EC) No 1829/2003 of 22 September 2003 “on genetically modified food and feed” and with Regulation (EC) No 641/2004 of 6 April 2004 “on detailed rules for the implementation of Regulation (EC) No 1829/2003”, Ajinomoto Eurolysine S.A.S. provided the detection method and the samples (genomic DNA from E. coli K-12 harbouring the AG3139 event, bacterial biomass derived thereof, genomic DNA from the parental organism E. coli K-12 MG1655, and plasmids as positive and negative control samples). The JRC prepared the validation samples. The collaborative trial involved twelve laboratories from eight European countries. The results of the international collaborative trial met the ENGL performance requirements (see Annex 1). The method is, therefore, considered applicable to the control and feed samples provided, in accordance with the requirements of Annex I-2.C.2 to Commission Regulation (EC) No 641/2004. The results of the collaborative study are made publicly available at http://gmo-crl.jrc.ec.europa.eu/.

How to obtain EU publications Our priced publications are available from EU Bookshop (http://bookshop.europa.eu), where you can place an order with the sales agent of your choice. The Publications Office has a worldwide network of sales agents. You can obtain their contact details by sending a fax to (352) 29 29-42758.
The mission of the JRC is to provide customer-driven scientific and technical support for the conception, development, implementation and monitoring of EU policies. As a service of the European Commission, the JRC functions as a reference centre of science and technology for the Union. Close to the policy-making process, it serves the common interest of the Member States, while being independent of special interests, whether private or national.
LB
-NA
-24236-EN-C