event detection in airport surveillance - · event detection in airport surveillance the trecvid...
TRANSCRIPT

Event Detection in Airport
Surveillance
The TRECVid 2008 EvaluationThe TRECVid 2008 Evaluation
Jerome Ajot, Jonathan Fiscus, John Garofolo
Martial Michel, Paul Over, Travis Rose, Mehmet Yilmaz
NIST
Heather Simpson, Stephanie Strassel
LDCVideo Analysis
Content Extraction

Outline
• Motivation
• Evaluation process
• Data
• Task definitions
• Events• Events
• Annotation process
• Scoring
• Adjudication
• Conclusion & Future work

Motivation
• Problem: automatic detection of observableevents in surveillance video
• Challenges: – requires application of several Computer Vision
techniquestechniques• segmentation, person detection/tracking, object recognition,
feature extraction, etc.
– involves subtleties that are readily understood by humans, difficult to encode for machine learning approaches
– can be complicated due to clutter in the environment, lighting, camera placement, traffic, etc.

NIST Evaluation Process
Determine Program
Requirements
Dry-Run
shakedown
PlanningPlanning ProductsProducts ResultsResults
Evaluation Plan
Task Definitions
Protocols/Metrics
Rollout Schedule
Choosing the right task and metric is key
Formal EvaluationAssess
required/existing
resources
Develop detailed
plans with
researcher input
Technical Workshops
and reports
Recommendations
Data Identification
Evaluation Resources
Training Data
Development Data
Evaluation Data
Ground Truth and
other metadata
Scoring and
Truthing Tools

UK Home Office
London Gatwick Airport Data
• Home Office collected two parallel surveillance camera datasets
– 1 for their multi-camera tracking evaluation
– 1 for our event detection evaluation
• 100 hour event detection dataset
– 10 data collection sessions– 10 data collection sessions
* 2 hours per session
* 5 cameras per session
• Camera views
– Elevator close-up
– 4 high traffic areas
– Camera view features
– Controlled access door
– Some overlapping views
– Areas with low pixels on target

TRECVid
Retrospective Event Detection
• Task:
– Given a definition of an observable event involving humans, detect all occurrences of an event in airport
surveillance videosurveillance video
– Identify each event observation by
• The temporal extent
• A detection score indicating the strength of evidence
• A binary decision on the detection score optimizing
performance for a surrogate application

TRECVid
Freestyle Analysis
• Goal is to support innovation in ways not
anticipated by the retrospective task
• Freestyle task includes:
– rationale– rationale
– clear definition of the task
– performance measures
– reference annotations
– baseline system implementation

Technology Readiness Discussion ResultsBenchmark detection accuracy across a variety of low occurrence events
SitDown
StandUp
ObjectPut
ReverseDirection
ObjectGet
ChildWalking
PersonLoiters
LargeLuggage
PersonRuns
VestAppears
OpenCloseDoor
Zero Acc., Not Feasible 2+ yrs.
Zero Acc., Not Feasible next year
Low Acc.
0% 20% 40% 60% 80% 100%
CellToEar
ObjectGive
Embrace
PeopleMeet
PeopleSplitUp
Pointing
ElevatorNoEntry
UseATM
OpposingFlow
SitDown Low Acc.
Low-Medium Acc.
Med.-High Acc.
High Acc.
Fraction of 13 ParticipantsEvents
Selected for
2008

Event Annotation Guidelines
• Jointly developed by:
– NIST, Linguistic Data Consortium (LDC), Computer Vision Community
• Rules help users identify event observations
– Reasonable Interpretation (RI) Rule
• If according to a reasonable interpretation of the video, the event must
have occurred, then it is a taggable event
– Start/Stop times for occlusion
• Observations with “occluded start times” begin with the occlusion or frame boundary
• Observations with “occluded end times” end with the occlusion or frame boundary
• Frame boundaries are occlusions, but the existence of the event still follows the RI Rule
• Event Definitions left minimal to capture human intuitions
– Contrast with highly defined annotation tasks such as ACE

Annotator Training
• Training session with lead annotator to introduce task and guidelines
• Complete 1-3 practice files
– Tool functionality
– Data and camera views
– Annotation decisions and rules of thumb– Annotation decisions and rules of thumb
• Regular team meetings for ongoing training
• Annotator mailing list to resolve challenging examples
– Usually matter of reinforcing basic principles – “How would you describe this event to someone else?”
• Decisions logged to LDC wiki for annotator reference
• NIST input sought on issues that could not be resolved locally

Annotation Tool and Data Processing
• Annotation Tool
– ViPER GT, developed by UMD (now AMA)• http://viper-toolkit.sourceforge.net/
– NIST and LDC adapted tool for workflow system compatibility
• Data Pre-processing•– OS limitations required conversion from MPEG to JPEG
• 1 JPEG image for each frame
– For each video clip assigned to annotators
• Divided JPEGs into framespan directories
• Created .info file specifying order of JPEGs
• Created ViPER XML file (XGTF) with pointer to .info file
– Default ViPER playback rate = about 25 frames (JPEGs)/second

Annotation Workflow Design
• Pilot study to determine optimal balance of clip duration and number of events per work session
• Source data divided into 5m 10s clips
– 10s = 5s of overlap with the preceding and following clips
• Events divided into 2 sets of 5
Set 1: PersonRun, CellToEar, ObjectPut, Pointing, – Set 1: PersonRun, CellToEar, ObjectPut, Pointing, ElevatorNoEntry
– Set 2: PeopleMeet, PeopleSplitUp, Embrace, OpposingFlow, TakePicture
• For each assigned clip + event set, detect any event occurrence and label its temporal extent
• 5% of devtest set dually annotated (double-blind) to establish baseline IAA and permit consistency analysis

Visualization of Annotation Workflow
A1 A2
E1 E2 E5E4E3Event Set 1
Set 1
Annotators
5 minutes10
secs5 minutesVideo
A3 A4
E7 E9E6 E10E8Event Set 2
Set 2
Annotators

Annotation Rates• Average 10-15 x Real Time
– i.e. 50-75 mins per 5m clip, with 5 events under consideration per clip
• Annotation rates heavily conditioned by camera view
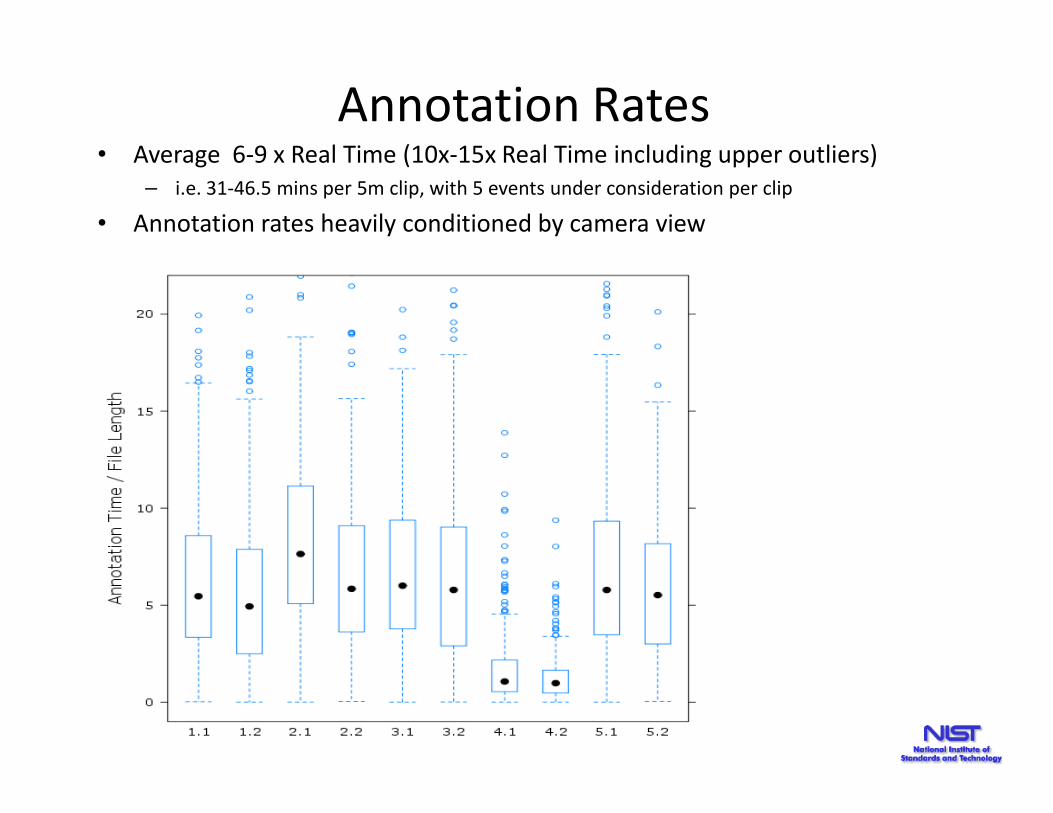
Annotation Rates• Average 6-9 x Real Time (10x-15x Real Time including upper outliers)
– i.e. 31-46.5 mins per 5m clip, with 5 events under consideration per clip
• Annotation rates heavily conditioned by camera view

Annotation Challenges
• Ambiguity of guidelines
– Loosely defined guidelines tap into human intuition instead of forcing
real world data into artificial categories
– But human intuitions often differ on borderline cases
– Lack of specification can also lead to incorrect interpretation
• Too broad (e.g. baby as object in ObjectPut)
• Too strict (e.g. person walking ahead of group as PeopleSplitUp)• Too strict (e.g. person walking ahead of group as PeopleSplitUp)
• Ambiguity and complexity of data
– Video quality leads to missed events and ambiguous event instances
• Gesturing or pointing? ObjectPut or picking up an object? CellToEar or
fixing hair?
• Human factors
– Annotator fatigue a real issue for this task
• Technical issues

Example Observations
Easy to Find Example Hard to Find Example
Pointing
Embrace

Table of Participants Vs Events
Ce
ll T
o E
ar
Ele
vato
r
No
En
try
Em
bra
ce
Ob
ject
Pu
t
Op
po
sin
g
Flo
wP
eo
ple
Me
et
Pe
op
le
Sp
lit
Up
Pe
rso
n R
un
s
Po
inti
ng
Take
Pic
ture
AIT X X X
BUT X X X X
CMU X X X X X X X X X X
DCU X X X X X
FD
•16 Sites
•72 Event Runs
FD X X X
IFP-UIUC-NEC X X X X X X X X X X
Intuvision X X X
MCG-ICT-CAS X X X X X X X
NHKSTRL X X X
QMUL-ACTIVA X X X
SJTU X X X X X
THU-MNL X X X
TokyoTech X X X
Toshiba X X X
UAM X X X
UCF X X X X
Total 3 11 4 5 15 6 4 15 3 6

Rates of Event ObservationsDevelopment vs. Evaluation data
35
40
45
50
(Ob
serv
ati
on
s/H
ou
r)
Dev 08
Eval 08
A single Rtarget (20)
was chosen for
the evaluation
0
5
10
15
20
25
30
35
Ra
teTa
rge
t(O
bse
rva
tio
ns/
Ho
ur)

Evaluation Protocol Synopsis• NIST used the Framework for Detection Evaluation
(F4DE) Toolkit• Available for download on the Event Detection Web Site
• Events are independent for eval. purposes
• Two step evaluation process• System observations are “aligned” to reference observations
• Detection performance is a tradeoff between missed • Detection performance is a tradeoff between missed detections and false alarms
• Two methods of evaluating performance– Decision Error Tradeoff curves graphically depict
performance
– A “Surrogate Application”: Normalized Detection Cost Rate– A priori application requirements unknown
– Optimization to be achieved using a “System Value Function”

Temporal Alignment for Detection in
Streaming Media
Time
Ref. Obs.Hungarian Solution to Bipartite Graph Matching
• Mapping Alignment Rules
– Mid point of system with Δt of reference extent
– Temporal congruence and decision scores give
preference to overlapping events
Sys. Obs.

Decision Error Tradeoff Curves
ProbMiss vs. RateFA
Decision Score Histogram
Co
un
t o
f O
bse
rva
tio
ns
Full Distribution
Co
un
t o
f O
bse
rva
tio
ns
Decision Score
Full Distribution

Decision Error Tradeoff Curves
ProbMiss vs. RateFA
Decision Score Histogram Separated wrt. Reference Annotation s
Co
un
t o
f O
bse
rva
tio
ns
Incorrect System
Observations
Non-Targets
Targets
Θ
Co
un
t o
f O
bse
rva
tio
ns
System Decision Score
True Observations
tionSignalDura
sFalseAlarmRateFA
#)( =θ
TrueObs
MissedObsPMiss
#
#)( =θ
Normalizing by # of Non-Observations is
impossible for Streaming Detection Evaluations
Targets

Decision Error Tradeoff Curves
ProbMiss vs. RateFA
Compute RateFA and PMiss for all Θ
Co
un
t o
f O
bse
rva
tio
ns
Incorrect System
Observations
Θ
Co
un
t o
f O
bse
rva
tio
ns
System Decision Score
True Observations
))(),(( θθ MissFA PRate
+= )(*
*)(minarg)(
arg
θθθθ
FA
etTMiss
FAMiss R
RCost
CostPRMinimumNDC

Decision Error Tradeoff Curves
Actual vs. Minimum NDCRC
ou
nt
of
Ob
serv
ati
on
s
System
Obs. With
/YES/
Decision
System
Obs. With
/NO/
Decision
10=MissCost
Event Detection
Constants
Θ
Co
un
t o
f O
bse
rva
tio
ns
System Decision Score
+= )(*
*)(minarg)(
arg
θθθθ
FA
etTMiss
FAMiss R
RCost
CostPRMinimumNDC
.).(**
.).(.).(arg
DecActRRCost
CostDecActPDecActActualNDCR FA
etTMiss
FAMiss +=
20
1
arg =
=
etT
FA
Miss
R
Cost

PersonRuns EventBest Submission per Site
SJTU_1-p-baseline_1
QMUL-ACTIVA_3-p-…
NHKSTRL_4-p-NHK-…
MCG-ICT-CAS_2-p-…
IFP-UIUC-NEC_3-p-1_3
FD_1-p-base_1
DCU_1-p-DCUSystem_1
CMU_11-p-VCUBE_1
BUT_2-p-butsys_1
AIT_1-p-baseline_1
Min NDCR Act. NDCR
0 0.5 1 1.5
UCF_1-p-UCF08_1
UAM_1-p-baseline_1
Toshiba_2-p-baseline_1
TokyoTech_3-p-EVAL_1
THU-MNL_2-c-…
SJTU_1-p-baseline_1

Estimating Human Error Rates:6-Way Annotation Study
• LDC create 6 independent annotations for each excerpt
Caveats of the experiment
• Not balanced by events
• Not balanced by annotators
• Blindly merge all annotations
– Use evaluation code to iteratively merge annotations
– Commonly detected observations counted once
40
50
60
Nu
mb
er
of
Un
iqu
e O
bse
rva
tio
ns
Found Unique Observations by
the Number of Independent Annotators
PointingPeopleMeetPeopleSplitEmbracecounted once
• Analysis:
– Curves follow published studies on finding software bugs*
– Curves suggest more annotation is needed for some events but False Alarms haven’t been accounted for
– LDC reviewed all observed events (100% Adjudication)
0
10
20
30
1 2 3 4 5 6
Nu
mb
er
of
Un
iqu
e O
bse
rva
tio
ns
Number of Annotators
EmbraceObjectPutTakePicturePersonRunsOpposingFlowCellToEarElevatorNoEntry
* Nielsen and Landauer: “A Mathematical Model of Finding Usability Problems”

Estimating Human Error Rates:Humans vs. 6-Way Adjudicated References
0.8
1
1.2
CellToEar
Embrace
ObjectPut
Circle area is the
duration of video
annotated
50 minutes
-0.2
0
0.2
0.4
0.6
-5 0 5 10 15 20 25 30
PM
iss
RateFA (FA per Hour)
ObjectPut
OpposingFlow
PeopleMeet
PeopleSplitUp
PersonRuns
Pointing
TakePicture
5 minutes

PersonRuns EventBest Submission per Site with Human Error Estimates
Circle area is the
duration of video
annotated
Gia -> 50minutes

Random DET Curves for
Streaming Detection Evaluations• Parametric random curves are not possible
– Due to un-countable non-target trials
– Monte Carlo simulation is a feasible method
• Monte Carlo Random DET Curves
– Two factors influence a random system
• RTarget -- Primary effect• RTarget -- Primary effect
• Observation duration statistics -- Secondary effect
– Distribution measurements: Mean, Standard Deviation, etc.
– Test set size computation (Rule of 30 @ 40% Pmiss)
• #Hours = 30 errs / .4 (Pmiss) / RTarget
– Our procedure:
1. Measure Rtarget and Mean Duration of observations in the eval set
2. Construct 50 pairs of a random test set and system output with decision
scores from a uniform random distribution, 1000 system obs./hour
3. Compute an ref/sys pair-averaged, DET Curve

PersonRuns EventBest Submission per Site with Human Error Estimates
and Random Curves
• Random system
• Rtarg=6.36,
• MeanDur=3.25s
• TestDur=12H

PeopleMeet EventBest Submission per Site
0 0.5 1 1.5
UAM_1-p-baseline_1
TokyoTech_3-p-EVAL_1
SJTU_1-p-baseline_1
MCG-ICT-CAS_2-p-baseline_1
DCU_1-p-DCUSystem_1
CMU_11-p-VCUBE_1
Min NDCR Act. NDCR
• Random system
• Rtarg=23.46,
• MeanDur=129.4s
• TestDur=3H

PeopleSplitUp EventBest Submission per Site
0 0.5 1 1.5
UAM_1-p-baseline_1
TokyoTech_3-p-EVAL_1
MCG-ICT-CAS_2-p-baseline_1
CMU_11-p-VCUBE_1
Min NDCR Act. NDCR
• Random system
• Rtarg=13.2,
• MeanDur=11.66s
• TestDur=6H

Opposing Flow EventBest Submission per Site
0 0.5 1 1.5
UCF_1-p-UCF08_1
Toshiba_2-p-baseline_1
SJTU_1-p-baseline_1
NHKSTRL_4-p-NHK-SYS1_2
Intuvision_2-p-zipsub_1
FD_1-p-base_1
CMU_11-p-VCUBE_1
AIT_1-p-baseline_1
Min NDCR Act. NDCR
• Too few human annot.
• No random system
• Rtarg=0.23,
• MeanDur=2.38s
• TestDur=326H
0 0.5 1 1.5

Elevator No Entry EventBest Submission per Site
Toshiba_2-p-baseline_1
SJTU_1-p-baseline_1
QMUL-ACTIVA_3-p-baseline_1
NHKSTRL_4-p-NHK-SYS1_3
MCG-ICT-CAS_2-p-Run2_1
Intuvision_2-p-zipsub_1
IFP-UIUC-NEC_3-p-2_1
DCU_1-p-DCUSystem_1
CMU_11-p-VCUBE_1
BUT_2-p-butsys_1
AIT_1-p-baseline_1
Min NDCR Act. NDCR
• No human perf. avail.
• No random system
• Rtarg=0.11,
• MeanDur=11.5s
• TestDur=642H
0 0.2 0.4 0.6 0.8 1 1.2 1.4
Toshiba_2-p-baseline_1

Object Put EventBest Submission per Site
0 0.5 1 1.5
UCF_1-p-UCF08_1
UAM_1-p-baseline_1
IFP-UIUC-NEC_3-p-1_3
CMU_11-p-VCUBE_1
BUT_2-p-butsys_1
Min NDCR Act. NDCR
• Random system
• Rtarg=38.5,
• MeanDur=1.08s
• TestDur=1H

Embrace EventBest Submission per Site
0 0.5 1 1.5
MCG-ICT-CAS_2-p-baseline_1
IFP-UIUC-NEC_3-p-1_3
DCU_1-p-DCUSystem_1
CMU_11-p-VCUBE_1
Min NDCR Act. NDCR
• Random system
• Rtarg=8.09,
• MeanDur=5.2s
• TestDur=9H

CellToEar EventBest Submission per Site
0 0.5 1 1.5
THU-MNL_2-c-contrast_2
IFP-UIUC-NEC_3-p-2_1
CMU_11-p-VCUBE_1
Min NDCR Act. NDCR
• Random system
• Rtarg=7.15,
• MeanDur=27s
• TestDur=5H

Pointing EventBest Submission per Site
0 0.5 1 1.5
SJTU_1-p-baseline_1
IFP-UIUC-NEC_3-p-1_3
CMU_11-p-VCUBE_1
Min NDCR Act. NDCR
• Random system
• Rtarg=45.47,
• MeanDur=1.43s
• TestDur=2H

TakePicture EventBest Submission per Site
0 0.5 1 1.5
UCF_1-p-UCF08_1
Intuvision_2-p-zipsub_1
IFP-UIUC-NEC_3-p-1_3
FD_1-p-base_1
CMU_11-p-VCUBE_1
Min NDCR Act. NDCR
• Random system
• Rtarg=.44,
• MeanDur=9.34s
• TestDur=170H

Best Run: All Events
9
8
7
52
4
3
1
68
Ordinal Position
of Selected
Events from the
Technology
Readiness
Discussion

Adjudication Summary
• Dual annotation studies indicated a low recall rate for
humans
– NIST and LDC designed an system-mediated adjudication
framework focused on improving recall
• Adjudication process for streaming detection
– Merge system false alarms to develop a prioritized list of
excerpts to review:
• Take into account existing annotations
• Take into account temporally overlapping annotations
– Review top 100 false alarm excerpts sorted by
• Inter-system agreement
• Average decisions score

Effect of Adjudication
60
70
Nu
mb
er
of
Ev
en
t R
un
s
MinNDCRPostAdjud-MinNDCRPreAdjud
PersonRuns
Pointing
TakePicture
On Annotations On System Scores
0
10
20
30
40
50
60
-0.2 -0.1 0 0.1
Nu
mb
er
of
Ev
en
t R
un
s
0 20 40 60 80
CellToEar
ElevatorNoEntry
Embrace
ObjectPut
OpposingFlow
PeopleMeet
PeopleSplitUp
PersonRuns
Number of New Event
Observations
After Reviewing 100 ExcerptsWorse
ScoresBetter
Scores

Conclusions
• Detecting events in high volumes of found
data is feasible
– 16 sites completed the evaluation
– Human annotation performance indicates the task – Human annotation performance indicates the task
has a high degree of difficulty
– 50 Hr. test set insufficient for low frequency
events, but 12 Hrs. is sufficient for most events