event coincidence analysis for quantifying simultaneities ... post on site talk... · event...
TRANSCRIPT
Event coincidence analysis for quantifying simultaneities in sequences of extremes among variables and regions
Reik V. Donner, Jonatan F. Siegmund, Jonathan F. Donges, Jonathan Bauermann, Marc Wiedermann, Carl-Friedrich Schleussner
NCAR TOY Workshop - Boulder, 27 April 2016

2 Reik V. Donner, [email protected]
http://pnld2016.physik.hu-berlin.de - with mini-symposium on extreme events

3 Reik V. Donner, [email protected]
4 Reik V. Donner, [email protected]
Motivation Climate extremes - Heat waves, cold spells - Heavy rainfall, floods - Droughts (hydrological, agricultural) - Thunderstorms, hail - Cyclones, tornadoes - …
Terrestrial biosphere impacts - Death of plants and animals - Forest fires - Decreasing yields - Shift/shortfall of phenological
stages - Growth anomalies of plants - Secondary impacts via food chain - …
Possibly nonlinear and nonstationary relationship between climate drivers and ecosystem responses So far mostly studied by linear methods (correlation, linear regression models) Few results on properties of extreme responses to climate extremes (existence, conditions, strength of interrelationships, etc.)
5 Reik V. Donner, [email protected]
Problem formulation How to quantify the impact of climate extremes in terms of extreme ecosystem responses? (existence, time-scales/delay, strength, significance)
Problem 1: available ecosystem data often sparse, short and/or low resolution • Tree-ring widths: several centuries, 1 value/year, sparse • Timing of phenological stages: several decades, 1 value/year, sparse • Remote sensing (NDVI, faPAR, etc.): few decades, weekly to biweekly, full coverage • Dendrometer recordings (tree growth): few years, daily to sub-hourly, sparse • Eddy covariance measurements (flux towers): few years, sub-hourly, sparse • … and various other types of similar data
⇒ Definition of extremes in such cases? Here: commonly adopt POT idea of threshold exceedances based on empirical quantiles of annual values or seasonal anomalies Short series: moderate quantiles (e.g. 10/90%): extraordinary instead of true extreme events

6 Reik V. Donner, [email protected]
Conceptual relevance Classical statistical approaches: mainly focused on distributions of (extreme) events in individual recordings (GEV, GP) Fewer approaches to characterizing multivariate extremes (copulas) Study of paired event sequences is often relevant across scientific disciplines Beyond the motivation of the present work, quantifying simultaneities between sequences of events has further important applications: • uncovering (spatio-) temporal organization of events (neuronal activity, hydro-
meteorological extremes, etc.) • establishing possible cause-effect relationships (weak notion of causality in some
non-predictive sense) – relevance for impact studies (relation to extreme events), but not for single event attribution
7 Reik V. Donner, [email protected]
Extreme value theory: Tail dependence Bivariate/multivariate extreme value theory (especially copula approaches): tail dependence coefficients Problems in present context: • Sparse data – PDF hard to be properly estimated • Data may already be of event type (e.g., forest fires) without underlying
continuous distribution • Tail dependence coefficient not flexible regarding
• Timing of response (delay, possibly even distributed) • Common restriction to equal percentiles of variables of interest • Statistical significance testing
⇒ Consider alternative approaches?!
8 Reik V. Donner, [email protected]
Dynamical systems: Event synchronization Common approach from neurosciences (spike train analysis from EEG recordings, Quian Quiroga et al., PRE, 2002) - normalized fraction of temporally close extremes observed at different spatial locations (EEG electrodes, climate data grid point)
Various (even more concepts) further extending this approach (e.g., spike train synchrony), commonly tailored to specific features of neuronal spike trains
9 Reik V. Donner, [email protected]
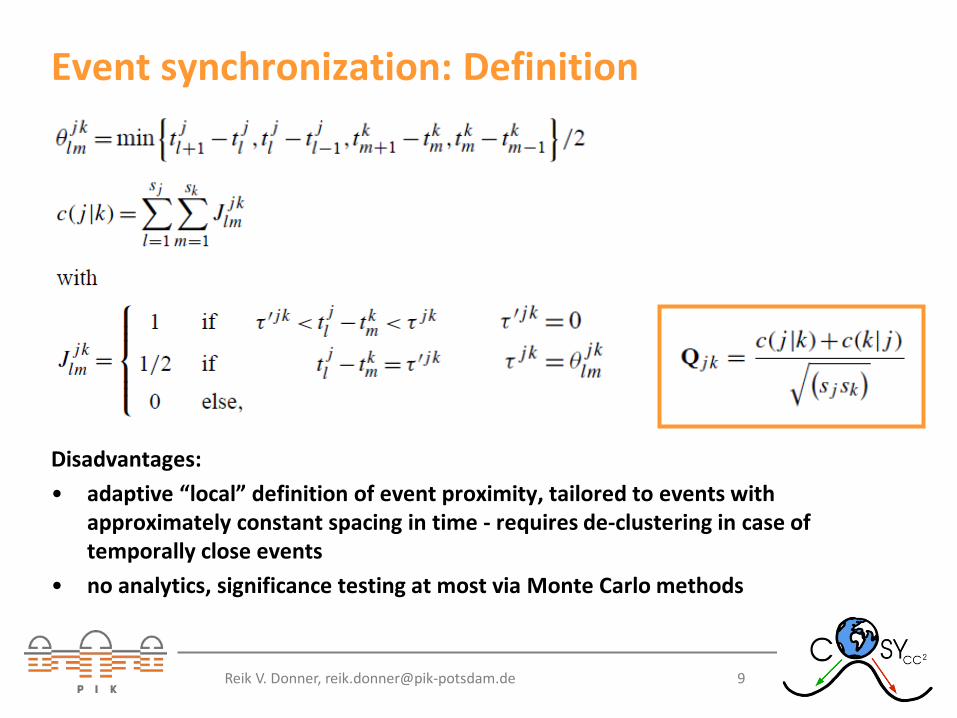
Event synchronization: Definition
Disadvantages: • adaptive “local” definition of event proximity, tailored to events with
approximately constant spacing in time - requires de-clustering in case of temporally close events
• no analytics, significance testing at most via Monte Carlo methods
10 Reik V. Donner, [email protected]
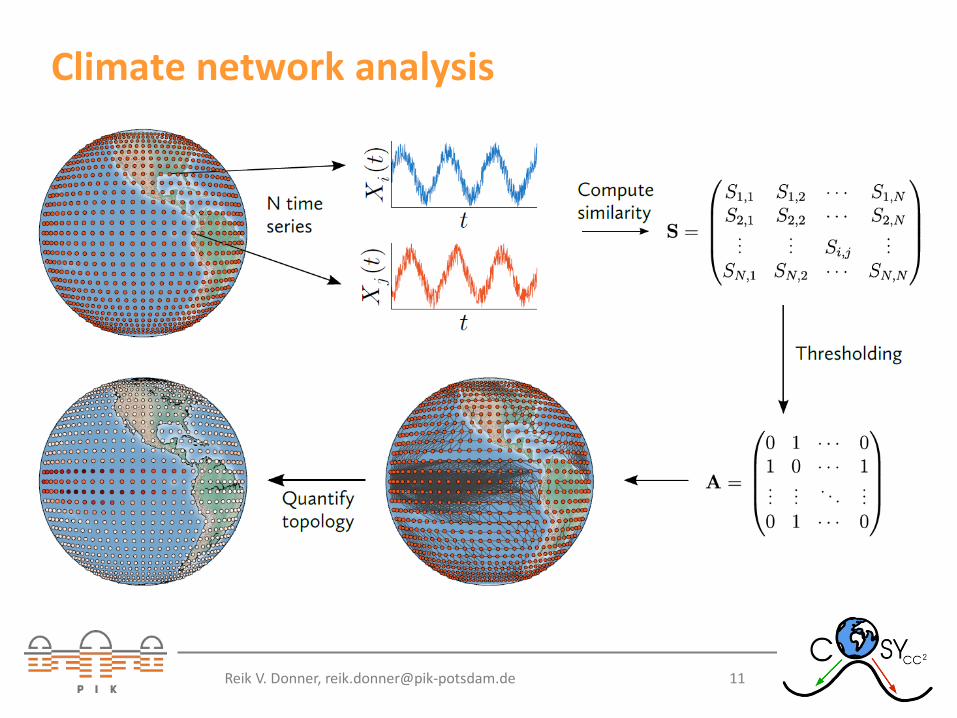
Climate network analysis Talk Imme Ebert-Uphoff: causal graphs representing strongest driver-response relationships between climate variability in different regions (causal climate networks) Simplification: study networks mapping general strong/significant statistical associations between climate time series from different parts of the world • Take grid points of climate data set as nodes of a network embedded on the
Earth’s surface • Compute pairwise statistical similarity (according to appropriate measure)
between climate variability at all grid points • Link those pairs of nodes with the strongest / most significant similarity • Employ complex network techniques to characterize the resulting graph structure ⇒ Climate network analysis

12 Reik V. Donner, [email protected]
Climate network analysis Commonly based on statistical dependence measures that take full distribution of variables of interest into account
• Correlation coefficients: climate networks as nonlinear (thresholded) generalization of EOF analysis (number of connections often related to dominating EOF patterns: Donges et al., Clim. Dyn., 2015; Wiedermann et al., Int. J. Climatol., in review)
• Mutual information, order pattern-based statistics, etc. as alternative options
Climate networks based on event synchronization: spatio-temporal organization of climate extremes, successful applications to:
• Heavy precipitation in Indian monsoon domain (Malik et al., NPG 2010, Clim. Dyn. 2012; Stolbova et al., NPG 2014, GRL 2016)
• Precipitation and evapotranspiration extremes in South America (Boers et al., GRL, 2013, 2014, Nature Comm. 2014, Clim. Dyn. 2015, J. Clim. 2014, 2015)

13
Event coincidence analysis Problem: neither tail dependence coefficients nor event synchronization appear
directly applicable to our problem - combine ideas from both approaches Original formulation: Donges et al., PNAS, 2011 – byproduct of study to quantify
simultaneity between species appearance/disappearance in fossil record and large-scale reorganization of past atmospheric circulation
Reik V. Donner, [email protected]
14
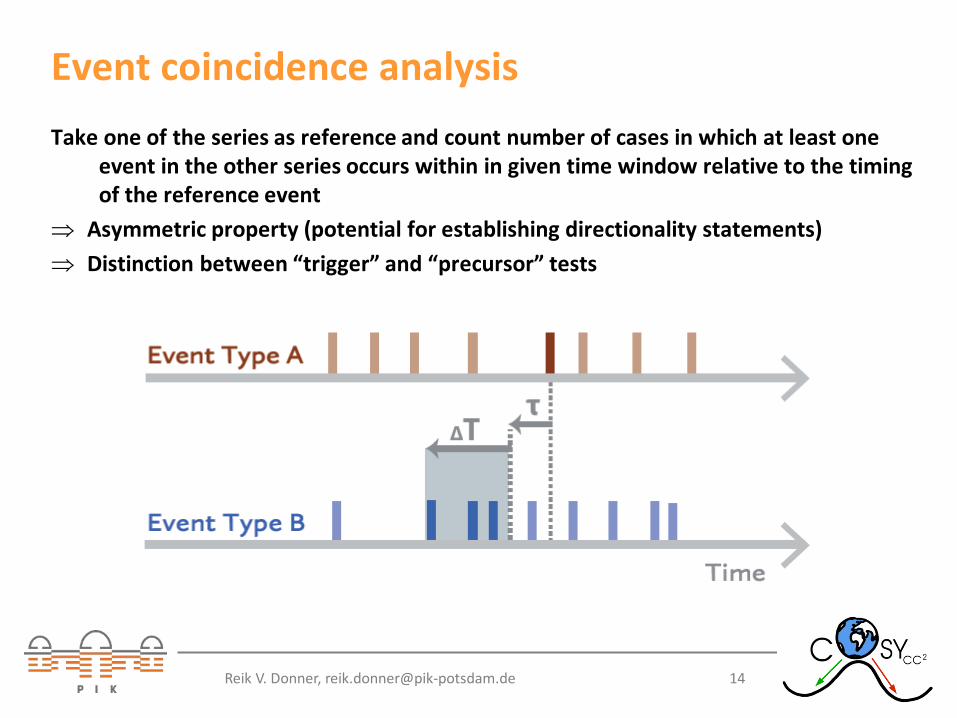
Event coincidence analysis Take one of the series as reference and count number of cases in which at least one
event in the other series occurs within in given time window relative to the timing of the reference event
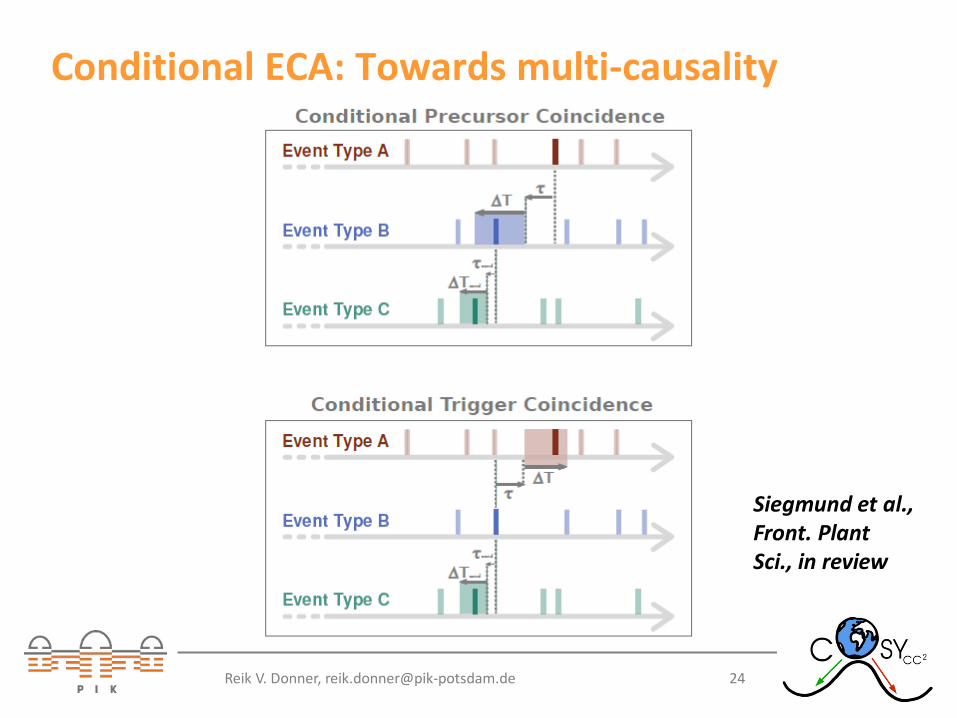
⇒ Asymmetric property (potential for establishing directionality statements) ⇒ Distinction between “trigger” and “precursor” tests
Reik V. Donner, [email protected]
15
Event coincidence analysis
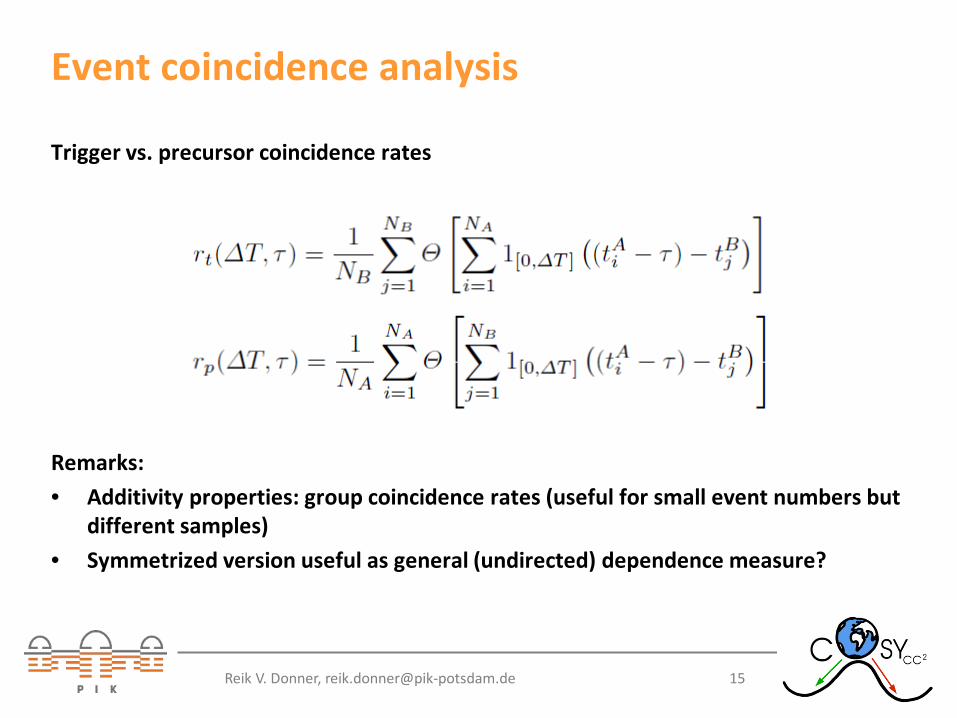
Trigger vs. precursor coincidence rates Remarks: • Additivity properties: group coincidence rates (useful for small event numbers but
different samples) • Symmetrized version useful as general (undirected) dependence measure?
Reik V. Donner, [email protected]
16
Event coincidence analysis
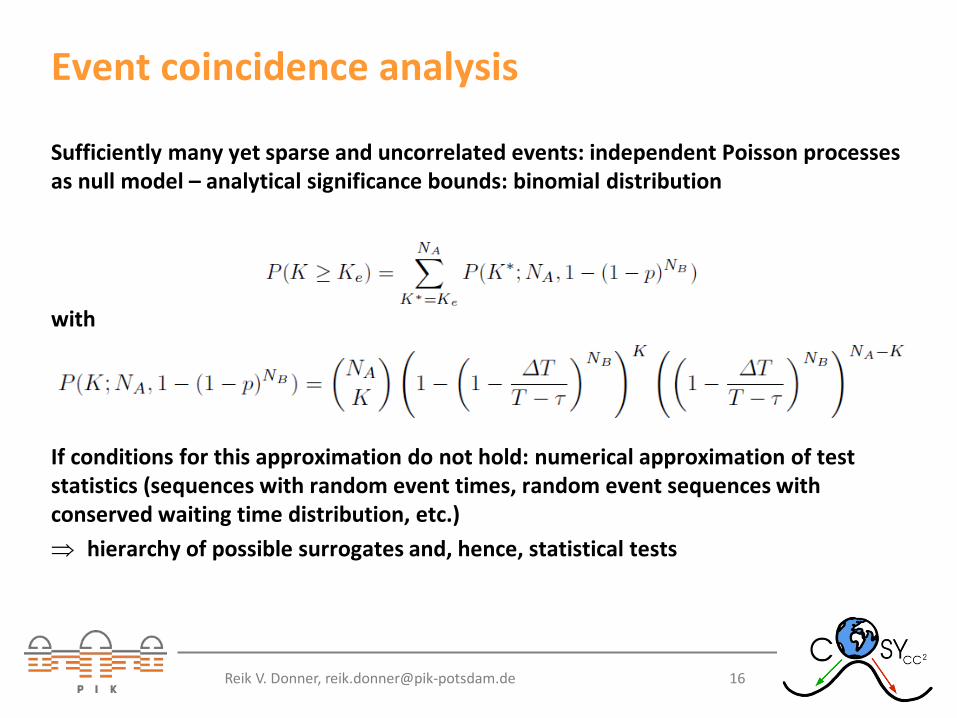
Sufficiently many yet sparse and uncorrelated events: independent Poisson processes as null model – analytical significance bounds: binomial distribution with If conditions for this approximation do not hold: numerical approximation of test statistics (sequences with random event times, random event sequences with conserved waiting time distribution, etc.) ⇒ hierarchy of possible surrogates and, hence, statistical tests
Reik V. Donner, [email protected]
17
Event coincidence analysis
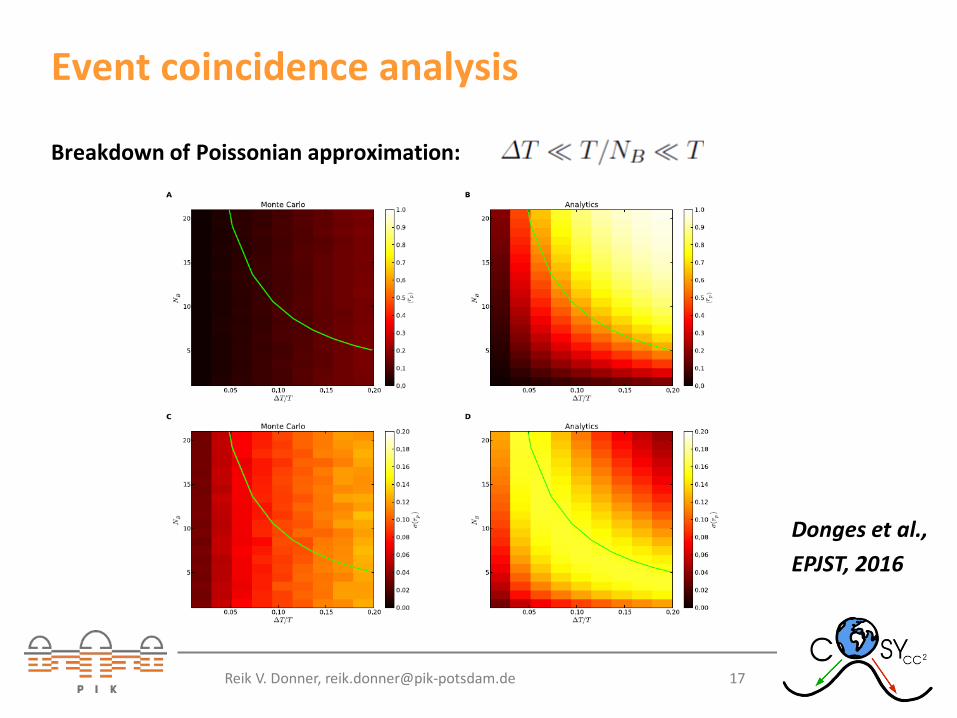
Breakdown of Poissonian approximation:
Donges et al., EPJST, 2016
Reik V. Donner, [email protected]

18
Various recent applications
• Coincidence between large-scale dynamical reorganization of African climate and hominin evolution over the last 5 Myr (Donges et al., PNAS, 2011)
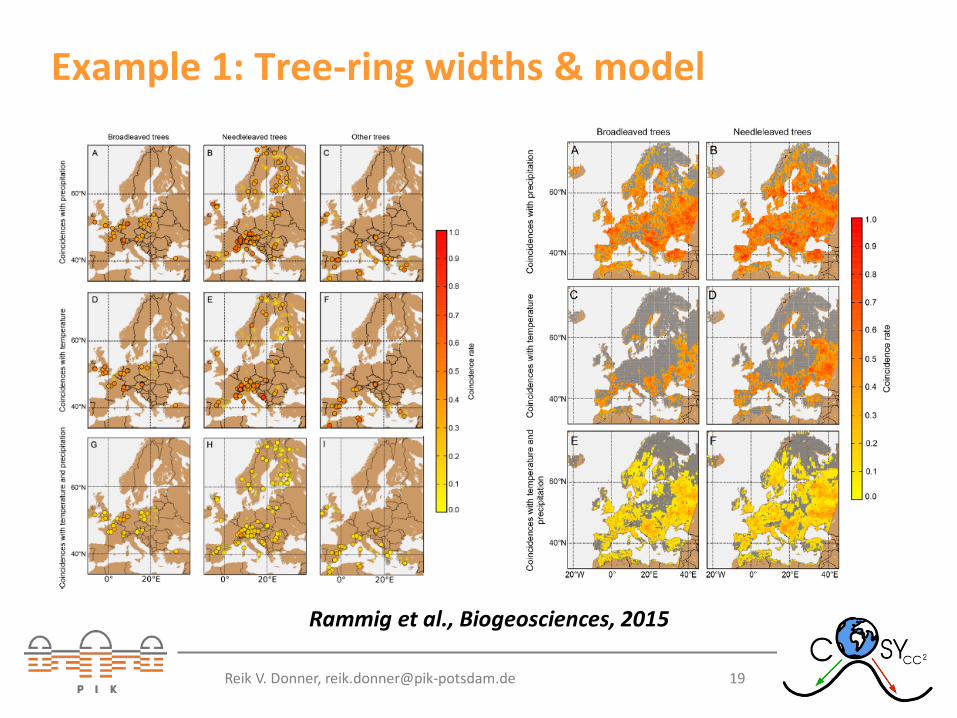
• Anomalous historical tree growth in Europe during years with very (un)favourable climate conditions (Rammig et al., Biogeosciences, 2015)
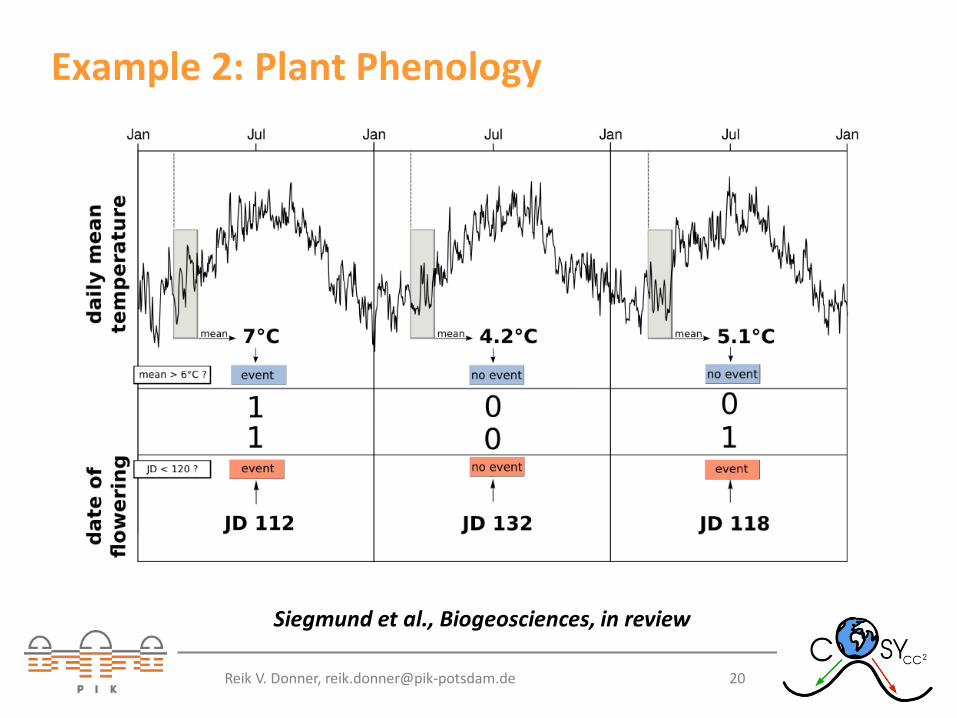
• Impact of seasonal temperature extremes during specific times of the year on subsequent flowering dates of German shrubs (Siegmund et al., Biogeosciences Discussions, 2015)
• Interdependence between meteorological extremes and extreme daily tree growth based on dendrometer data (Siegmund et al., Frontiers in Plant Science, in review)
• Impact of flood events on the timing of epidemic outbreaks (Donges et al., EPJST, 2016)
• Impact of high economic impact natural hazards on the outbreak of violent conflicts (Schleussner et al., PNAS, in review)
Reik V. Donner, [email protected]
19
Example 1: Tree-ring widths & model
Rammig et al., Biogeosciences, 2015
Reik V. Donner, [email protected]
20
Example 2: Plant Phenology
Siegmund et al., Biogeosciences, in review
Reik V. Donner, [email protected]

21
Example 2: Plant Phenology
Siegmund et al., Biogeosciences, in review
Reik V. Donner, [email protected]
22
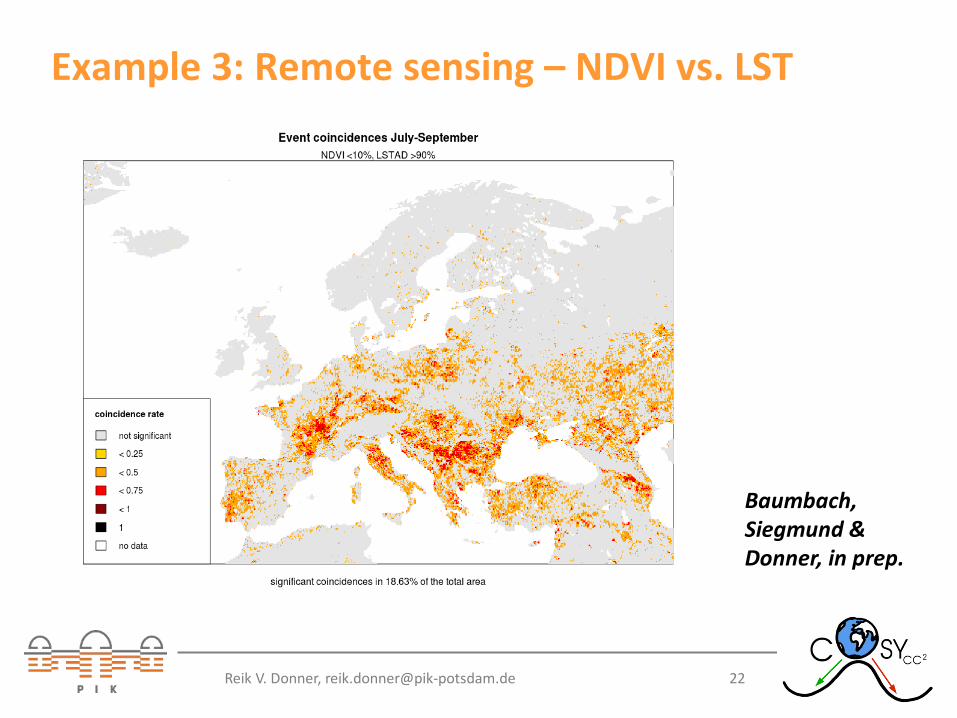
Example 3: Remote sensing – NDVI vs. LST
Baumbach, Siegmund & Donner, in prep.
Reik V. Donner, [email protected]

23
Example 4: Dendrometer
Siegmund et al., Front. Plant Sci., in review
Reik V. Donner, [email protected]
24
Conditional ECA: Towards multi-causality
Siegmund et al., Front. Plant Sci., in review
Reik V. Donner, [email protected]
25
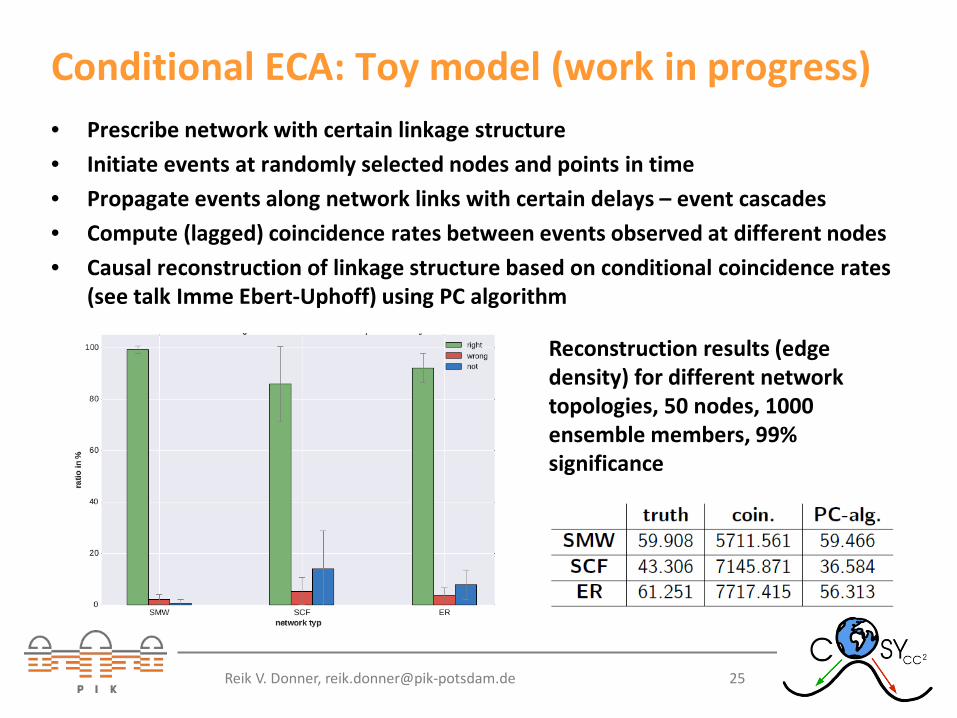
Conditional ECA: Toy model (work in progress) • Prescribe network with certain linkage structure • Initiate events at randomly selected nodes and points in time • Propagate events along network links with certain delays – event cascades • Compute (lagged) coincidence rates between events observed at different nodes • Causal reconstruction of linkage structure based on conditional coincidence rates
(see talk Imme Ebert-Uphoff) using PC algorithm
Reconstruction results (edge density) for different network topologies, 50 nodes, 1000 ensemble members, 99% significance
Reik V. Donner, [email protected]
26 Reik V. Donner, [email protected]
Conclusions
• Classical statistical methods are insufficient to quantify interdependencies between event sequences in a general context
• Event coincidence analysis as promising new statistical tool: analytical theory, hierarchy of null models, multivariate extensions (conditional and joint ECA)
• R package CoinCalc (currently available at Github, CRAN under review)
• Various successful applications to different types of data sets
27 Reik V. Donner, [email protected]
References J.F. Donges, C.-F. Schleussner, J.F. Siegmund, R.V. Donner: Coincidence analysis for quantifying statistical interrelationships between event time series - On the role of extreme flood events as possible drivers of epidemics. European Physical Journal ST, 225, 469-485 (2016)
J.F. Siegmund, M. Wiedermann, J.F. Donges, R.V. Donner: Impact of climate extremes on wildlife plant flowering over Germany. Biogeosciences Discussions, 12, 18389-18423 (2015)
A. Rammig, M. Wiedermann, J.F. Donges, F. Babst, W. von Bloh, D. Frank, K. Thonicke, M.D. Mahecha: Tree-ring responses to extreme climate events as benchmarks for terrestrial dynamic vegetation models. Biogeosciences 12, 373-385 (2015)
J.F. Donges, R.V. Donner, M.H. Trauth, N. Marwan, H.J. Schellnhuber, J. Kurths: Nonlinear detection of paleoclimate-variability transitions possibly related to human evolution. Proceedings of the National Academy of Sciences of the U.S.A., 108(51), 20422-20427 (2011)