even minimal polishing of an indian parboiled brown rice...
TRANSCRIPT

Asia Pac J Clin Nutr 2017;26(5):829-836 829
Original Article Even minimal polishing of an Indian parboiled brown rice variety leads to increased glycemic responses Shanmugam Shobana MSc, PhD1, Nagarajan Lakshmipriya MSc1, Mookambika Ramya Bai MSc, MPhil1, Rajagopal Gayathri MSc1, Vaidya Ruchi MSc, PhD1, Vasudevan Sudha MSc1, Nagappa G Malleshi MSc, PhD1, Kamala Krishnaswamy MBBS, MD1, CJK Henry MSc, PhD2, Ranjit Mohan Anjana MBBS, MD, PhD1, Ranjit Unnikrishnan MBBS, MD1, Viswanathan Mohan MBBS, MD, PhD1 1Madras Diabetes Research Foundation, Dr. Mohan’s Diabetes Specialties Centre, WHO Collaborating Centre for Non-Communicable diseases, Gopalapuram, Chennai, India 2Clinical Nutritional Sciences, Singapore Institute for Clinical Sciences, Brenner Centre for Molecular Medicine, Medical Drive, Singapore
Background and Objectives: To evaluate the effect of polishing on the glycemic properties of Indian parboiled brown rice. Methods and Study Design: We evaluated the effect of different degrees of polishing on the glyce-mic and insulinemic responses of Bapatla (BPT-5204), Indian parboiled Indica rice variety. Brown rice (BR), un-der milled rice (UMR) and white rice (WR) with 2.3% and 9.7% degree of polishing (DOP), respectively, were prepared and evaluated for the glycemic properties. Incremental Area Under the Curves (IAUC) were estimated for both glycemic index (GI) in 12 healthy participants (6 men, 6 women) and 24 hr glycemic response studies in 13 overweight participants (5 men, 8 women) using continuous glucose monitoring (CGM) system with ≈2000kcal/day rice diets. Differences in pre and post meal insulin (∆) were assessed. Results: The GI of WR (GI=79.6) and UMR (GI=73) were significantly higher than BR (GI=57.6) (p<0.01). Similar results were ob-tained for 24 hr glycemic responses [IAUC: WR=58.4, UMR=55.5, BR=34.7 mg*5 min/dL, respectively]. The ∆ Insulin responses were lower with BR meals compared with UMR and WR (p=0.025; p=0.003). Conclusions: Both UMR and WR had a high GI while BR had a medium GI. This could have influenced the 24 h glycaemic and insulinemic responses of BR which had the lowest responses as compared with UMR and WR, and the latter two had similar higher responses. Thus any degree of polishing leads to higher glycaemic responses.
Key Words: brown rice, under milled rice, white rice, glycemic response, India INTRODUCTION Rice is the main cereal staple in many parts of the world, including India. Modern methods of paddy processing involve dehusking to produce brown rice (BR), and pol-ishing to obtain white rice (WR); the latter process re-moves most of the bran, aluerone layer and germ, de-creases the fibre and micronutrient content and increases available carbohydrates.
Commonly consumed Indian white rice varieties have a high glycemic index (GI) (>70).1 Refined grain consump-tion and subsequent higher dietary glycemic load (GL) have been associated with chronic diseases such as meta-bolic syndrome (MS), type 2 diabetes and cardiovascular disease (CVD).2-5 Intake of whole grains such as BR has been shown to lower the risk of diabetes and heart dis-ease.6-8 However, the GI of Indian BR varieties are un-known, with no data as to how the GI varies with differ-ent degrees of polishing within the same rice variety. This study therefore examines the GI of parboiled BR (0% polish), under milled rice (UMR, 2.3% polish) and WR (9.7% polish) prepared from the popular Indian rice varie-ty “Bapatla” (BPT-5204). This study also examines the
whole day glycemic and insulinemic responses to isoca-loric rice diets of different degrees of polish. METHODS Paddy parboiling and milling The BPT - 5204 paddy was procured from the National Seeds Corporation, Chennai, India and cleaned using a paddy pre cleaner. The cleaned paddy was parboiled by soaking in cold water for 7 h and steaming for 10 min. It was then dried to a moisture content of 12% and de-husked to prepare brown rice.9 By standardized milling operations, a portion of BR was milled in Buhler emery
Corresponding Author: Dr Shanmugam Shobana, Foods Nu-trition and Dietetics Research Madras Diabetes Research Foun-dation, 4 Conran Smith Road, Gopalapuram, Chennai, 600 086, India. Tel: (9144) 2835 9048; Fax: (9144) 2835 0935 Email: [email protected]; [email protected] Manuscript received 01 April 2016. Initial review completed 04 May 2016. Revision accepted 07 June 2016. doi: 10.6133/apjcn.112016.08
830 S Shobana, N Lakshmipriya, M Ramya Bai, R Gayathri, V Ruchi, V Sudha et al
polishers, to a degree of 2.3%, and 9.7% based on the amount of bran or polishing removed. Participants A total of fifteen participants without diabetes aged be-tween 20 and 45 years were recruited for GI study. Addi-tionally, 15 overweight participants with BMI >22.9 kg/m2 (Asia-Pacific guidelines)10 were recruited for con-tinuous glucose monitoring (CGM) study from the volun-teer registry of the Glycemic Index Testing Centre of the Madras Diabetes Research Foundation, Chennai, India. As per the validated protocol,11 individuals on any special diet for a therapeutic or other purpose, suffering from any illness, those with a history of food allergy or on any medication and participants with fasting blood glucose value >5.6 mmol/L (>100 mg/dL) were excluded. The study was conducted according to the guidelines laid down by the Declaration of Helsinki, and was approved by the Institutional Ethics Committee. All participants gave written informed consent before participation in the studies.
Experimental protocol GI The protocol used to measure GI was adapted from the method described12,13 and is in line with the procedure recommended by the FAO/WHO.14 The procedure has been standardized with an International laboratory and has been published elsewhere.11 CGM The iPro™2 CGM (iPro™2 Professional CGM- Medtron-ic Mini Med, Northridge, USA) sensor was inserted sub-cutaneously on the lateral abdominal wall and was used to obtain continuous interstitial glucose readings.14 The iPro 2™ was worn unobtrusively for 6 days after which the participants returned the recorder for upload of data to a web-based software, which provided a summary of glu-cose responses. The 3 non-consecutive days on which the participants consumed their randomized isocaloric test diets were considered for analysis, leaving out the CGM readings of washout days. The sensor was calibrated us-ing finger prick capillary blood glucose measurements taken at fasting, pre and post meals (breakfast, lunch and dinner) during the study period by using a Hemocue 201+ glucose analyzer (Hemocue Ltd, Angelholm, Sweden).
During the washout period of both GI and CGM, par-ticipants were requested not to smoke, consume alcohol or undertake any vigorous physical activity and to con-sume their usual meal of similar size and composition, which was verified by a 24-hr dietary recall and a brief questionnaire on behavioral status.
Biochemical measurements GI study After an overnight fast of 8-12 h, finger-prick capillary blood samples were obtained from all participants. The reference/test foods were consumed immediately after this. First bite in the mouth was set as time 0 and blood samples were taken exactly after 15 min, followed by 30, 45, 60, 90 and 120 min. An automatic lancet device (Ac-cu-Chek Sensor, Roche Diagnostics GmbH, Mannheim,
Germany) and the Hemocue Glucose 201 analyzer, which was calibrated daily using the control solution, was used to determine capillary blood glucose values.
CGM study The iPro™2 CGM system was used to record the intersti-tial blood glucose values over a period of 24 h and pro-vided 288 readings per test day on an average. Venous blood samples were drawn and analyzed for plasma glu-cose (Hitachi 912 auto analyzer; Mannheim, Germany) and serum insulin concentrations (enzyme-linked immu-noassay; Dako, Glostrup, Denmark) before and after each meal (6 times a day) on all test days.
Anthropometric measurements Anthropometric measurements such as height, weight and waist circumference were taken in the fasting state using standardized techniques.16
Nutrient analysis The available carbohydrate content of the rice samples (uncooked) was determined by the enzymatic kit method (Megazyme Limited, Ireland). For GI analysis, the por-tion size (containing 50 g available carbohydrate) of the test foods (cooked rice) was calculated based on the available carbohydrate content of food namely BR=67 g; UMR=71 g and WR=76 g. The isocaloric meal menu for CGM is shown in Table 1. The nutrient compositions of the meals for CGM are shown in Table 2. The carbohy-drate, protein and fat percent were in the range of 68-71%; 12-13% and 16-19%, respectively for the test diets, as calculated based on the in-house EpiNu database
Test and reference food Brown rice (BR), minimally polished/under milled rice (UMR) with 2.3% degree of polish (≈hand pounded rice) and fully polished white rice (WR) with 9.7% degree of polish were taken up for the GI and 24-hr glycemic and insulinemic response studies.
GI Study Fifty-five grams of dextrose (glucose monohydrate) dis-solved in 200 mL water was used as the reference food (Glucon-D glucose powder, Heinz India (P) Ltd., Mum-bai, India). The test foods (BR, UMR and WR) were con-sumed in random order (with the help of computer gener-ated randomized tables) in between the reference food sessions, with at least 2 days gap between measurements to minimize carry-over effects.12,13 All the test foods were standardized and prepared at the MDRF test kitchen. The common household method of pressure-cooking was used. Rice to water ratio of 1:2 was common for all 3 test foods based on the sensory attributes of the cooked rice. How-ever, the cooking times for the rice samples were differ-ent with WR having the least cooking time (8 mins) fol-lowed by UMR (10 mins) and BR (18 mins).
CGM The study design followed in CGM was a randomized crossover design. Isocaloric (≈2000 kcal/day) WR, UMR and BR based diets were given for 3 non-consecutive days using computer-generated randomized tables. The
Glycemic index of parboiled Indian rice 831
diets consisted of typical Indian food choices with suita-
ble accompaniments. Except for the type of rice, the menu (breakfast, lunch and dinner) was identical (Table 1). The test diets were standardized, prepared and served in the test kitchen at MDRF.
Calculation of the glycemic index and 24-hr glycemic response The Incremental Area Under the blood glucose response Curves (IAUC) for the test foods and the reference food (glucose) for GI were obtained through the in-house GI software developed based on the guidelines laid by FAO/WHO14. Similarly, change in glucose concentrations in CGM was also calculated geometrically using the trap-ezoid rule, ignoring the area beneath the baseline (fasting).
For each subject, a GI value for each test food was calcu-lated by expressing each subject’s IAUC for the test food as a percentage of the same subject’s mean reference food (glucose) IAUC. The group mean value was declared as the GI of the test food.
Scanning Electron Microscopic (SEM) studies of rice with different degree of milling The intactness of the bran and other anatomical parts of the rice samples were viewed using scanning electron microscope (Carl Zeiss MA 15/ EVO 18).17 The selective portions of the bran, aleurone layer, cell walls and the endosperm with the special reference to the granular or-ganization of the starch, and the topography of the rice kernels were photographed at different magnifications.
Table 1. Iso-caloric (~2000 kcals/day) diet plan for CGM 24-hr glycemic response study Meal (Time) Menu Serving quantity Breakfast (7:30 AM) Coffee with milk & sugar
Idly [fermented and steamed rice and dehusked black gram cake]# (medium) Coconut ‘chutney’(Coconut ground to paste with green chillies) Onion Sambar
150 mL 220 g 60 g 150 g
Mid-morning (10:30 AM) Lime Juice ‘Sauted’ white dried peas
250 mL 100 g
Lunch (12:00 NOON) Vegetable ‘Pulao’# (stir fried rice with Indian spices and vegetables) Onion ‘raita’ (yogurt dip with onion)
275 g 150 g
Evening (3:30 PM) Coffee with milk & sugar ‘Sauted’ white dried peas
150 mL 100 g
Dinner (6:00 PM) ‘Dosa’[Indian crepe made from rice and dehusked black gram] $(medium) Onion ‘Chutney’$ (onion ground to paste with Indian spices) ‘Sambar’ (Lentil sauce with spices)
168†, /160‡/120††g 60†/48‡/72††g 150 g
Bed time (9:00 PM) Apple (medium) 135 g †Idly, vegetable pulao and Dosa were made from respective rice. $Weight of dosa and onion chutney varied to meet the iso-caloric diet plan. †Brown rice diet ‡Under Milled Rice diet ††Fully Polished Rice diet. Table 2. Clinical characteristics of GI and CGM study participants and nutrient profile of rice samples a. Demographic and clinical characteristics of GI and CGM study participants
Characteristics GI (n=12) Mean±SE
CGMS (n=13) Mean±SE
Age (yrs) 25.8±1.2 32±2.0 Women, n (%) 6.0 (50.0) 8.0 (61.5) Body mass index (kg/m2)†
Normal weight Overweight
19.6±0.4 (n=6) 24.5±0.6 (n=6)
-
27±0.7 Waist circumference (cm)
Normal weight Overweight
72.5±2.2 81.2±2.9
-
93.5±2.0 Central obesity (≥80 cm for female and ≥90 cm for male), n (%) 2.0 (16.7) 13.0 (100) b. Nutrition profile of rice samples
Parameter BR Mean±SEM
UMR Mean±SEM
WR Mean±SEM p for trend
Moisture (g %) 12.4 ±0.1 12.2±0.1 12.0±0.3 <0.001 Protein (g %) 9.0±0.1 7.9±0.1 6.7±0.1 <0.001 Fat (g %) 2.3±0.2 1.7±0.2 0.5±0.03 <0.001 Ash (g %) 1.4±0.1 1.1±0.1 0.7±0.03 <0.001 Available carbohydrates (g %) 67.0±0.3 70.6±0.3 76.1±0.5 <0.001 Dietary fibre (g %) 5.3±0.1 3.4 ±0.2 1.3±0.2 <0.001 GI:Glycemic Index; CGM:Continuos Glucose monitoring; BR: brown rice; UMR: under milled rice; WR: white rice. †Body mass index (kg/m2): normal: 18.5-22.9; overweight: 23-24.9; obese: ≥25.

832 S Shobana, N Lakshmipriya, M Ramya Bai, R Gayathri, V Ruchi, V Sudha et al
Statistical analysis Statistical analysis was performed with SAS software (version 9.0; SAS Institute, Inc., Cary, NC). Out of 15 participants in the GI study, one dropped out due to ill-ness (fever) and two were excluded as outliers owing to large intra-individual variability (CV >30%). Thus, data of twelve participants (six men and six women) were in-cluded in the final analysis. Data are shown as means with their standard errors. Shapiro–Wilkes test revealed normal distribution of the data. The significance of differ-ence in GI, Δ Insulin response and 24-hr glycemic re-sponses of test foods and meals was tested both by Freidman (BR vs UMR vs WR) and paired t (BR vs UMR; BR vs WR and UMR vs WR) tests. Intra-individual varia-tion of the three reference (glucose) tests was assessed by determining CV%. Participants with more than 30% of CV for reference glucose were considered as outliers. Using linear regression, the effects of age, sex, BMI and waist circumference on the GI and IAUC were analyzed for the test foods. Statistical significance was set at p<0.05.
Of the 15 overweight volunteers recruited for the CGM study, two dropped out due to personal reasons. Hence 13 participants were considered for the final analysis. We used mixed linear models using General Linear model (GLM) to estimate the difference in the 3 rice diets for the 24-hr glycemic responses (IAUC). Mean change in glu-cose concentration over 24-hr from baseline (ignoring values lower than baseline) on the test days was noted and area under the curve calculated geometrically by ap-plying the trapezoid rule. However, to account for the few missing CGM readings of some participants we standard-ized the IAUC by dividing by the number of CGM meas-urements available. Δ insulin response (post – pre-meals for each test diet) was also reported (median and IQR) for the three iso caloric test rice diets. RESULTS The demographic and clinical characteristics of the GI and CGM study participants are presented in Table 2a. The mean age and BMI of GI study participants were 26±1.2 (SE) ys, 22.1±0.8(SE) kg/m2 , respectively, com-pared with 32±2(SE) ys and 27±0.7(SE) kg/m2, respec-
tively, for the CGM study participants. The protein and fat content of the rice samples ranged from 6.7-9.0 g% and 0.5-2.3 g%, respectively (p for trend <0.001). The available carbohydrate contents of the rice samples were 67.0, 70.6 and 76.1 g% (p for trend <0.001), respectively, for BR, UMR and WR. The dietary fibre was highest in BR followed by UMR and lowest in WR (Table 2b).
Table 3 shows the nutrient composition of the isocalor-ic (≈2,000 kcal/day) test diets given during CGM study. Though the 3 rice diets were isocaloric, percent calories from fat were 16.9 for WR and 18.5% in BR (due to in-herent higher content of fat in the bran layers of BR). The percent calories from carbohydrates were 70.6%E for WR and 68.6%E for BR.
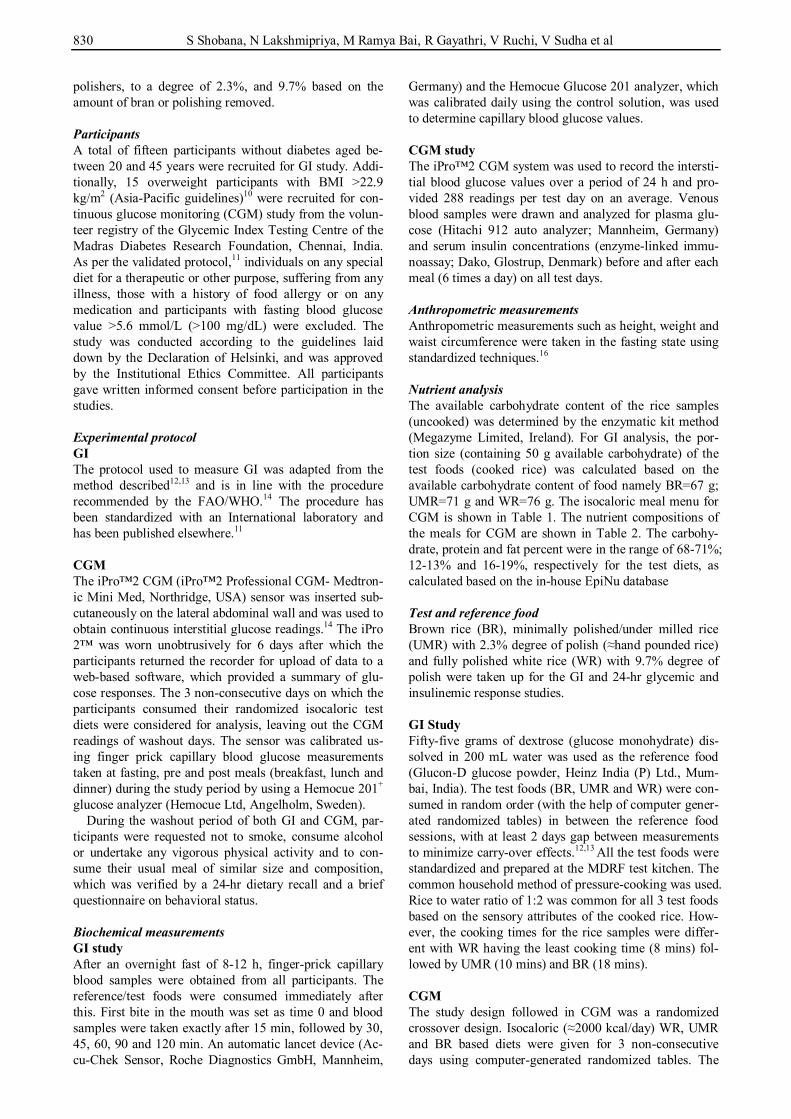
Figure 1a shows the 2 h IAUC (GI study) for BR, UMR and WR. The IAUC were 2987.5±277.3 mg/dL*min; 3901.5±313.5 mg/dL*min and 4214.8±339.3 mg/dL*min, respectively, for BR, UMR and WR. There was no signif-icant difference in the fasting blood glucose levels among the participants. However, there was a significant differ-ence in GI among BR, UMR and WR (p=0.004). The BR (GI=57.6±6.8) was in medium GI category whereas the UMR (GI=73.0±5.4) and WR (GI=79.6±6.8) were in high GI category. Age, sex, BMI and waist circumference of the participants did not influence the GI in these trials. The GI of UMR and WR were not significantly different. The CGM study also showed significantly lower 24-hr glycemic response of BR (IAUC=34.7 mg*5 min/dL) compared with UMR (55.5 mg*5 min/dL) [p<0.001] and WR (58.4 mg*5 min/dL) [p<0.001]. Similar to GI values, no significant difference was observed between UMR and WR diets in the CGM study (Figure 1b).
Figure 1c shows overall average ∆ insulin response for 3 rice varieties. The insulin response was lower after con-sumption of BR compared with WR and UMR across the 3 meals (breakfast, lunch and dinner) [BR vs UMR (39 µ IU/mL vs 49.2 µ IU/mL, p=0.025); BR vs WR (39 µ IU/mL vs 47.9 µ IU/mL, p=0.03)].
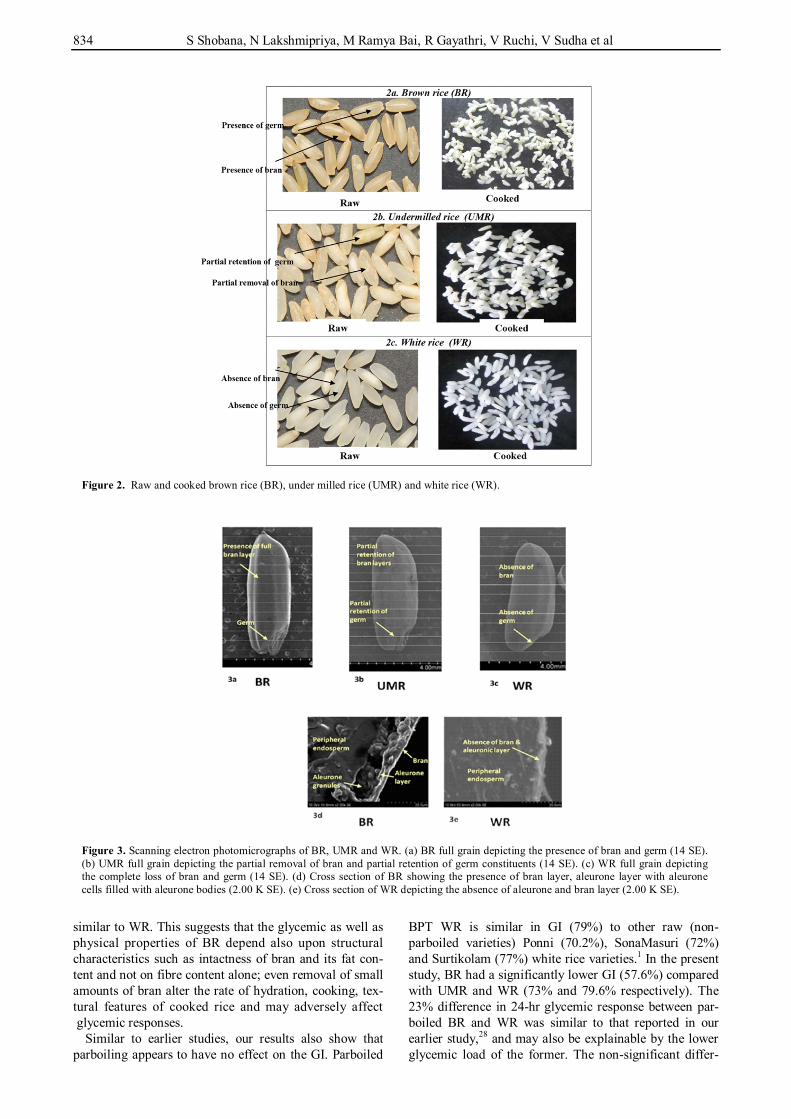
BR appeared glossy, smooth and brown with intact bran and germ (Figure 2a raw). The UMR contained less-er amounts of bran and germ constituents reflected by the less glossy and non-uniform surface with the presence of a discontinuous bran layer (Figure 2b raw). WR appeared
Table 3. Nutrient composition of Iso-caloric (≈2000 kcals/ day) test diets
Energy
kcal (%E) Protein
g/day (%E) Fat
g/day (%E) CHO
g/day (%E) Brown rice diet (BR)
Breakfast 801 (39.2) 27.6 (5.4) 14.1 (6.2) 140.4 (27.5) Lunch 672 (32.9) 22.6 (4.4) 18.1 (8.0) 104.9 (20.6) Dinner 568 (27.8) 16.9 (3.3) 9.3 (4.1) 104.8 (20.5) Total 2041 67 (13.1) 42 (18.5) 350 (68.6)
Under milled rice diet (UMR) Breakfast 773 (37.7) 26.4 (5.2) 13.7 (6.0) 136.4 (26.6) Lunch 673 (32.8) 22.3 (4.4) 17.7 (7.8) 106.5 (20.8) Dinner 603 (29.4) 17.8 (3.5) 8.2 (3.6) 114.5 (22.4) Total 2049 67 (13.1) 40 (17.6) 357 (69.7)
Fully polished white rice diet (WR) Breakfast 777 (38.4) 25.6 (5.1) 12.9 (5.7) 139.2 (27.5) Lunch 677 (33.5) 21.7 (4.3) 16.9 (7.5) 110.0 (21.7) Dinner 569 (28.1) 15.6 (3.1) 8.4 (3.7) 108.3 (21.4) Total 2023 63 (12.5) 38 (16.9) 357 (70.6)
Glycemic index of parboiled Indian rice 833
smooth and devoid of bran (absence of brown glossy ap-pearance) and germ (Figure 2c raw). Cooked BR kernels had a fissured appearance. Fissuring was absent in both UMR and WR (Figure 2a-c cooked).
Scanning micrographs were examined to explain the above GI and CGM results obtained. The scanning elec-tron photomicrographs reveal the presence of bran and germ in BR (Figure 3a) and partial removal of peripheral bran layers and germ in UMR (Figure 3b) as compared with WR (Figure 3c). Figure 3c clearly shows the com-plete loss of bran layers and germ (indicated by the pres-ence of a groove) in WR. Cross-section of BR indicates the presence of bran layers and aleurone layer with aleu-rone granules (Figure 3d), which is completely absent in WR (Figure 3e).
DISCUSSION In this study we report on the GI and 24 h glycemic and insulinemic responses of a single Indian fine grain rice variety (BPT 5204 parboiled) milled to produce different degrees of polish. This variety was chosen as it is one of the most common rice varieties consumed in southern India. Earlier studies have shown similar glycemic re-sponses to a single long grain Indica rice variety (IR 42 and BR 16).18,19 However, to our knowledge there are no data on the glycemic properties of parboiled BR and WR
of BPT 5204 and none comparing UMR with BR or WR of different rice varieties. This study is also the first to measure the glycemic property of rice milled to different degree of polish and 24-hr glycemic responses using CGM. Glycemic index and 24-hr glycemic response of BR, UMR and WR Glycemic index, a scale that ranks foods based on their ability to raise the blood glucose, is an important parame-ter to determine quality of dietary carbohydrates.
The differences in the glycemic properties of rice may be attributed to several factors such as varietal differ-ences,20 processing methods such as type of parboiling,19 milling,21 pre-germination,22 degree of gelatinization,23 physical form of food, chewing or degree of mastica-tion,24 amylose content25 and resistant starch content.26
Moreover, each variety of rice may have unique carbohy-drate profile and molecular architecture. For this reason, we studied the same variety and batch of paddy grown under identical conditions to assess the effect of milling on the glycemic index and 24 h glycemic response of rice.
The lower GI of BR could probably be due to its higher fibre content contributed by the intact bran and germ. Although UMR had considerable amounts of fibre, it had a disturbed or scratched bran layer and hence had a GI
Figure 1. Glycemic response for reference (glucose), Brown rice (BR), under milled Rice (UMR) and White (WR). (a) IAUC and GI of BR, UMR and WR. (b) IAUC of 24 h glycemic response of BR, UMR and WR. (c) change in insulin response of BR, UMR and WR.
834 S Shobana, N Lakshmipriya, M Ramya Bai, R Gayathri, V Ruchi, V Sudha et al
similar to WR. This suggests that the glycemic as well as physical properties of BR depend also upon structural characteristics such as intactness of bran and its fat con-tent and not on fibre content alone; even removal of small amounts of bran alter the rate of hydration, cooking, tex-tural features of cooked rice and may adversely affect glycemic responses.
Similar to earlier studies, our results also show that parboiling appears to have no effect on the GI. Parboiled
BPT WR is similar in GI (79%) to other raw (non-parboiled varieties) Ponni (70.2%), SonaMasuri (72%) and Surtikolam (77%) white rice varieties.1 In the present study, BR had a significantly lower GI (57.6%) compared with UMR and WR (73% and 79.6% respectively). The 23% difference in 24-hr glycemic response between par-boiled BR and WR was similar to that reported in our earlier study,28 and may also be explainable by the lower glycemic load of the former. The non-significant differ-
Figure 2. Raw and cooked brown rice (BR), under milled rice (UMR) and white rice (WR).
Figure 3. Scanning electron photomicrographs of BR, UMR and WR. (a) BR full grain depicting the presence of bran and germ (14 SE). (b) UMR full grain depicting the partial removal of bran and partial retention of germ constituents (14 SE). (c) WR full grain depicting the complete loss of bran and germ (14 SE). (d) Cross section of BR showing the presence of bran layer, aleurone layer with aleurone cells filled with aleurone bodies (2.00 K SE). (e) Cross section of WR depicting the absence of aleurone and bran layer (2.00 K SE).
Glycemic index of parboiled Indian rice 835
ence in GI between parboiled UMR and WR may be the reason for similar 24-hr glycemic response of these two milled rice varieties.
Effect of milling on the microstructure, cooking charac-teristics and GI of rice Food structure plays a vital role in determining the gly-cemic properties of food.29 BR, UMR and WR had simi-lar endosperm features except for the differences in the degree of milling. However, the distinct differences in the cooking characteristics may be attributed to the intactness and the level of the bran content and the rate of hydration and gelatinization. Bran thickness (in the case of BR) and extent of bran removal in milled rice contributes to the cooking characteristics of rice as the bran layer in BR contains fat and wax which forms a barrier for water ab-sorption during cooking. The increased cooking time could have led to rupture of intact bran and increased gelatinization, resulting in BR showing medium rather than low GI as would have been expected for a whole grain. Conversely, UMR had a high GI in spite of lesser cooking time, on account of greater gelatinization due to more than 75% of its bran content being removed.
Our study is the first to determine the GI and 24-hr gly-cemic response of BPT-5204 rice variety parboiled with different degree of polishing in India. The BR used in study was milled under a food technologist’s supervision for the preparation of UMR and WR, as authentic variety-specific BR is not presently available in the Indian mar-ket.30 The main limitation of the study is that we studied only one Indian rice variety. Different rice varieties need to be studied for their glycemic responses upon different degrees of polishing. However, it is unlikely that there would be major differences in terms of the GI of UMR and WR and hence, this study can be reasonably extrapo-lated to other rice varieties as well.
Conclusion Parboiled Bapatla (BPT) brown rice exhibited a lower glycemic response compared with under milled rice and white rice and could be a healthier alternative to polished white rice in Indian diet. White rice and under milled rice did not differ in their 24-hr glycemic response and gly-cemic index, which may reflect the deleterious effect of even minimal polishing on structural integrity, composi-tion, as well as fibre content. ACKNOWLEDGEMENTS The authors acknowledge Ms Heinz Nutrition Foundation, India, Mumbai for sponsoring the study. AUTHOR DISCLOSURES All authors declare that they have no duality of interest associat-ed with this manuscript. REFERENCES 1. Shobana S, Kokila A, Lakshmipriya N, Subhashini S,
Ramya Bai M, Mohan V, Malleshi NG, Anjana RM, Henry CJK, Sudha V. Glycemic index [GI] of three Indian rice varieties. Int J Food Sci Nutr. 2012;63:178-83. doi: 10.3109/ 09637486.2011.615300.
2. Radhika G, Van Dam RM, Sudha V, Ganesan A, Mohan V. Refined grain consumption and the metabolic syndrome in
urban Asian Indians (Chennai Urban Rural Epidemiology Study 57). Metabolism. 2009;58:675-81. doi: 10.1016/j. metabol.2009.01.008.
3. Newby PK, Maras J, Bakun P, Muller D, Ferrucci L, Tucker KL. Intake of whole grains, refined grains, and cereal fiber measured with 7-d diet records and associations with risk factors for chronic disease. Am J Clin Nutr. 2007;86:1745-53.
4. Sun Q, Spiegelman D, van Dam RM, Holmes MD, Malik VS, Willett WC, Hu FB. White rice, brown rice and risk of type 2 diabetes in US men and women. Arch Intern Med. 2010;170:961-9. doi: 10.1001/archinternmed.2010.109.
5. Mohan V, Radhika G, Sathya RM, Tamil SR, Ganesan A, Sudha V. Dietary carbohydrates, glycemic load, food groups and newly detected type 2 diabetes among urban Asian Indian population in Chennai, India (Chennai Urban Rural Epidemiology study 59). Br J Nutr. 2009;102:1498-506. doi: 10.1017/S0007114509990468.
6. Montonen J, Knekt P, Jarvinen R, Aromaa A, Reunanen A. Whole-grain and fiber intake and the incidence of type 2 diabetes. Am J Clin Nutr. 2003;77:622-9.
7. Liese AD, Roach AK, Sparks KC, Marquart L, Agostino Jr RBD, Mayer-Davis EJ. Whole-grain intake and insulin sensitivity: the insulin resistance Atherosclerosis study. Am J Clin Nutr. 2003;78:965-71.
8. Jensen MK, Koh-Banerjee P, Franz M, Sampson L, Gronbaek M, Rimm EB. Whole grains, bran and germ in relation to homocysteine and markers of glycemic control, lipids, and inflammation. Am J Clin Nutr. 2006;83:275-83.
9. Bhattacharya KR. Parboiling of rice. In: Juliano BO, editor. Rice chemistry and technology. St. Paul, Minn: Am Assoc Cereal Chem; 1985. pp. 289-348.
10. WHO Expert Consultation. Appropriate body-mass index for Asian populations and its implications for policy and intervention strategies. Lancet. 2004;363:157-63.
11. Henry CJK, Lightowler HJ, Newens K, Sudha V, Radhika G, Sathya RM, Mohan V. Glycaemic index of common foods tested in the UK and India. Br J Nutr. 2008;99:840-5. doi: 10.1017/S0007114507831801.
12. Wolever TMS, Jenkins DJA, Jenkins AL, Joss RG. The glycemic index: methodology and clinical implications. Am J Clin Nutr. 1991;54:846-54.
13. Brouns F, Bjorck I, Frayn KN, Gibbs AL, Lang V, Slama G, Wolever TMS Glycaemic index methodology.Nutr Res Rev. 2005;18:145-71. doi: 10.3945/ajcn.112.042457.
14. FAO/ WHO. Carbohydrates in human nutrition: Report of joint FAO/WHO expert consultation. FAO Food and Nutr. 1998;66:1-140. doi: 10.1007/s00394-008-0724-9.
15. Monsod TP, Flanagan DE, Rife F, Saenz R, Caprio S, Sherwin RS, Tamborlane WV. Do sensor glucose levels accurately predict plasma glucose concentrations during hypoglycemia and hyperinsulinemia? Diabetes Care. 2002; 25:889-93. doi: 10.2337/diacare.25.5.894.
16. Deepa M, Pradeepa R, Rema M, Anjana M, Deepa R, Shanthirani S, Mohan V. The Chennai Urban Rural Epidemiology Study (CURES) – Study design and methodology (urban component) (CURES-I). J Assoc Phys India. 2003;51:863-70. doi: 10.1016/j.jfoodeng.2006.01.076.
17. Shobana S, Malleshi NG. Preparation and functional properties of decorticated finger millet (Eleusinecoracana). J Food Eng. 2007;9:529-38. doi: 10.1080/0963748050041087 9.
18. Panlasigui LN, Thompson LU . Blood glucose lowering effects of brown rice in normal and diabetic participants. Int J Food Sci Nutr. 2006;57:151-8. doi: 10.2337/dc08-1239.
19. Larsen HN, Rasmussen OW, Rasmussen PH, Alstrup KK, Biswas SK, Tetens I, Thilsted SH, Hermansen K.
836 S Shobana, N Lakshmipriya, M Ramya Bai, R Gayathri, V Ruchi, V Sudha et al
Glycaemic index of parboiled rice depends on the severity of processing: study in type 2 diabetic participants. Eur. J. Clin Nutr. 2000;54:380-5.
20. Atkinson FS, Foster-Powell K, Brand-Miller JC. International tables of glycemic index and glycemic load values: 2008. Diabetes Care. 2008;31:2281-3. doi: 10.2337/ dc08-1239.
21. Yusof BNM, Talib RA, Karim NA. Glycaemic Index of Eight Types of Commercial Rice in Malaysia. Malay J Nutr. 2005;11:151-63.
22. Rasolt DR. Chemical in germinated brown rice could benefit diabetics. Defeat-diabetes foundation: Yu RK, Yusuki S, Baker T. J Lipid Res, News release. July 2008.
23. Collings P, Williams C, Maodonald I. Effects of cooking on serum glucose and insulin responses to starch. Br Med J (Clin Res Ed). 1981;282:1032.
24. Ranawana DV, Henry CJK, Lightowler HJ, Wang D. Glycemic index of some commercially available rice and rice products in Great Britain. Int J Food Sci Nutr. 2009;60: 99-110. doi: 10.1080/09637480802516191.
25. Miller JB, Pang E, Bramall L. Rice: a high or low glycemic index food? Am J Clin Nutr. 1992;56:1034-6.
26. Bird AR, Brown IL, Topping DL. Starches, resistant
starches, the gut microflora and human health. Curr Issues Intest Microbiol. 2000;1:25-37.
27. Shobana S, Malleshi NG, Sudha V, Spiegelman D, Hong B, Hu FB, Willett WC, Krishnaswamy K, Mohan V. Nutritional and sensory profile of two Indian rice varieties with different degrees of polishing. Int J Food Sci Nutr. 2011;62:800-10. doi: 10.3109/09637486.2011.585962.
28. Mohan V, Spiegelman D, Sudha V, Gayathri R, Hong B, Praseena K et al. Effect of brown rice, white rice, and brown rice with legumes on blood glucose and insulin responses in overweight Asian Indians: arandomized controlled trial. Diabetes Technol Ther. 2014;16:317-25. doi: 10.1089/dia.2013.0259.
29. Jarvi AE, Karlström BE, Granfeldt YE, Björck IM, Vessby BO, Asp NG. The influence of food structure on postprandial metabolism in patients with non-insulin diabetes mellitus. Am J Clin Nutr. 1995;61:837-42.
30. Kumar S, Mohanraj R, Sudha V, Wedick NM, Malik V, Hu FB, Spiegelman D, Mohan V. Perceptions about varieties of brown rice: a qualitative study from Southern India. J Am Diet Assoc. 2011;111:1517-22. doi: 10.1016/j.jada.2011.07. 002.