evapotranspiration estimation for south...
TRANSCRIPT

Technical PaperEMA # 407
(for presentation and publication in a proceedings of the World Water and EnvironmentalResources Congress 2003, Symposium on Integrated Surface and Groundwater Modeling,
ASCE Conference at Philadelphia, PA, June 22-26, 2003)
Evapotranspiration Estimationfor South Florida
January 2003
by
Wossenu AbtewJayantha Obeysekera
Michelle Irizzary-OrtizDanielle LyonsAnna Reardon
South Florida Water Management District3301 Gun Club Road
West Palm Beach, FL 33406

II

Evapotranspiration Estimation for South Florida
W. Abtew1 , J. Obeysekera 2, M. Irizarry-Ortiz 3, D. Lyons4 and A. Reardon5
'South FL Water Management District, 3301 Gun Club Road, West Palm Beach, FL33406; PH (561) 682-6326; FAX (561) 681-6265; email:[email protected] FL Water Management District; email:[email protected];3South FL Water Management District; email:[email protected],4South FL Water Management District; email:dlyons @sfwmd.gov5South FL Water Management District, email:[email protected]
Abstract
A regional estimate of potential evapotranspiration (ETp) for central and south Florida isprovided based on cumulative literature and lysimeter studies of evaporation andevapotranspiration measurements and estimations. General estimates of annual ETp forthe south Florida Water Management District range from 122 cm in the north to 137 cm
in the south. Open water and wetland systems evaporate at the potential rate. Otherwise,actual evapotranspiration will be lower due to limited availability of water or moisture.A network of weather stations and an ETp computation software developed in-house iscurrently being used at the South Florida Water Management District to develop a dailyETp database. A simple ETp estimation model that was previously calibrated withlysimeter data is being applied.
Introduction
Evapotranspiration is one of the major parameters in south Florida hydrology. As amajor component of the hydrologic cycle, there is a need for reasonably accurateestimates of evaporation from water bodies and evapotranspiration from vegetation.Evapotranspiration depends on the availability of energy, on the mechanism of masstransfer, energy transfer and the availability of water. Evaporation andevapotranspiration are functions of solar radiation, temperature, wind speed, vaporpressure deficit, atmospheric pressure, characteristics of the surrounding environment andtype and condition of vegetation. South Florida is an area of high rainfall, high humidityand generally low wind speed. Air temperature is high with relatively warm wintermonths. Solar radiation is abundant with seasonal and daily variation. Most of thevariation of daily ET is explained by solar radiation (Abtew, 1996a). Annual lakeevaporation in the continental United States spatially ranges between 51 cm in theextreme northeast to 218 cm in southern California (Viessman et al., 1977).
Through the years, various measurements and estimates of evapotranspiration data havebeen reported for different locations in central and south Florida which is the focal areaof this study. A one-year study of evapotranspiration from a central Florida freshwatermarsh yielded an estimate of 131.7 cm for the year. The method was based on diurnalwater-table fluctuation monitoring (Dolan et al., 1984). Lysimeter studies at the

Agricultural Research and Education Center at Belle.Glade in south Florida (26° 39' N,80° 38' W) reported measured annual water requirements of planted sugarcane to be117.7 cm, 123.0 cm and 136 cm per year for water table depths of 89 cm, 61 cm, and30.5 cm, respectively (Shih and Gascho, 1980).
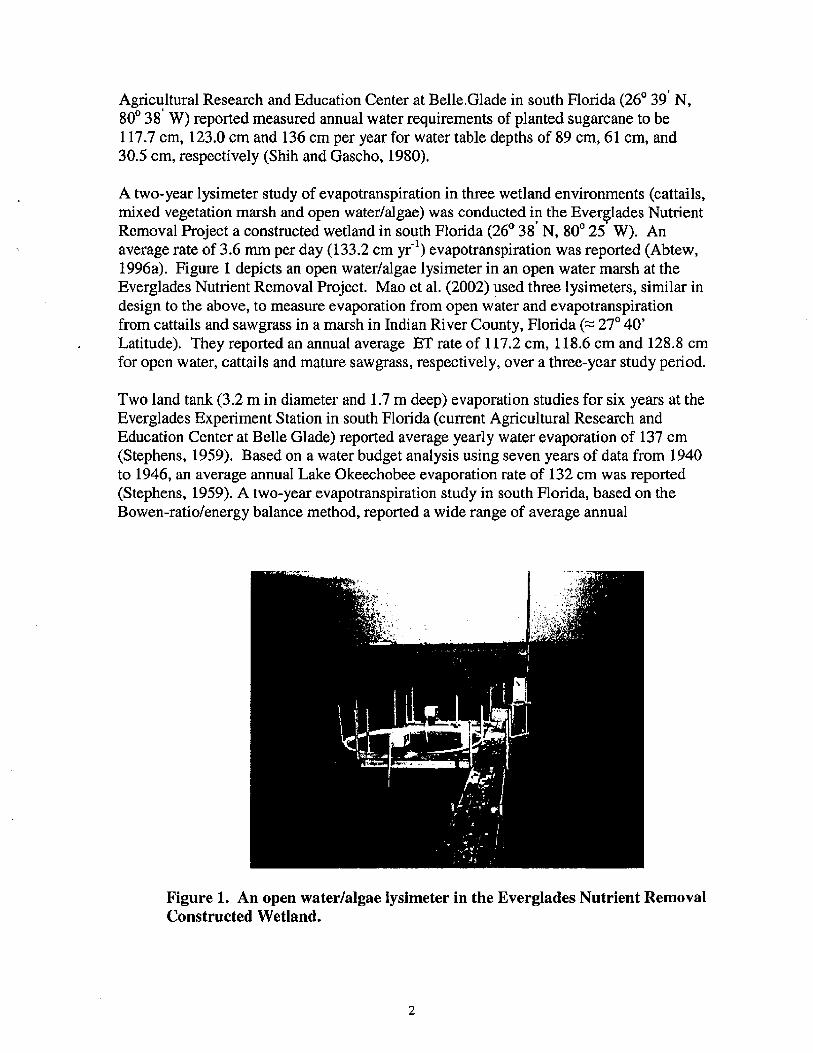
A two-year lysimeter study of evapotranspiration in three wetland environments (cattails,mixed vegetation marsh and open water/algae) was conducted in the Everglades NutrientRemoval Project a constructed wetland in south Florida (260 38' N, 800 25 W). Anaverage rate of 3.6 mm per day (133.2 cm yr 1) evapotranspiration was reported (Abtew,1996a). Figure 1 depicts an open water/algae lysimeter in an open water marsh at theEverglades Nutrient Removal Project. Mao et al. (2002) used three lysimeters, similar indesign to the above, to measure evaporation from open water and evapotranspirationfrom cattails and sawgrass in a marsh in Indian River County, Florida (; 270 40'Latitude). They reported an annual average ET rate of 117.2 cm, 118.6 cm and 128.8 cmfor open water, cattails and mature sawgrass, respectively, over a three-year study period.
Two land tank (3.2 m in diameter and 1.7 m deep) evaporation studies for six years at theEverglades Experiment Station in south Florida (current Agricultural Research andEducation Center at Belle Glade) reported average yearly water evaporation of 137 cm(Stephens, 1959). Based on a water budget analysis using seven years of data from 1940to 1946, an average annual Lake Okeechobee evaporation rate of 132 cm was reported(Stephens, 1959). A two-year evapotranspiration study in south Florida, based on theBowen-ratio/energy balance method, reported a wide range of average annual
Figure 1. An open water/algae lysimeter in the Everglades Nutrient RemovalConstructed Wetland.


evapotranspiration rates between open water and vegetated sites that were dry for part of
the year (German, 2000). This study reported an annual average evapotranspiration rateof 122.2 cm for the nine sites in the Everglades Protection Area and vicinity. Themaximum annual average evapotranspiration rate was 145.8 cm for an open water siteand the minimum was 107.7 cm for a sparse sawgrass site that was dry part of the year.
Annual lake evaporation estimates for the Lake Okeechobee area were reported as 129.5
cm (Viessman et al., 1977) and 127 cm (Visher and Hughes, 1969, Figure 2). Usingweather parameters observed on the lake, an annual average Lake Okeechobeeevaporation estimate was reported as 132 cm (Abtew, 2001). An annual isohyetal lineshowing an average annual lake evaporation of 127 cm running southeast to northwestfrom the West Palm Beach area to west central Florida was published (Linsley andFranzini, 1979). Based on 1968 data from the U.S. Department of Commerce, Hanson(1991) provided mean annual lake evaporation estimates for the contiguous United Stateswith the South Florida Water Management District area being in the range of 102 to 127cm and 127 to 152 cm. The gradient was increasing north to south in a southeast-to-northwest pattern. Waylen and Zorn (1998) graphically presented annual evaporationrates for Florida, with an increasing gradient from 115 cm in the north to 134.9 cm in thesouth. The gradient lies diagonally in a northwest to southeast direction.
One of the indications of how well evapotranspiration estimation methods perform insouth Florida is whether or not the annual estimate falls within the expected limits.Temporal variation in annual potential evapotranspiration in many parts of Florida isslight when compared to annual variation in rainfall which ranges between 50 percentgreater than normal to about 50 percent less than normal (Visher and Hughes, 1969). Alysimeter evapotranspiration measurements at Coshocton, Ohio between 1948 and 1965indicated a maximum annual range of 17.8 cm (USDA, 1968).
AVERAGE ANNUAL LAKE EVAPORATION
Figure 2. Average annual lake evaporation in inches (Visher and Hughes, 1969).


In open water and wetland systems in south Florida, where water is available all yearround, the potential evaporation and evapotranspiration is the same as the actualevaporation and evapotranspiration for the period under consideration. Based on theliterature review and the recent lysimeter measurements of wetland evapotranspiration,Figure 3 depicts assumed average ETp over the region.
Figure 3. Estimated potential evapotranspiration isohyetallines for the South Florida Water Management District.
Central and South Florida Hydrologic System
The water resources management area of the South Florida Water Management Districtextends from central Florida near Orlando in the north to the Florida Keys in the south.The area includes the Kissimmee River, Lake Okeechobee and Everglades systems. Thehydrology of the area is comprised of lakes, impoundments, canals and wetlands. Themajor lakes are Lake Okeechobee, Lake Kissimmee and Lake Istokpoga. In the south-southeast, the Everglades Protection Area comprises the Water Conservation Areas andthe Everglades National Park, which consist of expansive wetlands and impoundments.In the southwest, the Big Cypress National Preserve is a large forested wetland. Thewater management system comprises a large network of canals and water controlstructures.
South Florida Hydrometeorology
Rainfall. South Florida is a sub-tropical region that is relatively wet, warm and humid.The wet season lasts from June through October and accounts for 66 percent of theannual rainfall. The driest month is December, followed by January (Table 1). Runoffgenerated by wet-season rainfall and dry-season high-rainfall events is stored in ponds,lakes, impoundments, wetlands and aquifers resulting in potential evaporation andevapotranspiration over large areas. The average annual rainfall for the south FloridaWater Management District area is 134 cm (Ali and Abtew, 1999).


Meteorology. The annual average air temperature is 23.1 °C with monthly averagetemperature increasing from 17.9 °C in January to 27.4 °C in August. The average windspeed is 3.1 m s-1. The annual average relative humidity is 80.7% with annual averageminimum and maximum values of 67% and 92%, respectively. The area has significantsunshine with an annual average solar radiation flux rate of 0.1908 kw m-2. Table 1depicts the monthly average meteorological parameters as computed from weatherstations with varying lengths of record from 1988 to 2002. The average potentialevapotranspiration is estimated based on Equation 1.
Table 1. District-wide average monthly weather parameters.
Parameter Jan Feb Mar Apr May June July Aug Sept Oct Nov DecTmean (oC) 17.9 19.0 20.6 22.7 25.0 26.6 27.3 27.4 26.3 24.8 21.5 18.8Tmax (oC) 23.2 23.3 24.8 25.9 27.3 28.5 29.2 29.2 28.0 27.5 25.2 23.3Tmin (oC) 9.7 12.0 14.7 18.0 21.8 24.3 24.7 24.5 23.8 20.3 16.1 10.5Rhmin (%) 62.8 63.9 60.9 58.3 65.2 71.6 73.1 74.3 74.3 67.1 67.0 65.9Rhmax (%) 94.0 92.2 91.3 89.6 90.1 90.9 90.8 91.2 92.7 92.5 93.9 95.0WS@10m (m/s) 3.22 3.42 3.66 3.56 3.18 2.73 2.53 2.53 2.69 3.18 3.31 3.11
Rs (MJ M2 d1 ) 11.87 14.62 18.14 20.44 21.40 19.43 19.15 18.58 16.06 14.69 12.34 10.91ETp (mm/d) 2.57 3.16 3.93 4.42 4.63 4.20 4.14 4.02 3.47 3.18 2.67 2.36Rainfalt (cm) 5.59 5.99 7.45 6.55 11.84 19.94 17.73 17.86 18.36 11.99 5.84 4.83
Daily Potential Evapotranspiration Estimation
At the Everglades Nutrient Removal Project, a constructed wetland, three lysimeters wereinstalled to measure evapotranspiration from cattail marsh, mixed vegetation marsh andopen water/algae marsh (Figure 1). These lysimeters were operated from 1993 to 1995.The main part of the lysimeter system has a polyethylene tank 3.53 m in diameter and 91cm deep with automated water level control and monitoring (Abtew and Obeysekera,1995, Abtew, 1996b). Daily evapotranspiration was computed from the water balance.The results of the study were applied to test and calibrate six evapotranspirationestimation models: Penman-Monteith, Penman-Combination, Priestly-Taylor, ModifiedTurc, Radiation/Tmax method and Radiation (Simple) method. The performance of eachmethod was compared.
The input data requirements increase from the Radiation method to the Penman-Monteithmethod. In south Florida, most of the variance (73%) in daily evapotranspiration isexplained by solar radiation (Abtew, 1996a). The effect of humidity and wind speed isrelatively minimal. A similar conclusion was reported after a two-year lysimeter study ofpotential evapotranspiration from St. Augustine grass in Fort Lauderdale (Stephens andStewart, 1963). Stephens and Stewart (1963) developed a monthly potential evaporationestimation for St. Augustine grass in Fort Lauderdale from monthly average temperatureand monthly solar radiation that corresponded very well with their lysimeter measureddata. The following are three simpler methods: Equation 1 (Simple), Equation 2(Modified Turc) and Equation 3 (Radiation/fmax). These methods require only solarradiation and air temperature, and demonstrate comparable performance to the complexmethods with numerous input requirements (Abtew, 1996a).

RsET = K Rs (1)
Where ETp is daily potential evapotranspiration (mm d"'), Rs is solar radiation (MJ m -2 d-'), X is latent heat of vaporization (MJ kg -) and K1 is a coefficient (0.53).
(23.89Rs + 50)T maxETP =K T (2)
T max+ 15
Where Tmax is maximum daily temperature (°C) and K2 is a coefficient (0.012).
1 RsxTmaxETP = (3)
P K 3 X
Where K3 is a coefficient (56°C).
There are 25 weather stations in the South Florida Water Management Districtmonitoring network. Solar radiation, humidity, wind speed and air temperature sensorsare common equipment in the weather stations. Some are equipped with net radiometersto measure net solar radiation. A computer program, ET_SF, was developed to directlyaccess a meteorological database holding fifteen minute interval field observations andthen compute potential ETp using each of the six methods (Reardon and Abtew, 2002).The program can access data from all the weather stations in the network and computesETp for the respective site. A time series of measured and model-estimatedevapotranspiration at the Everglades Nutrient Removal constructed wetland, renamedStormwater Treatment Area 1 West, is shown in Figure 4. The average dailyevapotranspiration is 3.64 mm. Average monthly weather parameters for the constructedwetland are shown in Table 2. The simple model (Equation 1) was applied to elevenweather stations that fairly represented most of the District area for 2001. The monthlyaverage District area-wide ETp is shown in Figure 5 as computed from simple average ofthe stations. The yearly sum was 134.7 cm. There was a severe drought in 2000 and2001 in central and south Florida.


Table 2. Mean monthly weather parameters at the Everglades Nutrient RemovalConstructed Wetland site (1994 to 2002).
ParameterTmean (oC)Tmax (oC)Tmin (oC)Rhmin (%)Rhmax (%)WS@10m (m/s)Rs (MJ M 2 d-')ET (mm/d)Rainfall (cm)
Jan Feb Mar Apr May June July17.7 19.0 20.6 22.6 25.0 26.4 27.2
25 24.3 25.8 26.9 27.2 28.2 28.98.8 11.7 15.3 18.1 22.0 23.9 24.8
71.1 72.7 72.7 68.8 74.5 80.1 81.296.8 95.9 96.5 94.6 94.2 95.5 94.83.49 3.62 3.89 3.44 2.95 2.68 2.50
12.48 14.56 18.38 20.30 22.08 19.61 19.922.68 2.96 3.82 4.44 4.93 4.38 4.463.66 5.20 7.94 6.13 7.67 18.90 17.07
Aug Sept Oct Nov Dec27.3 26.7 24.7 21.4 19.1
29 28.5 27.4 25.2 23.624.8 24.2 20.6 16.6 10.381.4 81.3 76.4 76.8 76.5
96 97 96.2 96.9 982.46 2.55 3.22 3.40 3.31
18.57 15.98 15.02 12.96 11.234.15 3.50 3.28 2.76 2.41
17.32 18.64 14.68 6.28 4.32
5
Ec4
L 2O
.3
0co -t LO0 N 0 > 0
r r r r rDate
Figure 4. Daily measured and model estimated evapotranspiration at theEverglades Nutrient Removal (renamed Storm Water Treatment Area 1 West) inSouth Florida.


140
120EP 100
.In 80_%
60 -
40
20 -
0
Month
Figure 5. District-wide average potential ET for 2001.
Summary
A regional estimation of ETp for central and south Florida is provided based oncumulative information of reported evaporation and evapotranspiration measurementsand estimations. General estimates of annual ETp for the South Florida WaterManagement District area range from 122 cm in the north to 137 cm in the south. Anetwork of weather stations and an ETp computation software developed in-house iscurrently being used to develop a daily ETp database at the South Florida WaterManagement District. A simple ETp estimation model that was previously calibratedwith lysimeter data is being applied.
References
Abtew, W. and Obeysekera, J. (1995). "Lysimeter Study of Evapotranspiration ofCattails and Comparison of Three Estimation Methods." Transactions of theASAE, 38(1), 121-129.
Abtew, W. (1996a). "Evapotranspiration Measurements and Modeling for ThreeWetland Systems in South Florida." Journal of the American Water ResourcesAssociation, 32 (3), 465-473.
Abtew, W. (1996b). "Lysimeter Study of Evapotranspiration from a Wetland."Evapotranspiration and Irrigation Scheduling. C. R. Camp, E. J. Sadler and R.E.Yoder (eds.). Proceedings of the International Conference. Nov. 3-6, SanAntonio, TX. pp. 54-60. ASAE.
Abtew, W. (2001). "Evaporation Estimates for Lake Okeechobee in South Florida".Journal of Irrigation Drainage Engineering, 127(3), 140:147.
Ali, A. and Abtew, W. (1999). "Regional Rainfall Frequency Analysis for Central and
I
I i I I i I I I i I

South Florida". Technical Publication, WRE # 380. South Florida WaterManagement District, West Palm Beach, FL.
Dolan, T.J., Herman, A.J., Bayley, S. and Zoltek, J. (1984). "Evapotranspiration of aFlorida, U.S.A., Freshwater Wetland. " Journal of Hydrology, 74, 355-371.
German, E.R. (2000). Regional Evaluation of Evapotranspiration in the Everglades.USGS. Water-Resources Investigations Report 00-4217, Tallahassee, FL.
Hanson, R.L. (1991). "Evapotranspiration and Drought. " In: National Water Summary1988-89--Hydrologic Events Floods and Droughts. R.W. Paulson, E.B. Chase,R.S. Roberts and D.W. Moody (eds.). USGS, Water-Supply paper 2375, 99-104.
Linsley, R.K. and Franzini, J.B. (1979). Water Resources Engineering. McGraw-Hill,New York.
Mao, L.M, Bergman, M.J. and Tai, C. (2002). "Evapotranspiration Measurement andEstimation of Three Wetland Environments in the Upper St. Johns River Basin,Florida". Journal of the American Water Resources Association, 5(38), 1271-1285.
Reardon, A. and Abtew, W. (2002). Evapotranspiration Estimation for South Florida-Documentation for Program ET_SF. Environmental Monitoring and AssessmentDepartment. South Florida Water Management District, West Palm Beach, FL.
Shih, S.F. and Gascho, G.J. (1980). "Water Requirements for Sugarcane Production."Transactions of the ASAE, 23(4), 934-937.
Stephens, J.C. (1959). Evapotranspiration studies pertaining to the agriculturalwatersheds in Florida. USDA. ARS. Soil and Water Conservation ResearchDivision. Fort Lauderdale, FL, 39.1-39.31.
Stephens, J.C. and Stewart, E.H. (1963). "A Comparison of Procedures for ComputingEvaporation and Evapotranspiration." Extract of publication no. 62 of theI.A.S.H. Committee for Evaporation, pp. 123-133.
USDA. (1968). "Estimating Evapotranspiration in Humid Regions." Technical BulletinNo. 1389.
Viessman, W., Klapp, J.W., Lewis, G.L and Harbaugh, T.E. (1977). Introduction toHydrology, Harper & Row, New York.
Visher, F.N. and Hughes, G.H. (1969). The difference between rainfall and potentialevaporation in Florida, 2 nd Ed. Florida Bureau of Geology Map Series 32,Tallahassee, FL.
Waylen, P.R. and Zorn, R. (1998). "Prediction of mean annual flows in North andCentral Florida." Journal of American Water Resources Association, 34(1), 149-157.
