evaluation, ranking and selection of r&d projects by
TRANSCRIPT

Evaluation, ranking and selection of R&D projectsby multiple experts: an evidential reasoning rule basedapproach
Fang Liu1• Wei-dong Zhu2
• Yu-wang Chen3•
Dong-ling Xu3• Jian-bo Yang3
Received: 12 July 2016 / Published online: 1 March 2017� Akademiai Kiado, Budapest, Hungary 2017
Abstract As a typical multi-criteria group decision making (MCGDM) problem, research
and development (R&D) project selection involves multiple decision criteria which are
formulated by different frames of discernment, and multiple experts who are associated
with different weights and reliabilities. The evidential reasoning (ER) rule is a rational and
rigorous approach to deal with such MCGDM problems and can generate comprehensive
distributed evaluation outcomes for each R&D project. In this paper, an ER rule based
model taking into consideration experts’ weights and reliabilities is proposed for R&D
project selection. In the proposed approach, a utility based information transformation
technique is applied to handle qualitative evaluation criteria with different evaluation
grades, and both adaptive weights of criteria and utilities assigned to evaluation grades are
introduced to the ER rule based model. A nonlinear optimisation model is developed for
the training of weights and utilities. A case study with the National Science Foundation of
China is conducted to demonstrate how the proposed method can be used to support R&D
project selection. Validation data show that the evaluation results become more reliable
and consistent with reality by using the trained weights and utilities from historical data.
Keywords R&D project evaluation � Evidential reasoning � Reliability � Nonlinear
optimisation
& Fang [email protected]
1 School of Accounting, Zhejiang University of Finance and Economics, 18 Xueyuan Road,Hangzhou 310018, Zhejiang, China
2 School of Economics, Hefei University of Technology, 193 Tunxi Road, Hefei 230009, Anhui,China
3 Alliance Manchester Business School, The University of Manchester, Manchester M15 6PB, UK
123
Scientometrics (2017) 111:1501–1519DOI 10.1007/s11192-017-2278-1

Introduction
With limited funds and resources, organizations and companies depending on research and
development (R&D) to keep continual competitiveness always face the problem of eval-
uating and selecting R&D projects. The decision of selecting and funding certain R&D
projects usually has a significant impact on survivability and development of technology-
based organizations (Collan and Luukka 2014; Meade and Presley 2002). R&D project
selection is a typical multi-criteria group decision making problem, and its main objective
is to select appropriate projects through the assessment of multiple experts from a given
group of research projects that are characterized by multiple criteria (Liu et al. 2010;
Mahmoodzadeh et al. 2007).
R&D project evaluation and selection is a significant and challenging task for organi-
zations with R&D project management, especially for governments and public funding
agencies such as the National Science Foundation of China (NSFC). The basic project
evaluation and selection process usually includes six steps, namely, proposal submission,
form review, peer review for project evaluation, aggregation of review results, panel
evaluation, and final decision (Tian et al. 2005). It is a complex decision making process
which involves multiple evaluation criteria and multiple decision makers (Liu et al. 2010;
Chiang and Che 2010). The involved criteria can be either quantitative or qualitative,
where the former can be easily defined by numerical values, while the later often by a set of
evaluation grades.
In order to support the decision makers to make rational decision, a wide range of R&D
project evaluation and selection methods have been proposed by researchers over the last
few decades. Reviews and comparative studies on the topic of these R&D project selection
methods have been conducted comprehensively (Poh et al. 2001; Heidenberger and
Stummer 1999; Henriksen and Traynor 1999; Jackson 1983; Baker and Freeland 1975).
According to Heidenberger and Stummer (1999), the main methods used in R&D project
selection can be summarized into the following categories: (1) benefit measurement
methods, (2) decision theory, (3) mathematical programming, (4) artificial intelligence, (5)
simulation and heuristics, as shown in Fig. 1.
Among the five categories, methods in decision theory category are the most widely
studied and applied by researchers. For example, analytic hierarchy process (AHP) (Saaty
1980) is a method for comparing a set of alternatives by decomposing the evaluation
criteria of a decision problem hierarchically and this method has been used for R&D
project evaluation by Amiri (2010) and Huang et al. (2008). Integrated methods have also
been used to assess and select R&D projects. For example, Feng et al. (2011) have
proposed an approach which integrates AHP, scoring and weighted geometric averaging
methods for R&D project evaluation. Furthermore, comparative studies have been con-
ducted to analyse the strengths and weaknesses of these R&D project evaluation methods
(Heidenberger and Stummer 1999).
However, the AHP model suffers from the ‘rank reversal problem’ and the large number
of pairwise comparisons can be another serious challenge for decision makers (Poh et al.
2001). In addition, current research findings reveal that almost all of the previous studies
on R&D project evaluation methods focus on describing the mechanisms of the methods
and on analysing the strengths and weaknesses based on the nature of R&D projects (Poh
et al. 2001; Hsu et al. 2003). The classical approaches suffer from a number of deficiencies,
range from problems in methodology (treatment of uncertainty, multiple criteria, etc.) to
more fundamental concerns with the overall approach. The models ignore the
1502 Scientometrics (2017) 111:1501–1519
123

organizational decision process though they may be valid in a mathematical sense (Sch-
midt and Freeland 1992). Thus many of the proposed models and methods are not applied,
and they have limited impacts on the decision making of real-world R&D project selection
(Tian et al. 2005). In this paper, we propose to apply the evidential reasoning (ER) rule
(Yang and Xu 2013, 2014) for modelling the problems and for aggregating the evaluation
information with uncertainty. The ER rule is developed from the ER approach for multiple
criteria decision analysis (Yang and Singh 1994; Yang and Xu 2002) which is based on the
evidence theory proposed by Dempster and Shafer (Shafer 1976). The kernel of the ER
approach constitutes a rational aggregation algorithm, i.e., the ER algorithm. Although the
ER approach has been widely applied to a range of areas, such as engineering design,
project management and supply chain management, environmental and sustainability
management, policy making and group decision making (Xu 2012), it assumes that the
weight of a piece of evidence is always equal to the reliability of the evidence, which may
not always be the case in practice. The reliability of a piece of evidence represents the
quality of the information source and its ability to provide the correct assessment of the
given decision problem, and it has significant influence on the quality of a decision. In the
context of evaluating and selecting R&D projects, the process of providing evaluation
opinions is often accused of being exposed to various kinds of bias and conflict of interests
(Wessely 1998; Juznic et al. 2010). Taking the reliability into consideration, it measures
the quality of evaluation information and reflects its limited role in the aggregation process.
In this paper, we present an effective model for evaluating and selecting R&D projects
with the use of the recently-developed ER rule (Yang and Xu 2013). As a generalization to
the ER algorithm, the ER rule is a generic probabilistic reasoning process and can be used
to combine multiple pieces of independent evidence by taking into consideration both
weight and reliability of the evidence. The approach has the features of managing
importance and reliability of information sources separately and of handling highly or
completely conflicting evidence rationally. The reliability of a source represents its ability
R&D project selectionmethods
Benefitmeasurement
methods
Mathematicalprogramming
Decisiontheory
Simulationand heuristics
Artificialintelligence
Dec
isio
nan
alys
issu
chas
deci
sion
trees
Ana
lytic
hier
arch
ypr
oces
s
Gro
upde
cisi
onte
chni
ques
such
asD
elph
imet
hod
Com
para
tive
mod
elss
uch
asQ
-sor
tapp
roac
h
Scor
ing
appr
oach
essu
chas
the
chec
klis
tapp
roac
h
Trad
ition
alec
onom
icm
odel
ssuc
has
econ
omic
inde
xes;
optio
nsap
proa
ch
Line
arpr
ogra
mm
ing
mod
els
Non
-line
arpr
ogra
mm
ing
mod
els
Inte
gerp
rogr
amm
ing
mod
els
Goa
lpro
gram
min
gm
odel
s
Dyn
amic
prog
ram
min
gm
odel
s
Expe
rtsy
stem
sand
synt
hese
sof
othe
rnew
erde
velo
pmen
ts
Fuzz
yse
ts
Sim
ulat
ion
such
asM
onte
Car
losi
mul
atio
n
Heu
ristic
mod
ellin
g
Fig. 1 Categories of R&D project selection methods
Scientometrics (2017) 111:1501–1519 1503
123

to provide the correct judgement or information of a given problem. The ER rule is thus
ideally suited for modelling and aggregating the evaluation information of a project pro-
vided by a group of experts (Yang and Xu 2013).
The rest of this paper is organized as follows. In ‘‘Preliminaries’’ section, the evidence
theory, the ER rule and the utility based information transformation technique are briefly
introduced. In ‘‘The proposed approach’’ section, the proposed methodology for R&D
project selection is investigated, which includes problem modelling with multiple criteria
and multiple experts. In ‘‘A case study of the National Science Foundation of China’’
section, a case study is conducted on the project selection of the National Nature Science
Foundation of China (NSFC), and selection results and sensitivity analysis are also given in
this section. The paper is concluded in the last section.
Preliminaries
D–S theory of evidence
The evidence theory was first proposed by Dempster (1967) and refined by Shafer (1976).
The ER approach developed from Dempster’s rule of evidence combination has the ability
to deal with multiple criteria and has been applied in a range of decision making problems
(Taroun and Yang 2011; Xiao et al. 2012).
Definition 1 (Basic probability assignment) Let H = {H1, …, HN} be a set of collec-
tively exhaustive and mutually exclusive hypotheses, called a frame of discernment (Shafer
1976). The power set of H consists of 2N subsets of H, denoted by P(H) or 2H, as follows
P Hð Þ ¼ 2H ¼ /;H1; . . .;HN ; H1;H2f g; . . .; H1;HNf g; . . .; H1; . . .;HN�1f g;Hf g ð1Þ
A basic probability assignment (bpa), called a belief structure, is a mass function m:
2H ? [0, 1]. It satisfies the following two conditions:X
A�H
m Að Þ ¼ 1; 0�m Að Þ� 1 ð2Þ
m /ð Þ ¼ 0 ð3Þ
where / is an empty set, and 2H is the power set of H. m(A) is probability mass to A, a
subset of H, which represents the degree to which the evidence supports A. m(H) is called
the degree of ignorance, which measures the probability mass assigned to H.
Definition 2 (Belief and plausibility degrees) The belief on a hypothesis A and the total
amount of belief that could be potentially placed on A are denoted by Bel(A) and
Pl(A) respectively as follows:
Bel Að Þ ¼X
B�A
m Bð Þ ð4Þ
Pl Að Þ ¼X
A\B 6¼0
m Bð Þ ð5Þ
Bel(A) and Pl(A) are the lower and upper bounds of the probability to which A is supported.
1504 Scientometrics (2017) 111:1501–1519
123

Definition 3 (Dempster’s rule of combination) Dempster’s combination rule, the kernel
of the evidence theory, is used to aggregate different information sources. With multiple
belief structures m1(A), …, mn(A), Dempster’s combination rule is defined as
m Að Þ ¼
0; A ¼ /K �
P
A1; . . .;An � HA1 \ . . . \ An ¼ A
m1 A1ð Þ. . .mn Anð Þ A 6¼ /
8>><
>>:ð6Þ
K is a normalisation factor, reflecting the conflict among n pieces of evidence, which is
determined by the following equation:
K ¼ 1 �X
A1; . . .;An � HA1 \ . . . \ An ¼ /
m1 A1ð Þ. . .mn Anð Þ
0BBBB@
1CCCCA
�1
ð7Þ
Dempster’s rule of combination satisfies both commutativity and associativity of
multiplication (Shafer 1976). Those two properties ensure that the combination results
remain the same regardless of the order in which multiple pieces of evidence are
aggregated.
The ER rule
In the ER rule, a piece of evidence ei is profiled by a belief distribution as follows
ei ¼ h; ph;i� �
; 8h � H;X
h�H
ph;i ¼ 1
( )ð8Þ
where ph,i denotes the degree of belief to which evidence ei supports proposition h which
can be any element of the power set P(H) except for the empty set. (h, ph,i) is an element of
evidence ei, and it is referred to as a focal element of ei if ph,i[ 0.
Suppose wi and ri are the weight and reliability of evidence ei respectively. Both of them
are in the range of [0, 1]. Let ~wi ¼ wi= 1 þ wi � rið Þ ¼ wicrw;i. In the ER rule, ~wi can be
seen as a combined weight and reliability coefficient for ei. The basic probability masses
for ei are assigned as follows
~mh;i ¼0; h ¼ /~wiph;i; h � H; h 6¼ /1 � ~wi; h ¼ P Hð Þ
8<
: or ~mh;i ¼0; h ¼ /crw;imh;i; h � H; h 6¼ /crw;i 1 � rið Þ; h ¼ P Hð Þ
8<
: ð9Þ
where mh,i = wiph,i and crw,i = 1/(1 ? wi - ri) is a normalisation factor which determinesPh�H ~mh;i þ ~mP Hð Þ;i ¼ 1. ~mh;i measures the degree of support for h from evidence ei after
taking into account both the weight and the reliability.
From the above definition, a weighted belief distribution with reliability for representing
a piece of evidence can by represented by
mi ¼ h; ~mh;i� �
; 8h � H; P Hð Þ; ~mP Hð Þ;i� �� �
ð10Þ
Scientometrics (2017) 111:1501–1519 1505
123

If two pieces of evidence e1 and e2 are independent and defined by the weighted belief
distribution with reliability (i.e., m1 and m2), the combined degree of belief to which e1 and
e2 jointly support proposition h, denoted by ph,e(2), can be generated as follows
ph;e 2ð Þ ¼0 h ¼ /
mh;e 2ð ÞPD�H mD;e 2ð Þ
h ¼ /
8<
: ð11Þ
mh;e 2ð Þ ¼ 1 � r2ð Þmh;1 þ 1 � r1ð Þmh;2� �
þX
B\C¼H
mB;1mC;2 ð12Þ
It has been proven that the Dempster’s combination rule is a special case of the ER rule
when each piece of evidence is fully reliable and the ER algorithm is also a special case of
the ER rule when the reliability of each piece of evidence is equal to its weight and the
weights of all pieces of evidence are normalised.
Utility based information transformation
In project evaluation, a frame of discernment normally consists of a set of evaluation grades
used for recording the outcomes of projects evaluated against a criterion. Suppose the
utilities of all grades have been estimated by a panel of decision makers and are denoted by
u(Hj) (u(Hj?1)[ u(Hj), j = 1, …, N) and u(Hn,i) (n = 1, …, Ni, i = 1, 2, …, L), an origi-
nal evaluation distribution {(Hn,i, cn,i)} can then be transformed to an equivalent distribution
in terms of expected utility {(Hi, bj,i)} using the following equations:
bj;i ¼
Pn2pj
cn;isj;n for j ¼ 1;
Pn2pj�1
cn;i 1 � sj�1;n
� �þ
Pn2pj
cn;isj;n; for 2� j�N � 1;
Pn2pj�1
cn;i 1 � sj�1;n
� �; for j ¼ N;
8>>>><
>>>>:
ð13Þ
and
sj;n ¼u Hjþ1
� �� u Hn;i
� �
u Hjþ1
� �� u Hj
� � if u Hj
� �� u Hn;i
� �� u Hjþ1
� �; ð14Þ
pj ¼nju Hj
� �� u Hn;i
� �\u Hjþ1
� �; n ¼ 1; . . .;Ni
� �; j ¼ 1; . . .;N � 2;
nju Hj
� �� u Hn;i
� �� u Hjþ1
� �; n ¼ 1; . . .;Ni
� �; j ¼ N � 1:
�ð15Þ
The utilities of grades can be determined by using the decision maker’s preferences. If
preferences are not available, the utilities of evaluation grades can be assumed to be
linearly distributed in the normalized utility space, that is, u(Hj) = (j - 1)/(N - 1)
(j = 1, …, N).
The proposed approach
In this section, we firstly present the model of R&D project selection with multiple criteria
and multiple experts. Then the main procedures of the proposed approach are introduced,
including the optimal learning process. The proposed model focuses on representing and
1506 Scientometrics (2017) 111:1501–1519
123

aggregating the evaluation information provided by experts and provides a flexible way to
support funding agencies to make better funding decisions based on evaluations of experts.
A multiple criteria evaluation model of R&D projects by multiple experts
The evaluation criteria used for measuring the performance of a R&D project can be
different due to the unique characteristics of R&D programs to which the projects belong
(Jung and Seo 2010). To evaluate and select appropriate alternatives (i.e., projects) from a
finite number of projects am (m = 1, 2, …, M), the performance of an alternative on
evaluation criteria ci (i = 1, 2, …, L) need to be measured by clearly defined evaluation
grades H ¼ H1;H2; . . .;Hn; . . .;HNif g n ¼ 1; 2; . . .;Nið Þ. It is necessary to assign weights wi
to each criterion to reflect its relative importance. It should be noted that each criterion may
have a number of sub-criteria. As discussed above, the evaluation criteria can be either
qualitative or quantitative. Then experts are asked to assess projects by using the defined
grades and the assessment information can be regarded as pieces of evidence, which are
represented by belief distributions for further analysis. Each expert judges a project on each
of the L basic criteria, and the outcome of the judgement can be a numerical value or a
grade selected from the predefined set of evaluation grades. Together with the reliabilities
and weights of the experts, assessments provided by various experts for the same alter-
native on the same sub-criterion are aggregated using the ER rule. If a criterion and its sub-
criteria are measured using different sets of grade or different frames of discernment,
subsequently the aggregated assessments on the sub-criteria need to be transformed to the
assessments expressed by the set of grades for measuring the upper level criterion for
further aggregation. Information transformation between different frames of discernment
can be done on the basis of utility equivalence, as shown in Eqs. (13–15). The further
aggregation results are used for ranking projects.
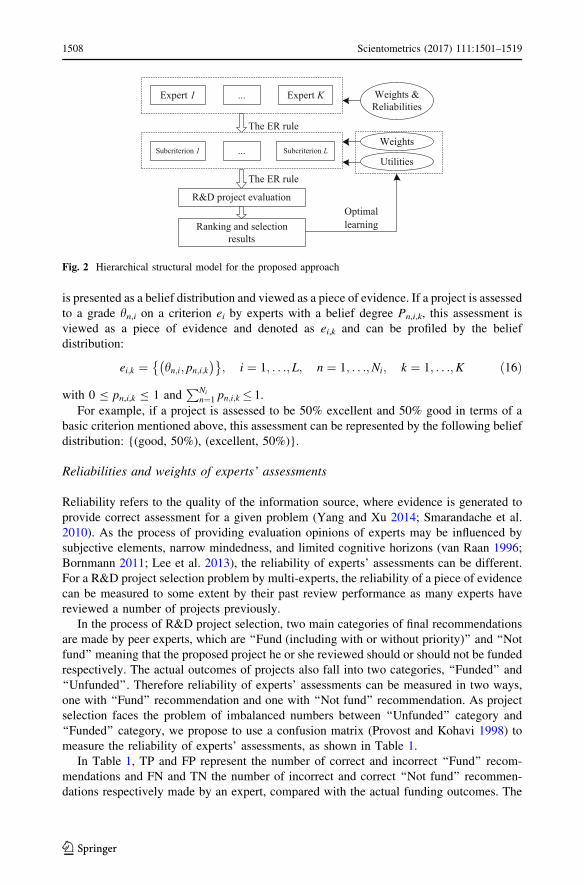
Generally, suppose there are L basic evaluation criteria by K experts, the hierarchical
structure for R&D project evaluation can be modelled as shown in Fig. 2.
As can be seen in Fig. 2, the parameters which need to be determined by optimal
learning are weights of criteria and utilities assigned to evaluation grades. In the evaluation
model, to aggregate experts’ review information with weights and reliabilities by using the
ER rule, the normalisation factor is revised to be crw,i = 1/(1 ? wi - wiri), where wiri in
the normalisation factor sets a bound within which ri can play a limited role (Zhu et al.
2015). The degree of support for h from ei, i.e., ~mh;i, can be formulated by using Eq. (9)
and then be used for further combination.
The main procedures
Representing assessment information using belief distributions
In this section, belief distributions are introduced to represent both qualitative and quan-
titative assessments in an informative and consistent way. The hypotheses in the frame of
discernment in the context of project evaluation are the evaluation grades on each criterion,
such as ‘‘poor, average, good and excellent’’ for evaluating a project on a bottom level
criterion or a basic criterion in a criteria hierarchy.
Suppose there are M projects am (m = 1, 2, …, M) and each is assessed on L basic
criteria ci (i = 1, 2, …, L) by K experts using a common set of Ni assessment grades (i.e.,
propositions) hn;i ¼ h1;i; h2;i; . . .; hn;i; . . .; hNi;i
� �. In the ER rule, the assessment information
Scientometrics (2017) 111:1501–1519 1507
123
is presented as a belief distribution and viewed as a piece of evidence. If a project is assessed
to a grade hn,i on a criterion ei by experts with a belief degree Pn,i,k, this assessment is
viewed as a piece of evidence and denoted as ei,k and can be profiled by the belief
distribution:
ei;k ¼ hn;i; pn;i;k
� �� �; i ¼ 1; . . .; L; n ¼ 1; . . .;Ni; k ¼ 1; . . .;K ð16Þ
with 0 B pn,i,k B 1 andPNi
n¼1 pn;i;k � 1.
For example, if a project is assessed to be 50% excellent and 50% good in terms of a
basic criterion mentioned above, this assessment can be represented by the following belief
distribution: {(good, 50%), (excellent, 50%)}.
Reliabilities and weights of experts’ assessments
Reliability refers to the quality of the information source, where evidence is generated to
provide correct assessment for a given problem (Yang and Xu 2014; Smarandache et al.
2010). As the process of providing evaluation opinions of experts may be influenced by
subjective elements, narrow mindedness, and limited cognitive horizons (van Raan 1996;
Bornmann 2011; Lee et al. 2013), the reliability of experts’ assessments can be different.
For a R&D project selection problem by multi-experts, the reliability of a piece of evidence
can be measured to some extent by their past review performance as many experts have
reviewed a number of projects previously.
In the process of R&D project selection, two main categories of final recommendations
are made by peer experts, which are ‘‘Fund (including with or without priority)’’ and ‘‘Not
fund’’ meaning that the proposed project he or she reviewed should or should not be funded
respectively. The actual outcomes of projects also fall into two categories, ‘‘Funded’’ and
‘‘Unfunded’’. Therefore reliability of experts’ assessments can be measured in two ways,
one with ‘‘Fund’’ recommendation and one with ‘‘Not fund’’ recommendation. As project
selection faces the problem of imbalanced numbers between ‘‘Unfunded’’ category and
‘‘Funded’’ category, we propose to use a confusion matrix (Provost and Kohavi 1998) to
measure the reliability of experts’ assessments, as shown in Table 1.
In Table 1, TP and FP represent the number of correct and incorrect ‘‘Fund’’ recom-
mendations and FN and TN the number of incorrect and correct ‘‘Not fund’’ recommen-
dations respectively made by an expert, compared with the actual funding outcomes. The
Expert 1 Expert K... Weights &Reliabilities
The ER rule
Subcriterion 1 Subcriterion L...Weights
The ER rule
R&D project evaluation
Ranking and selectionresults
Utilities
Optimallearning
Fig. 2 Hierarchical structural model for the proposed approach
1508 Scientometrics (2017) 111:1501–1519
123
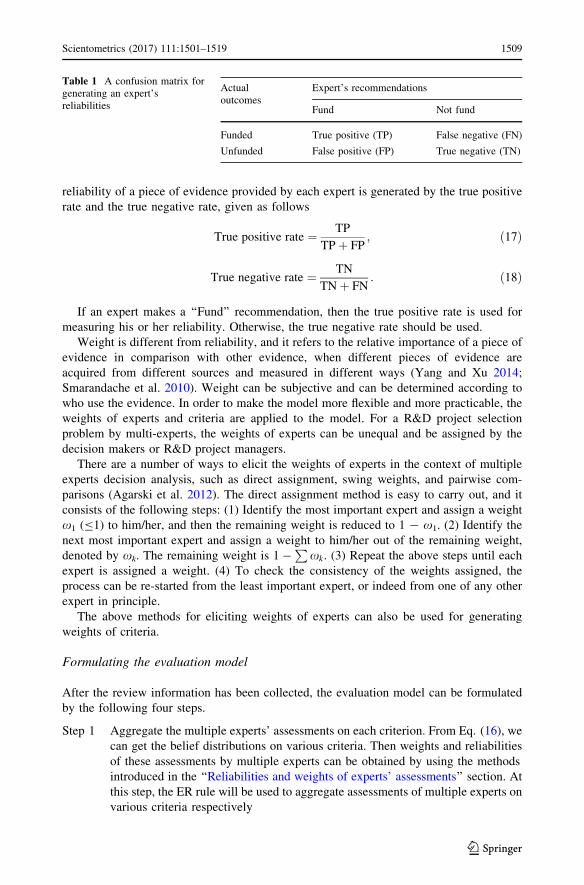
reliability of a piece of evidence provided by each expert is generated by the true positive
rate and the true negative rate, given as follows
True positive rate ¼ TP
TP þ FP; ð17Þ
True negative rate ¼ TN
TN þ FN: ð18Þ
If an expert makes a ‘‘Fund’’ recommendation, then the true positive rate is used for
measuring his or her reliability. Otherwise, the true negative rate should be used.
Weight is different from reliability, and it refers to the relative importance of a piece of
evidence in comparison with other evidence, when different pieces of evidence are
acquired from different sources and measured in different ways (Yang and Xu 2014;
Smarandache et al. 2010). Weight can be subjective and can be determined according to
who use the evidence. In order to make the model more flexible and more practicable, the
weights of experts and criteria are applied to the model. For a R&D project selection
problem by multi-experts, the weights of experts can be unequal and be assigned by the
decision makers or R&D project managers.
There are a number of ways to elicit the weights of experts in the context of multiple
experts decision analysis, such as direct assignment, swing weights, and pairwise com-
parisons (Agarski et al. 2012). The direct assignment method is easy to carry out, and it
consists of the following steps: (1) Identify the most important expert and assign a weight
x1 (B1) to him/her, and then the remaining weight is reduced to 1 - x1. (2) Identify the
next most important expert and assign a weight to him/her out of the remaining weight,
denoted by xk. The remaining weight is 1 �P
xk. (3) Repeat the above steps until each
expert is assigned a weight. (4) To check the consistency of the weights assigned, the
process can be re-started from the least important expert, or indeed from one of any other
expert in principle.
The above methods for eliciting weights of experts can also be used for generating
weights of criteria.
Formulating the evaluation model
After the review information has been collected, the evaluation model can be formulated
by the following four steps.
Step 1 Aggregate the multiple experts’ assessments on each criterion. From Eq. (16), we
can get the belief distributions on various criteria. Then weights and reliabilities
of these assessments by multiple experts can be obtained by using the methods
introduced in the ‘‘Reliabilities and weights of experts’ assessments’’ section. At
this step, the ER rule will be used to aggregate assessments of multiple experts on
various criteria respectively
Table 1 A confusion matrix forgenerating an expert’sreliabilities
Actualoutcomes
Expert’s recommendations
Fund Not fund
Funded True positive (TP) False negative (FN)
Unfunded False positive (FP) True negative (TN)
Scientometrics (2017) 111:1501–1519 1509
123
Step 2 Transform assessments on different criteria. Different sets of evaluation grades
are usually used to assess different qualitative criteria in real decision
environments. In order to get the overall performance of each project in terms of
its expected utility or value, the original assessments presented by belief
distributions over different frames of discernment need to be transformed to
distributions over a common frame of discernment. When utilities can be
estimated explicitly, a utility based information transformation technique can be
applied to implement the transformation process (Yang 2001). At this step, the
transformed information can be obtained by using the technique outlined in the
‘‘Utility based information transformation’’ section. It should be noticed that
utilities assigned to evaluation grades are parts of the parameters to be trained by
the optimal learning model described in the following sections
Step 3 Aggregate project performance information on multiple criteria. At this step, the
ER rule is used again to aggregate project performance on multiple criteria. The
direct assignment method can be used for generating initial criteria weights. Then
the following optimal learning model treats the weights as parameters to be
trained. As the information used in this step is generated by the previous steps,
the reliability of each piece of information (or evidence) is not taken into account
in the later aggregation and then the aggregation can be conducted by using the
ER approach (Yang and Xu 2002). Suppose that pn is the combined degrees of
belief to support hn. The overall performance of a project am can be described by
the following belief distribution
S y amð Þð Þ ¼ Hj; pj
� �; j ¼ 1; 2; . . .N
� �ð19Þ
Step 4 Calculate overall expected utilities for projects. The overall expected utility u for
a project can be used to represent the overall performance of a project, which is
calculated as follows
u ¼XN
j¼1
u Hj
� �pj ð20Þ
The generated utilities are then used to rank the projects. The ranking list can be used to
determine the threshold for funding in the optimal learning model and also can be used for
project selection in the final decision making process.
Optimal learning for improving selection consistency
Through the above analysis, we can aggregate review information and obtain a ranking list
of R&D projects. For past R&D projects, expert review information and actual funding
decisions about those projects are known and available. Such historical information can be
very useful to fine tune the parameter in the proposed approach so that the funding
decisions generated by using the approach can be as consistent as possible with the actual
results. To improve the consistency, the parameters, including weights of assessment
criteria and utilities of assessment grades, can be adjusted using the following optimal
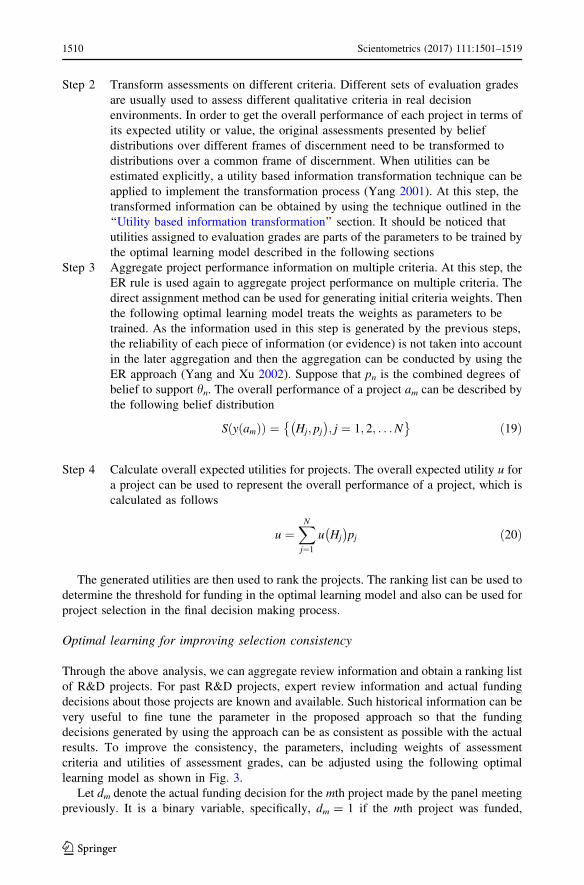
learning model as shown in Fig. 3.
Let dm denote the actual funding decision for the mth project made by the panel meeting
previously. It is a binary variable, specifically, dm = 1 if the mth project was funded,
1510 Scientometrics (2017) 111:1501–1519
123

dm = 0 otherwise. In the proposed approach, a threshold utility uThr needs to be decided.
uThr is the utility of the (A ? 1)th project, where A represents the funding number of
projects in the data set. A project with a utility above the threshold is supposed to be
funded. Thus, the optimisation objective is to maximise the number of projects which are
recommended for funding by the proposed approach and are actual funded, and the fol-
lowing optimal learning model can be formulated:
MaxXM
m¼1
sign dm um � uThr� �� �
ð21Þ
s.t.
PL
i
wi ¼ 1
u Hn;i
� �\u Hn;iþ1
� �
u Hj
� �\u Hjþ1
� �
0�wi � 1; i ¼ 1; . . .; L0� u Hn;i
� �� 1
0� u Hj
� �� 1 j ¼ 1; . . .;Nð Þ
8>>>>>>>><
>>>>>>>>:
ð22Þ
This nonlinear optimisation model contains L variables for the L criteria weights and
N þPL
i Ni variables for the utilities of evaluation grades. This optimal learning model can
be solved by fmincon function in the MATLAB optimisation toolbox.
After the calculation of training weights of criteria and training utilities assigned to
evaluation grades, the procedure of assessments transformation, information aggregation of
criteria and the overall expected utility calculation should be run one more time to rank and
select projects.
A case study of the National Science Foundation of China
Problem description
China as a rising power in academic research has attracted global interests (Liu et al.
2015a, b). The National Science Foundation of China (NSFC) is a main funding body for
supporting fundamental research in China and its core function and task is R&D project
selection. The project selection process often includes several steps, and the main steps
include project submission, preliminary screening, peer review, aggregation of review
results, panel review and final decision.
Real system Funding outcomes
ER rule based model Inference output
Training variables( , , )
Training of ER rule based model
-
Fig. 3 The training model of the ER rule based approach
Scientometrics (2017) 111:1501–1519 1511
123

In the peer review step, three to five experts are chosen from the database of experts
working in the same or relevant fields to assess projects on two criteria, namely ‘‘Com-
prehensive evaluation level’’ and ‘‘Funding recommendation’’. The first criterion is mea-
sured by four grades: poor, average, good and excellent, and the second criterion is
assessed by a three-point scale: not fund, fund, and fund with priority.
After peer review, the NSFC simply adopts an additive approach to aggregate the
assessments on the two criteria by multiple experts. Taking the Management Sciences
department of the NSFC for example, the values of 1, 2, 3 and 4 are assigned to the four
grades of the first criterion, and the values of 0, 1, and 2 to the three grades of the second
criterion respectively. Then the average scores from all experts on the two criteria are
calculated and the sum of the average scores is used for categorizing the projects into six
categories: A, A–, B, C, D and E. Generally, A: C4.8, A–: C4.6, B: C4.0, E: C3.8, meaning
that projects in the A category have a score of 4.8 or above and so on. Projects within the
above four categories will be reviewed further in the next panel review step. The rest two
categories C and D represent projects within are not eligible for panel review and projects
within are for direct rejection respectively. This initial categorization provides basic
support for panel review. The above R&D project selection method is simple and has been
applied for years in the NSFC.
Illustration of the proposed approach for the NSFC project evaluation
In this section, the review information of a research project is used to illustrate the pro-
posed approach. The evaluation criteria are: comprehensive evaluation level (C1) and
funding recommendation (C2). Two sets of evaluation grades, H:,1 = {excel-
lent, good, average, poor} = {H4,1, H3,1, H2,1, H1,1} and H:,2 = {fund with prior-
ity, fund, not fund} = {H3,2, H2,2, H1,2}, are used to assess the two basic evaluation
criteria.
In this paper, only the projects reviewed by five reviewers (i.e., K = 5) are chosen and
the data set contains 1225 projects, of which 210 are funded and 1015 unfunded. For
example, one of the projects is evaluated by five experts Ek (k = 1, 2, 3, 4, 5), as shown in
Table 2.
In Table 2, reliability of each expert is calculated by using the method proposed in the
‘‘Reliabilities and weights of experts’ assessments’’ section and historical review infor-
mation. For experts who have not evaluated any projects previously, the average relia-
bilities can be used for replacing the missing value. Weights of experts are determined by
Table 2 Original assessments of project and the reliability and weight of experts
Experts Criteria (weight of criterion) Reliability Weight of expert
C1 (0.6667) C2 (weight 0.3333)
E1 H4,1 H2,2 0.25 0.2
E2 H2,1 H1,2 1 0.2
E3 H4,1 H2,2 0.375 0.2
E4 H3,1 H2,2 0.3333 0.2
E5 H4,1 H3,2 0.4286 0.2
1512 Scientometrics (2017) 111:1501–1519
123
using the direct assignment method. In this application, weights of all the experts are 0.2.
The ER rule is used to aggregate the assessments of individual experts on each criterion
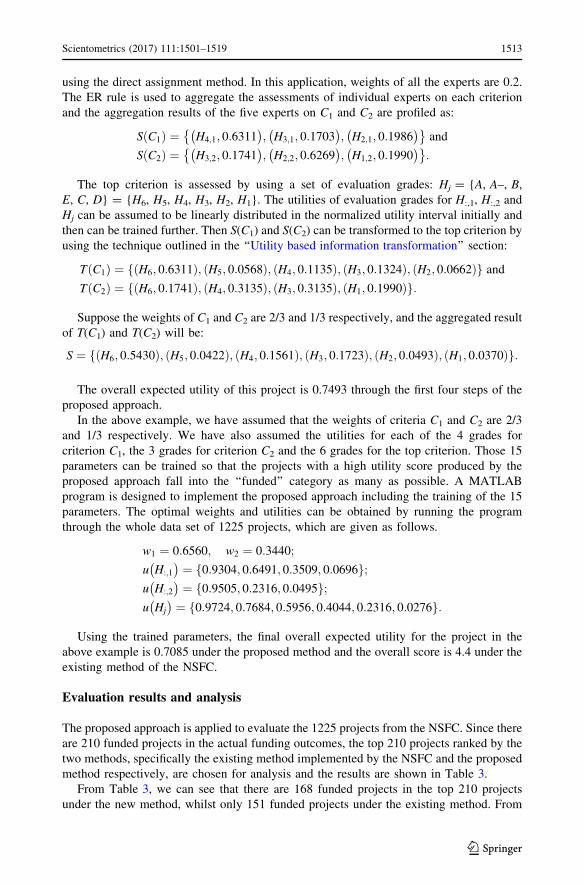
and the aggregation results of the five experts on C1 and C2 are profiled as:
S C1ð Þ ¼ H4;1; 0:6311� �
; H3;1; 0:1703� �
; H2;1; 0:1986� �� �
and
S C2ð Þ ¼ H3;2; 0:1741� �
; H2;2; 0:6269� �
; H1;2; 0:1990� �� �
:
The top criterion is assessed by using a set of evaluation grades: Hj = {A, A–, B,
E, C, D} = {H6, H5, H4, H3, H2, H1}. The utilities of evaluation grades for H:,1, H:,2 and
Hj can be assumed to be linearly distributed in the normalized utility interval initially and
then can be trained further. Then S(C1) and S(C2) can be transformed to the top criterion by
using the technique outlined in the ‘‘Utility based information transformation’’ section:
T C1ð Þ ¼ H6; 0:6311ð Þ; H5; 0:0568ð Þ; H4; 0:1135ð Þ; H3; 0:1324ð Þ; H2; 0:0662ð Þf g and
T C2ð Þ ¼ H6; 0:1741ð Þ; H4; 0:3135ð Þ; H3; 0:3135ð Þ; H1; 0:1990ð Þf g:
Suppose the weights of C1 and C2 are 2/3 and 1/3 respectively, and the aggregated result
of T(C1) and T(C2) will be:
S ¼ H6; 0:5430ð Þ; H5; 0:0422ð Þ; H4; 0:1561ð Þ; H3; 0:1723ð Þ; H2; 0:0493ð Þ; H1; 0:0370ð Þf g:
The overall expected utility of this project is 0.7493 through the first four steps of the
proposed approach.
In the above example, we have assumed that the weights of criteria C1 and C2 are 2/3
and 1/3 respectively. We have also assumed the utilities for each of the 4 grades for
criterion C1, the 3 grades for criterion C2 and the 6 grades for the top criterion. Those 15
parameters can be trained so that the projects with a high utility score produced by the
proposed approach fall into the ‘‘funded’’ category as many as possible. A MATLAB
program is designed to implement the proposed approach including the training of the 15
parameters. The optimal weights and utilities can be obtained by running the program
through the whole data set of 1225 projects, which are given as follows.
w1 ¼ 0:6560; w2 ¼ 0:3440;
u H:;1
� �¼ 0:9304; 0:6491; 0:3509; 0:0696f g;
u H:;2
� �¼ 0:9505; 0:2316; 0:0495f g;
u Hj
� �¼ 0:9724; 0:7684; 0:5956; 0:4044; 0:2316; 0:0276f g:
Using the trained parameters, the final overall expected utility for the project in the
above example is 0.7085 under the proposed method and the overall score is 4.4 under the
existing method of the NSFC.
Evaluation results and analysis
The proposed approach is applied to evaluate the 1225 projects from the NSFC. Since there
are 210 funded projects in the actual funding outcomes, the top 210 projects ranked by the
two methods, specifically the existing method implemented by the NSFC and the proposed
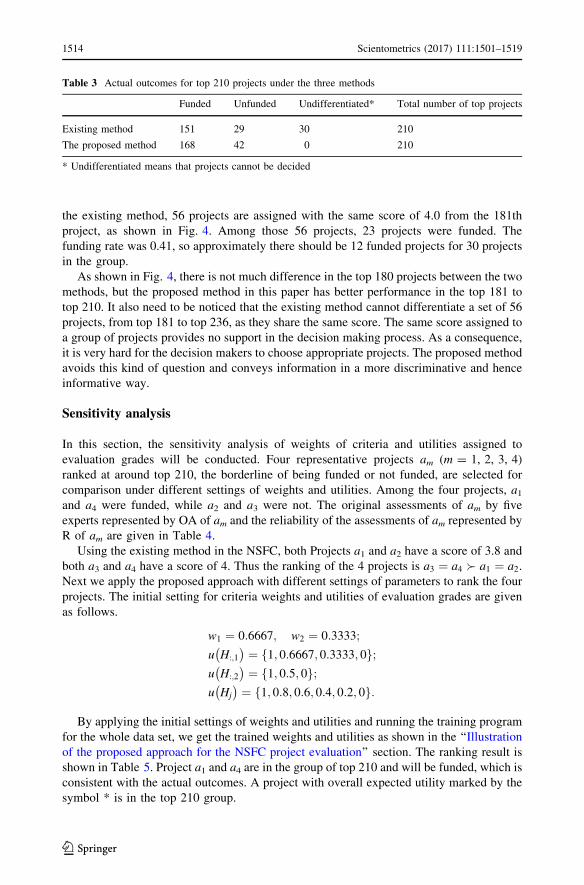
method respectively, are chosen for analysis and the results are shown in Table 3.
From Table 3, we can see that there are 168 funded projects in the top 210 projects
under the new method, whilst only 151 funded projects under the existing method. From
Scientometrics (2017) 111:1501–1519 1513
123
the existing method, 56 projects are assigned with the same score of 4.0 from the 181th
project, as shown in Fig. 4. Among those 56 projects, 23 projects were funded. The
funding rate was 0.41, so approximately there should be 12 funded projects for 30 projects
in the group.
As shown in Fig. 4, there is not much difference in the top 180 projects between the two
methods, but the proposed method in this paper has better performance in the top 181 to
top 210. It also need to be noticed that the existing method cannot differentiate a set of 56
projects, from top 181 to top 236, as they share the same score. The same score assigned to
a group of projects provides no support in the decision making process. As a consequence,
it is very hard for the decision makers to choose appropriate projects. The proposed method
avoids this kind of question and conveys information in a more discriminative and hence
informative way.
Sensitivity analysis
In this section, the sensitivity analysis of weights of criteria and utilities assigned to
evaluation grades will be conducted. Four representative projects am (m = 1, 2, 3, 4)
ranked at around top 210, the borderline of being funded or not funded, are selected for
comparison under different settings of weights and utilities. Among the four projects, a1
and a4 were funded, while a2 and a3 were not. The original assessments of am by five
experts represented by OA of am and the reliability of the assessments of am represented by
R of am are given in Table 4.
Using the existing method in the NSFC, both Projects a1 and a2 have a score of 3.8 and
both a3 and a4 have a score of 4. Thus the ranking of the 4 projects is a3 ¼ a4 � a1 ¼ a2.
Next we apply the proposed approach with different settings of parameters to rank the four
projects. The initial setting for criteria weights and utilities of evaluation grades are given
as follows.
w1 ¼ 0:6667; w2 ¼ 0:3333;
u H:;1
� �¼ 1; 0:6667; 0:3333; 0f g;
u H:;2
� �¼ 1; 0:5; 0f g;
u Hj
� �¼ 1; 0:8; 0:6; 0:4; 0:2; 0f g:
By applying the initial settings of weights and utilities and running the training program
for the whole data set, we get the trained weights and utilities as shown in the ‘‘Illustration
of the proposed approach for the NSFC project evaluation’’ section. The ranking result is
shown in Table 5. Project a1 and a4 are in the group of top 210 and will be funded, which is
consistent with the actual outcomes. A project with overall expected utility marked by the
symbol * is in the top 210 group.
Table 3 Actual outcomes for top 210 projects under the three methods
Funded Unfunded Undifferentiated* Total number of top projects
Existing method 151 29 30 210
The proposed method 168 42 0 210
* Undifferentiated means that projects cannot be decided
1514 Scientometrics (2017) 111:1501–1519
123

From Table 5, we can see that the overall expected utilities of the four projects are not
equal. It means that projects are differentiated successfully with the proposed approach.
Comparing the ranking result of the existing method in the NSFC, we can also find out that
the proposed approach keeps a high consistency with the actual outcomes.
Sensitivity analysis of weights
The criteria weights calculated using the optimal learning model reflects the true contri-
butions of the criteria to the funding decisions based on historical data. In this sensitivity
analysis, the initial weights generated by using the direct assignment method and the
trained utilities of evaluation grades are used to calculate the overall expected utilities of
the 4 projects. The initial settings of weights and the evaluation grades’ utilities generated
by training are as follows.
151
153
29
27
56
15 15 7 19
36
35
0 30 60 90 120 150 180 210 240 270
The exis�ng method
The proposed method
Funded/No.1-180 Unfunded/No.1-180
Undifferen�ated/No.181-236 Funded/No.181-210
Unfunded/No.181-210 Funded/No.211-236
Unfunded/No.211-236 Funded/No.237-1225
Fig. 4 Comparison of actual funding outcomes and selection generated by the two methods
Table 4 Original review information and the corresponding reliabilities of the four projects
Experts OA of a1 R of a1 OA of a2 R of a2 OA of a3 R of a3 OA of a4 R of a4
E1 H4,1, H2,2 0.2726 H4,1, H2,2 0.1875 H4,1, H3,2 0.2726 H4,1, H3,2 0.5000
E2 H3,1, H1,2 0.9592 H3,1, H1,2 1.0000 H4,1, H3,2 0.5000 H2,1, H2,2 0.2726
E3 H4,1, H2,2 0.2726 H4,1, H3,2 0.3000 H2,1, H1,2 0.9592 H3,1, H2,2 0.2726
E4 H2,1, H1,2 1.0000 H2,1, H1,2 0.9592 H2,1, H1,2 0.9592 H3,1, H1,2 0.9592
E5 H3,1, H2,2 0.1667 H3,1, H1,2 0.9592 H3,1, H2,2 0.3333 H3,1, H2,2 0.5000
Table 5 Ranking result of expected project utilities using the trained weights and trained utilities in theproposed method
Overall expected utility Ranking result
a1 0.6084* a4 � a1 � a2 � a3
a2 0.6047
a3 0.6049
a4 0.6138*
* The project is in the top 210 group and will be funded
Scientometrics (2017) 111:1501–1519 1515
123

w1 ¼ 0:6667; w2 ¼ 0:3333;
u H:;1
� �¼ 0:9304; 0:6491; 0:3509; 0:0696f g;
u H:;2
� �¼ 0:9505; 0:2316; 0:0495f g;
u Hj
� �¼ 0:9724; 0:7684; 0:5956; 0:4044; 0:2316; 0:0276f g:
The ranking result under the initial weights and trained utilities can be obtained by
running the MATLAB program, which is shown in Table 6.
The ranking result in Table 6 is the same as that in Table 5. However, using the initial
weights and the trained utilities, the proposed approach ranks Project a2 within the top 210
projects while in Table 5 Project a2 is ranked outside the top 210. This means that Project
a2 is wrong classified into the ‘‘funded’’ category by the approach when initial weights are
used. The example shows that it is important to train the criteria weights to construct a
model to support the decision making process.
Sensitivity analysis of utilities assigned to evaluation grades
In this section, the trained criteria weights and the utilities initially assigned to evaluation
grades are used to generate the overall expected utilities of each project. The result is then
compared with that shown in Table 5 in which both trained weights and trained utilities are
used. The parameters in this sensitivity analysis are as follows.
w1 ¼ 0:6560; w2 ¼ 0:3440;
u H:;1
� �¼ 1; 0:6667; 0:3333; 0f g;
u H:;2
� �¼ 1; 0:5; 0f g;
u Hj
� �¼ 1; 0:8; 0:6; 0:4; 0:2; 0f g:
With the above weights and utilities, we can calculate the overall utilities of the four
projects. The ranking result is shown in Table 7.
It is observed that Project a4 is ranked the first among the four projects no matter
whether the ranking is based on the trained parameters or their initial settings, Project a3 is
ranked the worst among the four projects based on the trained utilities, while Project a2 is
ranked the worst based on the initial utilities. Another observation is that in Table 7 the
Table 6 Ranking result usingthe initial weights and trainedutilities
* The project is in the top 210group and will be funded
Overall expected utility Ranking result
a1 0.6142* a4 � a1 � a2 � a3
a2 0.6112*
a3 0.6068
a4 0.6161*
Table 7 Ranking result usingthe trained weights and initialutilities
* The project is in the top 210group and will be funded
Overall expected utility Ranking result
a1 0.6274* a4 � a3 � a1 � a2
a2 0.6252*
a3 0.6285*
a4 0.6304*
1516 Scientometrics (2017) 111:1501–1519
123

four projects are all in the top 210 group, which is not consistent with the actual funding
outcomes or the result based on the trained utilities. A conclusion can be drawn that the
ranking result of the four projects may change when the criteria weights and the utilities of
evaluation grades are changed.
Conclusion
An ER rule based model is proposed for R&D project evaluation and selection using multi-
expert judgements on multiple criteria. A nonlinear optimal learning model is also pro-
posed. In this approach, historical data can be used to train the weights of criteria and the
utilities assigned to evaluation grades. Experts’ reliabilities can also be calculated by using
historical data. The new approach provides a flexible way to represent and a rigorous
procedure to deal with project evaluation information for supporting funding decision
making. The results generated from a series of case studies on the NSFC have demon-
strated that the proposed approach can provide decision makers with an informative tool
that can be used in project evaluation processes with multi-experts and multi-criteria. The
sensitivity analysis of the weights of criteria and utilities assigned to evaluation grades is
also conducted. In conclusion, the proposed approach has shown a better performance than
the existing method in supporting the decision making of R&D project evaluation and
selection, especially with multiple experts and multiple criteria. Moreover, it provides
effectiveness and flexibility for learning parameters in the evaluation framework.
In this paper, weights of all the experts are assumed to be equal according to the current
states of the NSFC, which may not reflect the true effect of experts. Thus the relative
importance of expert needs to be studied further, such as utilizing self-confidence or the
degree of familiarity to measure the weights. In addition, the reliabilities of experts who
have not evaluated any projects previously are replaced by the average reliabilities. In
further research, the knowledge background, expertise and judgment capabilities of experts
can be taken into account to generate more reasonable results. In practice, based on the
long-term accumulations of historical data, we can obtain more reliable calculation results
of reliability. And the study of reliabilities provides the important referential value for the
improvement on the rationality of expert assignment. Overall, the approach described
provides a supplement to concepts and methods already in use for project evaluation and
selection in the NSFC and provides a new way for governmental organizations and
companies to conduct project evaluation and selection decision making.
Acknowledgements This research is partially supported by the National Natural Science Foundation ofChina under Grant No. 71071048 and 71601060 and the Scholarship from China Scholarship Council underGrant No. 201306230047.
References
Agarski, B., Budak, I., Kosec, B., & Hodolic, J. (2012). An approach to multi-criteria environmentalevaluation with multiple weight assignment. Environmental Modeling & Assessment, 17(3), 255–266.
Amiri, M. P. (2010). Project selection for oil-fields development by using the AHP and fuzzy TOPSISmethods. Expert Systems with Applications, 37(9), 6218–6224.
Baker, N., & Freeland, J. (1975). Recent advances in R&D benefit measurement and project selectionmethods. Management Science, 21(10), 1164–1175.
Scientometrics (2017) 111:1501–1519 1517
123

Bornmann, L. (2011). Scientific peer review. Annual Review of Information Science and Technology, 45(1),197–245.
Chiang, T. A., & Che, Z. H. (2010). A fuzzy robust evaluation model for selecting and ranking NPD projectsusing Bayesian belief network and weight-restricted DEA. Expert Systems with Applications, 37(11),7408–7418.
Collan, M., & Luukka, P. (2014). Evaluating R&D projects as investments by using an overall ranking fromfour new fuzzy similarity measure-based TOPSIS variants. IEEE Transactions on Fuzzy Systems,22(3), 505–515.
Dempster, A. P. (1967). Upper and lower probabilities induced by a multivalued mapping. The Annals ofMathematical Statistics, 38, 325–339.
Feng, B., Ma, J., & Fan, Z. P. (2011). An integrated method for collaborative R&D project selection:Supporting innovative research teams. Expert Systems with Applications, 38(5), 5532–5543.
Heidenberger, K., & Stummer, C. (1999). Research and development project selection and resource allo-cation: A review of quantitative modelling approaches. International Journal of Management Reviews,1(2), 197–224.
Henriksen, A. D., & Traynor, A. J. (1999). A practical R&D project-selection scoring tool. IEEE Trans-actions on Engineering Management, 46(2), 158–170.
Hsu, Y. G., Tzeng, G. H., & Shyu, J. Z. (2003). Fuzzy multiple criteria selection of government-sponsoredfrontier technology R&D projects. R&D Management, 33(5), 539–551.
Huang, C. C., Chu, P. Y., & Chiang, Y. H. (2008). A fuzzy AHP application in government-sponsored R&Dproject selection. Omega, 36(6), 1038–1052.
Jackson, B. (1983). Decision methods for selecting a portfolio of R&D projects. Research Management,26(5), 21–26.
Jung, U., & Seo, D. W. (2010). An ANP approach for R&D project evaluation based on interdependenciesbetween research objectives and evaluation criteria. Decision Support Systems, 49(3), 335–342.
Juznic, P., Peclin, S., Zaucer, M., Mandelj, T., Pusnik, M., & Demsar, F. (2010). Scientometric indicators:Peer-review, bibliometric methods and conflict of interests. Scientometrics, 85(2), 429–441.
Lee, C. J., Sugimoto, C. R., Zhang, G., & Cronin, B. (2013). Bias in peer review. Journal of the AmericanSociety for Information Science and Technology, 64(1), 2–17.
Liu, W., Hu, G., Tang, L., & Wang, Y. (2015a). China’s global growth in social science research:Uncovering evidence from bibliometric analyses of SSCI publications (1978–2013). Journal ofInformetrics, 9(3), 555–569.
Liu, W., Tang, L., Gu, M., & Hu, G. (2015b). Feature report on China: A bibliometric analysis of China-related articles. Scientometrics, 102(1), 503–517.
Liu, X. B., Pei, F., Yang, J. B., & Yang, S. L. (2010). An MAGDM approach combining numerical valueswith uncertain linguistic information and its application in evaluation of R&D projects. InternationalJournal of Computational Intelligence Systems, 3(5), 575–589.
Mahmoodzadeh, S., Shahrabi, J., Pariazar, M., & Zaeri, M. S. (2007). Project selection by using fuzzy AHPand TOPSIS technique. International Journal of Human and social sciences, 1(3), 135–140.
Meade, L. M., & Presley, A. (2002). R&D project selection using the analytic network process. IEEETransactions on Engineering Management, 49(1), 59–66.
Poh, K. L., Ang, B. W., & Bai, F. (2001). A comparative analysis of R&D project evaluation methods. R&DManagement, 31(1), 63–75.
Provost, F., & Kohavi, R. (1998). Guest editors’ introduction: On applied research in machine learning.Machine Learning, 30(2), 127–132.
Saaty, T. L. (1980). The analytic hierarchy process: Planning, priority setting, resources allocation. NewYork: McGraw.
Schmidt, R. L., & Freeland, J. R. (1992). Recent progress in modeling R&D project-selection processes.IEEE Transactions on Engineering Management, 39(2), 189–201.
Shafer, G. (1976). A mathematical theory of evidence (Vol. 1). Princeton: Princeton University Press.Smarandache, F., Dezert, J., & Tacnet, J. M. (2010). Fusion of sources of evidence with different impor-
tances and reliabilities. In 2010 13th Conference on information fusion (FUSION) (pp. 1–8). IEEE.Taroun, A., & Yang, J. B. (2011). Dempster–Shafer theory of evidence: Potential usage for decision making
and risk analysis in construction project management. The Built & Human Environment Review,4(Special Issue 1), 155–166.
Tian, Q., Ma, J., Liang, J., Kwok, R. C., & Liu, O. (2005). An organizational decision support system foreffective R&D project selection. Decision Support Systems, 39(3), 403–413.
van Raan, A. (1996). Advanced bibliometric methods as quantitative core of peer review based evaluationand foresight exercises. Scientometrics, 36(3), 397–420.
Wessely, S. (1998). Peer review of grant applications: What do we know? The Lancet, 352, 301–305.
1518 Scientometrics (2017) 111:1501–1519
123

Xiao, Z., Yang, X., Pang, Y., & Dang, X. (2012). The prediction for listed companies’ financial distress byusing multiple prediction methods with rough set and Dempster–Shafer evidence theory. Knowledge-Based Systems, 26, 196–206.
Xu, D. L. (2012). An introduction and survey of the evidential reasoning approach for multiple criteriadecision analysis. Annals of Operations Research, 195(1), 163–187.
Yang, J. B. (2001). Rule and utility based evidential reasoning approach for multiattribute decision analysisunder uncertainties. European Journal of Operational Research, 131(1), 31–61.
Yang, J. B., & Singh, M. G. (1994). An evidential reasoning approach for multiple-attribute decision makingwith uncertainty. IEEE Transactions on Systems, Man, and Cybernetics, 24(1), 1–18.
Yang, J. B., & Xu, D. L. (2002). On the evidential reasoning algorithm for multiple attribute decisionanalysis under uncertainty. IEEE Transactions on Systems, Man, and Cybernetics-Part A: Systems andHumans, 32(3), 289–304.
Yang, J. B., & Xu, D. L. (2013). Evidential reasoning rule for evidence combination. Artificial Intelligence,205, 1–29.
Yang, J. B., & Xu, D. L. (2014). A study on generalising Bayesian inference to evidential reasoning. InInternational conference on belief functions (pp. 180–189). Springer.
Zhu, W. D., Liu, F., Chen, Y. W., Yang, J. B., Xu, D. L., & Wang, D. P. (2015). Research project evaluationand selection: An evidential reasoning rule-based method for aggregating peer review information withreliabilities. Scientometrics, 105(3), 1469–1490.
Scientometrics (2017) 111:1501–1519 1519
123