evaluation of vulnerability of critical … · seismic condition and vulnerability of the building...
TRANSCRIPT
EVALUATION OF VULNERABILITY OF CRITICAL INFRASTRUCTURES DUE TO
EARTHQUAKE IN SYLHET CITY
Presented By
Dr. Md. Jahir Bin Alam

Introduction
Bangladesh National Building Code (1993) has placed Sylhet (Latitude: 24.85ºN, Longitude: 91.80ºE) in seismic zone 3, the zone of high seismicity. All the major earthquakes having its epicenter inside Bangladesh made the active faults in the region. One of these kinds of active faults is Shazibazar-Lalmai fault from Hobigonj to Comilla. The potential hazardous scenario for Sylhet city has been developed based on the seismic condition and vulnerability of the building stock, especially for the critical infrastructures such as schools, hospitals and fire station.

Rapid Visual Screening (RVS)
To measure the fact that how prone the buildings are to seismic force, the entire procedure was conducted based on FEMA 154 Report-Rapid Visual Screening (RVS) of Buildings for Potential Seismic Hazards. RVS provides information on the average behavior of different types of structures.

Objectives
To conduct a data collection and evaluation process
to document building location, size, use and
vulnerability factors
Conduction of “sidewalk survey” that enabled users
to classify surveyed buildings

Study Area
The buildings of High Schools, Primary
Schools, Hospitals and Clinics, and Fire
Station under the city of Sylhet are selected.
232 buildings are surveyed in this study.

Sylhet City
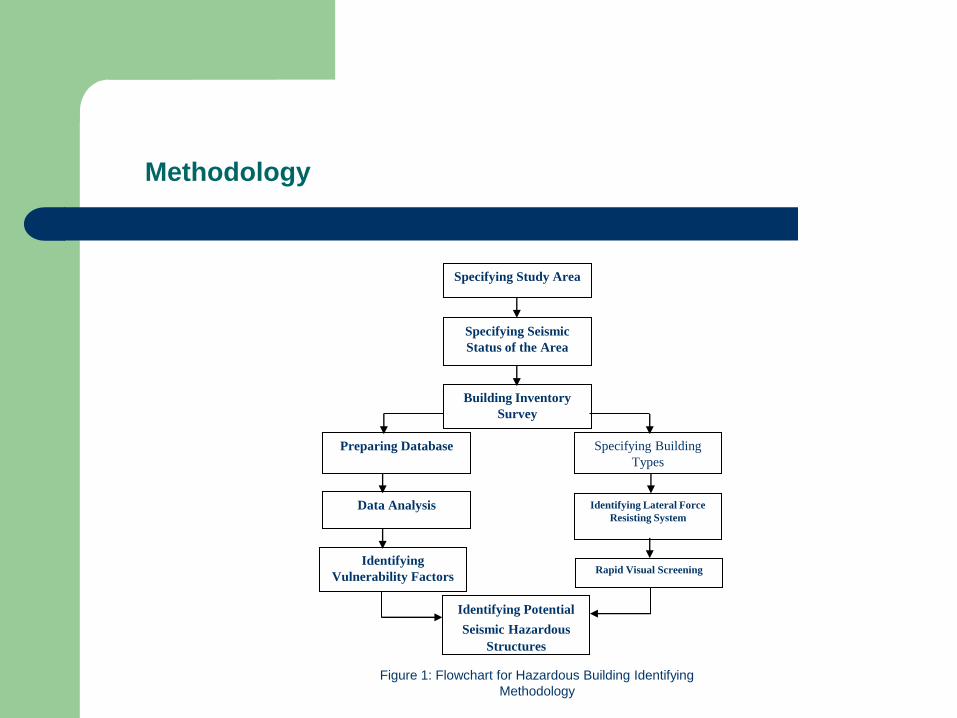
Methodology
Specifying Study Area
Specifying Seismic
Status of the Area
Building Inventory
Survey
Specifying Building
Types
Preparing Database
Identifying Lateral Force
Resisting System Data Analysis
Rapid Visual Screening Identifying
Vulnerability Factors
Identifying Potential
Seismic Hazardous Structures
Figure 1: Flowchart for Hazardous Building Identifying
Methodology

Building Types Considered by the RVS Procedure
The sample sites survey helped to classify all buildings in Sylhet into six types, EMSA, EMSB1, EMSB2, EMSC, EMSD and EMSF, based on their definition in European Macro-seismic Scale (Grunthal, 1998).
According to description of Macro-seismic Scale and FEMA 154, the similarity of lateral-load-resisting system exists only EMSB2, EMSC, and EMSD similar to URM, C2 and C3. In Sylhet there are a number of old buildings, which are of unique and completely different types of force resisting system & in structural pattern.

Identification of Building
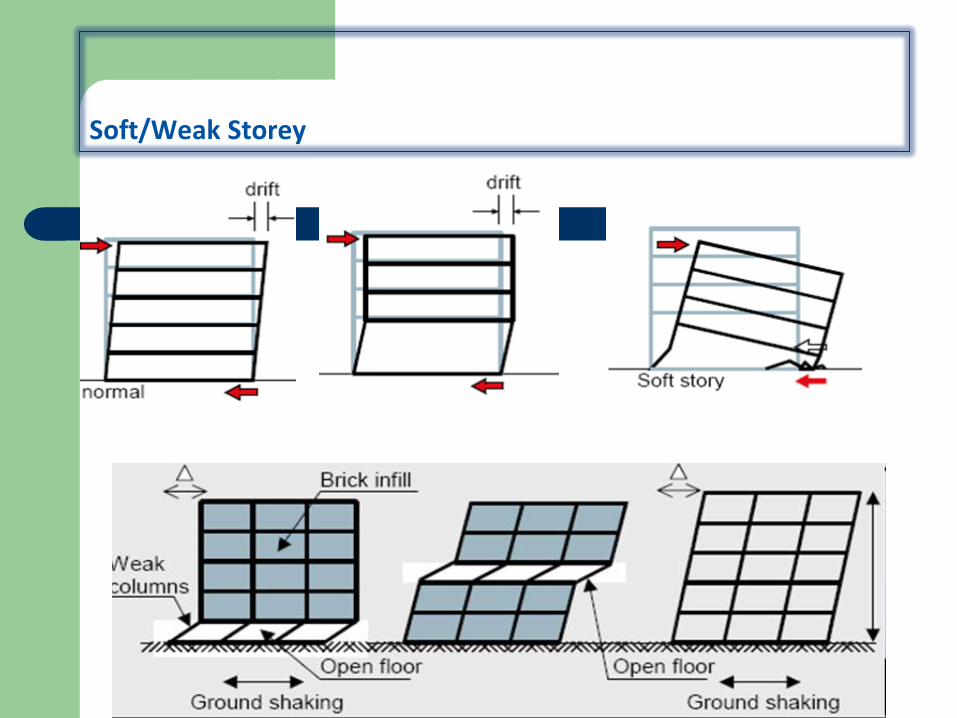
Soft/Weak Storey

Soft/Weak First Storey

Heavy overhang
Heavy Overhang or cantilever

Pounding

Short Column Effect

Shape in Building Plan

Shape in Building Plan
Setback
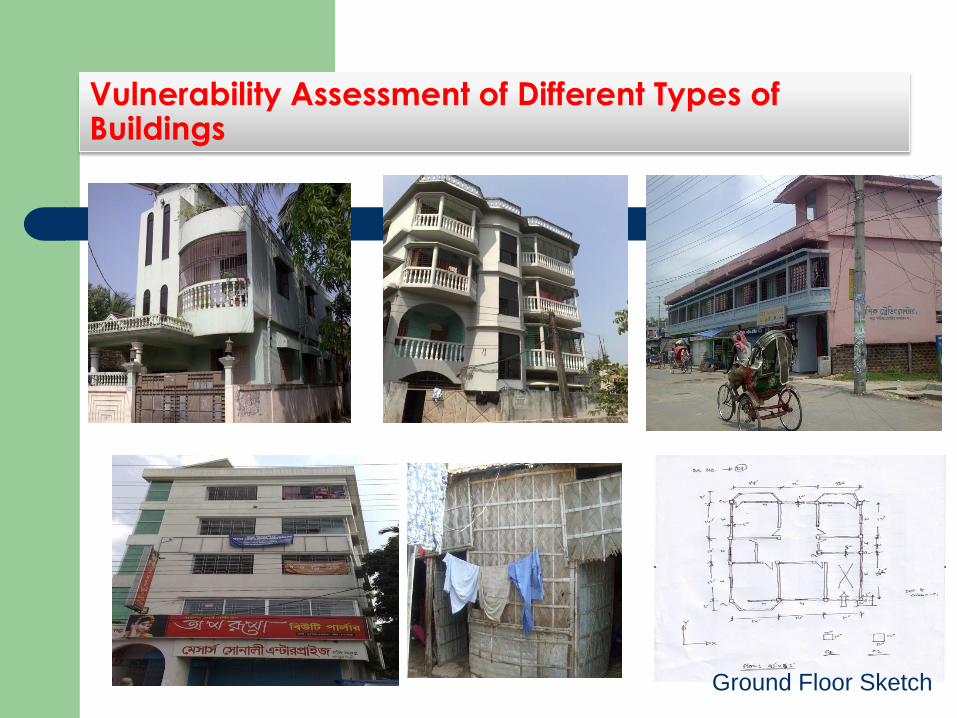
Vulnerability Assessment of Different Types of Buildings
Ground Floor Sketch

Different Types of Buildings
Soil type
Soil type were identified and documented on
the data collection form. For Sylhet, we have
selected the soil types C, D, and E for
different geographical locations based on soil
intensity.

Liquefaction potential map and soil hazards map for Sylhet City

Distribution of Building Scores
Score Primary School High School Hospital Total
Bldg No % Bldg No % Bldg No % Bldg No %
<0 2 2.86 0 13 23.21 15 6.47
0-1 9 12.86 5 4.72 21 37.50 35 15.09
1-2 42 60.00 57 53.77 6 10.71 105 45.26
>=2 3 5.36 3 1.29
No
scoring
17 24.29 44 41.51 13 23.21 74 31.90
Total 70 30.17 106 45.69 56 24.14 232

Distribution of Lateral Force Resisting System
Type Primary School High School Hospital Total
Bldg No % Bldg No % Bldg No % Bldg No %
URM 5 7.14 16 15.09 12 21.43 33 14.22
C3 46 68.57 50 47.17 30 53.57 128 55.17
C2 5 8.93 5 2.16
Other 17 24.29 40 37.74 9 16.07 66 28.45
Total 70 30.17 106 45.69% 56 24.14 232

Distribution of Building types
Type Primary School High School Hospital Total
Bldg No % Bldg No % Bldg No % Bldg No %
EMSB1 28 40 49 46.23 11 19.64 88 37.93
EMSB2 5 7.14 16 15.09 12 21.43 33 14.22
EMSC 37 52.86 29 27.36 5 8.93 71 30.60
EMSD 12 11.32 26 46.43 38 16.38
EMSF 2 3.57 2 0.86
Total 70 30.17 106 45.69 56 24.14 232

Distribution of Buildings having Lifelines
Stories Primary School High School Hospital Total
Bldg No % Bldg No % Bldg No % Bldg No %
Gas 1 2.08 5 23.81 40 90.91 46 40.71
Electricity 48 100 21 100 44 100 113 100
Phone 8 16.67 18 85.71 43 97.7 69 61
Water 46 95.83 21 100 44 100 111 98.23
No
water
2 4.17 0 0 0 2 1.77
Total
Institution 48 21 44 113

Distribution of building storey
Score Primary School High School Hospital Total
Bldg No % Bldg No % Bldg No % Bldg No %
1 Storied 29 41.43 54 50.94 13 23.21 96 41.38
2 Storied 14 20 38 35.85 9 16.07 61 26.29
3 Storied 21 30 7 6.60 10 17.86 38 16.38
4 Storied 4 5.71 7 6.60 16 28.57 27 11.64
5 Storied 2 2.86 4 7.14 6 2.59
6 Storied 4 7.14 6 1.72

Distribution of Foundation types
type Primary School High School Hospital Total
Bldg No % Bldg No % Bldg No % Bldg No %
Foot 55 78.57 71 66.98 50 89.29 176 75.86
Pilling 1 0.94 5 8.93 6 2.59
None 15 21.43 34 32.08 1 1.79 50 21.55
total 70 30.17 106 45.69 56 24.14 232

Distribution of building Shape
Shape Primary School High School Hospital Total
Bldg No % Bldg No % Bldg No % Bldg No %
L 9 12.86 11 10.38 3 5.36 23 9.91
R 57 81.43 91 85.85 25 44.64 173 74.57
Irregular 4 5.71 4 3.77 28 50.0 36 15.52
total 70 30.17 106 45.69 56 24.14 232

Distribution of buildings having Continuous Lintel
Continu
ous
Lintel
Primary School High School Hospital Total
Bldg No % Bldg No % Bldg No % Bldg No %
Yes 59 84.29 77 72.64 24 42.86 160 68.97
No 11 15.71 29 27.36 32 57.14 72 31.03
Total 70 30.17 106 45.69 56 24.14 232

Distribution of buildings` population
Population Primary School High School Hospital Total
Bldg No % Bldg No % Bldg No % Bldg No %
<100 16 22.86 40 37.74 49 87.50 105 45.26
100-200 8 11.43 17 16.04 2 3.57 27 11.64
200-500 28 40 39 36.79 4 7.14 71 30.60
500-
1000
18 25.71 8 7.55 1 1.79 27 11.64
>1000 2 2 0.86
Total 70 30.17 106 45.69 56 24.14 232

Distribution of Buildings in Age
Age
(yrs)
Primary School High School Hospital Total
Bldg No % Bldg No % Bldg No % Bldg No %
<=10 37 52.86 39 36.79 20 35.71 96 41.38
11-25 21 30 23 21.7 20 35.71 64 27.59
26-50 8 11.43 29 27.36 10 17.86 47 20.26
51-100 3 4.29 6 5.66 6 10.71 15 6.47
>100 1 1.43 9 10 4.31
Total 70 30.17 106 45.69 56 24.14 232
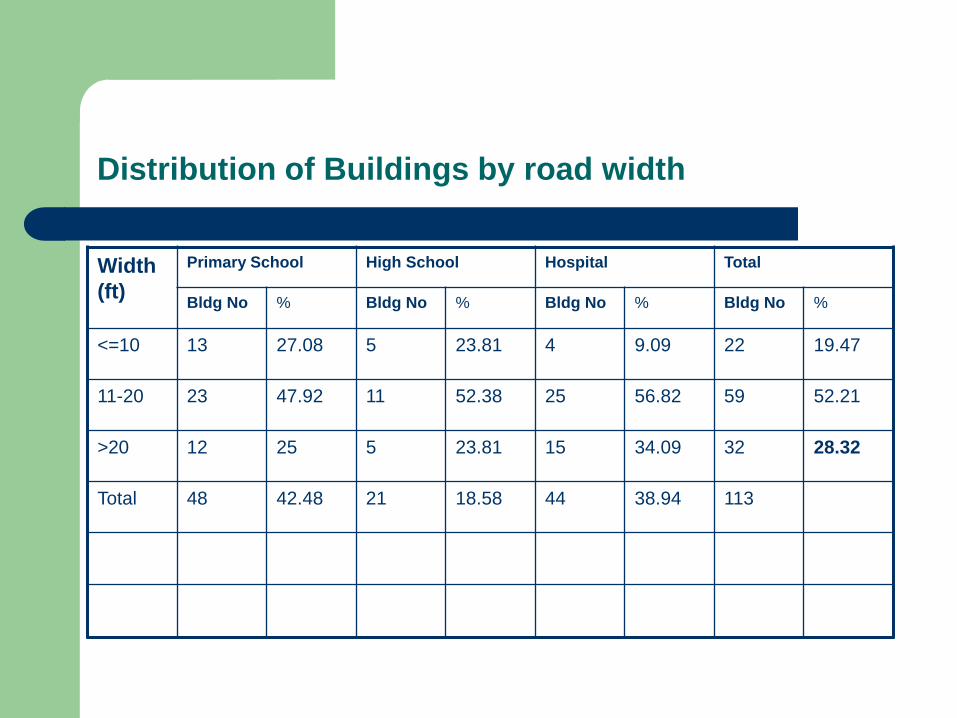
Distribution of Buildings by road width
Width
(ft)
Primary School High School Hospital Total
Bldg No % Bldg No % Bldg No % Bldg No %
<=10 13 27.08 5 23.81 4 9.09 22 19.47
11-20 23 47.92 11 52.38 25 56.82 59 52.21
>20 12 25 5 23.81 15 34.09 32 28.32
Total 48 42.48 21 18.58 44 38.94 113

Distribution of data for the Fire Station
No
Use Age (yrs0 Story Frame Wall Foundati
on
Column Shape
1 Garage 40 2 RC 10” No Yes Irregu
2 Barrack 40 1 RC 10” No Yes R
3 Tower 40 70 ft RC 20” Foot No R

Conclusion
We have identified some factors regarding with
vulnerability
Information of different buildings is recorded on the
RVS sheet and final scores are determined.
Considering the final score, S (for most of the
buildings below 2) of the buildings it can be decided
as per FEMA 154 Handbook (2nd edition) that the
surveyed buildings are hazardous and require
detailed seismic evaluation.

Continue
The old, weak 1-storied brick masonry & tin
shed buildings (EMSB1 type), found in
schools mainly, are very much vulnerable,
and a moderate earthquake can cause
them to collapse. These buildings cannot be
evaluated by RVS.
Continue
It seems that some traditional bamboo or wooden
buildings & Assam-type (EMSF type) houses may
show poor response due to being old & aged; but in
reality they are proven to have good seismic
performance against earthquake because their box
type pattern.

Suggessions
Improved Design techniques such as Base
Isolation system and Seismic Dampers
should be introduced.
Quality of materials should be maintained
Building code should be followed.

Thank you all