evaluation of various separation techniques for the
TRANSCRIPT

Graduate Theses, Dissertations, and Problem Reports
2021
Evaluation of Various Separation Techniques for the Removal of Evaluation of Various Separation Techniques for the Removal of
Actinides from A Rare Earth-Containing Solution Generated from Actinides from A Rare Earth-Containing Solution Generated from
Coarse Coal Refuse Coarse Coal Refuse
Deniz Talan West Virginia University, [email protected]
Follow this and additional works at: https://researchrepository.wvu.edu/etd
Part of the Mining Engineering Commons
Recommended Citation Recommended Citation Talan, Deniz, "Evaluation of Various Separation Techniques for the Removal of Actinides from A Rare Earth-Containing Solution Generated from Coarse Coal Refuse" (2021). Graduate Theses, Dissertations, and Problem Reports. 8232. https://researchrepository.wvu.edu/etd/8232
This Dissertation is protected by copyright and/or related rights. It has been brought to you by the The Research Repository @ WVU with permission from the rights-holder(s). You are free to use this Dissertation in any way that is permitted by the copyright and related rights legislation that applies to your use. For other uses you must obtain permission from the rights-holder(s) directly, unless additional rights are indicated by a Creative Commons license in the record and/ or on the work itself. This Dissertation has been accepted for inclusion in WVU Graduate Theses, Dissertations, and Problem Reports collection by an authorized administrator of The Research Repository @ WVU. For more information, please contact [email protected].

Graduate Theses, Dissertations, and Problem Reports
2021
Evaluation of Various Separation Techniques for the Removal of Evaluation of Various Separation Techniques for the Removal of
Actinides from A Rare Earth-Containing Solution Generated from Actinides from A Rare Earth-Containing Solution Generated from
Coarse Coal Refuse Coarse Coal Refuse
Deniz Talan
Follow this and additional works at: https://researchrepository.wvu.edu/etd
Part of the Mining Engineering Commons

i
EVALUATION OF VARIOUS SEPARATION TECHNIQUES FOR THE REMOVAL OF
ACTINIDES FROM A RARE EARTH-CONTAINING SOLUTION GENERATED
FROM COARSE COAL REFUSE
DENIZ TALAN
Dissertation submitted to the
Benjamin M. Statler College of Engineering and Mineral Resources
at West Virginia University
In partial fulfillment of the requirements for the degree of
Doctor of Philosophy
in
Mining Engineering
Qingqing Huang, Ph.D., Chair
Lian-Shin Lin, Ph.D.
Yi Luo, Ph.D.
Xueyan Song, Ph.D.
Ihsan Berk Tulu, Ph.D.
Department of Mining Engineering
Morgantown, West Virginia
2021
Keywords: Rare Earth Elements, Thorium, Uranium, Coal, Separation, Fundamental Studies,
Process Development
Copyright 2021 Deniz Talan

ii
ABSTRACT
EVALUATION OF VARIOUS SEPARATION TECHNIQUES FOR THE REMOVAL OF
ACTINIDES FROM A RARE EARTH-CONTAINING SOLUTION GENERATED FROM
COARSE COAL REFUSE
DENIZ TALAN
Rare earth elements have emerged as a vital commodity due to their significance in the
production of high-tech devices as well as their utilization in defense and military systems. They
are deemed critical due to potential scarcity, supply constraints, and the lack of minable
concentrations. Therefore, alternative sources are needed to meet the demand and continue
manufacturing rare earth-required products. Coal and coal by-products, in that regard, have
presented a significant opportunity and proven to contain a considerable amount of rare earths.
However, toxic elements such as thorium and uranium are frequently seen in the same
mineralization as rare earths. The concentration of these hazardous trace elements is elevated
due to the extraction and beneficiation processes. Unless proper separation and disposal are
performed, these radionuclides accumulate on the soil’s surface or integrate with aquatic systems
that raise environmental and health concerns. Consequently, there exists an urgent need to
remove these radionuclides to produce high purity rare earths and diversify its supply chain
as well as maintain an environmentally favorable extraction process for the surroundings.
In this study, a process flowsheet was targeted to be developed for the removal of thorium and
uranium from rare earth elements when coarse coal refuse was utilized as a non-traditional
feedstock for rare earth production. The separation performance between these hazardous
elements and rare earths was systematically evaluated. Various separation techniques, namely
selective precipitation, solvent extraction, and adsorption, were applied to extract rare earth
elements while minimizing the non-selective recovery of thorium and uranium into the
product stream. While investigating the potential application of different separation
methods, several operating parameters were tested, and the experimental test results were
analyzed from a statistical and fundamental perspective to provide an in-depth understanding of
each separation mechanism.
Selective precipitation test results indicate that it was effective for removing thorium,
while exploratory solvent extraction tests preferentially removed uranium from rare earths.
Based on the findings of the initial testing, an experimental protocol consisting of both selective
precipitation and solvent extraction was developed and implemented. Around pH 4.85, nearly all
thorium was precipitated out with approximately 19 wt% of rare earths and 47 wt% uranium co-
precipitation. The optimum separation performance between uranium and rare earth elements
was achieved with double-stage solvent extraction under the following conditions: 50 v% tri-
butyl phosphate, feed pH at 3.5, organic to aqueous phase ratio at 3, and DI water as the
strippant, which corresponded to an overall rare earth and uranium recovery of 80 wt% and 3.1
wt%, respectively. The selective

iii
precipitation and solvent extraction test results were assessed from a fundamental point of view
with respect to metal species distribution, chemical complexation reactions, and thermodynamic
calculations, which all aligned well with the experimental data. The precipitation reactions were
all spontaneous and exothermic for the elements studied based on calculated Gibbs energy and
enthalpy values. The extraction behavior of uranium and rare earths was further studied with the
distribution ratio and separation factors. Statistically, significant models were developed for
uranium recovery prediction in solvent extraction, which indicates the extractant concentration,
solution pH, and organic to aqueous phase ratio all played a critical role. On the contrary, the
concentration of the stripping agent was identified as an insignificant parameter over the tested
concentration range.
As an alternative to selective precipitation and solvent extraction, an experimental design was
generated to examine the potential application of zeolite adsorption on the removal of thorium and
uranium. However, good selectivity was not observed, especially between uranium and rare earth
elements. The kinetic adsorption studies suggest a similar pattern for rare earth elements and
uranium, which creates a separation challenge. In the case of thorium adsorption, a fast adsorption
behavior was observed. Freundlich adsorption isotherm was determined to be the best-fit model,
and the adsorption mechanism of rare earths and thorium was identified as multilayer
physisorption. Also, the kinetic adsorption data fit to the pseudo-second-order rate reaction for
thorium and rare earth elements. The best separation performance was achieved using 2.5 grams
of 12-µm zeolite sample at a pH value of 3 with a contact time of 2 hours. Under these conditions,
the adsorption recovery of rare earths, thorium, and uranium into the solid phase was found to be
20.4 wt%, 99.2 wt%, and 89.6 wt%, respectively.
As a result of comprehensive experimental and fundamental studies, a conceptual process
flowsheet was developed using the metallurgical simulation software, METSIM. The developed
flowsheet consists of five main unit operations. After dissolution with acid (1), it is intended to
apply one-stage selective precipitation (2) for thorium removal followed by solvent extraction (3)
for uranium separation, where two-stage extraction and two-stage stripping are performed. Later
the remaining rare earth-containing aqueous stream is treated with oxalic acid to achieve rare earth
oxalate precipitation (4). Finally, roasting (5) is applied to convert rare earth oxalate to rare earth
oxide products. Lastly, the developed experimental protocol was validated using a real system rare
earth oxalate sample produced at the pilot-scale processing facility.
KEYWORDS: Rare Earth Elements, Thorium, Uranium, Coal, Separation, Fundamental Studies,
Process Development.

iv
ACKNOWLEDGMENTS
First of all, I would like to express my deepest gratitude to my advisor and dissertation committee
chair, Dr. Qingqing Huang, for her continuous support, guidance, and motivation. This dissertation
would not be possible without her valuable contributions. I will always be grateful for her patience,
help, and kindness. She is an excellent researcher and advisor, and she has been a great role model
to me. She gave me an opportunity of a lifetime, and I will never forget that. It was a privilege to
work with her.
I would also like to extend my appreciation to my valuable committee members, Dr. Yi Luo, Dr.
Lian-Shin Lin, Dr. Xueyan Song, and Dr. I. Berk Tulu, for their participation in my dissertation
committee, time, and efforts. Their significant inputs enhanced the value of this dissertation, and
they are greatly appreciated.
Moreover, I would like to thank Dr. Rick Honaker, Dr. Wencai Zhang, Dr. Xinbo Yang, and all
the University of Kentucky Mining Engineering Department members for providing the sample
used in this study and letting me benefit from their elemental analysis instrument. The efforts of
West Virginia University National Resource Center for Coal and Energy Analytical Laboratory
Director Gabriela Perhinschi, and Research Assistant, Robert Vincent, are also very much
appreciated for conducting elemental analysis throughout my study. I am thankful to Dr. Marcela
Redigolo, Dr. Qiang Wang, and Dr. Gunes Yakaboylu for their help in performing characterization
tests. Further, I want to thank Dr. Aaron Noble from Virginia Polytechnic Institute and State
University for his mentoring and all the external support he provided. I am grateful for his time
and the knowledge he shared with me.
I would like to give special thanks to our research group members and my colleagues, Amir
Eskanlou, Zhongqing Xiao, Francisco Patino, and Zeynep Cicek, who supported me constantly.
They were always present when I needed their help. Also, I want to thank my friends Dr. Emel
Sen Kilic, Cagri Kilic, Mustafa Can Suner, Dr. Ozcan Ozmen, and all the WVU Department of
Mining Engineering students for creating great memories together in Morgantown. Moreover, I
appreciate all the support and help that I received from the Faculty and Staff of the WVU
Department of Mining Engineering. They all will be greatly missed.
Last but not least, I would like to express my love and appreciation to my family. I am thankful
for their enormous support during my Ph.D. journey. They were on the other side of the phone
whenever I needed them. Their understanding and enormous help are endless. Finally, I have to
mention the tremendous support that I received from my husband, Deniz Tuncay. He lessened my
burden and offered all the help he can provide. Without his help, this dissertation would not be
happening.

v
To My Dear Family

vi
TABLE OF CONTENTS
ABSTRACT ...................................................................................................................... ii
ACKNOWLEDGMENTS ................................................................................................ iv
LIST OF FIGURES .......................................................................................................... ix
LIST OF TABLES ......................................................................................................... xiii
CHAPTER 1 INTRODUCTION....................................................................................... 1
CHAPTER 2 LITERATURE REVIEW ............................................................................ 4
2.5.1. Selective Precipitation ............................................................................................ 14
2.5.2. Solvent Extraction ................................................................................................... 16
2.5.3. Solid-Phase Separation ........................................................................................... 17
CHAPTER 3 EXPERIMENTAL AND METHODOLOGY .......................................... 20
3.3.1. Preliminary Selective Precipitation Tests ............................................................... 21

vii
3.3.2. Preliminary Solvent Extraction Tests ..................................................................... 23
3.3.3. Modified Experimental Protocol............................................................................. 25
3.3.4. Zeolite Adsorption Tests ......................................................................................... 28
3.4.1. Characterization of Solids Generated from Selective Precipitation ....................... 31
3.4.2. Characterization of Zeolite Samples ....................................................................... 31
CHAPTER 4 SELECTIVE PRECIPITATION AND SOLVENT EXTRACTION
STUDIES ................................................................................................................... 33
4.3.1. One-Stage Precipitation .......................................................................................... 40
4.3.2. The First Subset of Solvent Extraction Tests .......................................................... 53
4.3.3. The Second Subset of Solvent Extraction Tests ..................................................... 61
CHAPTER 5 ZEOLITE ADSORPTION STUDIES....................................................... 77
CHAPTER 6 CONCEPTUAL PROCESS FLOWSHEET DEVELOPMENT ............... 99
CHAPTER 7 CONCLUSIONS AND SUGGESTIONS FOR FUTURE STUDIES .... 102

viii
REFERENCES .............................................................................................................. 105
APPENDIX ................................................................................................................... 123
VITAE ........................................................................................................................... 139

ix
LIST OF FIGURES
Figure 1 Schematic representation of solvent extraction tests. ..................................................... 17
Figure 2 Pictures illustrating the experimental procedures of selective precipitation tests. (A) pH
measurement, (B) Settling after precipitation. .............................................................................. 22
Figure 3 Experimental flowsheet followed during selective precipitation tests. .......................... 22
Figure 4 Experimental flowsheet followed during the exploratory solvent extraction tests. ....... 24
Figure 5 Separation between aqueous and organic phase during solvent extraction tests. ........... 24
Figure 6 A modified experimental protocol developed for enhanced separation of thorium,
uranium, and rare earths. ............................................................................................................... 26
Figure 7 Experimental designs for uranium separation using TBP as the extractant: (A) DI water
as the strippant; (B) H2SO4 as the strippant. ................................................................................. 27
Figure 8 Structure of zeolite (after Zendelska et al., 2015). ......................................................... 29
Figure 9 Cumulative precipitation of total rare earths, thorium, and uranium ............................. 33
Figure 10 Cumulative precipitation of total, heavy, light, critical, and uncritical rare earths at
various pH values. ......................................................................................................................... 35
Figure 11 Recovery of total rare earths, thorium, and uranium into the REE product stream of both
the one-stage and two-stage solvent extraction process. .............................................................. 37
Figure 12 Recovery of individual rare earth, thorium, and uranium into the REE product stream of
both the one-stage and two-stage solvent extraction process. ...................................................... 37
Figure 13 Recovery of total, heavy, light, critical and uncritical REEs from both the one-stage and
two-stage solvent extraction process. ........................................................................................... 38
Figure 14 Average precipitation of total REEs, Th, U, and major metals at the pH value of 4.85.
Error bars one standard deviation of three replicate tests. ............................................................ 41
Figure 15 The average precipitation of total, heavy, light, critical, and uncritical rare earths at the
pH value of 4.85. Error bars represent one standard deviation of three replicate tests. ............... 42
Figure 16 XRD pattern of the solids samples obtained from selective precipitation tests at a pH
value of 4.85.................................................................................................................................. 43
Figure 17 Elemental identification of the solids samples obtained from selective precipitation at a
pH of 4.85 using SEM-EDX analysis. .......................................................................................... 43

x
Figure 18 SEM images of precipitated solids (at a pH of 4.85) observed under various
magnifications. .............................................................................................................................. 44
Figure 19 Species distribution diagram of Th-HCl system. ......................................................... 46
Figure 20 Species distribution diagram of U-HCl system. ........................................................... 46
Figure 21 Eh-pH diagram of Th-Cl-Na-Ca-H2O system. ............................................................. 48
Figure 22 Eh-pH diagram of U-Cl-Na-Ca-H2O system ................................................................ 48
Figure 23 Species distribution diagrams of REEs-HCl system. A) Cerium, B) Neodymium, C)
Gadolinium, D) Lanthanum, E) Yttrium....................................................................................... 50
Figure 24 Species distribution diagram of Fe-HCl system. .......................................................... 52
Figure 25 Species distribution diagram of Al-HCl system. .......................................................... 52
Figure 26 Experimental procedure and the operating conditions followed the second subset of
solvent extraction tests. ................................................................................................................. 53
Figure 27 Recovery of total rare earths and uranium into the final REE product stream based solely
on solvent extraction circuit. Error bars represent one standard deviation of three replicate tests.
....................................................................................................................................................... 55
Figure 28 Overall recovery of total rare earths and uranium with respect to the overall experimental
flowsheet. Error bars represent one standard deviation of three replicate tests. ........................... 56
Figure 29 3D surface response graphs obtained from the statistical analysis using Design-Expert.
....................................................................................................................................................... 59
Figure 30 2D contour plots obtained from the statistical analysis using Design-Expert. ............. 60
Figure 31 Experimental procedure and the operating conditions followed the second subset of
solvent extraction tests. ................................................................................................................. 61
Figure 32 Recovery of total rare earths and uranium into the final rare earth product stream based
solely on the solvent extraction circuit. Error bars represent one standard deviation of three
replicate tests. ................................................................................................................................ 62
Figure 33 Overall recovery of total rare earths and uranium with respect to the whole experimental
flowsheet. Error bars represent one standard deviation of three replicate tests. ........................... 63
Figure 34 Distribution ratio of (A) total rare earths, (B) uranium in the two extraction stages. Error
bars represent one standard deviation of three replicate tests. ...................................................... 65
Figure 35 Separation factor between total rare earths and uranium. Error bars represent one
standard deviation of three replicate tests. .................................................................................... 66

xi
Figure 36 3D surface response graphs obtained for the statistical model predicting uranium
recovery......................................................................................................................................... 70
Figure 37 2D contour plots obtained for the statistical model predicting uranium recovery. ...... 72
Figure 38 Experimental flowsheet followed for rare earth oxalate sample. ................................. 73
Figure 39 Precipitation of total rare earths and thorium at various pH values. Error bars represent
one standard deviation. ................................................................................................................. 74
Figure 40 The SEM image of the rare earth oxide feed sample. .................................................. 74
Figure 41 The SEM image of precipitated solids at pH 4.6. ......................................................... 75
Figure 42 Particle size distribution of three zeolite samples. (A) Coarsest sample, P80=1490 µm,
(B) Middle-sized sample, P80=200 µm, (C) Finest sample, P80=12 µm..................................... 77
Figure 43 X-ray diffraction pattern of the zeolite samples. .......................................................... 78
Figure 44 Elemental identification of the zeolite samples obtained from the EDX spectrums. ... 79
Figure 45 SEM images of the zeolite samples under various magnification. (a) the coarsest sample,
(b) medium size sample, (c) the finest sample. ............................................................................. 80
Figure 46 The Brunauer–Emmett–Teller (BET) Nitrogen adsorption isotherm of the three zeolite
samples. ......................................................................................................................................... 82
Figure 47 Classification of (a) physisorption isotherms, (b) hysteresis (Thommes et al., 2015) . 82
Figure 48 Pore size distribution of the three zeolite samples. ...................................................... 83
Figure 49 Adsorption recoveries into the solid phase. A) total rare earths, B) thorium, C) uranium.
Error bars represent one standard deviation of multiple replicate test.......................................... 84
Figure 50 SEM image showing the fractures and cracks formed after adsorption. ...................... 86
Figure 51 XRD pattern of the solid samples generated with Test 11. .......................................... 87
Figure 52 SEM images of the solid samples generated after adsorption. Bright areas highlighted
in the red boxes indicating the deposition of heavy elements. ..................................................... 88
Figure 53 EDX pattern of the solid sample generated after Test 11. (A) Full EDX pattern indicating
high-intensity elements. (B) Close-up view showing the detection of rare earths and thorium. .. 88
Figure 54 Diagnostic plots obtained based on the statistical model developed for the adsorption
recovery of rare earths. ................................................................................................................. 92
Figure 55 Adsorption recoveries of total rare earths, thorium, and uranium as a function of contact
time. Error bars represent one standard deviation of multiple replicate tests. .............................. 94

xii
Figure 56 Distribution coefficient values of (A) total rare earths and (B) thorium as a function of
contact time. Error bars represent one standard deviation of multiple replicate tests. ................. 94
Figure 57 Pseudo-second-order reaction model for (A) total rare earths and (B) thorium. .......... 95
Figure 58 Freundlich adsorption isotherms of the elements onto zeolite. (A) total rare earths (B)
thorium. ......................................................................................................................................... 97
Figure 59 D-R adsorption isotherms of the elements onto zeolite. (A) total rare earths (B) thorium.
....................................................................................................................................................... 97
Figure 60 Conceptual flowsheet designed for the removal of thorium and uranium from rare earth
elements ...................................................................................................................................... 101
Figure 61 The PANanalytical XRD used throughout the study. ................................................ 123
Figure 62 Instrument used for the SEM analysis of various solid samples. (A) Hitachi S4700 SEM-
EDX (B) Denton Desk V Sputter and Carbon Coater. ............................................................... 123
Figure 63 The CILAS particle size analyzer used throughout the study. ................................... 124
Figure 64 The Vanta handheld XRF used throughout the study. ............................................... 124
Figure 65 BET nitrogen adsorption instrument used for the characterization of zeolite samples.
..................................................................................................................................................... 125

xiii
LIST OF TABLES
Table 1 Classification of rare earth elements based on atomic numbers. ....................................... 4
Table 2 Area of the use of rare earth elements (after Michieka, 2017 and Van Gosen et al., 2019).
......................................................................................................................................................... 6
Table 3 Level of radioactivity in rare earth solid waste (modified from Liu and Pan (2011). ..... 11
Table 4 Radioactivity level (Bq/kg) of the nuclides in coal in various countries (modified from
World Nuclear Association (2021)). ............................................................................................. 12
Table 5 Level of radioactivity (Bq/kg) in coal solid waste (modified from Liu and Pan (2011)). 12
Table 6 Thorium and uranium concentration in the world’s selected coal and coal-based materials
(modified from Parzentny and Rog (2019)).................................................................................. 13
Table 7 Elemental composition of synthetic feedstock solution. ................................................. 21
Table 8 Operating conditions for exploratory solvent extraction tests. ........................................ 23
Table 9 Test order and conditions of the solvent extraction stage following the first subset of the
modified experimental protocol. ................................................................................................... 27
Table 10 Test order and conditions of the solvent extraction stage following the second subset of
the modified experimental protocol. ............................................................................................. 28
Table 11 Test order and conditions of zeolite adsorption tests. .................................................... 30
Table 12 Individual rare earth, thorium, and uranium concentrations (ppm) in the rare earth product
stream obtained from both the one-stage and two-stage solvent extraction process. ................... 38
Table 13 Individual rare earth, thorium, and uranium concentration (ppm) of the filtrate obtained
at the pH value of 4.85. ................................................................................................................. 41
Table 14 Redox potential measurements at various pH values .................................................... 47
Table 15 Gibbs free energy and enthalpy and entropy values of rare earths under standard operating
conditions (1 atm and 25 °C). ....................................................................................................... 49
Table 16 Elemental composition of individual rare earth and uranium (mg/L) in the final REE
product stream obtained from Test 8. ........................................................................................... 55
Table 17 ANOVA analysis of the quadratic model for the prediction of uranium recovery. ....... 57
Table 18 Elemental composition of individual rare earth and uranium (ppm) in the final REE
product stream obtained from Test 8. ........................................................................................... 65
Table 19 ANOVA analysis of the quadratic model for the prediction of uranium recovery. ....... 67

xiv
Table 20 Elemental composition of the rare earth oxalate sample. .............................................. 72
Table 21 ANOVA analysis of the quadratic model for predicting rare earth recovery. ............... 90
Table 22 Individual rare earth elements, thorium and uranium concentrations (ppm) in the filtrates
at various pH values. ................................................................................................................... 125
Table 23 Individual rare earth elements, thorium, and uranium precipitation (%) at various pH
values during the preliminary selective precipitation tests. ........................................................ 126
Table 24 Precipitation (%) of heavy, light, critical, and uncritical rare earth elements at various pH
values during the preliminary selective precipitation tests. ........................................................ 126
Table 25 Extraction recovery (%) of total rare earths, thorium, and uranium during the exploratory
solvent extraction tests. ............................................................................................................... 126
Table 26 Extraction recovery (%) individual rare earth elements during the exploratory solvent
extraction tests. ........................................................................................................................... 127
Table 27 Extraction recovery (%) of heavy, light, critical, and uncritical rare earth elements during
the exploratory solvent extraction tests. ...................................................................................... 127
Table 28 Precipitation (%) of total rare earth elements, thorium, uranium, and major metals during
the one-stage modified experimental protocol. ........................................................................... 127
Table 29 Individual rare earth elements and uranium extraction recovery (%) into the final rare
earth product stream based on solely solvent extraction circuit during the first subset of solvent
extraction tests. ........................................................................................................................... 128
Table 30 Individual rare earth elements and uranium concentrations (mg/L) in the final rare earth
product stream based on solely solvent extraction circuit during the first subset of solvent
extraction tests. ........................................................................................................................... 129
Table 31 Overall extraction recovery (%) of total rare earth elements and uranium during the first
subset of solvent extraction tests................................................................................................. 130
Table 32 Individual rare earths and uranium extraction recovery (%) into the final rare earth
product stream based solely on the solvent extraction circuit during the second subset of solvent
extraction tests. ........................................................................................................................... 131
Table 33 Individual rare earth elements and uranium concentrations (mg/L) in the final rare earth
product stream based solely on solvent extraction unit during the second subset of solvent
extraction tests. ........................................................................................................................... 133

xv
Table 34 Overall extraction recovery (%) of total rare earth elements and uranium during the first
subset of solvent extraction tests................................................................................................. 135
Table 35 RE Oxide precipitation at various pH values............................................................... 135
Table 36 Adsorption recovery of total rare earths, thorium, and uranium during zeolite adsorption
tests. ............................................................................................................................................ 136
Table 37 Individual rare earth elements, thorium and uranium concentrations (mg/L) in the
aqueous filtrate after zeolite adsorption tests. ............................................................................. 137
Table 38 The results of the kinetic adsorption tests. ................................................................... 138

1
CHAPTER 1
INTRODUCTION
Background
Rare earth elements (REEs) are essential raw materials for numerous applications such as high-
tech industries, military, and defense systems (Binnemans et al., 2013; Wang et al., 2017). In recent
years, there has been a growing interest in exploring new and alternative sources to meet the
industrial demand, and the deficit arose due to the tight export quotas favored by the world’s
leading rare earth producer and supplier, China (Alex et al., 1998).
Recently, in addition to the primary rare earth sources (i.e. bastnaesite, monazite, and xenotime),
coal and coal byproducts have been distinguished as potential feedstock materials for rare earth
elements (Seredin, 1996; McLellan et al., 2014; Hower et al., 2016; Zhang and Honaker, 2018;
Huang et al., 2018). According to the characterization studies conducted in various geological
locations, the average concentration of rare earths in coal has been identified as 69 ppm on a whole
sample basis (Ketris and Yudovich, 2009). Also, it was stated in a study that the total amount of
rare earths in coal is nearly 50 million metric tons, which accounts for 50% of REEs in
conventional rare earths deposits (Yang, 2019). Considering the vast amount of coal reserves and
the volumes of byproducts generated after coal mining and processing, the utilization of which has
the possibility to overcome the challenges the rare earth industry facing and contribute to the U.S.
economy. Currently, with no domestic supply chain, the U.S. is vulnerable to interruptions in the
international market. Therefore, developing a rare earth supply chain is of great importance for the
U.S.
Occurrences of rare earth elements and their extraction techniques have been well summarized by
many research studies (Kuzmin et al., 2012; Seredin and Dai, 2012; Zhang et al., 2015; Van Gosen
et al., 2017; Arbuzov et al., 2018). Nonetheless, rare earth extraction processes cause significant
environmental issues by producing mildly radioactive tailing streams due to the association of
naturally occurring radioactive materials (NORM), such as thorium (Th) and uranium (U). The
radioactive materials can be enriched along with rare earths since they also dissolve during the
leaching of host minerals (Al-Areqi et al., 2015), and these dissolved radioactive ions, pollute the
groundwater and surface water (Akkaya, 2013). Although, there are studies conducted to remove
the hazardous elements selectively, the focus of which are generally on the conventional sources
of rare earths (Jun et al., 1998; Rabie et al., 2007; Anufrieva et al., 2014; Panda et al., 2014; Batchu
et al., 2015; Borai et al., 2016; Dittrich et al., 2016; Alemrajabi et al., 2017; Kuang et al., 2017;
Pillai, 2017). However, when coal and its byproducts are identified as potential sources for rare
earth elements, it is equally crucial to investigate promising separation techniques to efficiently
separate hazardous and radioactive elements from rare earths in a coal-based matrix (Valkov et al.,
2014; Zhang et al., 2016, Wang, et al., 2017).

2
Objectives of the Study
This study was supported by the Department of Energy’s National Energy Technology Laboratory
under the Award Number DE-FE0027035. The ultimate goal of the overall project was to design,
construct and test a mobile pilot-scale plant that is capable of processing ¼-ton per hour of coal or
coal by-products to produce concentrates assaying more than 2% rare earth elements on a dry,
whole mass basis in an environmentally and economically benign manner.
Per the project goal, this Ph.D. dissertation specifically focused on environmental control, which
aims to investigate the potential application of various separation techniques to remove radioactive
and hazardous elements; thorium and uranium. At the end of detailed experimental and
fundamental studies, the development of an effective separation process to remove thorium and
uranium with optimum operating parameters was targeted. Besides, it was intended to contribute
to the literature by providing insight into the theoretical and experimental understanding of the
separation processes.
The research tasks to achieve the dissertation objectives included the followings:
1. Investigation of selective precipitation, solvent extraction, and zeolite adsorption to explore
the potential of removing thorium and uranium from a rare earth-containing solution,
2. For each separation technique, exploration of the effect of various influential operating
parameters on the selective removal of thorium and uranium,
3. Utilization of experimental design tools to identify the test conditions as well as optimize
the processes from the operational standpoint,
4. Assessing the process separation efficiency of each separation technique using the response
surface methodology (RSM), and utilization of the statistical tool to test the significance
and adequacy of the models developed during the study,
5. Conducting detailed characterization studies using various analytical techniques such as
X-ray diffraction (XRD), X-ray fluorescence (XRF), scanning electron microscope-energy
dispersive X-ray spectroscopy (SEM-EDX), Brunauer–Emmett–Teller (BET) nitrogen
adsorption, and the particle size analyzer (PSA) to identify the chemical and mineralogical
compositions, surface morphology, particle size distributions as well as pore size
distribution and surface area of a variety of solid samples,
6. Performing fundamental studies, which include equilibrium, kinetic and thermodynamic
studies, to obtain an in-depth understanding of each separation mechanism. The
fundamental studies cover the species distribution for selective precipitation to illustrate
the relative solubility, stability regions of different species, and predominant species at a
given pH value. Studies for extraction mechanisms of certain elements cover distribution
ratio and separation factor. Studies for the adsorption technique contain the development
of Langmuir, Freundlich, and Dublinin-Raduchlevitch isotherms based on the
experimental data to have an in-depth understanding of the adsorption mechanism.
Thermodynamic studies include determining the Gibbs standard free energy change,
standard enthalpy, and entropy changes.

3
Organization of the Dissertation
The dissertation was divided into seven chapters. The first chapter gives a brief introduction to the
background and objectives of the study. The second chapter covers a thorough literature review
on rare earth elements and their applications in various areas, followed by the research and
development studies performed on substitution and recycling of rare earths sources. The
occurrences of rare earth elements in coal and coal byproducts and the environmental issues that
arise during rare earth extraction were also provided in detail. Besides, regulatory stipulations
established by various agencies and countries were summarized in addition to the techniques used
for the separation of radioactive and hazardous elements from rare earths.
In chapter three, sample preparation, apparatus, and experimental methodologies were introduced.
The results and discussions of the experimental findings were presented in chapters four and five.
While chapter four includes the studies on selective precipitation and solvent extraction, chapter
five focuses on zeolite adsorption studies. Following the experimental results, in chapter six, the
conceptual process development was described. Lastly, in chapter seven, the conclusions obtained
in this dissertation were compiled and listed in addition to the suggestions for future studies.

4
CHAPTER 2
LITERATURE REVIEW
Occurrences and Applications of Rare Earth Elements
Rare earth elements or lanthanides refer to 15 elements that occur together in the periodic table
and have atomic numbers from 57 to 71. Two other elements, scandium and yttrium with an atomic
number of 27 and 39, respectively, are also considered as rare earth elements since they share
similar chemical and physical properties (Rim et al., 2013; Jorjani and Shahbazi, 2016; Anderson
et al., 2017; Zhou et al., 2018). Contrary to their names, the abundance of rare earths in the earth’s
crust is much higher than many commodities (Jordens, 2016; Van Gosen et al., 2017). Even the
least abundant rare earths, thulium and lutetium, have an average crystal abundance of
approximately 200 times of gold. As opposed to thulium and lutetium, cerium, yttrium, lanthanum,
and neodymium are the most abundant rare earths. However, concentrated rare earth deposits are
limited, accounting for ineffective and uneconomical extraction (Fouquet and Martel-Jantin, 2014;
McLallan et al., 2014).
On the basis of the atomic weight, rare earths are divided into two groups. The elements from
lanthanum through gadolinium comprise the light rare earth elements (LREEs), whereas the rest
forms heavy rare earths (HREEs), which are more in demand than lighter ones because of their
higher strategic value (Van Gosen et al., 2019). Although yttrium has an atomic number of 39, it
is included in the heavy rare earth group due to its similar characteristics as other heavy rare earths.
A detailed list of heavy and light rare earths is provided in Table 1.
Table 1 Classification of rare earth elements based on atomic numbers.
Light Rare Earth Elements (LREEs) Heavy Rare Earth Elements (HREEs)
Element Atomic No. Atomic Wt. (g/mol) Elemen
t
Atomic No. Atomic Wt. (g/mol)
Lanthanum
(La) 57 138.91
Yttrium
(Y) 39 88.91
Cerium
(Ce) 58 140.12
Terbium
(Tb) 65 158.92
Praseodymium
(Pr) 59 140.91
Dysprosium
(Dy) 66 162.50
Neodymium
(Nd) 60 144.24
Holmium
(Ho) 67 164.93
Samarium
(Sm) 62 150.36
Erbium
(Er) 68 167.26
Europium
(Eu) 63 151.96
Thulium
(Tm) 69 168.93
Gadolinium
(Gd) 64 157.25
Ytterbium
(Yb) 70 173.04
Lutetium
(Lu) 71 174.97

5
The formation of rare earths is diverse and complex. They do not occur as native elemental metals;
instead, they are seen in various host minerals, such as halides, carbonates, oxides, phosphates,
and silicates (Rim et al., 2013; Suli et al., 2017). Although there are more than 200 rare earth-
bearing minerals being identified in nature, bastnaesite (REECO3F), monazite ((Th,REE)PO4),
xenotime (REEPO4), and ion-adsorption clays are considered as the primary sources due to their
REE content and economic feasibility, and account for more than 95% of total rare earth
production (Amaral and Morais, 2010; Hidayah and Abidin, 2017). The world’s two largest rare
earth deposits, Mountain Pass (USA) and Bayan Obo (China), have bastnaesite as their rare earth
host mineral, which is particularly rich in light rare earths. Monazite is generally seen in sediments
and recovered especially in coastal deposits. The deposits in Australia, Brazil, China, India,
Malaysia, and South Africa constitute the largest monazite deposits. Currently, it is extracted on
the east coast of Brazil and India (Van Gosen et al., 2017). Oppositely, xenotime contains a high
concentration of heavy rare earths and yttrium (Alex et al., 1998). Like xenotime, ion adsorption
clays also contain a considerable amount of heavy rare earths (typically 300 ppm), which are
different than the mineral-type (i.e., bastnaesite, monazite, and xenotime) deposits, and discovered
in granite weathering crust in Southern China in the late 60s (Wang et al., 2018). Apatite, cheralite,
eudialyte, loparite, and phosphorites make up the remaining secondary sources (Dutta et al., 2016).
Because of their unique magnetic, optical, and electrical properties, rare earth elements have
diverse industrial applications (Navarro and Zhao, 2014; Wang et al., 2017). The military uses rare
earths for the production of night-vision goggles, communication, and GPS equipment. Likewise,
they are used in developing defense systems, such as jet engines, missile guidance systems, and
satellites (Van Gosen et al., 2019). They are heavily used in the production of computers, cell
phones, electric vehicle batteries, and many other electronic devices. In addition to their critical
role in modern technology, energy, defense, and military industries, they are highly used in glass,
petroleum, automotive, medical, and ceramic industries (Banda et al., 2012; Yoon et al., 2016).
Lanthanum-based catalysts and cerium-based catalysts are commonly used in petroleum and
automotive industries, whereas cerium oxide, lanthanum, and lutetium are widely used in the glass
industry to provide polishing, color, and unique optical properties (Van Gosen et al., 2017).
Producing permanent magnets from rare earth alloys is an expanding area and neodymium is used
to produce neodymium-iron-boron magnet, which is the strongest type of magnet (Uda et al.,
2000). Permanent magnets are also used in electric motor production for hybrid cars and wind
turbines. Moreover, gadolinium phosphorous is used for X-ray imaging and medical applications
such as MRI, and yttrium, lanthanum, praseodymium is used as pigments for ceramics (Akdogan
and Ghosh, 2014). In Table 2, example applications are given for each of the rare earth elements.

6
Table 2 Area of the use of rare earth elements (after Michieka, 2017 and Van Gosen et al., 2019).
Element Application
Scandium
Lanthanum
Super-alloys, ultra-light aerospace components, X-ray tubes
Optical glass, night-vision goggles Cerium Catalytic converters, steel production, colored glass
Praseodymium Super-strong magnets, lasers
Neodymium Guidance and communication systems
Samarium Permanent magnets, precision-guided weapons
Europium Fluorescents and phosphorus in lamps and monitors
Gadolinium Magnetic resonance imaging contrast agent, nuclear reactor shielding
Terbium Fuel cells, sonar systems
Dysprosium Batteries for hybrid gas-electric vehicles, magnets for wind turbines
Holmium Catalysts, magnets, lasers
Erbium Amplifiers in fiber-optic data transmission
Thulium Portable X-ray machines, microwaves, metal halide lamps
Ytterbium Infrared lasers, chemical reducing agents, rechargeable batteries
Lutetium Superconductors, LED lamps
Yttrium Cancer treatment drugs, alloys, high-intensity lamps
Recent Research Advances on Rare Earth Elements
Although the average amount of rare earths needed per unit product has decreased, due to the
increase in global population increase and the expanded area of use, the demand for rare earth
elements is rapidly increasing. It became a significant issue in 2011 when the market values of rare
earths increased by almost 200% (Paul and Campbell, 2011; Paulick and Machacek, 2017).
Besides, it raises a serious concern among many countries since most rare earth deposits are located
in China. Considering the global reserves, China holds approximately 48% while the U.S., India,
and Australia hold 12%, 3%, and 1%, respectively. Within that context, research and development
studies have gained tremendous significance.
The global reserves for rare earth elements were estimated at 130 million metric tons (Gamboghi,
2015). However, the industrial demand is expected to increase even more, and the value of the rare
earth market is projected to be more than $20 billion by 2024, which was $9 billion in 2019 (Song
et al., 2017; Yang et al., 2020). For some specific elements, such as dysprosium, the demand is
projected to increase by 2600% over the next decade (Honaker et al., 2018). Due to their
importance in many industries and shortage in supply, the U.S. Department of Energy recognized
neodymium (Nd), terbium (Tb), yttrium (Y), dysprosium (Dy), and europium (Eu) as critical rare
earths (CREEs) (Chu, 2011; Quinn et al., 2015). Besides, depleting resources, environmental
concerns of rare earth mining, and the export limitations set by the world’s biggest rare earth
producer and supplier, China, have urged countries to develop various research projects to recycle,
substitute, and explore alternative sources in compliance with the environmental regulations (U.S.
Department of Energy, 2011; McLellan et al., 2014; Das et al., 2018).

7
Within this context, new operations were initiated in India, Brazil, and Vietnam to produce rare
earths as a byproduct of rutile and zircon production (Paulick and Machacek, 2017). Meanwhile,
Russia and Malaysia started to recover rare earths from magnesia and cassiterite plants,
respectively (Van Gosen et al., 2017). New deposits have been identified in Canada, the United
Kingdom, Estonia, and Greenland (Suli et al., 2017). A probable mineral reserve that accounts for
0.59% of total rare earth oxide has been identified in Sweden (Schreiber et al., 2016) while another
mineral resource was estimated in Alaska with 0.56% total rare earths.
Furthermore, two previously operated mines, Mountain Pass in the U.S. and Mount Weld in
Australia, were re-opened to increase their respective domestic rare earth production. The
Australian company, Laynas Corporation, may break the dominancy of China by becoming the
world’s largest rare earth processing plant if it fully operates. Besides, both the U.S. Department
of Energy and the U.S. Critical Materials Institute support multiple high-value projects to develop
substitutes for rare earths and other critical elements (Paul and Campbell, 2011). Nickel-laterites
of Cuba and the Dominican Republic have also been identified as potential rare earth sources for
the future (Dutta et al., 2016). Alternatively, bauxite residue (red mud) has a considerable rare
earth concentration, particularly high Scandium content. While the rare earth concentration in
Greek bauxite is 506 ppm, it can be as high as 2500 ppm for the Jamaican bauxite samples
(Binnemans et al., 2015).
The research initiatives on recycling electronic wastes to be used as alternative rare earth sources
has tremendous potential. According to 2016 data, 44.7 million tons of electronic waste were
generated in the world, which is even projected to be greater in the future (Jyothi et al., 2020). The
European Union is sponsoring a variety of ongoing research projects that mostly focus on recycling
rare earths from permanent magnets, disused metal alloys, and fluid catalytic cracking catalysts.
For instance, a Belgian-based company has developed a program to recycle rare earths from nickel-
metal-hydride (NiMH) batteries (Van Gosen et al., 2017). Similarly, Germany is working on
recycling rare earths from used light metal alloys and catalysts to contribute to the European supply
chain. Solvay, an international chemical company, is working on recycling light bulbs to recover
cerium and lanthanum in France. In Asia, Honda Motor Co. Ltd. and Hitachi Ltd., are working to
recycle rare earths from batteries, hard disk drives, air conditioners, and other types of compressors
(Van Gosen et al., 2017). In terms of recycling, as reported in Omodara and his coworkers’ study
(2019), a novel process has been developed to recover light rare earth elements with a purity
greater than 99% from shredded hard disk drives by the researchers at Critical Minerals Institute
and Ames Laboratory. Alternatively, Hua et al. (2014) and Jakobsson et al. (2016) proposed the
extraction of rare earths by molten chlorides and direct melting of NdFeB magnets, separately.
Rare Earth Elements in Coal and Coal By-products
Lately, as one of the outcomes of the research and development efforts, there have been studies
validating the technical feasibility of coal and coal byproducts as alternative sources for REEs
(Akdogan and Ghosh, 2014; Hower et al., 2016; Kolker et al., 2017; Das et al., 2018; Huang et al.,
2018; Lanzerstorfer, 2018; Lin et al., 2018; Valentim et al., 2019).

8
Rare earth concentrations in coal and coal byproducts vary between 270 and 1,480 ppm (Blissett
et al., 2014; Das et al., 2018). According to several studies from different geological locations,
average REE content in coal has been estimated to be 69 ppm on a whole mass basis (Eskanazy,
1987; Ketris and Yudovich, 2009; Karayigit et al., 2000; Hu et al., 2006; Wagner and Matiane,
2018; Huang et al., 2019) while the REE concentration in the U.S. coals was indicated as 62.1 ppm
(Seredin and Dai, 2012). The average REE content in coal fly ashes has been determined as 445
ppm (Pan et al., 2019). On the other hand, a study conducted with 86 coal ash samples from the
U.S. revealed that the total rare earth concentration in coal ash fluctuated between 98 ppm to 525
ppm, in which samples from West Virginia contain the highest concentration (Das et al., 2018).
This finding is also supported by Lin et al. (2018) and Ekmann (2012), both of which indicate that
the Appalachian region has the highest probability of being a source for rare earth recovery. In
another study, the Pennslyvania Department of Environmental Protection stated that massive coal
refuse piles are overlaying 10,000 acres and Yang et al. (2020) estimated the rare earth
concentration in those piles to be between 200-500 ppm. Akdogan and Ghosh (2014) studied the
rare earth content in several Alaskan coal and ash samples. They stated that the inorganic
component of the examined Alaskan coals has a higher rare earth concentration than the organic
component. As another byproduct of coal, bottom ash reportedly contains 110 ppm with a
dominance of La, Ce, and Nd (Allegrini et al., 2014).
According to the study conducted by Honaker et al. (2016), the REE distribution in coal was found
to be associated with the incombustible material in coal rather than the combustible carbon
material. Another study by Honaker et al. (2014) evaluated six coal and coal byproducts. The study
stated that the rare earths are dispersed in the form of monazite, xenotime, and bastnaesite with the
particle size range changing between 1-10 µm or smaller. On the other hand, Dai et al. (2012)
divided rare earth’s formation in coal into five categories: water-soluble, ion exchangeable, and
associated with carbonates, organic matter, and aluminum-silicates. Huang et al. (2019) studied
several Colombian coal samples to address the geologic mechanisms that lead to rare earth
enrichment in Latin American coals. The study verified that rare earth element content appears to
be strongly dependent on the chemical setting during the coal’s formation. The study also
suggested a strong and positive relationship between rare earth and ash content. Pan et al. (2019)
studied coal fly ash samples collected from China and observed a relationship between particle
size and rare earth enrichment, and according to their study, rare earth-enriched components
increased as the particles get finer. Also, a strong relation between Si/Al ratio and rare earth
elements was observed.
Coal is recognized as the second-largest energy source in the world and has massive global
reserves (860 billion tonnes). The world’s coal consumption is estimated to increase at a rate of
0.6% per annum, which generates a tremendous volume of tailings in the form of bottom ash, fly
ash, and slag (Adiansyah et al., 2017; Fiket et al., 2018). A report published by the American Coal
Ash Association (2017) stated that, in 2016, 38 million tons of fly ash were generated in the U.S,
and only 60% of it was utilized. Therefore, using coal processing products for rare earth production

9
can turn the waste of one industry into the feedstock of another, which eventually leads to a more
circular economy (Das et al., 2018; Zhou et al., 2018). While focusing on the technical feasibility
and economic viability of the extraction and recovery of REEs from coal and coal byproducts, it
is equally crucial to ensure that the process is environmentally benign (Navarro and Zhao, 2014;
Valkov et al., 2014). The environmental prospect of rare earth mining was not thoroughly
considered until recent years. However, nowadays, the development of cleaner production
becomes a significant subject, and environmental control is now an essential part of mine
management and many other industries (Paul and Campbell, 2011).
Environmental Impact of Rare Earth Extraction and Regulatory Stipulations
As mentioned previously, rare earth mining faces challenges due to the detectable amount of
radioactive matter (Pillai, 2007; Dutta et al., 2016). Both coal and traditional rare earth-bearing
minerals being currently processed contain a considerable amount of thorium and uranium due to
isomorphic substitution, which needs to be treated specially to prevent their interaction with
groundwater and distribution to air. In some cases, in addition to isomorphic substitution, uranium,
is also formed by epigenetic infiltration during the lignite-subbituminous stage of coalification
(He, 2014; Ault et al., 2015; Qin et al., 2018; Findeiß, 2016; Kursun et al., 2018).
It was reported in a study that bastnaesite contains up to 0.3 wt% thorium dioxide and 0.09 wt%
uranium dioxide, whereas the thorium and uranium contents in monazite can be as high as 20 wt%
and 16 wt%, respectively. Similarly, xenotime may contain up to 5 wt% uranium dioxide (Van
Gosen et al., 2017). In other words, concentrations of 238U and 232Th in these minerals exceed 1000
Bq/kg (Liu and Pan, 2011). As an unconventional resource for rare earth production, coal, also
contains a significant amount of thorium and uranium either associated with elements in the coal
itself or within the minerals that are part of coal formation (Cooper, 2005; Papastefanou, 2007;
Department of Energy, 2017; Lange et al., 2017; Dai and Finkelman, 2018). Besides thorium and
uranium, their decay products such as radium (Ra) and radon (Rn) are present in coal-related
materials as well (United States Geological Survey, 1997). Moreover, many condensed elements
with high volatility (i.e., As, Cd, Cu, Pb, etc.) are present on the surface of fly ash samples
(Parzentny and Rog, 2019). The study conducted by Finkelman (1999) with approximately 7000
coal samples indicated that the average thorium and uranium concentrations in coal are 3.2 and 2.1
ppm, respectively. Another study conducted by Dai et al. (2014) also revealed a certain amount of
uranium in coal samples taken from deposits located in China and Russia. According to a
characterization study conducted by the United States Geological Survey (1997) with
approximately 2,000 U.S. coal samples, the concentration of thorium and uranium has been found
to mostly vary between 1 to 4 ppm with the highest concentration value of 20 ppm being reported
in some cases. It was reported that uranium organically bounds within the coal and can also be
associated with other minerals such as rare earth phosphates (Finkelman et al., 2018).
The rare earth element extraction processes can yield approximately 1.4 tons of radioactive waste
in the form of solid, liquid, or gas for one ton of rare earth oxide (REO) (Jiabao and Jie, 2009;
British Geological Survey, 2011; Navarro and Zhao, 2014). For example, at the Bayan Obo Mine,

10
the largest mine in China, which produces rare earths as a secondary product of iron ore, 200 tons
of thorium dioxide sludge are produced every year from 100 thousand tons of rare earth
concentrates. When naturally-occurring radioactive materials are concentrated or released by
human activities (i.e., mining), they are classified as technologically enhanced naturally occurring
materials (TENORM) (Findeiß, 2016). If not regulated correctly, exposure to such elements may
develop cancer risk for workers, severely damage surface vegetation, cause water pollution, and
affect agricultural output.
In general, thorium and uranium-containing leaching wastes are generally neutralized with
limestone before their disposal. If the radionuclide-containing waste is solid, it must be kept moist
to minimize dust formation. Additionally, impoundment facilities are built with waterproof
materials like high-density polyethylene (HDPE) to prevent their interference with soil and
groundwater. Further, at the impoundment site, the radioactive element containing tailings are
mixed with barium hydroxide ([BaOH]2) to precipitate radioactive elements (Findeiß, 2016).
Another consideration is reducing the concentration of radioactive materials to less than 500 ppm,
which is the internationally maximum allowed concentration limit to dispose of the waste without
restriction. One way to do that is by mixing radioactive waste with other residues to lower the
concentrations of thorium and uranium (Findeiß, 2016).
Various regulatory approaches exist to handle radioactive materials. The International Atomic
Energy Agency (IAEA) has specific guidelines for these materials, which are used by many
countries. According to a study conducted at this mine by Baotou Radiation and Environmental
Institute, the radioactivity at the plant and in the soil was 32 and 1.7 times higher than the normal
range, respectively. Typically, the uranium concentration in soil is between 0.3 to 11.7 mg/kg, and
the average radioactivity of 234U is between 0.02 to 0.04 Bq/g (Abdel-Sabour, 2014). Likewise,
the thorium content in the leaching pond was around 5 mg/L, while the thorium concentration in
freshwater was 0.01 to 1 µg/L (Findeiß, 2016). In another study, it was reported that the radiation
level in the Bayan Obo city area was in the range of 100-150 nGy/h which was 50% higher than
the accepted value. This range increases to 600-2000 nGy/h at mining sites. Similar high radiation
activity results were reported in Wang and his coworkers’ (2016) study. According to the
measurements made in the vicinity of the Bayan Obo mine, the 232Th activity in total suspended
particulates in mining and smelting area was between 820-39 and 720 µBq/m3 respectively, which
is significantly higher than the world’s maximum acceptable limit of 0.5 µBq/m3. For the purpose
of cleaner production, China implemented the IAEA’s safety standards as a national standard in
2003 to prevent ionizing radiation (Liu and Pan, 2011; Wang et al., 2017). Again in China, an
environmental impact assessment approved by Environmental Protection Agency (EPA) is
requested at non-uranium mining sites containing natural radioactive nuclides.
For thorium and uranium, radioactivity with less than 1 Bq/g is considered not radioactive, and the
waste is classified as exempt waste. Nonetheless, in the United Kingdom, 0.1 Bq/g must be
achieved for residental land use. Moreover, radioactive materials with less than 50 ppm of uranium
and thorium or any combination of the two are regarded as not radioactive by the U.S. Nuclear

11
Regulatory Commission (NRC). Additionally, according to the World Health Organization
(WHO), the maximum uranium level in drinking water can not exceed 15 µg/L, and the maximum
contaminant level set by the EPA is 20 µg/L (Rozmaric et al., 2009; Camacho et al., 2010).
According to the Canadian Soil Quality Guidelines, the maximum allowable concentrations of
these hazardous elements are 23 ppm for agricultural and residential land use, 33 ppm for
commercial land use, and 300 ppm for industrial land use. (Abdel-Sabour, 2014). Waste within
the allowed level is sent to a landfill, and a level greater than 100 Bq/g must be buried (World
Nuclear Association, 2021).
Furthermore, the chemical extraction of rare earths from monazite involves occupational radiation
exposures in the range of 0.13–1 mSv per ton depending on the concentration of monazite (Pillai,
2017). Other researchers studied thorium and uranium activity in a monazite mine in Spain and
observed an activity range of 70-100 Bq/kg and 40-60 Bq/kg for thorium and uranium, separately
(Garcia-Tenorio et al., 2018). The radioactivity and chemical characterization of Malaysian
monazite processing residue was comprehensively investigated in Jaffary et al.’s (2019) study,
which clearly pointed out that the radioactivity is above world permitted limits. Similarly, Aziman
and Ismail (2020) conducted a study to emphasize the high radioactivity level of water leach
residue generated after processing monazite in Malaysia. For these reasons, countries like
Australia and the U.S. stopped rare earth production from monazite in the early 90s since it has
the highest radioactive element concentration among other conventional rare earth-bearing
minerals (Hedrick, 2000; Schuler et al., 2011). Similarly, in India, improved effluent treatment
processes are applied and, the radionuclide concentration in the river, close to a mine site, is
reduced subsequently (Paul and Pillai, 1991). On the other hand, in Malaysia, two rare earth
processing plants were closed in 1992 due to the problem arising from disposing of a vast amount
of naturally occurring radioactive material wastes (Al-Areqi et al., 2016). For more details
regarding to the natural levels of radioactivity in rare earth solid waste are given in Table 3.
Table 3 Level of radioactivity in rare earth solid waste (modified from Liu and Pan (2011).
Uranium (Bq/kg) Ra-226 (Bq/kg) Thorium (Bq/kg) External ɤ Dose Rate
(nGy/h)
Average Maximum Average Maximum Average Maximum Average Maximum
2,081 83,044 1,240 53,700 4786.3 85,600 3,249 48,344
Even though the initial concentration of thorium and uranium in coal and coal byproducts is not
high compared to their existence in traditional rare earth minerals, the radioactive elements can be
substantially enriched along with the processing stages and may present in the form of solid, liquid,
or gaseous wastes. It was stated that when coal is burned into fly ash, it creates a concentrated
form of thorium and uranium with a concentration approximately 10 times higher than the initial
level (Hvistendahl, 2007). Although the direct toxicity of thorium is low because of its stability
under ambient temperature, the fine thorium powder is self-ignitable (Metaxas et al., 2003). The
radionuclides may accumulate in the upper layer of the soils, form complexes with organics, and

12
can be moved into water streams or air (Abdel-Sabour, 2014). When these toxic ions enter living
organisms, such as the human body, they tend to accumulate in the liver, spleen, and marrow,
where they precipitate in their hydroxide form (Metaxas et al., 2003). It is noteworthy that acid
mine drainage (AMD) sludge has very low concentrations of thorium and uranium (Vass et al.,
2019). Vass et al. (2019) studied several AMD sludge samples and reported an average of 5.67
and 4.46 g/ton thorium and uranium concentration, respectively. The radioactivity level of the
radionuclides in coals from different regions are presented in Table 4 and the level of radioactivity
in the solid waste generated from coal processing is given Table 5. Parzentny and Rog (2019)
performed a detailed study on the role of mineral matter in concentrating thorium and uranium in
coal and combustion residues, where the researchers also summarized the thorium and uranium
contents of a wide variety of coal and coal-based samples worldwide (Table 6).
Table 4 Radioactivity level (Bq/kg) of the nuclides in coal in various countries (modified from
World Nuclear Association (2021)).
Country U-238 Ra-226 Ra-228 Th-232
Australia 8.5-47 19-24 11-64 11-69
Brazil 72 72 62 62
China Typically 10-25, may be up to 29,000
Germany 10-25,
average 32
10-63,
average 21
Greece 117-390 44-206 9-41 NA
Hungary 20-480 NA 12-97 NA
Poland 159 NA 123 NA
Romania 415 557 NA 170
United Kingdom 7-19 8-22 NA 7-19
United States 6-73 8.9-59 NA 4-21
Table 5 Level of radioactivity (Bq/kg) in coal solid waste (modified from Liu and Pan (2011)).
Uranium Ra-226 Thorium External ɤ Dose Rate
(nGy/h)
Average Maximum Average Maximum Average Maximum Average Maximum
225 7600 326 92,178 91 910 162 987

13
Table 6 Thorium and uranium concentration in the world’s selected coal and coal-based
materials (modified from Parzentny and Rog (2019)).
Type of Material Country/Area Thorium
(g/Mg)
Uranium
(g/Mg)
Raw coal
Bulgaria 6 5
Poland 3.2 1.9
Poland 2.3 1.9
USA 3.2 2.1
USA 1.5-5.9 1.2-3.9
China 5.84 2.43
China NA 0.75-7207
Feed Coal (the
coal before
burning)
Europe 5.6 6.1
Europe 17-65 5-29
Brazil 14.09-17.04 6.12-7.67
Poland 1.1-2.6 0.2-0.8
Spain 5.6 6.1
Turkey 9 14
Fly ash
Europe 22.1 22.9
Brazil 33.5-42 14.5-24.8
China 5.8-50 2.6-51.9
Poland 23 10.6
Poland 7.6-19.3 3.3-10.6
Spain 22.1 22.9
Turkey 22 34
USA 14.0-28.0 6.9-12.7
USA 11.8-21.6 6.72-10.4
Bottom ash
Europe 20.6 19
Australia 15-42 5-9.7
Brazil 25.8-42.9 9.3-16.7
China 19.1-25 8.5-379.2
Spain 20.6 19
Turkey 15 19
USA 14.9-25.3 0.9-9.7
USA 13-25.3 5.87-9.83

14
Solution Purification Techniques to Remove Thorium and Uranium from Rare Earth
Elements
Processing rare earths requires complex separation techniques using a variety of chemical
compounds. Typically, bastnaesite and monazite are first subjected to sample preparation and pre-
concentration, including size reduction, roasting, froth flotation, which is later followed by
extraction with a strong acid (Yang et al., 2020). Fatty acids and hydroxamate-based collectors
were found to be the most efficient for bastnaesite flotation, and benzoic acid has been found to
be adequate in separating bastnaesite from monazite. Although it is not preferred these days,
roasting the ore at 600-800 °C and leached it with HCl acid was another method to recover rare
earth elements. An alternative approach was proposed by Yorukoglu and his coworkers’ (2003)
study to enhance the leaching ability of bastnaesite by the addition of thiourea (CH4N2S). In the
case of monazite processing, typically, two methods are followed; sulfuric acid treatment or
sodium hydroxide decomposition, which both require extremely high temperatures to activate the
reactions (Yang, 2020). To reduce the thorium amount reporting to the pregnant leach solution, an
alternative pretreatment was developed by Merrit (1990) which involves converting rare earth
phosphates into rare earth oxysulfides by heating with CaCl2 or CaCO3 in a sulfurizing
environment. Gravity separation techniques can be applied to recover relatively high-density rare
earths from low-density gangues associated together. In a study conducted by Ozbayoglu and
Atalay (2000), approximately 50% recovery and 36% REO product were achieved using a
combination of the scrubbing-cycloning-multi gravity separation process. Similarly, recovery of
rare earth elements can be enhanced by eliminating the magnetic gangue minerals via magnetic
separators. Gao and Chen (2010) achieved approximately 80% recovery using low-intensity and
high-gradient magnetic separators.
Physical and chemical methods to recover rare earths are well-summarized (Ozbayoglu and
Atalay, 2000; Kim and Osseo-Asare, 2012; Jordens, 2016; Kermer et al., 2016; Anderson, 2017;
Suli et al., 2017; Zhang and Honaker, 2018; Honaker et al., 2019; Zhang and Honaker, 2019).
However, during rare earths recovery, thorium and uranium are also enriched alongside rare earths.
Especially after the leaching of rare earths with acids, such as sulfuric acid (H2SO4), hydrochloric
acid (HCl), or nitric acid (HNO3), thorium and uranium also dissolve, which in return, requires
further purification of the leachate. Although many remediation solutions are known, only a few
of them have been found feasible for a large-scale operation. For this study, efforts focused on
hydrometallurgical purification techniques, namely precipitation, solvent extraction, and
adsorption processes. In some cases, the combination of multiple methods is suggested to be used
(Chellam and Clifford, 2002; Akkaya, 2013; Zhang and Zhao, 2016).
2.5.1. Selective Precipitation
Selective precipitation of elements by controlled pH is the most well-known method for the
removal of certain elements from impure leach liquors. Besides, it is a simple and cost-effective
operation (Monhemius, 1977; Zhou et al., 2018). The underlying mechanism of precipitation is

15
reacting chemicals with ions to generate insoluble complexes, which, can be separated from
aqueous solutions by filtration (Zhou et al., 2018). Precipitation is induced by reduction using
hydroxides or sulfides (Hostetler and Garrels, 1962). It takes the advantage of different
precipitation pH ranges for thorium, uranium, and rare earths (Vijayalakshmi et al., 2001; Silva et
al., 2018).
It was stated in Kim and Ossae’s (2012) study that the dissolved species of thorium, uranium and
rare earth metals in acidic solutions may be separated by pH adjustment, in which thorium
separation is expected to take place first. This statement also agrees well with other studies in
literature indicating different precipitation pH ranges for thorium, uranium, and rare earths. As
indicated in the study of Zhu et al. (2015), thorium’s precipitation pH range is typically 2.5-5.5;
following this, uranium and rare earths precipitation subsequently takes place. The precipitation
pH range of uranium and rare earths is approximately 5.5-7 and 6.8-8, respectively (Langmuir,
1978; Zhu et al., 2015).
At the Bayan Obo Mine, the rare earth mineral, bastnaesite, is beneficiated using a combination of
physical and chemical processes. After leaching, both rare earths and thorium are converted into
their hydroxide forms using sodium hydroxide, and then they are leached with hydrochloric acid.
Finally, thorium and iron are precipitated at a pH region of 4 to 5. The solution containing
substantial rare earths elements proceeds to further treatment for the recovery of individual rare
earth elements (Navarro and Zhao, 2014; Wang et al., 2017). In Sichuan Mine, the second largest
rare earth mine in China, the ore is roasted at a temperature higher than 500 °C, where thorium
and cerium are converted to ThO2 and CeO2. Later, thorium is separated from cerium with the
caustic attack. At Mountain Pass Mine, bastnaesite is leached with hydrochloric acid, which also
dissolves uranium along with rare earths. The dissolved uranium is then selectively precipitated
using barium chloride or sodium sulfate (Findeiß, 2016).
Al-Areqi and his coworkers (2016) studied selective precipitation of thorium from Malaysian
monazite using ammonia. In addition to the typical precipitation method induced by adjusting the
solution pH with a basic chemical, oxalic acid has been employed to initially co-precipitate
thorium and rare earths so as to separate them from uranium. The precipitate is subsequently
subjected to selective dissolution to further separate thorium from rare earth using a hot sodium
carbonate solution (Zhu et al., 2015). A similar process was followed by Amer et al. (2013), in
which alkali breakdown of monazite was first achieved and followed by dissolution-oxalate
precipitation to leave uranium in the solution. The precipitation efficiencies of rare earths and
thorium reached 99%. Oxalate precipitation reactions of rare earth elements, thorium, and uranium
in sulfate media are given in the Equations (1-4). Later, thorium separation can be achieved by
dissolving the precipitated solid in a carbonate-containing solution (i.e., Na2CO3 and NaHCO3)
where thorium will create a soluble complex.
𝑅𝐸𝐸2(𝑆𝑂4)3(𝑎𝑞) + 3𝐻2𝐶2𝑂4(𝑎𝑞) = 𝑅𝐸𝐸2(𝐶2𝑂4)3(𝑠) + 3𝐻2𝑆𝑂4(𝑎𝑞) (1)
𝑇ℎ(𝑆𝑂4)2(aq) + 2𝐻2𝐶2𝑂4(aq) = 𝑇ℎ(𝐶2𝑂4)2(s) + 2𝐻2𝑆𝑂4(aq) (2)

16
𝑈𝑂2(𝑆𝑂4) + 𝐻2𝐶2𝑂4(𝑎𝑞) = 𝑈𝑂2(𝐶2𝑂4) + 𝐻2𝑆𝑂4(𝑎𝑞) (3)
𝑈𝑂2(𝐶2𝑂4) + 3𝐻2𝑆𝑂4(𝑎𝑞) = 𝑈𝑂2(𝑆𝑂4) + 2𝐶𝑂2(𝑎𝑞) + 3𝐻2𝑂 (4)
Double salt precipitation with sodium or sulfate can also be an alternative method; however,
thorium’s ability to form double salts is limited. Although some studies report thorium
precipitation as high as 80%, other studies are stating lower thorium precipitation (25-30%) (Zhu
et al., 2015). Therefore, this method varies depending on the operational conditions and ore
characteristics.
2.5.2. Solvent Extraction
Solvent extraction has been the most extensively used method for purification purposes due to its
capability to handle large volumes of aqueous solutions (Asselin et al., 1949; Hidayah and Abidin,
2017). It has also been an effective technique to remove hazardous matters from rare earths (Brown
and Sherrington, 1979).
One of the crucial parameters in the solvent extraction process is the type and concentration of the
extractant (organic chemical) because the efficiency of the process depends on the extractant’s
ability to transfer metal ions between two immiscible phases, aqueous and organic (Hidayah and
Abidin, 2017; Zhou et al., 2018). Organic phosphorus acid, carboxylic acid, tertiary and quaternary
amines, and sulphoxide are some of the commercially used extractant types which have been
proved to be effective for the separation of radioactive elements while present with rare earths
(Gupta et al., 2002; Belova et al., 2015; Zhu et al., 2015; Giri and Nath, 2016; Kuang et al., 2017).
However, most of these extractants are also effective for the recovery of rare earths. Therefore, it
is crucial to develop a unique experimental scheme for the desired selectivity and separation
efficiency.
Many studies have been conducted to investigate the impact of different extractant types, diluents,
and operating conditions on the removal of thorium and uranium from traditional rare earth-
bearing minerals (Nasab, 2014; Lu et al., 2016; Samsonov et al., 2015; Wang et al., 2017). One of
the earliest studies in this field was conducted by Hughes and Singh (1980), who used a secondary
amine to separate thorium from monazite. Palmieri (1987) explored the possibility of separating
uranium using chelating reagents. Likewise, Gupta et al. (2002) investigated thorium and uranium
separation from rare earths using Cyanex 923. On the other hand, Amaral and Morais (2010)
studied the removal of thorium and uranium from sulfuric leach liquor generated from monazite
leaching using a mixture of primary and tertiary amine (Primene JM-T and Alamine 336)
extractants. The expected reactions between primary amine and thorium, and tertiary amine and
uranium are given in Eqs. 5 and 6, separately.
4𝑅𝑁𝐻2𝐻+𝐻𝑆𝑂4− + (𝑇ℎ(𝑆𝑂4)4)− = (𝑅𝑁𝐻2𝐻+)4(𝑇ℎ(𝑆𝑂4)4)4− + 4𝐻𝑆𝑂4
− (5)
4𝑅3𝑁𝐻+𝐻𝑆𝑂4− + (𝑈𝑂2(𝑆𝑂4)3)4− = (𝑅3𝑁𝐻+)4(𝑈𝑂2(𝑆𝑂4)3)4− + 4𝐻𝑆𝑂4
− (6)

17
Furthermore, Nasab et al. (2011) studied thorium removal using Cyanex 272 and Cyanex 302 as
the extractants. Conventional extractants such as di-Ethylhexyl phosphoric acid (D2EHPA) and
tributyl phosphate (TBP) are also indicated as effective extractants for the purpose of thorium and
uranium separation. However, the use of TBP is restricted to the extraction from nitrate and
chloride media (Gupta et al., 2002). Purification of impurities using TBP in kerosene also required
multi-stage extracting and stripping (Al-Areqi et al., 2015). Multiple contacts between aqueous
and organic solutions may increase the extraction efficiency; however, the organic extractant tends
to be lost into the aqueous phase after a long contact between aqueous and organic phases.
When the extraction is completed, the extractant is stripped by mixing the solution with acids. This
removes ions from the organic phase, draws them into the aqueous acids, and regenerates the
extractant (Jorjani and Shahbazi, 2016). In some cases, a combination of acid and precipitation
stripping is applied to recover the organic extractant (Findeiß, 2016). To further recycle the used
organic phase, ammonium nitrate solution and deionized hot water can be used to remove
undesirable elements, such as calcium, iron, magnesium, and phosphorus (Jorjani and Shahbazi,
2016). A schematic representation of solvent extraction is given in Figure 1.
Figure 1 Schematic representation of solvent extraction tests.
2.5.3. Solid-Phase Separation
Separation using solid materials is heavily used in metal separations, hydrometallurgy, water and
wastewater treatment, removal, and recovery of metal ions (Sani et al., 2015). Ion exchange and
adsorption processes are two very similar solid-liquid separation techniques. Ion exchange is a
process in which dissimilar ions with the same charge are exchanged between a solution and a
solid (Hidayah and Abidin, 2017). The exchange reaction between ions in solution and ions
attached to the matrix is generally reversible. On the other hand, adsorption can be explained by
electrical attraction to the solid surface, and it is the net accumulation of matter at the interface
between solid and aqueous phases (Jorgensen, 1989).

18
Recently, the application of adsorption using porous solid sorbent has been gradually increased
due to its high efficiency, easy handling, low maintenance, and operating costs over other
techniques (Liu et al., 2013; Nandanwar et al., 2016). It has an advantage over the conventionally
used solvent extraction mechanism by eliminating the consumption of organic extract and reducing
environmental pollution that organic chemicals may create (Xiong et al., 2020). Adsorption has
also been used for fuel processing containing thorium and uranium (Chen et al., 2016).
Sorbents are available in various material forms, such as natural and synthetic organic, inorganic,
or composite materials. Their surfaces are often heterogeneous, and bonding energies may vary
from one site to another. Materials like zeolite, apatite, activated carbon, calcined phosphate,
oxides, and hydroxides are examples of some highly abundant sorbents (Ladeira and Goncalves,
2007). Especially silica-based materials have suitable physical, chemical, and thermal stability.
There are plenty of studies about thorium and uranium adsorption on different materials
(Aksoyoglu, 1989; Badei et al., 1992; Milonjic et al., 1992; Qadeer et al., 1992; Jain et al., 2001;
Kilislioglu and Bilgin, 2003; Humelnicu et al., 2006; Sikalidis et al., 2008; Wang et al., 2012; Liu
et al., 2013; Kaynar et al., 2015). Even though several studies were performed to examine the
possible application of sorbents to remove naturally occurring heavy metals and radioactive
materials, predominantly, these studies were performed for decontamination of polluted waters
rather than rare earth production (Obaid et al., 2018). Doi et al. (1975) conducted a comprehensive
study about uranium adsorption on a wide variety of sorbents such as peat, ferric oxide, clay
minerals, zeolite, calcite, and apatite. The highest uranium uptake on peat was observed at a pH
range of 3.8-8.5. It was noticed that the humic acid in the peat was causing uranium adsorption,
and as the coalification progressed, the adsorption of uranium decreased in the order of peat,
lignite, bituminous coal, and anthracite. Khalili and Al-Banna (2015) also studied thorium and
uranium adsorption by humic acid. Sikalidis et al. (2008) studied thorium and uranium adsorption
by clay minerals, montmorillonite, and vermiculite. Alternatively, Kutahyali and Eral (2010)
investigated the adsorption of thorium and uranium on activated carbon. Fasfous and Dawoud
(2012) performed a thorough study about the adsorption of uranium by multiwalled carbon
nanotubes (CNT) and they also examined the kinetic and thermodynamic aspects of the adsorption
process. Among all the carbon-based materials (i.e., carbon nanotubes, graphene, carbon fibers),
CNT is more favorable due to its high specific surface area (Yadav et al., 2019). Further, Monji et
al. (2016) studied the adsorption of uranium ions in the presence of lanthanides using a byproduct
of the agricultural industry. Considering the immense quantities of agricultural waste, their use for
the adsorption of ions substantially benefits the environment.
Sometimes the sorbent needs surface modification to enhance its adsorption capability. The
modified material is called synthetic sorbent, which is more stable compared to its natural form
(Ullah et al., 2012). Zou et al. (2009) studied uranium removal by manganese oxide-coated zeolite
samples. On the other hand, Metaxas et al. (2003) and Baybas and Ulusoy (2011) focused on
thorium adsorption using different zeolite and clay samples in addition to investigating the effect
of the modified (pretreated) samples. In a similar study with activated carbon, Yakout (2017) stated

19
that uranium adsorption onto KOH-modified activated carbon is more selective than thorium
adsorption. Most recently, Xiong et al. (2020) studied membrane-based separation using a novel
sorbent (covalent organic frameworks, COFs) with high adsorption capacity in order to separate
thorium from uranium and rare earths. Adsorption via membrane is known to consume less energy,
and it is easy to operate as well.
The adsorption process depends on the chemical nature of both fluid and solid. Also, it is highly
affected by the available surface area and pore volume of the adsorbent (Couper et al., 2009).
Besides, the selectivity depends on many other factors such as the particle size of the absorbent,
pH of the solution, contact time, nature of the solution, etc. The pH plays an important role in
sorption processes because it can influence the aqueous chemistry of the ions, determines the
hydrolysis products and the properties of the active sites of the sorbent (Faghihian et al., 2004;
Cheira et al., 2017). It also affects the external charge of the adsorbent which results in a change
in the electrostatic interactions. It was seen that the capacity of uranium absorption increases with
increasing pH and reaches a maximum value at a pH range of 2.0 to 3.5 (Cheira et al., 2017). In
another report published by the U.S. Environmental Protection Agency (1999), it was stated that
when carbonate ions are present, the adsorption of uranium reaches its maximum in the pH range
5 to 8 and decreases as the pH continues to increase. Particle size distribution is another critical
factor due to its influence on the mass transfer rates. Mass exchange rates increase with decreasing
particle size (Kammerer et al., 2011; Monji et al., 2016). An increase in adsorption capacity is
expected when the particles are finer since the effective surface area increases as the size decreases
(Zou et al., 2009). The pore size distribution also plays a significant role in the diffusion of the
solutes onto the sorbents.
Following adsorption, desorption is performed by either elevating the temperature, reducing
pressure, or washing with a suitable reagent. The desorbed material may be recovered as a valuable
product or discarded as waste (Couper et al., 2009).

20
CHAPTER 3
EXPERIMENTAL AND METHODLOGY
Samples and Materials
Synthetic leach solutions containing rare earth elements, thorium, uranium, and major metals were
prepared and used throughout the study. Standard Inductively Coupled Plasma (ICP) solutions
with 1000 ppm of rare earths, thorium, uranium was purchased from Ricca Chemical while
respective metal chlorides with a grade higher than 99% were purchased from Alfa Aesar.
Various alkaline salts (i.e., sodium hydroxide (NaOH), potassium hydroxide (KOH), ammonia
hydroxide (NH4OH)) were purchased from Merck and Fisher Scientific for selective precipitation
tests. Hydrochloric acid (HCl) and sodium hydroxide with analar grade were used throughout the
study for pH adjustment. The Oakton 450 pH meter was used to measure the solution pH, which
was calibrated using pH 4, 7, and 10 buffer solutions purchased from Ricca Chemical.
Tri-butyl phosphate (TBP) and kerosene were purchased from Fisher Scientific and Sigma Aldrich,
respectively, and used as extractant and diluent for solvent extraction tests. Adsorption studies
were performed as well, during which zeolite samples with different particle sizes were purchased
from both KMI Zeolite Inc. and Heiltropfen Lab LLP.
Deionized water was used at all stages of the study, and experiments were performed at room
temperature unless otherwise noted. During each experiment, representative samples taken from
the aqueous and solid samples that were generated from various stages were subjected to rare earth
elements and major metal analyses using Inductively Coupled Plasma-Optical Emission
Spectroscopy (ICP-OES), and thorium and uranium analysis using Inductively Coupled Plasma-
Mass Spectroscopy (ICP-MS). ICP techniques were used due to their ability to detect trace
elements with low detection limits and high sensitivity. While ICP-MS analyses were provided by
West Virginia University National Research Center for Coal and Energy (WVU NRCCE), ICP-
OES analyses were provided by the University of Kentucky. Except for XRF, particle size
distribution, and BET nitrogen adsorption analyses, all other characterization testing was
performed at WVU Shared Research Facility. A detailed description of each analysis is given in
part 3.4.
Sample Preparation
The initial feedstock material used at the earlier stages of the study was obtained from a coal
preparation plant operating in Southern West Virginia. The coarse coal refuse sample was
subjected to various unit operations at the pilot coal processing plant located in Providence,
Kentucky, to produce high-grade rare earths. Crushing, leaching, solvent extraction, and stripping
were applied using di-(2-Ethylhexyl) phosphoric acid (D2EHPA) and 6 mol/L hydrochloric acid
as the extractant and stripping agent, respectively. An acidic strip solution was generated during

21
the process and used for the exploratory tests that aimed to separate thorium and uranium from
rare earths.
Later, synthetic solutions were prepared following the elemental composition of the strip solution
produced at the pilot plant. The solution was prepared freshly before each test to avoid any sudden
compositional change which may occur over time. Calculated volume from 1000 ppm standard
ICP solutions of REEs, Th, and U were taken by pipettes to prepare synthetic leach solution. Six
mol/L hydrochloric acid medium was maintained during the synthetic feedstock preparation. The
elemental composition of the synthetic feedstock is provided in Table 7. As seen, the concentration
of total rare earth elements is approximately 37 mg/L while the concentration of thorium and
uranium is 0.5 and 0.9 mg/L, separately. The content of major metals (i.e., Al, Ca, Fe, K, and Mg)
is around 74 mg/L.
Table 7 Elemental composition of synthetic feedstock solution.
Element Sc Y La Ce Pr Nd Sm Eu
Concentration (mg/L) 0.00 3.09 1.91 14.47 1.90 9.03 2.67 0.47
Element Gd Tb Dy Ho Er Tm Yb Lu
Concentration (mg/L) 2.01 0.10 0.82 0.09 0.33 0.00 0.14 0.01
Element Th U Al Ca Fe K Mg
Concentration (mg/L) 0.50 0.86 1.99 55.20 12.85 0.82 2.86
Methodology
3.3.1. Preliminary Selective Precipitation Tests
A number of preliminary studies were performed to assess the potential of using different
separation techniques to remove thorium and uranium from rare earths. Selective precipitation
tests were first conducted to selectively precipitate out thorium, uranium, and rare earth elements
according to their distinctive precipitation behaviors at different pH values.
A 200-ml feedstock solution with an initial pH value of zero was used for the experimental testing.
2 mol/L sodium hydroxide (NaOH), potassium hydroxide (KOH), and ammonium hydroxide
(NH4OH) were used to incrementally increase the pH, respectively. The pH value was elevated
gradually by adding alkaline solution in a step-wise manner followed by three-min conditioning
using a mechanical stirrer. Since the addition of hydroxides augments the hydrolysis and above a
certain concentration, it results in precipitation (Tomazic et al., 1962), each addition of alkaline
salt was monitored carefully to prevent sudden increments (Figure 2A). When significant
precipitation was visually observed, the test was paused, and the solution was subjected to settling
for a sufficient amount of time and subsequent filtration using 0.45µm pore-sized filter paper
(Figure 2B). Afterward, precipitated solids were dried and weighed. A detailed flowsheet
governing selective precipitation tests is shown in Figure 3.

22
Figure 2 Pictures illustrating the experimental procedures of selective precipitation tests. (A) pH
measurement, (B) Settling after precipitation.
Figure 3 Experimental flowsheet followed during selective precipitation tests.
(A) (B)

23
3.3.2. Preliminary Solvent Extraction Tests
In addition to precipitation, solvent extraction tests were continued to explore its possibility of
separating radioactive elements from rare earths. Tri-butyl phosphate was selected for the study
due to its capability to selectively extract thorium and uranium under controlled operating
conditions (Palmieri, 1987; Habashi, 1997; Zhang et al., 2016). Two sets of solvent extraction tests
were designed and performed during the study, and the corresponding flowsheet is given in Figure
4.
Each test was conducted with a 50-ml synthetic feedstock solution at an initial pH value of 2.5. As
seen from Figure 4, the solvent extraction test consisted of two parts, with the first and second
parts targeting uranium and thorium removal, separately. To initially separate uranium, 5 v% TBP
dispersed in a kerosene solution was used as the extracting organic phase. Kerosene was chosen
as the diluent to enhance the extraction capability of TBP and reduce the emulsification of the
extractant (Anitha et al., 2014). Mixing of the organic and aqueous phases was performed using a
mechanical stirrer, then the phases were separated using a separation funnel (Figure 5). A 2 mol/L
HNO3 solution was used at both the scrubbing and stripping stages. A scrubbing circuit was
engaged after the extraction phase to wash impurities from the organic phase before the final
purification stage.
The aqueous phase obtained from the uranium extraction step was subsequently sent for the
thorium extraction, and 40 v% TBP was used accordingly. Deionized water was used for the
thorium stripping. Both sets of the solvent extraction tests were conducted under the same
conditions except for the number of stages applied to extraction, scrubbing, and stripping. For the
first set of exploratory tests, each unit process (extraction, scrubbing, stripping) was conducted as
a single stage, while two stages were conducted for each of the aforementioned processes during
the second set of tests. Test results obtained were used to compare the separation efficiencies
resulting from various extraction stages, scrubbing, and stripping. Detailed operating procedures
for the exploratory solvent extraction tests are summarized in Table 8.
Table 8 Operating conditions for exploratory solvent extraction tests.
Uranium Separation Thorium Separation
pH 2.5 2.5
Extractant (v/v) 5% TBP 40% TBP
Scrubbing agent 2 mol/L HNO3 -
Stripping agent 2 mol/L HNO3 DI water
O/A ratio at extraction 1:1 2:1
O/A ratio at scrubbing 5:1 -
O/A ratio at stripping 2:1 2:1
Retention time (min) 20 20

24
Figure 4 Experimental flowsheet followed during the exploratory solvent extraction tests.
Figure 5 Separation between aqueous and organic phase during solvent extraction tests.

25
3.3.3. Modified Experimental Protocol
A modified experimental protocol (Figure 6) was developed based on the test results obtained from
the previous experimental work. The new experimental flowsheet consisted of one-stage selective
precipitation followed by two-stage solvent extraction that aimed to achieve enhanced separation
between thorium, uranium, and rare earths. A 2 mol/L sodium hydroxide solution was used to
gradually increase the pH to a value of around 4.85 that corresponded to a region under which
solid precipitation was first observed. The tests were designed in a manner that precipitation aimed
to selectively precipitate out thorium while the remaining filtrate loaded with uranium and rare
earth elements was used as the feedstock for subsequent solvent extraction. Each solvent extraction
test was performed with a 100-ml filtrate solution obtained from prior selective precipitation.
Extraction and stripping were both carried out in two stages. In addition, various parameters, such
as type and concentration of extractant, feed solution pH, organic to aqueous ratio (O/A), and type
and concentration of strippant, were evaluated to optimize the solvent extraction stage. Both rare
earth-enriched (aqueous phase 2 in Figure 6) and uranium-enriched (aqueous phases 3 and 4 in
Figure 6) streams were produced at the end of each solvent extraction test. Representative aqueous
samples were taken from each step for rare earth, thorium, and uranium analysis using both ICP-
MS and ICP-OES.
3.3.3.1. Experimental Design for Modified Experimental Protocol
Experimental design methodologies were used to guide the design of various separation techniques
applied in this study. For this purpose, a Box-Behnken experimental design technique based on
response surface methodology (RSM) was used to determine the number of tests that need to be
conducted. The design technique also ensures that the tests to be performed are sufficient to
evaluate the significance of every influential operating parameter. Detailed descriptions of the
experimental designs are given in the following sections.
The modified experimental protocol (Figure 6) was divided into two subsets of experimental
design. Each subset has a fixed combination of extractant and strippant, as shown in Figure 7(A)
and Figure 7(B), separately. It can be seen that three or four operating parameters, three levels of
each, will be investigated during each subset study. The levels of each parameter have been
determined based on prior studies conducted in a similar field (Menzies and Rigby, 1961; Nasab
et al., 2011; Biswas et al., 2013; Xie et al., 2014; Jha et al., 2016). The retention time was fixed at
10 min. A total of 15 tests and 27 tests were conducted for the first and second subset, respectively,
with the only difference being the stripping agent. The equation used to determine the number of
tests for each subset is:
𝑁 = 2𝑘(𝑘 − 1) + 𝐶0 (7)
where N is the number of tests required for the experimental design, k is the number of variables
to be studied (k=3), C0 is the number of center points (C0=3). Detailed test order and conditions
for the two subsets of experiments are shown in Table 9 and Table 10, respectively. Adequate
separation is obtained in conditions of low extraction of one component and high extraction of the

26
other. One component tends to stay in the organic phase, and the other in the aqueous phase. This
is achieved when the chemical nature of the compounds is significantly different.
Figure 6 A modified experimental protocol developed for enhanced separation of thorium,
uranium, and rare earths.

27
Figure 7 Experimental designs for uranium separation using TBP as the extractant: (A) DI
water as the strippant; (B) H2SO4 as the strippant.
Table 9 Test order and conditions of the solvent extraction stage following the first subset of the
modified experimental protocol.
Test No. Extractant Conc. (v% TBP) pH Organic/Aqueous Ratio
1
40
2.5 1
2 4.5 1
3 3.5 2
4 3.5 2
5 3.5 2
6 2.5 3
7 4.5 3
8
50
3.5 3
9 3.5 1
10 4.5 2
11 2.5 2
12
30
2.5 2
13 4.5 2
14 3.5 1
15 3.5 3
(A)
(B)

28
Table 10 Test order and conditions of the solvent extraction stage following the second subset of
the modified experimental protocol.
Test No. Strippant Conc.,
H2SO4 (mol/L)
Extractant Conc.
(v% TBP) pH
Organic/Aqueous
Ratio
1
1
30 3.5 1
2 40 4.5 1
3 50 3.5 1
4 40 2.5 1
5 30 2.5 2
6 30 4.5 2
7 30 3.5 3
8 50 3.5 3
9 40 3.5 2
10 50 2.5 2
11 40 3.5 2
12 40 3.5 2
13 40 4.5 3
14 40 2.5 3
15 50 4.5 2
16
0.5
40 4.5 2
17 50 3.5 2
18 40 3.5 3
19 40 3.5 1
20 30 3.5 2
21 40 2.5 2
22
2
50 3.5 2
23 30 3.5 2
24 40 4.5 2
25 40 3.5 1
26 40 3.5 3
27 40 2.5 2
3.3.4. Zeolite Adsorption Tests
In this present study, zeolites, a group of crystalline alumina-silicates, were determined to be used
for the adsorption tests due to their high chemical and radiation stability, unique physicochemical
characteristics, high porosity, high sorption capacity, and many efficient applications to remove
thorium and uranium from aqueous solutions by adsorption (Brindley and Bastovanov, 1982; Dyer
and Jozefowicz, 1992; Misaelides et al., 1995; Kilincarslan and Akyil, 2005; Camacho et al.,
2010). Zeolite’s crystal lattice consists of two tetrahedral structures, SiO4 and AlO4 are arranged
to share each oxygen atom. The crystal structure of a zeolite has a net negative charge due to the

29
charge difference between aluminum and silicon, and it is balanced with the exchangeable cations
(Metaxas et al., 2003). A representation of a zeolite structure is given in Figure 8. The adsorption
tests were carried out in a batch system by mixing the known volume of feedstock solution with a
suitable amount of sorbent for a period of time at a controlled temperature to achieve equilibrium.
Then, the sorbent was separated by filtration using 0.45 µm pore-sized filter paper, and the
representative supernatant was subjected to thorium, uranium, rare earths, and major metal
analyses using ICP-MS and ICP-OES.
Figure 8 Structure of zeolite (after Zendelska et al., 2015).
3.3.4.1. Experimental Design for Zeolite Adsorption Tests
The effects of various operational parameters such as feed solution pH, adsorbent particle size,
zeolite amount, and contact time on the removal of thorium and uranium were investigated during
zeolite adsorption tests. According to earlier studies, the solution pH was decided to vary between
2-4, (Kaygun and Akyil 2007; Baybas and Ulusoy, 2011; Bertetti et al., 2011; Fasfous and
Dawoud, 2012; Li et al., 2018). A further increase in pH (above 4.5) typically leads to the
precipitation of thorium, uranium, and rare earths which is why experiments are not usually
performed at pH values higher than 4 (Kutahyali and Eral, 2010; Cheira et al., 2017). Additionally,
when pH is less than 2, the decomposition of zeolite is noticed, which will result in ineffective and
lower adsorption capacity (Baybas and Ulusoy, 2011). 2 mol/L sodium hydroxide (NaOH) was
used to adjust the solution chemistry to achieve different pH values as needed. Following
previously conducted studies, 1h, 2h, and 3h contact periods were determined for the tests
(Kutahyali and Eral, 2010; Sani et al., 2015). Zeolite samples were used as received, without any
pretreatment. An experimental design was generated with each parameter has three levels, and a
total of 27 tests were performed following the operational conditions seen in Table 11.

30
Table 11 Test order and conditions of zeolite adsorption tests.
Test No. Particle Size (µm) pH Adsorbent Amount (g) Contact Time (hr)
1 12 3 5.00 2
2 1490 2 3.75 2
3 200 4 3.75 1
4 12 4 3.75 2
5 1490 3 2.50 2
6 200 3 3.75 2
7 200 4 2.50 2
8 200 3 5.00 3
9 12 3 3.75 1
10 200 3 2.50 3
11 12 3 2.50 2
12 1490 3 3.75 1
13 1490 4 3.75 2
14 200 3 3.75 2
15 12 3 3.75 3
16 200 2 3.75 3
17 200 3 2.50 1
18 200 2 5.00 2
19 200 4 5.00 2
20 200 4 3.75 3
21 200 3 3.75 2
22 1490 3 3.75 3
23 12 2 3.75 2
24 200 3 2.50 1
25 1490 3 3.75 2
26 200 2 3.75 2
27 200 2 2.50 1
Following the test results, the adsorption recovery of thorium, uranium, and rare earths were
calculated using the equation below:
𝐴𝑑𝑠𝑜𝑟𝑝𝑡𝑖𝑜𝑛 𝑅𝑒𝑐𝑜𝑣𝑒𝑟𝑦 (%) =𝐶𝑖−𝐶𝑓
𝐶𝑖𝑥 100 (8)
where Ci and Cf are the concentration (mg/L) of the ions of interest in the aqueous solution before
and after adsorption, separately. The results were also examined in terms of adsorption capacity
and distribution coefficient according to the following equations:
𝑆𝑜𝑟𝑝𝑡𝑖𝑜𝑛 𝐶𝑎𝑝𝑎𝑐𝑖𝑡𝑦 (𝑞) = (𝐶𝑖−𝐶𝑓) 𝑥 𝑉
𝑚 (9)

31
𝐷𝑖𝑠𝑡𝑟𝑖𝑏𝑢𝑡𝑖𝑜𝑛 𝐶𝑜𝑒𝑓𝑓𝑖𝑐𝑖𝑒𝑛𝑡 (𝐾𝑑) =𝐶𝑖−𝐶𝑓
𝐶𝑖 𝑥
𝑉
𝑚 (10)
where V is the volume of the solution (L), m is the weight of zeolite (g) used, and Ce is the ion
concentration (mg/L) when adsorption equilibrium is reached. The distribution coefficient, which
defines the ratio of ion of interest in the sorbent and the solution at equilibrium, is a direct indicator
of the selectivity of the adsorbent towards the ions of interest (Metaxas et al., 2003).
Sample Characterization
3.4.1. Characterization of Solids Generated from Selective Precipitation
The dry solids produced from selective precipitation tests were subjected to X-ray Diffraction
(XRD) and Scanning Electron Microscopy-Energy Dispersive X-ray Spectroscopy (SEM-EDX)
analyses. XRD and SEM-EDX analytical techniques were applied to detect the mineralogy,
morphology, and elemental compositions of the solid samples. Powdered samples were mounted
in cavity mounts, and XRD patterns were collected using a Malvern PANalytical X'Pert Pro
diffractometer equipped with copper radiation and an X'Celerator parallel plate detector. The
samples were scanned at 45 kV, 40 mA over a range of 10-85° two-theta in continuous mode.
Evaluation and refinement of the diffraction pattern were carried out using the HighScore software.
The Hitachi S4700 Scanning Electron Microscope was used for the SEM-EDX analysis. Prior to
analysis, the sample was subjected to sputtering using Denton Desk V Sputter and Carbon Coater
to prevent charging and improve the quality of the image. During the analysis, accelerating voltage
and working distance were kept at 5 kV and 12 mm, respectively. The XRD instrument and the
SEM and sample preparation instruments used during the characterization studies are seen in
Figure 61 and Figure 62 in Appendix.
3.4.2. Characterization of Zeolite Samples
A detailed characterization study was performed for the zeolite samples both before and after
adsorption. First, the particle size analysis of each zeolite sample was performed using CILAS
1190 particle size analyzer, as shown in Figure 63. Following that, samples' mineralogical
compositions were determined using the aforementioned PanAnalytical X'Pert Pro X-ray
diffractometer. Samples were scanned at 45 kV and 40 mA over a 10-90° two-theta angle range in
a continuous mode. As described previously, the evaluation and refinement of diffraction patterns
were carried out using the HighScore software. The chemical composition of the samples was
identified using the Olympus Vanta handheld X-ray fluorescence (XRF) analyzer (Figure 64). The
same SEM-EDX instrument was utilized to analyze the samples' morphology. The accelerating
voltage was varied between 5 and 15 kV, and the working distance was maintained at 12 mm
during the SEM-EDX analysis. Similar to the other solid samples, before SEM-EDX analysis,
zeolite samples were subjected to sputtering for 140 seconds using the Denton Desk V Sputter and
Carbon Coater to enhance the image quality. SEM images taken under the lowest magnification
were also analyzed with ImageJ image processor for additional particle size measurement. Lastly,

32
the three zeolite feed samples were subjected to the Brunauer–Emmett–Teller (BET) nitrogen
adsorption tests using the Micrometrics BET instrument (Figure 65) equipped with the ASAP 2020
Version 4.02 to identify the pore volume, pore size, and specific surface area.

33
CHAPTER 4
SELECTIVE PRECIPITATION AND SOLVENT EXTRACTION STUDIES
Preliminary Selective Precipitation Tests
The initial precipitation data resulting from the addition of the three alkaline salts is shown in
Figure 9. Test results indicate no significant difference observed between various alkaline salts
with respect to the process separation efficiency. Therefore, the precipitation data obtained from
all three pH adjustments were grouped and shown in Figure 9, and NaOH was chosen for
subsequent experimental testing.
It can be seen from Figure 9 that the first precipitation was observed in a pH range of 4 to 5. Under
this condition, over 90% of thorium precipitated out while a small portion of uranium (i.e., 28.7%)
and REEs (i.e., 16.3%) co-precipitated with thorium. As indicated in the study of Zhu et al. (2015),
thorium’s precipitation pH range is 2.5-5.5, which is consistent with the findings presented in this
work. Thorium initially existed in the solution as Th4+ followed by being converted to thorium
hydroxide with an increase in the solution pH. However, thorium hydroxide is unstable by nature
and eventually transforms into thorium dioxide (Brookins, 1988). A further increase in the pH to
a value of 6.2 resulted in higher thorium and uranium precipitation and a significant amount of
rare earth co-precipitation, which was approximately 34%. The observed phenomena can be
attributed to the fact that the precipitation pH range of uranium (i.e., 5.5-7) and rare earths (i.e.,
6.8-8.0) overlaps to some degree which leads to the co-precipitation of the two (Zhu et al., 2015).
Detailed results for individual rare earth elements, thorium and uranium precipitation, and their
concentrations in the filtrates at various pH values are given in the Appendix.
Figure 9 Cumulative precipitation of total rare earths, thorium, and uranium
at various pH values.
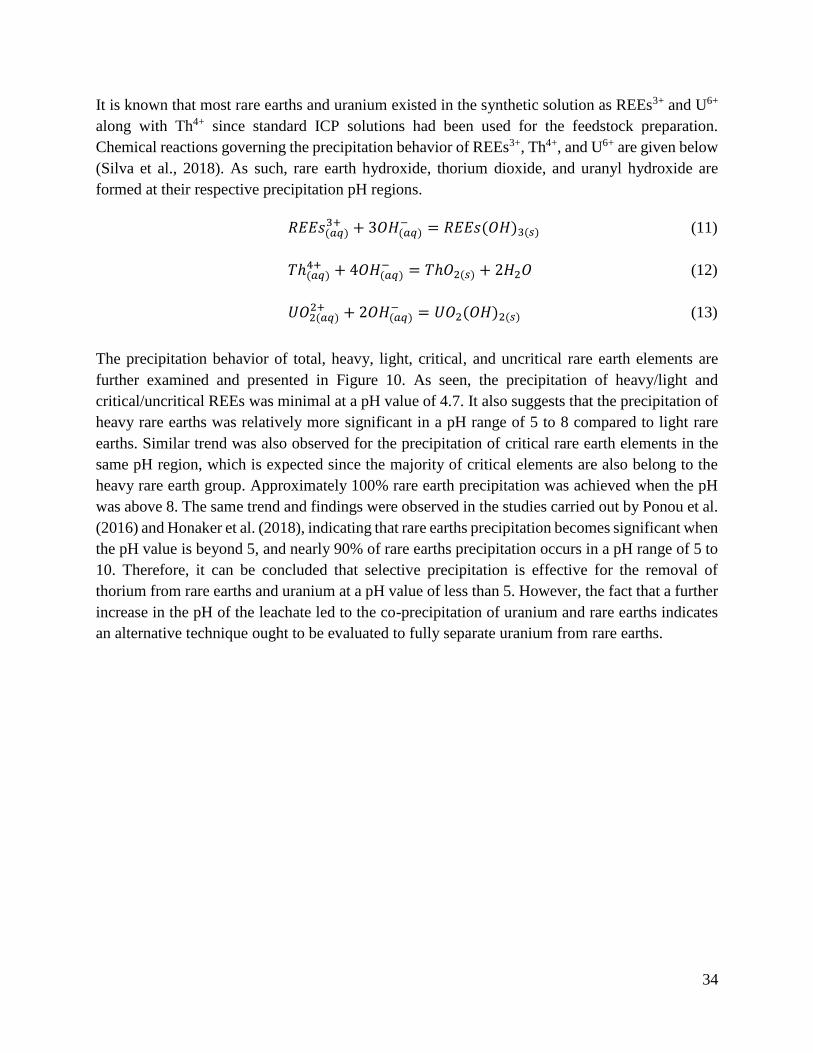
34
It is known that most rare earths and uranium existed in the synthetic solution as REEs3+ and U6+
along with Th4+ since standard ICP solutions had been used for the feedstock preparation.
Chemical reactions governing the precipitation behavior of REEs3+, Th4+, and U6+ are given below
(Silva et al., 2018). As such, rare earth hydroxide, thorium dioxide, and uranyl hydroxide are
formed at their respective precipitation pH regions.
𝑅𝐸𝐸𝑠(𝑎𝑞)3+ + 3𝑂𝐻(𝑎𝑞)
− = 𝑅𝐸𝐸𝑠(𝑂𝐻)3(𝑠) (11)
𝑇ℎ(𝑎𝑞)4+ + 4𝑂𝐻(𝑎𝑞)
− = 𝑇ℎ𝑂2(𝑠) + 2𝐻2𝑂 (12)
𝑈𝑂2(𝑎𝑞)2+ + 2𝑂𝐻(𝑎𝑞)
− = 𝑈𝑂2(𝑂𝐻)2(𝑠) (13)
The precipitation behavior of total, heavy, light, critical, and uncritical rare earth elements are
further examined and presented in Figure 10. As seen, the precipitation of heavy/light and
critical/uncritical REEs was minimal at a pH value of 4.7. It also suggests that the precipitation of
heavy rare earths was relatively more significant in a pH range of 5 to 8 compared to light rare
earths. Similar trend was also observed for the precipitation of critical rare earth elements in the
same pH region, which is expected since the majority of critical elements are also belong to the
heavy rare earth group. Approximately 100% rare earth precipitation was achieved when the pH
was above 8. The same trend and findings were observed in the studies carried out by Ponou et al.
(2016) and Honaker et al. (2018), indicating that rare earths precipitation becomes significant when
the pH value is beyond 5, and nearly 90% of rare earths precipitation occurs in a pH range of 5 to
10. Therefore, it can be concluded that selective precipitation is effective for the removal of
thorium from rare earths and uranium at a pH value of less than 5. However, the fact that a further
increase in the pH of the leachate led to the co-precipitation of uranium and rare earths indicates
an alternative technique ought to be evaluated to fully separate uranium from rare earths.

35
Figure 10 Cumulative precipitation of total, heavy, light, critical, and uncritical rare earths at
various pH values.
Preliminary Solvent Extraction Tests
Rare earth-enriched product, organic, and effluent streams were produced at the end of each set of
solvent extraction tests (Figure 6). The content of individual rare earth, thorium, and uranium in
the rare earth product stream for both the one-stage and two-stage process is provided in Table 12.
The results shown in Figure 11 indicate that approximately 97% of rare earths and 94% of thorium
were recovered into the circuit product stream of the two-stage process. Under the same
operational conditions, 43% of uranium was recovered into the circuit product stream. For the one-
stage process, the recovery of rare earth elements, thorium, and uranium into the product stream
was 90%, 93%, and 51% separately. Regardless of the number of stages conducted for the solvent
extraction process (one-stage vs. two stages), the recovery of thorium did not fluctuate much;
however, a noticeable difference was observed for the recovery of rare earths and uranium. When
the number of operating stages for extraction, scrubbing, and stripping was increased from one to
two, the recovery of uranium was reduced from an initial value of 51% to 43%, while the rare earth
element recovery was increased from around 90% to 97%. Therefore, the efficiency of the multi-
stage solvent extraction process was indicated as opposed to the single-stage process with respect
to the exaction of REEs and the removal of uranium. However, no significant separation of thorium
was observed compared to uranium (Table 12), which may be explained by their distinct extraction
behaviors in hydrochloric acid. Qi (2018) studied the extraction mechanism of thorium, uranium,
and rare earths in the TBP-HCl system and stated that the extraction order is UO22+ > Th4+ > REE3+.
When present with the three ion groups, TBP forms complexes with the ions in the solution

36
according to their distinctive capabilities to bind with the extractant (Rand et al., 2008). The
complexation reactions occurring between TBP and the three ion groups (i.e., U, Th, and REE) are
given in Eqs. (14)–(16). Similarly, Nasab (2014) observed that the extraction of uranium is more
feasible compared to thorium in a chloride medium, which is attributed to the species formed
between uranium and hydrochloride that TBP readily extracts through forming organic soluble
complexes. Another reason is that thorium purification by solvent extraction in nitric acid media
is more favorable (Al-Areqi et al., 2014). Nitrate is a preferred medium for enhanced extraction of
thorium due to an associated increase in the hydration energy of the anions (Nasab, 2014; Lu et
al., 2016). In addition, 2 mol/L nitric acid (HNO3) solution was used as the scrubbing reagent to
remove entrained rare earth elements and thorium from the U-laden organic phase following the
reactions given in Eqs. (17) and (18). Afterward, DI water and 2 mol/L HNO3 were applied as the
stripping reagent for thorium and uranium, separately, and the corresponding equations governing
the complexation reactions are shown in Eqs. (19) and (20).
The recovery of individual rare earths into the product stream shown in Figure 12 indicates that
the majority of the elements achieved a recovery above 90%. In comparison, a relatively lower
recovery was noticed for scandium (<90%). The same phenomenon for scandium was also
observed in Qi’s (2018) study saying that in a high hydrochloric acid medium, the separation factor
of scandium is much higher, resulting in transferring scandium into the organic phase. Moreover,
Figure 13 suggests that no substantial difference was observed for the recovery of HREEs, LREEs,
CREEs, and UCREEs for each of the two sets of solvent extraction tests. An improved recovery
was obtained for the two-stage process. Detailed results are given in Table 25, Table 26, and Table
27 in the Appendix.
(14)
(15)
(16)

37
Figure 11 Recovery of total rare earths, thorium, and uranium into the REE product stream of
both the one-stage and two-stage solvent extraction process.
Figure 12 Recovery of individual rare earth, thorium, and uranium into the REE product stream
of both the one-stage and two-stage solvent extraction process.

38
Table 12 Individual rare earth, thorium, and uranium concentrations (ppm) in the rare earth product stream obtained from both the
one-stage and two-stage solvent extraction process.
Process Sc Y La Ce Pr Nd Sm Eu Gd Tb Dy Ho Er Tm Yb Lu Th U
One-Stage 0.00 1.49 0.85 6.17 0.84 3.95 1.18 0.20 0.88 0.04 0.36 0.04 0.16 0.00 0.06 0.01 0.21 0.20
Two-Stage 0.00 1.62 0.94 7.16 0.96 4.42 1.34 0.24 1.04 0.05 0.43 0.05 0.19 0.00 0.08 0.01 0.26 0.09
Figure 13 Recovery of total, heavy, light, critical and uncritical REEs from both the one-stage and two-stage solvent extraction
process.

39
(18)
(19)
(20)
(17)
= +2

40
Modified Experimental Protocol
4.3.1. One-Stage Precipitation
As seen from the results presented earlier, selective precipitation successfully precipitated out
thorium, while solvent extraction was noticeably more effective in removing uranium from rare
earths. Therefore, a modified experimental protocol consisting of one-stage precipitation and two-
stage solvent extraction was developed, the procedure of which was strictly followed for improved
separation of the radioactive elements from rare earths.
Individual REE content and the concentration of thorium and uranium of the filtrate obtained at
the precipitation pH of 4.85 are shown in Table 13. All the data reported are the average of three
replicate selective precipitation tests. It can be seen from Table 13 that thorium present in the
feedstock solution all precipitated out as solids, and no content was detected in the remaining
solution, which further confirms the findings previously discussed in selective precipitation.
Besides, the amount of REEs, uranium, and major metals along with thorium precipitated at a pH
of 4.85 was shown in Figure 14.
As seen, 100% of thorium precipitated out, while approximately 19.32% of rare earth elements
and 47.98% of uranium co-precipitated at the same pH value. A similar result for uranium
precipitation was also obtained by Tomazic et al. (1962). Furthermore, nearly 25% of major
metals, including aluminum, calcium, iron, and magnesium, were transformed into solid forms
under identical conditions. As for major metals, approximately 65.58% of iron precipitated,
followed by around 38.51% of aluminum, 17.12% of calcium, and 14.17% of magnesium. The
findings presented here are consistent with prior studies (Ladeira and Goncaves, 2007; Xie et al.,
2014; Balintova and Petrilakova, 2011; Paul and Campbell, 2011). It is known that the
precipitation of iron starts at a pH value of 3.5, and Fe(OH)3 is formed as a result of iron oxidization
(Seo et al., 2017). In the present study, iron had existed in the solution as ferric iron, which was
ready to precipitate with an increase in the pH, as seen in Eq. (21). On the other hand, the
precipitation of aluminum typically initiates around a pH value of 5 (Balintova and Petrilakova,
2011), which results in the formation of Al(OH)3 in the presence of OH− ions following Eq. (22).
Therefore, a substantially higher amount of iron precipitated out as opposed to aluminum, which
also agrees well with the study carried out by Seo et al. (2017). High Fe(OH)3 precipitation may
partially contribute to the co-precipitation of rare earths due to its capability to absorb particles
onto the iron crystals’ lattice sites (Silva et al., 2018).
Supplemental information can be derived by further analyzing the rare earth precipitation data, as
shown in Figure 15. It suggests again that heavy REEs tend to preferentially precipitate out
compared to light REEs, which leads to a precipitation difference of approximately 4.5 percent.
However, this difference is less than one standard deviation, which may not be statistically
significant.

41
Table 13 Individual rare earth, thorium, and uranium concentration (ppm) of the filtrate obtained at the pH value of 4.85.
Sc Y La Ce Pr Nd Sm Eu Gd Tb Dy Ho Er Tm Yb Lu Th U
0 0.50 0.33 2.55 0.25 1.49 0.67 0.08 0.29 0.03 0.13 0.02 0.06 0.00 0.02 0.00 0.00 0.13
Figure 14 Average precipitation of total REEs, Th, U, and major metals at the pH value of 4.85. Error bars one standard deviation of
three replicate tests.

42
Figure 15 The average precipitation of total, heavy, light, critical, and uncritical rare earths at the
pH value of 4.85. Error bars represent one standard deviation of three replicate tests.
𝐹𝑒(𝑎𝑞)3+ + 3𝑂𝐻(𝑎𝑞)
− = 𝐹𝑒(𝑂𝐻)3(𝑠) (21)
𝐴𝑙(𝑎𝑞)3+ + 3𝑂𝐻(𝑎𝑞)
− = 𝐴𝑙(𝑂𝐻)3(𝑠) (22)
4.3.1.1. Characterization of Solids Generated from Selective
The XRD pattern of the solid sample obtained from the one-stage precipitation is shown in Figure
16. It can be seen that precipitated solids predominantly consisted of halite (NaCl), which is
attributed to the existence of sodium hydroxide and hydrochloric acid that were used to adjust the
solution pH values according to various needs. In addition to halite, a relatively small amount of
iron oxide was also detected, which corroborates the prior finding that approximately 66% of iron
precipitated out from the feedstock solution and was transformed into iron oxide. Elemental
identification of the solid sample was provided by SEM-EDX analysis as opposed to the qualitative
analysis provided by XRD. As seen in Figure 17, the highest intensity peaks were observed for the
elements of sodium (Na), oxygen (O), and chloride (Cl), which is consistent with the findings
obtained from XRD analysis. In addition to the three elements, a portion of rare earths and thorium
were also detected in the EDX spectrum; however, the intensities are considerably low compared
to Na, O, and Cl. The carbon peak seen in the EDX spectrum is due to the carbon tape substrate
used during sample preparation. Moreover, SEM images presented in Figure 18 show the rough
surfaces of the solid particles. The microscopic pictures observed under high magnifications
further indicate that tiny nuclei in nanoscale initially precipitated out and deposited on top of the

43
particles, which acted like the nucleating agents and led to the subsequent growth of the particles
in the form of roughly spherical crystallites.
Figure 16 XRD pattern of the solids samples obtained from selective precipitation tests at a pH
value of 4.85.
Figure 17 Elemental identification of the solids samples obtained from selective precipitation at a
pH of 4.85 using SEM-EDX analysis.

44
Figure 18 SEM images of precipitated solids (at a pH of 4.85) observed under various
magnifications.
4.3.1.2. Equilibrium and Thermodynamic Evaluation of Selective
The predominance and stabilities of ionic and non-ionic species in aqueous solutions are critical
to understanding the concepts of dissolution, leaching, and selective precipitation. This
information can be displayed graphically using speciation (species) distribution diagrams and Eh-
pH (Pourbaix) diagrams. They are also helpful to identify major species existing at a particular pH
value and provide the ability to predict the change in composition when there is a change in
condition. Species distribution diagrams were constructed for selected rare earth elements,
thorium, uranium, iron, and aluminum using the OLI Studio software based on their initial
concentrations in the synthetic solution. It was reported that the existence of various species is
notably pH-dependent (Li et al., 2012; Liu et al., 2015; Li et al., 2018) because pH value controls
the ion activity (Monhemius, 1977; Hayes et al., 2002).
As seen in Figure 19, under acidic conditions, aqueous ions of Th4+ and ThCl3+ are seen. The
concentration of Th4+ starts to decrease around a pH value of 3, which is due to the OH- ions
liberated from NaOH that initiates thorium’s precipitation by forming hydroxide complexes.
Likewise, the concentration of ThCl3+ starts to decrease at pH 3. Initially, ThCl3+ is formed due to
a reaction between Cl- and Th4+ ions in the solution. However, when an alkaline is introduced to
the solution, the reaction is reversed. It releases Cl- ions back into the solution, and free Th4+ ions
react with OH--forming thorium precipitates. Meanwhile, a substantial increase of thorium
hydroxide (Th(OH)4) is seen with an elevation in the solution pH. In nature, Th(OH)4 may
precipitate first; however, due to the thorium hydroxide’s unstable nature, it slowly transforms into
thorium dioxide (ThO2) (Brookins 1988). It is stable as thorium dioxide (ThO2) even in acidic
conditions. The concentration of Th4+ and Th(OH)4 reaches the same level at a pH value of 5, for
which the precipitation of thorium is assumed to be completed (Zhu et al., 2015). A further increase
in the pH does not change the concentrations of Th4+ and Th(OH)4. The conclusions reached in
this study are well correlated with the literature (Felmy et al., 1991). Thermodynamic studies were

45
also performed following the precipitation. The Gibbs free energy change of the reaction is -125.52
kJ/mol at the standard state conditions (1 atm and 25°C). The negative value of ΔG indicates the
precipitation of thorium dioxide is thermodynamically favorable. The enthalpy value of -108.99
kJ/mol further supports and suggests that the reaction is exothermic. The entropy value of thorium
precipitation is found to be 70 J.mol-1.K-1.
𝑇ℎ(𝑎𝑞)4+ + 4𝑂𝐻(𝑎𝑞)
− = 𝑇ℎ𝑂2(𝑠) + 2𝐻2𝑂 (23)
Thorium, with its only oxidation state, 4+, is relatively easy to work with compared to other
actinide elements, such as uranium, because of the simplicity of the species (Torapava et al., 2009).
Uranium can be seen in many forms, such as U (III, IV, V, VI), and forms various complexes as
oxides, phosphates, carbonates, etc. (Navrotsky et al., 2013). U (IV and VI) are the most common
and stable states (Monji et al., 2016). The speciation of uranium in chloride media is given in
Figure 20. Uranium initially exists in the solution with its 6+ oxidation state as a uranyl cation.
According to the literature data, the precipitation of uranium starts at a pH value of approximately
6 (Zhu et al., 2015), which means the solubility of the ions decreases, and the tendency to create
insoluble complexes increases. Langmuir (1978) and Brookins (1988) performed comprehensive
studies about the thermodynamic characteristics of aqueous and solid uranium species. Under
oxidizing conditions (pH<4), uranium exists as UO22+ (U(VI)), which is well correlated with the
results obtained in this study (Langmuir, 1978; Regenspurg et al., 2010; Abdel-Sabour, 2014;
Monji et al., 2016). A sharp decrease in the UO22+ concentration is noticed starting from a pH value
of 5. As the concentrations of U6+ and UO22+ are lessening, aqueous uranyl hydroxide (UO2(OH)2)
starts to be formed, which then transfers into a crystalline form around pH 7. Similarly, the
precipitation of UO2(OH)2 is spontaneous and exothermic with ΔG and ΔH values of -65.69 kJ/mol
and -53.93 kJ/mol, separately, at the standard state conditions. The entropy of the reaction was
calculated to be 40 J.mol-1.K-1. Similar findings were also seen in Orabi’s study (2013).
𝑈𝑂2(𝑎𝑞)2+ + 2𝑂𝐻(𝑎𝑞)
− = 𝑈𝑂2(𝑂𝐻)2(𝑠) (24)

46
Figure 19 Species distribution diagram of Th-HCl system.
Figure 20 Species distribution diagram of U-HCl system.

47
Pourbaix diagrams of thorium and uranium systems were generated using HSC Chemistry
Software as shown in Figure 21 and Figure 22, respectively. The elements with the highest effect
were selected to create a system that is as close as possible to the real system. In the diagrams, the
dashed lines represent the stability area of water, and all Eh-pH diagrams are constructed assuming
the system is in equilibrium with the water. The redox potential measurements of the synthetic
solution at various pH values are given in Table 14. Based on the redox potential readings, it is
clear that at pH 4.8, thorium is stable in the form of ThO2, which is an additional support of the
experimental findings and previously presented species distribution diagrams. It initially present
as Th+4 which later reacts with OH- as the pH increases and the diagram moves to the right. On the
other hand, according to the diagram, uranium may form a compound with sodium, which is
expected due to the high concentration of sodium ions present in the solution.
Table 14 Redox potential measurements at various pH values
pH Eh (mV)
Initial pH <0 1030.60
0.00 927.00
0.25 794.80
0.50 687.50
1.00 597.90
1.50 590.50
2.50 564.90
3.00 551.40
3.50 434.40
4.00 389.30
4.50 338.80
4.80 331.70
5.00 296.40

48
Figure 21 Eh-pH diagram of Th-Cl-Na-Ca-H2O system.
Figure 22 Eh-pH diagram of U-Cl-Na-Ca-H2O system

49
The species distribution diagrams of selected rare earth elements are shown in Figure 23.
Considering the concentration of individual rare earths in the synthetic feedstock solution, five
rare earth elements, including cerium, neodymium, gadolinium, lanthanum selected to represent
different rare earth groups (i.e., heavy (Y, Eu, Gd, Tb, Dy, Ho, Er, Tm, Yb, Lu), light (La, Ce, Pr,
Nd, Sm), critical (Y, Nd, Tb, Dy, Eu), and uncritical (La, Ce, Pr, Sm, Gd, Ho, Er, Tm, Yb, Lu)
rare earth elements). It is known that most rare earths existed in the synthetic solution as REEs3+.
However, cerium, praseodymium, and terbium may also be tetravalent, and samarium, europium,
and ytterbium in a divalent state, but these states are not stable (Thakur, 2000). Rare earths become
less soluble with increasing pH, and thermodynamically stable rare earth hydroxides can be
obtained by treating aqueous solutions with a base. The precipitation of rare earths occurs between
pH 6.8-8, where there is an overlap with uranium that leads to the co-precipitation of the two (Zhu
et al., 2015). Rare earths’ resistance to the base and the solubility decreases from light rare earths
towards heavy rare earths, with lanthanum being the most basic and soluble.
As seen in the diagrams (Figure 23), the precipitation behavior of rare earths is alike, reflecting
the similarity in their physical and chemical properties (Al-Nafai, 2015). Similar types of species
tend to be formed approximately at the same pH regions. For all the rare earth elements examined,
an increase in the concentration of rare earth hydroxide compound is observed starting from a pH
value of 8. An immediate increase in the concentration of REE(OH)3(aq) is also seen for all of the
selected elements which is then stabilize around a pH value of 8. A slight increase in the
concentration of trivalent rare earth ions is observed around pH 10, which shows that the solubility
starts again at high pH regions. Thermodynamic values were also calculated for rare earths and
can be seen in Table 15. Due to their similar characteristics, the thermodynamic values were
considerably close to each other. The precipitation reaction of rare earths (Eq. 25) is favored
according to the Gibbs free energy values. The enthalpy changes are suggesting that the processes
are exothermic. Moreover, the thermodynamic findings shown in Table 15 indicate that heavy rare
earth elements tend to precipitate as opposed to light elements. A more negative ΔG value is
obtained for heavy rare earth elements (i.e., Gadolinium and Yttrium) than light rare earth elements
(i.e., Cerium, Neodymium, and Lanthanum).
𝑅𝐸𝐸𝑠(𝑎𝑞)3+ + 3𝑂𝐻(𝑎𝑞)
− = 𝑅𝐸𝐸𝑠(𝑂𝐻)3 (25)
Table 15 Gibbs free energy and enthalpy and entropy values of rare earths under standard
operating conditions (1 atm and 25 °C).
Elements / Thermodynamic Parameter ΔG (kJ/mol) ΔH (kJ/mol) ΔS (J.mol-1.K-1)
Cerium -130.5 -32.4 +330
Neodymium -136.9 -29.4 +360
Gadolinium -143.6 -32.9 +370
Lanthanum -124.6 -19.7 +350
Yttrium -173.5 -59.3 +380

50
Figure 23 Species distribution diagrams of REEs-HCl system. A) Cerium, B) Neodymium, C) Gadolinium, D) Lanthanum, E) Yttrium
A
E D
C B

51
The speciation of iron and aluminum in the chloride media is presented in Figure 24 and Figure
25, respectively. Also, their precipitation reactions are given in Eqs. (26) and (27). In the synthetic
feedstock solution, iron exists with its trivalent oxidation state, Fe3+. The concentration of Fe+3
starts to decrease around a pH value of 3, which is consistent with the literature data (Balintova
and Petrilakova, 2011; Seo et al., 2017). Due to the nature of the synthetic solution’s medium, iron
(III) chloride (FeCl3) is also seen in the solution, and its concentration starts to decrease at the
same pH value. While the concentrations of Fe+3 and FeCl3 are reducing, the formation of iron
hydroxide (Fe(OH)3) is seen. Iron precipitation is found to be thermodynamically stable with a
corresponding ΔG value of -317.13 kJ/mol and ΔH value of -229.43 kJ/mol. According to previous
selective precipitation test results, approximately 66% Fe precipitated out at pH 4.85.
Characterization studies also supported the presence of iron in the precipitates. XRD revealed the
formation of iron oxide and the iron peak was detected in the EDX spectrum as well, which were
all consistent with the distribution of iron species as indicated in Figure 24.
When an alkali is added to a solution containing aluminum, a precipitate is obtained in a hydroxide
gel, Al(OH)3. Generally, Al(OH)3 formation starts to be seen at a pH value of 5 (Balintova and
Petrilakova, 2011), which is supported by Figure 25. The original form of aluminum, Al3+,
gradually transforms into Al(OH)2+1. However, due to continuous reactions occurring between
aluminum species and OH-, the formed Al(OH)2+1 is not stable, and it decreases significantly at a
pH value of 4. At that pH, the formation of Al(OH)3 initiates. On the other hand, in the presence
of sufficiently alkaline solutions, aluminum decomposes water with the evolution of hydrogen,
dissolving as aluminate ions AlO2- (Pourbaix, 1974). Although stability is observed for Al(OH)3
through a wide range of pH values, a decrease in its concentration starts when pH exceeds 10. Like
iron, the aluminum precipitation mechanism is thermodynamically favorable with a standard
energy change value of -540.03 kJ/mol. Moreover, the enthalpy change, -545.53 kJ/mol, suggests
an exothermic reaction.
𝐹𝑒(𝑎𝑞)3+ + 3𝑂𝐻(𝑎𝑞)
− = 𝐹𝑒(𝑂𝐻)3(𝑠) (26)
𝐴𝑙(𝑎𝑞)3+ + 3𝑂𝐻(𝑎𝑞)
− = 𝐴𝑙(𝑂𝐻)3(𝑠) (27)

52
Figure 24 Species distribution diagram of Fe-HCl system.
Figure 25 Species distribution diagram of Al-HCl system.

53
4.3.2. The First Subset of Solvent Extraction Tests
The experimental flowsheet, including the operational conditions, is given in Figure 26. Recovery
of rare earths and uranium into the final rare earth product stream, based solely on solvent extract
circuit, as a result of the 15 tests are given in Figure 27. Likewise, the overall recovery of rare
earths and uranium is shown in Figure 28, taking both selective precipitation and solvent extraction
into account.
Figure 26 Experimental procedure and the operating conditions followed the second subset of
solvent extraction tests.
As seen in Figure 27, the rare earth recovery obtained from the solvent extraction circuit varied
from 90% to 98.9%, while the corresponding uranium recovery changed between 5.9% to 89.4%.
This noteworthy fluctuation in uranium recovery implies that the chosen variables had an impact
on the removal of uranium. On the other hand, the rare earth recovery value close to each other
suggests that the same variables had less profound or a minimal impact on the recovery of rare
earths.

54
Figure 28 further indicates the overall recovery of rare earths and uranium based on the whole
experimental route by incorporating the selective precipitation stage. After considering the
amounts of rare earths and uranium that precipitated out as solid forms, the overall recovery of
rare earths and uranium both decreased to a value varying between 72.6%-79.8% and 3.1%-46.5%,
respectively. Data from Figure 27 and Figure 28 indicate the best results with respect to the
recovery of rare earth and uranium were obtained by Test 8 under the following conditions: 50 v%
TBP, feed pH value of 3.5, an O/A ratio at 3. An overall rare earth recovery of approximately
79.8% with a corresponding uranium recovery of 3.1% was produced under the same operating
conditions. The elemental composition (i.e., individual rare earth and uranium) of the final rare
earth product stream obtained from Test 8 is also given in Table 16. No thorium was reported since
all the thorium precipitated out at a pH of approximately 4.8 prior to the solvent extraction tests.
It was also observed that a noticeable portion of uranium was reported to the organic stream instead
of the uranium product stream. For example, for Test 8, on the basis of the solvent extraction
circuit, the recovery of uranium into the uranium product stream and final rare earth product stream
was 52.1% and 5.9%, respectively. In contrast, the remaining uranium reported to the organic
stream, which needs to be further extracted so that the organic can be reused for solvent extraction
from an economic standpoint. One solution to purify TBP is treating the organic stream with
sodium carbonate or sodium hydroxide solutions to neutralize and precipitate the organic
impurities with high molecular weights (Geier, 1979; Srinivas et al., 1994; International Atomic
Energy Agency, 2000). The quality of the organic phase must be periodically checked and
maintained after recycling since TBP may be subject to hydrolyze in the aqueous phases
(International Atomic Energy Agency, 2000). Among the 15 tests, the amount of rare earths
reporting to the organic stream was >1% for eight tests, with the highest value of 5.3%
corresponding to Test 8. For the remaining seven tests, the non-selective recovery of rare earths
into the organic stream is all less than 1%, which is negligible.
Detailed results of the individual rare earth elements and uranium extraction recoveries (%), their
concentrations in the rare earth product stream, as well as the detailed overall extraction recoveries
are given in Table 29, Table 30, and Table 31 separately in the Appendix.

55
Table 16 Elemental composition of individual rare earth and uranium (mg/L) in the final REE product stream obtained from Test 8.
Sc Y La Ce Pr Nd Sm Eu Gd Tb Dy Ho Er Tm Yb Lu U
0.00 0.06 0.04 0.30 0.03 0.17 0.08 0.01 0.04 0.03 0.02 0.00 0.01 0.00 0.00 0.00 0.001
Figure 27 Recovery of total rare earths and uranium into the final REE product stream based solely on solvent extraction circuit. Error
bars represent one standard deviation of three replicate tests.

56
Figure 28 Overall recovery of total rare earths and uranium with respect to the overall
experimental flowsheet. Error bars represent one standard deviation of three replicate tests.
4.3.2.1. Statistical Analysis and Modeling of First Subset of Solvent Extraction Tests
Following data analysis, the impact of the operating variables (i.e., extractant concentration, feed
solution pH, and O/A ratio) on the recovery of rare earth and uranium were analyzed using the
Design Expert statistical analysis software.
The statistical model developed to predict the recovery of uranium by considering the influential
operating parameters is shown in equation 28. It can be seen from the quadratic model that all
three variables have a significant impact on the non-selective recovery of uranium into the REE
product stream.
𝑈𝑟𝑎𝑛𝑖𝑢𝑚 𝑅𝑒𝑐𝑜𝑣𝑒𝑟𝑦 = +596.01 − 12.38 ∗ 𝐴 − 85.85 ∗ 𝐵 − 110.80 ∗ 𝐶 + 0.65 ∗ 𝐴𝐵 + 0.80 ∗
𝐴𝐶 + 3.92 ∗ 𝐵𝐶 + 0.09 ∗ 𝐴2 + 4.81 ∗ 𝐵2 + 10.88 ∗ 𝐶2 (28)
where the uncoded model term A, B, and C is corresponding to extractant concentration, feed
solution pH, and O/A ratio, respectively.
The Analysis of Variance (ANOVA) table provided detailed information on the significance of the
model, as shown in Table 17. The Fischer variation ratio (F-value) is a statistically valid measure
of how well the factors describe the variation in the data about its mean. In this model, an F-value
of 9.84 implies the model is significant and the probability of an F-value to become this large is
1.07% (<5%, which is the critical P-value used to determine the significance). Model terms are
considered significant within a 95% confidence level, or in other words, values of “prob>F” less

57
than 0.05 indicate that terms are significant. Terms A (extractant concentration), B (pH), and C
(O/A ratio) are all significant model terms according to the data obtained from ANOVA, and they
all have a profound impact on uranium recovery. The “lack-of-fit” model is insignificant based on
a p-value greater than 5%, which further supports the statistical significance of the model. An R-
squared value of 0.9466 and an adjusted R-squared value of 0.8503 again validate the model. Even
though the coefficients associated with high-order terms are not high compared to that of the first-
order terms, they are still needed to justify the significance of the model.
Table 17 ANOVA analysis of the quadratic model for the prediction of uranium recovery.
Source Sum of
Squares df
Mean
Square F Value
p-value
Prob> F
Model 7992.72 9 888.08 9.84 0.0107 Significant
Lack of Fit
A-Extractant Concentration
B-pH
C-O/A Ratio
AB
AC
BC
A2
B2
C2
428.26
1214.51
1890.82
3666.25
169
258.41
61.54
304.75
85.25
436.87
3
1
1
1
1
1
1
1
1
1
142.75
1214.51
1890.82
3666.25
169
258.41
61.54
304.75
85.25
436.87
12.39
13.46
20.95
40.62
1.87
2.86
0.68
3.38
0.94
4.84
0.0756
0.0145
0.0060
0.0014
0.2295
0.1514
0.4466
0.1256
0.3758
0.0791
Not significant
R-Squared 0.9466
Adj R-Squared 0.8503
Pred R-Squared 0.1824
Adeq Precision 10.172
3D response surface and 2D contour plots shown in Figure 29 and Figure 30 indicating the impact
of two input variables on uranium recovery, while the level of the third variable was fixed at the
middle-range value. Figure 29(A) first shows the effect of extractant concentration and feed
solution pH on uranium recovery while the O/A ratio was maintained as a constant value of 2. As
seen, a high pH value and high extractant concentration tend to generate enhanced separation
results. The experimental results corroborated that the lowest recovery of uranium into the rare
earth product stream (i.e., 5.9%) was obtained with 50% TBP by volume. For the tests conducted
with low TBP concentrations and low pH values, the amount of uranium reporting to the final
product stream increased substantially. Similarly, the effect of extractant concentration and O/A
ratio on uranium recovery was indicated in Figure 29(B) with a constant feed solution pH value of
3.5.

58
The uranium recovery decreases with an elevation in both extractant concentration and O/A ratio,
which is supported by experimental results obtained from Test 8 (i.e., 50 v% TBP, O/A of 3) and
Test 14 (i.e., 30 v% TBP, O/A of 1) where the lowest and highest uranium recovery was achieved,
respectively. As the O/A ratio and pH increase, the recovery of uranium into the final product
stream decreases, as reflected by Figure 29(C). The shape of contour plots, on the other hand,
suggests the degree of interaction between the variables taken into account. Elliptical contours
indicate strong interaction, whereas circular contours display less significant or minimum
interaction. It can be seen from Figures 30(A), (B), and (C) that feed solution pH and extractant
concentration are two variables strongly interacting with each other, as indicated by the elliptical
contour plot.
Following uranium, statistical analysis was also performed for the recovery of total rare earths,
and a model was first developed to predict the response parameter of interest. However, a scrutiny
of the model, as reflected by the ANOVA table, indicates the model is not statistically meaningful.
The insignificance of this model is consistent with the experimental findings that the recovery of
rare earths did not change much during the solvent extraction stage, with the value varying between
90% and 98.9%.

59
C
B A
x
Figure 29 3D surface response graphs obtained from the statistical analysis using Design-Expert.

60
C
B A
Figure 30 2D contour plots obtained from the statistical analysis using Design-Expert.

61
4.3.3. The Second Subset of Solvent Extraction Tests
The experimental procedure followed during the study is given in Figure 31 with operating details.
Recovery of rare earths and uranium into the final rare earth product stream, based solely on
solvent extraction circuit, as a result of 27 tests, are given in Figure 32. Likewise, the overall
recovery of rare earths and uranium, taking into account both selective precipitation and solvent
extraction, is shown in Figure 33.
Figure 31 Experimental procedure and the operating conditions followed the second subset of
solvent extraction tests.
As seen in Figure 32, the rare earth recovery obtained from the solvent extraction circuit varied
from 80.2% to 97.6%, while the corresponding uranium recovery changed between 3.4 to 62.5%.
Similar fluctuation in uranium recovery was also observed in the first set of solvent extraction
tests, which implies again that the chosen variables had an impact on the uranium recovery.
Moreover, compared to the first set of tests, there is a noticeable reduction in the recovery range
of uranium. During the first set of tests, the uranium recovery into the final product stream was

62
varying between 5.9% to 89.4%. The narrowing recovery range shows that the strippant used in
the second set of tests had a positive impact on the uranium recovery since the only varying
parameter between the first and second set is the strippant.
On the other hand, a much smaller variation in the recovery of rare earths and the value close to
each other indicates that the chosen variables had a less profound impact on the recovery of rare
earths. A similar phenomenon was also observed in the first set of tests. Although this time, the
recovery range of rare earths is slightly wider, which indicates that the new strippant (i.e., H2SO4)
may impact the recovery of rare earths.
Figure 33 further indicates the overall recovery of rare earths and uranium based on the whole
experimental route by incorporating the selective precipitation stage. After considering the amount
of rare earths and uranium previously precipitated out as solid forms, the overall recovery of rare
earths and uranium both decreased, ranging from 64.7% to 78.7% and 1.8% to 32.5%, respectively.
Detailed results of the individual rare earth elements and uranium extraction recoveries (%), their
concentrations in the rare earth product stream, as well as the detailed overall extraction recoveries
are given in Table 32, Table 33, and Table 34, separately in the Appendix.
Figure 32 Recovery of total rare earths and uranium into the final rare earth product stream based
solely on the solvent extraction circuit. Error bars represent one standard deviation of three
replicate tests.

63
Figure 33 Overall recovery of total rare earths and uranium with respect to the whole
experimental flowsheet. Error bars represent one standard deviation of three replicate tests.
During the first set of solvent extraction tests, it was observed that the test conditions that generated
the highest rare earth recovery and the lowest uranium recovery were identical. However, the
second set presented a different finding. Among all the 27 tests, the lowest uranium recovery (i.e.,
3.4%, based solely on solvent extraction) into the rare earth product stream was produced by Test
8 with a corresponding rare earth recovery of 91%. On the other hand, the highest rare earth
recovery (i.e., 97.6%, based solely on solvent extraction circuit) into the final product stream was
generated by Test 1. However, the operating conditions of Test 1 resulted in a considerably higher
uranium recovery of 62.5%. The elemental composition of the final REE product stream obtained
from Test 8 is given as well in Table 18. In the previous set of solvent extraction tests, it was
noticed that a portion of uranium was reported to the organic stream. The amount of uranium
reporting to the organic stream noticeably decreased in this set of tests which further supports the
effect of the stripping agent. For example, for Test 8, no uranium was recovered into the organic
stream on the basis of a solely solvent extraction circuit. Under the same conditions, 3.4% of
uranium reported to the rare earth product stream and the remaining uranium all reported to the
uranium product stream, as expected. In addition, the amount of rare earths reporting to the organic
stream was negligible (<1%) for most of the tests, and the highest recovery of rare earths into the
organic stream was seen as 5.9%.
Complexation reactions occurring during extraction and stripping stages are shown in Eqs. (29) -
(31). The extraction ability of TBP is attributed to the phosphoryl group, which forms solvates
with the metal ions in the solution (Giri and Nath, 2016). The extraction of rare earths increases

64
proportionally to the atomic number (Peiro and Mendez, 2013). Figure 34 (A) and Figure 34 (B)
show the distribution ratio of rare earths and uranium during extraction. Distribution ratios were
calculated for total rare earths and uranium during each extraction step. D1 represents the element
concentration ratio of organic to aqueous phases during the first extraction, and similarly, D2 shows
that of the second extraction. Although the distribution ratio is not necessarily related to the
extraction efficiency, it is an indicator of the necessity of multistage extraction. Generally, a
decrease in the second distribution ratio was observed for rare earths. This reduction may occur
due to the completion of extraction during the first stage. However, there are a few exceptions for
which the second step enhanced the extraction of rare earths, as seen in Figure 34 (A). A similar
trend was observed for uranium, although this time, the effect of the second extraction step is more
profound. The distribution ratio of uranium under the best operating conditions (Test 8) changed
from 0.84 to 2, which resulted in the lowest uranium recovery into the final rare earth product
stream. The separation factor between REEs/U is seen in Figure 35. The separation factor is a good
measurement of the extractant’s separation ability. The data indicate the effect of two-stage
extraction on selectively removing uranium from rare earths.
(29)
(30)
(31)

65
Table 18 Elemental composition of individual rare earth and uranium (ppm) in the final REE product stream obtained from Test 8.
Sc Y La Ce Pr Nd Sm Eu Gd Tb Dy Ho Er Tm Yb Lu U
0.00 0.08 0.05 0.37 0.06 0.24 0.08 0.01 0.05 0.00 0.02 0.00 0.01 0.00 0.00 0.00 0.00
Figure 34 Distribution ratio of (A) total rare earths, (B) uranium in the two extraction stages. Error bars represent one standard
deviation of three replicate tests.
B A

66
Figure 35 Separation factor between total rare earths and uranium. Error bars represent one
standard deviation of three replicate tests.
4.3.3.1. Statistical Analysis and Modeling of Second Subset of Solvent Extraction Tests
The same methodology during the first subset followed, and a statistical model was developed to
predict the recovery of uranium by incorporating all the influential operating parameters, as shown
in equation 32. It can be seen from the quadratic model that all variables except the stripping agent
concentration had a significant impact on the recovery of uranium.
𝑈𝑟𝑎𝑛𝑖𝑢𝑚 𝑅𝑒𝑐𝑜𝑣𝑒𝑟𝑦 = +18.64 − 13.06 ∗ 𝐴 − 15.41 ∗ 𝐵 + 1.99 ∗ 𝐶 − 14.02 ∗ 𝐷 + 4.75 ∗ 𝐴𝐵 − 3.90 ∗
𝐴𝐶 − 1.74 ∗ 𝐴𝐷 + 0.54 ∗ 𝐵𝐶 + 7.55 ∗ 𝐵𝐷 − 4.92 ∗ 𝐶𝐷 + 8.24 ∗ 𝐴2 + 2.25 ∗ 𝐵2 + 6.29 ∗ 𝐶2 + 4.54 ∗
𝐷2 (32)
where the uncoded model term A, B, C, and D is corresponding to the extractant concentration,
feed solution pH, strippant concentration, and O: A ratio, respectively.
The Analysis of Variance (ANOVA) table of this statistical model is shown in Table 19. The model
F-value of 5.90 implies the model is significant. The probability of an F-value to become this large
is 0.19% which is noticeably lower than the critical P-value (5%). Terms A (extractant
concentration), B (pH), and D (organic/aqueous ratio) are significant model terms with P-values
less than 5%. The same conclusion was reached as a result of the first set of tests. On the other
hand, the term D (strippant concentration) has a P-value of 0.5036 outside the confidence level
and is considered an insignificant model term due to the same reason. Although the concentration
of the strippant tested in the study did not signifcantly impact the recovery of uranium, the data
indicate a reduction in the uranium recoveries after using sulfuric acid as the strippant compared

67
to deionized water. The concentration of the strippant may not contribute to the improved
separation of uranium, but using a different strippant itself (i.e., H2SO4) can explain. The lack-of-
fit value of 1.94 implies a 38.79% chance that a lack-of-fit F-value can be this high. R-squared
values were also given in Table 19 to further evaluate the robustness of the developed model. As
seen, an R-square value of 0.8731 and an adjusted R-squared value of 0.7250 confirms the
significance of the model. The adequate precision value describes the signal-to-noise ratio, which
compares the range of predicted values at the design points to the average prediction error. In
general, ratios greater than 4 are desirable and in this case, the adequate precision value is 8.03,
which exceeds the desired ratio, and indicates an adequate signal.
Table 19 ANOVA analysis of the quadratic model for the prediction of uranium recovery.
Source Sum of
Squares df
Mean
Square F Value
p-value
Prob> F
Model
Lack of Fit
8250.39
1087.33
14
10
589.31
108.73
5.90
1.94
0.0019
0.3879
Significant
Not
significant
A- Extractant
Concentration
2045.46 1 2045.46 20.46 0.0007
B- pH 2849.62 1 2849.62 28.51 0.0002
C- Strippant
Concentration
47.52 1 47.52 0.48 0.5036
D- O/A Ratio 2359.57 1 2359.57 23.61 0.0004
AB 90.25 1 90.25 0.90 0.3608
AC 60.76 1 60.76 0.61 0.4507
AD 12.18 1 12.18 0.12 0.7331
BC 1.17 1 1.17 0.012 0.9158
BD 228.31 1 228.31 2.28 0.1566
CD 96.73 1 96.73 0.97 0.3447
A2 361.72 1 361.72 3.62 0.0814
B2 27.10 1 27.10 0.27 0.6121
C2 211.29 1 211.29 2.11 0.1716
D2 110.07 1 110.07 1.10 0.3147
R-Squared 0.8731
Adj R-Squared 0.7250
Pred R-Squared 0.3105
Adeq Precision 8.029
Like the first subset, here again, 3D response surface plots were given in Figure 36 to graphically
represent the relation between the parameters and their subsequent effect on uranium recovery. It
was observed from the experimental test results that an increase in the operational parameters
produces a lower uranium recovery. However, when the interacting effect of the model terms was
further analyzed, it was seen that any reduction in the uranium recovery into the final product
stream does not depend solely on a single parameter. A simultaneous increase in the extractant
concentration, O/A ratio, and solution pH generates the best separation performance. Figure 36(A)
shows the effect of extractant concentration and pH on uranium recovery while the O/A ratio and
stripping agent concentration were fixed at 2 and 1 mol/L, respectively. One of the highest uranium

68
recovery (57.22%) of this set of tests was observed when the feed solution pH and extractant
concentrations were 2.5 and 30% by volume, respectively. A gradual increase in the pH and
extractant concentration lowered the uranium recovery. The lowest uranium recovery (3.42%) into
the rare earth product stream was obtained at a pH value of 3.5 with 50% TBP by volume. These
findings prove that the pH of the feed solution and the extractant concentration are the two critical
factors impacting uranium recovery. A higher extractant concentration enhanced the process, and
higher uranium removal from the aqueous phase to the organic phase was achieved. The same
conclusion was reached in the previous set of tests with the lowest uranium recovery being
obtained under identical conditions (i.e., pH of 3.5 and 50 v% TBP). Figure 36(B) shows the effect
of extractant concentration and stripping agent concentration while the feed solution pH and O/A
ratio were kept constant at 3.5 and 2, respectively. It can be seen that changing the stripping agent
from DI water to sulfuric acid had an impact on uranium recovery. In both sets of the tests, the
lowest uranium recovery was obtained under the same conditions (i.e., 50 v% TBP at pH 3.5 with
O/A ratio 3), with the only difference being the stripping agent. The uranium recovery was reduced
by approximately 2.5% after switching the strippant, which indicates the effect of sulfuric acid to
some extent. However, the concentration of sulfuric acid tested in the study did not generate a
significant impact on the separation results. In Figure 36(C), the effect of the O/A ratio and
extractant concentration on uranium recovery can be seen. The uranium recovery into the final
product stream decreases with an increase in both extractant concentration and O/A ratio. The
highest uranium recovery of 62.5% was achieved with the lowest extractant concentration (30%
TBP) and O/A ratio of 1. A low O/A ratio may not be sufficient to extract uranium ions from the
aqueous phase for separation the purpose. Therefore, an increase in the O/A ratio results in an
improved separation. Additionally, a high O/A ratio and pH produce noticeably enhanced
separation results. Similar findings were also obtained in Jorjani and Shabazi’s study (2012).
Figure 36(D) further shows the effect of feed pH value and stripping agent concentration while
extractant concentration and O/A ratio were kept constant at 40% and 2, respectively. As it was
indicated and statistically supported by the model, pH is an influential parameter, and the best
result was obtained at pH 3.5. The lowest uranium recovery was generated using 1 mol/L sulfuric
acid. Even though an increase in the concentration of stripping agent from 0.5 mol/L to 1 mol/L
lowered the uranium recovery, a further boost from 1 mol/L to 2 mol/L had a minimum impact on
uranium recovery. This indicates that 1 mol/L H2SO4 solution was sufficient to break the uranium-
TBP complex and strip uranium back into the aqueous phase. Figure 36(E) displays the effect of
O/A ratio and solution pH and it can be seen from the figure that a high O/A ratio and pH produce
noticeably enhanced separation results. Moreover, a lower uranium recovery observed with an
increase in the solution pH suggests that the higher pH favors creating more stable uranium-TBP
complexes. Lastly, the plot in Figure 36(F) shows the effect of the O/A ratio and stripping agent
concentration on uranium recovery while keeping the extractant concentration and pH constant at
40% and 3.5, respectively.
Similar to the first subset, 2D contour plots were generated for this subset to further evaluate the
degree of interaction between the variables tested during the experiments. Elliptical contours

69
observed for Figure 37(A), (D), and (E) indicate strong interaction, whereas Figure 37(B) and
Figure 37(F) represent relatively less significant interaction. Among all the contour plots, Figure
37(C) displays the smallest interaction with more circular lines.
Statistical analysis was also performed for the recovery of total rare earths, and a model was
developed. Although a model was obtained, the ANOVA indicates that the model is not
statistically meaningful. However, the insignificance of this model is consistent with the
experimental findings of both sets of tests. Considering the objective of this experimental design
is to investigate the effect of different input operating variables on uranium recovery as opposed
to rare earths recovery. Therefore, it is not surprising that the input variables had a minimum
impact on the recovery of rare earths compared to uranium. This finding confirms the selectivity
of the experimental design.
B
A

70
D C
Figure 36 3D surface response graphs obtained for the statistical model predicting uranium recovery.
E F

71
B A
C D

72
Rare Earth Oxalate Studies
A new set of tests were conducted with the rare earth oxalate sample provided by the University
of Kentucky. This sample was generated at the pilot processing plant operated by the project
partner researchers, and it was used as a validation of previously obtained test results. The
elemental composition of the rare earth oxalate sample is given in Table 20, and the process
flowsheet followed for thorium removal is given in Figure 38. As seen, the total rare earths
concentration is around 35%, and the light rare earths constitute the majority. While there was no
uranium detected, thorium content is 0.12 mg/g.
Table 20 Elemental composition of the rare earth oxalate sample.
Element Sc Y La Ce Pr Nd Sm Eu
Concentration (mg/g) 0.14 14.42 66.20 144.80 17.78 72.42 12.46 2.20
Element Gd Tb Dy Ho Er Tm Yb Lu
Concentration (mg/g) 8.56 0.83 3.35 0.56 1.32 0.14 0.76 0.10
Element Th Ca Fe
Concentration (mg/g) 0.12 30.75 9.31
Initially, a 10 g rare earth oxalate sample was roasted at 600 °C for 2 hours to produce rare earth
oxide. After roasting, 5.7 g of solid was obtained. After taking a representative sample for
elemental analysis, the remaining solid sample was washed with 0.5 mol/L HCl acid to remove
calcium. During the calcium wash step, the agitation was provided by a magnetic stirrer at
approximately 525 rpm. After 15 minutes of washing, the solution was filtered using 0.45 µm pore
size filter paper, and the solid that remained on filter paper was dried in the oven overnight. Solid,
Figure 37 2D contour plots obtained for the statistical model predicting uranium recovery.
F E

73
obtained after the calcium removal step, was weighed, and a sample was taken for analysis. The
sample was taken from the wash effluent as well.
Following the calcium removal step, leaching was performed at a concentration of 0.5 g/L using 6
mol/L hydrochloric (HCl) acid at 80 °C. Mixing was continued for 24 hours. After leachate was
generated, precipitation tests were conducted. 50% w/w NaOH was used to adjust the pH. When
the targeted pH value was achieved, the test was stopped, the solution was centrifuged for 15 min,
and then it was subjected to filtration using 0.45 µm pore size filter paper. The sample was taken
from the filtrate, and the precipitated solid sample was dried in the oven overnight. All the stage-
wise precipitation tests were conducted at room temperature, and DI water was used at all steps.
Figure 38 Experimental flowsheet followed for rare earth oxalate sample.
The results obtained from stage-wise precipitation tests are given in Figure 39. The first color
change and formation of particles were observed around pH 3.5 for all the tests. However, even
after 45 minutes of settling and an additional 20 minutes of centrifuging, nothing was completely
precipitated or settled. Therefore, it is not suggested to pause at this pH value. The results are
consistent with the previous selective precipitation tests conducted using the synthetic solution. A
good selectivity was observed between thorium and rare earth elements suggesting a pH value
lower than 5. A continuous increase in the precipitation of rare earths was observed, and it reached
Roasting at 600°C for
2hours
RE Oxalate feed
Solid
Filtrate
Leaching with HCl acid
Leachate
Precipitation tests
Filtration
Precipitated solid
Filtrate
Ca removal with HCl acid
RE Oxide
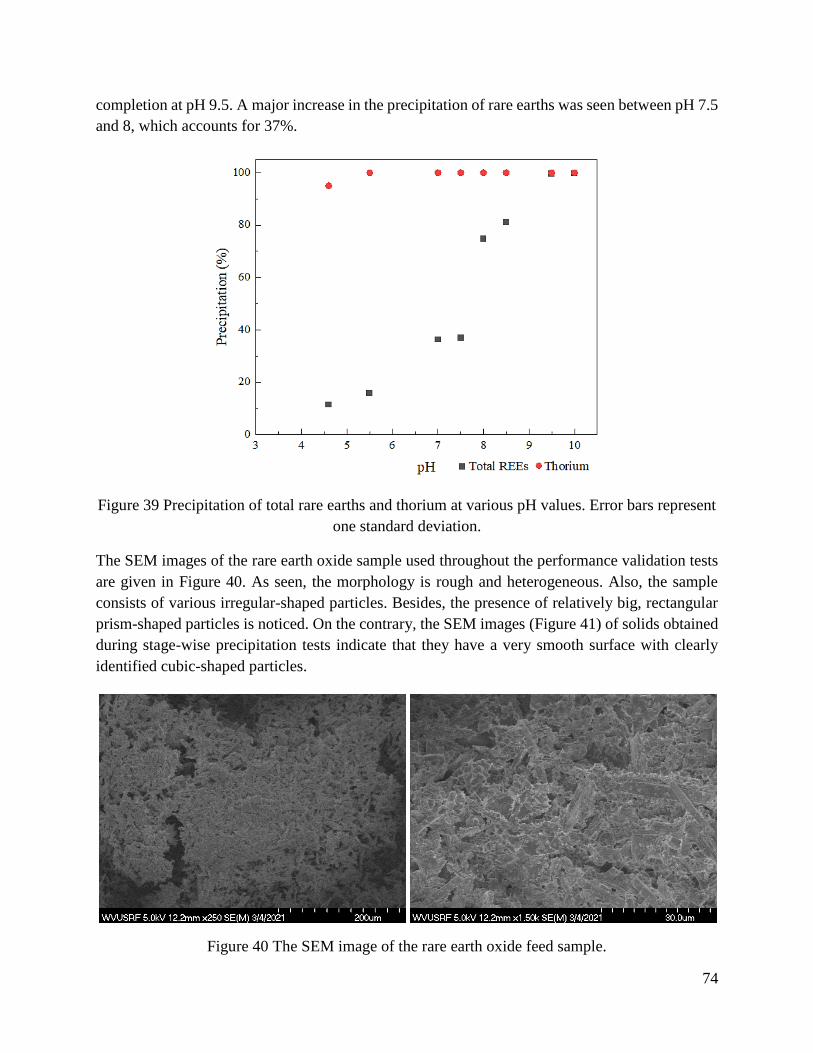
74
completion at pH 9.5. A major increase in the precipitation of rare earths was seen between pH 7.5
and 8, which accounts for 37%.
Figure 39 Precipitation of total rare earths and thorium at various pH values. Error bars represent
one standard deviation.
The SEM images of the rare earth oxide sample used throughout the performance validation tests
are given in Figure 40. As seen, the morphology is rough and heterogeneous. Also, the sample
consists of various irregular-shaped particles. Besides, the presence of relatively big, rectangular
prism-shaped particles is noticed. On the contrary, the SEM images (Figure 41) of solids obtained
during stage-wise precipitation tests indicate that they have a very smooth surface with clearly
identified cubic-shaped particles.
Figure 40 The SEM image of the rare earth oxide feed sample.

75
Figure 41 The SEM image of precipitated solids at pH 4.6.
Conclusions
In this chapter, selective precipitation and solvent extraction were applied to assess the separation
of thorium and uranium from a rare earth-containing solution. Based on the findings of initial
testing, an experimental approach consisting of selective precipitation followed by solvent
extraction was developed and strictly followed. Later, the findings were validated using a real
system rare earth oxalate sample generated at the pilot processing plant located in Kentucky.
Specific findings from this part of the study include:
1. Selective precipitation was an effective technique for the removal of thorium. Nearly 100%
of thorium precipitated out at a solution pH value of 4.8, while 19.3% of rare earths and
47.9% of uranium co- precipitated at the same pH. A further increase in the solution pH
led to the co-precipitation of rare earths and uranium due to their overlapping precipitation
pH regions.
2. At the same pH value of 4.8, approximately 65.6% of iron precipitated out, followed by
around 38.5% of aluminum, 17.1% of calcium, and 14.2% of magnesium precipitation.
3. Species distribution diagrams of thorium, uranium, selected REEs, iron, and aluminum in
chloride media corresponded well with the precipitation data generated during selective
precipitation, which enhanced the understanding of metal precipitation from a fundamental
perspective.
4. The precipitation reactions were spontaneous and exothermic for the elements studied
based on calculated Gibbs energy and enthalpy values. All precipitation reactions were
thermodynamically favorable at the standard state operating conditions.
5. Solvent extraction preferentially extracted uranium compared to thorium from the REE-
containing solution. A two-stage solvent extraction process proved to be more efficient
than the single-stage process, during the former process of which approximately 97%, 94%,

76
and 43% of REEs, thorium, and uranium were recovered into the circuit product stream,
respectively.
6. Test results following the first subset of the modified experimental protocol indicate that
extractant concentration, solvent extraction feed pH, and O/A ratio during extraction, all
played a significant role in the removal of uranium from rare earths, which the statistical
model further corroborated developed using Box-Behnken.
7. The optimum separation performance was identified throughout the study, which
corresponded to overall rare earth, thorium, and uranium recovery of 79.6%, 0%, and 3.1%,
separately. The optimum separation was obtained under the following operating condition:
one-stage precipitation at a pH value of 4.8, solvent extraction feed pH of 3.5, 50 v% TBP,
O/A ratio at 3:1.
8. During the second subset, the recovery of rare earths into the REE product stream varied
from 80.2 wt% to 97.6 wt% based solely on solvent extraction. In comparison, uranium
recovery into the same product steam fluctuated between 3.4 wt% and 62.5 wt% under all
tested conditions.
9. The lowest overall uranium recovery of 1.8 wt% into the final product stream was achieved
with 50 v% TBP, feed pH at 3.5, O/A ratio at 3, and 1 mol/L H2SO4 strippant, which
corresponded to an overall rare earth recovery of 73.4 wt%.
10. A statistically significant model was developed for uranium recovery prediction in solvent
extraction, which indicates the extractant concentration, solution pH, and O/A ratio all
played a critical role. On the contrary, the concentration of the stripping agent (H2SO4) was
found as an insignificant parameter over the tested concentration range.

77
CHAPTER 5
ZEOLITE ADSORPTION STUDIES
Characterization of Initial Zeolite Samples
Three zeolite samples with distinctly different size distributions were used to investigate the effect
of particle size on the adsorption efficiency. The particle size distribution of these zeolite samples
is provided in Figure 42. Figure 42(A) shows the particle size distribution of the coarsest zeolite
sample with a P80 passing value of 1490 µm, whereas Figure 42(B) displays the particle size
distribution of the middle-sized zeolite sample with a P80 value of approximately 200 µm. Lastly,
the particle size distribution of the finest sample is provided in Figure 42(C). As seen, a P80 value
of approximately 12 µm was found for this particular sample. Due to the limit of the particle size
analyzer’s capability, the particle size distribution of the coarsest zeolite sample was determined
via sieve analysis, while the rest two samples were subjected to the laser particle size analysis.
Figure 42 Particle size distribution of three zeolite samples. (A) Coarsest sample, P80=1490 µm,
(B) Middle-sized sample, P80=200 µm, (C) Finest sample, P80=12 µm.
A
C
B

78
Mineralogical compositions of the samples were identified using XRD. The combined XRD
patterns of the three samples are provided in Figure 43. All samples displayed the same diffraction
pattern with the most intense peak being at approximately 22°, which refers to the single phase of
clinoptilolite-type zeolite. It is the most commonly found zeolite type with the aluminum-silicate
tetrahedral arrangement and Si/Al>4 (Godelitsas and Armbruster, 2003). This type of zeolite series
has the complex chemical formula of Na6[Al6Si30O72]24H2O.
Figure 43 X-ray diffraction pattern of the zeolite samples.
XRD analysis was followed by identifying the chemical composition of the zeolite samples using
the Vanta handheld XRF analyzer. Test results indicate that the samples contain a high
concentration of silicon and aluminum, which is typical for zeolites. The distinctive properties of
zeolites result from their honeycomb structures with water molecules and exchange cations located
in the cavities. Mostly, Ca2+, Na+, or K+ located in the cavities, are exchangeable with other ions
depending on the Si/Al ratio and the position of the ion exchange sites. This ratio provides a
relatively high negative charge for attracting positive ions from the solution; thus, an increase in
aluminum concentration will also provide higher adsorption capacity. The SiO2/Al2O3 ratio of the
three zeolite samples was around 5.74%. In addition to these major components, 1.43 wt% Ca,
0.99 wt% Fe, 0.28 wt% Mg, and 2.10 wt% K were also detected in the samples as minor
components. The framework structure containing cations and enclosing cavities, called supercage
(Nandanwar et al., 2016).
Clinoptilolite

79
EDX spectrums of three zeolite samples are presented in a combined graph (Figure 44). All three
samples represent a similar EDX pattern that shows Si, O, and Al as the main peaks. Compared to
coarse and middle-sized zeolite samples, the EDX pattern of the finest zeolite sample (12 µm)
displays considerably high intensities for all element peaks. In addition to Si, Al, and O, a portion
of Na was also detected. The findings obtained from EDX, XRF, and XRD analyses complete and
support each other. The carbon peak seen in the EDX spectrum is due to the carbon tape substrate
used during sample preparation.
The images obtained by SEM under various magnifications are seen in Figure 45. As seen,
regardless of the sample size, the surface is heterogeneous and rough with noticeable porous
structures. Also, particles all have flaky and irregular shapes, which is consistent with the
observations provided in Zendelska and his co-workers’ study (2015). Besides, The finest zeolite
samples also tend to agglomerate due to an increased surface area, as seen in Figure 45(C).
Figure 44 Elemental identification of the zeolite samples obtained from the EDX spectrums.
O
C
Na
Al
Si

80
C
A
B
Figure 45 SEM images of the zeolite samples under various magnification. (a) the coarsest sample, (b) medium size sample, (c) the finest sample.

81
Lastly, the three zeolite feed samples with a P80 value of 1490 µm, 200 µm, and 12 µm, separately,
were subjected to the BET nitrogen adsorption tests using the Micrometrics BET instrument
equipped with the ASAP 2020 Version 4.02 to identify the pore size and specific surface area. The
Brunauer–Emmett–Teller (BET) method is most widely used for evaluating the surface area of
porous materials. Nitrogen (at 77 K) is traditionally the adsorptive used to perform the analysis.
While the coarsest zeolite had a pore diameter of 12.6 nm, the middle-sized and the finest zeolites
had a pore diameter of 9.9 and 8.7 nm, respectively. According to the classification of pores
established by the International Union of Pure and Applied Chemistry (IUPAC) in 1985 (Thommes
et al., 2015), all zeolite samples have mesoporous structures due to pore widths less than 50 nm.
The specific surface area of the coarsest sample was determined as 16.1 m2/g. The middle-sized
and the finest samples had a specific surface area of 15.7 and 20.2 m2/g, respectively. As seen,
with a decrease in the particle size, the corresponding specific surface area generally increased.
Moreover, the pore volume distribution as a function of the pore size indicated a linear distribution
for all three zeolite samples.
The adsorption isotherm of the three zeolite samples is given in Figure 46, and the classification
of physisorption isotherms is shown in Figure 47(A). According to the classification, the nitrogen
adsorption on the zeolite sample is a Type IV (a) isotherm. Point B, the beginning of the near-
linear section, usually corresponds to the completion of monolayer coverage. For example, a more
gradual curvature, a less distinctive Point B, is an indication of significant overlap of the monolayer
coverage and the multilayer adsorption. There existed a linear relationship between the absorbance
and the relative pressure varying from 0.09 to approximately 0.7, representing the predominant
mesoporous region of the fraction. A near-vertical adsorption line appeared with a relative pressure
beyond 0.9 indicates that the zeolites had a portion of macropores as well. If a mesoporous
adsorbent contains no macropores, the Type IV isotherm remains nearly horizontal over the upper
range of p/p0 (Thommes et al., 2015). In addition, the adsorption started at very low pressures,
which may indicate the presence of some micropores (Ramesh et al., 2014). Besides, there existed
a hysteresis between adsorption and desorption curves. This hysteresis occurs when the pore width
exceeds a certain critical width (i.e., pores wider than 4 nm) (Thommes et al., 2015). According to
the hysteresis classification given in Figure 47(B), it is an H3 type of hysteresis. Pore-size
distribution is usually expressed in the form of a pore volume distribution as the function of the
pore size. As seen in Figure 48, the pore size distribution is linear. Overall, no difference was
observed between the nitrogen adsorption behaviors of the three zeolite samples (i.e., coarse,
middle-sized, and fine zeolite samples).

82
Figure 46 The Brunauer–Emmett–Teller (BET) Nitrogen adsorption isotherm of the three zeolite
samples.
Figure 47 Classification of (a) physisorption isotherms, (b) hysteresis (Thommes et al., 2015)
A B
B

83
Figure 48 Pore size distribution of the three zeolite samples.
Adsorption Tests
The recovery of total rare earths, thorium, and uranium into the solid phase was given in Figure
49. As seen in Figure 49(A), the recovery of rare earths fluctuated between 0.03 wt% and 96.90
wt%. On the contrary, nearly 100 wt% thorium removal was achieved in every test condition
except for Test 23, which yielded a 36.67 wt% of thorium adsorption (Figure 49(B)). Like rare
earths, a significant variation was observed for uranium adsorption, as shown in Figure 49(C). The
adsorption recovery of uranium changed between 0.00 and 98.70 wt%.

84
A
C
B
Figure 49 Adsorption recoveries into the solid phase. A) total rare earths, B) thorium, C) uranium. Error bars represent
one standard deviation of multiple replicate test.

85
The three lowest rare earth adsorption recoveries, namely 0.03 wt%, 1.01 wt%, and 2.67 wt%,
were achieved with Test 16, 27, and 23, respectively, at the same pH value of 2. Additionally, Test
16 and Test 27 were conducted with zeolite samples of the same size (i.e., 200 µm). However, Test
23 was performed using the zeolite sample with a P80 value of 12 µm, indicating the impact of
particle size on the adsorption mechanism. The retention time of Test 16, 27, and 23 was 3, 1, and
2 hours, respectively. As seen, Test 16 produced the lowest rare earth adsorption into the solid
phase (0.03 wt%), which corresponded to a 3-hour contact time. However, when the zeolite’s size
was reduced to 12 µm (Test 23), a retention time of 2 hours was sufficient to achieve a nearly
equal low rare earth adsorption (2.67 wt%). Moreover, in a study conducted by Kini (2006), it was
stated that different adsorption tests might take various contact times to equilibrate with the ions
in the solution to complete the adsorption. Although these three tests generated the lowest rare
earth adsorption recoveries into the solid phase, no separation was observed between uranium and
rare earths under the same conditions. This may be due to the saturation of adsorption sites with
other ions before uranium. Under all three test conditions, 0 wt% uranium was adsorbed by the
zeolites. On the other hand, thorium adsorption recovery varied among these three test conditions.
The thorium adsorption recovery at Test 16, 27, and 23 was 99.33 wt%, 72.52 wt%, and 36.67
wt%, respectively. It is known that thorium shows minimal tendency to hydrolyze at low pH
values, and the dominated ion at pH< 3 is Th4+, which is the exchangeable ion between solution
and the zeolite. When the solution pH increases, the formation of other species (i.e.[ThOH]3+,
[Th(OH)2]2+, and [Th(OH)3]
+) are seen due to hydrolysis. The hydroxyl group in these species
increases with increasing pH (Faghihian et al., 2004).
The effect of particle size was expected since adsorption capacity is dependent on the effective
surface area, which generally increases with decreasing particle size (Zou et al., 2009). Also,
particles with a smaller diameter are characterized by a larger specific surface area. Thus the
adsorption is enhanced, and a shorter contact time is required to reach the equilibrium. However,
an increase in the adsorption recovery of rare earths was observed while a coarser zeolite sample
was used. For example, Test 5 and Test 11 were conducted under the same operating conditions,
except for the zeolite particle size. While Test 5 was performed with the coarsest zeolite, 1490 µm,
Test 11 was carried out with the finest size zeolite, 12 µm. The respective rare earth adsorption
recoveries were found as 90.67 wt% and 20.43 wt%. The reason for this substantial increase in the
adsorption recovery of rare earths may lie under the particle size reduction occurring during the
mixing of solid and liquid phases throughout the adsorption process. The post adsorption SEM
image provided in Figure 50 shows fractures and cracked surfaces, which may result from a
reduction in the zeolite particle size. Later, the particle size analysis performed with post
adsorption solid samples confirmed the size reduction. The particle size of the coarsest zeolite
sample with an initial P80 value of 1490 µm was reduced to 45 µm after adsorption. Likewise, a
reduction in the particle size of the middle-sized zeolite sample was also observed. After
adsorption, the new P80 value of the middle-sized zeolite sample was found to be 60.5 µm as
opposed to the initial value of 200 µm. However, no change in the particle size of the fine sample
(i.e., 12 µm) was detected. The particle size reduction occurred for coarse and middle-sized zeolite

86
samples during adsorption. It created fresh surfaces and new active sites ready for ion adsorption
that may explain the elevated adsorption recovery with increased nominal adsorbent particle size.
Overall, the best separation performance was achieved with Test 11 while using 2.50 grams of 12-
µm zeolite sample at a pH value of 3 with a contact period of 2 hours. Under these conditions, the
adsorption recovery of rare earths, thorium, and uranium into the solid phase was found to be 20.43
wt%, 99.20 wt%, and 89.60 wt%, respectively.
In terms of major metal adsorption, steady recovery results were observed for iron in comparison
to aluminum and magnesium. Almost 100 wt% iron adsorption onto zeolite was seen under every
test condition. Similar selective iron adsorption over other metals was seen in Motsi and his co-
workers’ (2009) study on heavy metal adsorption from acid mine drainage by natural zeolite.
Contrarily, the adsorption recovery of aluminum changed between 12.49 wt% to 99.65 wt%, where
the lowest adsorption recovery was achieved with Test 11. The adsorption recovery of magnesium
also varied. The lowest magnesium adsorption, 69.60 wt%, was observed with Test 11, and the
highest magnesium adsorption recovery seen was 99.87 wt%. Detailed results for the adsorption
studies are provided in Table 36 and Table 37 in the Appendix.
Figure 50 SEM image showing the fractures and cracks formed after adsorption.
Characterization of Post Adsorption Zeolite Samples
The solid sample used during Test 11 (12-µm zeolite) was subjected to XRD and SEM-EDX
analyses to detect any change in the elemental and mineralogical compositions after adsorption.
Results obtained from XRD revealed the formation of halite and perrierite-Ce in addition to
clinoptilolite. Halite formation is probably due to the reaction between feedstock’s medium, HCl,
and the addition of pH regulator, NaOH. Also, the zeolite samples initially contained a small
amount of sodium before the adsorption tests. Perrierite-Ce is a compound consisting of many
elements and having a general formula of A4BC2D2Si4O22, where A represents rare earths and

87
thorium, B represents Fe, Mn, Mg, C refers to Fe, Mn, Mg, Al, Ti, Cr, and D corresponds to Ti
(Muhling et al., 2014). Cerium and lanthanum are the most dominant rare earth elements.
Perrierite-Ce is defined as radioactive according to the Code of Federal Regulations Title 49, which
supports the high concentration of thorium in the zeolite post adsorption. The XRD pattern of the
sample was given in Figure 51.
Figure 51 XRD pattern of the solid samples generated with Test 11.
Image analysis was performed using SEM to provide further information. As seen in Figure 52,
the morphology remains rough, and the particles maintain irregular shapes. However, the
formation of small prismatic crystal particles is seen. This finding is well correlated with the crystal
structure of perrierite-Ce (Chukanov et al., 2012). The bright areas highlighted in the image may
refer to the accumulation of heavy elements such as the rare earths and thorium.
The EDX pattern of the solid sample generated from Test 11 is shown in Figure 53(A). In
comparison to the elemental concentration of the raw zeolite samples, after adsorption, a
substantial decrease in the intensities of aluminum and silicon was observed. This finding suggests
a reduction in aluminum and silicon concentration, attributed to the adsorption of external elements
onto the zeolite structure. Like XRD, EDX was also able to detect thorium and most of the rare
earth elements; however, their concentrations are considerably low compared to Al, Si, and O. Due
to this fact, they are not clearly seen in the full pattern. However, as shown in the close-up view
(Figure 53(B)), most of the rare earths were observed in the energy level between 0.5 and 1.3 keV,
and thorium was detected around 3 keV

88
Figure 52 SEM images of the solid samples generated after adsorption. Bright areas highlighted
in the red boxes indicating the deposition of heavy elements.
Figure 53 EDX pattern of the solid sample generated after Test 11. (A) Full EDX pattern
indicating high-intensity elements. (B) Close-up view showing the detection of rare earths and
thorium.

89
Statistical Analysis and Modeling of Adsorption Tests
Following the test results, the impact of four operating variables (i.e., zeolite particle size, feed
solution pH, adsorbent amount, and contact time) on the recovery of total rare earths, thorium, and
uranium was analyzed using the response surface methodology. The adsorption recovery values
of rare earths, thorium, and uranium obtained from the full dataset were uploaded to the Design
Expert Software following the Box Behnken experimental design. Statistical models were
developed separately to determine the operational sensitivity with respect to the input parameters.
A statistical model was first developed as a tool to predict the recovery of rare earth elements by
incorporating all the influential operating parameters, as shown in Eq. (33). It can be seen from
the quadratic model that the variables, including the zeolite particle size, feed solution pH, and
adsorbent amount, except the contact time, all had a significant impact on the recovery of rare
earths.
𝑅𝐸𝐸 𝐴𝑑𝑠𝑜𝑟𝑝𝑡𝑖𝑜𝑛 𝑅𝑒𝑐𝑜𝑣𝑒𝑟𝑦 = +60.21 + 28.43 ∗ 𝐴 + 27.46 ∗ 𝐵 + 16.27 ∗ 𝐶 + 8.58 ∗ 𝐷 − 14.33 ∗
𝐴𝐵 − 5.08 ∗ 𝐴𝐶 − 3.48 ∗ 𝐴𝐷 − 14.13 ∗ 𝐵𝐶 + 5.62 ∗ 𝐵𝐷 − 14.23 ∗ 𝐶𝐷 + 2.08 ∗ 𝐴2 − 7.39 ∗ 𝐵2 +
7.76 ∗ 𝐶2 − 3.68 ∗ 𝐷2 (33)
where the uncoded model terms A, B, C, and D correspond to zeolite particle size, feed solution
pH, adsorbent amount, and contact time, respectively. While a statistical model was generated for
rare earths, a significant model was generated for neither thorium nor uranium.
The Analysis of Variance (ANOVA) table used to determine the significance of the statistical
model generated for the estimation of rare earth adsorption recovery is shown in Table 21. As seen
from the table, the model F-value of 6.90 implies the model is significant. The probability of an
F-value becoming this large is 0.09% (<5%, which is the critical P-value used to determine the
significance). Model terms are considered significant within a 95% confidence level, or in other
words, values of “prob>F” less than 0.05 indicate that terms are significant. In this case, terms A,
B, and C are significant model terms, whereas D is an insignificant model term. The lack of fit
value of 1.21 implies a 53.50% chance that a lack-of-fit F-value can be this high. The lack of fit
must be insignificant for a model to be fit. In the same table, R-squared values were also given to
further evaluate the robustness of the developed model. As seen, the R-squared value of 0.8895,
and an adjusted R-squared value of 0.7606 further confirm the model’s significance.

90
Table 21 ANOVA analysis of the quadratic model for predicting rare earth recovery.
Source Sum of
Squares df
Mean
Square F Value
p-value
Prob> F
Model 26572.63 14 1898.05 6.90 0.0009 Significant
A- Particle Size 9696.90 1 9696.90 35.25 0.0001
B- pH 9048.07 1 9048.07 32.89 0.0001
C- Adsorbent
Amount
D- Contact Time
3177.21
884.26
1
1
3177.21
884.26
11.55
3.21
0.0053
0.0982
AB 821.68 1 821.68 2.99 0.1095
AC
AD
103.12
48.44
1
1
103.12
48.44
0.37
0.18
0.5518
0.6822
BC
BD
CD
798.06
126.34
810.26
1
1
1
798.06
126.34
810.26
2.90
0.46
2.95
0.1142
0.5108
0.1118
A2 23.08 1 23.08 0.084 0.7770
B2 290.94 1 290.94 1.06 0.3240
C2
D2
320.78
72.06
1
1
320.78
72.06
1.17
0.26
0.3014
0.6181
Residual 3300.85 12 275.07
Lack of Fit 2832.19 10 283.22 1.21 0.5350 Not Significant
significant Pure Error 468.66 2 234.33
Cor Total 29873.48 26
R-Squared 0.8895
Adj R-Squared 0.7606
Pred R-Squared 0.4186
Adeq Precision 10.110
Three diagnostic plots developed based on the statistical model are given in Figure 54. The
relationship between two parameters was described in these plots while keeping the other two
parameters constant at their middle values. In Figure 54(A), the effect of particle size and pH is
presented while keeping the adsorbent amount and contact time constant at 3.75 g and 2 hrs,
respectively. It is well-known that pH is an important parameter in adsorption processes. As seen,
rare earth recovery increases with an increase in the pH value. This phenomenon could attribute
to the competition between hydrogen ions and rare earth ionic species present in the solution at a
given pH value (Faghihan et al., 2004). Typically, zeolite has a tendency to adsorb H+ ions from
the solution, which creates a positive charge on the zeolite structure and other positively charged
ions are repulsed due to the electrostatic interaction. When the solution pH increases, the amount
of H+ ions decreases, which results in the adsorption of other ions present in the solution (Motsi et
al., 2009). However, freed negatively charged ions (i.e., Cl-) may reverse the electrostatic repulsion
and enhance adsorption. At the same time, depending on the concentration and conditions, it may
have an opposite effect and further reduce the adsorption by binding with metals and forming
complexes that cannot be adsorbed. This fact could be the reason for the wide variation observed
in the adsorption recovery of rare earths. Also, rare earth adsorption recovery rises with an increase
in the particle size, which statistically supports the findings stated earlier that unexpected particle
size reduction induced during mixing leads to enhanced adsorption due to freshly created surfaces
for ion adsorption. The same trend was seen in Figure 54(B). The relationship between particle

91
size and the adsorbent amount is given while maintaining the pH and contact time constant at 2
and 2 hours, respectively. In comparison to Figures 54(A) and 54(C), Figure 54(B) displays a
relatively flat surface. A higher amount of adsorbent will result in more significant adsorption
because the active adsorption sites will increase concurrently. Figure 54(C) further shows that rare
earth recovery decreases at a lower pH value and a smaller adsorbent amount.

92
A
C
B
Figure 54 Diagnostic plots obtained based on the statistical model developed for the adsorption recovery of rare earths.

93
Adsorption Kinetics and Isotherms
The kinetic adsorption test results shown in Figure 55 indicate fast adsorption for thorium instead
of rare earths and uranium. Within the first 5 min, the adsorption recovery of thorium reached 86.5
wt%, which later continued to rise but with a slight incremental increase. At the end of the 3-hr
contact, the maximum thorium adsorption onto the zeolite was 93.4 wt%. On the other hand, rare
earths and uranium followed a similar pattern jointly. A significant increase in the adsorption
recovery of rare earths was first seen during the 10-15 min time interval. At the end of 10 min, the
adsorption recovery of rare earths was 3.0 wt%, and at 15 min, it increased by 8.2 wt% and reached
a new value of 11.3 wt%. Later, another 8.2 wt% increase was further observed during the 30-45
min time interval. Adsorption recovery of total rare earths reached 21.5 wt% at the end of the
kinetic test. Data shown in Figure 56 further support the findings mentioned above. It can be seen
from Figure 56(A) that the distribution of rare earths in the solid phase increased significantly at
both the 10-15 and 30-45 min time intervals. The distribution of thorium as a function of adsorption
time is presented in Figure 56(B), which again suggests that the most significant adsorption
occurred during the first 5 min. Uranium exhibited a similar adsorption behavior as rare earths.
Low uranium adsorption was also observed in Godelitsas and Armbsruster’s study due to the
complicated aqueous chemistry of uranium as well as the constant structural changes occurring in
the mesoporous zeolite sample (Godelissas and Armbruster, 2003). In the same study, high
thorium adsorption along with hydrogen ion adsorption at pH<3 were also observed, which shares
similar findings presented here. The adsorption mechanism starts with the formation of complexes
at the external surface. Later, the ions transport into the pores to form inner complexes via covalent
or ionic bonding and become more stable. As the valence of a cation increases, the tendency of
complexation also increases. Later the cation creates an outer-sphere complex in which at least
one water molecule being in between the cation and the adsorbent. Sometimes, the cation, which
is surrounded by water molecules, may locally neutralize the surface charge of the adsorbent
instead of forming a complex. In that case, the ion lies in the diffusion layer. While the complexes
on the Stern layer may have covalent or ionic bonding, the ions in the diffusion layer only have
ionic bonds. Rapid thorium complexes formed on the external surface of the zeolite may block the
formation of complexes with other ions. Afterward, the thorium molecules diffusing into the inner
pores can hinder the adsorption of other ions. This may also be explained via the molecule sizes
of rare earths, thorium, and uranium. While thorium has a molecule size of 0.24 nm, uranium has
a molecule size of 0.23 nm. Although the molecule size of rare earths changes, it varies between
0.23 and 0.25 nm. If thorium is adsorbed first due to its easy nature, it may slow down the transport
of other ions when the adsorbent has a narrow pore diameter (Malamis and Katsou, 2013). This
matter also supports the identification of thorium-containing mineral phases in the XRD analysis
conducted after adsorption. Moreover, Parzentny and Rog (2019) stated that uranium is mainly
concentrated on the surface of Al-Si porous structures, and thorium is concentrated in the Al-Si
grains.

94
Figure 55 Adsorption recoveries of total rare earths, thorium, and uranium as a function of
contact time. Error bars represent one standard deviation of multiple replicate tests.
Figure 56 Distribution coefficient values of (A) total rare earths and (B) thorium as a function of
contact time. Error bars represent one standard deviation of multiple replicate tests.
The adsorption data were examined according to the kinetic models of pseudo-first-order (equation
34) and pseudo-second-order (equation 35). The pseudo-first-order model assumes that the rate of
radionuclide removal with time is directly proportional to the difference between the equilibrium
capacity of sorbent and the amount of radionuclide sorbed at any time. On the other hand, the
pseudo-second-order model assumes that the sorption process is a pseudo-chemical reaction
process which means the driving force is not the difference between the equilibrium capacity of
A B

95
sorbent and the amount of radionuclide sorbed at any time, but the overall sorption rate is
proportional to the square of the driving force (Sani et al., 2015).
ln(𝑞𝑒 − 𝑞𝑡) = 𝑙𝑛𝑞𝑒 − 𝑘1𝑡 (34)
𝑡
𝑞𝑡=
1
𝑘2𝑞𝑒2 +
1
𝑞𝑒 (35)
Where qt and qe (mg/g) are the amounts of ions adsorbed at t (min) and equilibrium, separately. k1
and k2 are the rate constants (1/min) for pseudo-first and pseudo-second-order, respectively. The
values of qe, k1, and k2 are determined from the slope and intercept values obtained from the plot
which is drawn based on ln(qe-qt) versus t for the pseudo-first-order and t/qt versus t for the pseudo-
second-order. The experimental data fit pseudo-second-order reaction better than pseudo-first-
order based on the significance of the correlation coefficients (Figure 57). Rate constants for rare
earths and thorium were found to be 1.2 1/min and 76.9 1/min, respectively. On the other hand, qe
values were calculated as 2.04 and 0.04 mg/g, separately.
Figure 57 Pseudo-second-order reaction model for (A) total rare earths and (B) thorium.
Adsorption isotherms were subsequently developed based on the kinetic adsorption data. The
isotherms indicate the distribution of molecules between the solid and liquid phases when the
process reaches its equilibrium (Wang et al., 2012). Zhou et al. (2012) studied selective uranium
adsorption using ion-imprinted magnetic chitosan. Their equilibrium data were fit to Langmuir’s
Isotherm equation which shows the monolayer adsorption process. Similarly, Li et al. (2018)
studied thorium and uranium separation from rare earth elements by sorption on phenanthroline
diamide functionalized graphene oxide, and their data well coincided with the Langmuir model.
On the other hand, Kaynar et al. (2015) studied thorium removal by ZnO, and their experimental
data were best characterized by the Freundlich adsorption model. Based on previously conducted
studies, Langmuir, Freundlich, and D–R isotherms, which aim to identify the adsorption
A B

96
mechanism underlying the experimental data, were decided on (Camacho et al., 2010; Li et al.,
2012; Karimi et al., 2019).
The Langmuir isotherm assumes that the adsorption occurs at specific homogeneous sites within
the adsorbents, and the energy of the adsorption is a constant (Langmuir, 1918). Moreover,
according to Langmuir isotherm, adsorption occurs uniformly on the active sites of the sorbent,
and once a sorbate occupies a site, no further sorption takes place at this site (Wang et al., 2012;
Barkat et al., 2015). The Langmuir isotherm equation is represented as:
𝑞𝑒 =𝑞𝑚𝐾𝐿𝐶𝑒
1+𝐾𝐿𝐶𝑒 (36)
Where Ce is the equilibrium concentration (mg/L), qe is the amount absorbed at equilibrium (mg/g),
qm is the Langmuir constant (mg/g), KL is constant for energy adsorption. Freundlich equation
considers the adsorbent surface as heterogeneous (multilayer mode), and the amount absorbed at
equilibrium is determined by the following equation (Liu et al., 2013):
𝑞𝑒 = 𝐾𝐹𝐶𝑒1/𝑛
(37)
Where KF is the Freundlich constant (L/g) and n is related to the adsorption density. D-R isotherm
is governed by the equation given below. It does not assume that the materials have homogeneous
surfaces (Barkat et al., 2015).
𝑙𝑛𝑞𝑒 = 𝑙𝑛𝑞𝑚𝑎𝑥 − 𝐾𝑎𝑑𝑠ɛ2 (38)
Where qmax is the capacity of saturation theory (mg/g), Kads is the adsorption energy constant
(mol2/kJ2), and ɛ is the Polanyi potential which is defined as:
ɛ = 𝑅𝑇𝑙𝑜𝑔(1 +1
𝐶𝑒) (39)
where R is gas constant (8.314 J/molK) and T is adsorption temperature (K).
The Freundlich adsorption isotherm was found to be the best fit for both rare earths and thorium
(Figure 58). The plots were generated following Eq. (37). Afterward, the slope and the intercept
of the plots were used to calculate 1/n and Kf values. The high correlation coefficient (R2) observed
in both isotherms suggests a good model fit. The Kf values for rare earths and thorium were
calculated as 2.05 and 0.24 L/g, respectively. A negative slope observed for rare earths and thorium
indicates a reverse correlation between the amount adsorbed (Cads) and the equilibrium
concentration (Ce), which corresponded well with the experimental findings that the amount

97
adsorbed decreased as time increased. Moreover, the Freundlich isotherm indicates multilayer
adsorption rather than monolayer and considers a heterogeneous surface.
Figure 58 Freundlich adsorption isotherms of the elements onto zeolite. (A) total rare earths (B)
thorium.
Dubinin-Raduskevich (D-R) adsorption isotherms of total rare earths and thorium are shown in
Figure 59. The mean adsorption energy calculated from the isotherms reveals supplemental
information on adsorption behavior. If the mean adsorption energy value falls between 1 and 8
kJ/mol, physical adsorption is considered. On the other hand, if the value varies between 9 and 16
kJ/mol, it represents chemical adsorption (Erden and Donat, 2016). The mean adsorption energy
(E) values of rare earths and thorium were calculated as 5.8 kJ/mol and 1.80x10⁻³ kJ/mol,
respectively. E<8 kJ/mol indicates that both rare earth and thorium adsorption is governed by
reversible physisorption and require less energy. Intermolecular forces are involved in
accomplishing the adsorption. Moreover, the activity coefficient values were found to be -1.48x10⁶
mol2/kJ2 and -1.54x10⁻⁵ mol2/kJ2 for total rare earths and thorium, separately.
Figure 59 D-R adsorption isotherms of the elements onto zeolite. (A) total rare earths (B) thorium.
A B
B A

98
Conclusions
In this chapter, zeolite adsorption was studied to remove thorium and uranium from rare earths.
Experimental testing was carried out to evaluate the impact of four operational parameters,
including solution pH, zeolite particle size, zeolite amount, and contact time, on the adsorption
recoveries. Following conclusions were reached at the end of the zeolite adsorption study:
1. It was observed that rare earths and uranium adsorption follow a similar pattern, which
creates the separation challenge. The reason for this phenomenon can be the competition
between rare earths and uranium ions.
2. As opposed to rare earth elements and uranium, test results indicate that zeolite adsorption
is an effective technique for thorium removal.
3. Iron adsorption was in agreement with thorium adsorption and exhibited a steady-state
adsorption under all operating conditions. Differently, a variation was observed for
aluminum and magnesium depending on the test conditions.
4. The statistical model developed to predict the adsorption recovery of rare earths indicates
that the initial solution pH, particle size, and zeolite amount are the key operating
parameters that all impacted the adsorption recovery of rare earths. However, the contact
time was identified as an insignificant parameter.
5. Kinetic studies suggest a fast adsorption rate for thorium in contrast to total rare earths and
uranium. Multilayer physisorption was determined for total rare earths and thorium when
zeolite was selected as the adsorbent.
6. In conclusion, the best separation was achieved using 2.5 grams of 12-µm zeolite at a
solution pH of 3 for a contact period of 2 hrs. Under these conditions, almost 100 wt%
thorium removal was achieved with approximately 20 wt% total rare earth loss.

99
CHAPTER 6
CONCEPTUAL PROCESS FLOWSHEET DEVELOPMENT
Based on the above findings, a conceptual flowsheet was developed in order to produce high purity
rare earth oxide while removing thorium and uranium (Figure 60). The proposed process flowsheet
was developed using metallurgical simulation software, METSIM, and comprised of five main
unit processes. The unit operations in the flowsheet are (1) leaching of the feedstock, (2) selective
thorium removal by precipitation, (3) uranium removal by solvent extraction (4) rare earth oxalate
precipitation, and (5) roasting for rare earth oxide production.
First, a solid coarse coal refuse sample is introduced to the leaching tank where the dissolution of
the coarse coal refuse with acid at elevated temperature (80 °C) is achieved. After a sufficient
retention time, the pregnant solution is subjected to filtration to remove the undissolved residue.
A press filter is recommended due to the fine particle size. While the undissolved leach residue is
sent to the tailings pond, the loaded leach solution is subjected to the second unit operation, where
selective thorium removal is targeted via one-stage precipitation. Based on the experimental
findings and literature review, it is recommended to keep the solution pH below 5 to prevent the
loss of rare earth elements. When significant loss is observed, a re-dissolution-re-precipitation
route can be followed to minimize the loss. According to the findings, there is no substantial
difference between different alkaline salts; however, the use of sodium hydroxide (NaOH) is more
common than others. After the targeted pH is reached, the solution is sent to a second filter.
Thorium is separated from the rest of the solution and sent to the same tailing pond with the leach
residue. The material in this tailing pond can be utilized as mine backfilling since the concentration
of thorium will be diluted by mixing it with other residues.
The solution remained from precipitation is treated with solvent extraction (the third unit process),
where two-stage extraction and two-stage stripping are performed. In this study, the effect of
scrubbing was found to be minimal; therefore, no scrubbing unit is proposed. After the solvent
extraction unit, the loaded aqueous phase (uranium product stream) is sent to a pond, and the
sulfuric acid used during the striping stage is recycled for reuse. The used extractant, TBP, is also
sent to the recycling unit for further purification and reuse. To recycle the loaded organic phase,
ammonium nitrate solution and deionized hot water can be used to remove undesirable elements,
such as calcium, iron, magnesium, and phosphorus (Jorjani and Shahbazi, 2016).
On the other hand, the rare earth-containing aqueous stream is subjected to the fourth unit
operation, where oxalic acid precipitation is performed to produce rare earth oxalates. The
precipitated rare earth oxalates are filtered and subjected to roasting to convert them into sellable
rare earth oxide products. The oxalic acid-containing stream is sent to another recycling system
for its reuse.
The technical feasibility of this flowsheet was proven depending on the data obtained from
laboratory and pilot plant scale samples Although this flowsheet is only including

100
hydrometallurgical processing unit operations. Prior to this, several other unit operations, such as
sample preparation (i.e., crushing, grinding, sizing), pre-treatment (i.e., density-based separation,
froth flotation), pre-roasting, can be applied to increase the overall efficiency as well as to reduce
the feed amount entering to the hydrometallurgical unit. For instance, significant increases were
observed in the leaching of several coal samples by performing calcination before leaching. Due
to high temperatures in the coal power plants, mineralogical changes may occur in the coal samples
whose recovery can be enhanced with an additional calcination step prior to leaching by enhancing
the liberation of particles. (Honaker et al., 2019). Even though the application of traditional mineral
processing techniques alone for rare earth recovery from coal-based materials is ineffective, they
can still be utilized as a pre-treatment method.
Although a techno-economic analysis has not been performed in this study, it is known that the
majority of the cost belongs to the chemical reagents; therefore, recycling and reuse are essential.
As Das et al. (2018) indicated in their study, the dosages of the chemical reagent and process time
are two of the most important cost determiners. The researchers also mentioned that the economic
viability of a process depends on the content of Scandium, too, due to the high market value.
Furthermore, all water must be recycled as much as possible and fed into the process plant to
reduce operational costs. However, since the developed flowsheet does not include any other unit
operation than typical rare earth extraction processes, it is believed that no additional capital cost
is needed. On the other hand, from an economic perspective, it was seen by the study of Honaker
et al. (2019) a minimal plant size of 225 tph is required to generate profit.
Lastly, separated thorium and uranium have significant potential to be used in the fuel cycle or
electricity production by nuclear energy. The U.S. Department of Energy estimates an
approximately 28% increase in the need for electrical power from 2012 to 2040 (Nandanwar et al.,
2016). On the other hand, uranium has been recognized as one of the critical minerals in the United
States Geological Survey Bulletin. Aziman and Ismail (2020) have a thorough review study in
which they investigated the sustainable recovery of thorium from the water leach residue of rare
earth processing. Thorium has three to five times more potential reserves than uranium, and 232Th
can be converted to 233U by absorbing slow neutrons (Kursun et al., 2018; Salehuddin et al., 2019).
According to 2015 data, 174 million pounds of uranium (in the form of U3O8) was used in nuclear
power plants worldwide, and a continuous increase is projected (Kim et al., 2016). The depleting
uranium sources create a need for substitutes (Udayakumar et al., 2021). By converting thorium to
uranium, thorium can effectively be used as a replacement for uranium-based nuclear reactors and
can also become an alternative for uranium sources (Xiong et al., 2020). Therefore, if the standards
are met, thorium and uranium separated from rare earth elements can create an additional
production source.

101
Figure 60 Conceptual flowsheet designed for the removal of thorium and uranium from rare earth elements

102
CHAPTER 7
CONCLUSIONS AND SUGGESTIONS FOR FUTURE STUDIES
7.1. Summary and Conclusions
Over the past few decades, the demand for rare earth elements has increased rapidly and
drastically. Their use has expanded tremendously as technology advances, and their importance in
defense and military products is indisputable. Therefore, developing a supply chain for these
elements from recycling or alternative sources has gained extreme importance. Given the global
context, the identification of coal and coal by-products as potential rare earth sources is a novel
finding and contribution. Considering the amounts of coal reserves, it possesses a vast potential to
be a long-lasting source for rare earth elements. However, the association of thorium and uranium
with rare earth minerals is an issue that requires additional treatment. Nonetheless, the studies on
separating hazardous elements and rare earths from coal and coal byproducts are limited.
In that regard, this study was conducted to enlighten and provide insightful information on the
removal of thorium and uranium from rare earth-containing solutions generated from coal coarse
refuse. It was targeted to bridge the literature gap on REE-associated hazards in detail. This was
accomplished through various hydrometallurgical separation processes considering the
concentration of the feedstock sample. Three major separation techniques (i.e., precipitation,
solvent extraction, and zeolite adsorption) were studied and evaluated. Initial exploratory tests
were performed to identify the operational conditions. Selective precipitation was first assessed as
an easy and cost-effective route. Later, solvent extraction was applied to further evaluate the
separation potential. A modified experimental protocol incorporating both separation methods
(i.e., selective precipitation and solvent extraction) was later developed and followed based on the
results. Adsorption studies produced a good separation of thorium under all examined conditions.
However, it did not generate sufficient separation between uranium and rare earth elements. A
Box-Behnken design technique on the basis of response surface methodology was utilized for the
experimental design of all examined separation techniques. Later, the statistical analysis sheds
light on the process operating parameters that profoundly impact the removal of radioactive
elements from rare earths. Finally, the findings were validated using a real system rare earth
oxalate sample generated at the pilot processing plant located in Kentucky. As a result of all the
research findings, a process flowsheet was developed to remove thorium and uranium and produce
pure rare earth oxides.
Overall, the following conclusions were reached at the end of the study:
1. Experimental data obtained from initial selective precipitation and solvent extraction
tests indicated that selective precipitation is effective in the removal of thorium. In
contrast, solvent extraction has a superior performance in terms of selectively
separating uranium from rare earths.

103
2. It is possible to remove nearly 100% of thorium at a solution pH value of 4.85 with
approximately 19.32% of rare earths and 47.98% of uranium co-precipitation.
3. Another separation technique needs to be utilized to further separate rare earth elements
and uranium due to their overlapping precipitation pH regions.
4. An increase in the number of extraction stages proved to be more efficient than the
single-stage solvent extraction process.
5. An experimental protocol incorporating both one-stage selective precipitation and two-
stage solvent extraction yielded an enhanced separation performance between thorium,
uranium, and rare earth elements.
6. Based on the statistical analyses, among the examined operating parameters, extractant
concentration, solvent extraction feed pH, O/A ratio played a significant role in the
removal of uranium from rare earths.
7. As for the effect of the stripping agent, a noticeable reduction in uranium recovery was
observed when sulfuric acid was used instead of DI water. However, the effect of
sulfuric acid concentration on the overall separation was found as insignificant.
8. The optimum separation performance of the first subset tests following the modified
experimental protocol was identified throughout the study, which corresponded to an
overall rare earth, thorium, and uranium recovery of 80%, 0%, and 3.1%, separately.
The optimum separation was obtained under the following operating condition: one-
stage precipitation at a pH value of 4.85, solvent extraction feed pH of 3.5, 50 v% TBP,
O/A ratio at 3:1.
9. Under the operating conditions of the second subset of solvent extraction tests, based
on the overall experimental flowsheet, the recovery of rare earths into the REE product
stream varied from 64.7% to 78.7%, while the recovery of uranium into the same
product steam fluctuated between 1.8% and 32.5% for the second subset of testing.
10. During the second subset, the best separation performance between the rare earths and
uranium was achieved with 50 v% TBP, feed pH at 3.5, O: A ratio at 3, and 1 M H2SO4
as the strippant, which corresponded to an overall rare earth recovery of 73.4% and
uranium recovery of 1.8%.
11. Experimental findings of the adsorption studies suggested that rare earths and uranium
adsorption follow a similar pattern, which creates the separation challenge. On the other
hand, zeolite had a satisfactory capability for thorium removal.
12. The initial solution pH, zeolite particle size, and zeolite amount were the key operating
parameters that all impacted the adsorption recovery of rare earths.
13. Kinetic studies suggest a rapid adsorption rate for thorium in contrast to total rare earths
and uranium. Multilayer physisorption was determined for total rare earths and thorium
when zeolite was selected as the adsorbent.
14. Moreover, the experimental findings obtained so far have been supported by various
characterization studies (e.g., XRD, XRF, SEM-EDX, BET, PSA) and fundamental
investigations.

104
15. At the end of all the studies, an effective process flowsheet was designed, which can
be followed for the selective removal of thorium and uranium.
16. Following detailed parametric tests, performance validation tests were conducted on
the rare earth oxalate sample produced from the pilot-scale processing facility. Test
results validate the efficiency and reliability of the separation protocol developed.
In conclusion, considering the financial burden of disposing of coal waste and the environmental
damage associated with it, this study has the utmost importance to utilize secondary sources to
produce rare earth elements in an environmentally favorable manner. Specifically, this study had
shown the possible separation strategies for thorium and uranium when a nontraditional feedstock
was used. The separation behavior of the elements was systematically investigated in consideration
of various aspects. As a result, the developed process can be applied to various feedstock materials.
As mentioned in the previous chapters, the studies pertaining to the separation of hazardous
elements and rare earths from coal and coal byproducts are limited. Given the lack of knowledge,
experimental data, and commercialized technology in this aspect, it is believed that this study will
contribute remarkably to both academia and the mining industry. Besides, considering the changes
towards cleaner and more sustainable mining operations, this study has absolute significance and
contribution to the field.
7.2. Suggestions for Future Studies
This study demonstrated the development of a process flowsheet that can effectively remove
thorium and uranium from rare earth elements when non-traditional sources are utilized. However,
from the standpoint of future commercialization, a detailed economic analysis of thorium and
uranium removal from rare earth-bearing solutions should be conducted since there is no
discussion on this subject yet.
Besides, the potential application of two novel separation methods, i.e., ionic liquid-based
extraction and membrane-based separation, may be considered for future investigation.
Unfortunately, only a few studies have been performed with ionic liquids. Ionic liquids are known
as more environmentally friendly due to their high thermal stability and low volatility. On the other
hand, membrane-based adsorption is superior to traditional adsorbents with high adsorption
capacity.
Thorium and uranium purification can be studied to turn those separated from rare earths into the
feedstock for the nuclear energy cycle. While the minimum required uranium (235U)
concentration to be used in the fuel cycle spans between 0.7% to 5%, a total of 1500 µg/g impurity
(i.e., rare earth elements, Al, Fe, Ca, Si, Pb, Li, etc.) is acceptable. Therefore, the rare earth
economic analysis can be expanded to consider thorium and uranium since they can be purified to
be used in other industries for additional economic gains.

105
REFERENCES
1. Abdel-Sabour, M. (2014). Uranium Fixation and Removal from Different Soil
Types: Review. Journal of Nuclear Energy Science and Power Generation Technology.
2. Adiansyah, J., Rosano, M., Biswas, W., & Haque, N. (2017). Life Cycle Cost
Estimation and Environmental Valuation of Coal Mine Tailings Management. Journal
of Sustainable Mining , 114-125.
3. Akdogan, G., & Ghosh, T. (2014). Identification of REE in Some Alaskan Coal
and Ash Samples. Mineral Industry Research Laboratory (MIRL) Institute of Northern
Engineering, University of Alaska Fairbanks.
4. Akkaya, R. (2013). Uranium and Thorium Adsorption from Aqueous Solution
Using A Novel Polyhydroxyethylmethacrylate-pumice Composite. Journal of
Environmental Radioactivity, 58-63.
5. Aksoyoglu, S. (1989). Sorption of U(VI) on Granite. Journal of Radioanalytical
and Nuclear Chemistry, 393-403.
6. Al-Areqi, W., Aniza, C., Bahri, C., Majid, A., & Sarmani, S. (2016). Separation
and Radiological Impact Assessment of Thorium in Malaysian Monazite Processing.
Malaysian Journal of Analytical Sciences, 770-776.
7. Al-Areqi, W., Majid, A., & Sarmani, S. (2014). Thorium, Uranium and Rare
Earth Elements Content in Lanthanide Concentrate (LC) and Water Leach Purification
(WLP) Residue of Lynas Advanced Materials Plant (LAMP). American Institute of
Physics Conference Proceedings, (pp. 93-96).
8. Al-Areqi, W., Majid, A., Sarmani, S., & Bahri, C. (2015). Thorium: Issues and
Prospects in Malaysia. AIP Conference Proceedings (p. 1659). American Institute of
Physics.
9. Alemrajabi, M., Rasmuson, A., Korkmaz, K., & Forsberg, K. (2017). Recovery
of Rare Earth Elements from Nitrophosphoric Acid Solutions. Hydrometallurgy, 253-
262.
10. Alex, P., Suri, A., & Gupta, C. (1998). Processing of Xenotime Concentrate.
Hydrometallurgy, 331-338.
11. Allegrini, E., Maresca, A., Olsson, M., Holtze, M., Boldrin , A., & Astrup, T.
(2014). Quantification of the Resource Recovery Potential of Municipial Solid Waste
Incineration Bottom Ashes. Waste Management, 1627-1636.
12. Al-Nafai, I. (2015). Application of Pourbaix Diagrams in the
Hydrometallurgical Processing of Bastnasite. M.S. Thesis, The Pennsylvania State
University, Department of Materials Science and Engineering.

106
13. Amaral, J., & Morais, C. (2010). Thorium and Uranium Extraction from Rare
Earth Elements in Monazite Sulfuric Acid Liquor Through Solvent Extraction.
Minerals Engineering, 498-503.
14. Amer, T., Abdeall, W., Abdel Wahab, G., & El-Sheikh, E. (2013). A Suggested
Alternative Procedure for Processing of Monazite Mineral Concentrate. International
Journal of Mineral Processing, 106-111.
15. American Coal Ash Association. (2017). 2016 Coal Combustion Product (CCP)
Production and Use Survey Report. Farmington Hills, MI.
16. Anderson, C., Taylor, P., & Anderson, C. (2017). Rare Earth Flotation
Fundamentals: A Review. American Journal of Engineering Research, 155-166.
17. Anitha, M., Kotekar, M., Singh, D., Vijayalakshmi, R., & Singh, H. (2014).
Solvent Extraction Studies on Rare Earths from Chloride Medium with
Organophosphorous Extractant Dinonyl Phenyl Phosphoric Acid. Hydrometallurgy,
128-132.
18. Anufrieva, A., Buinovskii, A., Guluyta, M., Molokov, P., Ageeva, L., &
Verkhoturova, V. (2014). Processing of REE-containing Ores and Concentrates.
Procedia Chemistry, 119-125.
19. Arbuzov, S., Maslov, S., Finkelman, R., Mezhibor, A., Ilenok, S., Blokhin, M.,
& Peregudina, E. (2018). Modes of Occurrence of Rare Earth Elements in Peat from
Western Siberia. Journal of Geochemical Exploration, 40-48.
20. Asselin, G., Audrieth, L., & Comings, E. (1949). The Separation of Thorium
and Rare Erath Salts by Solvent Extraction. 640-648.
21. Ault, T., Krahn, S., & Croff, A. (2015). Radiological Impacts and Regulations
of Rare Earth Elements in Non-Nuclear Energy Production. Energies, 2066-2081.
22. Aziman, E., & Ismail, A. (2020). Frontier Looking of Rare-Earth Processed
Residue As Sustainable Thorium Resources: An Insight into Chemical Composition
and Separation of Thorium. Progress in Nuclear Energy, 103471.
23. Badei, M., El-Naggar, I., El-Belihi, A., Aly, H., & Aly, H. (1992). Sorption
Behaviour of Uranium on Tin(IV) Antimonate from Aqueous Solutions. Radiochimica
Acta, 89-92.
24. Balintova, M., & Petrilakova, A. (2011). Study of pH Influence on Selective
Precipitation of Heavy Metals from Acid Mine Drainage. Chemical Engineering
Transactions, 345-350.
25. Banda, R., Jeon, H., & Lee, M. (2012). Solvent Extraction Separation of Pr and
Nd from Chloride Solution Containing La using Cyanex 272 and Its Mixture with Other
Extractants. Separation and Purification Technology, 481-487.

107
26. Barkat, M., Nibou, D., Amokrane, S., Chegrouche, S., & Mellah, A. (2015).
Uranium (VI) Adsorption on Synthesized 4A and P1 Zeolites: Equilibrium, Kinetic,
and Thermodynamic Studies. Comptes Rendus Chimie, 261-269.
27. Batchu, N., Jeon, H., & Lee, M. (2015). Solvent Extraction of Praseodymium
(III) from Chloride Solutions by A Mixture of Cyanex 301 and LIX 63. Journal of
Industrial and Engineering Chemistry, 286-290.
28. Baybas, D., & Ulusoy, U. (2011). The Use of Polyacrylamide-Aluminosilicate
Composites for Thorium Adsorption. Applied Clay Sciences, 138-146.
29. Belova, V., Egorova, N., Voshkin, A., & Khol'kin, A. (2015). Extraction of Rare
Earth Metals, Uranium and Thorium from Nitrate Solutions by Binary Extractants.
Theoretical Foundations of Chemical Engineering, 545-549.
30. Bertetti, P., Pabalan, R., Pickett, D., & Turner, D. (2011). Radionuclide Sorption
Technical Assistance Activities at the Center for Nuclear Waste Regulatory Analyses.
San Antonio, Texas.
31. Binnemans, K., Jones, P., Blanpain, B., Van Gerven, T., & Pontikes, Y. (2015).
Towards Zero-Waste Valorisation of Rare-Earth-Containing Industrial Process
Residues: A Critical Review . Journal of Cleaner Production, 17-38.
32. Binnemans, K., Jones, P., Blanpain, B., Gerven, T., Yang, Y., Walton, A., &
Buchert, M. (2013). Recycling of Rare Earths: A Critical Review. Journal of Cleaner
Production, 1-22.
33. Biswas, S., Pathak, P., Singh, D., & Roy, S. (2013). Comparative Evaluation of
Tri-n-butyl Phosphate (TBP) and Tris(2-Ethylhexyl) Phosphate (TEHP) for the
Recovery of Uranium from Monazite Leach Solution. Separation Science and
Technology, 2013-2019.
34. Blissett, R., Smalley, N., & Rowson, N. (2014). An Investigation into Six Coal
Fly Ashes from the United Kingdom and Poland to Evaluate Rare Earth Element
Content. Fuel, 236-239.
35. Borai, E., El-Ghany, M., Ahmed, I., Hamed, M., El-Din, A., & Aly, H. (2016).
Modified Acidic Leachinh for Selective Separation of Thorium, Phosphate, and Rare
Earth Concentrates from Egyptian Crude Monazite. International Journal of Mineral
Processing, 34-41.
36. Brindley, G., & Bastovanov, M. (1982). Clay and Clay Minerals, 135.
37. British Geological Survey. (2011). Rare Earth Elements.
38. Brookins, D. (1983). Eh-pH Diagrams for the Rare Earth Elements at 25C and
one Bar Pressure. Geochemical Journal, 223-229.
39. Brookins, D. (1988). Eh-pH Diagrams for Geochemistry. Albuquerque:
Springer-Verlag.

108
40. Brown, C., & Sherrington, L. (1979). Solvent Extraction used in Industrial
Separation of Rare Earths. Journal of Chemical Technology and Biotechnology, 193-
209.
41. Camacho, L., Deng, S., & Parra, R. (2010). Uranium Removal from
Groundwater by Natural Clinoptilolite Zeolite: Effects of pH and Initial Feed
Concentration. Journal of Hazardous Materials, 393-398.
42. Cheira, M., Atia, B., & Kouraim, M. (2017). Uranium (VI) Recovery from
Acidic Leach Liquor by Ambersep 920U SO4 Resin: Kinetic, Equilibrium and
Thermodynamic Studies. Journal of Radiation Research and Applied Sciences, 307-
319.
43. Chellam, S., & Clifford, D. (2002). Physical-Chemical Treatment of
Groundwater Contaminated by Leachate from Surface Disposal of Uranium Tailings.
Journal of Environmental Engineering, 942-952.
44. Chen, Y., Wei, Y., He, L., & Tang, F. (2016). Separation of Thorium and
Uranium in Nitric Acid Solution Using Silica Based Anion Exchange Resin. Journal of
Chromatography A, 37-41.
45. Chu, S. (2011). Critical Materials Strategy. DIANE Pubslishing.
46. Chukanov, N., Blass, G., Pekov, I., Belakovskiy, D., Van, K., Rastsvetaeva, R.,
& Aksenov, S. (2012). Perrierite-(La), (La, Ce, Ca)4(Fe2+, Mn)(Ti, Fe3+,
Al)4(Si2O7)2O8, A New Species from the Eifel Volcanic District, Germany. Geology
of Ore Deposits, 647-655.
47. Cooper, M. (2005). Naturally Occurring Radioactive Materials (NORM) in
Australian Industries - Review of Current Inventories and Future Generation.
Radiation Health and Safety Advisor Council.
48. Couper, J., Fair, J., Penney, W., & Walas, S. (2009). Chemical Process
Equipment: Selection and Design. Elsevier Science and Technology.
49. Dai, S., & Finkelman, R. (2018). Coal As A Promising Source of Critical
Elements: Progress and Future Prospects. International Journal of Coal Geology, 155-
164.
50. Dai, S., Seredin, V., Ward, C., Jiang, J., Hower, J., Song, X., . . . Zhao, C. (2014).
Composition and Modes of Occurrence of Minerals and Elements in Coal Combustion
Products Derived from High-Ge Coals. International Journal of Coal Geology, 79-97.
51. Das, S., Gaustad, G., Sekar, A., & Williams, E. (2018). Techno-Economic
Analysis of Supercritical Extraction of Rare Earth Elements from Coal Ash. Journal of
Cleaner Production.
52. Department of Energy. (2017). Report on Rare Earth Elements from Coal and
Coal Byproducts. Washington DC.

109
53. Dittrich, C., Kaya, S., Diekmann, F., & Yagmurlu, B. (2016). Recovery of Rare
Earth Elements and Scandium from European Deposits by Solvent Extraction. ALTA
Uranium-REE Proceedings, (pp. 123-135).
54. Doi, K., Hirono, S., & Sakamaki, Y. (1975). Uranium Mineralization by Ground
Water in Sedimentary Rocks, Japan. Economic Geology, 628-646.
55. Dutta, T., Kim, K., Uchimiya, M., Kwon, E., Jeon, B., Deep, A., & Yun, S.
(2016). Global Demand for Rare Earth Resources and Strategies for Green Mining.
Environmental Research, 182-190.
56. Dyer, A., & Jozefowicz, L. (1992). The Removal of Thorium from Aqueous
Solutions using Zeolites. Journal of Radioanalytical and Nuclear Chemistry, 47-62.
57. Ekmann, J. (2012). Rare Earth Elements in Coal Deposits - A Prospectivity
Analysis. Search and Discovery.
58. Eskanazy, G. (1987). Rare Earth Elements and Yttrium in Lithotypes of
Bulgarian Coals. Org. Geochem., 83-89.
59. Faghihian, H., Maragheh, M., Amini, M., & Nezamzadeh, A. (Adsorption
Science and Technology ). Thorium Ion Uptake by Zeolite A Synthesized from Natural
Clinoptilolite Tuffs. 2004, 707-717.
60. Fasfous, I., & Dawoud, J. (2012). Uranium(VI) Sorption by Multiwalled Carbon
Nanotubes from Aqueous Solution. Applied Surface Science, 433-440.
61. Felmy, A., Rai, D., & Mason, M. (1991). The Solubility of Hydrous
Thorium(IV) Oxide in Chloride Media: Development of An Aqueous Ion-Interaction
Model . Radiochimica Acta, 177-185.
62. Fiket, Z., Medunic, G., Turk, M., & Kniewald, G. (2018). Rare Earth Elements
in Superhigh-Organic-Sulfur Rasa Coal Ash (Croatia). International Journal of Coal
Geology, 1-10.
63. Findeiß, M. (2016). Effects of Radioactive By-products Along the Extraction of
Rare Earth Elements on Aquatic and Terrestrial Organisms. Aachen: Thesis.
64. Finkelman, R. (1999). Trace Elements in Coal Environmental and Health
Significance. Biological Trace Element Research, 197-204.
65. Finkelman, R., Palmer, C., & Wang, P. (2018). Quantification of the Modes of
Occurrence of 42 Elements in Coal. International Journal of Coal Geology , 138-160.
66. Fouquet, Y., & Martel-Jantin, B. (2014). Rare and Strategic Metals. In Y.
Fouquet, & D. Lacroix, Deep Marine Mineral Resources (pp. 55-64). Springer.
67. Gamboghi, J. (2015). Rare Earths: U.S. Geological Survey Mineral Commodity
Summaries. 128-129.

110
68. Gao, L., and Y. Chen. 2010. A study on the rare earth ore containing scandium
by high-gradient magnetic separation. Journal of Rare Earths 25: 623–626.
69. Garcia-Tenorio, R., Manjon, G., Vioque, I., Jimenez-Ramos, M., Mantero, J., &
Diaz-Frances, I. (2018). Grey Monazite (Rare Earths) Mining in Centre of Spain:
Characterization and Pre-operational Radiological Evaluation. Chemosphere, 691-697.
70. Garrels, R. (1955). Some Thermodynamic Relations Among the Uranium
Oxides and Their Relation to the Oxidation States of the Uranium Ores of the Colorado
Plateaus. Washington D.C.: U.S. Geological Survey.
71. Geier, R. (1979). Purex Process Solvent Literature Review. Washington.
72. Giri, R., & Nath, G. (2016). Physicochemical Study of Extractants for
Extraction of Rare Earth Element. Journal of Analytical Science and Technology.
73. Godelitsas, A., & Armbruster, T. (2003). HEU-type Zeolites Modified by
Transition Elements and Lead. Microporous and Mesoporous Materials, 3-24.
74. Gupta, B., Malik, P., & Deep, A. (2002). Extraction of Uranium, Thorium and
Lanthanides using Cyanex 923: Their Separations and Recovery from Monazite.
Journal of Radioanalytical and Nuclear Chemistry, 451-456.
75. Habashi, F. (1997). Handbook of Extractive Metallurgy. Quebec: Wiley-VHC.
76. Hayes, S., Yu, P., O'Keefe, T., O'Keefe, M., & Stoffer, J. (2002). The Phase
Stability of Cerium Species in Aqueous Systems I. E-pH Diagram for the Ce-HCLO4-
H2O System. Journal of the Electrochemical Society, 623-630.
77. He, Y. (2014). Regulations of China's Rare Earth Production and Export.
International Journal of Emerging Markets, 236-256.
78. Hedrick, J. (2000). Thorium. U.S. Geological Survey Minerals Yearbook.
79. Hidayah, N., & Abidin, S. (2017). The Evolution of Mineral Processing in
Extraction of Rare Earth Elements Using Solid-Liquid Extraction over Liquid-Liquid
Extraction - A Review. Minerals Engineering, 103-113.
80. Honaker, R., Zhang, W., & Werner, J. (2019). Acid Leaching of Rare Earth
Elements from Coal and Coal Ash: Implications for Using Fluidized Bed Consumption
to Assist in the Recovery of Critical Materials. Energy Fuels, 5971-5980.
81. Honaker, R., Groppo, J., Bhagavatula, A., Razaee, M., & Zhang, W. (2016).
Recovery of Rare Earth Minerals and Elements from Coal and Coal Byproducts.
Louisville, KY.
82. Honaker, R., Hower, J., Eble, C., Weisenfluh, J., Groppo, J., Rezaee, M., &
Bhagavatula, A. (2014). Laboratory and Bench-Scale Testing for Rare Earth Elements,
Final Project Report.

111
83. Honaker, R., Zhang, W., Yang, X., & Razaee, M. (2018). Conception of An
Integrated Flowsheet for Rare Earth Elements Recovery from Coal Coarse Refuse.
Minerals Engineering, 233-240.
84. Hostetler, P., & Garrels, R. (1962). Transportation and Precipitation of Uranium
and Vanadium at Low Temperatures with Special Reference to Sandstone-Type
Uranium Deposits. Economic Geology and the Bulletin of the Society of Economic
Geologists, 137-167.
85. Hower, J., Granite, E., Mayfield, D., Lewis, A., & Finkelman, R. (2016). Notes
on Contributions to the Science of Rare Earth Element Enrichment in Coal and Coal
Combustion Byproducts. Minerals, 1-9.
86. Hu, J., Zheng, B., Finkelman, R., Wang, B., Wang, M., Li, S., & Wu, D. (2006).
Concentration and Distribution of Sixty-One Elements in Coals from DPR Korea. Fuel,
679-688.
87. Hua, Z., Wang, J., Wang, L., Zhao, Z., Li, X., Xiao, Y., & Yang, Y. (2014).
Selective Extraction of Rare Earth Elements from NdFeB Scrap by Molten Chlorides .
ACS Sustain. Chem. Eng., 2536-2543.
88. Humelnicu, D., Drochioiu, G., Sturza, M., Cecal, A., & Popa, K. (2006).
Kinetic and Thermodynamic Aspects of U(VI) and Th(IV) Sorption on A Zeolitic
Volcanic Tuff. Journal of Radioanalytical and Nuclear Chemistry , 637-640.
89. Huang, Q., Noble, A., Herbst, J., & Honaker, R. (2018). Liberation and Release
of Rare Earth Minerals from Middle Kittanning, Fire Clay, and West Kentucky No. 13
Coal Sources. Powder Technology, 242-252.
90. Huang, Q., Talan, D., Restrepo, J., Baena, O., Kecojevic, V., & Noble, A.
(2019). Characterization Study of Rare Earths, Yttrium, and Scandium from Various
Colombian Coal Samples and Non-Coal Lithologies. International Journal of Coal
Geology, 14-26.
91. Hughes, K., & Singh, R. (1980). The Isolation of Thorium from Monazite by
Solvent Extraction. Hydrometallurgy, 25-33.
92. Hvistendahl, M. (2007, December 13). Coal Ash Is More Radioactive Than
Nuclear Waste. Retrieved from Scientific American:
https://www.scientificamerican.com/article/coal-ash-is-more-radioactive-than-
nuclear-waste/
93. International Atomic Energy Agency. (2000). Recycle and Reuse of Materials
and Components from Waste Streams of Nuclear Fuel Cycle Facilities. Vienna.
94. Jaffary, N., Khoo, K., Mohamed, N., Yusof, M., & Fadzil, S. (2019). Malaysian
Monazite and Its Processing Residue: Chemical Composition and Radioactivity.
Journal of Radioanalytical and Nuclear Chemistry, https://doi.org/10.1007/s10967-
019-06813-1.

112
95. Jain, V., Handa, A., Sait, S., Shrivastav, P., & Agrawal, Y. (2001). Pre-
concentration, Separation and Trace Determination of Lanthanum(III), Cerium(III),
Thorium(IV) and Uranium(VI) on Polymer Supported o-Vanillinsemicarbazone.
Analytica Chimica Acta, 237-246.
96. Jakobsson, L., Kennedy, M., Aune, R., & Tranell, G. (2016). Recovery of Rare
Earth Elements from the Ferrous Fraction of Electronic Waste, REWAS 2016: Towards
Materials Resource Sustainability . Springer.
97. Jha, M., Kumari, A., Panda, R., Kumar, J., Yoo, K., & Lee, J. (2016). Review
on Hydrometallurgical Recovery of Rare Earth Metals. Hydrometallurgy, 2-26.
98. Jiabao, L., & Jie, L. (2009, 09 07). Rare Earth Industry Adjusts to Slow Market.
Retrieved from China Daily : http://www.chinadaily.com.cn/bw/2009-
09/07/content_8660849.htm
99. Jordens, A. (2016). The Beneficiation of Rare Earth Element-Bearing Minerals.
Montreal: Thesis, McGill University.
100. Jorgensen, S. (1989). Chapter 4-Adsorption and Ion Exchange.
Developments in Environmental Modelling, 65-81.
101. Jorjani, E., & Shahbazi, M. (2016). The Production of Rare Earth Elements
Group via Tributyl Phosphate Extraction and Precipitation Stripping Using Oxalic
Acid. Arabian Journal of Chemistry, 1532-1539.
102. Jun, L., Zhenggui, W., Deqian, L., Gengxiang, M., & Zucheng, J. (1998).
Recovery of Ce (IV) and Th (IV) from Rare Earths (III) with Cyanex 923.
Hydrometallurgy, 77-87.
103. Jyothi, R., Thenepalli, T., Ahn, J., Parhi, P., Chung, K., & Lee, J. (2020).
Review of Rare Earth Elements Recovery from Secondary Resources for Clean Energy
Technologies: Grand Opportunities to Create Wealth from Waste. Journal of Cleaner
Production, 122048.
104. Kammerer, J., Carle, R., & Kammerer, D. (2011). Adsorption and Ion
Exchange: Basic Principles and Their Application in Food Processing. Journal of
Agricultural and Food Chemistry Review, 22-42.
105. Karayigit, A., Gayer, R., Querol, X., & Onacak, T. (2000). Contents of Major
and Trace Elements in Feed Coals from Turkish Coal-Fired Power Plants. International
Journal of Coal Geology, 169-184.
106. Karimi, S., Yaraki, M., & Karri, R. (2019). A Comprehensive Review of the
Adsorption Mechanisms and Factors Influencing the Adsorption Process from the
Perspective of Bioethanol Dehydration. Renewable and Sustainable Energy Reviews,
535-553.
107. Kaygun, A., & Akyil, S. (2007). Study of the Behaviour of Thorium Adsorption
on PAN/Zeolite Composite Adsorbent. Journal of Hazardous Materials, 357-362.

113
108. Kaynar, U., Ayvacikli, M., Hicsonmez, U., & Kaynar, S. (2015). Removal of
Thorium(IV) Ions from Aqueous Solutions by A Novel Nanoporous ZnO: Isotherms,
Kinetic and Thermodynamic Studies. Journal of Environmental Radioactivity, 145-
151.
109. Ketris, M., & Yudovich, Y. (2009). Estimations of Clarkes for Carbonaceous
Biolithes: World Averages for Trace Element Contents in Black Shales and Coals.
International Journal of Coal Geology, 135-148.
110. Khalili, F., & Al-Banna, G. (2015). Adsorption of Uranium(VI) and
Thorium(IV) by insolubilized Humic Acid from Ajloun Soil - Jordan. Journal of
Environmental Radioactivity, 16-26.
111. Kilincarslan, A., & Akyil, S. (2005). Uranium Adsorption Characteristic and
Thermodynamic Behavior of Clinoptilolite Zeolite. Journal of Radioanalytical and
Nuclear Chemistry , 541-548.
112. Kilislioglu, A., & Bilgin, B. (2003). Thermodynamic and Kinetic Investigations
of Uranium Adsorption on Amberlite IR-118H Resin. Applied Radiation and Isotopes,
155-160.
113. Kim, E., & Osseo-Asare, K. (2012). Aqueous Stability of Thorium and Rare
Earth Metals in Monazite Hydrometallurgy: Eh-pH Diagrams for the Systems T-, Ce-,
La-, Nd-, (PO4)-(SO4)-H2O at 25C. Hydrometallurgy, 67-78.
114. Kim, H., Eggert, R., Carlsen, B., & Dixon, B. (2016). Potential Uranium Supply
from Phosphoric Acid: A U.S Analysis Comparing Solvent Extraction and Ion
Exchange Recovery. Resources Policy, 222-231.
115. King, H. (2020, 11 4). REE- Rare Earth Elements and Their Uses. Retrieved
from Geology: https://geology.com/articles/rare-earth-elements/
116. Kini, G. (2006). Characterization of Synthetic Zeolites Optimized for Heavy
Metal Uptake from Wastewater. Thesis, University of Florida.
117. Kolker, A., Scott, C., Hower, J., Vazquez, J., Lopano, C., & Dai, S. (2017).
Distribution of Rare Earth Elements in Coal Combustion Fly Ash, Determined by
SHRIMP-RG Ion Microprobe. International Journal of Coal Geology, 1-10.
118. Kuang, S., Zhang, Z., Li, Y., Wei, H., & Liao, W. (2017). Synergistic Extraction
and Separation of Rare Earths from Chloride Medium by the Mixture of HEHAPP and
D2EHPA. Hydrometallurgy, 78-83.
119. Kursun, I., Tombal, T., & Terzi, M. (2018). Solubility of Eskisehir
Thorium/Rare Earth Ores in Sulphuric and Nitric Acids. Physicochemical Problems of
Mineral Processing, 476-483.
120. Kutahyali, C., & Eral, M. (2010). Sorption Studies of Uranium and Thorium on
Activated Carbon Prepared from Olive Stones: Kinetic and Thermodynamic Aspects.
Journal of Nuclear Materials, 251-256.

114
121. Kuzmin, V., Pashkov, G., Lomaev, V., Voskresenskaya, E., & Kuzmina, V.
(2012). Combined Approaches for Comprehensive Processing of Rare Earth Metal
Ores. Hydrometallurgy, 1-6.
122. Ladeira, A., & Goncalves, C. (2007). Influence of Anion Species on Uranium
Separation from Acid Mine Water Using Strong Base Resins. Journal of Hazardous
Materials, 499-504.
123. Lange, C., Camargo, I., Figueiredo, A., Castro, L., Vasconcellos, M., &
Ticianelli, R. (2017). A Brazilian Coal Fly Ash As A Potential Source for Rare Earth
Elements. Journal of Radioanal Nucl. Chem., 1235-1241.
124. Langmuir, D. (1978). Uranium Solution-Mineral Equilibria at Low
Temperatures with Applications to Sedimentary Ore Deposits. Geohemica et
Cosmochimica Acta, 547-569.
125. Langmuir, I. (1918). The Adsorption of Gases on Plane Surfaces of Glass, Mica
and Platinum. American Chemical Society, 1361-1368.
126. Lanzerstorfer, C. (2018). Pre-processing of Coal Combustion Fly Ash by
Classification for Enrichment of Rare Earth Elements. Energy Reports, 660-663.
127. Li, F., Yang, Z., Weng, H., Chen, G., Lin, M., & Zhao, C. (2018). High Efficient
Separation of U(VI) and Th(IV) from Rare Earth Elements in Strong Acidic Solution
by Selective Sorption on Phenanthroline Diamide Functionalized Graphene Oxide.
Chemical Engineering Journal, 340-350.
128. Li, Z., Chen, F., Yuan, L., Liu, Y., Zhao, Y., Chai, Z., & Shi, W. (2012).
Uranium(VI) Adsorption on Graphene Oxide Nanosheets from Aqueous Solutions.
Chemical Engineering Journal, 539-546.
129. Lin, R., Soong, Y., & Granite, E. (2018). Evaluation of Trace Elements in U.S.
Coals Using the USGS COALQUAL Database Version 3.0. Part I: Rare Earth Elements
and Yttrium (REY). International Journal of Coal Geology, 1-13.
130. Liu, H., & Pan, Z. (2011). NORM Situation in Non-Uranium Mining in China.
Annals of the ICRP, 343-351.
131. Liu, X., Li, J., Wang, X., Chen, C., & Wang, X. (2015). High Performance of
Phosphate Functionalized Graphene Oxide for the Selective Adsorption of U(VI) from
Acidic Solution. J. Nucl. Mater., 56-64.
132. Liu, Y., Wang, Y., Zhang, Z., Cao, X., Nie, W., Li, Q., & Hua, R. (2013).
Removal of Uranium from Aqueous Solution by A Low Cost and High-Efficient
Adsorbent. Applied Surface Science, 68-74.
133. Lu, Y., Wei, H., Zhang, Z., Li, Y., Wu, G., & Liao, W. (2016). Selective
Extraction and Separation of Thorium from Rare Earths by A Phosphorodiamidate
Extractant. Hydrometallurgy, 192-197.

115
134. Malamis, S., & Katsou, E. (2013). A Review on Zinc and Nickel Adsorption on
Natural and Modified Zeolite, Bentonite, and Vermiculite: Examination of Process
Parameters, Kinetics and Isotherms. Journal of Hazardous Materials, 428-461.
135. McLellan, B., Corder, G., Golev, A., & Ali, S. (2014). Sustainability of the Rare
Earths Industry. Procedia Environmental Sciences, 280-287.
136. Menzies, I., & Rigby, F. (1961). Separation of Thorium from Uranium and Rare
Earth Elements by Solvent Extraction with Tri-n-Butyl Phosphate-Xylene. J. Appl.
Chem., 104-113.
137. Merritt, R. R. (1990). High temperature methods for processing monazite: I.
Reaction with calcium chloride and calcium carbonate. Journal of the Less Common
Metals, 166(2), 197–210.
138. Metaxas, M., Kasselouri-Rigopoulou, V., Galiatsatou, P., Konstantopoulou, C.,
& Oikonomou, D. (2003). Thorium Removal by Different Adsorbents. Journal of
Hazardous Materials, 71-82.
139. Michieka, N. (2017, June). Rare Earth Elements and Their Role in Renewable
Energy. Retrieved from https://www.bakersfield.com/kern-business-journal/rare-earth-
elements-and-their-role-in-renewable-energy/article_2dff98b6-8b4e-5ecc-91f6-
ef18c0a2c44e.html
140. Milonjic, S., Cokesa, D., & Stevanovic, R. (1992). Dynamic Adsorption of
Uranium(VI) and Zirconium(IV) on Silica Gel. Journal of Radioanalytical and Nuclear
Chemistry, 79-90.
141. Misaelides, P., Godelitsas, A., Filippidis, A., Charistos, D., & Anousis, I.
(1995). Thorium and Uranium Uptake by Natural Zeolitic Materials. The Science of the
Total Environment, 237-246.
142. Monhemius, J. (1977). Precipitation Diagrams for Metal Hydroxides, Sulfides,
Arsenates and Phosphates. Transactions Institution of Mining and Metallurgy, 202-206.
143. Monji, A., Ghoulipour, V., & Mallah, M. (2016). Selective Sorption of Uranium
(IV) from Hydrochloric Acid Media by Agro-Industrial Byproducts. Annals of Nuclear
Energy, 115-121.
144. Motsi, T., Rowson, N., & Simmons, M. (2009). Adsorption of Heavy Metals
from Acid Mine Drainage by Natural Zeolite. Int. J. Miner. Process., 42-48.
145. Muhling, J., Suvorova, A., & Rasmussen, B. (2014). The Occurrence and
Composition of Chevkinite-(Ce) and Perrierite-(Ce) in Theoleitic Intrusive Rocks and
Lunar Mare Basalt. American Mineralogist, 1911-1921.
146. Nandanwar, S., Coldsnow, K., Utgikar, V., Sabharwall, P., & Aston, D. (2016).
Capture of Harmful Radioactive Contaminants from Off-Gas Stream Using Porous

116
Solid Sorbents for Clean Environment - A Review. Chemical Engineering Journal,
369-381.
147. Nasab, M. (2014). Solvent Extraction Separation of Uranium (VI) and Thorium
(IV) with Neutral Organophosphorus and Amine Ligands. Fuel, 595-600.
148. Nasab, M., Sam, A., & Milani, S. (2011). Determination of Optimum Process
Conditions for the Separation of Thorium and Rare Earth Elements by Solvent
Extraction. Hydrometallurgy, 141-147.
149. Navarro, J., & Zhao, F. (2014). Life-Cycle Assessment of the Production of Rare
Earth Elements for Energy Applications: A Review. Retrieved from Frontiers in Energy
Research: https://www.frontiersin.org/articles/10.3389/fenrg.2014.00045/full
150. Navrotsky, A., Shvareva, T., & Guo, X. (2013). Thermodynamics of Uranium
Minerals and Related Materials. In Mineralogical Association of Canada Short Course
43. Winnipeg, MB.
151. Obaid, S., Gaikwad, D., Sayyed, M., Al-Rashdi, K., & Pawar, P. (2018). Heavy
Metal Ions Removal from Waste Water by the Natural Zeolites. Materials Today:
Proceedings (pp. 17930-17934). Elsevier.
152. Omodara, L., Pitkaaho, S., Turpeinen, E., Saavalainen, P., Oravisjarvi, K., &
Keiski, R. (2019). Recycling and Substitution of Light Rare Earth Elements, Cerium,
Lanthanum, Neodymium, and Praseodymium from End-of-Life Applications- A
Review. Journal of Cleaner Production , 117573.
153. Ozbayoglu, G., & Atalay, M. (2000). Beneficiation of Bastnaesite by A Multi-
Gravity Separator. Journal of Alloys and Compounds, 520-523.
154. Palmieri, M. (1987). Separation and Determination of Trace Metal Ions Using
Organic Chelating Reagents. Thesis, Iowa State University.
155. Pan, J., Zhou, C., Tang, M., Cao, S., Liu, C., Zhang, N., . . . Ji, W. (2019). Study
on the Modes of Occurrence of Rare Earth Elements in Coal Fly Ash by Statistics and
A Sequential Chemical Extraction Process. Fuel, 555-565.
156. Panda, R., Kumari, A., Jha, M., Hait, J., Kumar, V., Kumar, J., & Lee, J. (2014).
Leaching of Rare Earth Metals (REMs) from Korean Monazite Concentrate. Journal of
Industrial and Engineering Chemistry, 2035-2042.
157. Papastefanou, C. (2007). Radioactivity of Coals and Fly Ashes. Journal of
Radioanalytical and Nuclear Chemistry, 29-35.
158. Parzentny, H., & Rog, L. (2019). The Role of Mineral Matter in Concentrating
Uranium and Thorium in Coal and Combustion Residues from Power Plants in Poland.
Minerals, doi:10.3390/min9050312.
159. Paul, A., & Pillai, K. (1991). Natural Radionuclides in A Tropical River
Subjected to Pollution. Water, Air and Soil Pollution, 305-319.

117
160. Paul, J., & Campbell, G. (2011). Investigating Rare Earth Element Mine
Development in EPA Region 8 and Potential Environmental Impacts. The United States
Environmental Protection Agency.
161. Paulick, H., & Machacek, E. (2017). The Global Rare Earth Element
Exploration Boom: An Analysis of Resources Outside of China and Discussion of
Development Perspectives. Resources Policy, 134-153.
162. Pillai, P. (2007). Naturally Occurring Radioactive Materials (NORM) in the
Extraction and Processing of Rare Earths. Proceedings of An International Symposium
(pp. 197-221). Seville, Spain: International Atomic Energy Agency.
163. Ponou, J., Dodbiba, G., Anh, J., & Fujita, T. (2016). Selective Recovery of Rare
Earth Elements from Aqueous Solution Obtained from Coal Power Plant Ash. Journal
of Environmental Chemical Engineering, 3761-3766.
164. Pourbaix, M. (1974). Atlas of Electrochemical Equilibria in Aqueous Solutions.
Brussels: Cebelcor.
165. Peiro, L., & Mendez, G. (2013). Material and Energy Requirement for Rare
Earth Production. JOM, 1327-1340.
166. Qadeer, R., Hanif, J., Saleem, M., & Afzal, M. (1992). Effect of Alkali Metals,
Alkaline Earth Metals and Lanthanides on the Adsorption of Uranium on Activated
Charcoal from Aqueous Solutions. Journal of Radioanalytical and Nuclear Chemistry,
243-253.
167. Qi, D. (2018). Extractants Used in Solvent Extraction-Separation of Rare
Earths: Extraction Mechanism, Properties, and Features. In Hydrometallurgy of Rare
Earths-Separation and Extraction (pp. 187-389).
168. Qin, S., Lu, Q., Li, Y., Wang, J., Zhao, Q., & Gao, K. (2018). Relationships
Between Trace Elements and Organic Matter in Coal. Journal of Geochemical
Exploration, 101-110.
169. Quinn, J., Soldenhoff, K., Stevens, G., & Lengkeek, N. (2015). Solvent
Extraction of Rare Earth Elements Using Phosphonic/Phosphinic Acid Mixtures.
Hydrometallurgy, 298-305.
170. Rabie, K., Sayed, S., Lasheen, T., & Salama, I. (2007). Europium Separation
from A Middle Rare Earths Concentrate Derived from Egyptian Black Sand Monazite.
Hydrometallurgy, 121-130.
171. Radioactive Elements in Coal and Fly Ash: Abundance, Forms, and
Environmental Significance. (1997, October). Retrieved from United States Geological
Survey: https://pubs.usgs.gov/fs/1997/fs163-97/FS-163-97.html
172. Ramesh, K., Reddy, K., & Nandanan, R. (2014). Porosity Distribution, Surface
Area and Morphology of Synthetic Potassium Zeolites: A SEM and N2 Adsorption
Study. Communications in Soil Science and Plant Analysis.

118
173. Rand, M., Fuger, J., Grenthe, I., Neck, V., & Rai, D. (2008). Chemical
Thermodynamics of Thorium. Oxford.
174. Regenspurg, S., Margot-Roquier, C., Harfouche, M., Froidevaux, P.,
Steinmann, P., Junier, P., & Bernier-Latmani, R. (2010). Speciation of Naturally-
Accumulated Uranium In An Organic-Rich Soil of An Alpine Region (Switzerland).
Geochimica et Cosmochimica Acta , 2082-2098.
175. Rim, K., Koo, K., & Park, J. (2013). Toxicological Evaluations of Rare Earths
and Their Health Impacts to Workers: A Literature Review. Saf. Health Work, 12-26.
176. Rozmaric, M., Ivsic, A., & Grahek, Z. (2009). Determination of Uranium and
Thorium in Complex Samples Using Chromatographic Separation, ICP-MS and
Spectrophotometric Detection. Talanta, 352-362.
177. Salehuddin, A., Ismail, A., Bahri, C., & Aziman, E. (2019). Economic Analysis
of Thorium Extraction from Monazite. Nuclear Engineering and Technology, 631-640.
178. Samsonov, M., Trofimov, T., Kulyako, Y., Vinokurov, S., Malikov, D.,
Batorshin, G., & Myasoedov, B. (2015). Recovery of Rare Earth Elements, Uranium
and Thorium from Monazite Concentrate by Supercritical Fluid Extraction.
Radiochemistry, 343-347.
179. Sani, A., Bandegharaei, A., Hosseini, S., Kharghani, K., Zarei, H., & Rastegar,
A. (2015). Kinetic, Equilibrium and Thermodynamic Studies on Sorption of Uranium
and Thorium from Aqueous Solutions by A Selective Impregnated Resin Containing
Carminic Acid. Journal of Hazardous Materials, 152-163.
180. Schreiber, A., Marx, J., Zapp, P., Hake, J., Vobenkaul, D., & Friedrich, B.
(2016). Environmental Impacts of Rare Earth Mining and Separation Based on
Eudialyte: A New European Way. Resources, doi:10.3390/resources5040032.
181. Schuler, D., Buchert, M., Liu, R., Dittrich , S., & Merz, C. (2011). Study on
Rare Earths and Their Recycling. Darmstadt.
182. Seo, E., Cheong, Y., Yim, G., Min, K., & Geroni, J. (2017). Recovery of Fe, Al
and Mn in Acid Coal Mine Drainage by Sequential Selective Precipitation with Control
of pH. Catena, 11-16.
183. Seredin, V. (1996). Rare Earth Element-Bearing Coals from the Russian Far
East Deposit. International Journal of Coal Geology, 101-129.
184. Seredin, V., & Dai, S. (2012). Coal Deposits as Potential Alternative Sources
for Lanthanides and Yttrium. International Journal of Coal Geology, 67-93.
185. Sikalidis, C., Alexiades, C., & Misaelides, P. (2008). Adsorption of Uranium
and Thorium from Aqueous Solutions by the Clay Minerals Montmorillonite and
Vermiculite. Toxicological and Environmental Chemistry, 175-180.

119
186. Silva, R. G., De Morais, C. A., & Teixeria, L. V. (2018). Selective Removal of
Impurities from Rare Earth Sulphuric Liquor Using Different Reagents. Minerals
Engineering, 238-246.
187. Song, G., Yuan, W., Zhu, X., Wang, X., Zhang, C., Li, J., & Wang, J. (2017).
Improvement in Rare Earth Element Recovery from Waste Thrichromatic Phosphors
by Mechanical Activation. J. Clean. Prod., 361-370.
188. Song, Y., Wang, Y., Wang, L., Song, C., Yang, Z., & Zhao, A. (1999). Recovery
of Uranium from Carbonate Solutions Using Strongly Basic Anion Exchanger 4.
Column Operation and Quantitative Analysis. Reactive and Functional Polymers, 245-
252.
189. Srinivas, C., Venkatesh, K., Wattal, P., Theyyunni, T., Kartha, P., & Tripathi,
S. (1994). Alkaline Hydrolysis Process for Treatment and Disposal of Purex Solvent
Waste. Bombay, India: Bhabha Atomic Research Centre.
190. Suli, L., Ibrahim, W., Aziz, B., Deraman, M., & Ismail, N. (2017). A Review of
Rare Earth Mineral Processing Technology. Chemical Engineering Research Bulletin,
20-35.
191. Thakur, N. (2000). Separation of Rare Earths by Solvent Extraction . Mineral
Processing and Extractive Metallurgy Review, 277-306.
192. Thommes, M., Kaneko, K., Niemark, A., Olivier , J., Rodriguez-Reinoso, F.,
Rouquerol, J., & Sing, K. (2015). Physisoprtion of Gases, With Special Reference to
the Evaluation of Surface Area and Pore Size Distribution. Pure Applied Chemistry.
193. Tomazic, B., Branica, M., & Tezak, B. (1962). Precipitation and Hydrolysis of
Uranium(VI) in Aqueous Solutions: Uranyl Nitrate-Potassium Hydroxide-Neutral
Electrolyte. Croatica Chemica Acta, 41-50.
194. Torapava, N., Persson, I., Eriksson, L., & Lundberg, D. (2009). Hydration and
Hydrolysis of Thorium (IV) in Aqueous Solution and the Structures of Two Crystalline
Throium(IV) Hydrates. Inorganic Chemistry, 11712-11723.
195. U.S. Department of Energy. (2011). Critical Materials Strategy.
196. U.S. Environmental Protection Agency. (1999). Understanding Variation in
Partition Coefficient, Kd, Values, Volume II: Review of Geochemistry and Available
Kd Values for Cadmium, Cesium, Chromium, Lead, Plutonium, Radon, Strontium,
Thorium, Tritium, and Uranium. Washington, DC: U.S. Environmental Protection
Agency and U.S. Department of Energy.
197. Uda, T., Jacob, K., & Hirasawa, M. (2000). Technique for Enhanced Rare Earth
Separation. Science, 2326-2329.
198. United States Geological Survey. (1997). Retrieved from Radioactive Elements
in Coal and Fly Ash: Abundance, Forms, and Environmental Significance:
https://pubs.usgs.gov/fs/1997/fs163-97/FS-163-97.html

120
199. Valentim, B., Abagiu, A., Anghelescu, L., Flores, D., French, D., Goncalves,
P., . . . Ward, C. (2019). Assessment of Bottom Ash Landfilled at Ceplea Valley
(Romania) As A Source of Rare Earth Elements. International Journal of Coal
Geology, 109-126.
200. Valkov, A., Sergievskiy, V., Sofronov, V., Kalaev, M., & Ermakova, Y. (2014).
Studies in the Field of Rare Earth Elements. Procedia Chemistry, 171-175.
201. Van Gosen , B., Vernplanck, P., & Emsbo, P. (2019). Rare Earth Element
Mineral Deposits in the United States. U.S.Geological Survey Circular 1454.
202. Van Gosen, B., Verplanck, P., Seal, R. I., Long, K., & Gambogi, J. (2017). Rare-
Earth Elements, Chap. O Schulz, K.J, DeYoung, J.H. Jr, Seal, R.R., II, and Bradley,
D.C., eds. Critical Mineral Resources of United States-Economic and Environmental
Geology and Prospects for Future Supply: U.S. Geological Survey Professional Paper.
Retrieved from https://doi.org/10.3133/pp1802O
203. Vass, C. (2019). A Critical Assessment on the Resources and Extraction of Rare
Earth Elements from Acid Mine Drainage . Morgantown, WV: Ph.D. Thesis, West
Virginia University.
204. Vijayalakshmi, R., Mishra, S., Singh, H., & Gupta, C. (2001). Processing of
Xenotime Concentrate by Sulphuric Acid Digestion and Selective Thorium
Precipitation for Separation of Rare Earths. Hydrometallurgy, 75-80.
205. Wagner, N., & Matiane, A. (2018). Rare Earth Elements in Select Main Karoo
Basin (South Africa) Coal and Coal Ash Samples. International Journal of Coal
Geology, 82-92.
206. Wang, D., Zhao, Z., Yu, Y., Dai, J., Deng, M., Zhao, T., & Liu, L. (2018).
Exploration and Research Progress on Ion-Adsorption Type REE Deposit in South
China. China Geology, 415-424.
207. Wang, L., Huang, X., Yu, Y., Zhao, L., Wang, C., Feng, Z., . . . Long, Z. (2017).
Towards Cleaner Production of Rare Earth Elements from Bastnaesite in China.
Journal of Cleaner Production, 231-242.
208. Wang, Y., Zhang, Z., Liu, Y., Cao, Z., Liu, Y., & Li, Q. (2012). Adsorption of
U(VI) from Aqueous Solution by the Carboxyl-Mesoporous Carbon. Chemical
Engineering Journal, 246-253.
209. World Nuclear Association. (2021, 06 04). Naturally-Occurring Radioactive
Materials (NORM). Retrieved from World Nuclear Association: https://world-
nuclear.org/information-library/safety-and-security/radiation-and-health/naturally-
occurring-radioactive-materials-norm.aspx
210. Xie, F., Zhang, T., Dreisinger, D., & Doyle , F. (2014). A Critical Review on
Solvent Extraction of Rare Earths from Aqueous Solutions. Minerals Engineering, 10-
28.

121
211. Xiong, X., Tao, Y., Yu, Z., Yang, L., Sun, L., Fan, Y., & Luo, F. (2020).
Selective Extraction of Thorium from Uranium and Rare Earth Elements Using
Sulfonated Covalent Organic Framework and Its Membrane Derivative. Chemical
Engineering Journal, 123240.
212. Yadav, V., Gadi, R., & Kalra, S. (2019). Clay Based Nanocomposites for
Removal of Heavy Metals from Water: A Review. Journal of Environmental
Maganement, 803-817.
213. Yakout, S. (2017). Influence of Solution Chemistry on the Selective Adsorption
of Uranium and Thorium onto Activated Carbon. Nuclear Technology, 294-300.
214. Yang, X. (2019). Leaching Characteristics of Rare Earth Elements from
Bituminous Coal-Based Sources. Lexington: Thesis, University of Kentucky.
215. Yoon, H., Kim, C., Chung, K., Kim, S., Lee, J., & Kumar, J. (2016). Solvent
Extraction, Separation and Recovery of Dysprosium (Dy) and Neodymium (Nd) from
Aqueous Solutions: Waste Recycling Strategies for Permanent Magnet Processing.
Hydrometallurgy, 27-43.
216. Yorukoglu, A., Obut, A., Girgin, I. (2003). Effect of Thiourea on Sulphuric Acid
Leaching of Bastnaesite. Hydrometallurgy,195-202.
217. Zendelska, A., Golomeova, M., Blazev, K., Krstev, B., Golomeov, B., & Krstev,
A. (2015). Adsorption of Copper Ions from Aqueous Solutions on Natural Zeolite.
Environmental Protection Engineering, 17-36.
218. Zhang, J., & Zhao, B. (2016). Separation Hydrometallurgy of Rare Earth
Elements. Saskatoon: Springer.
219. Zhang, J., Zhao, B., & Schreiner, B. (2016). Separation Hydrometallurgy of
Rare Earth Elements. Saskatoon: Springer.
220. Zhang, W., & Honaker, R. (2019). Calcination Pretreatment on Acid Leaching
Characteristics of Rare Earth Elements from Middlings and Coarse Refuse Material
Associated with A Bituminous Coal Source. Fuel, 130-145.
221. Zhang, W., & Honaker, R. (2018). Rare Earth Elements Recovery Using Stages
Precipitation from A Leachate Generated from Coarse Coal Refuse. International
Journal of Coal Geology, 189-199.
222. Zhang, W., Rezaee, M., Bhagavatula, A., Li, Y., Groppo, J., & Honaker, R.
(2015). A Review of the Occurrence and Promising Recovery Methods of Rare Earth
Elements from Coal and Coal By-Products. International Journal of Coal Preparation
and Utilization, 295-330.
223. Zhou, H., Wang, Y., Guo, X., Dong, Y., Su, X., & Sun, X. (2018). The Recovery
of Rare Earth by A Novel Extraction and Precipitation Strategy using Functional Ionic
Liquids. Journal of Molecular Liquids, 414-420.

122
224. Zhou, L., Shang, C., Liu, Z., Huang, G., & Adesina, A. (2012). Selective
Adsorption of Uranium(VI) from Aqueous Solutions Using the Ion-Imprinted Magnetic
Chitosan Resins. Journal of Colloid and Interface Science, 165-172.
225. Zhu, Z., Pranolo, Y., & Cheng, C. (2015). Separation of Uranium and Thorium
from Rare Earths for Rare Earth Production - A Review. Minerals Engineering, 185-
196.
226. Zou, W., Zhao, L., & Han, R. (2009). Removal of Uranium (VI) by Fixed Bed
Ion-Exchange Column Using Natural Zeolite Coated with Manganese Oxide . Chinese
Journal of Chemical Engineering, 585-593.

123
APPENDIX
Figure 61 The PANanalytical XRD used throughout the study.
Figure 62 Instrument used for the SEM analysis of various solid samples. (A) Hitachi S4700
SEM-EDX (B) Denton Desk V Sputter and Carbon Coater.

124
Figure 63 The CILAS particle size analyzer used throughout the study.
Figure 64 The Vanta handheld XRF used throughout the study.

125
Figure 65 BET nitrogen adsorption instrument used for the characterization of zeolite
samples.
Table 22 Individual rare earth elements, thorium and uranium concentrations (ppm) in the
filtrates at various pH values.
Element/pH 4.66 5.00 6.17 6.55 8.00 8.15 8.42 9.40 9.80
Sc 0.00 0.00 0.00 0.00 0.00 0.00 0.00 0.00 0.00
Y 0.67 0.55 0.52 0.39 0.01 0.00 0.01 0.00 0.03
La 0.43 0.41 0.39 0.35 0.03 0.01 0.02 0.00 0.02
Ce 3.29 2.86 2.75 2.39 0.08 0.04 0.05 0.04 0.13
Pr 0.47 0.42 0.33 0.29 0.03 0.03 0.03 0.03 0.03
Nd 1.97 1.70 1.56 1.20 0.03 0.01 0.02 0.01 0.07
Sm 0.66 0.52 0.45 0.31 0.04 0.04 0.05 0.04 0.07
Eu 0.11 0.08 0.07 0.04 0.00 0.00 0.00 0.00 0.00
Gd 0.44 0.35 0.30 0.21 0.01 0.01 0.01 0.01 0.01
Tb 0.02 0.02 0.02 0.02 0.02 0.02 0.02 0.02 0.02
Dy 0.18 0.14 0.10 0.06 0.01 0.01 0.01 0.01 0.01
Ho 0.02 0.02 0.02 0.01 0.00 0.00 0.00 0.00 0.00
Er 0.08 0.06 0.05 0.03 0.01 0.01 0.01 0.01 0.01
Tm 0.00 0.00 0.00 0.00 0.00 0.00 0.00 0.00 0.00
Yb 0.03 0.01 0.01 0.01 0.00 0.00 0.00 0.00 0.00
Lu 0.00 0.00 0.00 0.00 0.00 0.00 0.00 0.00 0.00
Th 0.01 0.00 0.00 0.00 0.00 0.00 0.00 0.00 0.00
U 0.15 0.04 0.00 0.00 0.00 0.00 0.00 0.00 0.01

126
Table 23 Individual rare earth elements, thorium, and uranium precipitation (%) at various pH
values during the preliminary selective precipitation tests.
4.66 5.00 6.17 6.55 8.00 8.15 8.42 9.40 9.80
Sc 79.09 80.20 79.09 100.00 100.00 100.00 100.00 100.00 100.00
Y 14.44 34.25 34.36 58.76 99.13 99.68 99.24 99.87 96.99
La 12.75 21.96 21.61 39.26 94.28 97.74 95.97 99.19 96.56
Ce 16.81 31.53 30.52 48.28 98.15 99.15 98.76 99.01 96.98
Pr 18.84 31.85 35.30 55.67 96.07 96.19 95.66 95.66 95.89
Nd 17.50 32.44 34.47 56.75 98.92 99.68 99.24 99.62 97.10
Sm 11.00 33.39 39.04 63.74 95.63 95.17 93.69 94.62 91.85
Eu 19.35 40.05 49.49 68.54 96.91 97.00 96.98 96.98 97.14
Gd 15.15 35.80 42.15 67.04 99.03 99.06 98.85 98.85 98.00
Tb 15.21 19.71 15.21 42.50 40.72 42.50 15.21 15.15 19.71
Dy 18.07 40.95 53.11 74.28 97.83 97.89 97.72 97.72 97.41
Ho 18.38 38.82 45.58 66.66 88.89 88.89 89.79 89.78 90.33
Er 19.11 41.54 49.97 71.47 88.62 88.96 87.22 87.21 87.89
Tm 0.00 0.00 0.00 0.00 0.00 0.00 0.00 0.00 0.00
Yb 21.57 65.34 63.39 88.82 100.00 100.00 100.00 100.00 100.00
Lu 33.95 79.15 55.96 59.74 58.50 59.74 77.98 77.96 79.15
Th 95.49 99.83 99.99 99.99 99.99 99.99 99.99 99.99 99.99
U 28.67 82.18 98.45 99.59 99.40 99.90 99.82 99.37 96.52
TREEs 16.32 32.46 33.95 54.44 97.71 98.49 97.89 98.36 98.37
Table 24 Precipitation (%) of heavy, light, critical, and uncritical rare earth elements at
various pH values during the preliminary selective precipitation tests.
Element/pH 4.66 5.00 6.17 6.55 8.00 8.15 8.42 9.40 9.80
TREEs 16.32 32.46 33.95 54.44 97.71 98.49 97.89 98.36 98.37
HREEs 15.93 36.96 41.32 64.67 97.45 97.76 97.18 97.45 96.05
LREEs 16.38 31.41 32.25 52.11 97.70 98.66 98.05 98.56 96.44
CREEs 17.18 33.35 35.96 58.12 98.14 98.72 98.23 98.57 96.59
UCREEs 15.72 31.83 32.53 51.87 97.41 98.33 97.65 98.21 96.21
Table 25 Extraction recovery (%) of total rare earths, thorium, and uranium during the
exploratory solvent extraction tests.
Element/Recovery (%) One-Stage Double-Stage
TREEs 89.97 96.59
Thorium 92.76 93.80
Uranium 51.46 42.74

127
Table 26 Extraction recovery (%) individual rare earth elements during the exploratory
solvent extraction tests.
Element/Recovery (%) One-Stage Double-Stage
Sc 63.76 62.54
Y 94.92 96.24
La 91.40 96.50
Ce 87.74 96.67
Pr 91.11 96.62
Nd 90.27 96.67
Sm 91.76 96.76
Eu 90.27 96.74
Gd 90.69 96.27
Tb 94.15 95.42
Dy 89.83 96.64
Ho 91.79 96.39
Er 96.03 96.35
Tm 78.70 92.49
Yb 92.49 95.94
Lu 98.37 94.94
Th 92.76 93.80
U 51.46 42.74
Table 27 Extraction recovery (%) of heavy, light, critical, and uncritical rare earth elements
during the exploratory solvent extraction tests.
Element/Recovery (%) One-Stage Double-Stage
TREEs 89.97 95.59
HREEs 92.79 96.31
LREEs 89.31 96.66
CREEs 91.32 96.57
UCREEs 89.01 96.66
Table 28 Precipitation (%) of total rare earth elements, thorium, uranium, and major metals
during the one-stage modified experimental protocol.
Element/pH TREEs Thorium Uranium Major Metals
4.85 19.32 99.90 47.89 24.57

128
Table 29 Individual rare earth elements and uranium extraction recovery (%) into the final rare earth product stream based
on solely solvent extraction circuit during the first subset of solvent extraction tests.
Element/Recovery (%) 1 2 3 4 5 6 7 8 9 10 11 12 13 14 15
Sc 0.00 0.00 0.00 0.00 0.00 0.00 0.00 0.00 0.00 0.00 0.00 0.00 0.00 0.00 0.00
Y 99.43 97.72 100.00 98.54 99.34 99.51 100.00 100.00 89.73 93.91 95.00 92.47 93.30 97.68 96.17
La 96.76 98.75 99.41 97.09 98.89 96.78 94.12 98.39 90.24 95.50 95.97 93.17 94.90 97.76 97.59
Ce 97.95 95.98 99.55 97.82 98.38 99.08 92.74 100.00 89.63 94.36 95.18 92.52 93.76 96.65 96.33
Pr 94.88 88.89 98.49 94.09 98.62 95.03 100.00 97.98 91.80 87.25 87.69 87.12 87.12 93.22 82.67
Nd 97.64 95.83 98.00 96.36 97.45 95.43 97.13 96.95 89.73 94.42 95.30 92.69 93.71 96.84 97.08
Sm 97.39 94.98 97.76 95.82 96.94 94.85 94.03 97.04 90.94 93.74 93.99 93.59 93.58 95.05 91.00
Eu 98.70 94.67 100.00 96.63 100.00 100.00 93.02 100.00 91.92 92.38 92.59 92.16 92.00 95.83 88.68
Gd 98.23 94.60 98.74 97.62 98.83 97.40 93.79 99.18 91.65 94.39 96.52 93.11 92.60 96.79 97.09
Tb 92.31 84.62 77.14 81.81 78.95 84.21 60.53 70.73 76.47 62.79 62.79 64.44 63.64 77.14 54.72
Dy 100.00 96.75 100.00 100.00 100.00 100.00 96.40 100.00 90.96 94.68 97.06 93.37 93.33 98.73 99.38
Ho 100.00 92.86 100.00 100.00 100.00 100.00 94.12 100.00 80.00 66.67 68.00 66.67 66.67 80.00 58.62
Er 100.00 94.44 100.00 96.88 100.00 100.00 93.44 100.00 88.89 80.73 81.40 80.49 80.49 89.61 74.47
Tm 0.00 0.00 0.00 0.00 0.00 0.00 0.00 0.00 0.00 0.00 0.00 0.00 0.00 0.00 0.00
Yb 100.00 94.12 100.00 100.00 100.00 100.00 90.48 100.00 89.29 93.10 96.55 92.86 89.29 100.00 100.00
Lu 0.00 0.00 0.00 0.00 0.00 0.00 0.00 0.00 0.00 0.00 0.00 0.00 0.00 0.00 0.00
U 66.67 33.33 23.53 17.65 17.65 29.41 11.76 5.86 46.11 11.69 34.52 69.00 20.16 89.36 17.07
TREEs 97.83 95.55 98.85 97.09 98.12 97.41 94.79 98.62 89.99 93.52 94.37 92.03 92.87 96.35 94.58

129
Table 30 Individual rare earth elements and uranium concentrations (mg/L) in the final rare earth product stream based on solely solvent
extraction circuit during the first subset of solvent extraction tests.
Element/Concentration 1 2 3 4 5 6 7 8 9 10 11 12 13 14 15
Sc 0.00 0.47 0.00 0.00 0.00 0.00 0.00 0.00 0.00 0.00 0.00 0.00 0.00 0.00 0.00
Y 0.52 0.32 0.55 0.54 0.61 0.61 0.53 0.62 0.60 0.65 0.65 0.62 0.63 0.63 0.65
La 0.33 2.39 0.34 0.33 0.36 0.36 0.34 0.37 0.37 0.40 0.41 0.38 0.39 0.39 0.41
Ce 2.53 0.22 2.67 2.60 2.91 2.92 2.39 2.97 2.79 3.06 3.04 2.88 2.96 2.94 3.04
Pr 0.24 1.36 0.26 0.26 0.29 0.29 0.26 0.29 0.41 0.44 0.46 0.43 0.43 0.44 0.46
Nd 1.45 0.59 1.57 1.53 1.68 1.69 1.52 1.72 1.73 1.88 1.89 1.79 1.82 1.81 1.86
Sm 0.06 0.07 0.70 0.69 0.76 0.77 0.65 0.79 0.57 0.60 0.63 0.58 0.58 0.60 0.61
Eu 0.08 0.26 0.09 0.09 0.10 0.10 0.08 0.10 0.09 0.10 0.10 0.10 0.09 0.09 0.09
Gd 0.28 0.02 0.31 0.33 0.34 0.34 0.29 0.36 0.38 0.40 0.42 0.39 0.39 0.39 0.40
Tb 0.02 0.12 0.03 0.03 0.03 0.03 0.02 0.03 0.03 0.03 0.03 0.03 0.03 0.03 0.03
Dy 0.13 0.01 0.15 0.15 0.16 0.16 0.13 0.16 0.15 0.16 0.17 0.16 0.15 0.16 0.16
Ho 0.01 0.05 0.02 0.02 0.02 0.02 0.02 0.02 0.01 0.02 0.02 0.02 0.02 0.02 0.02
Er 0.06 0.00 0.06 0.06 0.07 0.07 0.06 0.07 0.06 0.07 0.07 0.07 0.07 0.07 0.07
Tm 0.00 0.02 0.00 0.00 0.00 0.00 0.00 0.00 0.00 0.00 0.00 0.00 0.00 0.00 0.00
Yb 0.02 0.00 0.02 0.02 0.03 0.03 0.02 0.03 0.03 0.03 0.03 0.03 0.03 0.03 0.03
Lu 0.00 0.00 0.00 0.00 0.00 0.00 0.00 0.00 0.00 0.00 0.00 0.00 0.00 0.00 0.00
U 0.02 0.01 0.04 0.03 0.03 0.05 0.02 0.01 0.05 0.01 0.03 0.07 0.02 0.04 0.01
TREEs 6.31 5.88 6.77 6.64 7.34 7.39 6.29 7.52 7.23 7.83 7.90 7.46 7.58 7.58 7.83

130
Table 31 Overall extraction recovery (%) of total rare earth elements and uranium during the
first subset of solvent extraction tests.
Test Number Extraction Recovery (%) of TREEs Extraction Recovery (%) of Uranium
1 78.93 34.68
2 77.09 17.34
3 79.75 12.24
4 78.33 9.18
5 79.16 9.18
6 78.59 15.30
7 76.48 6.12
8 79.57 3.05
9 72.60 23.93
10 75.45 5.72
11 76.14 17.69
12 74.25 35.89
13 74.93 10.40
14 77.74 46.49
15 76.31 8.88

131
Table 32 Individual rare earths and uranium extraction recovery (%) into the final rare earth product stream based solely on the solvent
extraction circuit during the second subset of solvent extraction tests.
Element/Test
Number
1 2 3 4 5 6 7 8 9 10 11 12 13 14 15
Sc 0.00 0.00 0.00 0.00 0.00 0.00 0.00 0.00 0.00 0.00 0.00 0.00 0.00 0.00 0.00
Y 98.79 96.72 97.55 98.15 98.48 92.87 93.17 94.23 95.84 96.30 95.32 98.100 70.211 95.389 95.76
La 98.53 97.8 97.52 97.92 98.04 96.15 95.89 94.21 95.53 95.94 95.24 98.04 75.99 96.47 98.99
Ce 97.82 96.08 96.00 97.19 95.87 90.94 90.11 92.31 93.60 93.50 93.20 95.57 76.37 96.10 96.53
Pr 96.65 92.56 87.86 96.85 88.17 87.33 85.00 84.89 84.61 86.56 87.55 78.97 84.11 95.87 95.08
Nd 97.98 96.00 96.69 97.28 96.14 91.32 91.32 92.44 93.90 94.19 93.41 95.91 78.28 94.81 96.28
Sm 93.24 86.35 92.40 92.72 91.63 81.97 80.71 91.99 90.58 89.01 91.93 90.12 86.82 95.55 97.18
Eu 98.06 90.09 96.15 98.17 92.79 87.76 90.14 90.98 91.30 91.11 91.75 91.67 73.63 95.18 96.08
Gd 98.14 93.36 96.77 97.660 95.96 88.65 91.23 92.36 93.38 93.72 93.22 95.48 72.80 96.30 95.38
Tb 88.24 77.14 78.95 88.89 65.96 61.91 60.64 58.62 60.98 60.98 62.79 61.90 55.56 96.58 50.00
Dy 98.32 89.72 98.31 98.94 98.90 89.02 90.57 94.60 97.37 97.31 97.52 98.73 71.91 96.44 97.62
Ho 90.00 80.95 82.61 90.91 70.37 65.22 67.89 67.57 65.22 63.64 66.67 66.67 61.29 95.61 78.95
Er 94.94 89.47 90.48 95.24 82.80 80.00 80.64 78.75 79.75 79.49 80.73 80.73 72.15 96.30 89.75
Tm 0.00 0.00 0.00 0.00 0.00 0.00 0.00 0.00 0.00 0.00 0.00 0.00 0.00 0.00 20.00
Yb 100.00 82.15 100.00 100.00 100.00 83.33 100.00 100.00 100.00 100.00 100.000 100.000 56.53 98.84 86.21
Lu 0.00 20.00 100.00 100.00 100.00 100.00 100.00 100.00 0.00 0.00 100.00 100.00 41.09 95.95 20.00
U 62.47 4.28 42.92 59.39 57.22 12.00 29.95 3.42 23.33 31.68 10.00 22.58 5.14 30.00 5.46
TREEs 97.57 94.60 95.37 97.09 94.83 89.61 80.23 91.00 92.94 92.87 92.79 94.00 81.53 94.22 95.72

132
Table 32 continued
Element/Test
Number
16 17 18 19 20 21 22 23 24 25 26 27
Sc 20.00 20.00 14.29 33.33 20.00 23.53 20.00 20.00 20.00 33.33 14.28 14.28
Y 96.15 96.81 97.22 95.92 97.35 95.94 95.87 96.05 94.18 93.25 96.13 96.20
La 98.93 98.93 98.45 97.57 98.91 98.11 97.96 97.66 96.41 94.95 96.47 96.47
Ce 95.40 95.88 95.23 95.41 96.28 94.85 94.97 95.29 93.05 93.15 95.29 95.00
Pr 94.71 94.66 92.69 95.50 94.68 93.80 94.97 94.82 92.72 95.14 92.56 93.72
Nd 95.17 95.63 95.44 95.29 96.05 94.70 95.08 95.22 93.38 92.63 94.45 93.92
Sm 93.61 95.77 95.81 95.08 97.33 96.04 95.64 95.15 93.67 96.31 96.18 96.10
Eu 95.87 95.83 94.18 96.81 95.83 96.70 95.96 95.79 93.75 94.57 93.94 96.55
Gd 94.72 95.19 95.83 94.63 96.08 95.15 94.90 95.16 93.29 95.95 93.75 95.10
Tb 47.83 47.83 39.40 63.64 46.67 51.85 48.94 47.83 48.94 63.64 39.98 48.99
Dy 97.48 97.50 96.44 96.84 97.47 98.00 97.59 97.50 95.65 96.13 96.38 98.25
Ho 78.95 78.95 71.43 87.50 77.78 82.20 78.95 77.78 77.78 86.67 71.43 80.77
Er 89.33 89.19 85.19 94.21 89.19 91.28 89.33 88.89 88.89 93.85 84.62 92.18
Tm 20.00 20.00 14.28 33.33 20.00 23.53 20.00 20.00 20.00 33.33 14.28 14.28
Yb 86.21 86.21 81.25 92.31 85.72 88.50 85.19 84.62 84.00 91.30 78.57 91.69
Lu 20.00 20.00 14.28 33.33 20.00 23.53 20.00 20.00 20.00 33.33 14.28 14.28
U 22.58 11.87 12.73 36.77 43.33 40.43 13.73 60.78 21.57 50.98 7.27 37.26
TREEs 94.65 95.20 94.43 95.16 95.64 94.63 94.61 94.70 92.80 93.41 93.92 94.93

133
Table 33 Individual rare earth elements and uranium concentrations (mg/L) in the final rare earth product stream based solely on solvent
extraction unit during the second subset of solvent extraction tests.
Element/Concentration 1 2 3 4 5 6 7 8 9 10 11 12 13 14 15
Sc 0.00 0.00 0.00 0.00 0.00 0.00 0.00 0.00 0.00 0.00 0.00 0.00 0.00 0.00 0.00
Y 0.65 0.62 0.64 0.69 0.65 0.60 0.59 0.78 0.60 0.57 0.61 0.62 0.71 0.60 0.63
La 0.40 0.40 0.39 0.42 0.40 0.40 0.41 0.49 0.39
392.87
0.38 0.40 0.40 0.44 0.40 0.39
Ce 3.09 2.99 3.00 3.36 3.06 2.79 2.78 3.71 2.87 2.73 2.93 2.98 3.33 3.00 3.12
Pr 0.46 0.45 0.46 0.49 0.48 0.44 0.48 0.56 0.42 0.41 0.45 0.44 0.51 0.45 0.46
Nd 1.95 1.85 1.90 2.08 1.94 1.81 1.85 2.35 1.76 1.69 1.81 1.83 2.08 2.00 1.87
Sm 0.65 0.60 0.64 0.70 0.67 0.58 0.60 0.76 0.56 0.55 0.59 0.58 0.68 0.62 0.62
Eu 0.10 0.09 0.10 0.11 0.10 0.09 0.10 0.12 0.08 0.08 0.09 0.09 0.11 0.10 0.10
Gd 0.42 0.39 0.42 0.45 0.43 0.38 0.45 0.51 0.37 0.36 0.39 0.38 0.44 0.41 0.41
Tb 0.03 0.03 0.03 0.03 0.03 0.03 0.03 0.03 0.03 0.03 0.03 0.03 0.03 0.02 0.02
Dy 0.18 0.16 0.18 0.19 0.18 0.15 0.20 0.21 0.15 0.15 0.16 0.16 0.18 0.16 0.16
Ho 0.02 0.02 0.02 0.02 0.02 0.02 0.02 0.03 0.02 0.01 0.02 0.02 0.02 0.02 0.02
Er 0.08 0.07 0.08 0.08 0.08 0.06 0.06 0.09 0.06 0.06 0.07 0.07 0.08 0.07 0.07
Tm 0.00 0.00 0.00 0.00 0.00 0.00 0.00 0.00 0.00 0.00 0.00 0.00 0.00 0.00 0.00
Yb 0.03 0.02 0.03 0.03 0.03 0.02 0.02 0.03 0.02 0.02 0.02 0.02 0.03 0.03 0.03
Lu 0.00 0.00 0.00 0.00 0.00 0.00 0.00 0.00 0.00 0.00 0.00 0.00 0.00 0.00 0.00
U 0.12 0.01 0.08 0.11 0.10 0.02 0.02 0.00 0.01 0.01 0.00 0.01 0.00 0.00 0.00
TREEs 8.15 7.69 7.89 8.64 8.06 7.35 7.61 9.66 7.30 7.04 7.57 7.61 8.63 7.88 7.91

134
Table 33 continued
Element/Concentration 16 17 18 19 20 21 22 23 24 25 26 27
Sc 0.00 0.00 0.00 0.00 0.00 0.00 0.00 0.00 0.00 0.00 0.00 0.00
Y 0.60 0.61 0.63 0.59 0.59 0.63 0.60 0.58 0.58 0.55 0.60 0.60
La 0.37 0.37 0.38 0.36 0.36 0.38 0.38 0.38 0.38 0.36 0.38 0.38
Ce 2.90 2.93 3.06 2.85 2.85 3.03 3.02 2.91 2.92 2.76 2.97 3.00
Pr 0.43 0.43 0.46 0.42 0.43 0.45 0.45 0.44 0.43 0.41 0.45 0.45
Nd 1.74 1.75 1.83 1.70 1.70 1.81 1.82 1.75 1.75 1.65 1.79 1.80
Sm 0.59 0.59 0.62 0.58 0.58 0.61 0.61 0.59 0.59 0.57 0.61 0.61
Eu 0.09 0.09 0.10 0.09 0.09 0.10 0.10 0.09 0.09 0.09 0.09 0.09
Gd 0.39 0.40 0.41 0.39 0.39 0.40 0.41 0.39 0.39 0.38 0.41 0.40
Tb 0.02 0.02 0.02 0.02 0.02 0.02 0.02 0.02 0.02 0.02 0.02 0.02
Dy 0.16 0.16 0.16 0.15 0.15 0.16 0.16 0.16 0.15 0.15 0.16 0.16
Ho 0.02 0.02 0.02 0.01 0.01 0.02 0.02 0.01 0.01 0.01 0.01 0.01
Er 0.07 0.07 0.07 0.07 0.07 0.07 0.07 0.06 0.06 0.06 0.07 0.07
Tm 0.00 0.00 0.00 0.00 0.00 0.00 0.00 0.00 0.00 0.00 0.00 0.00
Yb 0.03 0.03 0.03 0.02 0.02 0.03 0.02 0.02 0.02 0.02 0.02 0.02
Lu 0.00 0.00 0.00 0.00 0.00 0.00 0.00 0.00 0.00 0.00 0.00 0.00
U 0.02 0.01 0.01 0.03 0.03 0.03 0.00 0.03 0.01 0.03 0.00 0.02
TREEs 7.40 7.45 7.76 7.26 7.28 7.68 7.69 7.42 7.41 7.04 7.58 7.63

135
Table 34 Overall extraction recovery (%) of total rare earth elements and uranium during the
first subset of solvent extraction tests.
Test Number Extraction Recovery (%) of TREEs Extraction Recovery (%) of Uranium
1 77.11 31.84
2 74.76 2.18
3 75.37 21.87
4 76.71 30.25
5 74.94 29.16
6 70.82 6.12
7 63.41 15.26
8 71.92 1.74
9 73.45 11.89
10 73.40 16.14
11 73.33 5.10
12 74.29 11.51
13 64.43 2.62
14 74.46 15.29
15 75.65 2.78
16 74.80 11.51
17 75.24 6.05
18 74.63 6.49
19 75.20 18.74
20 75.58 22.02
21 74.79 20.60
22 74.77 6.77
23 74.84 30.97
24 73.34 11.00
25 73.82 25.98
26 74.22 3.71
27 75.02 18.99
Table 35 RE Oxide precipitation at various pH values.
Element/pH 4.6 5.5 7.0 7.5 8 8.5 9.5 10.0
TREEs 11.48 15.83 36.24 37.00 74.80 81.08 99.65 99.74
Thorium 95.01 100.00 100.00 100.00 100.00 100.00 100.00 100.00

136
Table 36 Adsorption recovery of total rare earths, thorium, and uranium during zeolite
adsorption tests.
Test Number TREEs Thorium Uranium
1 45.88 98.81 98.46
2 76.88 99.86 91.29
3 73.33 99.88 94.35
4 67.33 98.28 96.75
5 90.67 99.89 94.28
6 77.71 99.13 98.46
7 83.64 99.97 96.60
8 91.76 99.20 93.17
9 21.36 98.79 50.40
10 73.20 99.94 97.59
11 20.43 99.17 89.60
12 92.00 99.90 94.06
13 84.21 99.33 80.09
14 53.64 99.61 91.02
15 38.92 99.96 97.31
16 0.03 99.33 0.00
17 14.09 99.61 37.64
18 73.75 99.96 98.65
19 89.00 99.28 92.42
20 94.00 99.86 93.11
21 49.29 99.92 90.87
22 96.00 86.71 77.38
23 2.67 36.67 0.00
24 89.58 99.80 87.32
25 92.00 98.83 81.55
26 10.19 82.43 0.00
27 1.01 72.52 0.00

137
Table 37 Individual rare earth elements, thorium and uranium concentrations (mg/L) in the aqueous filtrate after zeolite adsorption tests.
Element/Concentration 1 2 3 4 5 6 7 8 9 10 11 12 13 14 15
Sc 0.00 0.00 0.00 0.00 0.00 0.00 0.00 0.00 0.00 0.00 0.00 0.00 0.00 0.00 0.00
Y 0.49 0.22 0.27 0.26 0.10 0.13 0.12 0.07 0.74 0.18 0.62 0.05 0.19 0.37 0.55
La 0.39 0.22 0.24 0.27 0.11 0.23 0.16 0.11 0.45 0.24 0.41 0.08 0.17 0.34 0.37
Ce 2.35 0.91 1.10 1.43 0.37 1.06 0.61 0.32 3.33 1.21 2.90 0.24 0.64 1.95 2.48
Pr 0.33 0.10 0.13 0.19 0.06 0.12 0.08 0.06 0.49 0.12 0.41 0.06 0.09 0.27 0.36
Nd 1.35 0.35 0.47 0.70 0.14 0.43 0.25 0.15 2.01 0.51 1.72 0.10 0.31 1.08 1.45
Sm 0.35 0.08 0.13 0.18 0.07 0.11 0.08 0.05 0.65 0.12 0.55 0.05 0.10 0.28 0.45
Eu 0.05 0.01 0.01 0.02 0.01 0.01 0.01 0.01 0.10 0.01 0.09 0.01 0.01 0.04 0.07
Gd 0.25 0.06 0.09 0.12 0.03 0.06 0.04 0.02 0.44 0.08 0.37 0.02 0.05 0.20 0.31
Tb 0.03 0.03 0.03 0.03 0.03 0.03 0.03 0.03 0.03 0.03 0.03 0.03 0.03 0.03 0.03
Dy 0.09 0.02 0.03 0.04 0.01 0.01 0.01 0.01 0.18 0.02 0.15 0.01 0.02 0.06 0.13
Ho 0.01 0.01 0.01 0.01 0.01 0.01 0.01 0.01 0.03 0.01 0.02 0.02 0.01 0.01 0.02
Er 0.04 0.02 0.02 0.02 0.02 0.02 0.02 0.02 0.08 0.02 0.07 0.01 0.02 0.03 0.05
Tm 0.00 0.00 0.00 0.00 0.01 0.01 0.01 0.00 0.00 0.00 0.00 0.00 0.00 0.00 0.00
Yb 0.01 0.00 0.00 0.00 0.00 0.00 0.00 0.00 0.03 0.00 0.03 0.00 0.00 0.01 0.02
Lu 0.00 0.00 0.00 0.00 0.00 0.00 0.00 0.00 0.00 0.00 0.00 0.00 0.00 0.00 0.00
Th 0.00 0.00 0.00 0.00 0.00 0.00 0.00 0.00 0.00 0.00 0.00 0.00 0.00 0.00 0.00
U 0.00 0.02 0.01 0.01 0.01 0.00 0.01 0.02 0.13 0.01 0.02 0.01 0.05 0.02 0.01

138
Table 37 continued
Element/Concentration 16 17 18 19 20 21 22 23 24 25 26 27
Sc 0.00 0.00 0.00 0.00 0.00 0.00 0.00 0.00 0.00 0.00 0.00 0.00
Y 0.80 0.69 0.18 0.06 0.03 0.44 0.01 0.64 0.13 0.02 0.79 0.84
La 0.56 0.44 0.26 0.11 0.04 0.35 0.00 0.54 0.08 0.03 0.52 0.56
Ce 3.93 3.12 1.15 0.34 0.11 1.95 0.07 3.93 0.35 0.08 3.35 3.78
Pr 0.54 0.49 0.16 0.06 0.06 0.30 0.06 0.52 0.06 0.06 0.53 0.57
Nd 2.37 2.00 0.56 0.14 0.05 1.22 0.01 2.37 0.16 0.03 2.03 2.31
Sm 0.77 0.67 0.14 0.08 0.01 0.35 0.05 0.75 0.08 0.05 0.76 0.82
Eu 0.14 0.10 0.01 0.01 0.01 0.05 0.01 0.13 0.01 0.01 0.14 0.15
Gd 0.61 0.44 0.08 0.02 0.03 0.24 0.01 0.59 0.03 0.01 0.59 0.64
Tb 0.03 0.03 0.03 0.03 0.01 0.03 0.03 0.03 0.03 0.03 0.03 0.03
Dy 0.25 0.18 0.02 0.01 0.01 0.08 0.01 0.25 0.01 0.01 0.25 0.27
Ho 0.03 0.03 0.01 0.01 0.02 0.01 0.01 0.03 0.01 0.01 0.03 0.04
Er 0.11 0.08 0.02 0.02 0.01 0.04 0.02 0.11 0.01 0.02 0.11 0.12
Tm 0.00 0.00 0.00 0.00 0.00 0.00 0.01 0.00 0.02 0.01 0.00 0.00
Yb 0.05 0.03 0.00 0.00 0.00 0.01 0.00 0.05 0.01 0.00 0.05 0.05
Lu 0.00 0.00 0.00 0.00 0.00 0.00 0.00 0.00 0.00 0.00 0.00 0.00
Th 0.00 0.00 0.00 0.00 0.00 0.00 0.02 0.08 0.00 0.00 0.02 0.04
U 0.30 0.14 0.00 0.02 0.01 0.02 0.05 0.30 0.03 0.04 0.20 0.30
Table 38 The results of the kinetic adsorption tests.
Adsorption Recovery (%)/Time 5 10 15 30 45 60 120 180
TREEs 0.00 3.04 11.28 11.28 19.56 20.13 20.16 21.55
Thorium 86.47 86.76 87.48 87.48 89.70 90.60 91.02 93.41
Uranium 0.00 0.22 2.22 2.50 4.10 5.76 6.83 7.88

139
VITAE
EDUCATIONAL BACKGROUND
2018- August 2021 Ph.D., Department of Mining Engineering, West Virginia University,
Dissertation: Evaluation of Various Separation Techniques for the
Removal of Actinides from A Rare Earth-containing Solution Generated
from Coarse Coal Refuse.
Advisor: Qingqing Huang
2014-2016 MSc., Department of Mining Engineering, Middle East Technical
University (METU), Turkey. Thesis: Beneficiation of Oxide Lead and
Zinc Minerals by Selective Flotation and Ammonia Leaching.
Advisor: M. Ümit Atalay, Co-Advisor: N. Emre Altun
2008-2013 BSc, Department of Mining Engineering, Hacettepe University, Turkey,
02/2012-06/2012 Erasmus Exchange Student, University of Miskolc, Hungary
RESEARCH & WORK EXPERIENCE
Graduate Research Assistant, West Virginia University Department of Mining Engineering
2018 – Present Researcher at a project funded by the US Department of Energy’s
National Energy Technology Laboratory
Project Name: Pilot-Scale Testing of an Integrated Circuit for the
Extraction of Rare Earth Elements from Coal and Coal By-Products
02/2018 – 04/2018 Researcher at a project funded by WVU Office of Global Affairs,
Energy Institute & Office of Research
Project Name: Study of Rare Earth Elements from Colombian Coals for
High-Tech Industries and Clean Energy Technologies
Research Assistant, Middle East Technical University Department of Mining Engineering,
Ankara, Turkey
05/2017-12/2017 Researcher at a project funded by The Scientific and Technological
Research Council of Turkey (TUBITAK)
Project Name: Obtaining Hybrid Fossil Fuel-Biomass Fuel Briquettes
Based On Domestic Energy Resources (Project Code: 315M310)
2015-2016 Researcher at a project funded by General Directorate of Eti Mine
Enterprises
Project Name: Preliminary Evaluation of Mineral Fields of General
Directorate of Eti Mine Enterprises (Project Code: 2015-03-05-00-04)

140
2015-2016 Researcher at a project funded by Middle East Technical University
Coordination of Scientific Research Projects
Project Name: Production of Lead and Zinc Concentrates from Oxide
Lead and Zinc Ores by Selective Flotation (Project Code: BAP-03-05-
2015-001)
Summer 2013 Intern at Koza Gold Corporation, Ovacik Gold Mine, Izmir, Turkey
Summer 2012 Intern at Eldorado Gold/Tuprag Metal Madencilik San.&Tic. A.S,
Efemcukuru Gold Mine, Izmir, Turkey
TEACHING EXPERIENCE
Fall 2020, Mineral Processing, West Virginia University
Fall 2019, Aggregates Production, West Virginia University
Spring 2018, Coal Preparation, West Virginia University
2013-2017, Mineral Processing Laboratory I and II, Middle East Technical University
JOURNAL PUBLICATIONS
1. Talan, D., Huang, Q., (2021). Rare Earth Elements: A Review of Recent Advances in
Resource Exploration, Environmental Aspect of Extraction and Solution Purification
Techniques. Submitted to Minerals Engineering.
2. Talan, D., Huang, Q., (2021). Separation of Radionuclides from A Rare Earth-Containing
Solution by Zeolite Adsorption. Minerals 11 (1). doi.org/10.3390/min11010020.
3. Huang, Q., Noble, A., Talan, D., (2020). Exploratory Investigation on the Use of Low-Cost
Alternative Media for Ultrafine Grinding of Coal. International Journal of Coal
Preparation and Utilization. DOI: 10.1080/19392699.2020.1809387
4. Talan, D., Huang, Q., (2020). Separation of Thorium, Uranium and Rare Earths from A
Strip Solution Generated from Coarse Coal Refuse. Hydrometallurgy. Volume 197,
105446, DOI:10.1016/j.hydromet.2020.105446.
5. Huang, Q., Talan, D., Restrepo, J., Restrepo, O., Kecojevic, V., Noble, A. (2019).
Characterization Study of Rare Earths, Yttrium and Scandium from Various Colombian
Coal Samples, International Journal of Coal Geology. Volume 209, p 14-26,
DOI:10.1016/j.coal.2019.04.008.
CONFERENCE PUBLICATIONS
1. Talan, D., Atalay, Ü. and Altun, N. E. (2017). Extraction of Zinc from Smithsonite by
Ammonia Leaching. 4th International Conference on Mining, Material and Metallurgical
Engineering (MMME’17), 8th-10th of June 2017, Rome-Italy.
2. Talan, D., Atalay, Ü. and Altun, N. E. (2015). Characterization of Kayseri-Develi Oxide
Lead and Zinc Ore. XVI Balkan Mineral Processing Congress, 17th-19th of June 2015,
Belgrade-Serbia.

141
TECHNICAL & POSTER PRESENTATIONS
1. Talan, D. and Huang, Q. (2021). Process Development for Separating Actinides from Rare
Earth‐containing Solution Generated from Coarse Coal Refuse. Poster presentation. 2021
SME Annual Conference & Expo, Mineral and Metallurgical Division Student Poster
Competition, Virtual Event.
2. Talan, D. and Huang, Q. (2021). Process Development for Separating Actinides from Rare
Earth‐containing Solution Generated from Coarse Coal Refuse. Poster presentation. 2021
SME Annual Conference & Expo, Environmental Division Student Poster Competition,
Virtual Event.
3. Talan, D. and Huang, Q. (2021). Process Development for Separating Actinides from Rare
Earth‐containing Solution Generated from Coarse Coal Refuse. Technical presentation.
2021 SME Annual Conference & Expo, 1st-5th of March, Virtual Event.
4. Talan, D., Huang, Q., Honaker, R. (2020). Separation of Thorium and Uranium from Rare
Earth Elements Using Zeolite Adsorption. Technical presentation. 2020 SME Annual
Conference & Expo,23rd-26th of February, Phoenix-Arizona.
5. Talan, D., Huang, Q., (2020). Separation of Radionuclides from Rare Earth Elements using
Zeolite Adsorption. Poster presentation. 2020 SME Annual Conference & Expo, Graduate
Student Research Poster Competition, 23rd-26th of February, Phoenix-Arizona.
6. Talan, D., Huang, Q., (2020) A Study on Removal of Thorium and Uranium from Rare
Earth Elements using Zeolite Adsorption. Poster presentation. 2020 SME Annual
Conference & Expo Mineral and Metallurgical Division Student Poster Competition, 23rd-
26th of February, Phoenix-Arizona. (Ranked 6th in 26 posters).
7. Talan, D., Huang, Q., Honaker, R., (2019). Removal of Radioactive Elements from Rare
Earths Using Various Separation Methods. Technical presentation. 2019 SME Annual
Conference & Expo, 24th-27th of February, Denver-Colorado.
SCHOLARSHIPS & AWARDS
1. Ranked 1st at the 2021 Society of Mining, Metallurgy and Exploration (SME),
Environmental Division Poster Contest
2. Ranked 5th at the 2021 Society of Mining, Metallurgy and Exploration (SME), Mineral and
Metallurgical Processing Division (MPD) Student Poster Competition
3. Finalist for 2021 Society of Mining Professors Michael Karmis Ph.D. Fellowship Award
4. Recipient of 2021 Mining and Metallurgical Society of America / Society of Mining,
Metallurgy and Exploration Foundation Presidential Scholarship
5. Recipient of 2020 Outstanding Merit Fellowship for Continuing Doctoral Students (sole
recipient among Benjamin M. Statler College of Engineering and Mineral Resources)
6. Recipient of 2020 Women’s Auxiliary to the American Institute of Mining Engineers
(WAAIME) Scholarship

142
7. Ranked 6th at the 2020 Society of Mining, Metallurgy and Exploration (SME), Mineral and
Metallurgical Processing Division (MPD) Student Poster Competition
8. Recipient of 2019 WVU Mining Engineering Faculty Graduate Award
9. Recipient of 2019 Women’s Auxiliary to the American Institute of Mining Engineers
(WAAIME) Scholarship
10. Recipient of 2015 Performance Award (given by Middle East Technical University, and
sole recipient)