evaluation of two pathways to produce torrefied pellets of two pathways to produce torrefied pellets...
TRANSCRIPT

@tcbiomass2013
Include #tcbiomass in your conference tweets!
Evaluation of two pathways to
produce torrefied pellets
Shahab Sokhansanj
Oak Ridge National Laboratory

2 Managed by UT-Battelle for the U.S. Department of Energy ORNL – Bioenergy Resource and Engineering Systems
Question?
• Is it better to do torrefaction before or after pelletization?
3 Managed by UT-Battelle for the U.S. Department of Energy ORNL – Bioenergy Resource and Engineering Systems
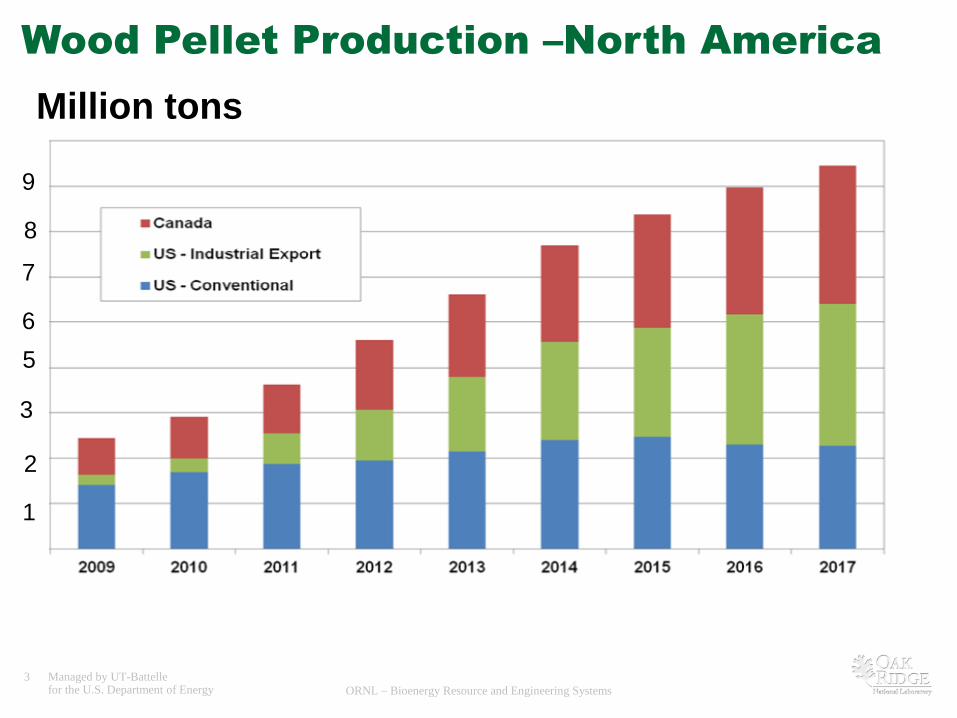
Wood Pellet Production –North America
1
2
3
5
6
7
8
9
Million tons

4 Managed by UT-Battelle for the U.S. Department of Energy ORNL – Bioenergy Resource and Engineering Systems

5 Managed by UT-Battelle for the U.S. Department of Energy ORNL – Bioenergy Resource and Engineering Systems
5
Collaborate with wood pellet industry in
developing durable pellets and quality
standards

6 Managed by UT-Battelle for the U.S. Department of Energy ORNL – Bioenergy Resource and Engineering Systems
Advantage of wood pellets over other
forms of cellulosic biomass
• Higher bulk density- Pellets are 2-5 time denser
• Better flowability characteristics – feeding to reactors
• Predictable quality and thermal performance
• Access and upgrade low quality low cost residues and wastes
• A good form of feedstock for biochemical conversion
But pellets are
• Susceptible to moisture ingress and damage
• Easily become dusty during handling
• Low in energy density (MJ/kg)

7 Managed by UT-Battelle for the U.S. Department of Energy ORNL – Bioenergy Resource and Engineering Systems
Torrefaction is a solution to a few of
problems with regular pellets
• The calorific value of torrefied pellets increases 10-25%
• T. pellets are hydrophobic – can be stored outside
• T. feedstock takes less energy to grind
• Bio-oil produced from T. feedstock is less acidic and more stable
But
• Torrefied biomass does not bind to form durable pellets
• Increased carbon fraction makes the torrefied biomass more abrasive to press mill.
7

8 Managed by UT-Battelle for the U.S. Department of Energy ORNL – Bioenergy Resource and Engineering Systems
One possible solution to making pelletize pellets
8
A. Pelletization Before Tarrefaction (PBT)
B. Pelletization After Torrefaction (PAT)
B
A

9 Managed by UT-Battelle for the U.S. Department of Energy ORNL – Bioenergy Resource and Engineering Systems
Process equipment to test the question:
Torrefier BTGA Hammermill grinder
Pellet mill

10 Managed by UT-Battelle for the U.S. Department of Energy ORNL – Bioenergy Resource and Engineering Systems 10
Grinding and Pelletizing
Comparison
11 Managed by UT-Battelle for the U.S. Department of Energy ORNL – Bioenergy Resource and Engineering Systems 11
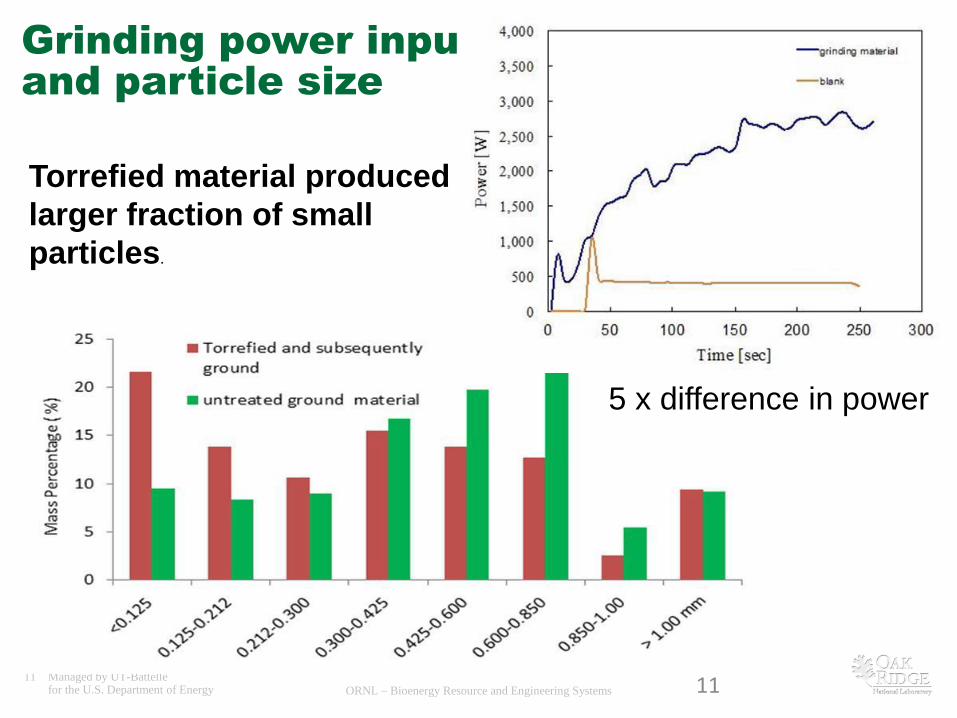
Torrefied material produced a
larger fraction of small
particles.
Grinding power input
and particle size
5 x difference in power

12 Managed by UT-Battelle for the U.S. Department of Energy ORNL – Bioenergy Resource and Engineering Systems 12
Torrefaction
Comparison

13 Managed by UT-Battelle for the U.S. Department of Energy ORNL – Bioenergy Resource and Engineering Systems 13
Torrefaction of woodchips and regular
pellets in BTGA
0.0
0.2
0.4
0.6
0.8
1.0
1.2
0 20 40 60 80 100 120 140 160
Mas
s ra
tio
Time (min)
Chips Pellets
290oC
100oC
The initial mc of pellets was 5.5%. The initial m.c. of wood chips 11.1%.
Not much difference in mass loss ratio

14 Managed by UT-Battelle for the U.S. Department of Energy ORNL – Bioenergy Resource and Engineering Systems 14
A. Pelletized
and torrefied
A. Torrefied and
pelletized
Testing hydrophobicity
Immersing pellets in water for two hours

15 Managed by UT-Battelle for the U.S. Department of Energy ORNL – Bioenergy Resource and Engineering Systems
Physical properties of pellets made from
untreated and torrefied wood chips Pellet type Diam.
(mm)
MC
(%)
Particle
density
(g/cm3)
Bulk
density
(kg/m3)
High
heat
value
(MJ/kg)
Durability
DURAL
(% )
Pellets made from untreated wood chips
6.43 6.7 1.16 674 18.82 80.7
Pellets made from torrefied woodchips mixed with 7% wheat flour binder , Temp 260oC
6.47 8.6 1.21 - - 85.0
Regular white pellets torrefied at 260oC
6.28 1.9 1.14 614 21.08 63.9
Regular white pellets torrefied at 280oC
6.12 1.7 1.04 579 21.97 62.0
Regular white pellets torrfied at 300oC
6.12 1.5 0.96 510 23.00 60.9

16 Managed by UT-Battelle for the U.S. Department of Energy ORNL – Bioenergy Resource and Engineering Systems
0
20
40
60
80
100
120
140
Drying Grinding Torrefaction Pelltization
Ene
rgy
inp
ut
(MJ)
Pelletize before torrefaction (Pathway I) Pelletize after torrefaction (Pathway II)
Pelletize before torrefaction
(Pathway A)
Pelletize after torrefaction
(Pathway BI)
m.c. in
(%)
m.c. out
(%)
Dry matter
loss
(%)
m.c. in
(%)
m.c. out
(%)
Dry matter
loss
(%)
Drying 45 15 0 45 2 2
Grinding 15 10 1 2 2 2
Pelletization 12 10 2 12 10 10
Torrefaction 10 2 27 5 2 27
Overall mass and energy balance
Calculations for 100 kg
Pathway I 3.55 MJ/kg
Pathway II 2.62 MJ/kg

17 Managed by UT-Battelle for the U.S. Department of Energy ORNL – Bioenergy Resource and Engineering Systems
Conclusions
• Hydrophobic pelletized pellets can be made from regular pellets (good)
• Energy input to make torrefied pellets from regular pellets is higher than pellets made from torrefied wood chips (not so good).
• The rates of torrefaction (mass loss vs. time) for the two pathways are similar (good)
• Untreated ground wood particles are larger than ground torrefied wood chips (good)
• Torrefied pellets made from regular pellets have a lower density and durability (not so good)

18 Managed by UT-Battelle for the U.S. Department of Energy ORNL – Bioenergy Resource and Engineering Systems
Acknowledgement
• The Thermochemical Platform of the Bioenergy Technology Office (BETO), EERE, DOE supported this project.

19 Managed by UT-Battelle for the U.S. Department of Energy ORNL – Bioenergy Resource and Engineering Systems
Carbon, Hydrogen, Cellulose, Hemicellulose and Lignin content of wood chips
and pellets. Numbers in the parenthesis are (+/-) ranges of at least triplicated
tests
Biomass and
treatments
Carbon
(%)
Hydrogen
(%)
Glucan
(Celulose)
(%)
Hemicellu-
loses
(%)
Acid insoluble
lignin/resi-due
Untreated wood
chips 45.7 6.4
43.2
(0.8)
21.5
(0.4)
31.7
(0.4)
Untreated wood
pellets 46.5 6.4
43.8
(0.6)
21.1
(0.3)
32.3
(0.7)
Pelletised and
then torrefied 51.2 6.0
49.1
(1.0)
6.2
(0.2)
43.3
(0.2)
Torrefied and
then pelletixed 49.5 5.4
54.7
(1.4)
5.2
(0.2)
38.3
(0.5)

20 Managed by UT-Battelle for the U.S. Department of Energy ORNL – Bioenergy Resource and Engineering Systems
20
0.60
0.70
0.80
0.90
1.00
1.10
1.20
1.30
0 50 100 150 200 250 300
Pe
lle
t d
en
sit
y
(g/cm
3)
Die temperature (oC)
Density vs. compacting die temperature
Tooyserkani et al. 2012. Torrefaction and pelletization od steam treatment of soft wood species. Applied Energy
(under review).