evaluation of thermoelectric generators by i–v …...evaluation of thermoelectric generators by...
TRANSCRIPT

Evaluation of Thermoelectric Generators by I–V Curves
GAO MIN,1,2 TANUJ SINGH,1 JORGE GARCIA-CANADAS,1
and ROBERT ELLOR1
1.—School of Engineering, Cardiff University, Cardiff CF24 3AA, UK. 2.—e-mail: [email protected]
A recent theoretical study proposes a new way to evaluate thermoelectricdevices by measuring two I–V curves—one obtained under a constant tem-perature difference and the other obtained for a constant thermal input. Wereport an experimental demonstration of the feasibility of this novel tech-nique. A measurement system was designed and constructed, which enablesboth types of I–V curves to be obtained automatically. The effective ZT valuesof a thermoelectric module were determined using this system and comparedwith those measured by an impedance spectroscopy technique. The resultsconfirm the validity of the proposed technique. In addition, the capability ofmeasuring ZT under a large temperature difference was also investigated.The results show that the ZTs obtained for a large temperature difference aresignificantly smaller than those for a small temperature difference, providinginsights into the design and operation of thermoelectric modules in realisticapplications.
Key words: Thermoelectric, I–V curves, maximum power output
INTRODUCTION
The performance of a thermoelectric generator isprimarily evaluated by its maximum power outputand conversion efficiency for given operating condi-tions.1–4 This is usually achieved by measuring thepower output delivered to a load under a giventemperature difference. Traditionally, the measure-ment is carried out using a variable resistor as theload. By manually changing the value of the loadresistance and measuring the corresponding voltageacross it at steady state, the maximum poweroutput, together with the optimal load resistance,can be determined by plotting the power output as afunction of the load resistance. A problem associatedwith this technique is to maintain a constanttemperature difference across the thermoelectricgenerator when the load resistance is altered,resulting in a lengthy and inaccurate measurement.The change in the temperature difference isinevitable because of inherent thermoelectric pro-cesses described in a recent publication.5 Thisproblem was resolved owing to advances in modern
electronic measurement systems. Such a systemuses an ‘‘electronic load’’ and can scan a full I–Vsweep within a period of less than a second, whilethe temperature difference across a thermoelectricgenerator takes a much longer time to change due tothe large thermal mass and specific heat. Since theI–V curves of thermoelectric devices exhibit a linearrelationship, the maximum power output and cor-responding optimal load resistance (also the inter-nal resistance of thermoelectric generator) can beconveniently determined from I–V curves. The useof I–V curves for evaluation of thermoelectricdevices is becoming a preferred method.
In addition to maximum power output and con-version efficiency, another important parameter forthermoelectric generators is the effective ZT, whichprovides insights into the fabrication quality andrealistic operation performance of thermoelectricgenerators. The effective ZT can be determined byusing the Harman method.6 However, such valuescorrespond to small temperature differences. Theeffective ZT values under large temperature differ-ences can be estimated by measuring the maximumtemperature difference when operating in thePeltier mode3 or measuring the change in temper-ature difference between open-circuit and short-(Received June 16, 2015; accepted October 24, 2015;
published online November 19, 2015)
Journal of ELECTRONIC MATERIALS, Vol. 45, No. 3, 2016
DOI: 10.1007/s11664-015-4180-z� 2015 The Author(s). This article is published with open access at Springerlink.com
1700

circuit when operating in the Seebeck mode.7 In thispaper, we report a new method to determine theeffective ZT of thermoelectric generators based onI–V curves. This method stems from a study of usingI–V curves to determine the maximum poweroutput of a thermoelectric generator. It wasobserved that the slopes of I–V curves are differentwhen the scan rate is varied significantly. A theo-retical work8 in an attempt to explain this observa-tion has led to a proposal of a new method forcharacterisation of thermoelectric materials anddevices based on two I–V curves—one obtained fora constant temperature difference and the otherobtained for a constant thermal input. This workfocuses on the experimental validation of the pro-posed technique using a thermoelectric module. Theeffective ZT is obtained from I–V curves based onthe principle reported in8 and compared with thevalues obtained using an impedance spectroscopytechnique.9–11 A unique capability of this techniquefor measuring ZT under a large temperature differ-ence is demonstrated by comparison with the ZTobtained under a small temperature difference forthe same mean temperatures.
PRINCIPLE OF MEASUREMENT
Figure 1 shows a schematic diagram for measur-ing the I–V of a thermoelectric module. It has beenshown8 that, for a thermoelectric module operatingunder a constant temperature difference, DTo, thevoltage and current relationship of the module canbe expressed as,
V ¼ 2aNDTo � RiI ð1Þ
where, V is the voltage across the load resistance, Ithe current flow through the circuit, a the Seebeckcoefficient of thermoelectric materials, N, the num-ber of thermocouples in a module, Ri the internalresistance of the module and DTo the temperaturedifference across the module.
When the thermoelectric module is operatedunder a given thermal input with the initial tem-perature difference being DTo at open circuit condi-tion, the voltage and current relationship is givenby8:
V ¼ 2aNDTo
1 þ ZTM�RiI ð2Þ
where, Z is the thermoelectric figure-of-merit andTM is a parameter related to the hot side temper-ature, TH, and the cold side temperature, TC, by8:
TM ¼ ð1 þ 2sÞTH þ TC
2ð1 þ sÞ2ð3Þ
where, s ¼ RL=Ri is the ratio of the load resistanceto the internal resistance. Clearly, an I–V curvedescribed by Eq. 1 can be obtained by performing afast scan, whilst an I–V curve described by Eq. 2 canbe obtained by performing a very slow scan. It hasbeen shown theoretically8 that the short circuit
current for a thermoelectric module operating undera constant temperature difference, ID, can be deter-mined by the intercept with the current axis fromthe I–V curve of Eq. 1. The short-circuit current fora thermoelectric module operating with a giventhermal input, IQ, can be determined by the inter-cept with the current axis from the I–V curve ofEq. 2. Consequently, the effective ZT of thermoelec-tric modules can be calculated using8:
ZT ¼ IDIQ
� 1 ð4Þ
In addition, the maximum power output and con-version efficiency of a thermoelectric module oper-ating for a given thermal input can be calculatedusing8:
Pmax ¼ 1
4IQ � Vo ð5Þ
g ¼ 1
4
DTo
T1 � IQ
ID
� �ð6Þ
Equations 5 and 6 provide a convenient method tocharacterize the performance of thermoelectricmodules operating under a given thermal input.Currently, there is no clearly defined measurementtechnique for evaluation of thermoelectric modulesunder a given thermal input. This method haspotential to provide a standard evaluation tech-nique in this aspect.
EXPERIMENTAL SETUP
Figure 2a shows a schematic diagram of themeasurement system, where the thermoelectricmodule is sandwiched between a heater and acooling plate. To ensure minimum heat loss fromthe heater to the surrounding atmosphere, a heaterthat has the same area as that of the module isemployed. The sandwiched part is placed in avacuum chamber and covered with a heat shield to
Fig. 1. Schematic diagram for measuring I–V of thermoelectricmodule.
Evaluation of Thermoelectric Generators by I–V Curves 1701
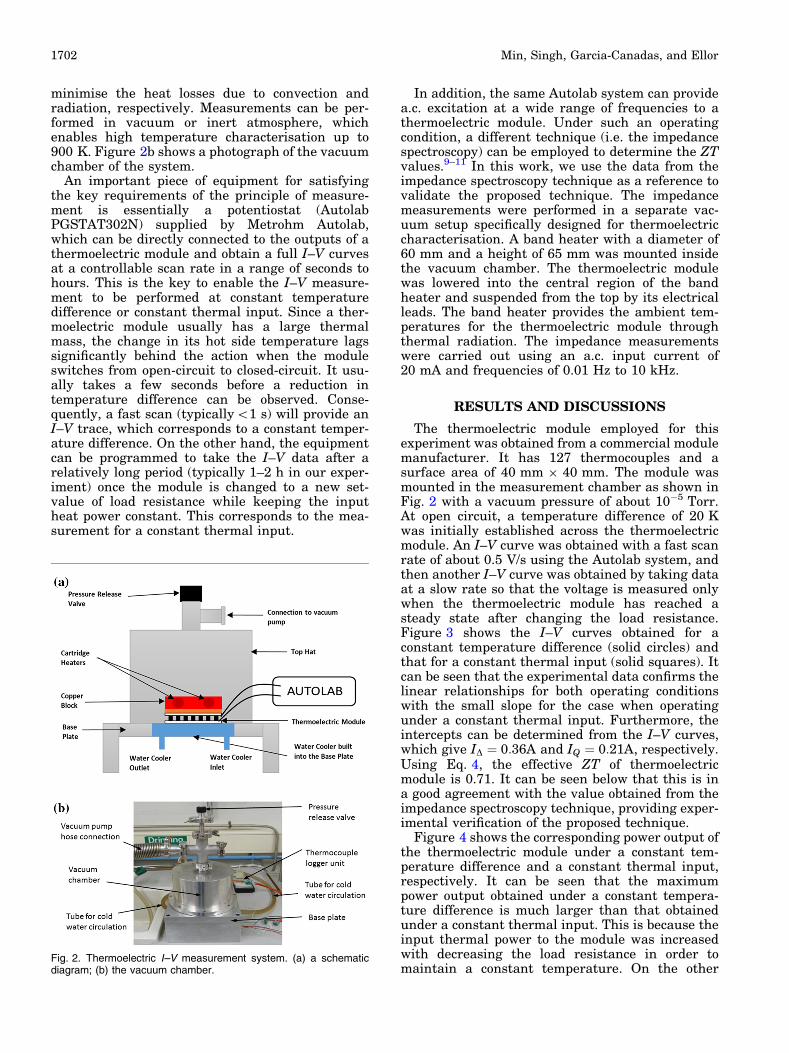
minimise the heat losses due to convection andradiation, respectively. Measurements can be per-formed in vacuum or inert atmosphere, whichenables high temperature characterisation up to900 K. Figure 2b shows a photograph of the vacuumchamber of the system.
An important piece of equipment for satisfyingthe key requirements of the principle of measure-ment is essentially a potentiostat (AutolabPGSTAT302N) supplied by Metrohm Autolab,which can be directly connected to the outputs of athermoelectric module and obtain a full I–V curvesat a controllable scan rate in a range of seconds tohours. This is the key to enable the I–V measure-ment to be performed at constant temperaturedifference or constant thermal input. Since a ther-moelectric module usually has a large thermalmass, the change in its hot side temperature lagssignificantly behind the action when the moduleswitches from open-circuit to closed-circuit. It usu-ally takes a few seconds before a reduction intemperature difference can be observed. Conse-quently, a fast scan (typically<1 s) will provide anI–V trace, which corresponds to a constant temper-ature difference. On the other hand, the equipmentcan be programmed to take the I–V data after arelatively long period (typically 1–2 h in our exper-iment) once the module is changed to a new set-value of load resistance while keeping the inputheat power constant. This corresponds to the mea-surement for a constant thermal input.
In addition, the same Autolab system can providea.c. excitation at a wide range of frequencies to athermoelectric module. Under such an operatingcondition, a different technique (i.e. the impedancespectroscopy) can be employed to determine the ZTvalues.9–11 In this work, we use the data from theimpedance spectroscopy technique as a reference tovalidate the proposed technique. The impedancemeasurements were performed in a separate vac-uum setup specifically designed for thermoelectriccharacterisation. A band heater with a diameter of60 mm and a height of 65 mm was mounted insidethe vacuum chamber. The thermoelectric modulewas lowered into the central region of the bandheater and suspended from the top by its electricalleads. The band heater provides the ambient tem-peratures for the thermoelectric module throughthermal radiation. The impedance measurementswere carried out using an a.c. input current of20 mA and frequencies of 0.01 Hz to 10 kHz.
RESULTS AND DISCUSSIONS
The thermoelectric module employed for thisexperiment was obtained from a commercial modulemanufacturer. It has 127 thermocouples and asurface area of 40 mm 9 40 mm. The module wasmounted in the measurement chamber as shown inFig. 2 with a vacuum pressure of about 10�5 Torr.At open circuit, a temperature difference of 20 Kwas initially established across the thermoelectricmodule. An I–V curve was obtained with a fast scanrate of about 0.5 V/s using the Autolab system, andthen another I–V curve was obtained by taking dataat a slow rate so that the voltage is measured onlywhen the thermoelectric module has reached asteady state after changing the load resistance.Figure 3 shows the I–V curves obtained for aconstant temperature difference (solid circles) andthat for a constant thermal input (solid squares). Itcan be seen that the experimental data confirms thelinear relationships for both operating conditionswith the small slope for the case when operatingunder a constant thermal input. Furthermore, theintercepts can be determined from the I–V curves,which give ID ¼ 0:36A and IQ ¼ 0:21A, respectively.Using Eq. 4, the effective ZT of thermoelectricmodule is 0.71. It can be seen below that this is ina good agreement with the value obtained from theimpedance spectroscopy technique, providing exper-imental verification of the proposed technique.
Figure 4 shows the corresponding power output ofthe thermoelectric module under a constant tem-perature difference and a constant thermal input,respectively. It can be seen that the maximumpower output obtained under a constant tempera-ture difference is much larger than that obtainedunder a constant thermal input. This is because theinput thermal power to the module was increasedwith decreasing the load resistance in order tomaintain a constant temperature. On the other
Fig. 2. Thermoelectric I–V measurement system. (a) a schematicdiagram; (b) the vacuum chamber.
Min, Singh, Garcia-Canadas, and Ellor1702
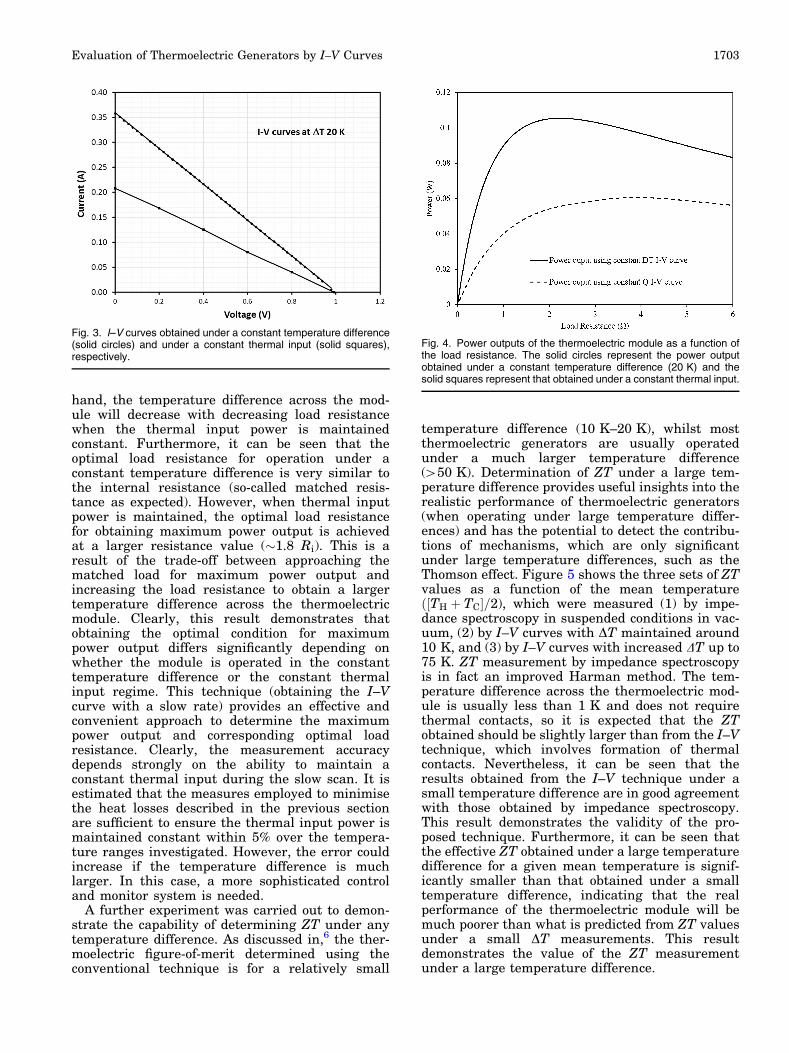
hand, the temperature difference across the mod-ule will decrease with decreasing load resistancewhen the thermal input power is maintainedconstant. Furthermore, it can be seen that theoptimal load resistance for operation under aconstant temperature difference is very similar tothe internal resistance (so-called matched resis-tance as expected). However, when thermal inputpower is maintained, the optimal load resistancefor obtaining maximum power output is achievedat a larger resistance value (�1.8 Ri). This is aresult of the trade-off between approaching thematched load for maximum power output andincreasing the load resistance to obtain a largertemperature difference across the thermoelectricmodule. Clearly, this result demonstrates thatobtaining the optimal condition for maximumpower output differs significantly depending onwhether the module is operated in the constanttemperature difference or the constant thermalinput regime. This technique (obtaining the I–Vcurve with a slow rate) provides an effective andconvenient approach to determine the maximumpower output and corresponding optimal loadresistance. Clearly, the measurement accuracydepends strongly on the ability to maintain aconstant thermal input during the slow scan. It isestimated that the measures employed to minimisethe heat losses described in the previous sectionare sufficient to ensure the thermal input power ismaintained constant within 5% over the tempera-ture ranges investigated. However, the error couldincrease if the temperature difference is muchlarger. In this case, a more sophisticated controland monitor system is needed.
A further experiment was carried out to demon-strate the capability of determining ZT under anytemperature difference. As discussed in,6 the ther-moelectric figure-of-merit determined using theconventional technique is for a relatively small
temperature difference (10 K–20 K), whilst mostthermoelectric generators are usually operatedunder a much larger temperature difference(>50 K). Determination of ZT under a large tem-perature difference provides useful insights into therealistic performance of thermoelectric generators(when operating under large temperature differ-ences) and has the potential to detect the contribu-tions of mechanisms, which are only significantunder large temperature differences, such as theThomson effect. Figure 5 shows the three sets of ZTvalues as a function of the mean temperatureð½TH þ TC�=2), which were measured (1) by impe-dance spectroscopy in suspended conditions in vac-uum, (2) by I–V curves with DT maintained around10 K, and (3) by I–V curves with increased DT up to75 K. ZT measurement by impedance spectroscopyis in fact an improved Harman method. The tem-perature difference across the thermoelectric mod-ule is usually less than 1 K and does not requirethermal contacts, so it is expected that the ZTobtained should be slightly larger than from the I–Vtechnique, which involves formation of thermalcontacts. Nevertheless, it can be seen that theresults obtained from the I–V technique under asmall temperature difference are in good agreementwith those obtained by impedance spectroscopy.This result demonstrates the validity of the pro-posed technique. Furthermore, it can be seen thatthe effective ZT obtained under a large temperaturedifference for a given mean temperature is signif-icantly smaller than that obtained under a smalltemperature difference, indicating that the realperformance of the thermoelectric module will bemuch poorer than what is predicted from ZT valuesunder a small DT measurements. This resultdemonstrates the value of the ZT measurementunder a large temperature difference.
Fig. 3. I–V curves obtained under a constant temperature difference(solid circles) and under a constant thermal input (solid squares),respectively.
Fig. 4. Power outputs of the thermoelectric module as a function ofthe load resistance. The solid circles represent the power outputobtained under a constant temperature difference (20 K) and thesolid squares represent that obtained under a constant thermal input.
Evaluation of Thermoelectric Generators by I–V Curves 1703

It is to be noted that the conversion efficiency ofthe thermoelectric module can be determined usingEq. 6. However, in this work, we only focus oninvestigating the ZTs. This is because the referencedata can be readily obtained using the impedancespectroscopy technique, whilst obtaining reliablereference data for the conversion efficiency is morechallenging.
CONCLUSIONS
A measurement system for thermoelectric char-acterisation based on I–V curves has been developedwhich enables the I–V curves of thermoelectricmodules to be obtained at a controllable scan ratefrom less than a second to a few hours. Theexperimental results obtained using this equipmentconfirms the validity of a recently proposed ther-moelectric measurement technique.8 This noveltechnique provides an effective method to determinethe maximum power output and optimal loadresistance of thermoelectric generators operating
under a constant thermal input. The technique canalso be used to determine the effective ZT ofthermoelectric devices with a capability of ZTmeasurement under large temperature differences.This has important implications in understandingthe realistic performances of thermoelectric gener-ators in actual operating conditions. The resultsfrom a commercial module show that the ZTobtained under a large temperature difference issignificantly smaller than that under a small tem-perature difference.
ACKNOWLEDGEMENTS
The work is financially supported by the Euro-pean Commission Research Fund for Coal and Steelprogramme under the Therelexpro project (RPS-PR-12068) and Globasol project (309194).
OPEN ACCESS
This article is distributed under the terms of theCreative Commons Attribution 4.0 International Li-cense (http://creativecommons.org/licenses/by/4.0/),which permits unrestricted use, distribution, andreproduction in any medium, provided you give ap-propriate credit to the original author(s) and thesource, provide a link to the Creative Commons li-cense, and indicate if changes were made.
REFERENCES
1. A.F. Ioffe, Semiconductor Thermoelements and Thermo-electric Cooling (London: Infosearch, 1957), p. 37.
2. D.M. Rowe and C.M. Bhandari, Modern Thermoelectrics(London: Holt, Rinehart and Winston, 1983), p. 24.
3. D.M. Rowe, CRC Handbook of Thermoelectrics (London:CRC Press, 1996), p. 479.
4. S. Beeby and N. White, Energy Harvesting for AutonomousSystems (Norwood: Artech House, 2010), p. 135.
5. G. Min and NMd Yatim, J. Phys. D Appl. Phys. 41, 222001(2008).
6. T.C. Harman, J. Appl. Phys. 29, 1373 (1958).7. G. Min, J. Electro. Mater. 39, 1782 (2010).8. G. Min, Meas. Sci. Technol. 25, 085009 (2014).9. A.D. Downey, T.P. Hogan, and B. Cook, Rev. Sci. Instrum.
78, 93904 (2007).10. A. De Marchi and V. Giaretto, Rev. Sci. Instrum. 82, 104904
(2011).11. J. Garcıa-Canadas and G. Min, J. Appl. Phys. 116, 174510
(2014).
Fig. 5. ZT values as a function of the mean temperature of thethermoelectric module. The solid circles represent ZT values ob-tained by impedance spectroscopy; the solid triangles represent ZTvalues measured by I–V curves with DT maintained around 10 K;and the solid diamonds represent ZT values determined from I–Vcurves with increased DT up to 75 K.
Min, Singh, Garcia-Canadas, and Ellor1704