evaluation of the use of radiosonde humidity data to ...centaur.reading.ac.uk/817/4/128_ftp.pdfit is...
TRANSCRIPT

Evaluation of the use of radiosonde humidity data to predict the occurrence of persistent contrails Article
Published Version
Radel, G. and Shine, K. P. (2007) Evaluation of the use of radiosonde humidity data to predict the occurrence of persistent contrails. Quarterly Journal of the Royal Meteorological Society, 133 (627). pp. 14131423. ISSN 1477870X doi: https://doi.org/10.1002/qj.128 Available at http://centaur.reading.ac.uk/817/
It is advisable to refer to the publisher’s version if you intend to cite from the work. Published version at: http://www3.interscience.wiley.com/journal/113388514/home
To link to this article DOI: http://dx.doi.org/10.1002/qj.128
Publisher: Royal Meteorological Society
All outputs in CentAUR are protected by Intellectual Property Rights law, including copyright law. Copyright and IPR is retained by the creators or other copyright holders. Terms and conditions for use of this material are defined in the End User Agreement .
www.reading.ac.uk/centaur

CentAUR
Central Archive at the University of Reading
Reading’s research outputs online

QUARTERLY JOURNAL OF THE ROYAL METEOROLOGICAL SOCIETYQ. J. R. Meteorol. Soc. 133: 1413–1423 (2007)Published online in Wiley InterScience(www.interscience.wiley.com) DOI: 10.1002/qj.128
Evaluation of the use of radiosonde humidity data to predictthe occurrence of persistent contrails
G. Radel* and K. P. ShineDepartment of Meteorology, University of Reading, Reading, UK
ABSTRACT: Regular visual observations of persistent contrails over Reading, UK, have been used to evaluate radiosondemeasurements of temperature and humidity defining cold ice-supersaturated atmospheric regions which are assumed tobe a necessary condition for persistent condensation trails (contrails) to form. Results show a good correlation betweenobservations and predictions using data from Larkhill, 63 km from Reading. A statistical analysis of this result and theforecasts using data from four additional UK radiosonde stations are presented. The horizontal extent of supersaturatedlayers could be inferred from this to be several hundred kilometres. The necessity of bias corrections to radiosondehumidity measurements is discussed and an analysis of measured ice-supersaturated atmospheric layers in the troposphereis presented. It is found that ice supersaturation is more likely to occur in winter than in summer, with frequencies of17.3% and 9.4%, respectively, which is mostly due to the layers being thicker in winter than in summer. The most probableheight for them to occur is about 10 km. Copyright 2007 Royal Meteorological Society
KEY WORDS ice supersaturation; contrails; radiosondes
Received 7 February 2007; Revised 6 June 2007; Accepted 8 June 2007
1. Introduction
Air traffic is expected to increase strongly in the nearfuture and is therefore an area of major concern regard-ing its influence on global climate (e.g. IPCC, 1999;Marquart et al., 2003; Sausen et al., 2005). Apart fromemitting greenhouse gases, persistent condensation trails(contrails) that form in the wake of an aircraft may influ-ence the radiation budget of the Earth in a similar wayas natural cirrus. In other words, they are presumed tocause a net warming as absorbed and reflected infraredradiation from the ground and lower troposphere out-weighs the effect of more sunlight being reflected tospace (e.g. Meerkotter et al., 1998; Minnis et al., 1999;Myhre and Stordal, 2001). Contrails form when hot andmoist exhaust mixes with cold, drier ambient air; thisincreases the relative humidity (RH) and can lead towater saturation if the ambient air is below a criticaltemperature Tc. The critical temperature is given by theSchmidt–Appleman criterion (Schmidt, 1941; Appleman,1953; Schumann, 1996) and depends on the ambientpressure, humidity and temperature as well as enginedependent parameters. If the air is subsaturated withrespect to ice, contrails persist for no more than a fewminutes. However, in the case of supersaturation withrespect to ice (RHice > 100%) contrails can persist forup to several hours and can eventually even evolve into
* Correspondence to: G. Radel, Department of Meteorology, Universityof Reading, Earley Gate, P.O. Box 243, Reading, RG6 6BB, UK.E-mail: [email protected]
extended cirrus clouds that are indistinguishable from nat-ural cirrus (Minnis et al., 1998; Schroder et al., 2000;Mannstein and Schumann, 2005; Stubenrauch and Schu-mann, 2005).
In order to better understand and quantify the effect ofpersistent contrails on climate, a thorough understandingof the atmospheric conditions required for them to formis essential. Humidity and temperature measurementsfrom radiosonde ascents may be a very valuable toolfor this purpose, since they provide relatively regularmeasurements in space as well as in time with highvertical resolution. This is especially true for Europe andNorth America, regions where most air traffic currentlyoccurs. The aim of this paper is to use humidity andtemperature data from some of the routine radiosondelaunch sites located in the UK and predict the presenceof cold ice-supersaturated regions, which are a necessarycondition for persistent contrails. These predictions arethen compared with visual observations of contrailswhich have been made at the same time over Reading,southeast England.
Visual observations of contrails have been used pre-viously to try to evaluate the atmospheric conditionsnecessary for them to form and persist. For instance,Jensen et al. (1998) measured temperature and humidityin situ during the aircraft campaign SUCCESS (SubsonicAircraft: Contrail and Cloud Effects Special Study) andcompared contrail formation and lifetimes observed fromthe same aircraft. However, less than 20 cases of persis-tent contrails were observed. Minnis et al. (2003) com-pared regular visual observations of persistent contrails
Copyright 2007 Royal Meteorological Society

1414 G. RADEL AND K. P. SHINE
over the US with temperatures and humidities measuredby radiosondes on a monthly basis.
Several other studies have been performed evaluatingdifferent contrail production forecasts using radiosondemeasurements and visual observations (e.g. Moss, 1999;Walters et al., 2000; Jackson et al., 2001) but these didnot address the question of persistence of contrails. Stue-fer et al. (2005) compared contrail observations overAlaska with uncorrected radiosonde measurements andperformed a statistical analysis comparing different fore-casts, also addressing the lifetime of contrails. However,the question of ice supersaturation was not discussedexplicitly.
Spichtinger et al. (2003) identified and analysed ice-supersaturated atmospheric layers using radiosonde dataover Lindenberg, Germany, and compared them to satel-lite observations. The present study shows direct co-locations of a high number of radiosonde measurementsof such cold supersaturated atmospheric layers withvisual observations of persistent contrails.
In the first part of this paper the selection of theradiosonde measurements and their treatment will beexplained. An analysis of identified ice-supersaturatedregions will be presented using a large amount of datafrom 2000–2006, showing properties such as frequencyand height of occurrence, seasonal cycle and averagethickness. In Section 3 the database of contrail obser-vations will be introduced and observations will be com-pared with the predictions of cold supersaturated atmo-spheric regions from different radiosonde stations via2 × 2 contingency tables. The results of a statistical anal-ysis of these comparisons will be presented in Section 4.
2. Analysis of radiosonde humidity measurements
2.1. Selection and correction of radiosonde profiles
Radiosonde measurements of temperature and humidityfrom different stations in the UK have been analysed inorder to detect atmospheric layers susceptible for the for-mation of persistent contrails. The main aim is to estab-lish a correlation between visual observation of persistentcontrails over Reading (0.97 °W, 51.45 °N) with actualatmospheric conditions. Larkhill (1.80 °W, 51.20 °N) wasselected as the main radiosonde launch site, since at adistance of 63 km it is the closest site to Reading, provid-ing data on a regular daily basis. Moreover, as Larkhillis located to the southwest of Reading, the actual dis-tance between the radiosondes and the observations isoften smaller due to prevailing south-westerly winds.For comparison, four additional UK stations were cho-sen which have all been providing regular data since atleast 2000. This way, the temporal and spatial variationsof atmospheric conditions could also be studied. Thesestations are: Herstmonceux (1.80 °W, 51.20 °N), Notting-ham (1.20 °W, 53.00 °N), Camborne (5.32 °W, 50.22 °N)and Lerwick (1.18 °W, 60.13 °N).
Vaisala radiosondes of type RS80 have been usedworldwide over a long time period and their measurement
accuracy and systematic biases have been studied by sev-eral groups (Wang et al., 2002; Miloshevich et al., 2004).The type of radiosondes used in the UK over this periodwere Vaisala RS80-H sondes with most sites switchingto the new type RS92 during the years 2005 or 2006,depending on the site. In the case of Larkhill, sondes ofboth types were used concurrently during the second partof 2005. Profiles of temperature and humidity recordedby the UK Met Office radiosondes were provided bythe British Atmospheric Data Centre (BADC) prior toMay 2005, and thereafter by the European Centre forMedium-Range Weather Forecasts (ECMWF) from theGlobal Telecommunication System (GTS) record. Onlyprofiles with continuous temperature and humidity mea-surements up to at least 150 hPa were used.
Relative humidity measurements in the upper tropo-sphere are particularly challenging due to low temper-atures and low water vapour concentrations. Differenttypes of sondes are subject to different error sources, suchas time lag, chemical contamination, sensor ageing, etc.,resulting in the need for different bias correction methods.For instance, while the more widely-used Vaisala RS80-A sondes show a large temperature-dependent error, thisproblem is much smaller for the RS80-H sondes usedin the UK (Miloshevich et al., 2001, Wang et al., 2002).The main error source for these sondes is the chemi-cal contamination originating from non-water moleculesemitted from the packaging material that occupy bindingsites in the sensor polymer, leading to a dry bias in theRH measurement. Wang et al. (2002) developed a cor-rection method for this and other measurement biases(including temperature dependence, ground check andsensor ageing) which has been applied to the RS80-Hdata used in this study. The synoptic data used for theground check correction was again obtained from BADCand, since May 2005, from ECMWF. The availability ofthese ground data at the radiosonde launch sites has beenanother criterion for the choice of the radiosonde sites.It was found that the correction that has to be applied tothe RH measurements was small, i.e. lower in magnitudethan −5% for temperatures down to about −30 °C andup to about −15% at −70 °C. Relative corrections arelargest for high relative humidities.
RS92 radiosondes were introduced by Vaisala in 2003and much less information of their measurement accuracyexists in current literature. In a recent study by Vomelet al. (2007), however, a bias correction procedure wasdeveloped and has been adopted here. The calibrationprocedure has been improved significantly with respectto previous sonde types, but the RS92 sondes no longerhave a radiation shield, making measurements susceptibleto solar heating. This causes an important potential errorsource for this study since daytime measurements areessential in order to be comparable to visual observationsof contrails. The radiation bias correction factors havebeen derived by Vomel et al. (2006) by comparingradiosonde measurements with a reference cryogenicfrost-point hygrometer with radiosonde launches aroundnoon in the tropics, at a very small solar zenith angle.
Copyright 2007 Royal Meteorological Society Q. J. R. Meteorol. Soc. 133: 1413–1423 (2007)DOI: 10.1002/qj

PREDICTING PERSISTENT CONTRAILS USING RADIOSONDE DATA 1415
The dependence of the radiation bias on this angle isunknown.
In the present study, therefore, this correction has onlybeen applied to radiosonde launches between 10:00 and14:00 GMT. This means that daytime measurements atlarger solar zenith angles are probably under-corrected,but the development of a solar angle dependent correc-tion for the radiation bias is beyond the scope of thispaper. Figure 1 depicts the average size of the correc-tions applied to the RS80-H and RS92 radiosondes. Forthe latter, day- and night-time corrections are shown sep-arately, stressing the importance of the radiation bias. Theaverage correction applied to night-time measurements isof the same order of magnitude (about −2% to −4%) asthat for RS80-H sondes for temperatures down to about−50 °C. For colder temperatures, it however changes signand becomes as large as +13% at −70 °C. In daytime,when the radiation bias is the dominant source of error,corrections are much larger for the RS92 sonde than forthe RS80-H sondes: they start at about −10% at 0 °C andrise to a maximum of about −40% at −60 °C.
A residual uncertainty of the radiosonde humidity mea-surements are due to sensor icing, which is particularlyimportant for the RS80-H sensors. When passing througha super-cooled area or cloud the sensor may ice over;
-70
-60
-50
T (
°C) -40
-30
-20
-10
0-0.5 -0.4
RS80-HRS92 dayRS92 night
-0.3 -0.2
(RH−RHcor)/RHcor
-0.1 0.0 0.1
Figure 1. Average correction applied to radiosonde relative humiditymeasurements as a function of ambient temperature. Full line: RS80-Hsondes, dashed line: daytime RS92 sondes, dash-dotted line: night-time
RS92 sondes.
hence supersaturation may be measured for the rest of theascent of the sonde even if the ambient air is not supersat-urated with respect to the ice. The occurrence of this icingeffect is difficult to spot for each profile. In order to havehumidity profiles which are as clean as possible, we there-fore restrict analyses of cold ice-supersaturated regions(CISSR) to the troposphere. For the quantitative analy-ses of Sections 2.2 and 2.3, we exclude all profiles thatshow very high RH measurements (RH > 90%) abovethe tropopause. The tropopause pressures are taken froma climatology based on the ECMWF re-analysis, ERA-40, with Simmons and Gibson (2000) providing monthlymean values for 5° × 5° grid points.
2.2. Vertical resolution of radiosonde data
The standard resolution data from the UK Met Officeradiosonde stations provide temperature and humiditymeasurements at a set of 20 standard pressure levelsand at a varying number of intermediate levels. For thefive stations studied here, the average vertical resolutionin the upper troposphere is about 300 m or 30 hPa,with slightly better values for Larkhill of 250 m and20 hPa. In addition to these so-called standard resolutionradiosonde data, the UK Met Office provides a set ofhigh resolution radiosonde data with a vertical resolutionof about 50 m in the upper troposphere. This dataset wasused to cross-check results, obtained with the standarddata set. Figure 2 shows the distributions of the widthof supersaturated atmospheric layers for the example ofHerstmonceux, averaged over all data from 2002 for thetwo different resolutions for both summer (June–August)and winter (December–February). The two datasets givesimilar results for widths larger than about 150 m, butthe high resolution set shows, in addition, a large peakof thinner layers with an average width of about 50 m.The overall mean of the width distributions are 42 hPaor 1.0 km for the standard data, and 31 hPa or 0.7 kmfor the high resolution set. The additional thin layersresolved only in the high resolution data change thenumber of supersaturated layers per atmospheric profile.Taking into account only profiles with at least one suchlayer, the average number of layers is 1.1 for the standarddataset compared to 2.3 for the high resolution data; ifall profiles are considered, the corresponding numbers
1.000
0.100
0.010
0.001
1.000
0.100
0.010
0.001100
summer winter
std. resolutionhigh resolution
Layer width (m)
1000 1000010 100Layer width (m)
1000 1000010
Figure 2. Distributions of the width of the supersaturated cold atmospheric layers derived from standard (full lines) and high resolution (dashedlines) data for summer (left) and winter (right).
Copyright 2007 Royal Meteorological Society Q. J. R. Meteorol. Soc. 133: 1413–1423 (2007)DOI: 10.1002/qj

1416 G. RADEL AND K. P. SHINE
are 0.4 and 0.5. The additional thin layers mostly belongto profiles that already have a supersaturated layer. Theaverage height of the layers (base, centre and top) are,however, very similar for the standard and high resolutiondata, except perhaps in winter when a small differencefor the mean centre and top heights can be observed. Thehigh resolution data show slightly lower top and centreheights.
Table I summarizes these results. In the following, thestandard dataset will be used due to its larger availability(high resolution data is, for example, not available forLarkhill), which means that the following results arevalid for layers with a width of ≥150 m. Results thatdo not concern the width of the layers, in particularthose concerning temporal variations, are only marginallyaffected.
2.3. Analysis of cold ice-supersatured regions
The existence of CISSRs, which predominantly occur inthe troposphere, is assumed to be a condition for persis-tent contrails to form (e.g. Schumann, 1996). The aim istherefore to determine the frequency, time and height atwhich CISSRs form, and to determine the thickness orhorizontal extension of atmospheric layers formed underthese conditions. The criteria we impose to identify CIS-SRs are: the layer must be supersaturated with respect toice, i.e. RHice > 100% and the temperature must be lowerthan a critical temperature Tc, assumed to be −40 °C. Inprinciple, the value of Tc depends also on the propulsionefficiency of the aircraft engine, e.g. a higher propulsionefficiency leads to contrails being produced at higher tem-peratures (Schumann, 2000). The chosen value for Tc isbroadly consistent with a propulsion efficiency of 0.3,a typical value for modern aircraft flying in the uppertroposphere (e.g. Schumann, 1996). RHice has been deter-mined using the saturation water vapour formula (Son-ntag, 1994).
Initially, the probability of finding RHice > 100%within a given height range was computed as the ratio ofmeasurements per profile that show supersaturation andthe total number of measurements. The probability of an
ice-supersaturated region averaged over all stations, yearsand heights from 6 km to the tropopause is 21.3%, with apronounced seasonal difference of 22.5% in winter (Octo-ber–March) and 18.1% in summer (April–September).This agrees with observations of lower relative humidi-ties in the upper troposphere in mid latitudes in summer(e.g. Soden and Lanzante, 1996; Stephens and Wittmayer,1998; Kley and Phillips, 2000). These values can be com-pared to results of Vaughan et al. (2006) who identifiedice-supersaturated atmospheric regions over Aberystwyth(4.06 °W, 52.4 °N) using corrected Vaisala RS80-A son-des. In the height interval 6–8 km, we find probabilitiesof 14.8% and 19.1% in summer and winter, respectively,compared to 8.2% and 18.2% in Vaughan et al. (2006).For the 8–10 km region the corresponding values are20.6% and 25% in our analysis, compared to 13.2% and24.3% in Vaughan et al. (2006). For winter these resultsagree very well with those of Vaughan et al. (2006); forsummer they are about 50% higher.
Including the condition that the ambient air tempera-ture is less than −40 °C gives the probability of a CISSRanywhere between 6 km height and the tropopause. Theseprobabilities are shown in Figure 3 as a function of thecalendar month averaged over the five stations for years2000–2006 (right and left, full bold lines). To show thelocal and temporal variations, data for the five differentstations averaged over all years (left) and for the sevenyears averaged over all stations (right) are also shown.The mean values of the probability that a CISSR willoccur are 13.7% overall with 9.4% in summer and 17.3%in winter, showing a pronounced seasonal cycle whichis clear both collectively and at each station individu-ally (Figure 3). Minnis et al. (2003) used visual obser-vations of persistent contrails over the US to derivecontrail frequencies of 15.2% (1993–1994) and 12.4%(1998–1999). These absolute values cannot be compareddirectly to the frequencies of CISSRs; however, the sea-sonal cycles of persistent contrails found by Minnis et al.(2003) and of CISSRs found in this study are in verygood agreement regarding the position and amplitudes ofminimum (summer) and maximum (winter).
Table I. Comparison of characteristics of cold supersaturated atmospheric layers derived from standard and high resolutionradiosonde data from Herstmonceux.
Standard resolution High resolution
All Winter Summer All Winter Summer
Width (mean) (hPa) 42 59 31 31 37 25(km) 1.0 1.3 0.8 0.7 0.8 0.7
Base height (mean) (hPa) 322 352 295 320 353 291(km) 8.6 7.9 9.3 8.7 7.9 9.4
Centre height (mean) (hPa) 301 323 279 304 334 279(km) 9.1 8.6 9.7 9.0 8.3 9.7
Top height (mean) (hPa) 280 294 263 289 315 266(km) 9.6 9.2 10.1 9.4 8.7 10.1
Number of layers per profile 0.4 0.5Number of layers per profile if >0 1.1 2.3
Copyright 2007 Royal Meteorological Society Q. J. R. Meteorol. Soc. 133: 1413–1423 (2007)DOI: 10.1002/qj

PREDICTING PERSISTENT CONTRAILS USING RADIOSONDE DATA 1417
Figure 3. Probability of a CISSR in the troposphere as a function of the calendar month, averaged over the years 2000–2006 for each separateradiosonde station (left) and averaged over all stations showing each individual year (right). The probability is computed as the number of
radiosonde measurements with T < −40 °C and RHice >100% divided by all measurements between 6–16 km height.
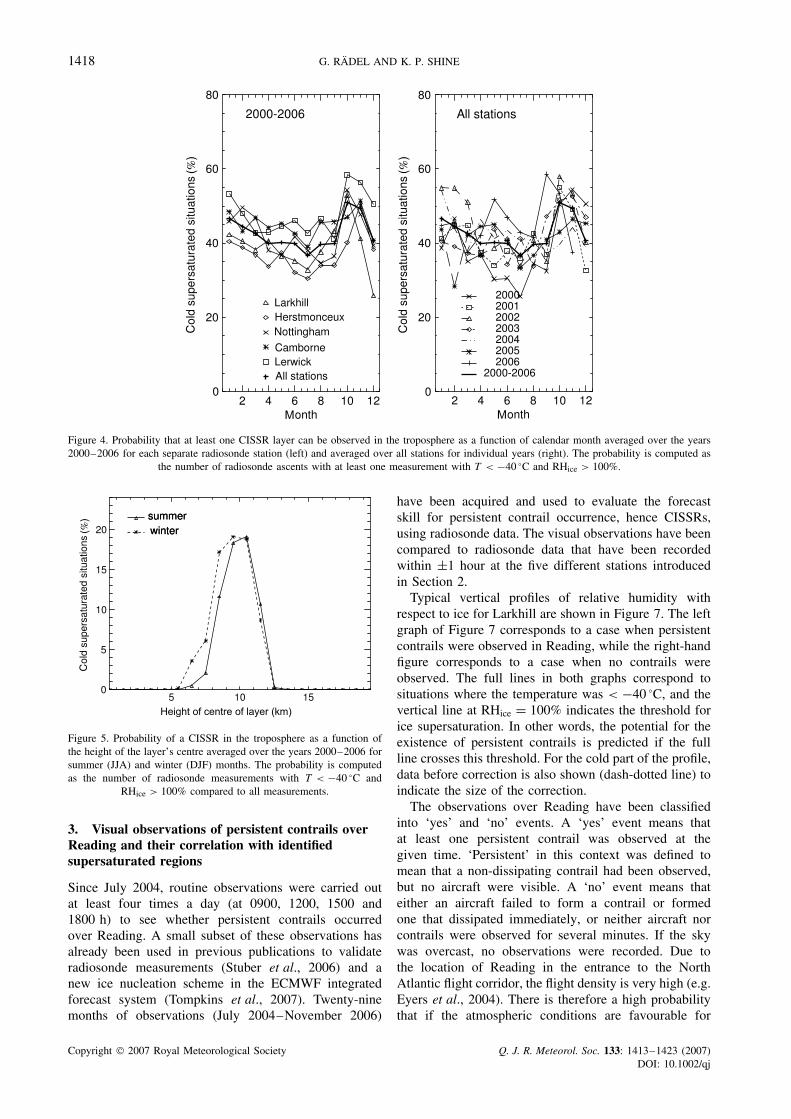
Figure 4 shows the percentage of atmospheric profileswith at least one CISSR, as a function of month.The average percentage of profiles with at least onesupersaturated atmospheric layer colder than −40 °C is42.5%. The individual values for the years 2001–2005lie between 40.5% and 45.1%. The year 2000 showsthe lowest value at 38.9% which is due to very lowvalues at Herstmonceux, which also shows similarly lowvalues for 2001. The reason for these low values areunder investigation. On the other hand, 2006 shows thehighest average value of 46.0%. This is perhaps due tothe fact that by 2006, Vaisala RS92 radiosondes wereused at all stations and correction methods were notyet fully optimized. This assumption is supported bylooking in detail at the 2005 results: those stations thatalready had the new type of sondes in use for somemonths also show larger values for these periods. Aweaker seasonal cycle is visible here which is consistentwith results obtained by Spichtinger et al. (2003) for astudy of occurrence of supersaturation over Lindenberg,Germany, in 2000/2001. Spichtinger et al. (2003) findaverage values for the occurrence of supersaturation,calculated similarly to the above values for the five UKstations, of about 28%. This is not in contradiction withthe results of this study, which for 2000 vary between17% and 48% depending on the station.
Figure 4 (left) shows that the seasonal cycle is broadlysimilar at each individual station. From this relativelysmall sample of years, we are not able to assert whethersome differences between the stations, e.g. the relativelyhigh probabilities measured at Lerwick, are significant.
Figure 5 shows the probability distribution of a CISSRas a function of the height of its centre for both summer
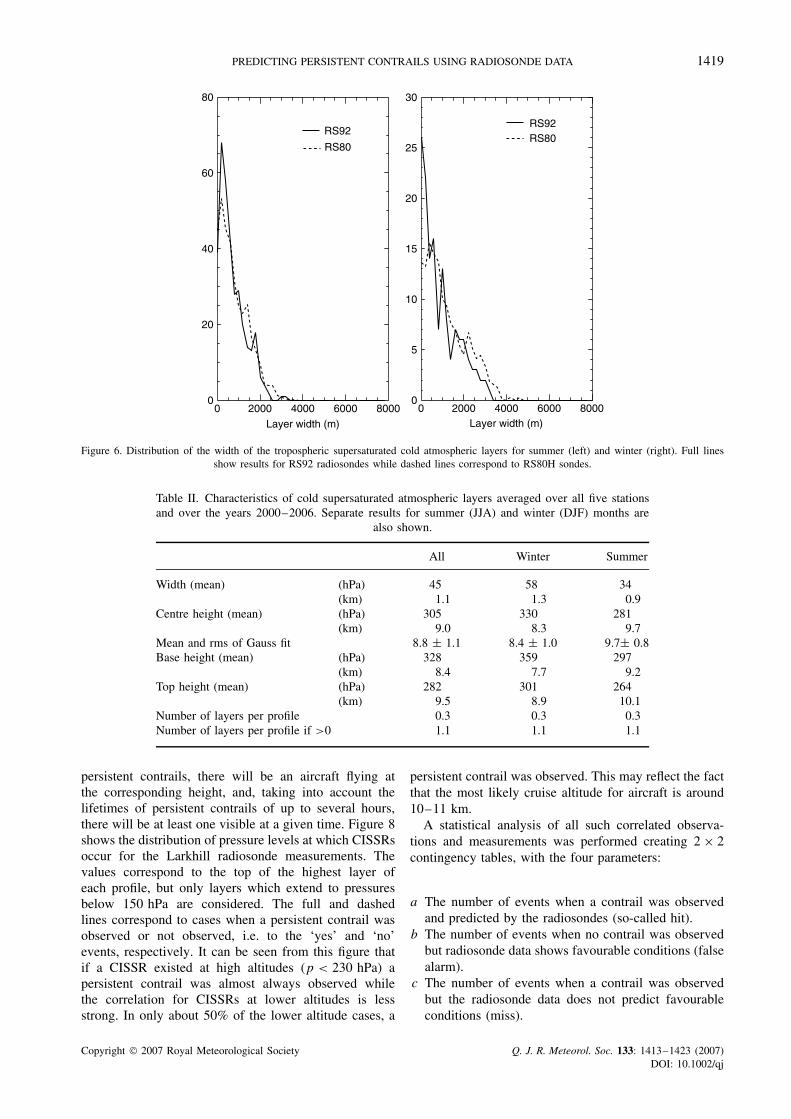
(June–August) and winter (December–February). Themost likely values are slightly higher for summer(∼10 km) than for winter (∼9.5 km). The probabilities ofcold supersaturated layers at altitudes smaller than 10 kmare larger in winter than in summer, while at higher alti-tudes the probabilities for summer and winter are verysimilar, leading to a wider distribution in winter. This isalso shown in Figure 6 where the distributions of layerwidths are shown separately for summer and winter forRS80-H and RS92 radiosondes, respectively. The RS92sondes seem to be able to measure smaller layer widths,an effect especially pronounced in winter. This may beattributed to the facts that RS92 sondes are less affectedby sensor icing and that the RS80-H sondes have a slowerresponse than RS92 sondes.
Table II displays the results on the mean heightsand widths of cold supersaturated atmospheric layers.For all these results the standard resolution data hasbeen used; they therefore refer to layers of a minimumwidth of ∼150 m. The thicker layers during winterexplain the difference between Figures 3 and 4. Althoughthe probability of at least one CISSR occurring isapproximately constant throughout the year, the layersthat occur during winter are thicker and there is ahigher probability of encountering one at any givenheight.
The characteristics of CISSRs given in this table werealso computed for RS80-H and RS92 measurements sep-arately. As mentioned above, CISSRs measured by RS92sondes are thinner on average by about 20%, but theiraverage altitudes are the same within ∼5% for all casesconsidered in Table II.
Copyright 2007 Royal Meteorological Society Q. J. R. Meteorol. Soc. 133: 1413–1423 (2007)DOI: 10.1002/qj
1418 G. RADEL AND K. P. SHINE
Figure 4. Probability that at least one CISSR layer can be observed in the troposphere as a function of calendar month averaged over the years2000–2006 for each separate radiosonde station (left) and averaged over all stations for individual years (right). The probability is computed as
the number of radiosonde ascents with at least one measurement with T < −40 °C and RHice > 100%.
Figure 5. Probability of a CISSR in the troposphere as a function ofthe height of the layer’s centre averaged over the years 2000–2006 forsummer (JJA) and winter (DJF) months. The probability is computedas the number of radiosonde measurements with T < −40 °C and
RHice > 100% compared to all measurements.
3. Visual observations of persistent contrails overReading and their correlation with identifiedsupersaturated regions
Since July 2004, routine observations were carried outat least four times a day (at 0900, 1200, 1500 and1800 h) to see whether persistent contrails occurredover Reading. A small subset of these observations hasalready been used in previous publications to validateradiosonde measurements (Stuber et al., 2006) and anew ice nucleation scheme in the ECMWF integratedforecast system (Tompkins et al., 2007). Twenty-ninemonths of observations (July 2004–November 2006)
have been acquired and used to evaluate the forecastskill for persistent contrail occurrence, hence CISSRs,using radiosonde data. The visual observations have beencompared to radiosonde data that have been recordedwithin ±1 hour at the five different stations introducedin Section 2.
Typical vertical profiles of relative humidity withrespect to ice for Larkhill are shown in Figure 7. The leftgraph of Figure 7 corresponds to a case when persistentcontrails were observed in Reading, while the right-handfigure corresponds to a case when no contrails wereobserved. The full lines in both graphs correspond tosituations where the temperature was < −40 °C, and thevertical line at RHice = 100% indicates the threshold forice supersaturation. In other words, the potential for theexistence of persistent contrails is predicted if the fullline crosses this threshold. For the cold part of the profile,data before correction is also shown (dash-dotted line) toindicate the size of the correction.
The observations over Reading have been classifiedinto ‘yes’ and ‘no’ events. A ‘yes’ event means thatat least one persistent contrail was observed at thegiven time. ‘Persistent’ in this context was defined tomean that a non-dissipating contrail had been observed,but no aircraft were visible. A ‘no’ event means thateither an aircraft failed to form a contrail or formedone that dissipated immediately, or neither aircraft norcontrails were observed for several minutes. If the skywas overcast, no observations were recorded. Due tothe location of Reading in the entrance to the NorthAtlantic flight corridor, the flight density is very high (e.g.Eyers et al., 2004). There is therefore a high probabilitythat if the atmospheric conditions are favourable for
Copyright 2007 Royal Meteorological Society Q. J. R. Meteorol. Soc. 133: 1413–1423 (2007)DOI: 10.1002/qj
PREDICTING PERSISTENT CONTRAILS USING RADIOSONDE DATA 1419
80 30
25
20
15
10
5
0
60
40
20
00 2000 4000
Layer width (m)
6000 8000 0 2000 4000Layer width (m)
6000 8000
RS92RS80
RS92
RS80
Figure 6. Distribution of the width of the tropospheric supersaturated cold atmospheric layers for summer (left) and winter (right). Full linesshow results for RS92 radiosondes while dashed lines correspond to RS80H sondes.
Table II. Characteristics of cold supersaturated atmospheric layers averaged over all five stationsand over the years 2000–2006. Separate results for summer (JJA) and winter (DJF) months are
also shown.
All Winter Summer
Width (mean) (hPa) 45 58 34(km) 1.1 1.3 0.9
Centre height (mean) (hPa) 305 330 281(km) 9.0 8.3 9.7
Mean and rms of Gauss fit 8.8 ± 1.1 8.4 ± 1.0 9.7± 0.8Base height (mean) (hPa) 328 359 297
(km) 8.4 7.7 9.2Top height (mean) (hPa) 282 301 264
(km) 9.5 8.9 10.1Number of layers per profile 0.3 0.3 0.3Number of layers per profile if >0 1.1 1.1 1.1
persistent contrails, there will be an aircraft flying atthe corresponding height, and, taking into account thelifetimes of persistent contrails of up to several hours,there will be at least one visible at a given time. Figure 8shows the distribution of pressure levels at which CISSRsoccur for the Larkhill radiosonde measurements. Thevalues correspond to the top of the highest layer ofeach profile, but only layers which extend to pressuresbelow 150 hPa are considered. The full and dashedlines correspond to cases when a persistent contrail wasobserved or not observed, i.e. to the ‘yes’ and ‘no’events, respectively. It can be seen from this figure thatif a CISSR existed at high altitudes (p < 230 hPa) apersistent contrail was almost always observed whilethe correlation for CISSRs at lower altitudes is lessstrong. In only about 50% of the lower altitude cases, a
persistent contrail was observed. This may reflect the factthat the most likely cruise altitude for aircraft is around10–11 km.
A statistical analysis of all such correlated observa-tions and measurements was performed creating 2 × 2contingency tables, with the four parameters:
a The number of events when a contrail was observedand predicted by the radiosondes (so-called hit).
b The number of events when no contrail was observedbut radiosonde data shows favourable conditions (falsealarm).
c The number of events when a contrail was observedbut the radiosonde data does not predict favourableconditions (miss).
Copyright 2007 Royal Meteorological Society Q. J. R. Meteorol. Soc. 133: 1413–1423 (2007)DOI: 10.1002/qj

1420 G. RADEL AND K. P. SHINE
Larkhill 20060124 11h0
200
400
600
800
Rel
ativ
e hu
mid
ity (
hPa)
1000
0
200
400
600
800
Rel
ativ
e hu
mid
ity (
hPa)
10000 50 100
RHice (%)
150 0 50 100
RHice (%)
150
Larkhill 20051117 11h
Figure 7. Vertical profiles of relative humidities with respect to ice measured at Larkhill. Left (right): Case when (no) persistent contrails havebeen observed over Reading. Full line: Corrected data at T < −40 °C; dashed line: corrected data at T > −40 °C; dash-dotted line: uncorrected
data at T < −40 °C.
10
persistent contrailobservednot observed
8
6
4
2
0100 200
Pressure (hPa)
300 400
Figure 8. Pressure levels at which CISSRs are measured at Larkhillusing radiosonde data (July 2004–November 2006). Full line: apersistent contrail was observed over Reading within ±1 hour of the
measurement; dashed line: no persistent contrail was observed.
d The number of events when no contrail was observedand the radiosonde data shows no favourable condi-tions (no-hit).
Obviously a good prediction implies that a and d arelarge while b and c should be small. The results of thecomparison between visual observation and radiosondedata are shown in Table III. The best correlation betweenforecast and observation is expected for Larkhill forecastsusing corrected radiosonde data. In fact, ‘yes’ events arepredicted correctly in 71% and ‘no’ events in 83% ofthe cases. Reasons for misses as well as false alarmsare the distance of 63 km and time difference of up to
1 hour between observation and measurement as well asmeasurement errors, e.g. insufficient dry-bias correctionor over-correction for misses and false alarms. A misscould also occur because a thin CISSR (Figure 2) ispresent but not represented in the standard resolutiondata. False alarms may be further explained by the factthat no aircraft at the correct height of the CISSR hadbeen passing over Reading at the time of observation orby the icing effect which would lead to an overestimate ofcontrail predictions. For stations close to the observationpoint, however, this latter effect should be less importantbecause icing predominately occurs when many low ormedium level clouds are present. Since it is not possibleto observe contrails in overcast situations, the sampleof radiosonde measurements which are compared to theobservations should be less affected by sensor icing thanthe full sample. For comparison, tables are shown forall five stations and results for uncorrected radiosondedata are given in brackets (Table III). One observesqualitatively, that the larger the distance of the stationfrom Reading the smaller is their predictive power, andpredictions are better for corrected than for uncorrecteddata, as is expected.
4. Statistical analysis of results
For a quantitative analysis of the 2 × 2 contingencytables, a possible method is to compute the statisticalsignificance of these results using the Odds ratio O,proposed by Stephenson (2000) for use in meteorologicalapplications. The Odds ratio is defined as O = (a ×d)/(b × c). It is 1 for the null hypothesis, i.e. nocorrelation between observation and prediction, >1 in
Copyright 2007 Royal Meteorological Society Q. J. R. Meteorol. Soc. 133: 1413–1423 (2007)DOI: 10.1002/qj

PREDICTING PERSISTENT CONTRAILS USING RADIOSONDE DATA 1421
case of a positive correlation, and <1 for a negativecorrelation. The natural logarithm of O is asymptoticallyGaussian distributed, with a standard deviation of σ =√
1/a + 1/b + 1/c + 1/d .Results for the Odds ratio O, ln O and its standard
deviation and PO , the probability to observe a config-uration for the contingency table that is more extremethan that observed on a purely random basis, are givenin Table IV. For comparison, other measures of the skillof the predictions are also shown: the probability accord-ing to Fisher’s exact test PFET (Fisher, 1922), the hit-rate(HR) a/(a + c), the false-alarm-rate (FAR) b/(b + d)
and the Peirce skill score (Peirce, 1884) which is equal toHR–FAR and is also referred to as the Hanssen–Kuipersscore (Hanssen and Kuipers, 1965). This score gives ameasure of the accuracy for both ‘yes’ and ‘no’ events.It ranges from −1 to 1, and is 0 for a random forecast. It is−1 if neither ‘yes’ nor ‘no’ events are predicted correctly.
For Larkhill, which at 63 km is the closest to Reading,a clear match between observations and predictions isobserved. The probabilities PO and PFET, which canbe seen as the probability of the measured contingencytable being obtained by a random forecast, i.e. a forecastwithout any skill, are extremely small. The HR at 70.9%is much higher than the FAR at 17.3% and the Peirceskill score is clearly greater than zero, indicating a skillto correctly predict ‘yes’ and ‘no’ events.
On the other hand, a forecast for persistent contrailsover Reading derived from radiosonde data at Lerwick
has no skill at all. Hit- and false-alarm-rates are aboutequal, probabilities PO and PFET are close to 100% andthe Peirce skill score is around 0, indicating no fore-casting skill. Given the distance of Lerwick to Readingof ∼1000 km, this is unsurprising. The other three sta-tions, at distances of 111–332 km, show intermediateresults. In fact, the results for forecasts from Herstmon-ceux and Nottingham are quite similar and still demon-strate skill, with HRs of more than two times larger thanthe FARs and a Peirce skill score of 0.34 and 0.38, respec-tively. This indicates that the average horizontal extentof supersaturated atmospheric areas is of the order ofradius 100–200 km. Even the forecasts from Camborne,which involve more than 300 km distance, still seem tohave a small skill. This may be helped by the two factsthat the measurements at Camborne are always made at11:00 GMT, i.e. 1 hour before observation time at Read-ing, and secondly predominant conditions at Cambourneare that of south-westerly winds. These indications forthe horizontal extent of CISSRs are in good agreementwith values derived from the MOZAIC (Measurement ofOzone by Airbus In-service aircraft) campaign (Gierensand Spichtinger, 2000), where average distances flownin ice-supersaturated regions by commercial aircraft weremeasured to be 150 km on average, with a standard devi-ation of 250 km. Values of several thousand kilometreshave even been recorded.
The same quantities using uncorrected radiosonde datafor the predictions are also shown in Table IV in the
Table III. 2 × 2 contingency tables for observations of persistent contrails over Reading compared to forecasts derived fromradiosonde data at different stations. Corrected radiosonde data has been used. Values in brackets were derived from uncorrected
data.
Larkhill Herstmonceux Nottingham Camborne Lerwick(1.80 °W, 51.20 °N) (0.32 °E, 50.89 °N) (1.20 °W, 53.00 °N) (5.32 °W, 50.22 °N) (1.18 °W, 60.13 °N)
Predicted Predicted Predicted Predicted Predicted
Observed Yes No Yes No Yes No Yes No Yes No
Yes 78 (30) 32 (79) 56 (20) 47 (94) 63 (11) 29 (80) 66 (17) 46 (92) 48 (24) 42 (63)No 22 (5) 105 (119) 19 (8) 72 (101) 29 (8) 67 (110) 45 (8) 77 (110) 55 (26) 41 (70)
Table IV. Statistical analysis of the 2 × 2 contingency tables derived using corrected radiosonde data for the predictions. Foreach station, the second line of values shows results using uncorrected radiosonde data.
Station (distance to Reading) O ln O ± σ PO (%) PFET (%) HR (%) FAR (%) Peirce S.S.
Larkhill (63 km) 11.6 2.45 ± 0.32 10−13 10−15 70.9 17.3 0.549.0 2.20 ± 0.50 0.001 5 × 10⁻⁵ 27.5 4.0 0.24
Herstmonceux (111 km) 4.5 1.50 ± 0.33 4 × 10⁻⁴ 2 × 10⁻⁴ 54.4 20.9 0.342.7 0.99 ± 0.44 0.025 0.026 17.5 7.3 0.10
Nottingham (168 km) 5.0 1.61 ± 0.32 4 × 10⁻⁵ 2 × 10⁻⁵ 68.5 30.2 0.383.1 1.13 ± 0.49 0.020 0.023 12.1 6.8 0.05
Camborne (332 km) 2.5 0.92 ± 0.27 0.06 0.1 58.9 36.9 0.222.5 0.92 ± 0.45 0.041 0.054 15.6 6.8 0.09
Lerwick (969 km) 0.8 −0.22 ± 0.30 100 66 53.3 57.3 −0.041.3 0.26 ± 0.33 43 100 27.6 27.1 0.00
Copyright 2007 Royal Meteorological Society Q. J. R. Meteorol. Soc. 133: 1413–1423 (2007)DOI: 10.1002/qj

1422 G. RADEL AND K. P. SHINE
second line for each station. It is clearly seen that theseforecasts are worse for all the stations (except Lerwick).However, these four forecasts also have a predictive skillas the HR is clearly larger than the FAR. However, dueto the dry-bias of the sondes they are both very low,and persistent contrails are only correctly predicted in27.5% of the cases for Larkhill and in less than 20%from the other stations. This clearly shows that the dry-bias corrections of the data are necessary.
The corrections for the two different types of radioson-des used, RS80-H and RS92, can also be checked. Thestatistical analyses from the contingency tables for thetwo types of sondes are shown for all five stations inTables V and VI, respectively. Comparing the resultsfor the two different datasets it can be seen that forLarkhill all the skill scores are quite similar for the newand old sondes, but the forecasts based on RS92 son-des are slightly better, as the ratio of HRs and FARsis more favourable. However, there may be a systematicdifference with the new sondes being drier even after cor-rection, since both are lower than for the RS80-H sondeswhich would be consistent with sensor icing affectingRS80-H sondes more than RS92 sondes.
The largest difference between the datasets is observedfor Herstmonceux. Here the RS92 sondes clearly pro-vide much poorer quality forecasts, while the Odds ratioand Peirce skill score of the other three stations arevery different for RS80-H and RS92. This may indicatethat the new sondes at Herstmonceux were not optimallyused. However, both hit- and false-alarm rates at Cam-borne, Nottingham and Lerwick are lower for RS92 thanfor RS80-H, indicating that the RS92 sondes are sys-tematically drier. Another abnormality in the data fromHerstmonceux appears when summer and winter fore-casts are checked individually. Comparing observationsand forecasts from both sonde types together for themonths of June–August and December–February, theresults are not significantly different, with the exception
of the Herstmonceux forecasts. These show much lessskill in winter than in summer, the Odds ratios being 1.9and 13.8, respectively.
5. Conclusions
It has been shown by comparison to visual observationof persistent contrails that radiosonde humidity mea-surements can be used to measure ice supersaturationin the upper troposphere, once corrected appropriatelyfor biases of different origins depending on the type ofradiosonde. For the more recently introduced RS92 son-des, corrections available in the literature cover only a rel-atively small range of conditions, and could be improved.
Cold ice-supersaturated atmospheric regions could beidentified and verified by visual observations of persis-tent contrails over Reading, establishing at the same timethe necessary condition of the existence of CISSRs forpersistent contrails to exist. It has been found that theprobability of an ice supersaturation somewhere in thetroposphere shows a strong seasonal cycle with a mini-mum in summer and a maximum in winter. On the otherhand, the probability of finding at least one supersaturatedlayer is approximately constant over the year, indicatingthat in winter the CISSRs are thicker than in summer,which has also been found directly from the observa-tions. The distribution of layer-widths has a strong peakat about 50 m and an underlying broader distribution withvalues up to several kilometres. Furthermore, a statisti-cal analysis of the correlation between the occurrenceof ice-supersaturated regions measured by radiosondes(launched at Larkhill and four other sites in the UK) andvisual observations of persistent contrails over Readinghas been performed, and horizontal extents of the CIS-SRs of diameters of several hundreds of kilometres couldbe inferred.
It is still common for models not to allow for icesupersaturation, and they are therefore not suitable for
Table V. Statistical analysis of the 2 × 2 contingency tables derived using radiosondes of type RS80-H.
Station (distance to Reading) O ln O ± σ PO (%) PFET (%) HR (%) FAR (%) Peirce S.S.
Larkhill (63 km) 10.4 2.34 ± 0.50 3 × 10⁻⁴ 8 × 10⁻⁵ 78.0 25.5 0.53Herstmonceux (111 km) 11.0 2.34 ± 0.62 0.02 0.007 78.6 25.0 0.54Nottingham (168 km) 5.7 1.74 ± 0.42 0.003 0.004 76.4 36.4 0.40Camborne (332 km) 3.3 1.19 ± 0.35 0.07 0.03 67.2 47.3 0.20Lerwick (969 km) 0.7 −0.36 ± 0.43 100 40 63.3 72.0 −0.09
Table VI. Statistical analysis of the 2 × 2 contingency tables for forecast using only radiosondes of type RS92.
Station (distance to Reading) O ln O ± σ PO (%) PFET (%) HR (%) FAR (%) Peirce S.S.
Larkhill (63 km) 14.9 2.70 ± 0.44 8 × 10⁻⁸ 5 × 10⁻¹⁰ 66.7 11.8 0.55Herstmonceux (111 km) 3.6 1.28 ± 0.41 0.18 0.16 45.3 18.6 0.27Nottingham (168 km) 4.7 1.55 ± 0.50 0.19 0.23 56.8 22.0 0.35Camborne (332 km) 3.3 1.19 ± 0.46 0.97 0.015 46.7 20.8 0.26Lerwick (969 km) 1.0 0.0 ± 0.44 2.2 100 41.5 41.3 0.002
Copyright 2007 Royal Meteorological Society Q. J. R. Meteorol. Soc. 133: 1413–1423 (2007)DOI: 10.1002/qj

PREDICTING PERSISTENT CONTRAILS USING RADIOSONDE DATA 1423
direct prediction of the occurrence of persistent con-trails. Efforts have been made to correct this shortcom-ing in a number of climate and numerical weather pre-diction (NWP) models (e.g. Wilson and Ballard, 1999;Lohmann and Karcher, 2002; Gettelman and Kinnison,2006; Tompkins et al., 2007). This work indicates that ifcorrected radiosonde data are used in conjunction withdata on the distribution of aircraft, the frequency ofoccurrence of contrails could be quite reliably deduced,subsequently allowing an evaluation of these new super-saturation schemes.
Acknowledgements
This work was performed under the ‘Low EmissionsEffects Aircraft’ project funded by Airbus and the UKDepartment of Trade and Industry. It was completedunder the European Commission’s Framework 6 Inte-grated Project QUANTIFY. We thank the British Atmo-spheric Data Centre and A. Tompkins (ECMWF) forproviding the radiosonde and synoptic data, N. Stuber, P.Spichtinger and K. Gierens for fruitful discussions andtwo referees for important comments.
References
Appleman H. 1953. The formation of exhaust contrails by jet aircraft.Bull. Am. Meteorol. Soc. 34: 14–20.
Eyers C, Norman P, Middel J, Plohr M, Michot S, Atkinson K, ChristouR. 2004. AERO2k Global Aviation Emissions Inventories for 2002and 2025. QinetiQ Ltd., Tech. Rep. QINETIQ/04/01113.
Fisher R. 1922. On the interpretation of χ2 from contingency tables,and the calculation of P . J. Roy. Statist. Soc. 85: 87–94.
Gettelman A, Kinnison DE. 2006. The global impact of supersaturationin a coupled chemistry-climate model. Atmos. Chem. Phys. 7:1629–1643.
Gierens K, Spichtinger P. 2000. On the size distribution of ice-supersaturated regions in the upper troposphere and lowermoststratosphere. Ann. Geophys. 18: 499–504.
Hanssen A, Kuipers W. 1965. On the relationship between thefrequency of rain and various meteorological parameters. Meded.Verh. 81: 2–15.
IPCC. 1999. Aviation and the Global Atmosphere – A Special Reportof IPCC Working Groups I and III. Penner JE (ed). IPCC, Tech. rep.
Jackson A, Newton B, Hahn D, Bussey A. 2001. Statistical contrailforecasting. J. Appl. Meteorol. 40: 269–279.
Jensen EJ, Toon OB, Kinne S, Sachse GW, Anderson BE, ChanKR, Twohy CH, Gandrud B, Heymsfield AJ, Miake-Lye RC.1998. Environmental conditions required for contrail formation andpersistence. J. Geophys. Res. 103: 3929–3936.
Kley DJR III, Phillips EC. 2000. SPARC assessment of uppertropospheric and stratospheric water vapour. SPARC, Tech. Rep. 2.
Lohmann U, Karcher B. 2002. First interactive simulationsof cirrus cloud formed by homogeneous freezing in theECHAM general circulation model. J. Geophys. Res. 107: AC-810.1029/2001JD000,767.
Mannstein H, Schumann U. 2005. Aircraft induced contrail cirrus overEurope. Meteorol. Zeitschrift 14: 549–554.
Marquart S, Ponater M, Mager F, Sausen R. 2003. Future developmentof contrail cover, optical depth and radiative forcing: Impacts ofincreasing air traffic and climate change. J. Climate 16: 2890–2904.
Meerkotter R, Schumann U, Doelling D, Minnis P, Nakajima T,Tsushima Y. 1998. Radiative forcing by contrails. Ann. Geophys.17: 1080–1094.
Miloshevich LM, Vomel H, Paukkunen A, Heymsfield A,Oltmanns SJ. 2001. Characterization and correction of relativehumidity measurements from Vaisala RS80-A radiosondes at coldtemperatures. J. Atmos. Ocean. Tech. 18: 35–156.
Miloshevich LM, Paukkunen A, Vomel H, Oltmanns SJ. 2004.Development and validation of a time-lag correction for Vaisalaradiosonde humidity measurements. J. Atmos. Ocean. Tech. 21:1305–1327.
Minnis P, Young D, Garber D, Nguyen L, Smith W Jr., PalikondaR. 1998. Transformation of contrails into cirrus during SUCCESS.Geophys. Res. Lett. 25: 1157–1160.
Minnis P, Schumann U, Doelling D, Gierens K, Fahey D. 1999. Globaldistribution of contrail radiative forcing. Geophys. Res. Lett. 26:1853–1856.
Minnis P, Ayers J, Nordeen M, Weaver S. 2003. Contrail frequencyover the United States from surface observations. J. Climate 16:3447–3462.
Moss SJ. 1999. The testing and verification of contrail forecasts usingpilot observations from aircraft. Meteorol. Appl. 6: 193–200.
Myhre G, Stordal F. 2001. On the tradeoff of the solar and thermalinfrared impact of contrails. Geophys. Res. Lett. 28: 3119–3122.
Peirce C. 1884. The numerical measure of the success of predictions.Science 12: 453–545.
Sausen R, Isaksen I, Grewe V, Hauglustaine D, Lee DS, Myhre G,Kohler MO, Pitari G, Schumann M, Stordal F, Zerefos C. 2005.Aviation radiative forcing in 2000: An update on IPCC (1999).Meteorol. Zeitschrift 14: 555–561.
Schmidt E. 1941. Die Entstehung von Eisnebel aus den Auspuffgasenvon Flugmotoren. Schriften der Deutschen Akademie der Luftfahrt-forschung 44: 1–15.
Schroder F, Karcher B, Duroure C, Strom J, Petzold A, Gayet J-F,Strauss B, Wendling P, Borrmann S. 2000. On the transition ofcontrails into cirrus clouds. J. Atmos. Sci. 57: 464–480.
Schumann U. 1996.. On conditions for contrail formation from aircraftexhausts. Meteorol. Zeitschrift 5: 4–25.
Schumann U. 2000. Influence of propulsion efficiency on contrailformation. Aerosp. Sci. Technol. 4: 391–401.
Simmons AJ, Gibson JK. 2000. The ERA-40 project plan. Era-40Project Report Series, Tech. Rep. 1.
Soden BJ, Lanzante RJ. 1996. An assessment of satellite and radiosondeclimatologies of upper-tropospheric water vapor. J. Climate 9:235–1250.
Sonntag D. 1994. Advancements in the field of hygrometry. Meteorol.Zeitschrift 3: 51–66.
Spichtinger P, Gierens K, Leiterer U, Dier H. 2003. Ice supersaturationin the tropopause region over Lindenberg, Germany. Meteorol.Zeitschrift 12: 143–156.
Stephens GL, Jackson DL, Wittmeyer I. 1998. Global observations ofupper-tropospheric water vapor derived from TOVS radiance data.J. Climate 9: 305–326.
Stephenson DB. 2000. Use of the ‘odds ratio’ for diagnosing forecastskill. Weather and Forecasting 15: 221–232.
Stubenrauch CJ, Schumann U. 2005. Impact of air trafficon cirrus coverage. Geophys. Res. Lett. 32: L14813 DOI:10.1029/2005GL022,707.
Stuber N, Forster P, Radel G, Shine K. 2006. The importance of thediurnal and annual cycle of air traffic for contrail radiative forcing.Nature 441: 864–867.
Stuefer M, Meng X, Wendler G. 2005. MM5 Contrail Forecasting inAlaska. Mon. Weather Rev. 133: 3517–3526.
Tompkins AM, Gierens K, Radel G. 2007. Ice supersaturation in theECMWF integrated forcast system. Q. J. R. Meteorol. Soc. 133:53–63.
Vaughan G, Cambridge C, Dean L, Phillips A. 2006. Water vapour andozone profiles in the midlatitude upper troposphere. Atmos. Chem.Phys. 5: 963–971.
Vomel H, Selkirk H, Miloshevich L, Valverde-Canossa J, Valdes J,Kyro E, Kivi R, Stolz W, Peng G, Diaz JA. 2007. Radiation drybias of the Vaisala RS92 humidity sensor. J. Atmos. Ocean. Tech.24: 953–963.
Walters MK, Shull JD, Asbury RP. 2000. A comparison of exhaustcondensation trail forecast algorithms at low relative humidity. J.Appl. Meteorol. 39: 80–91.
Wang JH, Cole HL, Carlson DJ, Miller ER, Beierle K, Paukkunen A,Laine TK. 2002. Corrections of humidity measurement errors fromthe Vaisala RS80 radiosonde - Application to TOGA COARE data.J. Atmos. Ocean. Tech. 19: 981–1002.
Wilson DR, Ballard S. 1999. A microphysical based precipitationscheme for the UK Meteorological Office Unified Model. Q. J. R.Meteorol. Soc. 125: 1607–1636.
Copyright 2007 Royal Meteorological Society Q. J. R. Meteorol. Soc. 133: 1413–1423 (2007)DOI: 10.1002/qj