evaluation of the renfrewshire development programme · nhs greater glasgow and clyde evaluation of...
TRANSCRIPT

NHS GREATER GLASGOW AND CLYDE
Evaluation of the Renfrewshire Development
Programme
Dr Lynda Fenton
Specialty Registrar Public Health
NHS Greater Glasgow and Clyde
Dr Cathy Johnman
Honorary Consultant in Public Health, NHS Greater Glasgow and Clyde
Clinical Senior Lecturer, University of Glasgow
26th July 2016

Content Page
Contents
Glossary ..................................................................................................................... 3
Executive Summary ................................................................................................... 4
The Renfrewshire Development Programme ........................................................... 10
Evaluation Aims, Components and Methods ............................................................ 14
Chest Pain Assessment Unit .................................................................................... 19
Older Adults Assessment Unit .................................................................................. 29
Out of Hours Community Inreach Service ................................................................ 40
Enhanced Pharmacy Services ................................................................................. 45
Enhanced Anticipatory Care Planning ...................................................................... 53
The Health and Social care context ......................................................................... 58
The Renfrewshire Development Programme: overall strengths and challenges ...... 65
Conclusions and discussion ..................................................................................... 67
Recommendations 1: The Renfrewshire Development Programme ........................ 75
Recommendations 2: using RDP findings to support wider implementation of the
Clinical Services Strategy ......................................................................................... 76
Recommendations 3: Data, monitoring and evaluation ............................................ 77
Acknowledgements .................................................................................................. 78
Bibliography ............................................................................................................. 79
Appendix 1: Programme Board & Project Team Members ....................................... 81
Appendix 2: Renfrewshire Development Programme Feedback Event 16/03/2016 . 83
Appendix 3: Data Sources ........................................................................................ 86
Appendix 4: CPAU and OAAU comparison groups .................................................. 92
Appendix 5: Chest Pain Unit and Older Adult Assessment Unit, supplementary data
tables. ....................................................................................................................... 95
Appendix 6: Health and Social care context, supplementary graphs ....................... 96

Glossary Page 3 of 99
Glossary
ACP Anticipatory Care Plan
AHP Allied Health Professional
AMU Acute Medical Unit (RAH acute medical receiving ward)
CCU Coronary Care Unit
CGA
CPAU
Comprehensive Geriatric Assessment
Chest Pain Assessment Unit
CSR / CSS Clinical Services Review/Strategy
DME Department of Medicine for the Elderly
ECAN Elderly Care Assessment Nurse
ED Emergency Department
eKIS electronic Key Information Summary
ETT Exercise Tolerance Test
IDL Immediate Discharge Letter
MAU Medical Assessment Unit (RAH assessment unit for GP referrals)
MDS Monitored Dosage System (“dosette box”)
MDT Multi-Disciplinary Team
NEWS National Early Warning Score
NSTEMI Non-ST elevation myocardial infarction
OAAU Older Adults Assessment Unit
QOF Quality and Outcomes Framework
RAH Royal Alexandra Hospital, Paisley
RES Rehabilitation and Enablement Service
STEMI ST elevation myocardial infarction
Troponin Blood marker used to test for myocardial ischaemia (heart attack)

Executive Summary Page 4 of 99
Executive Summary
What is the Renfrewshire Development Programme?
NHS Greater Glasgow and Clyde (NHSGGC) published the Clinical Services
Strategy “Fit for the Future” in 2015. This strategy supports delivery of the Scottish
Government 2020 Vision. It outlines new service models and the need to develop
and test these, led to the Renfrewshire Development Programme (RDP). By working
across a geographical area, bridging traditional divides of hospital and community
care, it was envisioned that this programme would demonstrate how specific
services can be improved and adapted for the future.
The RDP is a multifaceted service improvement and development programme
involving the Royal Alexandra Hospital (RAH), 13 local Paisley GP practices,
community health and primary care services and Renfrewshire social care services.
It has developed and assessed new service models which aim to:
Improve the quality of healthcare including patient experience
Improve care at the interface between hospital and community care
Shorten length of stay
Reduce avoidable admissions to hospital
Maintain or improve rates of re-admission
What was done?
The RDP was initiated at a stakeholder event in May 2014 which facilitated the
mapping of local services and identification of areas for targeting change. Five
initiatives, listed below, were selected as a focus for activity; these responded to the
priorities identified in the Clinical Services Strategy and took into account local
context and supporting evidence. The Programme Team met weekly and this
supported a co-ordinated, ‘whole system’ approach to the development of the
projects and allowed a number of other small tests of change to be initiated.

Executive Summary Page 5 of 99
RDP Initiatives:
1. Chest Pain Assessment Unit (CPAU): rapid assessment and follow-up for
patients with low-risk cardiac chest pain at the RAH.
2. Older Adults Assessment Unit (OAAU): combined assessment and short-stay
unit at the RAH to deliver early comprehensive geriatric assessment and
multidisciplinary support for timely discharge of frail older adults.
3. Out of Hours Community Inreach Service: a transport, settle-in and coordination
service to facilitate timely supported discharge from the RAH.
4. Enhanced Pharmacy Services: community and hospital medicines reconciliation,
improved communication of discharge prescription, and actions to reduce high-
risk co-prescribing.
5. Enhanced Anticipatory Care Planning: GP practices working with target patient
groups and local staff to increase the number and use of ACPs.
How was the Programme evaluated?
Evaluation of feasibility, effectiveness, safety and acceptability was based on the first
year of the programme and employed a mixed qualitative and quantitative approach
to describe its structure, process and outcomes.
Quantitative evaluation relied upon project activity databases with linked routine data
to make comparisons before versus during the RDP and for patients experiencing
usual care versus care in an RDP project. A range of routine data was also collated
to assess trends in wider health and social care activity. Qualitative data were
gathered through patient surveys and project staff feedback.

Executive Summary Page 6 of 99
Table 1: Summary of key project findings
Project Outcomes
Chest Pain
Assessment
Unit
High patient satisfaction and excellent feedback.
Safely reduced length of stay (average 25 hours shorter than before
project) and number of patients requiring an overnight stay (7%
more patients home on the day they present to hospital).
Older Adults
Assessment
Unit
High patient satisfaction and excellent feedback from relatives and
carers.
Safely reduced length of stay (average 3.3 days shorter than
patients in other clinical areas).
Out of Hours
Community
Inreach
Service
Discharge support provided to patients from a range of clinical
areas.
Benefits of joint working between health and social care and co-
location.
Enhanced
Anticipatory
Care Planning
Increased number of ACPs completed for patients in target groups.
Information contained in the ACP was useful and supports clinical
decision making for patients admitted as an emergency.
Enhanced
Pharmacy
Services
Initiation of improved medicines reconciliation mechanisms.
Establishment of improved communication between hospital and
community pharmacy to prevent medication errors.
The overall
RDP approach
to service
development
Joint working has forged new relationships between hospital,
community health and social care professionals which have
supported ongoing service improvement.
The RDP was a rewarding way of working and a successful means
of tackling previously hard to address issues.

Executive Summary Page 7 of 99
Table 2: Summary of key observed trends in health and social care
Activity area Observed trends
Hospital
activity
Reduction in average length of stay for patients aged > 65 years.
No change in overall admissions, bed days or delayed discharges.
Primary care
activity
No significant change in number of GP encounters in the 13
practices.
Out of Hours GP contacts followed the same trends as NHSGGC.
Increase in Community Nursing activity.
Social care
activity
Increase in the number of hours of home care provided and the
proportion of those aged 65+ years receiving home care.
These trends brought activity levels in Renfrewshire closer to those
observed on average across Scotland.
Summary of Conclusions:
Activity: Project activity was variable over the year, with periods of closure and
recruitment challenges impacting on the realisation of potential benefits of the units.
Effectiveness: The projects were successful in achieving a number of their
objectives, such as reductions in length of stay and increased ACP coverage, as well
as the RDP overall building links and improving communication between hospital
and community health and social care professionals. Tables 1 and 2 refer.
Safety: Readmissions at 7 and 28 days for the CPAU were lower than comparable
groups. Whilst in the OAAU there was some variability over the year, overall there is
not a consistently higher rate of readmission than in comparable patient groups.
Acceptability: Feedback from patients found high levels of satisfaction with the care
provided and overall approval of the model of care. Evidence from Programme Team
and project staff showed that they have found it satisfying way of working.

Executive Summary Page 8 of 99
Equity: Insufficient data were available to make a detailed analysis of the equity
impact of the projects (see report for further discussion).
Cost: Theoretical cost differences were found, however in the absence of bed
closures these have not been realised as cash savings.
Shifting the balance of care: There were reductions in length of stay for those aged
>65 years, in conjunction with increases in community nursing care and home care,
compared with the previous year. However it is not possible to directly attribute
these changes directly to RDP initiatives.
Recommendations 1: The Renfrewshire Development Programme
The current RDP projects should be continued, with preservation of the capacity
to assess new patients at peak times.
Attention should be given to selection criteria, referral pathways and assessment
capacity of these projects to ensure that maximum use is made of these services
and realise benefits for the largest possible number of patients.
To ensure equitable use of resources, evidence should be gathered to support
the assumption that units such as the CPAU and OAAU free capacity and
enhance care quality elsewhere in the hospital, i.e. in standard acute
assessment areas, through the most appropriate use of beds.
Maintenance of successful outcomes will depend on sufficient service capacity in
community health and social care.
Executive Summary Page 9 of 99
Recommendations 2: Using the RDP findings to support wider implementation
of the Clinical Services Strategy
Future initiatives should take account of the development of models of care in
alternative, non-acute settings in addition to the reduction of demand in hospital,
and work towards an integrated approach to care at the individual patient level.
Clear structures through which learning and experience, from the RDP and
future initiatives, can be disseminated across the health board should be
identified or, where no appropriate network exists, developed.
Identification of future initiatives will need to balance the benefits of local
knowledge and devolved project development, with the drive for a standardised
approach to acute assessment across NHSGGC and the need to ensure
sufficient attention to challenging areas e.g. multi-morbidity.
Recommendations 3: Data, Monitoring and Evaluation
Collection and analysis of data should be matched to purpose, outcomes and
time scales at the following three levels: monitoring data, project evaluation data
and strategic evaluation data (see main report for details).
Identified data gathering, access, and validity issues should be addressed to
support future monitoring and evaluation efforts, with solutions embedded into
routine health and social care data collection (see main report for details).

The Renfrewshire Development Programme Page 10 of 99
The Renfrewshire Development Programme
1. Background and context
The Clinical Services Review was launched by NHSGGC in April 2012 and resulted
in the Clinical Services Strategy “Fit for the Future” published in 2015 (1). The
Clinical Services Strategy serves as a platform for the delivery of the Scottish
Government 2020 Vision, and as a means of engaging and working together with
Integrated Joint Boards (IJBs) on service planning. The 2020 vision is summarised
as:
“...by 2020 everyone is able to live longer healthier lives at home, or in a
homely setting. We will have a healthcare system where we have integrated
health and social care, a focus on prevention, anticipation and supported self
management. When hospital treatment is required, and cannot be provided in
a community setting, day care treatment will be the norm. Whatever the
setting, care will be provided to the highest standards of quality and safety,
with the person at the centre of all decisions. There will be a focus on
ensuring that people get back into their home or community environment as
soon as possible, with minimal risk of readmission.” (2)
The Clinical Services Strategy describes five changes necessary to achieve a
sustainable health care system, matched to population needs and providing quality
care; these are:
Think beyond artificial boundaries of ‘hospital’ and ‘community’;
Focus on patient pathway and needs at each stage;
Change the delivery of acute care: assess and direct to appropriate place of
care;
Change the provision and accessibility of community services;
Create different ways of working at the interface. (1 p. 11)
The Clinical Services Review identified the need to further develop and evaluate the
new service models in a “test bed” area. The Renfrewshire Development Programme
(RDP) was established with the aim of demonstrating new service models and ways
of working and assessing their feasibility, affordability and effects.

The Renfrewshire Development Programme Page 11 of 99
2. Structure and Process of the Renfrewshire Development Programme
The RDP focused on the Paisley area of Renfrewshire, with 13 local GP Practices
(see Figure 1), and involved contributions from those working in the Royal Alexandra
Hospital (RAH), local Primary Care services, NHSGGC planning, Renfrewshire
Council and patient representatives (see Appendix 1). The Programme Board had
responsibility for oversight of the programme, whilst the Project Team led its
implementation and met weekly through the initial year of the RDP. These team
meetings brought professionals together to address the identified challenges and
supported a “whole system” approach to the work undertaken.
Figure 1: Paisley area of Renfrewshire showing the 13 GP Practices involved
in the RDP and the RAH

The Renfrewshire Development Programme Page 12 of 99
The RDP was initiated at a stakeholder event in May 2014 (see Figure 2) and was
attended by 163 representatives of local health and social care services. This
supported the mapping of local services, sharing information about the RDP and
identification of appropriate areas for targeting change.
Figure 2: Timeline of Renfrewshire Development Programme’s Key Events
Following this and the development of more detailed proposals for the board, five
initiatives were selected as a focus for activity. These responded to the priorities
identified in the Clinical Services Strategy; taking account of local context and
supporting evidence. The five project areas are shown in Figure 3; further detail and
rationale for each is given in the relevant evaluation section. As well as these
projects, a number of small tests of change were undertaken, as well as work on
over-arching issues such as patient transport.
Evaluation period: Sep
2014-Aug 2015
Apr 2014 Jul 2014 Oct 2014 Jan 2015 Apr 2015 Oct 2015 Jan 2016 Apr 2016
May 2014: RDP Stocktake event mapping of existing services and identification of areas to be addressed by RDP
Sep
2014:
Project
s start
Jan-Apr 2015: Winter bed pressure at RAH. High levels of demand on inpatient
capacity resulted in closure of assessment in CPAU and OAAU beds for periods.
Measures taken to address issues include establishment of multi-agency discharge
hub and daily discharge huddles.
March 2016: RDP
Feedback event
consultation on findings
and proposals for wider
adoption of approach

The Renfrewshire Development Programme Page 13 of 99
At the conclusion of the first year of the RDP, a feedback event was held with
stakeholders in March 2016. This facilitated sharing of the initial evaluation findings
and discussion of these in the context of the next steps in implementing the Clinical
Services Strategy. These discussions informed some of the recommendations
around future implementation. Summary notes from this event are in Appendix 2.
Figure 3: RDP Structure and Process
RDP Board: Lead and oversee delivery of the RDP and ensure robust evaluation. Quarterly meetings.
Inte
gra
ted
wo
rkin
g: a
"w
hole
syste
m"
app
roa
ch
Sm
all
tests
of ch
an
ge
: a
do
ptio
n o
f se
rvic
e im
pro
ve
me
nt m
ode
l w
idely
witin
in
RD
P
RDP Project team: Lead implementation of the RDP including service redesign, engagement of professional reference group, co-ordination and support of all work
streams. Weekly meetings.
Pro
ject
Aim
s
Co
mp
on
en
ts
Chest Pain Unit
Rapid assessment and follow-
up of patients with
low risk cardiac
chest pain
6 patients unit; open 7
days per week 0830-
2100
Older Adults
Assessment Unit
Early comprehen-sive geriatric assessment
and multidiscipli-nary support
for timely discharge
12 bed unit
8 Short-stay beds
4 Assessment beds (open
Mon-Fri 0800-2000)
Enhanced Pharmacy Services
Improve prescribing accuracy & medicine
compliance to prevent
admissions and support discharge
Medicines reconcilation
Email of discharge
prescription
Care bundle for NSAID
prescriptions
Out of Hours
Community Inreach Service
Admission prevention
and supported discharge
Mon-Fri 1330-2000, Weekend 0900-1700
Transport, settle-in &
coordination of services
Enhanced Anticipatory
Care Planning
Admission prevention and patient
centred care
Increase proportion of
target patients with
ACP; upload,
update and increase use

Evaluation Aims, Components and Methods Page 14 of 99
Evaluation Aims, Components and Methods
1. Evaluation Aims
The aim of this evaluation is to systematically investigate the deliverability,
acceptability, effectiveness and cost implications of the overall Renfrewshire
Development Programme and its constituent projects.
2. Components
The evaluation is based on the first year of the RDP and employs a mixed
quantitative and qualitative approach to describe the structure, process and
outcomes of the programme. Figure 4 gives an overview of the range of information
which has contributed to each area of the evaluation (for full list of quantitative data
sources see Appendix 3).
Figure 4: RDP Evaluation structure and components
RDP evaluation
Structure
Existing and new service
models
Project proposals and
reports
Staff information
Clinical protocols
Routine data
Outputs
Project activity
Number of patients seen, age, diagnosis
Length of stay and
readmissions
Outcomes
Effective and Safe
Length of stay and readmission
comparisons
Low risk chest pain
Frail older adults and those aged 80+ years
Acceptable
Patient satisfaction
survey
Staff survey and focus groups
Process
Implementation and
mechanisms
Staff focus groups
Regular project reports
Context
Health and social care
activity
Hospital activity data and day of
care survey
Primary care activity
Out of hours GP activity
Social care
Deaths and % in hospital

Evaluation Aims, Components and Methods Page 15 of 99
3. Methods
Structure
Information on the structure of the RDP and its constituent projects was obtained
through the terms of reference, meeting minutes, project proposals, interim project
reports, visits to the project sites and meetings with staff and project leads.
A description of the changes made by the RDP relied upon an accurate outline of the
existing model of care, which was based upon information from staff, clinical
protocols, ward databases and routinely collected data, for example the QOF and
hospital admissions data. The initial, hospital-wide “Day of Care” survey also
contributed to an understanding of the existing care within the RAH.
Process
An assessment on the fidelity and reach of the interventions is based upon project
activity data and interim project reports. Mechanisms of change were identified
through staff focus groups and reports by project leads.
Outputs
Each of the initiatives gathered data regarding the number of patients seen on local
project databases; any additional activity data gathered varied by project.
4. Outcomes
Qualitative data
Patient satisfaction surveys and gathering the views of friends, family and carers
were undertaken by the Patient Centred Health and Care Collaborative. A number of
staff focus groups were facilitated by Public Health to assess acceptability of the
service models to staff and identify process factors relevant to service development.
Online surveys were also used to obtain views from acute hospital staff and the RDP
project team.
Quantitative data
Patients who received care in one of the RDP projects were identified via the local
project databases. SMR01 hospital admission records were obtained for these

Evaluation Aims, Components and Methods Page 16 of 99
patients to provide a consistent dataset covering length of stay, episodes of care,
diagnosis and readmissions at 7 and 28 days.
Two comparisons were made to assess if the RDP projects had impacted on
outcomes:
Before RDP vs. During RDP – the experience of target patient groups in the year
preceding the RDP (Sep 2013-Aug 2014) was compared to that in the first year
of RDP (Sep 2014-Aug 2015)
Usual care vs. Care in the RDP project – the experience of similar patient groups
who received usual care in the first year of the RDP (Sep 2014-Aug 2015) was
compared to that of patients who received care in the RDP projects
Collation and description of data was undertaken in Microsoft Excel 2007 (3).
Assessment of statistical significance of differences between groups was made with
the SPSS statistical package (4). A comparison of means was undertaken using the
Mann-Whitney U test with a p-value <0.05 taken as statistically significant. 95%
confidence intervals for difference are presented and were calculated using an Excel
tool (5). Where significant differences were detected between groups the cost impact
of these was estimated by applying the average direct cost of the relevant clinical
episode to the observed difference.
Several methods, based on age, diagnosis and investigations, were used to identify
patient groups who were similar to those targeted by the interventions, in order to
provide comparators. Full details of the selection of these groups are given in
Appendix 2; the following summarises the comparators used:
Chest Pain Assessment Unit comparison groups:
(a) Patients with a discharge diagnosis of “low risk chest pain” (LRCP)
84% of patients seen in the CPAU had a diagnosis of low risk chest pain
21% of patients with low risk chest pain were seen in the CPAU
(b) Patients presenting with chest pain having a troponin test
43% of patients with chest pain, no immediate evidence of myocardial
ischaemia and having a troponin test were seen in the CPAU

Evaluation Aims, Components and Methods Page 17 of 99
Older Adults Assessment Unit comparison groups:
(a) Patients presenting with specified frailty conditions (dementia, delirium, tendency
to fall) - note this does not include all patients who would be classified as frail
according to the frailty score.
42% of patients seen in the OAAU had one of these conditions
14% of patients with these conditions were seen in the OAAU
(b) Patients aged over 80 years
74% of patients seen in the OAAU were aged over 80 years
15% of patients aged over 80 years admitted as an emergency were seen in
the OAAU
Health and Social Care context
Information was gathered on health and social care activity for the period preceding
and during the RDP in order to provide an understanding of the context in which the
interventions to place, and to monitor for any possible impacts on these services.
Hospital activity
Monthly data on ED attendances, Emergency admissions, Length of stay,
Readmissions (7 and 28 days) and Delayed discharges for the RAH and the rest of
NHSGGC were collated from Jan 2013 to the end of the evaluation period from
routinely collected data within the health board. Indirect standardisation of key
indicators was undertaken by the Information Services team.
A “Day of Care” survey was undertake in the RAH in November 2014, with repeats in
key wards in April 2015, June 2015 and Feb 2016.
Primary care activity
Data were gathered from the 13 participating Paisley GP practices on encounters by
type and staff member and on community nursing activity.
Information on Out-of-hours GP contacts was gathered for the whole of NHSGGC,
and analysed by post code area.

Evaluation Aims, Components and Methods Page 18 of 99
Social care
Data for Renfrewshire were gathered on the number of individuals receiving home
care, the number of hours of care provided, the number of new Standard Shareable
Assessments that were undertaken and the number of care home residents and
admissions.
Deaths
The number of deaths in Renfrewshire was indirectly standardised to NHSGGC for
age, sex and deprivation. The proportion of deaths that occurred in hospital was also
gathered.
Denominator populations
In order to allow meaningful comparisons over time and place, health and social care
activity data were related to the relevant denominator populations.
Renfrewshire
Mid-year population estimates for Renfrewshire were obtained from the National
Records Office for Scotland (NRS) and provided the denominator for social care
data.
Hospital
As the hospital does not have a discrete population which it serves an estimated
total denominator population of 200,000 was used. The population structure and
changes over time of Renfrewshire was applied to this figure, as this is the area
which most closely reflects the geographical area served by the hospital. This
method allows the comparison of rates over time, but not between places.
13 GP Practices
Practice populations for the 13 participating GP practices were obtained from ISD
Scotland.

Chest Pain Assessment Unit Page 19 of 99
Chest Pain Assessment Unit
1. Description
Patient group
Patients presenting to hospital as an emergency (self-referral or GP referral) with
possible cardiac chest pain but with a low risk of acute myocardial ischaemia (heart
attack).
Project aims
Reduce the time spent in hospital by patients with acute (cardiac) chest pain who are
at low risk of complications. Improve the quality of assessment and treatment of
patients with acute (cardiac) chest pain, including prompt access to further
investigation and specialist review.
Existing model of care
Patients with possible cardiac chest pain were assessed in the Emergency
Department (ED) and then transferred to the Coronary Care Unit (CCU). In order to
exclude acute myocardial ischaemia, blood testing for troponin was done at
presentation to hospital (zero hours) and at 6 hours after their pain. Patients with
negative tests would then wait for review by a cardiologist and further investigation
as appropriate, for example exercise tolerance testing (ETT). In addition to those
among whom cardiac pain was felt to be the most likely diagnosis, there is a further
group of patients who would undergo troponin testing, even though another
diagnosis was felt to be probable. These patients may be seen in the ED or MAU
and subsequently admitted to AMU and other medical wards.
New service model
Unit: Seated unit with capacity for 6 patients, located adjacent to the CCU. Open 7
days per week 0830-2100 (last patient accepted 1730). The unit is staffed by
specialist cardiology nurses, with patients reviewed by a cardiologist on the day of
admission or the following day if an out-of-hours admission.

Chest Pain Assessment Unit Page 20 of 99
Patient selection: Patients assessed in the ED or MAU with possible cardiac chest
pain and a HEART score <=5 1.
Subsequent care: transferred to CPAU, nurse specialist assessment, 3 hour high-
sensitivity troponin, chest x-ray. Those with positive findings are transferred to CCU
(or other medical ward as appropriate). Those without evidence of acute ischaemia
are discharged following cardiologist review. Further testing (e.g. ETT) either takes
place the same day if possible, or on the next available day as an outpatient.
Rationale for inclusion in the RDP
Acute chest pain is a common reason for presentation to hospital. Under the existing
model of care it was felt patients were spending too long in hospital to exclude more
serious diagnoses and receive investigations that could otherwise occur on an
urgent outpatient basis.
The advent of the HEART score risk stratification tool and new high sensitivity
troponin tests, which offer results in just 3 hours, raised the possibility of safely
identifying a patient group at low risk of complications who could be rapidly
reassured, discharged, and followed up thereafter.
This model of care is intended to deliver improvements in patient care and
experience. It tested a new way of working at the interface between community and
hospital care with prompt assessment, early discharge and access to specialist
cardiology review and investigations on a same-day or early outpatient basis.
Evidence base
The HEART score is a tool developed to predict outcome in those presenting with
acute chest pain, in order to guide diagnostic and therapeutic decisions. Based upon
a patient’s history, ECG, age, risk factors and troponin test, it has been found to be a
sensitive predictor of those at risk of major adverse cardiac events within 6 weeks of
presentation (6).
1 Composite risk score based on History, ECG, Age, Risk factors and Troponin, as described and
validated by Backus et al (2014) (6).

Chest Pain Assessment Unit Page 21 of 99
High-sensitivity troponin tests have been recognised as appropriate for use in “early
rule-out” decision making strategies by both NICE (7) and the European Society of
Cardiology (8).
Available evaluation data
CCU/CPU troponin database – data on all patients within RAH having troponin
testing from Oct 2010, recorded by chest pain specialist nurses
SMR01 CPU patients – all patients seen in CPU Sep 14-Aug 15, SMR01 records
of that and subsequent admissions
SMR01 Low risk chest pain patients – all patients admitted to hospital with a
diagnosis of non-specific chest pain or angina from Jan 2012-Aug 2015
Patient feedback cards – friends and family test
2. Project Activity September 2014-August 2015
Patient numbers
Figure 5 shows activity for the unit over the first year of operation: initially an average
of 3 patients were seen per day; between Jan-April 2015 there were significant
periods when the unit was closed because the beds were being used as standard
acute medical beds at times of pressure3. Since May 2015, numbers stabilised at an
average of 64 patients per month or just over 2 per day.
2 14/09/2014-20/08/2015: 587 patients seen, 35 repeat consultations 622 episodes of
care; SMR 01 data available for 574 individuals, including all repeats 609 episodes
3 Closures: 8-15 Jan 2015, 26 Jan-03 Mar 2015, 10-15 Mar 2015, 23 Mar-03 May 2015.
622 assessments made in CPAU2
74% non-specific chest pain; 7% had angina and 6% diagnosed
with a myocardial infarction (3% STEMI, 3% NSTEMI)
Mean age of patients 61 years (range 24-97)
Average length of stay was 9.4 hours, with 67 % patients
discharged on day 0

Chest Pain Assessment Unit Page 22 of 99
Figure 5: Number of patients and mean daily rate of patients seen in the RAH
CPAU by month, Sep 2014-Aug 2015
Diagnoses
The most common diagnosis for those seen in the unit is non-specific chest pain
(74%). Diagnoses related to cardiac ischaemia accounted for 13% of those seen,
with 6% being classified as myocardial infarction. Other cardiac problems e.g.
palpitations accounted for 3%, gastrointestinal issues 3% (mostly reflux), and
respiratory diagnoses 1%.
Readmissions
47 (7.7%) patients were readmitted to hospital for any reason within 28 days, 28
(4.6%) of these within 7 days. Figure 6 shows 7 and 28 day all-cause readmissions.
0
0.5
1
1.5
2
2.5
3
3.5
0
20
40
60
80
100
120
Me
an
pa
tie
nts
se
en
pe
r d
ay
Nu
mb
er
of
pa
tie
nts
Month
Number of patients Daily rate

Chest Pain Assessment Unit Page 23 of 99
Figure 6: 7 and 28 day all-cause readmissions (number and % readmitted)
among all patients seen in RAH CPAU Sep 2014-Aug 2015
3. Outcomes
Patient satisfaction
Patient feedback “friends and family test” cards were completed by 22 patients. 95%
said they would be “extremely likely” to recommend the ward to friends and family in
need of similar care, with 5% selecting “likely”.
Comments made reference to good quality communication (4 positive), speed and
efficiency of assessment (6 positive), good care (13 positive), as well as a number of
general positive comments (see Figure 7). There were no negative comments.
0
2
4
6
8
10
12
14
16
0
2
4
6
8
10
12
SEP OCT NOV DEC JAN FEB MAR APR MAY JUN JUL AUG
% o
f p
atie
nts
re
ad
mitte
d
Nu
mb
er
of
pa
tie
nts
re
ad
mitte
d
Month
Number of 7 day readmissions Number of 28 day readmissions
7 day readmissions % of all patients 28 day readmissions % of all patients

Chest Pain Assessment Unit Page 24 of 99
” Informed as everything
happened. Took away all the
worries I had.”
“Calm and relaxing atmosphere”
“Robert Calderwood
should be proud of you all”
“Looked after promptly and thoroughly”
“Staff are very friendly and attentive
to all your needs”
“First class”
“Could not be better”
Figure 7: Quotations from patients assessed in the CPAU
Length of stay in hospital
Average hours in hospital
Before vs. During RDP
The mean number of hours spent in hospital by patients with suspected cardiac
chest pain and a negative zero hour troponin was compared for the year preceding
the RDP with the first year of operation of the CPAU.
The length of stay chest pain patients was, on average, 25.3 hours shorter in the
project year compared with the previous year, as shown in Table 3.
Table 1: Average length of stay in hours for patients with chest pain and no
immediate evidence of ischaemia, seen in RAH CCU/CPAU, Sep 2013-Aug 2014
vs. Sep 2014-Aug 2015
CCU patients
Sep 13-Aug 14
CCU/CPAU
patients
Sep 14-Aug 15
Difference
95%
confidence
interval
Average stay
(hours) 36.1 10.8 -25.3 hours -21.6--28.6

Chest Pain Assessment Unit Page 25 of 99
Usual care vs. Care in CPAU
Length of stay was compared for those patients seen in CPAU with those assessed
in other clinical areas (CCU, MAU, AMU, ED) during the same year (Table 4).
It was 4.7 hours shorter for patients seen in the CPAU compared with those in other
clinical areas in the same year. The mean length of stay of chest pain patients fell in
all medical units (CCU, MAU, AMU) in the programme year, but the shortest length
of stay was achieved in the CPAU.
Table 2: Average length of stay for patients with chest pain and no immediate
evidence of ischaemia seen in RAH CCU/CPU, Sep 2014-Aug 2015 by clinical
area
Assessed in
other clinical
area
Assessed in
CPAU Difference
95%
confidence
interval
Average stay
(hours) 14.1 9.4 -4.7 hours -1.7--7.7 hours
Proportion of patients discharged on the day of assessment
One aim of the project was to avoid recovered patients having to spend a night in
hospital awaiting results or further investigation. This outcome therefore explored the
proportion of low risk chest pain (LRCP) patients who were discharged on day zero.
In order to focus on those who were likely target patients of the CPAU, it was
restricted to those with short lengths of stay (< 2 days).
Before vs. During RDP
64% of LRCP patients were discharged without an overnight stay during the
programme year, compared with 57% the preceding year (see Table 5). Some of
these patients would have been assessed in clinical areas other than the CPAU, e.g.
AMU.

Chest Pain Assessment Unit Page 26 of 99
Table 5: Proportion of LRCP patients discharged without an overnight stay:
Before (Sep 13-Aug 14) vs. During (Sep 14–Aug 15)
Before After Difference p-value 95% CI
LRCP
patients 57.2% 64.3% +7.1% <0.0001
+3.9%-
+10.4%
Usual care vs. Care in CPAU
70% of LRCP patients were discharged without an overnight stay from the CAPU,
compared with 62% from other clinical areas (see Table 6).
Table 6: Proportion of LRCP patients discharged without an overnight stay:
Usual care vs. CPAU care (Sep 14 – Aug 15)
Usual care CPAU care Difference p-value 95% CI
LRCP
patients 62.0% 70.1% +8.1% 0.065 3.1%-13.0%
Readmissions
The proportion of patients readmitted within 7 and 28 days for any reason, was lower
among those assessed in the CPU compared with other clinical areas and for the
project year compared with the preceding year. The differences were not statistically
significant (see Appendix 5).
Estimation of impact for significant differences
The direct cost per day associated with a cardiology admission in the RAH is £567. A
reduction in length of stay of 4.7 hours (0.2 days) in the CPAU compared with usual
care therefore equates to a cost difference of -£111 per admission.
An average of 58 patients per month were seen in the CPAU (during the period of
stable activity May-Aug), therefore over the cost of the year there was a potential
cost difference of -£77,282 associated with the reduction in length of stay observed
with this model of care. This accounts for just over half of the estimated roll-out costs
of £142,800, although it should be noted that implementation in the RAH was
essentially cost neutral as it was undertaken through redistribution of existing

Chest Pain Assessment Unit Page 27 of 99
services. The CPAU was initially established in the clinical area freed by the closure
of 6 CCU beds.
4. Process factors
Patient selection
The outcomes in terms of length of stay and readmissions suggest that this is a safe
approach and an appropriate patient group is being selected. However, the activity
levels in the unit are quite low, and a significant proportion of patients with low risk
chest pain/troponin testing were seen in other clinical areas. This suggests that there
is a balance to be struck between identifying suitable low risk patients and making
the unit accessible to the largest possible group to maximise benefits for them and
the service.
Unit location
Being located close to CCU provided convenience and support for staff, with easy
access to Consultant Cardiologists. Following more recent restructuring of acute
care in the RAH (after the RDP evaluation year) the location of the unit has changed
to adjacent to the MAU; this location closer to the “front door” may promote referrals
and shared learning/support with general acute assessment services.
Dedicated unit
Reductions in length of stay were also seen during periods when the CPAU was not
operating, and were observed even in non-CPAU clinical areas in comparison with
the preceding year. This may reflect the availability of high-sensitivity troponin
testing, as well as the cultural adoption of the new ways of working demonstrated by
the CPAU. This raises the possibility that efficiency gains may be made without a
physically dedicated unit, but by adopting new ways of managing chest pain patients
in existing clinical areas.
There may be additional benefits to having a dedicated space; staff found working in
the unit to be efficient and rewarding, whilst feedback from patients showed it
provides a calm atmosphere and the opportunity for clear communication and
reassurance from specialist staff.

Chest Pain Assessment Unit Page 28 of 99
Bed pressure
Experience from the first year of the CPAU showed that it can be difficult to protect
assessment beds at times of bed pressure. However, the potential benefits of rapid
assessment and prompt discharge may be greatest at these times.
Clinical lead
A strong clinical lead has been vital to the inception and successful implementation
of this project.

Out of hours Community Inreach Service Page 29 of 99
Older Adults Assessment Unit
1. Description
Patient group
Older adults presenting to the hospital as an emergency (self-referral) meeting frailty
criteria (care home residents, polypharmacy, immobility/falls, multiple conditions,
acute confusion) without evidence of major physiological disturbance (low NEWS4
score), and not obviously requiring the input of a non-medical specialty.
Project aims
Improve access to specialist Dept. of Medicine for the Elderly (DME)care and
early Comprehensive Geriatric Assessment (CGA)
Reduce length of stay
Increase the proportion of older people admitted who receive care in specialist
beds
Reduce number of internal hospital moves for older people
Better care for patients with dementia and delirium
Prevention of deterioration /crisis care through more proactive management of at
risk patients, supported by shared Anticipatory Care Plans
Existing model of care
Patients in this group received initial assessment and treatment in the ED, without
specific assessment of frailty and if admission was considered necessary would be
referred to the General Medical receiving team and transferred to AMU. Following
medical consultant review on AMU those felt to benefit from DME input would be
referred and reviewed by the DME consultant on AMU. Those accepted to the care
of the DME team would then await transfer to a DME bed; if not immediately
available then patients may be transferred to a general medical ward or boarded on
another ward. Once transferred to a DME bed patients would be assessed by the
4 NEWS = National Early Warning Score; a composite score based on routinely measured
physiological parameters (respiratory rate, oxygen saturations, temperature, systolic blood pressure, pulse rate and level of consciousness) used to assess a patient’s condition an alert staff to any deterioration.

Chest Pain Assessment Unit Page 30 of 99
ward doctor, and await consultant review at the next ward round (usually twice
weekly). This review would usually be the point at which a comprehensive geriatric
assessment was made.
New service model
Unit: 12 bedded unit with 4 assessment beds open 0800-2000 Mon-Fri (latest
admission 1600) and 8 short-stay beds open at all times. Staffed by Consultant
geriatrician, ward doctor, ECAN (Elderly Care Assessment Nurse), ward nursing
staff with interest in care of the older adult, physiotherapist, occupational
therapist, and ward manager.
Patient selection: Patients in the ED or AMU meeting frailty criteria and NEWS
score <=2 not requiring input from another specialty. Do not need to await review
from ED doctor/medical consultant prior to transfer to OAAU.
Subsequent care: Comprehensive Geriatric Assessment (CGA) followed by daily
consultant and AHP review. Discharge supported by Inreach service and follow-
up via Hospital/Community MDT and Day Hospital.
Rationale for inclusion in the RDP
Under the existing model of care there was felt to be undue delays in review of
patients by a geriatrician and transfer to a DME bed, resulting in longer lengths of
stay in hospital. Significant work had taken place in Renfrewshire in the preceding
years to reduce “delayed discharges”; it was therefore felt beneficial to focus on a
patient group for whom a short length of stay in hospital would be possible. The
existing access to established community support teams was felt to provide a
supportive context in which to assess this approach.
This model of care is intended to deliver improvements in patient care and
experience. It tested a new way of working at the interface between community and
hospital care with prompt specialist assessment, early supported discharge where
possible, with good access to community support services coupled with specialist
geriatrician follow-up in the community.

Chest Pain Assessment Unit Page 31 of 99
Evidence base
A meta-analysis of RCTs found that patients who underwent Comprehensive
Geriatric Assessment were more likely to be alive and living in their own homes at
the end of follow up (median follow up 12 months) (9). Subgroup analysis found that
the most effective method of delivering CGA was in a ward setting, as opposed to
mobile teams.
A case study report of four sites across Scotland explores the use of a screening tool
for frailty, a geriatric assessment unit and a new pathway for frail patients in the ED
(10). The outcomes presented suggest that these approaches may reduce length of
stay and mortality.
Available evaluation data
OAAU database – details of all patients assessed in the OAAU
SMR01 OAAU patients – all patients seen in the OAAU Sep 14-Aug 15, SMR01
records of that and subsequent admissions
SMR01 Patients with “specified frailty conditions” – all patient admitted to
hospital with a diagnosis of falls, dementia or delirium Jan 2012-Aug 2015
Patient centred health and care collaborative monthly patient surveys
2. Project activity September 2014-August 2015
713 patients assessed in OAAU5
There was a wide range of diagnoses, with the most common being
“tendency to fall” (25%)
68% discharged home from the unit, 26% were transferred to another
ward (6% data unavailable)
The mean age 84.3 years (range 47-103), and 74% of patients >80 years
For all patients assessed in the OAAU the average length of stay was
9.4 days, median 4 days. 8.5% of patients were discharged on the day
of assessment
5 Seen from 27/10/2014-31/08/2015, with SMR 01 data available for 634 of these (580 individuals, 45 further admissions); and 711 OAAU database entries.

Chest Pain Assessment Unit Page 32 of 99
Patient numbers
Figure 8 shows the number of patients seen in the OAAU and the average number of
new patients seen per day by month. There were initial high levels of activity at the
end of 2014, followed by reduced numbers of patients seen in the early months of
2015. This is a period when there was significant “winter pressure” on beds in the
hospital, and there were periods of closure of the OAAU assessment beds. Since
March 2015, activity has been more stable, with an average of 59 patients per
month, equating to 2 new patient assessments per day.
Figure 8: Number of patients and daily mean rate of patients seen in RAH
OAAU by month, Sep 2014-Aug 2015
Referral source
The majority of patients (62%) were transferred to the OAAU from AMU; 25% came
from the ED, with the remainder MAU, wards and other sources such as day hospital
and outpatients.
0
0.5
1
1.5
2
2.5
3
3.5
4
0
10
20
30
40
50
60
70
80
90
Ave
rag
e d
aily
nu
mb
er
of
pa
tie
nts
se
en
Nu
mb
er
of
pa
tie
nts
se
en
pe
r m
on
th
Month
Number of patients seen Average patients seen per day

Chest Pain Assessment Unit Page 33 of 99
Diagnoses
The most common diagnosis was “tendency to fall” (25% of patients), followed by
UTI, syncope and collapse, Acute LRTI, Disorientation, and other gait and mobility
abnormalities. The remaining 50% of patients had 156 different diagnoses.
Length of stay
The mean length of stay of all patients seen in the OAAU was 9.8 days (range 0-
131) and the median was 4 days. The difference between the mean and median is
attributable to the skewed distribution of LOS, with a small number of patients having
very long lengths of stay. 8.5% of patients were discharged on the day of
assessment.
The mean length of stay for patients discharged directly from the OAAU was 4.4
days.
Readmissions
The overall readmission rate was 4.9% at 7 days, and 14.4% at 28 days. Figure 9
shows how this varied over the course of the year, with highest rates experienced
over the winter months, and an improvement in readmission rates since April 2015.

Chest Pain Assessment Unit Page 34 of 99
Figure 9: 7 and 28 day all-cause readmissions (number and % readmitted)
among all patients seen in RAH OAAU, Oct 2014-Aug 2015
3. Outcomes
Patient satisfaction
A total of 47 patients were surveyed by the Person Centred Health and Care
Collaborative Feedback Nov 2014-Aug 2015. Patients were approached during
admission and followed-up with ‘themed conversation’ on the telephone; 30
interviews were with the patient only, 4 with carers/family and 13 involved both.
98.5% of patients reported an overall positive experience. There was consistent
good performance (>90% positive) in the domains of Respect and dignity, Safety,
Communication and Involvement. In the domains of Environment and facilities and
Consistency and coordination, patient experience was consistently above 80%
positive. In Pre-admission experience and Mealtime experience there was more
variation, though these areas lie at least partly out with the control of the OAAU.
0%
5%
10%
15%
20%
25%
0
2
4
6
8
10
12
14
16
% o
f p
ati
en
ts r
ead
mit
ted
Nu
mb
er
of
pati
en
ts r
ead
mit
ted
Month
Number of 7 day readmissions Number of 28 day readmissions
7 day readmissions % of all patients 28 day readmissions % of all patients

Chest Pain Assessment Unit Page 35 of 99
“I didn't realise the purpose of the ward had been changed. That makes a lot of sense now because the feel is very different. It's very proactive
here”
“I've been told this ward is the one that can get
you home, and I'm confident that they will get me well enough to
go”
“I'd give it 20/10 because they're all
doing an excellent job”
“I'd say it is 8 or 9 out of
10, I would say the food’s good and staff are pleasant. I'm very
comfortable. Being at home is my 10/10”
“I still have some concerns about going home so quickly
but I'll put my trust in them. It's my house and the stairs that
I'm worried about”
Figure 10: Quotations from patients assessed in the RAH OAAU
Experience of family, friends and carers
The Community Engagement Team (CET) undertook interviews with 24 family,
friends and carers of patients in the OAAU over the course of one week in March
2015. The responses were overwhelmingly positive with the report describing:
“..a clear picture of high quality care, kind, attentive staff and friendly interactions
with patients” (Listening to family, friends and carers” March 2015)
Responses specifically highlighted:
Positive staff attitudes, values and behaviours
High quality care
Good communication with families and carers
A clean, bright pleasant environment

Chest Pain Assessment Unit Page 36 of 99
Length of stay in hospital
Before vs. During
There was no statistically significant difference in mean LOS for the overall frailty
and 80+ patients groups before and during the period of operation of the unit. As
only 14.5% of specified frailty patients and 15.0% of patients >80 years were treated
in the OAAU, changes in outcomes for those patients may not be large enough to
alter the value for the overall patient group (Table 7).
Table 7: Average LOS (days) for specified frailty and 80+ years patients:
Before (Nov 13-Aug 14) vs. During (Nov 14-Aug 15) RDP, RAH Paisley, Sep 14-
Aug 15
Patient group Before
RDP
During
RDP
Difference P-value
Specified frailty patients 14.8 days 15.1 days +0.3 0.762
Patients >80 years 13.4 days 13.0 days -0.4 0.450
Usual care vs. OAAU care
Mean length of stay was 3.1 days shorter among the specified frailty patient group
seen in the OAAU, compared to those who were not, and 3.3 days shorter among
patients aged over 80 years who were seen in the unit, compared to those who were
not. Both these findings were statistically significant (see Table 8).
Table 8: Average LOS (days) for specified frailty and 80+ years patients:
Usual medical/geriatric care vs. OAAU care, RAH Paisley, Sep 14-Aug 15
Patient group Usual
care
OAAU care Difference
(95% Conf.
Interval)
P-value
Specified frailty patients 15.6 days 12.5 days -3.1days
(2.75-3.45)
0.023
Patients >80 years 13.4 days 10.1 days -3.3 days
(3.14-3.46)
0.003

Chest Pain Assessment Unit Page 37 of 99
Readmissions
Before vs. During
There was no significant difference in the readmission rate for the specified frailty
conditions and 80+ patient groups before and during the project (see Appendix 4).
Usual care vs. Care in OAAU
Patients aged over 80 years had a lower readmission rate if assessed in the OAAU,
compared with usual care. However those with specified frailty conditions had a
higher readmission rate if assessed in the OAAU. These findings are summarised in
Table 9; statistical tests are not presented for these comparisons as the numbers in
each group were too small.
Table 9: 7 and 28 day readmissions for Specified frailty and 80+ years
patients: Usual care vs. OAAU care (Sep 14–Aug 15)
Patient
group
%
Readmissions
at:
Usual
care
OAAU
care
Difference Lower
95% CI
Upper
95% CI
Sp. frailty 7 days 3.5 % 6.6 % +3.1% +0.4 +6.9%
Sp. frailty 28 day 7.2 % 12.9 % +5.6 % +1.7 +10.5%
80+ years 7 days 7.6 % 5.3% -2.3 % -4.3 +0.24%
80+ years 28 day 16.9% 10.6% -6.3% -9.2 -3.0%
Estimation of cost difference associated with new model of care
The direct cost per day associated with a geriatric assessment admission in the RAH
is £205. A reduction in length of stay of 3.3 days (as observed in the 80+ patient
group) therefore equates to a cost difference of -£676.5 (95% confidence interval -
£643.7-£709.3) per admission.
An average of 43 patients per month aged over 80 years were seen in the OAAU,
therefore over the cost of the year there was a potential cost difference of -£349,074
associated with the reduction in length of stay observed with this model of care. This
exceeds the overall estimated roll-out costs of the unit of £312,000.

Chest Pain Assessment Unit Page 38 of 99
4. Process factors
Patient selection
There were fewer than expected referrals from the ED; contributing factors have
been identified as the need to raise and maintain awareness of the service among
ED staff, and ensuring consistent availability of assessment beds into which to
accept patients.
The role of the ECAN has been important in identifying patients in the ED and AMU,
and also as a means of raising awareness and communicating with staff in other
areas of the hospital.
GP referrals were deliberately not targeted by this initiative, as it was felt that
patients who had been reviewed recently by their GP and found requiring admission
would be less likely to be candidates for early discharge than self-referrals to the
hospital.
Given that only 14.1% of patients with the specified frailty conditions were assessed
in the OAAU, it seems likely that there is potential for a greater number of patients to
benefit from the service, even allowing for the fact that a proportion of the remainder
may not have met the criteria for the OAAU.
Unit operation
Daily consultant and AHP review were important in allowing earlier discharge and
the combination of assessment and short stay beds supports early discharge where
possible.
Bed Pressure
It was difficult to protect the assessment beds at times of bed pressure. This
impacted unit effectiveness, as well as having downstream effects, for example not
being able to accept ED patients may impact on referral rates and awareness.

Chest Pain Assessment Unit Page 39 of 99
Recruitment
Difficulty in recruiting consultant staff meant there were issues in maintaining cover
for the unit, and cross-cover for other DME clinical areas. This, at times, affected the
ability of the OAAU to remain open, or function as intended, as well as impacting the
overall cost of the unit due to the need to use locum cover.
Discharge services
Active early discharge planning, including involvement in the daily discharge
“huddles” and work of the multi-agency discharge hub, supported early discharge.
The existing good, cohesive and experienced community team, enhanced by
additional input from the OOH community Inreach service provided a context where
there were the appropriate services to support discharge.
Medical follow-up and planning could take place via the joint hospital-community
MDT and the day hospital, meaning that patients could be allowed home but
continue to have consultant geriatrician input into their care.
Patient flow in hospital; boarding and transfers
One aim of the OAAU was to free capacity within the DME wards through the
efficient management of patients with a potentially short length of stay. This capacity
would then allow other patients to move more quickly from medical admissions
(AMU) to a DME bed, without a period of boarding on another ward. A two week
audit undertaken in May 2015 suggested that there had been a reduction in the
number of patients waiting for a transfer from a medical bed to a DME bed.
The OAAU was located in what was ward 6; this ward had previously accepted
patients from the Stroke Unit who required medium-term rehabilitation. One
unintended consequence of the OAAU unit was high occupancy within the adjacent
Stroke Unit, due to the loss of these “downstream” rehabilitation beds. An alternative
rehabilitation ward had to be identified for this patient group in order to maintain
availability of acute beds in the Stroke Unit.
Clinical lead
A strong clinical lead has been vital to the inception and successful implementation
of this project.

Out of hours Community Inreach Service Page 40 of 99
Out of Hours Community Inreach Service
1. Description
Patient group
These are patients who are in need of additional support to prevent admission to
hospital, or facilitate discharge from hospital.
Project aims
Provide a range of support to allow an alternative to admission or safe discharge
earlier from hospital
Support key points of transition both in and out of hours to support the whole
system to shift the balance of care.
Support and facilitate improved relationships and ways of working with other
services to facilitate longer term change and management of patients out with
hospital.
Existing model of care
The Rapid Response team of the Renfrewshire Rehabilitation and Enablement
Service (RES) offered access to PT, OT, nursing, dietetic and technical assessment
and support to patients referred urgently by their GP or hospital. It operated 0830-
1900 Mon-Fri.
New Service Model
The Out of Hours Community Inreach Service aimed to support key points of
transition both in and out of hours. Community social workers coordinated a range of
supports to prevent admission and support discharge, working alongside the Rapid
Response team. Key additions were the provision of a transport and resettlement
service (including transport of equipment) and the extension of hours of working
(1330-2000 Mon-Fri and 0900-1700 weekends). The team worked within the multi-
agency discharge hub following its establishment in Feb 2015.

Out of hours Community Inreach Service Page 41 of 99
Rationale for inclusion in the RDP
Transport and resettlement were felt to be important elements in smoothing the
interface between hospital and community care. Provision of this service out of hours
was intended to support the provision of a 7 day service and allow safe earlier
discharge to promote shifting the balance of care.
Evidence base
Case studies describing similar services elsewhere in the UK are available in
Deloitte 2012 (11) and Zinovieff & Robinson 2010 (12). Each of these found
evidence that transport and resettlement had the potential to reduce stay in hospital
and improve patient experience.
Available evaluation data
Out of Hours Inreach service database
Linked SMR01 data for OAAU patients using the Inreach service
2. Project Activity September 2014-August 2015
334 patients supported by Inreach service
27% of referrals were from the OAAU, 25% from the ED, and 25% from
other wards
Mean age 79.4 years (range 16-98)
Patient numbers
Recruitment delays meant that the service did not commence until Nov 2014.
Numbers of patients supported gradually increased, peaking at mean of around 2
patients per day in July 2015 (refer Figure 11).

Out of hours Community Inreach Service Page 42 of 99
Figure 11: Patients supported by RAH Inreach service (number and average
per day) by month, Nov 2014-Aug 2015
Referral source
Overall the OAAU referred 27% of patients to the service, ED and other wards 25%
each, MAU and AMU together 16%. The pattern of referral source changed over the
first year of operation, as seen in Figure 12. The proportion of patients from OAAU
remained relatively constant at 20-30%. In the initial months a large proportion of
patients were from the ED; however by Aug 2015 the vast majority of patients were
referred from other wards, with only around 5% from the ED.
0.0
0.5
1.0
1.5
2.0
2.5
0
10
20
30
40
50
60
70
NOV DEC JAN FEB MAR APR MAY JUN JUL AUG
Ave
rag
e d
aily
nu
mb
er
of
pa
tie
nts
Nu
mb
er
of
pa
tie
nts
by
mo
nth
Month
Number of patients Average daily number of patients

Out of hours Community Inreach Service Page 43 of 99
Figure 12: Total number of patients supported by RAH Inreach service, and
proportion of patients by referral location, Nov 2014-Aug 2015
Inreach and the OAAU
13.6% of OAAU patients were supported by the Inreach service on discharge. This
patient group had an average length of stay of 3.6 days
3. Process factors
Reach and referrals
Referrals were lower than expected and the service has capacity to assist a larger
number of patients. Contributing factors to low reach were difficulties in recruitment
and initiation of the project, visibility of the service and awareness among clinical
leaders in other areas.
Adaptations
There were a number of adaptations of the service over the first year of operation, in
response to recognised issues and wider circumstances:
Adoption of uniform – in order to promote team working and visibility
Involvement in multiagency discharge hub and daily huddles – this has
enhanced awareness and uptake of the service in other wards
0
10
20
30
40
50
60
0%
10%
20%
30%
40%
50%
60%
70%
80%
90%
100%
NOV DEC JAN FEB MAR APR MAY JUN JUL AUG
Nu
mb
er
of
pa
tie
nts
su
pp
ort
ed
Pro
po
rtio
n o
f p
atie
nts
re
ferr
ed
fro
m
sou
rce
Month
Other
AMU/MAU
Other wards
Emergency
Dept.
OAAU
Total number
of patients
supported

Out of hours Community Inreach Service Page 44 of 99
Carrying home adaptation aids – to allow prompt, supported discharge of
patients requiring simple aids
Integrated working
There were some cultural barriers encountered in providing a joint working team and
accommodating social care workers within the hospital. Service managers have
been crucial in promoting an integrated service model and providing leadership in
this respect.

Enhanced Pharmacy Services Page 45 of 99
Enhanced Pharmacy Services
1. Description
Patient group
These are patients resident in the Renfrewshire area being admitted to or discharged
from the RAH and patients in the community on multiple medications or high-risk
medicine combinations.
Project aims
Improve prescribing accuracy and medication compliance
Reduce the number of patients admitted as a result of medication issues
Expedite discharge from acute settings
Existing model of care
When patients are seen in hospital as an emergency, communication of medicines
information often relies upon the Emergency Care Summary (ECS). The accuracy of
this depends on the process for medicines reconciliation and updating of ECS in the
community; prior to the RDP, the approach to this varied by GP practice.
Upon discharge from hospital, communication of medicines information to the
community pharmacy for patients using a compliance aid (also known as a
Monitored Dosage System – MDS, or “dosette box”) was via a posted copy of the
Immediate Discharge Letter (IDL). Any delay in this process could lead to a medicine
changed in hospital not being changed in the MDS compliance aid, with consequent
medication errors.
Medicine reconciliation support for patients supported by the Rehabilitation and
Enablement Service (RES) was undertaken by an interface pharmacist. It was felt
that a large volume of time was spent on technical medication issues and additional
support for patients on multiple medications would be helpful.

Enhanced Pharmacy Services Page 46 of 99
New service model
There were four elements to the work undertaken:
A pharmacy technician-led medicines reconciliation service for patients on
multiple medications. Referrals were received initially from GPs and then
extended to Homecare, RES and Community nurses. Patients were visited at
home for a medicines review and interventions as required, e.g. drug education,
prescription changes, initiation of MDS compliance aid.
Application of the Scottish Patient Safety Project (SPSP) approach to high-risk
medications across 10 pharmacies in Paisley, through development of a care
bundle for patients prescribed oral NSAIDs. The care bundle consisted of 6
questions used by community pharmacists to identify patients at high risk of
acute kidney injury or gastrointestinal bleeding (see Figure 13).
Development of an electronic process for timely communication of discharge
medications for patients using MDS compliance aids.
Improved medicines reconciliation procedures were adopted within primary care,
implemented using the methods of the SPSP.
Figure 13: Care bundle questions for Pharmacists to address re oral NSAID
prescriptions
Have you checked that the patient is concordant with taking their NSAID?
Have you checked if the patient is experiencing adverse drug reactions or side
effects?
Has gastroprotection been prescribed for high-risk patients?
For patients identified as taking other high risk drugs, has this risk been
highlighted to the prescriber?
If the prescriber was contacted, was the resulting review communicated back
to the pharmacy?
Has this change been discussed with the patient/carer?

Enhanced Pharmacy Services Page 47 of 99
Rationale for inclusion in the RDP
Clear communication of drug prescriptions at the interface of care is important to
smooth transitions of care. Improving these systems aims to enhance the quality of
care and patient safety and supports the reduction of undue delays to discharge.
Medication reconciliation in the community has the potential to reduce emergency
admissions due to high-risk prescribing or failure of communication of medication
alterations. The enhanced pharmacy services projects worked across hospital and
community services and involved staff from General Practice, RES and homecare.
Available evaluation data
Emergency Care Summary accuracy
Compliance with SPSP high-risk co-prescribing care bundle
2. Project Activity
Pharmacy technician-led reconciliation service
A total of 45 referrals were made to the reconciliation service in the first
year of operation
The majority of referrals were from the RES team and GPs, with most
made following discharge from hospital
Key activities in the technician visit were drug education (36%) and
changes to prescriptions (22%)
17% of referrals were declined by the patient
Enhanced Pharmacy Services Page 48 of 99
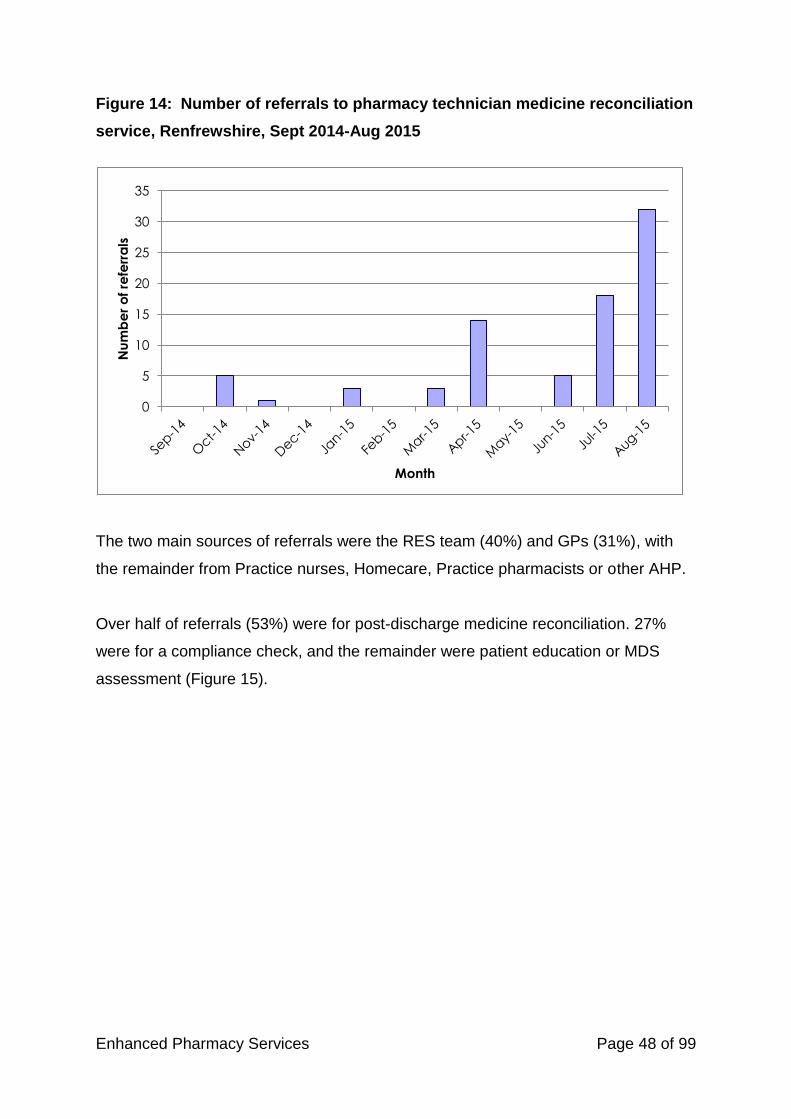
Figure 14: Number of referrals to pharmacy technician medicine reconciliation
service, Renfrewshire, Sept 2014-Aug 2015
The two main sources of referrals were the RES team (40%) and GPs (31%), with
the remainder from Practice nurses, Homecare, Practice pharmacists or other AHP.
Over half of referrals (53%) were for post-discharge medicine reconciliation. 27%
were for a compliance check, and the remainder were patient education or MDS
assessment (Figure 15).
0
5
10
15
20
25
30
35
Nu
mb
er
of
refe
rra
ls
Month

Enhanced Pharmacy Services Page 49 of 99
Figure 15: Outcome of pharmacy technician visit following reconciliation
referral
Communication of discharge prescription to community pharmacy
A medication short-life working group identified issues with delays in communication
to community pharmacies for patients receiving compliance aids due to the
implementation of a revised faxing policy.
Pharmacy and IT services collaborated to establish secure clinical mailboxes for all
44 Renfrewshire Community Pharmacies and the RAH Pharmacy department to
facilitate timely e-mail communication of the IDL following discharge from the RAH.
An electronic copy of the IDL for the target patient group was sent to the patient’s
nominated pharmacy (with consent) within 24 hours of their discharge from the RAH.
17%
2%
36%
5%
3%
22%
12%
3% Declined visit
No issues
Drug education given
MDS initiated
Altered formulation
Drug started/stopped/dose
altered
Query to prescriber
Error detected

Enhanced Pharmacy Services Page 50 of 99
” After coming out of hospital I had medicines everywhere and they all look
different from what I had before. You have helped me to sort out what I should
and shouldn’t be taking.”
“You organizing this pill box for me will help to remember to take my
medicine. It has been a big help”
“It is good to have someone go over
what medicines I am on and why I take
them”
3. Outcomes
Patient satisfaction
A range of positive feedback was received from patients (Figure 16)
Figure 16: Quotes from patients visited by the technician-led pharmacy
reconciliation service
Accuracy of ECS on admission to hospital
Medicines reconciliation was undertaken for patients admitted to the RAH CCU. This
was compared to the medicines information contained in the ECS, to assess the
accuracy of ECS (Table 10). This exercise had previously been undertaken in 2013,
prior to the implementation of the SPSP medicine reconciliation approach in primary
care.
Table 10: Proportion of Emergency Care summaries found to be accurate and
number of severe discrepancies, RAH CCU 2013 and 2015
2013 2015
Percentage of ECS
accurate
48% 61%
Number of severe
discrepancies
0 0

Enhanced Pharmacy Services Page 51 of 99
Staff satisfaction
A high degree of satisfaction was reported with the e-mail system from the RAH
pharmacy to community pharmacists. More than 80% respondents preferred the
new system, noting it was easy to use and that information about medicine changes
was received sooner.
Quote from Renfrewshire community pharmacist
Compliance with the SPSP high-risk oral NSAID co-prescribing care bundle
Compliance with the NSAID care bundle in community pharmacies varied between
60 and 98% over the course of the first half of 2015 (see Figure 17).
Figure 17: Percentage of pharmacy data returns compliant with the SPSP
high-risk NSAID co-prescribing care bundle, 10 participating Renfrewshire
practices, Jan 2015-July 2015
0
10
20
30
40
50
60
70
80
90
100
Jan-15 Feb-15 Mar-15 Apr-15 May-15 Jun-15 Jul-15
Pe
rce
nta
ge
co
mp
lia
nc
e
Month
Questions 1-4 Questions 5-6
Love the new system! Very beneficial, allows us to
be proactive in response to IDL when in the past we
often wouldn’t know anything until the patient ran out
of medication. Good to have some background
information on condition too.

Enhanced Pharmacy Services Page 52 of 99
4. Process factors
Referral process (GP to community reconciliation service) – GPs were initially
required to make referrals via an nhs.net email account. Referral numbers were
lower than expected and when reviewed in conjunction with the GPs, the referral
process was identified as a potential barrier. Steps have therefore been taken to
facilitate referral via SCI gateway in keeping with the process for other GP referrals.
Joint working – the RDP has supported the development of improved relationships
and trust across health and social care and community and hospital services. The
relationships built and service improvement techniques adopted have led to a
number of other initiatives being undertaken.

Enhanced Anticipatory Care Planning Page 53 of 99
Enhanced Anticipatory Care Planning
1. Description
Patient group
Patients registered with 13 participating Renfrewshire General Practices who fall into
one of the following target groups:
Care home patients
Discharged patients on multiple medications
Patients with dementia
Patients with complex and intensive needs
Project aims
Increase ACP coverage
Improve shared knowledge and skills among GPs, community and acute services
staff
Improve communication and information sharing between patients, health and
social care staff
Reduce unplanned hospitalisation in patients with multiple morbidities
In patients admitted to hospital, enable a proactive approach to discharge
Increase the proportion of expected death which occur at home
Existing model of care
Anticipatory Care Planning formed part of the Quality and Outcomes Framework
(QOF) for GP Practices in Scotland, with the Quality and Safety Domain indicator
005(S) describing that practices should complete ACPs for 30% of their patients at
highest risk of emergency admission (the 5% highest risk, as assessed, for example,
by SPARRA score). QOF describes a minimum information requirement and the
expectation that eKIS will be used as a summary and means of sharing the ACP (13).
New service model
Extension of anticipatory care planning to a larger number of patients than that
required by QOF 005(S); within the above target groups. Practices were paid an item

Enhanced Anticipatory Care Planning Page 54 of 99
of service for each ACP completed or updated. Additional work was undertaken to
improve awareness and use of eKIS among health care colleagues involved in
emergency care and home care, for example training junior hospital doctors and
extending access to eKIS to Community Nurses.
Rationale for inclusion in the RDP
Anticipatory care is identified within the Clinical Services Strategy as a key
characteristic of high quality primary care and anticipatory care planning is seen as a
core element of the clinical service model for frail elderly patients and those with
chronic disease. Enhancement of anticipatory care planning is seen as supporting
improved coordination at times of crisis or care transition, and involvement of primary
care in discharge planning in the event of hospital admission.
Evidence base
A pilot study undertaken in Nairn used an Anticipatory Care Planning approach to
reduce unplanned hospitalisation among patients identified as being high risk of
admission (14). Identified patients developed an ACP with their case manager, as well
as receiving proactive case management and supported discharge in the event of
admission. Those in the ACP group saw statistically significant falls in hospital
admission rate and days in hospital after the intervention, whereas the control group
did not. A lower proportion of ACP patients died in hospital than those in the control
group.
Available evaluation data
Number of eKIS completed and updated
OAAU patients who had eKIS
Online survey of secondary care staff

Enhanced Anticipatory Care Planning Page 55 of 99
2. Project Activity September 2014-August 2015
528 full ACPs were completed and uploaded as eKIS, 171 focused ACPs,
and 553 ACP updates
Mean age of full ACP 76.3 years; focussed ACP 67.4 years
Patient numbers
Data are only available from Dec 2014. There was an average of 59 new ACPs, 19
focussed ACPs and 61 ACP updates each month, across the 13 practices (see Figure
18).
Figure 18: Number of additional new ACP/eKIS and updated eKIS per month, 13
Paisley practices Dec 2014-Aug 2015
Practice level activity
12 of the 13 practices submitted claims for enhanced ACP work; the remaining
practice reported adopting the new service model without claiming (activity figures
may therefore be underestimates). Activity was variable across the practices; mean
completion rate of new ACPs was 9 per 1,000 practice population, range 0-63 per
1,000.
0 20 40 60 80
100 120 140 160 180 200
Dec 2014
Jan 2015
Feb 2015
Mar 2015
Apr 2015
May 2015
Jun 2015
Jul 2015 Aug 2015
Nu
mb
er
co
mp
lete
d
Month
Full ACP eKIS update Focussed ACP

Enhanced Anticipatory Care Planning Page 56 of 99
3. Outcomes
Estimated additional ACPs
In the year Apr 2014-Mar 2015 all 13 practices met QOF indicator Q005(S). If
practices just met the 30% threshold, then this equates to a minimum of 1,230
standard ACPs per year for the combined practice population of 82,000 (1,107 for a 9
month period).
The additional 528 ACPs completed as a result of the RDP therefore represents up to
a 48% increase in ACP numbers.
ACP among OAAU admissions
105 (14.8%) of patients admitted to the OAAU were documented as having had an
eKIS completed
17.0% of patients from Paisley postcodes had eKIS, compared with 9.2% of
patients from other areas
The information contained in the eKIS found to be “useful” (i.e. provided information
relevant to clinical decisions that was not available elsewhere) in 63.8% of cases
(n=67).
Acute staff survey
An online survey was made available to all staff involved in acute out of hours care at
the RAH (GP out of hours, Emergency Dept and Medical admissions) to assess
changes in the awareness and use of eKIS. There was a low response rate, with just 4
respondents, 3 consultants and one trainee from the ED. The findings were:
100% awareness of eKIS and all had accessed at least once in past year
75% make more use of eKIS now than one year ago
50% have used eKIS to inform a clinical decision in the past year (specifically with
reference to knowledge of a patients end of life wishes)
100% stated it would be useful if there were more detailed information within eKIS

Enhanced Anticipatory Care Planning Page 57 of 99
4. Process factors
Consent, access and visibility of eKIS
An eKIS is accessed via Clinical Portal, where it is located within the Electronic Care
Summary (ECS). This raises issues of accessibility and consent; the ECS should only
be accessed by secondary care staff if explicit consent from the patient, or if the need
is urgent and consent not possible. On the other hand an eKIS is designed as a
means for patients to share information; therefore consent for access is given at the
time of completion. It would seem preferable that eKIS was therefore more readily
visible and accessed within Clinical Portal.
Monitoring activity
Not all GP practices submitted claims for the enhanced ACP work and a detailed
baseline of ACP completion was not available. This limits the accuracy with which
activity could be tracked.
Assessing outcomes
It was challenging to assess the outcomes of the enhanced ACP project; there was no
identified comparator group and the majority of available data were focused on
hospital activity. It would have been beneficial to try and capture direct evidence of
admission prevention.

The Health and Social Care Context Page 58 of 99
The Health and Social Care Context
This section describes activity in health and social care in the period directly preceding
and during the RDP. The precise geography varies with the indicator used, and is
stated in each section below.
Where appropriate the observed trends are tested to explore if there are significant
differences, and where available, the findings are placed in the context of changes in
the wider NHSGGC area and Scotland. It is not possible to directly attribute observed
differences described here to the activities in the RDP, but where there are changes
that are plausibly connected in scale and nature, these are highlighted.
1. Hospital activity
Emergency admissions and bed days used – Renfrewshire
How Renfrewshire compares to NHSGGC
Indirect standardisation shows that admissions have been consistently higher than
expected for the population in Renfrewshire since 2012, by contrast the bed days
used in Renfrewshire have been fewer than expected. This indicates that there are
more but shorter admissions in this area, compared with NHSGGC as a whole (see
Figures 23 and 24, Appendix 6).
Trends over time in Renfrewshire
There was no significant difference in the rate of emergency admissions in the RAH in
the RDP year compared with that preceding. There was no significant difference in
bed day usage in the RAH in the RDP year, compared with the preceding year.
Average length of stay – RAH Paisley
Average length of stay has fallen steadily over the observed period, from around 5.5
days at the start of 2013, to just under 5 days by mid-2015. This mirrors the trend seen
across NHSGGC (see Figure 19).

The Health and Social Care Context Page 59 of 99
Reductions in length of stay were most marked in older age groups, and comparisons
with the preceding year found statistically significant differences in those age 65-79
years (5.5 vs. 5.1 days, p=0.0006) and over 80 years (8.0 vs. 7.5 days, p=0.012).
Figure 19: Average length of stay at RAH and rest of NHSGGC, 2013-2015, 3
month rolling averages by age group, Mar 2013-Jul 2015
Delayed discharges – RAH, Paisley
Delayed discharges in the RAH fell dramatically from the start of 2013 to mid-2014.
This was a period when there was significant investment and initiatives in this area as
part of the Change Fund. Delayed discharges in the rest of NHSGGC have only seen
similar reductions since the start of 2015 (see Figure 20).
Over the winter of 2014/5 there was a rise in delayed discharges, a period when there
was significant pressure within the hospital. At the outset of 2015 there were a number
of initiatives to address this within the hospital, including the establishment of a multi-
agency discharge hub and daily discharge huddles. By the end of the RDP period the
number of delayed discharges was similar to the beginning and there was no overall
significant difference compared with the preceding year.
0
1
2
3
4
5
6
7
8
9
10
Da
ys
RAH 80+yrs RAH 65-79 yrs
RAH 0-64 yrs RAH all ages
Other GGC hospitals all ages

The Health and Social Care Context Page 60 of 99
Figure 20: Number of delayed discharges RAH by age and rest of NHSGGC, 3
month rolling averages Mar 2013-Aug 2015
Day of Care Survey – RAH, Paisley
The Day-of-Care survey has been developed to describe and investigate inpatient
delays in acute hospitals. It aims to identify clinical areas or patient groups that might
benefit from changes in service provision. Inpatient medical records are reviewed
against validated criteria describing illness severity and service intensity to determine
if their care is most appropriately provided in an acute inpatient setting (15).
A whole hospital audit was undertaken in the RAH in November 2014, with partial re-
audits of areas with the largest proportion of patients with delays in April 2015, May
2015, and Feb 2016. An overview of results can be found in Table 20, Appendix 6. At
the initial survey 24% of all patients were found not to meet the criteria, a finding in
keeping with other hospitals in Scotland. There was marked variation across the
wards, with the highest proportion of patients with delays in the Rehabilitation and
Assessment (RAD) wards. Repeat surveys have found improvements, particularly in
the medical wards, where the proportion not meeting criteria fell to 10%, but also more
recently in the RAD wards.
0
50
100
150
200
250
0
10
20
30
40
50
60
Ma
r
Ap
r
Ma
y
Ju
n
Ju
l
Au
g
Se
p
Oc
t
No
v
De
c
Ja
n
Fe
b
Ma
r
Ap
r
Ma
y
Ju
n
Ju
l
Au
g
Se
p
Oc
t
No
v
De
c
Ja
n
Fe
b
Ma
r
Ap
r
Ma
y
Ju
n
Ju
l
Au
g
Nu
mb
er
rest
of
GG
C
Nu
mb
er
RA
H
Date
RAH all ages RAH 0-64 yrs RAH 65-79 yrs
RAH 80+ yrs GGC excluding RAH

The Health and Social Care Context Page 61 of 99
2. Primary care activity
General Practice encounters - 13 Paisley GP Practices
There is no clear trend over time in number or rate of GP encounters for any age
group of patient. Data on home visits were also explored by age group, with no
evidence of change in the RDP period compared with the preceding year (see Figure
25, Appendix).
GP Out-of-hours contacts – residents of Paisley postcodes
The trend in out-of-hours GP contacts was the same in NHSGGC and Paisley, but the
rate of contact is lower in Paisley, approx. 1.5 fewer contacts per day. There is a slight
increase in contacts over time in both areas, but no significant difference in the RDP
year compared with previous (see Figure 26, Appendix 6).
Community nursing contacts – 13 Paisley practices
There was an increase in both the number and rate of community nursing contacts
from March 2015, as shown in Figure 21. The increase in number of contacts
compared with the preceding year was statistically significant in those aged 65-74
(+108 contacts/month, 95% confidence interval 105-111, p-value=0.006) and 75+
years (+ 176 contacts/month, 95% confidence interval 116-237, p-value=0.039). The
overall increase amounted to an average of 284 more visits per month in the year Sep
2014- Aug 2015 (95% CI 221-348). This is an increase of 6.7% increase on the
previous year.

The Health and Social Care Context Page 62 of 99
Figure 21: Community nursing contacts in 13 Paisley Practices, rate per 1,000
by age group and total number, 3 month rolling averages Sep 2013-Aug 2015
3. Social Care provision
Home care – Renfrewshire
The number of hours of care provided, the number of people in Renfrewshire receiving
home care and the proportion of those aged over 65 years being supported, has
steadily increased over recent years (see Figure 22). In each case there was a
statistically significant increase in provision in the year Sep 14-Aug 15 compared with
the preceding year (see Table 11).
The proportion of those aged 65+ years receiving care in Renfrewshire was
significantly lower than the Scottish average in 2011 (9.0% vs. 16.6%) and the
observed increase in Renfrewshire saw this gap narrow by 2015 (14.8% vs. 18.1%).
The trend of increasing hours of care provided mirrors the pattern seen across
Scotland, though there was a 36% increase in Renfrewshire over the past 5 years,
compared with a 16% increase across Scotland.
0
1000
2000
3000
4000
5000
6000
7000
0
100
200
300
400
500
600
700
To
tal n
um
be
r o
f c
on
tac
ts
Ra
te o
f c
on
tac
t p
er
1,0
00
po
pu
lati
on
Month
Overall rate 0-64 yrs 65-74 yrs
75+ yrs Number of visits
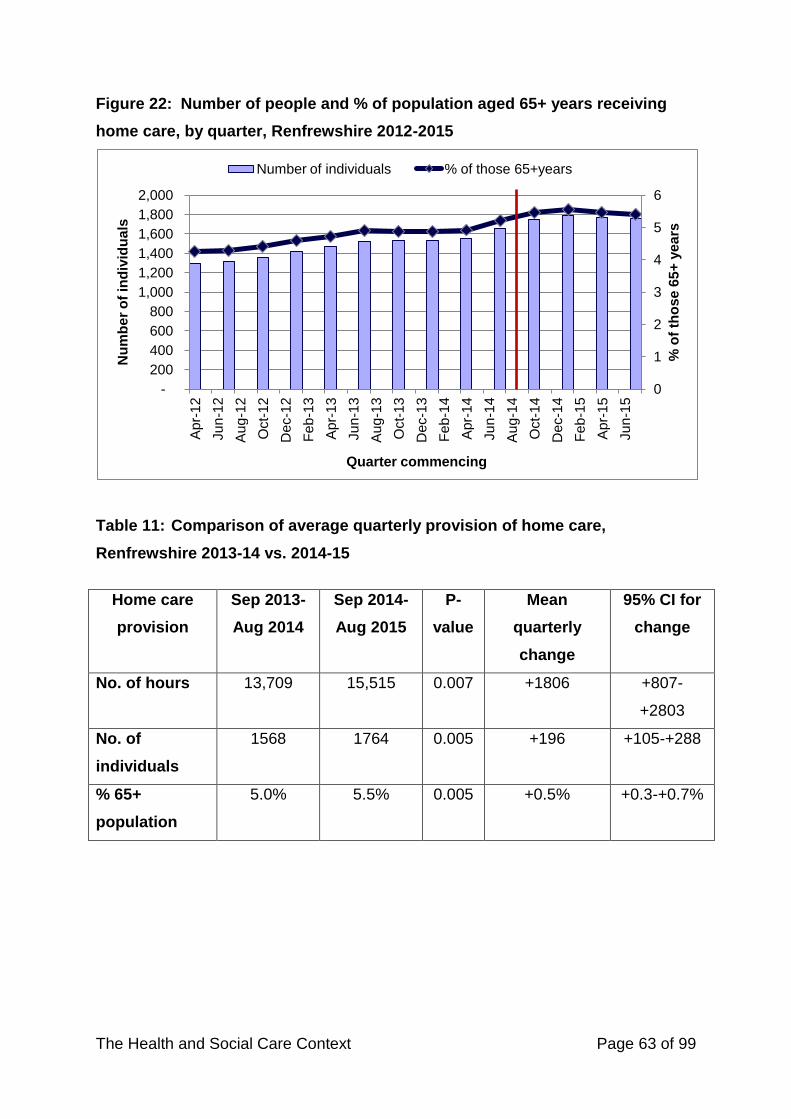
The Health and Social Care Context Page 63 of 99
Figure 22: Number of people and % of population aged 65+ years receiving
home care, by quarter, Renfrewshire 2012-2015
Table 11: Comparison of average quarterly provision of home care,
Renfrewshire 2013-14 vs. 2014-15
Home care
provision
Sep 2013-
Aug 2014
Sep 2014-
Aug 2015
P-
value
Mean
quarterly
change
95% CI for
change
No. of hours 13,709 15,515 0.007 +1806 +807-
+2803
No. of
individuals
1568 1764 0.005 +196 +105-+288
% 65+
population
5.0% 5.5% 0.005 +0.5% +0.3-+0.7%
0
1
2
3
4
5
6
-
200
400
600
800
1,000
1,200
1,400
1,600
1,800
2,000 A
pr-
12
Ju
n-1
2
Au
g-1
2
Oct-
12
De
c-1
2
Fe
b-1
3
Ap
r-1
3
Ju
n-1
3
Au
g-1
3
Oct-
13
De
c-1
3
Fe
b-1
4
Ap
r-1
4
Ju
n-1
4
Au
g-1
4
Oct-
14
De
c-1
4
Fe
b-1
5
Ap
r-1
5
Ju
n-1
5
% o
f th
os
e 6
5+
ye
ars
Nu
mb
er
of
ind
ivid
ua
ls
Quarter commencing
Number of individuals % of those 65+years

The Health and Social Care Context Page 64 of 99
4. Deaths
Standardised mortality ratios (SMR)
These data show the ratio of number of observed deaths to the number of expected
death, allowing for the age, sex and deprivation of the population, with a result of 100
indicating a match between observed and expected and results over 100 indicating
more deaths than would be expected. Over the 3 year period April 2012-March 2015
there was an excess of deaths in Renfrewshire (SMR=110, 95% CI 107-113), and in
the 12 Paisley practices (SMR=109, 95% CI 104-113). There is no clear trend in SMR
over time, as shown in Figure 27, Appendix 6.
Proportion of deaths which occur in hospital
The proportion of deaths which occurred in hospital was slightly lower in Renfrewshire
(41.7%) than in the rest of NHSGGC (43.4%), see Table 12. This overall difference is
largely attributable to a more notable difference in those aged over 80 years (45.1%
vs. 50.8%). However, over the past three years the proportion in Renfrewshire has
increased slightly, and that in NHSGGC fallen, so that they have converged at 40%
overall in the most recent quarter (Jul-Sep 2015), see Figure 28, Appendix 6 for
details.
Table 12: Proportion of death which occurred in hospital (%), by area and age
group, April 2012-Sep 2015
Age group NHSGGC Renfrewshire 13 Paisley
practices
All ages 43.4 % 41.7 % 42.1 %
0-64 years 6.9 % 6.6 % -
65-79 years 56.4 % 55.2 % -
80+ years 50.8 % 45.1 % -

The RDP - overall strengths and challenges Page 65 of 99
The Renfrewshire Development Programme: overall strengths and
challenges
The Renfrewshire Development Programme facilitated health and social care
professionals, from both hospital and community settings, across a geographical
area, working together to develop and improve local services. It combined working to
a board-wide strategic vision with identifying local priorities and opportunities.
The outcomes from this programme extend beyond the above findings from each of
the projects and include broader changes brought about through this way of working.
These changes have been captured through formal and informal feedback from the
project team. An online questionnaire, to which there were 8 respondents, gathered
their experiences; identified strengths and challenges of the RDP are summarised
below:
Strengths:
Good communication and relationships were built between hospital and
community professionals; this has facilitated ongoing service developments6
Strong commitment of individuals involved
Taking on issues previously seen as “unsolvable”
Promotes organisational development focused on people
Challenges:
Need to ensure all stakeholders engaged; for example there has been limited
involvement from transport and ambulance services
Pressure to demonstrate impact in short time-frame and short time-frame for the
establishment of projects
Need protected time for those involved; this has cost implications and also
requires the support of colleagues and managers
Must ensure ongoing demonstration of high-level commitment to programme
6 Examples include: access for GPs to the B-nariuretic peptide (BNP) test for diagnosis of heart failure when this was previously only available as a hospital test; and work between GPs and Renfrewshire Learning Disabilities team to increase the number of people with LD having ACPs.

The RDP - overall strengths and challenges Page 66 of 99
Maintaining continuity of team members over the whole period of the programme
and where this is not possible capturing the groups knowledge, actions and
intentions in order that there can be overall continuity within the programme and
evaluation
Every respondent stated that the improved communication and relationships across
community health and social care services and hospital services that have resulted
from this work has been a major success.
Quotations from members of the RDP team
“The core project team continued to give the work their focus
despite significant pressures during this time showing real
resilience with positive achievements”
“I really enjoyed being part of RDP. The people I worked with were great and enthusiastic. We achieved some
good outcomes and have made positive changes”

Conclusions and Discussion Page 67 of 99
Conclusions and discussion
Activity
Activity in the projects was variable over the year; this was attributable to a number
of factors, including difficulties in staff recruitment, lag-time in start up of new
initiatives and suspension of assessment beds due to bed pressure within the
hospital. Periods of closure impacted on the realisation of potential benefits of the
units, not only due to a reduction in the available service, but also due to knock-on
effects in terms of embedding the use and approach of the units in usual clinical
practice in the hospital.
In the development of discrete units such as the CPAU and OAAU there is a tension
in patient selection between identifying those most likely to benefit, and accepting a
wide enough patient group in order that the maximum number will benefit (the
sensitivity and specificity of patient selection). It is probable that both units could
support higher levels of activity, given consistent staffing, bed availability, patient
referrals and selection criteria, and that this would realise greater benefits than those
observed.
Effectiveness
Reductions in length of stay were seen for the patient groups managed in the CPAU
and the OAAU. The Inreach service has been a facilitator of the way of working of
the OAAU, and may have contributed to wider reductions in LOS in the hospital. The
effectiveness of these services is also linked to a number of other contextual factors,
such as the existing good links with community services, the community-hospital
MDT, development of the multi-agency discharge hub, and availability of the high-
sensitivity troponin test.
The enhanced ACP project was successful in increasing the number of target
patients with ACP completed and updated on eKIS from participating practices.
Evidence from the hospital staff survey suggests that this information is useful in
guiding clinical decision making when patients are brought in as an emergency.

Conclusions and Discussion Page 68 of 99
The RDP overall has been effective in building links and improving communication
between hospital and community health and social care professionals. Stakeholder
involvement in project selection led to the identification of projects felt to meet local
needs and to fit well with existing local service. Although a strength, it also means
that recommendations must consider that circumstances may vary in other areas,
and reflect the degree to which findings are generalisable.
Safety
The main available measure of safety is all-cause readmissions at 7 and 28 days.
For the CPAU these were lower than comparable groups, providing reassurance that
this is a safe model of care. For the OAAU there was some variability over the year,
but overall there is not a consistently higher rate of readmission than in comparable
patient groups. Given that this model of care might be expected to result in some
increase readmissions, this is reassuring. Readmission data were not available for
patients whose discharge was supported by the Inreach service.
Acceptability
Feedback from patients and relatives indicates high levels of satisfaction with the
standards of care provided and overall approval of the model of care. Evidence from
staff focus groups and informal feedback suggests that overall they have found it
satisfying to work in these settings and that they feel able to deliver a good level of
patient care.
Feedback from the project team showed that those involved in the RDP found it a
valuable and rewarding way of working.
Equity
Insufficient data were available to make a detailed analysis of the equity impact of
the projects. The projects all aim to prevent or improve patient care during
emergency admissions, and therefore may benefit those living in the most deprived
areas that experience the highest rates of emergency hospital admission.
On the other hand, some of projects target those with simpler or more limited
conditions that allow for early discharge, therefore complex patients with multi-
morbidity are unlikely to experience care in these projects. In fact the majority of

Conclusions and Discussion Page 69 of 99
older adults and those having troponin testing for chest pain continued to be cared
for in the “usual care” pathways of medical assessment. There is an assumption that
streamlining the care for some patient groups will also improve care for others
through the alleviation of pressure and appropriate use of beds, but this assumption
has not been fully explored. It is important that the quality of “usual care” is
monitored and enhanced.
Cost
Reductions in length of stay have resulted in theoretical cost differences for the
targeted patient groups that are in keeping with or greater than the cost of running
the projects. As there have not been overall bed closures within the hospital these
cost differences have not been realised as cash savings. However they indicate that
expenditure on new models of care can realise comparable savings and contribute to
improved care, overall hospital efficiency and care of patients in the most appropriate
clinical areas.
Shifting the balance of care
During the project year there were overall reductions in hospital length of stay for
those aged over 65 years, in conjunction with increases in community nursing care
and home care, compared with the previous year. It is not possible to attribute these
changes directly to RDP initiatives as they may in part represent longer time trends
attributable to wider demographic and service factors. However these changes
would represent success in shifting the balance of care.
The models of care explored by the RDP emphasised reductions in demand for
secondary care by reducing lengths of stay. Beyond the development of enhanced
ACPs there was less work on admission prevention and increasing the supply of
alternative models of care in other settings. This element is an opportunity for
attention in the future and in other geographical areas.
There was also a focus on physically discrete units and teams that target particular
patient groups by diagnosis or condition. This has been a useful way to start working
on new service models and to build staff engagement and momentum. It also allows

Conclusions and Discussion Page 70 of 99
the analysis of outcomes by unit. However, there is a risk of fragmentation of care by
condition rather than the intended integration at the individual patient level.

Evaluating the RDP: limitations, constraints and lessons learned Page 71 of 99
Evaluating the RDP: limitations, constraints and lessons learned
1. Limitations
Data completeness and accuracy
Hospital data
This was based upon routinely collected data with validated coding practices. The
treatment of assessment and ambulatory care patients within admission data, has,
however, proved problematic. The advent of Medical Assessment Units for the
assessment of GP referrals to hospital means that these patients are now usually
counted as an admission, even if discharged the same day, whereas previously
would have been seen and discharged from the ED. The changes in this over time
and between places limit comparability. In the RAH ambulatory care patients
returning to MAU for further investigations or treatment were being counted as
“readmissions” and therefore had to be excluded from analysis.
GP data
Analysis of the GP activity data revealed significant discrepancies in the recording of
encounters and encounter type. This was further investigated by Health Information
and Technology (HI&T) colleagues and found to be attributable to variable
administrative practices. The accuracy of overall encounters was improved by the
removal of those coded as “administrative” and guidelines developed for the
improvement of encounter recording (16).
Local databases
Local databases maintained by the projects have been a valuable source of data, but
are not validated and may, for example, be subject to inter-user variability in
recording and also have issues with completeness. For example, when the CPU was
closed due to bed pressure in spring 2015, the troponin testing database could not
be maintained as the Chest pain specialist nurses were temporarily redeployed to
other clinical activities.

Evaluating the RDP: limitations, constraints and lessons learned Page 72 of 99
Qualitative data
Technical issues with the recording and transcribing of a number of the focus groups
have limited the completeness of the record and hence the ability to formally analyse
these data.
Comparisons
There are a number of possible sources of error in the comparisons made. The small
numbers involved in the project groups, particularly when looking at subgroups such
as readmissions, means that there it is harder to reduce the role of chance in
observed differences.
There is an inherent bias when comparing patients who experience usual care vs.
those in the RDP projects, as those in the project group were specifically selected as
being likely to benefit from the CPU/OAAU. Patients receiving usual care may have
done so for a number of reasons including time of day of presentation (i.e. when unit
is closed), capacity within the unit (no assessment beds available), or patient
characteristics that excluded them (i.e. not meeting unit criteria). The limited data
available on the comparison group mean it is not possible to determine which of
these factors were most important. This limitation does not invalidate the findings,
but should be recognised. On the other hand, if a selection bias is present then it
does also indicate that the selection criteria of the units were successfully identifying
the appropriate patient group.
Confounding factors may play a role in the difference observed between groups.
Over time there may be other influences, not measured here, that have led to
changes in outcomes. When comparing between groups there is also the potential
for elements of the intervention to spread beyond the project unit itself. For example
other clinical areas may adopt the active discharge planning processes of the OAAU,
or use the chest pain assessment protocol to support investigation and prompt
discharge. Such cultural changes in practice and shared learning may well be
beneficial, but may also dilute the observed effects of the intervention in the project
group.

Evaluating the RDP: limitations, constraints and lessons learned Page 73 of 99
2. Constraints
The described limitations are, in part, attributable to a number of constraints on the
evaluation process. These included the available time and resources, availability of
data and continuity issues in the planning and undertaking of project monitoring and
evaluation.
3. Lessons learned-what would we do differently?
The monitoring and evaluation functions
The blurring of these two roles led to a lack of clarity over the function of each and
the appropriate data and time scales required. Maintaining clearer separation of the
monitoring and evaluation functions would have improved efficiency and clarity.
Additional data and analysis
There are a number of areas where additional data would have improved the rigour
of analysis or depth of understanding. In particular, having routinely recorded frailty
and HEART scores would have allowed identification of patients that were
candidates for care in the OAAU/CPAU but received usual care as a comparator
group. Additionally the ability to identify frail patients and monitor their outcomes will
be important in providing evidence that we are meeting the Care of Older People in
Hospital standards (17).
More detail on patient journeys within the hospital would contribute to an
understanding of how efficient and appropriate care was for patients, both within the
units and those receiving usual care. The majority of data was drawn from routine
hospital-based sources; this presented a challenge when exploring the impact of
ACPs where the aim was to avoid admission. Further attention should be given to
the means of tracking patient progress in the community.
Rational, outcome-focussed data use
A large volume of data was gathered as part of both the monitoring and evaluation of
the RDP. Only a relatively small proportion of this contributed directly to the

Evaluating the RDP: limitations, constraints and lessons learned Page 74 of 99
assessment of discrete outcomes. Clear description of a small number of key
measurable outcomes would support rational data gathering.

Recommendations 1: The Renfrewshire Development Programme Page 75 of 99
Recommendations 1: The Renfrewshire Development Programme
These recommendations relate to the future functioning of the Renfrewshire
Development Programme and the projects initiated through it.
The current RDP projects should be continued, with preservation of the
capacity to assess new patients at peak times
Attention should be given to selection criteria, referral pathways and
assessment capacity of these projects to ensure that maximum use is made of
these services and realise benefits for the largest possible number of patients
To ensure equitable use of resources, evidence should be gathered to support
the assumption that units such as the CPAU and OAAU free capacity and
enhance care quality elsewhere in the hospital (standard acute assessment
areas) through the most appropriate use of beds
Maintenance of successful outcomes will depend on sufficient service capacity
in community health and social care

Recommendations 2: Using the RDP findings Page 76 of 99
Recommendations 2: Using RDP findings to support wider
implementation of the Clinical Services Strategy
These recommendations describe how these findings might influence service
developments across NHSGGC. They are based on the evaluation evidence and
reflections on their relevance, particularly taking into account discussions at the RDP
Feedback stakeholder event.
Future initiatives should take account of the development of models of care in
alternative, non-acute settings in addition to the reduction of demand in
hospital, and work towards an integrated approach to care at the individual
patient level
Clear structures through which learning and experience (from the RDP and
future initiatives) can be disseminated across the health board should be
identified or, where no appropriate network exists, developed
Identification of future initiatives will need to balance the benefits of local
knowledge and devolved project development, with the drive for a standardised
approach to acute assessment across NHSGGC and the need to ensure
sufficient attention to challenging areas e.g. multi-morbidity

Recommendations 3: Data, monitoring and evaluation Page 77 of 99
Recommendations 3: Data, monitoring and evaluation
These recommendations describe how data should be used rationally to support
future health service monitoring and evaluation, and where gaps in the data exist
how they might be addressed.
Collection and analysis of data should be matched to purpose, outcomes and time
scales at the following three levels:
Monitoring data – local project activity data, updated regularly and directly
linked to features of the initiative that might be amended in the short-term (e.g.
through PDSA cycle)
Project evaluation data – data on individuals receiving care within new
initiatives, and appropriately matched/randomised control individuals that will
allow assessment of whether the project has met its outcomes
Strategic evaluation data – population level data on key indicators that reflect
whether the board and its constituent areas are moving towards the aims of the
CSS and the 2020 vision
The identified data gathering, access and validity issues should be addressed to
support future monitoring and evaluation efforts, with solutions embedded into
routine health and social care data collection, for example:
Recording of decision-making scores (e.g. HEART and Frailty scores) on
Clinical Portal
A standardised approach to the handling of ambulatory care and acute
assessment care episodes
Measurement of primary care activity that is accessible, comparable and
reliable
Measurement of equity impact of new initiatives

Acknowledgements Page 78 of 99
Acknowledgements
Sharon Adamson Head of Planning NHSGGC
Dr Iain Findlay Consultant Cardiologist RAH
John Gomez Information Manager NHSGGC
Dr Chris Johnstone GP Barony Practice, Paisley
John Kennedy General Manager RAH
Lorna Kelly Head of Policy NHSGGC
Ann Lees Health Economist NHSGGC
Dr Oona-Mary Lucie Consultant Geriatrician RAH
David Leese Director Renfrewshire HSCP
Jacqui McGeough Head of Planning Clyde Sector, NHSGGC
Dr Janice Murtagh Consultant Geriatrician RAH
Sylvia Morrison Primary Care and
Community Services
Renfrewshire HSCP
Angela McLelland Primary Care and
Community Services
Renfrewshire HSCP
Danny McAllion Senior Information and
research analyst
Renfrewshire Council
Jacqueline Nicol General Manager RAH
Hugh O’Pray GP IT facilitator NHSGGC
Frances Paton Business Intelligence
Manager
NHSGGC
Dr Lynne Rush Specialty Registrar Public Health, NHSGGC
Shiona Strachan Head of Adult Services Renfrewshire Council

Bibliography Page 79 of 99
Bibliography
1. NHSGGC. Clinical Services Strategy. 2015.
2. Scottish Government. Achieving Sustainable Quality in Scotland's Healthcare: A
20:20 Vision. 2011.
3. Microsoft. Office Excel. 2007 йил.
4. IBM Corp. . IBM SPSS Statistics for Windows, Version 21.0. s.l. : Armonk, NY:
IBM Corp., 2012 йил.
5. Herbert, Rob. www.pedro.org.au/wp-content/uploads/CIcalculator.xls. [Online]
2011 йил.
6. A prospective validation of the HEART score for chest pain patients at the.
Backus, BE, et al. 2014 йил, International Journal of Cardiology, Vol. 168, pp.
2153-2158.
7. NICE. Myocardial infarction (acute): Early rule out using high-sensitivity troponin
tests. 2014.
8. ESC Guidelines for the management of acute. al, CW Hamm et. 2011 йил,
European Heart Journal, Vol. 32, pp. 2999-3054.
9. Comprehensive geriatric assessment for older adults admitted to hospital: meta-
analysis of randomised controlled trials. al, G Ellis et. 2011 йил, BMJ, Vol. 343.
10. Healthcare Improvement Scotland. Think Frailty. Improving the identification
and management of frailty. . 2014.
11. Deloitte. The economic impact of care in the home services. A report
commissioned by the British Red Cross. 2012.
12. Robinson, F Zinovieff and C. The Role of the Voluntary Sector in Delayed
Transfer of Care (DToC)/Hospital Discharge and Prevention of Readmission. 2010.
13. Scottish Govenrment and BMA.
http://www.sehd.scot.nhs.uk/publications/DC20140502QOFguidance.pdf. Quality
and Outcomes Framework (QOF) guidance for NHS Boards and GP Practices
2014/15. [Online]
14. Anticipatory care planning and integration: a primary care pilot study aimed at
reducing unplanned hospitalisation. Adrian Baker, Paul Leak, Lewis D Ritchie,
Amanda J Lee and Shona Fielding. 2012 йил, British Journal of General Practice.

Bibliography Page 80 of 99
15. Identifying reasons for delays in acute hospitals using the Day-Of-Care Survey
method. Erica Reid, Andrew King, Alex Mathieson, Thomas Woodcock, Simon
W Watkin. 2, 2015 йил, Clinical Medicine , Vol. 15, pp. 117-120.
16. O'Pray, Hugh. Personal Communication. 11/01/2016.
17. Healthcare Improvement Scotland. Care of Older People in Hospital
standards. s.l. : NHS Scotland, 2015.
18. Identifying reasons for delays in acute hospitals using the Day-of-Care Survey
method. Reid, Erica, et al. 2, 2015 йил, Clinical Medicine, Vol. 15, pp. 117-20.

Appendix 1: Programme Board and Project Team Members Page 81 of 99
Appendix 1: Programme Board & Project Team Members
Table 13: Renfrewshire Development Programme Board Members
Name Organisation Role
Dr Jennifer
Armstrong
NHSGGC Medical Director
Ian Beattie Renfrewshire
Council
Head of Adult Services
Mari Brannigan NHSGGC Director of Nursing - Partnerships
Dr Iain Findlay NHSGGC Consultant Cardiologist
Marie Farrell NHSGGC Director Clyde Sector
Dr Rob Gray NHSGGC Staff Side Rep
Dr Cathy Johnman NHSGGC Honorary Consultant Public Health,
NHSGGC and Clinical Senior Lecturer,
University of Glasgow
Dr Chris Johnstone NHSGGC Lead GP
Anne Marie
Kennedy
Overarching
Patient Reference
Group
Patient Representative
John Kennedy NHSGGC General Manager, RAD
Professor Paul
Knight
NHSGGC Associate Medical Director
(Rehabilitation and Assessment
Directorate)
David Leese NHSGGC Chief Officer, Renfrewshire HSCP
Dr Oona-Mary
Lucie
NHSGGC Consultant Geriatrician
Norman Lannigan NHSGGC Head of PPSU
Dr David Murdoch NHSGGC Consultant Cardiologist
Fiona MacKay NHSGGC Head of Strategic Planning and Health
Improvement, Renfrewshire HSCP
Jacqui McGeough NHSGGC Head of Planning, Clyde Sector and
Diagnostics
Dr Janice Murtagh NHSGGC Consultant Geriatrician
Jacqueline Nicol NHSGGC General Manager, ECMS
Catriona Renfrew NHSGGC Director Corporate Planning and Policy
Dr David Stewart NHSGGC Lead Director for Acute Medical Services

Appendix 1: Programme Board and Project Team Members Page 82 of 99
Table 14: Renfrewshire Development Programme Project Team members
Ian Beattie Head of Adult Services, Renfrewshire Council
Iain Findlay Consultant Cardiologist, Royal Alexandra Hospital
Lynda Fenton Specialty Registrar Public Health, NHSGGC
Cathy Johnman Consultant Public Health, NHSGGC
Chris Johnstone GP Clinical Lead
John Kennedy General Manager, RAD, Royal Alexandra Hospital
Oona-Mary Lucie Consultant Geriatrician, Royal Alexandra Hospital
Lees Ann Health Economist
Jacqui McGeough Head of Planning, Clyde Sector and Diagnostics
Angela Mclelland Service Development Officer, Renfrewshire CHP
Janice Murtagh Geriatrician, Royal Alexandra Hospital
Jacqueline Nicol General Manager, ECMS Clyde Sector
Sylvia Morrison Primary Care and Community Services, Renfrewshire HSCP
Spencer Green Lead Clinical Pharmacist, RAH
Susan Love Lead Clinical Pharmacist, Renfrewshire HSCP
Sharon Adamson Head of Planning, NHSGGC
Alistair Dorward Consultant Respiratory Physician, Royal Alexandra Hospital
Shona Strachan Head of Adult Services, Renfrewshire Council

Appendix 2: RDP Feedback Event Page 83 of 99
Appendix 2: Renfrewshire Development Programme Feedback
Event 16/03/2016
The summaries below draw out the key themes and ideas proposed at the
Renfrewshire Development Programme Feedback event. The event was attended by
39 representatives of Acute and community health and social care services from
across NHSGGC. Following presentation of the initial RDP evaluation findings, three
open discussions were facilitated to allow exploration of how best these findings
could inform implementation of the Clinical Services Strategy across the Board.
Open Forum Discussion 1: This focused on points of clarification relating to the
presentation of features and findings of the RDP.
Open Forum Discussion 2: Actions needed to implement findings across all
sectors: opportunities, challenges and issues.
Ambulatory care and acute assessment
The potential for the expansion of the approach used in the CPAU (rapid
assessment, prompt discharge, early follow-up) for other acute presentations to
hospital was raised.
The need for a consistent approach to acute care across NHSGGC was raised,
highlighting that patients should experience the same care pathways
irrespective of which hospital they present to.
Expansion of rapid assessment processes will require robust mechanisms for
follow-up and clear communication with General Practitioners.
Anticipatory Care Planning and eHealth
The content of Anticipatory Care Plans was discussed, and distinction drawn
between recording of factual information about a patient and their
circumstances and a management plan that will be implemented in the event of
certain conditions. An aspiration of a single shared record was raised.

Appendix 2: RDP Feedback Event Page 84 of 99
Widening access to electronic records was seen as largely beneficial, but there
was some caution regarding confidentiality and who maintains overall
responsibility for ensuring the information is an accurate record.
Mechanisms for implementation
Joint governance of implementation of service developments was seen as
important.
A planning process for interface services needs to be developed to allow these
changes to occur across the system.
Existing services may vary between areas, and there may be differences the
population served and their needs, however whilst being aware of these local
variations the overall service challenges are seen as similar across the Board.
Existing clinical/professional networks may be used for the dissemination of
learning about service improvement. Where these do not exist there should be
work to ensure that good practice can be shared across the health board and
more widely, for example a shared learning network for those working in Dept.
Medicine for the Elderly.
Open Forum Discussion 3: How do we start to progress the wider development of
services between traditional acute, primary, and community services as one of the
key development areas for IJBs and for the Acute Division?
Ideas proposed included:
Implementation of service developments:
Have a programme similar to the RDP at each acute site
Use MCNs for developing service ideas and disseminating learning
Primary care:
Access to diagnostic investigations in the community
Opportunities for service development and reduction of variation offered by
cluster working
Care home LES should be extended

Appendix 2: RDP Feedback Event Page 85 of 99
Anticipatory Care Planning:
A board-wide approach to ACPs would be useful; including a consistent
approach to what should be core elements, mechanisms of sharing and use of
the plans.
Managing and spreading the intensity of acute assessment work in hospital:
Review emergency appointment and home visit times in primary care, to try
and ensure patients are referred to hospital as early as possible in the day.
Review shift patterns in acute assessment so they best match periods of
intensity.
Have appointment times within Medical Assessment Unit.
Have morning rapid access clinics, with transport, for conditions that are urgent
but do not need same-day hospital assessment.
Hospital discharge
Have a combined discharge team to facilitate discussions between health and
social care.
Improve post-discharge support to prevent readmissions.
eHealth
Make more use of available technology to support home visits and
consultations.
Work towards compatibility of systems across health and social care.

Appendix 3: Data Sources Page 86 of 99
Appendix 3: Data Sources
Topic Dataset Source
Type
Contact Content Period Interval Geography Denominator
Population
Data for
Comparisons
SECONDARY CARE DATA
Emergency
Dept
Hospital
activity
indicators
Extract from
routine
John Gomez
(Information
Manager,
NHSGGC
Corporate
Services
ED
attendances
#, Breaches
#%, %
admitted, by
age group,
flow group
Jan 2013-
Oct 2015
Calendar
months
RAH, Paisley
practice,
other
NHSGGC
None
(developed
separately)
Other GGC
included
Emergency
admissions
Hospital
activity
indicators
Extract from
routine
John Gomez Number of
admissions,
by age,
specialty
Jan 2013-
Oct 2015
Calendar
months
RAH, Paisley
practice,
other
NHSGGC
None
(developed
separately)
Other GGC
included
Bed days Hospital
activity
indicators
Extract from
routine
John Gomez Number of
bed days,
ALOS,
number of 0
stay
episodes, by
age,
specialty
Jan 2013-
Oct 2015
Calendar
months
RAH, Paisley
practice,
other
NHSGGC
None
(developed
separately)
Other GGC
included
Elective
admissions
Hospital
activity
indicators
Extract from
routine
John Gomez Jan 2013-
Oct 2016
Calendar
months
RAH, Paisley
practice,
other
NHSGGC
None
(developed
separately)
Other GGC
included

Appendix 3: Data Sources Page 87 of 99
Topic Dataset Source
Type
Contact Content Period Interval Geography Denominator
Population
Data for
Comparisons
SECONDARY CARE DATA
Day cases Hospital
activity
indicators
Extract from
routine
John
Gomez
Jan 2013-
Oct 2017
Calendar
months
RAH, Paisley
practice,
other
NHSGGC
None
(developed
separately)
Other GGC
included
AAU Hospital
activity
indicators
Extract from
routine
John
Gomez
Number of
admissions
with ACI and
0-1 day stay
by age and
area
Jan 2013-
Oct 2018
Calendar
months
RAH, Paisley
practice,
other
NHSGGC
None
(developed
separately)
Other GGC
included
Readmissions Hospital
activity
indicators
Extract from
routine
John
Gomez
Number and
rate per
1000
admissions,
7&28 days
by age
group and
specialty
Jan 2013-
Oct 2019
Calendar
months
RAH, Paisley
practice,
other
NHSGGC
All admissions Other GGC
included
Delayed
discharges
Hospital
activity
indicators
Extract from
routine
John
Gomez
Number of
delayed
discharges
and number
of bed days
lost
Jan 2013-
Oct 2020
Calendar
months
RAH only None
(developed
separately)
Sourced from
ISD - GGC
wide

Appendix 3: Data Sources Page 88 of 99
Topic Dataset Source
Type
Contact Content Period Interval Geography Denominator
Population
Data for
Comparisons
SECONDARY CARE DATA
Boarding One-off
report
Extract from
routine
John
Gomez
Number of
days
patients
spend
occupying a
bed in a
ward out
with the
specialty
under which
they were
admitted
April 2014-
Feb 2015
Calendar
months
RAH only
Standardised
Admissions
Standardised
hospital
activity data
(one-off)
Calculated
from routine
John
Gomez
Indirectly
standardised
emergency
admission
rates
April 2012-
Sep 2015
Quarterly Renfrewshire,
NHSGGC
Renfrewshire GGC
Standardised
bed days
Standardised
hospital
activity data
(one-off)
Calculated
from routine
John
Gomez
Indirectly
standardised
bed days
used in
emergency
admissions
April 2012-
Sep 2015
Quarterly Renfrewshire,
NHSGGC
Renfrewshire GGC

Appendix 3: Data Sources Page 89 of 99
Topic Dataset Source
Type
Contact Content Period Interval Geography Denominator
Population
Data for
Comparisons
SECONDARY CARE DATA
Deaths
standard-
isation
Standardised
mortality data
Calculated
from
routine
John
Gomez
Indirectly
standardised
overall
deaths and
proportion of
deaths in
hospital
April 2012-
Sep 2015
OAAU linked
data
CHI-linked
SMR-01
records
Routine
linked from
project
database
John
Gomez
Episodes,
specialty,
diagnosis,
LOS,
readmissions
(7&28 days)
Sep 2014-
Aug 2015
N/A RAH OAAU N/A N/A
CPU linked
data
CHI-linked
SMR-01
records
Routine
linked from
project
database
John
Gomez
Episodes,
specialty,
diagnosis,
LOS,
readmissions
(7&28 days)
Sep 2014-
Aug 2015
N/A RAH CPU N/A N/A
Specified
Frailty
patients
Frailty SMR-
01 records
Extract
from
routine
John
Gomez
LOS,
readmissions
, Paisley
practice,
OAAU
attendance
Sep 2012-
Aug 2015
N/A RAH, Paisley
practices
N/A N/A

Appendix 3: Data Sources Page 90 of 99
Topic Dataset Source
Type
Contact Content Period Interval Geography Denominator
Population
Data for
Comparisons
SECONDARY CARE DATA
Low Risk
Chest Pain
patients
LRCP SMR-
01 records
Extract
from
routine
John
Gomez
LOS,
readmissions
Paisley
practice,
CPU
attendance
Sep 2012-
Aug 2015
N/A RAH, Paisley
practices
N/A N/A
PRIMARY CARE DATA
GEMS
activity
Extract
GEMS,
Extract
GEMS
Renfrewshire
Extract
from
routine via
Advanced
Health and
Care
Paul
Rafferty
(Advanced
Health and
Care)
Jan 2013 -
May 2015
Daily All NHSGGC,
Renfrewshire
(residents),
Post code (3
digit)
Paisley
postcode areas
(PA1-5, G78)
Rest of GGC
from same
dataset
General
Practice
activity
CSR
summary
Extracted
from
individual
practice
systems,
on site
Hugh
O'Pray (GP
IT
facilitator,
NHSGGC)
Encounters
by type, user,
practice,
patient age
group
Jan 2014-
Sept 2015
Quarterly 13 Paisley
practices
Practice
populations
(ISD)
None
Community
nursing
activity
Community
nursing
Frances
Paton
(Business
Intelligence
Manager,
NHSGGC
Corporate
services)
Contacts by
location,
planned,
completed,
age group
Sep 2013-
Aug 2015
Calendar
months
13 Paisley
practices, by
practice
Practice
populations
(ISD)
None

Appendix 3: Data Sources Page 91 of 99
Topic Dataset Source
Type
Contact Content Period Interval Geography Denominator
Population
Data for
Comparisons
SOCIAL CARE
Home care Home care
stats RDP
Danny
McAllion
(Senior
Information
and
Research
Analyst,
Renfrewshi
re Council)
Number of
Hours and
number of
people 65+
Apr 2012 -
Sep 2015
Quarterly Renfrewshire Renfrewshire
residents (NRS
mid-year
population
estimates)
Care homes
and
assessments
Standard
Shareable
Assessments
Danny
McAllion
Care home
residents,
Care home
admissions,
New SSAs
Apr 2013 -
Sep 2015
Calendar
Months
Renfrewshire Renfrewshire
residents (NRS
mid-year
population
estimates)
Social care
survey
Social care
survey 2015
ISD,
publicly
available
Home care
details
1998-2015 Annual Scotland and
all local
authorities
DEATHS
Deaths RDP deaths
data
Calculated
from
routine
John
Gomez
Number of
deaths,
proportion in
hospital,
indirectly
standardised
by HSCP to
NHSGGC
Apr 2012 –
Sep 2015
Quarterly NHSGGC and
constituent
HSCPs
N/A

Appendix 4: CPAU and OAAU comparison groups Page 92 of 99
Appendix 4: CPAU and OAAU comparison groups
1. Chest Pain Assessment Unit
Patients with a discharge diagnosis of “low risk chest pain” (LRCP)
This group was identified on the basis of the most common discharge diagnoses
given to patients seen in the CPU. The top five ICD10 diagnoses are shown in Table
15, and together these accounted for 84% of the patients seen in the unit. SMR01
records were accessed for all patients with these as their first diagnosis from Jan
2012-Aug 2015. Since Sep 2014 21% of these LRCP attendances were seen in the
CPU.
Table 15: ICD10 Codes used to identify the ‘low risk chest pain’ patient group
R074 Chest Pain, unspecified
R073 Other chest pain
R072 Precordial pain
I209 Angina pectoris, unspecified
I200 Unstable angina
Patients presenting with chest pain having a troponin blood test
This group was identified on the basis of having been investigated with a troponin
blood test on presentation to hospital as an emergency. A local database of all such
patients has been kept in the RAH since 2012, maintained by the cardiology
specialist nurses. In order to focus on those patients targeted by the CPU,
individuals were excluded if they did not present with chest pain or if they had clear
myocardial ischaemia on presentation (diagnosed STEMI or positive troponin at zero
hours). In the year Sep 2014- Aug 2015 43.0% of these patients were assessed in
the CPU.

Appendix 4: CPAU and OAAU comparison groups Page 93 of 99
2. Older Adults Assessment Unit
Patients presenting with specified frailty conditions
A group of diagnoses were selected with reference to the literature (ref) and in
consultation with the Department of Medicine for the Elderly (DME) Consultants as
being likely to be most sensitive and specific for those patients being targeted by the
OAAU, and they focus on those with dementia, delirium and tendency to fall. The
ICD10 codes are shown in Table 16. SMR01 records for all patients with these
diagnoses were obtained for the period Jan 2012-Aug 2015. Of patients seen in the
OAAU 41.6% had one of these frailty diagnoses; it should be emphasised that
patients with a wider range of frailty diagnoses were accepted to the unit but these
were too diverse and non-specific to be helpful in determining a comparator group.
Since Sep 2014 14.5% of this patient group were assessed in the OAAU.
Table 16: ICD10 codes used to identify the “specified frailty conditions”
patient group
F00* Dementia in Alzheimer disease
F01 Vascular dementia
F02* Dementia in other diseases classified elsewhere
F03 Unspecified dementia
F05.1 Delirium superimposed on dementia
F05.9 Delirium, unspecified
F06.0 Organic hallucinosis
F06.7 Mild cognitive disorder
F107 Residual and late-onset psychotic disorder
G30 Alzheimer disease
G31.1 Senile degeneration of brain, not elsewhere classified
G31.8 Other specified degenerative diseases of nervous system
R29.6 Tendency to fall, not elsewhere classified

Appendix 4: CPAU and OAAU comparison groups Page 94 of 99
Patients aged over 80 years
Whilst the OAAU aimed to identify patients on the basis of frailty rather than age the
majority (74.0%) of patients seen in the OAAU were aged over 80 years. SMR01
data on this patient group was available via the routine project monitoring dataset. In
the first year of the project 15% of patients aged over 80 years admitted as an
emergency were seen in the OAAU.

Appendix 5: CPU and OAAU supplementary data tables Page 95 of 99
Appendix 5: Chest Pain Unit and Older Adult Assessment Unit,
supplementary data tables
Table 17: Proportion of LRCP patients readmitted at 7 and 28 days (any
reason): Before (Sep 13-Aug 14) vs. During (Sep 14 – Aug 15)
Table 18: Proportion of LRCP patients readmitted at 7 and 28 days (any
reason): Usual care vs. CPAU care (Sep 14 – Aug 15)
Readmissions In Out Difference p-value
LRCP patients 7 days 1.9 % 3.4 % -1.5 % 0.082
28 days 6.4 % 7.1 % -0.7 % 0.488
Table 19: 7 and 28 days readmissions (all-cause) before and during RDP for
patient with specified frailty condition and those aged over 80 years, RAH,
Paisley
Patient
group
%
Readmissions
at:
Before
OAAU
During
OAAU
Difference Lower
95% CI
Upper
95% CI
Sp.
frailty
7 days 4.5% 4.1 % -0.5 % -2.0 +1.1
Sp.
frailty
28 day 9.3 % 8.2 % -1.1 % -3.2 +1.0%
80+
years
7 days 7.4% 7.1% -0.3% -1.4 +0.9%
80+
years
28 day 18.2% 16.7% -1.5% -3.1 +0.2%
Readmissions Before After Difference p-value
LRCP patients 7 days 4.7 % 2.8 % -1.9 % 0.114
28 days 8.2 % 6.4 % -1.8 % 0.226

Appendix 6: Health and Social care context, supplementary graphs Page 96 of 99
Appendix 6: Health and Social care context, supplementary graphs
Figure 23: Renfrewshire standardised admission ratio* and rate of emergency
admission to hospital per 10,000, Renfrewshire and NHSGGC, Quarterly Apr
2012-Sep 2015 *standardized to NHSGGC for age, sex and deprivation
Figure 24: Renfrewshire standardised bed days ratio* and rate of bed days in
hospital per 10,000, Renfrewshire and NHSGGC, Quarterly Apr 2012-Jun 2015
0
25
50
75
100
125
150
175
0
50
100
150
200
250
300
350
Sta
nd
ard
ised
rati
o %
Ad
mis
sio
n r
ate
per
10,0
00
Quarter
Renfrewshire Standardised Admission Ratio
Renfrewshire admission rate
NHSGGC admission rate
0
20
40
60
80
100
120
140
160
180
0
250
500
750
1000
1250
1500
1750
2000
2250
Sta
nd
ard
ised
rati
o %
Bed
days p
er
10,0
00
Quarter
Renfrewshire standardised bed days ratio
Renfrewshire bed days rate
NHSGGC bed days rate

Appendix 6: Health and Social care context, supplementary graphs Page 97 of 99
Table 20: Day of Care Survey; overview of results RAH, Paisley Nov 2014 – Feb
2016
Date Wards Number
of
patients
Occupancy % Patients
not meeting
criteria
Top 3 reasons not met
Nov-
14
All 546 100% 24% Awaiting social work
allocation/ assessment
(18%)
Awaiting AHP
assessment/ treatment
(15%)
Awaiting Consultant
decision/ review (13%)
Nov-
14
Medical: 27
RAD: 3, 5, 7
120 100% 47% Awaiting social work
allocation/ assessment
(27%)
Awaiting Consultant
decision/ review (14%)
Awaiting AHP
assessment/ treatment
(7%)
Apr-
15
Medical: 27
RAD: 3
60 100% 31.50%
Medical 13%
RAD 50%
Awaiting AHP
assessment/treatment
(ongoing rehab) (26%)
Awaiting Consultant
decision/ review (26%)
Alteration to equipment for
home/ re-housing (16%)
May/
June
2015
Medical:
1,8,14,27
RAD: 3, 5, 7
Orthopaedics:
22, 23
243 100% 25%
Medical 10%
RAD 50%
Orthopaedics
10%
Awaiting AHP assessment/
treatment (ongoing rehab)
Awaiting Consultant
decision/review or awaiting
MDT review
Alteration to equipment for
home/ re-housing
Feb-
16
Medical: 27
RAD: 3, 5, 7
120 100% 22.50%
Medical 10%
RAD 37%
Awaiting social work
allocation/ assessment
(48%)
Making choices/awaiting
place in care home (26%)
Other (discharge plans in
place for subsequent 2-3
days) (19%)

Appendix 6: Health and Social care context, supplementary graphs Page 98 of 99
Figure 25: Number and rate of primary care encounters per 1,000 practice
population per month, quarterly 2014-2015, 13 Paisley practices by age group
Figure 26: Average GEMS calls per day per 10,000 population, Paisley and
NHSGGC, 3 month rolling averages Jan 2013- May 2015
0
20,000
40,000
60,000
80,000
100,000
120,000
140,000
160,000
0
200
400
600
800
1000
1200
1400
1600
1800
Jan-Apr
2014
Mar-Jun
2014
Jul-Sep 2014 Oct-Dec
2014
Jan-Mar
2015
Apr-Jun
2015
Jul-Sep 2015
Tota
l n
um
be
r e
nc
ou
nte
rs
Ra
te p
er
1,0
00 p
er
mo
nth
Quarter
0-64 65-79
80+ Overall
Number of encounters
0
2
4
6
8
10
12
14
Ave
rag
e c
alls
pe
r d
ay
/10,0
00
po
pu
latio
n
NHSGGC Paisley Paisley 0-64 yrs
Paisley 65-79 yrs Paisley 80+ yrs

Appendix 6: Health and Social care context, supplementary graphs Page 99 of 99
Figure 27: Quarterly standardised mortality ratios, Renfrewshire and 13 Paisley
GP practices, April 2012-Sep 2015
Figure 28: Proportion of deaths that occurred in hospital, rolling averages (3
quarters) April 2012-Sep 2015, NHSGGC, Renfrewshire and 13 Paisley
practices, all ages and 80+ years
0
20
40
60
80
100
120
140
Ra
tio
(%
)
Quarter
Renfrewshire 13 Paisley GP practices
30.0
35.0
40.0
45.0
50.0
55.0
Pe
rce
nta
ge
%
Quarter
NHSGGC all ages Renfrewshire all ages
13 Paisley GP practices all ages 80+ years NHSGGC
80+ years Renferwshire