evaluation of the removal efficiency of … · of perfluoroalkyl substances in drinking water ......
TRANSCRIPT
W 15004
Examensarbete 30 hpFebruari 2015
Evaluation of the Removal Efficiency of Perfluoroalkyl Substances in Drinking Water
Sophie Englund
i
ABSTRACT Evaluation of the Removal Efficiency of Perfluoroalkyl Substances in Drinking Water Sophie Englund
Per- and polyfluoroalkyl substances (PFASs) are chemicals that have been used for over 50 years. They are both hydrophobic and hydrophilic, which make them useful in a wide range of products, both in the domestic and industrial market. Recently, the global attention on PFASs has increased due to their possible harmful health effects on humans. Furthermore, PFASs have been detected in drinking water sources all over the world. Conventional treatment processes in drinking water treatment plants (DWTPs) are not able to remove PFASs. Therefore, more research is required to find efficient removal techniques for these compounds.
The aim of this study was to investigate the removal efficiency of PFASs using two different adsorption techniques, anion exchange (AE) with the resin Purolite A-600, and granular activated carbon (GAC) of type Filtrasorb®400. The experiments were performed in laboratory batch-scale, at Swedish University of Agriculture (SLU), and column tests in pilot-scale, at Bäcklösa DWTP in Uppsala.
The PFASs showed a high sorption potential to AE and GAC. However, the removal efficiency differed depending on the perfluorocarbon chain length, functional group, and concentration level. For the AE, in average 92 % of the PFASs were removed in the end of the batch experiments while the average removal efficiency in the column experiment was 86 %. In the batch experiments treated with GAC on average 55 % of the PFASs were removed in the end of the experiments while the column experiment had the average removal efficiency of 86 %. There was an increase in the removal efficiency with increasing perfluorocarbon chain length in the column experiments. However, in the batch experiments, the adsorption of PFASs decreased with an increasing chain length, except for the highest PFAS concentration level (5000 ng L-1) treated with AE and the lowest PFAS concentration level (200 ng L-1) treated with GAC. In the column experiments, the perfluoroalkane sulfonates (PFSAs) were slightly better removed than perfluoroalkyl carboxylates (PFCAs) with an average removal efficiency of 97 % for AE and 91 % for GAC compared to 67 % and 82 % for AE and GAC, respectively. In the batch experiments, there was no clear trend between the removal efficiency and functional group. Overall, the pilot-scale experiments removed the PFASs relatively well even after 42 days (on average, 86 % for both AE and GAC). The lowest removal capacity in the column experiments was seen for the shorter chained PFSAs (in average 46 % for ≤C6 PFCAs using AE and 75 % for ≤C7 PFCAs using GAC). More efficient treatment techniques are needed to minimise the PFAS concentrations in drinking water and the potential human.
ii
Keyword: Per- and polyfluoroalkyl substances (PFASs), anion exchange, activated carbon, drinking water, removal efficiency
Department of Aquatic Science and Assessment, Swedish University of Agricultural Sciences (SLU). Lennart Hjelms väg 9, SE 750 07

iii
REFERAT Utvärdering av reningseffektiviteten av perfluorerade alkylsubstanser i dricksvatten Sophie Englund
Per- och polyfluorerade alkylsubstanser (PFASs) är kemikalier som har används globalt under de senaste 50 åren. Tack vare att de är uppbygda av både en hydrofob och en hydrofil del är de ytaktiva (s.k. surfaktanter) och har ett brett användningsområde, både för industri- och hushållsprodukter. På senare år har dessa ämnen fått uppmärksamhet på grund av att exponering för PFASs har visats kunna medföra hälsorisker. PFASs har upptäckts i dricksvatten på många håll i världen, men flera av de konventionella reningsmetoderna för dricksvatten är inte effektiva för PFASs och därför finns ett behov av mer forskning och kunskap inom vattenberedningsområdet.
I denna studie undersöktes reningseffektiviteten för PFASs hos två adsorptionstekniker; i) anjonbyte (AE) med Purolite A-600 och ii) granulerat aktivt kol (GAC) med Filtrasorb®400. Studien utformades så att inverkan av kolkedjans längd, molekylens funktionella grupp samt koncentrationsnivån av PFASs kunde utvärderas. Experimenten utfördes både i liten skala genom försök i bägare på Sveriges lantbruksuniversitet (SLU) och i något större skala i en pilotanläggning med kolonnexperiment på Bäcklösa dricksvattenverk i Uppsala.
Båda reningsmetoderna visade god effekvititet för avlägsnandet av PFASs i dricksvatten. I slutet av bägarexperimenten var i medeltal 92 % och 55 % av PFASs eliminerade för de prover behandlade med AE respektive GAC. Reningseffektivititen för kolonnexperimenten var i medeltal 86 % för båda metoderna. Reningsgraden var beroende av längden på den perfluorerade kolkedjan. I kolonnexperimenten visades att ökad kedjelängd ledde till ökad reningseffektivitet, medan bägarexperimenten visade på motsatt trend, med undantag för prover behandlades med AE och PFAS-koncentration 5000 ng L-1 samt prover behandlade med GAC och PFAS-koncentration 200 ng L-1. Reningseffektiviteten varierade också beroende på funktionell grupp, d.v.s. beroende på om det var en sulfonat eller en karboxylat. I kolonnexperimenten avlägsnades de perfluorerade alkylsulfonaterna (PFSAs) i något högre grad (97 % och 91 %; AE och GAC) än karboxylaterna (PFCAs; 67 % och 82 %; AE och GAC). För bägarexperimenten hittades dock inget tydligt motsvarande samband.
Sammanfattningsvis renades PFASs från dricksvattnet i kolonnexperimenten relativt väl även i slutet av experimentent (efter 42 dagar). De sämst renade PFAS ämnena var de med kortare kolkedja. Efter 42 dagar hade PFCAs med kolkedjelängd ≤C6 renats bort med 46 % (AE) och på PFCAs med kolkedjelängd ≤C7 med 75 % (GAC). Behovet av bättre reningsmetoder för dessa PFASs är därför stort.
Nyckelord: PFAS, reningseffektivitet, anjonutbyte, aktivt kol, dricksvatten
Institutionen för vatten- och miljö. Sveriges lantbruksuniversitet (SLU). Lennart Hjelms väg 9, SE-750 07 Uppsala
iv
Acknowledgements This master thesis was written as the final part of the Master Programme in Environmental and Water Engineering at Uppsala University and Swedish University of Agricultural Sciences (SLU). The thesis comprises 30 ECTS, and was carried out on behalf of the Department of Aquatic Science and Assessment at SLU.
Docent Lutz Ahrens was the main supervisor and Professor Karin Wiberg the subject reviewer, both from the Department of Aquatic Sciences and Assessment. Philip McCleaf from Uppsala Vatten och Avfall AB acted as a supervisor as well. Fritjof Fagerlund from the Department of Earth Sciences at Uppsala University was the final examiner.
This research was supported by Uppsala Vatten och Avfall AB, providing the PFAS treatment technology, equipment, water analyses, and access to Bäcklösa DWTP. The chemical analyses were carried out at the persistent and organic pollutants (POPs) laboratory at the Department of Aquatic Sciences and Assessment, SLU.
First of all, I would like to thank my supervisor Lutz Ahrens for all help and guidance through the whole thesis. I would also like to thank my supervisor Philip McCleaf who helped me with everything related to the column experiments at Bäcklösa DWTP. Finally, I would like to thank Caroline Persson, my co-worker, during the whole thesis. Sophie Englund Uppsala 2015 Copyright © Sophie Englund and the Department of Aquatic Sciences and Assessment, Swedish University of Agricultural Sciences (SLU). UPTEC W 15004, ISSN 1401-5765 Published digitally at the Department of Earth Sciences, Uppsala University, Uppsala, 2015

v
POPULÄRVETENSKAPLIG SAMMANFATTNING Utvärdering av reningseffektiviteten av perfluorerade alkylsubstanser i dricksvatten Sophie Englund
I Sverige har förhöjda halter av per- och polyfluorerade alkylsubstanser (PFASs) upptäckts i flera kommuners dricksvatten. Det visade sig i flera av fallen att det var brandskum från brandövningsområden som var källan till de höga koncentrationerna. Detta har skapat oro då flertalet rapporter har påvisat att exponering av PFAS kan medföra hälsorisker, t.ex. skada lever och sköldkörtel samt vara cancerframkallande. Det har även visat sig att de konventionella reningsmetoderna för dricksvatten inte är effektiva för PFASs, och behovet är därför stort för mer forskning och kunskap inom detta område.
PFASs är kemikalier som har använts globalt i över 50 år. De finns inte naturligt utan är skapade av människan. De är uppbyggda av en kolkedja som är fettlöslig och en funktionell grupp som är vattenlöslig. Denna egenskap, att ha både en vatten- och en fettlöslig del gör dem ytaktiva (s.k. surfaktanter), vilket i sin tur medför att de kan användas inom en rad olika områden, både i hushållsprodukter, såsom tyger och färger, och inom industrin. När det framkom att hälsorisker kan förknippas med PFASs, reglerades dess användning, men detta gäller dock inte alla PFASs. Några PFASs är extremt långlivade, och så svårnedbrytbara att deras nedbrytningshastighet i miljön inte har kunnat uppmätas. I denna studie undersöktes hur effektivt PFASs renades bort från dricksvatten med hjälp av två olika reningstekniker, anjonbyte (AE) och granulerat aktivt kol (GAC). De är båda adsorptionstekniker, där PFASs ersätter negativa joner vid anjonbytet och adsorberas på kolets yta hos det aktiva kolet. Det undersöktes även om PFASs kolkedjelängd, funktionella grupp och koncentrationsnivå hade någon inverkan på reningseffektiviteten. Experimenten utfördes både småskaligt i bägarexperiment på SLU och i något större skala, i kolonnexperiment, på Bäcklösa dricksvattenverk i Uppsala.
Samtliga PFASs renades bort från vattnet med båda reningsteknikerna. I bägarexperimenten var i medelvärde endast 8 % av PFASs kvar vid slutet av experimentet för proverna behandlade med AE och 45 % var kvar i vattenproverna behandlade med GAC. I kolonnexperimenten renades i medelvärde 86 % av PFASs genom båda reningsteknikerna. Kolkedjans längd hos PFASs påverkade reningsgraden. Ju längre kolkedja PFASs hade desto bättre avlägsnades de från vattnet i kolonnexperimenten. Däremot visade bägarexperimenten motsatt resultat: minskad rening av PFASs vid ökad kolkedjelängd (med undantag för proverna behandlade med AE och PFAS-koncentration 5000 ng L-1 samt proverna behandlade med GAC och PFAS-koncentration 200 ng L-1). Reningseffektiviteten varierade även beroende på funktionell grupp. Två klasser av PFASs undersöktes med de funktionella grupperna alkylsulfonat (PFSAs) och alkylkarboxylat (PFCAs). I kolonnexperimenten renades PFSAs 45 % (AE) och 11 % (GAC) mer än vad PFCAs renades. I bägarexperimenten

vi
kunde inget tydligt samband mellan funktionell grupp och reningseffektivitet påvisas. Sammanfattningsvis renades PFASs från dricksvattnet i kolonnexperimenten relativt bra även i slutet av projektet. De sämst renade PFASs var de med kortare kolkedjelängd vilket stämmer överens med resultat från tidigare studier. Behovet av bättre reningsmetoder för alla PFASs, men särskilt de med kortare kedjelängd, är fortfarande stort.

vii
LIST OF ABBREVIATIONS 6:2 FTSA Fluorotelomer sulfonate
AC Activated carbon
AE Anion exchange
AFFF Aqueous firefighting foam
BV Bed volume
b.w. Body weight
DWTP Drinking water treatment plant
FOSA Perfluorooctanesulfonamide
GAC Granular activated carbon
IS Internal standard
IUPAC International union of pure and applied chemistry
Kow Octanol-water partition coefficient
MW Molecular weight
PAC Powdered activated carbon
PFASs Per- and polyfluoroalkyl substances
PFBA Perfluorobutanoate
PFBS Perfluorobutane sulfonate
PFCAs Perfluoroalkyl carboxylic acids
PFDA Perfluorodecanoate
PFDoDA Perfluorododecanoate
PFHpA Perfluoroheptanoate
PFHxA Perfluorohexanoate
PFHxS Perfluorohexane sulfonate
PFNA Perfluorononanoate
PFOA Perfluorooctanoate
PFOS Perfluorooctane sulfonate
viii
PFPeA Perfluorobutanoate
PFSAs Perfluoroalkane sulfonates
PFTeDA Perfluorotetradecanoate
PFUnDA Perfluoroundecanoate
pKa Acid dissociation constant
POPs Persistent organic pollutants
SPE Solid phase extraction
Sw Water solubility
WWTP Waste water treatment plant

ix
Table of Contents ABSTRACT ...................................................................................................................... i
REFERAT ....................................................................................................................... iii
Acknowledgements ......................................................................................................... iv
POPULÄRVETENSKAPLIG SAMMANFATTNING ................................................... v
LIST OF ABBREVIATIONS ........................................................................................ vii
1. INTRODUCTION .................................................................................................... 1
1.1. OBJECTIVES AND HYPOTHESES ................................................................ 2
1.2. FOCUS AND DELIMITATIONS ..................................................................... 2
2. BACKGROUND ...................................................................................................... 3
2.1. PER- AND POLYFLUOROALKYL SUBSTANCES ...................................... 3
2.1.1. Physicochemcial Properties of PFASs ....................................................... 6
2.1.2. Production, Usage and Regulations ............................................................ 6
2.1.3. PFASs in Drinking Water ........................................................................... 7
2.1.4. Exposure and Toxicity ................................................................................ 7
2.2. WATER TREATMENT TECHNIQUES .......................................................... 8
2.2.1. Anion Exchange ......................................................................................... 9
2.2.2. Granular Activated Carbon ....................................................................... 10
3. MATERIAL AND METHODOLOGY .................................................................. 11
3.1. CHEMICALS AND MATERIAL ................................................................... 11
3.1.1. Chemicals ................................................................................................. 11
3.1.2. Anion Exchange (Purolite A-600) ............................................................ 11
3.1.3. Granular Activated Carbon (FILTRASORB®400) .................................. 12
3.2. LABORATORY BATCH EXPERIMENTS USING GRANULAR ACTIVATED CARBON AND ANION EXCHANGE ............................................. 12
3.3. PILOT-SCALE COLUMN EXPERIMENTS AT BÄCKLÖSA DRINKING WATER TREATMENT PLANT ............................................................................... 13
3.4. PFAS ANALYSIS OF THE WATER SAMPLES .......................................... 15
4. RESULTS ............................................................................................................... 16
4.1. LABORATORY BATCH EXPERIMENTS USING GRANULAR ACTIVATED CARBON AND ANION EXCHANGE ............................................. 16
4.1.1. Anion Exchange (Purolite A-600) ............................................................ 16
4.1.2. Granular Activated Carbon (FILTRASORB®400) .................................. 18
x
4.2. PILOT-SCALE COLUMN EXPERIMENTS AT BÄCKLÖSA DRINKING WATER TREATMENT PLANT ............................................................................... 20
4.2.1. Anion Exchange (Purolite A-600) ............................................................ 20
4.2.2. Granular Activated Carbon (FILTRASORB®400) .................................. 23
5. DISCUSSION ......................................................................................................... 27
5.1. LABORATORY BATCH EXPERIMENTS USING GRANULAR ACTIVATED CARBON AND ANION EXCHANGE ............................................. 27
5.2. PILOT-SCALE COLUMN EXPERIMENTS AT BÄCKLÖSA DRINKING WATER TREATMENT PLANT ............................................................................... 30
6. CONCLUSIONS .................................................................................................... 34
7. REFERENCES ....................................................................................................... 36
8. APPENDIX ............................................................................................................ 41
8.1. APPENDIX A. RESULTS: LABORATORY BATCH EXPERIMENTS USING ANION EXCHANGE FOR PFASs CONCENTRATION OF 1000 ng L-1 . 41
8.2. APPENDIX B. RESULTS: LABORATORY BATCH EXPERIMENTS USING ANION EXCHANGE FOR PFASs CONCENTRATION OF 5000 ng L-1 . 42
8.3. APPENDIX C. RESULTS: LABORATORY BATCH EXPERIMENTS USING GAC FOR PFASs CONCENTRATION OF 1000 ng L-1 ............................. 44
8.4. APPENDIX D. RESULTS: LABORATORY BATCH EXPERIMENTS USING GAC FOR PFASs CONCENTRATION OF 5000 ng L-1 ............................. 45
8.5. APPENDIX E. METHODOLOGY: LABORATORY BATCH EXPERIMENTS USING GRANULAR ACTIVATED CARBON AND ANION EXCHANGE .............................................................................................................. 47
8.6. APPENDIX F. THE COLUMNEXPERIMENT AT BÄCKLÖSA DWTP .... 47
8.7. APPENDIX G. WATER SAMPLE ANALYSES: SPE-SET UP ................... 48
8.8. APPENDIX H. CUMULATIVE CONCENTRATIONS OF PFASS TO AE . 48
8.9. APPENDIX I. CUMULATIVE CONCENTRATIONS OF PFASS TO GAC 49
8.10. APPENDIX J. VARIATIONS IN CONCENTRATION LEVEL IN RAW WATER 50
1
1. INTRODUCTION Per- and polyfluoroalkyl substances (PFASs) have achieved increased global attention during the recent decades due to their persistence, bioaccumulation features and possible harmful effects on living organisms (Ahrens and Bundschuh, 2014). For humans the main sources of PFASs exposure are drinking water, food, and inhalation of dust (D’Hollander et al., 2010). In Sweden, high levels of PFASs have been detected in some municipalities’ drinking water. It was determined that aqueous firefighting foams (AFFFs) from fire exercise sites often were the source of local contamination of ground water. In some areas the contamination was so high that the water wells had to be shut down (Kemikalieinspektionen, 2013).
PFASs were first manufactured by electrochemical fluorination in 1947 and by telemerisation in the 1970s. Since 2002, the electrochemical production of PFASs stopped but the telemerisational production is still going on (Vestergren and Cousins, 2009). PFASs are extremely resistant to degradation, even in the presence of heat and acids. This, together with their unique surface characteristics, have made them used in a wide range of different products and industries, e.g. fire suppressants, food manufacturing, photography industries as well as consumer products (Hawley et al., 2012).
PFASs have been detected in human serum as well as in wildlife samples around the world (Ahrens, 2011), and in recent years, there has been an increased interest to study the toxicological effects of these substances (Stahl et al., 2011). The toxicology of PFASs is, however, still not fully understood, and even though there is data available of human exposure, especially of perfluorooctanoate (PFOA) and perfluorooctane sulfonate (PFOS), the studies of the toxic effects are limited. Different hazardous health effects related to PFASs have been reported, e.g. testicular and liver cancer, and delayed pubertal maturation (Appleman, 2013). The health effects from PFASs and their accumulation in humans, together with the detection of the compounds in drinking water, stress the importance of efficient removal techniques of PFASs in water treatment plants. However, many of the standard treatment techniques, such as coagulation and flocculation, sand filtration, and sedimentation in conventional drinking water treatment plants (DWTPs) do not remove PFASs (Post et al., 2012). Although, there are absorption techniques which can remove PFASs from drinking water, e.g. activated carbon (AC) and anion exchange (AE) (Zhou et al., 2009). Still, the research of removal techniques is limited and the results are sometimes contradictory and more research is needed (Xiao et al., 2012).

2
1.1. OBJECTIVES AND HYPOTHESES The main objective of this master thesis was to investigate the removal efficiency of PFASs using two different water treatment techniques (i.e. AE and AC). Laboratory scale batch experiments were performed to investigate the effect of the perfluorocarbon chain length, functional group and concentration level on the sorption of PFASs to AE and AC. In addition, the removal efficiency of PFASs was investigated pilote scale in column experiments using AE and AC at Bäcklösa DWTP, Uppsala, Sweden.
The hypotheses for this study were:
i. The removal efficiency of PFASs depends on their fluorocarbon chain length and functional group.
ii. AE and AC can be used as efficient treatment techniques for the removal of PFASs in drinking water treatment plants.
1.2. FOCUS AND DELIMITATIONS This master thesis did not include an investigation of the influence of different water types on the removal efficiency of PFASs in water. The batch experiments were performed using Millipore water with the purpose to give ideal curves for the adsorption isotherms. For the column experiments treated drinking water from Bäcklösa DWTP was spiked with PFASs. Furthermore, the PFASs that were investigated were limited to 14 different substances for the batch experiments and 26 for the column experiments. The treatment techniques were limited to AC, using the granular activated carbon FILTRASORB®400, and AE with the resin Purolite A-600. The removal mechanicals were studied for these techniques and there was no investigation on a micro scale level. The intention of this study was not to optimise the removal efficiency of these techniques but to investigate their efficiency for a range of different PFASs.

3
2. BACKGROUND PFASs are chemicals with a wide range of usage areas. They contain a hydrophobic alkyl chain, normally with the length of between 4 and 16 carbon atoms, as well as a hydrophilic end group (EFSA, 2011). Due to their ability of being both water and oil repelling viz. ambiphilic, they are commonly used as surfactants in a wide range of different industrial and consumer products (Appleman et al., 2013a; Buck et al., 2011).
2.1. PER- AND POLYFLUOROALKYL SUBSTANCES PFASs refer to the two aliphatic compounds poly- and perfluoroalkyl substances (Buck et al., 2011). Polyfluoroalkyl substances have a partly fluorinated carbon chain (Borg and Håkansson, 2012). They are defined as aliphatic compounds for which at least one, but not all, hydrogen atoms at the carbon atoms are substituted by fluorine atoms, i.e. contain the perfluoroalkyl moiety CnF2n+1
- (Buck et al., 2011). Perfluoroalkyl substances have a fully fluorinated carbon chain (Borg and Håkansson, 2012), i.e. they have all hydrogen atoms at the carbon atoms replaced with fluorine atoms. Polyfluoroalkyl substances can be abiotically or bioatically degraded into perfluoroalkyl substances (Buck et al., 2011).
PFASs are also grouped according to the length of their perfluorocarbon chain and functional group following the International Union of Pure and Applied Chemistry’s (IUPAC) nomenclature (Glynn et al., 2013). They are referred to as long-chained or short-chained. The long-chained refer to either perfluoroalkyl carboxylates (PFCAs) with eight carbons or more or perfluoroalkane sulfonates (PFSAs) with at least six carbons. PFCAs and PFSAs are the two most investigated PFAS classes (Butt et al., 2010). PFCAs and PFSAs are both soluble and stable in water and soil (Lau et al., 2007). PFOS, from the class PFSAs, and PFOA, from the class PFCAs, are two of the most widely known PFASs (Figure 1; Butt et al., 2010).
Other important PFAS groups are PFAS precursors such as perfluorooctanesulfonamides (FOSAs), perfluorooctane sulfonamidoethanols (FOSEs), perfluoroalkyl sulfonamidoacetic acids (FOSAAs), and fluorotelomer sulfonates (FTSAs) which can degrade to PFCAs and PFSAs (Buck et al., 2011). This thesis is focusing on 26 different PFASs which belong to the classes, PFCAs, PFSAs, FOSAs, FOSEs, FOSAAs, and FTSAs (Table 1).
Figure 1. Structural formula of A. PFOS (C8 PFSA) and B. PFOA (C7 PFSA) (Borg and Håkansson, 2012).

4
Table 1. Individual PFASs investigated in this thesis, including their acronyms, molecular formulas, structural formulas, molecular weights (MW), water solubility (Sw), the acid dissociation constant (pKa) values, and the octanol-water partition coefficient (log Kow)
Substances Acronym Molecular Formula
MW (g mol-1)
Sw (mg L-1)
pKa Log Kow (L kg-1)
PFCAs
perfluorobutanoate PFBA 214 563a 0.05b
0.4c 2.91d
2.82a
perfluoropentanoate PFPeA 264 113000a -0.10b 3.69d
3.43a perfluorohexanoate PFHxA
314 15700c
21700a -0.17b
-0.16c 4.50d
4.06a perfluoroheptanoate PFHpA
364 118.0e
4180a -0.20b 5.36d
4.67a perfluorooctanoate PFOA
414 4340e
3400c -0.21b,c
6.26d
5.30a
perfluorononanoate PFNA 464 131a -0.21b 7.23d
5.92a perfluorodecanoate PFDA
514 260e
25a -0.22b
8.26d
6.50a perfluoroundecanoate PFUnDA
564 92.3e
a -0.22b
2.32e
7.15a perfluorododecanoate PFDoDA
614 a
-0.22b 7.77a
perfluorotridecanoate PFTriDA 664
a -0.22b 8.25a
Perfluorotetra-decanoate
PFTeDA 714
a -0.22b 8.90a
Perfluorohexa-decanoate
PFHxDA 814 n.a. -0.22b n.a.
Perfluoroocta-decanoate
PFOcDA 914 n.a. -0.22a n.a.
PFSAs
Perfluorobutane- sulfonate
PFBS 300 510e
46200c 0.14b,c 3.90a
Perfluorohexane- sulfonate
PFHxS 400 1400c 0.14b,c 0.97e
5.17a
Perfluorooctane- sulfonate
PFOS 500 570c,e 0.14b
-3.27c 4.67d
7.66a

5
Perfluorodecane- sulfonate
PFDS 600 n.a. 0.14b 7.66a
FOSAs
Perfluorooctane-sulfonamide
FOSA 499 1850000a 6.56b 2.56e
Methylperfluoro-octansulfonamide
MeFOSA
513 0.81e 263000a
7.69b 6.07a
Ethylperfluoro-octanesulfonamide
EtFOSA
527 306a 7.91b 6.71a
FOSEs
Methylperfluoro-octanesulfonamido-
ethanol
MeFOSE
557 0.81e
14.4b n.a.
Ethylperfluoro-octanesulfonamido-
ethanol
EtFOSE
556 n.a. 14.4b n.a.
FOSAAs
Perfluorooctane-sulfonamidoacetic
acid
FOSAA
557 n.a. n.a. n.a.
Methylperfluoro-octanesulfonamido-
acetic acid
MeFOSAA
558 n.a. -3.27f n.a.
Ethylperfluoro-octanesulfonamido-
acetic acid
EtFOSAA
584 n.a. n.a. n.a.
FTSAs
6:2 fluorotelomer- sulfonate
6:2 FTSA n.a. n.a. n.a.
aWang et al., 2011 cDu et al., 2014 Not available (n.a.)
bAhrens et al., 2012 eRahman et al., 2013 dRayne and Forest, 2009 fBrooke et al., 2004

6
2.1.1. Physicochemcial Properties of PFASs The physicochemical properties of PFASs depend on their perfluorocarbon chain length and functional group; for example their tendency to bioaccumulate in biota (Buck et al., 2011). The hydrophobic part of the PFASs is partially or completely fluorinated and has either a branched or straight structure (Rahman et al., 2013). PFASs with shorter hydrophobic tails are more water soluble than the ones with longer tails (Campbell et al., 2009). Moreover, PFAS precursors are often less water-soluble but more volatile than the ionised PFASs (Ahrens, 2011). Other properties of PFASs related to their ambiphilic character are their tendency to accumulate in the aquatic environment (Appleman et al., 2013a). Furthermore, PFASs are extremely resistant against heat and chemical attacks, due to the strong and stable C-F bond (Butt et al., 2010; Buck et al., 2011).
2.1.2. Production, Usage and Regulations PFASs that consist of more than two carbon atoms are considered to be man-made, but volcanic activity is a possible natural source (Ahrens, 2011). The production of PFASs occurs from two manufacturing processes: electrochemical fluorination and telomerisation. PFASs in the Swedish environment originate from utilisation of PFAS containing products, i.e. there has never been any PFASs production in Sweden. The emissions are most probably consequences of release from industrial use of the chemicals, consumer use of products containing PFASs, leakage from waste disposals and landfills, and effluents from waste water treatment plants (Borg and Håkansson, 2012).
PFASs have been globally used in consumer-based products for over 50 years (Ochoa Herrera, 2008). They have been produced to withstand heat, oil, dirt, and water (Kemikalieinspektionen, 2013). They are used in both industrial and commercial processes, such as flame retardants, paints, and textiles (Hansen et al., 2010), as well as AFFFs, food packing and waterproof breathable fabrics (Arvaniti et al., 2014).
Risk assessments have been carried out for evaluating the interaction between PFASs and humans. In 2008, the European Food Safety Authority (EFSA) Scientific Panel on Contaminants in the Food Chain (CONTAM Panel) performed a risk assessment for PFOS and PFOA with the conclusion that the chemicals will most probably not cause adverse effects for the general population. However, there was a lack of data, e.g. for fish and drinking water. Furthermore, the CONTAM Panel has defined a tolerable daily intake of 150 ng kg-1 body weight (b.w.) per day of PFOS and 1500 ng kg-1 b.w. per day of PFOA (EFSA, 2012).
Moreover, the Swedish Chemical Agency has reported PFASs as chemicals with especially hazardous characteristics (Glynn et al., 2013). However, the risk assessments for most of the substances require improvement (Borg and Håkansson, 2012). PFOS has also been listed as a Persistent Organic Pollutant (POPs) of the Stockholm Convention (Ahrens, 2011). PFOS and PFOA have also been included in regulations in the U.S.,
7
Canada, and Germany (Du et al., 2014). Even though they are limited, for use they are still allowed in some special industrial areas, such as the chrome plating in China (Deng et al., 2014), electroplating, polytetrafluoroethylene manufacturing, and optoelectronic industries. Another aspect from these regulations is that the restriction of PFOS and PFOA may increase the use of other fluorinated organics (Rahman et al., 2013) and new PFASs classes will continue to be developed (Ahrens, 2011).
2.1.3. PFASs in Drinking Water Sources for PFASs in the aqueous environment are landfill leachate, both industrial and municipal wastewater treatment plants (WWTPs), dry and wet atmospheric deposition, and soil and street surface runoff (Ahrens, 2011). In Sweden, PFASs have been detected in drinking water in some municipalities, primarily because of the contamination of groundwater from AFFF released at fire exercise sites (Kemikalieinspektionen, 2013). In the U.S., PFASs have been found in various types of water sources, including surface water, groundwater and effluents from WWTPs (Appleman et al., 2013b). PFOS has also been detected in the aquatic environment around the world (Deng et al., 2010), including Sweden (Hedenberg, 2014). The detection of PFASs, not only in the industrial waste water but also in drinking water and water bodies, stress the importance of finding effective techniques for removing these substances from different types of water sources (Deng et al., 2014).
According to a report from the European Food Safety Agency (EFSA), PFASs were detected in drinking water but at low levels compared to food (EFSA, 2011). In Sweden, there are no legally binding limit values for PFASs in drinking water at present. However, the Swedish National Food Agency have regulations saying that drinking water must not contain concentrations of substances that may pose health risks for humans (7§; SLVFS 2001:30; Livsmedelsverket, 2014). According to this, if there is any reason to assume that the drinking water contain PFASs, the water has to be investigated with respect to the substances (12§; Kemikalieinspektionen, 2013). Furthermore, the Swedish National Food Agency has recommended the action threshold to be concentrations over 90 ng L-1 of the total content perfluoroalkyl acids (PFAAs) in the water. The following seven different PFASs are recommended to be investigated in raw and drinking water: PFBS, PFHxS, PFOS, PFPeA, PFHxA, PFHpA, and PFOA. There has also been suggested to have PFAS concentrations at 350-1000 ng L-1 as threshold values for drinking water (Livsmedelsverket, 2014).
2.1.4. Exposure and Toxicity The contribution of emissions from PFASs to the environment originates from either they leaking out from products and waste emitted in the environment or from herald substances degraded abiotically or biotically in the environment (Buck et al., 2011).
There are a number of different health hazards that have been associated with PFASs. Kidney and testicular cancer have been connected with PFOA, and certain levels of PFASs in the blood serum and low birth weight have been related. Longer waiting time

8
to pregnancy for women and delayed puberty in children are other health risks possibly associated with PFASs (Rahman et al., 2013). Moreover, higher PFAS levels in men might lead to lower than average sperm count (Joensen et al., 2009).
According to the Swedish National Food Agency’s risk analysis, the intake of PFOA and PFOS from drinking water and food does not pose a risk for the Swedish population (Kemikalieinspektionen, 2013). Nevertheless, the uncertainty about health risks from PFASs is large and it has been proven that the chemicals are more toxic than previously expected, which indicates that the threshold values for safe levels should be reinvestigated (Kemikalieinspektionen, 2013).
2.2. WATER TREATMENT TECHNIQUES Different adsorption techniques have frequently been used to remove organic substances as well as soluble metals from aquatic environments (Liu, 2005). Adsorption refers to accumulation or concentration of a specific compound (the adsorbate) onto a surface or interface, the so-called adsorbent. Adsorption occurs between either two different phases, i.e. gas-liquid, gas-solid or liquid-solid, or two liquid phases (Aktaş and Çeçen, 2011).
The adsorption isotherms are the functions between the aqueous-phase concentration and the amount of adsorbate adsorbed (Crittenden, 2009). The isotherms are the relation between the temperature T, amount adsorbed, and the equilibrium concentration in the liquid phase. The amount of adsorbed material is increasing (but not proportional) with increased concentration (Aktaş and Çeçen, 2011). The most widely used methods for finding the adsorption isotherms for a specific system are the Freundlich and Langmuir isotherm equations (Aktaş and Çeçen, 2011). They can be applied on different adsorption water treatment techniques, such as AE (Misak, 1993) and AC (Aktaş and Çeçen, 2011). PFASs’ adsorption isotherms can be described by the Langmuir and Freundlich models (Du et al., 2014). The adsorption capacity depends on the adsorbent properties, as well as pH in the solution (Du et al., 2014). The sorption process of highly fluorinated substances is often proportional to the concentration of organic carbon. Also, substances with a long perfluorocarbon chain are more hydrophobic and more inclined to bind to other particles (Kemikalieinspektionen, 2013). The pH-value has an impact on the sorption as well and in general the adsorption decrease when pH is increasing (Deng et al., 2009). Although, some reversible case have also been reported (Du et al., 2014).
Different water treatment techniques have been investigated with respect to the removal efficiency of PFASs (Appleman et al., 2013a). This often regards PFOA and PFOS which are the most studied PFASs. The removal efficiency of PFOS from water by using some physical technologies, such as adsorption techniques, has been investigated (Ochoa Herrera, 2008; Senevirathna et al., 2010; Tang et al., 2010; Yu et al., 2008; Zhou et al. 2009). AE and AC have been giving promising results for removing PFOS (Zhou et al., 2009). The two water treatment techniques which have been used and

9
analysed for removing PFASs in this study were granular activated carbon (GAC) and AE.
2.2.1. Anion Exchange AE refers to the process where anions in a solution are adsorbed to solid materials and replaced by other ions (de Dardel and Arden, 2008). It is the interactions between charged moieties that enable the process (Inamuddin and Luqman, 2012). Positive ions, cations, are replaced by other cations, while negative anions are replaced by other anions. Toxic solutions can be treated by replacing the toxic ions with non-toxic ions by letting a solution pass through a column, which contains beads of an AE resin ions (de Dardel and Arden, 2008). Primarily, electrostatic interactions and adsorption via hydrophobic interaction are the mechanisms for removal with AE (Rahman et al., 2013).
Anion exchangers are classified as weak or strong bases (Crittenden, 2009). In this study, the resin was a strong base of Type I. The strong base exchangers have normally a quaternary amine group. A Type I quaternary group with the resin in the hydroxide form is having the following general reaction (Crittenden, 2009)
(exchange reaction) (1)
(regeneration reaction) (2)
where is the solid part of the resin and is the anion which will be removed from the solution to the AE resin.
However, whether the reactions will appear back or forward depends on the AE resin’s certain affinity, i.e. the resin’s selectivity. In general, the selectivity depends on physical and chemical characteristic of the resin. The magnitude of the valence and atomic number are chemical properties, while pore size distribution and type of functional group are physical properties that impact the selectivity (Crittenden, 2009).
AE appears to be a promising removal treatment technique of the PFASs that occurs through exchange of negatively charged ions in water (Deng et al., 2010). Moreover, AE seems to be most efficient for the treatment of long chained PFASs. The efficiency may decrease by presence of other ions, while it increases by the presence of organic material (Kemikalieinspektionen, 2013). Drinking water has normally pH-values between 6 and 9 this pH-range is not expected to have an impact on the removal efficiency of PFASs. The removal efficiency of PFASs with shorter perfluorocarbon chain length has been reported to be higher for AE than AC treatment (Rahman et al., 2013).
10
2.2.2. Granular Activated Carbon AC is an adsorbent that can remove a large variety of organic solutes (Aktaş and Çeçen, 2011), such as odour and taste compounds (Svenskt Vatten, 2010), as well as some inorganic compounds from water (Aktaş and Çeçen, 2011). The non-polar surface that AC in general has makes it efficient for adsorption of hydrophobic substances. Due to its low cost and widely usability, AC is the most popular and common adsorbent (Du et al., 2014). It has a large activated surface of 500 to 1500 m2 g-1 (Aktaş and Çeçen, 2011). The carbon, i.e. bituminous coal, lignite coal, wood, or coal from coconut shells, is manufactured by controlled carbonisation and vapour activation (Chowdhury et al., 2012). The activated surface is represented by the pores’ partial surfaces, and depending on the specific material the pore volumes can vary in form and size (Crittenden, 2009).
The adsorption efficiency is affected by a number of factors (Aktaş and Çeçen, 2011) and to a certain extent the adsorption behaviour can be predicted from the carbon’s chemical and physical characteristics (Chowdhury et al., 2012). Larger molecules tend to better adsorb to the carbon, and so do substances with larger functional groups and a large number of functional groups (Aktaş and Çeçen, 2011). There seem to be more pore blockage and steric hindrance for bigger molecules compared to smaller (Du et al., 2014). The polarity of the adsorbate affects the adsorption in such a way that polar substances prefer to adsorb to polar adsorbents. Organic materials often have a higher efficiency of adsorption in neutral circumstances, i.e. efficiency depends on pH value. The temperature can impact in different ways depending on the carbon and the solution. Normally, decreasing the temperature means increasing the adsorption extent due to the fact that adsorption is exothermic (Aktaş and Çeçen, 2011).
In DWTP the AC is in general used in either fixed bed reactors with granular AC (GAC) or by slurry application in forms of powdered AC (PAC) (Chowdhury et al., 2012). The PAC is added directly to the water, which means it can be added in different locations of the treatment plant, while the GAC is most often used after the filtration just before the post disinfection (Crittenden, 2009). Furthermore, adsorption to GAC is a non-steady-state process, while adsorption to PAC is a steady-state process (Chowdhury et al., 2012). The AC used for this thesis was of a granular type, and the focus will be on GAC in the following.
GAC is a popular treatment material due to its removal efficiency, robustness, and low cost. However, the equilibrium time is long, often more than a week (Zhao et al., 2011), and the removal efficiency decrease with time (Rahman et al., 2013). There are many studies indicating that AC is an efficient method for removing a variety of PFASs from water (Hansen et al., 2010; Xiao et al., 2012; Deng et al., 2010). The 3M company has used GAC in 2005 to remove PFOS from wastewater with a removal efficiency as high as 99 % (Du et al., 2014). However, even though PFOS seems to be efficiently removed with AC, the removal efficiency for substances with shorter chains tend to be lower. Moreover, presence of organic materials in the water may decrease the efficiency (Kemikalieinspektionen, 2013).

11
3. MATERIAL AND METHODOLOGY The batch experiments were performed at SLU, and the column experiments were performed at Bäcklösa DWTP, Uppsala. Thereafter all samples were analysed at the POPs-laboratory at the Department of Aquatic Sciences and Assessment, SLU.
3.1. CHEMICALS AND MATERIAL
3.1.1. Chemicals The PFASs that were investigated in this study (n=26) were PFBA, PFPeA, PFHxA, PFHpA, PFOA, PFNA, PFDA, PFUnDA, PFDoDA, PFTriDA, PFTeDA, PFHxDA, PFOcDA, PFBS, PFHxS, PFOS, PFDS, FOSA, MeFOSA, EtFOSA, MeFOSE, EtFOSE, FOSAA, MeFOSAA, EtFOSAA and 6:2 FTSA (Table 1). The tap water samples from Bäcklösa DWTP were investigated for all 26 different compounds while the pure water samples used for the batch experiments at SLU were investigated for 14 of them, i.e. PFBA (purity 98 %), PFPeA (97 %), PFHxA ( 97 %), PFHpA (99 %), PFOA (96 %), PFNA (97 %), PFDA (98 %), PFUnDA (95 %), PFDoDA (95 %), PFTeDA (97 %), PFBS (98 %), PFHxS ( 98 %), PFOS (98 %), and FOSA (purity not available), and these were also the compounds included in the spiking solution in the reservoir tank for the column experiments at Bäcklösa DWTP.
Two different spiking solutions were used. They both contained the same 14 PFASs but had different concentrations. The one with higher concentration (c = 484.1 mg L-1 per individual PFAS) was used for the column experiments performed at Bäcklösa DWTP, and the one with lower concentration (c = 4.8 mg L-1 per individual PFAS) was used for the batch experiments at SLU.
The Internal standard (IS) that was added to all samples was FXIS07 with a concentration of 50 µg L-1, containing 13C8-FOSA, d3-N-MeFOSAA, d5-N-EtFOSAA, d3-N-MeFOSA, d5-N-EtFOSA, d7-N-MeFOSE, d9-N-EtFOSE, 13C4-PFBA, 13C2-PFHxA, 13C4-PFOA, 13C5-PFNA, 13C2-PFDA, 13C2-PFUnDA, 13C2-PFDoDA, 18O2-PFHxS and 13C4-PFOS.
Elution solvents for the samples were methanol (LiChrosolv®, Darmstadt Germany, ˃99 %) and 0.1 % ammonium hydroxid (Sigma-ALDRICH®, N.L., 25 %) in methanol. The buffer used for the extraction of the samples contained acetic acid (˃99.7 %, Sigma-ALDRICH®, N.L.) with ammonium acetat (˃99.0 %, Fluka, N.L.). The methanol together with acetone (Suprasolv®, ˃99.8 %) was used for cleaning the equipment.
3.1.2. Anion Exchange (Purolite A-600) The AE resin, used in the experiments was Purolite A-600 (Purolite®, Llantrisant, Wales, U.K). It is a Type I quaternary ammonium resin with a gel matrix of styrene-divinylbenzene copolymer, and it is strongly basic. The active group contains of R(CH3)3N+. The minimum total capacity is 1.4 eq L-1; it has an average diameter of 610 ± 90 µm, and shipping weight of 704 g L-1. There is no pH limitation (Purolite, 2010).
12
3.1.3. Granular Activated Carbon (FILTRASORB®400) For the AC treatment, the granular activated carbon FILTRASORB® 400 (Calgon Carbon Corporation, Feluy, Belgium) was used. It consists of the steam activated bituminous coal that first has been pulverised and then agglomerated. FILTRASORB® 400 has the effective size of 0.55-0.75 mm, iodine number of 1000 mg g-1, surface area of 1050 m2 g-1, and its trace capacity number is 10 mg cm-3. It is mainly produced for treatment of surface water (with high levels of total organic carbon), but it is applicable on groundwater as well. FILTRASORB®400 is certified by ISO9001 (Calgon Carbon Corporation, 2004).
3.2. LABORATORY BATCH EXPERIMENTS USING GRANULAR ACTIVATED CARBON AND ANION EXCHANGE
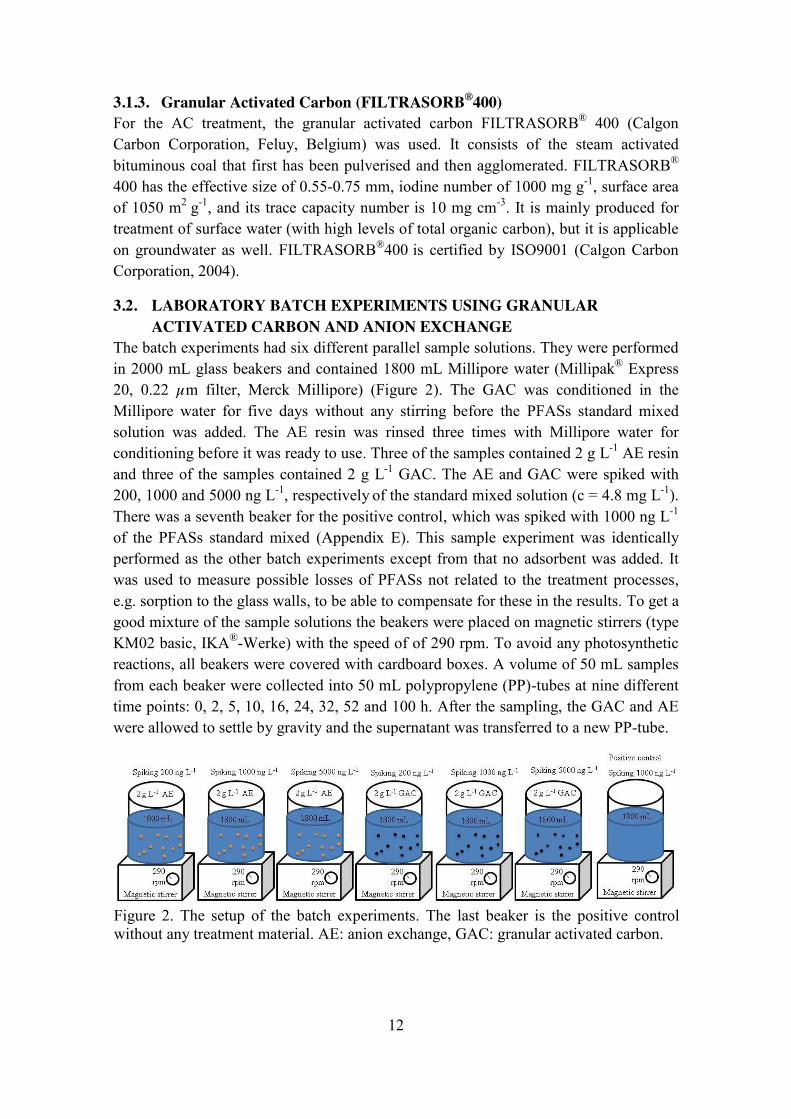
The batch experiments had six different parallel sample solutions. They were performed in 2000 mL glass beakers and contained 1800 mL Millipore water (Millipak® Express 20, 0.22 µm filter, Merck Millipore) (Figure 2). The GAC was conditioned in the Millipore water for five days without any stirring before the PFASs standard mixed solution was added. The AE resin was rinsed three times with Millipore water for conditioning before it was ready to use. Three of the samples contained 2 g L-1 AE resin and three of the samples contained 2 g L-1 GAC. The AE and GAC were spiked with 200, 1000 and 5000 ng L-1, respectively of the standard mixed solution (c = 4.8 mg L-1). There was a seventh beaker for the positive control, which was spiked with 1000 ng L-1
of the PFASs standard mixed (Appendix E). This sample experiment was identically performed as the other batch experiments except from that no adsorbent was added. It was used to measure possible losses of PFASs not related to the treatment processes, e.g. sorption to the glass walls, to be able to compensate for these in the results. To get a good mixture of the sample solutions the beakers were placed on magnetic stirrers (type KM02 basic, IKA®-Werke) with the speed of of 290 rpm. To avoid any photosynthetic reactions, all beakers were covered with cardboard boxes. A volume of 50 mL samples from each beaker were collected into 50 mL polypropylene (PP)-tubes at nine different time points: 0, 2, 5, 10, 16, 24, 32, 52 and 100 h. After the sampling, the GAC and AE were allowed to settle by gravity and the supernatant was transferred to a new PP-tube.
Figure 2. The setup of the batch experiments. The last beaker is the positive control without any treatment material. AE: anion exchange, GAC: granular activated carbon.
13
3.3. PILOT-SCALE COLUMN EXPERIMENTS AT BÄCKLÖSA DRINKING WATER TREATMENT PLANT
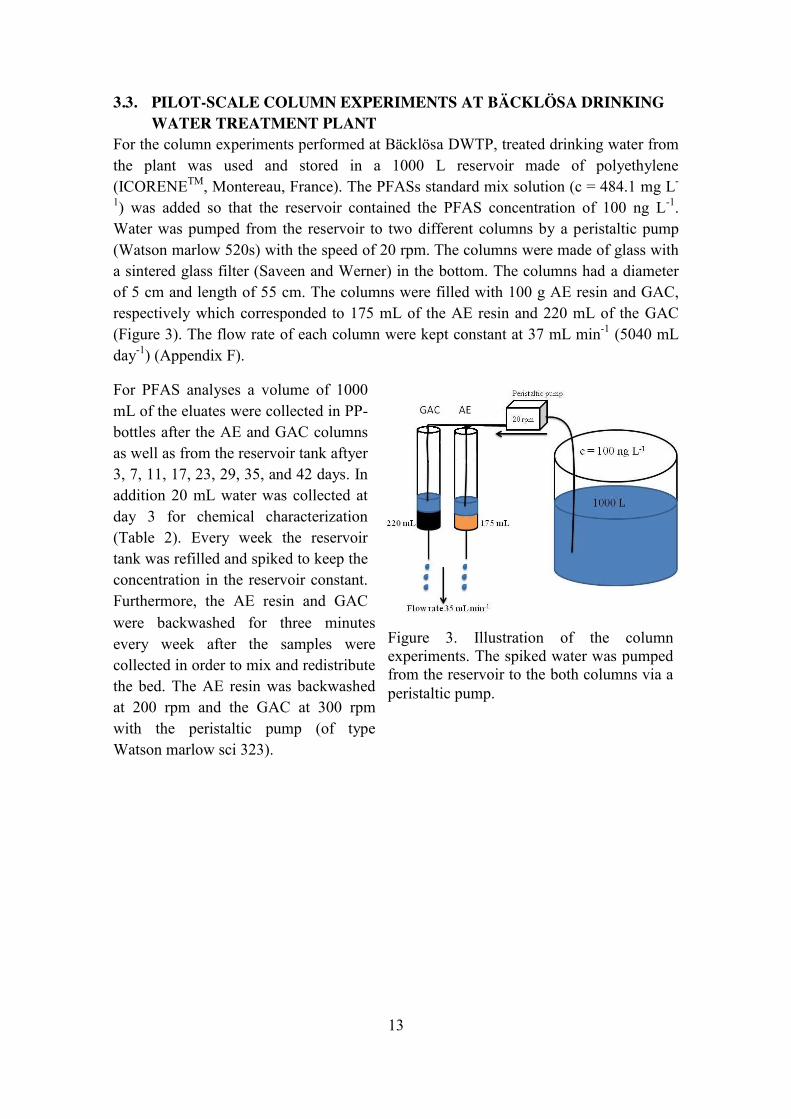
For the column experiments performed at Bäcklösa DWTP, treated drinking water from the plant was used and stored in a 1000 L reservoir made of polyethylene (ICORENETM, Montereau, France). The PFASs standard mix solution (c = 484.1 mg L-
1) was added so that the reservoir contained the PFAS concentration of 100 ng L-1. Water was pumped from the reservoir to two different columns by a peristaltic pump (Watson marlow 520s) with the speed of 20 rpm. The columns were made of glass with a sintered glass filter (Saveen and Werner) in the bottom. The columns had a diameter of 5 cm and length of 55 cm. The columns were filled with 100 g AE resin and GAC, respectively which corresponded to 175 mL of the AE resin and 220 mL of the GAC (Figure 3). The flow rate of each column were kept constant at 37 mL min-1 (5040 mL day-1) (Appendix F).
For PFAS analyses a volume of 1000 mL of the eluates were collected in PP-bottles after the AE and GAC columns as well as from the reservoir tank aftyer 3, 7, 11, 17, 23, 29, 35, and 42 days. In addition 20 mL water was collected at day 3 for chemical characterization (Table 2). Every week the reservoir tank was refilled and spiked to keep the concentration in the reservoir constant. Furthermore, the AE resin and GAC were backwashed for three minutes every week after the samples were collected in order to mix and redistribute the bed. The AE resin was backwashed at 200 rpm and the GAC at 300 rpm with the peristaltic pump (of type Watson marlow sci 323).
Figure 3. Illustration of the column experiments. The spiked water was pumped from the reservoir to the both columns via a peristaltic pump.

14
Table 2. Chemical characteristic of the water from the reservoir tank, the AE column and the GAC column at Bäcklösa DWTP day 3 of the pilot-scale column experiments
Parameter Reservoir Tank AE Column GAC Column
Al3+ (mg L-1) <0.02 <0.02 <0.02
Alkalinity (mg L-1)
115 129 115
Ca2+ (mg L-1) 34.3 33.2 34.6
Cl- (mg L-1) 63 70 63
COD Mn (mg L-1) <1.0 <1.0 <1.0
DOC (mg L-1) 1.78 <1.0 <1.0
F- (mg L-1) 0.91 0.91 0.91
Fe (mg L-1) <0.02 <0.02 <0.02
Conductivity (mS cm-1) 44.7 46.8 47.6
Mg2+ (mg L-1) 16.1 16.3 16.3
Mn (mg L-1) <0.005 <0.005 <0.005
Na+ (mg L-1) 30.4 30.7 31.0
pH 8.3 8.7 8.2
Turbulence 0.18 0.16 0.13
The total concentration of PFASs which were adsorbed to the adsorbents (AE and GAC) was calculated from the concentration data of PFASs (Equation 3).
(3)
where is the total concentration of all PFASs (ng g-1 adsorbent)
is the concentration of PFASs in the raw water for the time point (ng
L-1)
is the concentration of PFASs in the water after the column in time point i (ng L-1) is the mass adsorbent (AE resin or GAC) (g)
15
is the volume water that has passed through the column in total at time point i (L)
Bed volume is the volume of liquid that is treated divided with the volume of adsorbent. The bed volumes (BV) for the two columns were calculated as following
(4)
where = bed volume = flow rate (mL h-1) = sampling time (h) = volume of the adsorbent (mL)
The time that the particles have contact with the adsorbent is called empty bed contact time (EBCT). With an increasing EBCT the particles have more time to adsorb to the adsorbent (Equation 5; Water Treatment Guide, 2007).
(5)
where = empty bed contact time (min) = flow rate (mL min-1) = volume of the adsorbent (mL)
3.4. PFAS ANALYSIS OF THE WATER SAMPLES All the PFASs analyses were performed in the same way, both samples from the batch experiments and the column experiments, with the difference that the column samples were filtrated before extraction. All glassware used throughout the analysis was rinsed with Millipore water and ethanol before they were washed in the dishwasher and burned at 400°C. Thereafter they were rinsed with methanol three times. The samples from the column experiments were first filtered by glass fibre filters (GFF) of the type GC/C, Whatman, 47 mm, ˃1.2 μm).
The extraction of PFASs was done according to Ahrens et al., (2009). Before the solid phase extraction (SPE), the samples were all spiked with the IS (50 pg µL-1). Oasis WAX cartridges were used for the SPE (type Waters, 150 mg, 6 cm3, 30 µm) (Appendix G). Before the SPE cartridges were loaded with the samples, it was preconditioned with 4 mL ammonium hydroxide in methanol, 4 mL methanol and 4 mL Millipore water. The sample volume from the batch experiments was 50 mL, and from the column samples it was 1000 mL. The SPE cartridges were loaded with the speed of one drop per second. After the samples had run through the cartridge, 4 mL of the buffer was added. Finally, the samples were eluted with 6 mL of methanol and then 6 mL ammonium hydroxid in methanol. Thereafter, the samples were concentrated to 1 mL in a nitrogen evaporation device (N-EVAPTM112). The instrumental analysis was done using high performance liquid chromatography-mass spectrometry (HPLC-MS/MS).

16
4. RESULTS
4.1. LABORATORY BATCH EXPERIMENTS USING GRANULAR ACTIVATED CARBON AND ANION EXCHANGE
Considering the low concentrations of PFASs in the environment and in drinking water (in the range of pg L-1 to ng L-1; Rahman et al., 2013), the results from the lowest concentration level (200 ng L-1), are the most relevant. These are displayed in the results sections. The adsorption did not differ notably regarding to concentration levels for the AE experiments. The results for the two higher concentration levels (1000 ng L-1 and 5000 ng L-1) can be seen in Appendix A and Appendix B. However, for the GAC experiments, there were differences in the results (Appendix C; Appendix D).
4.1.1. Anion Exchange (Purolite A-600) The PFCAs in the water samples treated with AE were well adsorbed to the AE resin. Equilibrium was reached after 5-10 hours and nearly 100 % of the PFCAs with shorter perfluorocarbon chain length (C3-C7) were adsorbed to the AE resin (Figure 4A). For the PFCAs with longer perfluorocarbon chain length (C8-C13) the time to reached equilibrium was longer, 10-24 hours, and the adsorption efficiency was lower and more variable, the ratio between the concentrations in the end of the experiment and the initial concentrations were between 0.5 and 0 (Figure 4B).
A. B.
The ratio between the FOSA concentration in the end of the experiment and the initial concentration was ~0.2 for the AE treated samples (c = 200 ng L-1; Figure 5A) and equilibrium was reached after 5 hours. The PFSAs reached equilibrium after 5 hours as well, with the concentration ratio of <0.1 (Figure 5B).
Figure 4. The ratio between the individual PFCA concentrations (C) at respective time point and initial concentrations (C0) for the A) shorter perfluorocarbon chained and B) longer perfluorocarbon chained PFCAs from the water samples treated with AE (C0 = 200 ng L-1). Error bars represent standard deviations of duplicate samples collected after 100 hours.
0.0
0.2
0.4
0.6
0.8
1.0
0 20 40 60 80 100
C/C
0
PFBA PFPeA PFHxA PFHpA PFOA
0.0
0.2
0.4
0.6
0.8
1.0
0 20 40 60 80 100 Time (h)
PFNA PFDA PFUnDA PFDoDA PFTeDA

17
A. B.
The adsorption efficiency of PFASs according to their perfluorocarbon chain length decreased with increasing perfluorocarbon chain length for the samples treated with AE (Figure 6). The PFCAs with a chain length of 10 perfluorocarbons had a ratio lower than 0.2 between the concentrations from the last sample and the initial concentrations, while PFDoDA (C11) and PFTeDA (C13) had ratios of 0.25 and 0.5, respectively.
Figure 6. The ratio between the individual PFAS concentrations (C) at respective time point and initial concentrations (C0) for the PFASs treated with 2 g L-1 AE resin (C0 = 200 ng L-1) after 100 hours treatment.
Figure 5. The ratio between the individual FOSA or PFSA concentrations (C) at the respective time point and initial concentrations (C0) for the A) FOSA and B) PFSAs from the water samples treated with AE (C0 = 200 ng L-1). Error bars represent standard deviations of duplicated samples collected after 100 hours.
0.0
0.2
0.4
0.6
0.8
1.0
0 20 40 60 80 100
C/C
0
FOSA
0.0
0.2
0.4
0.6
0.8
1.0
0 20 40 60 80 100 Time (h)
PFBS PFHxS PFOS
0.0
0.2
0.4
0.6
0.8
1.0
0 2 4 6 8 10 12 14
C/C
0
Perfluorocarbon chain length
PFCAs FOSA PFSAs
18
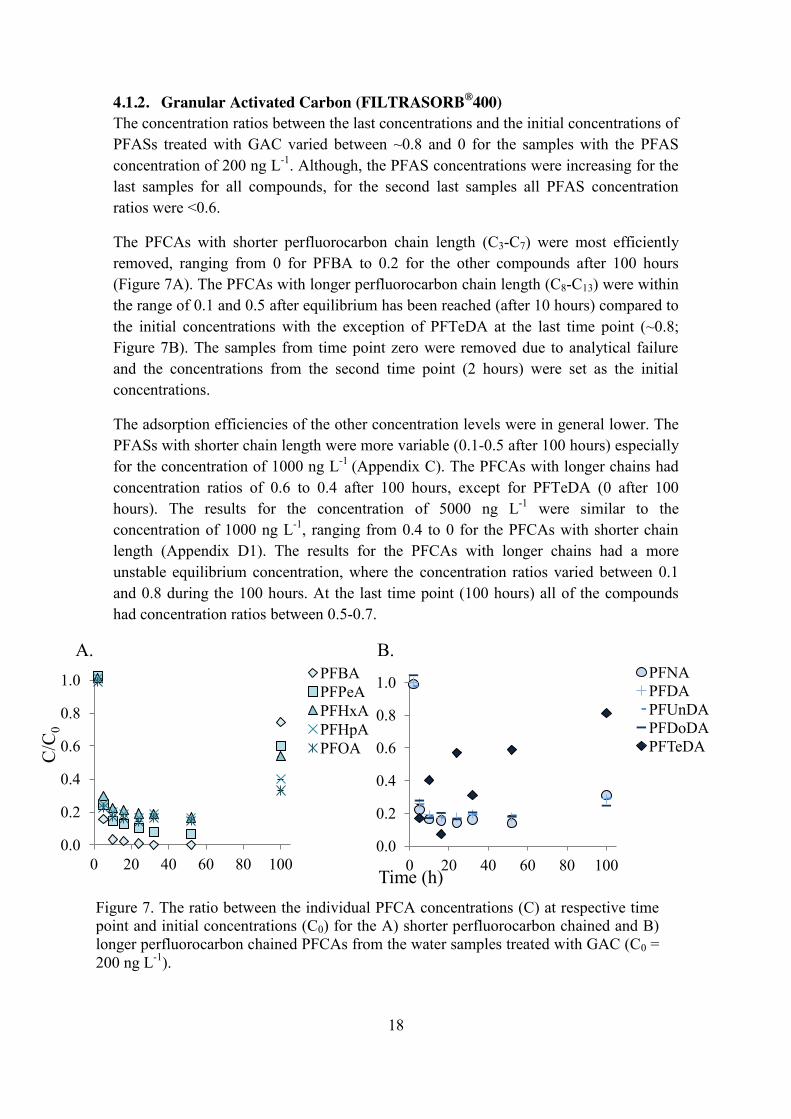
4.1.2. Granular Activated Carbon (FILTRASORB®400) The concentration ratios between the last concentrations and the initial concentrations of PFASs treated with GAC varied between ~0.8 and 0 for the samples with the PFAS concentration of 200 ng L-1. Although, the PFAS concentrations were increasing for the last samples for all compounds, for the second last samples all PFAS concentration ratios were <0.6.
The PFCAs with shorter perfluorocarbon chain length (C3-C7) were most efficiently removed, ranging from 0 for PFBA to 0.2 for the other compounds after 100 hours (Figure 7A). The PFCAs with longer perfluorocarbon chain length (C8-C13) were within the range of 0.1 and 0.5 after equilibrium has been reached (after 10 hours) compared to the initial concentrations with the exception of PFTeDA at the last time point (~0.8; Figure 7B). The samples from time point zero were removed due to analytical failure and the concentrations from the second time point (2 hours) were set as the initial concentrations.
The adsorption efficiencies of the other concentration levels were in general lower. The PFASs with shorter chain length were more variable (0.1-0.5 after 100 hours) especially for the concentration of 1000 ng L-1 (Appendix C). The PFCAs with longer chains had concentration ratios of 0.6 to 0.4 after 100 hours, except for PFTeDA (0 after 100 hours). The results for the concentration of 5000 ng L-1 were similar to the concentration of 1000 ng L-1, ranging from 0.4 to 0 for the PFCAs with shorter chain length (Appendix D1). The results for the PFCAs with longer chains had a more unstable equilibrium concentration, where the concentration ratios varied between 0.1 and 0.8 during the 100 hours. At the last time point (100 hours) all of the compounds had concentration ratios between 0.5-0.7.
A. B.
Figure 7. The ratio between the individual PFCA concentrations (C) at respective time point and initial concentrations (C0) for the A) shorter perfluorocarbon chained and B) longer perfluorocarbon chained PFCAs from the water samples treated with GAC (C0 = 200 ng L-1).
0.0
0.2
0.4
0.6
0.8
1.0
0 20 40 60 80 100
C/C
0
PFBA PFPeA PFHxA PFHpA PFOA
0.0
0.2
0.4
0.6
0.8
1.0
0 20 40 60 80 100 Time (h)
PFNA PFDA PFUnDA PFDoDA PFTeDA

19
The concentration ratios between the concentrations from the last time point and the initial concentrations for FOSA and PFSAs treated with GAC varied between 0 and 0.55 for the lowest concentration level (c = 200 ng L-1; Figure 8) and reached equilibrium after 5 hours. The adsorption efficiency for the two other concentration levels were lower for all compounds. FOSA had the concentration ratio of 0.4 and the PFSAs of 0.4-0.6 for the concentration of 1000 ng L-1 after 100 hours (Appendix C2). For the highest concentration (5000 ng L-1) FOSA’s concentration ratio were 0.7 after 100 hours and the PFSAs’ were between 0.2 and 0.5 (Appendix C2).
A. B.
The adsorption efficiency (after 100 hours) for PFASs treated with GAC decreased with increasing perfluorocarbon chain length except from PFTeDA (C13) with the concentration ratio of 0.8 (Figure 9). In total the concentration ratios varied between 0.8 and 0.25.
Figure 8. The ratio between the individual FOSA or PFSA concentrations (C) at the respective time point and initial concentrations (C0) for the A) FOSA and B) PFSAs from the water samples treated with GAC (C0 = 200 ng L-1).
0.0
0.2
0.4
0.6
0.8
1.0
0 20 40 60 80 100
C/C
0
FOSA
0.0
0.2
0.4
0.6
0.8
1.0
0 20 40 60 80 100 Time (h)
PFBS PFHxS PFOS
0.0
0.2
0.4
0.6
0.8
1.0
0 2 4 6 8 10 12 14
C/C
0
Perfluorocarbon chain length
PFCAs PFSAs FOSA
Figure 9. The ratio between the individual PFAS concentrations (C) at respective time point and initial concentrations (C0) for the PFASs treated with 2 g L-1 GAC resin (C0 = 200 ng L-1) after 100 hours treatment.
20
4.2. PILOT-SCALE COLUMN EXPERIMENTS AT BÄCKLÖSA DRINKING WATER TREATMENT PLANT
The pilot-scale column experiments were performed over a period of 42 days using GAC and AE columns at Bäcklösa DWTP (Figure 3). Spiked (c = 100 ng L-1) drinking water was used. Since the water in the reservoir was tap water from the plant, the samples were investigated for all 26 PFASs which are included in the analysis method (Table 1). The BV for the AE column and GAC column were 12 840 BV and 10 214 BV, respectively for 42 days (Equation 4). The average EBCT for the AE was 4.9 min and for the GAC 6.0 min (Equation 5). The removal efficiency was calculated as the percentage concentrations of PFASs in the samples from the AE and GAC columns, respectively, compared to the concentrations in the reservoir tank for each time point.
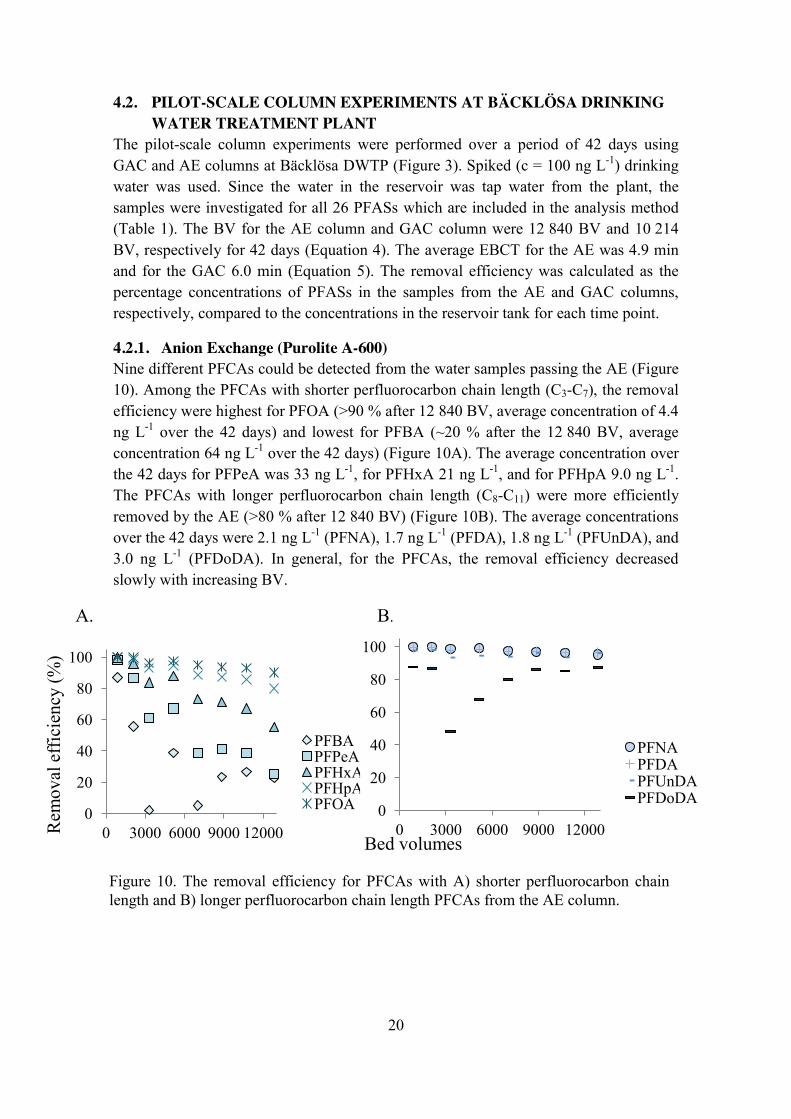
4.2.1. Anion Exchange (Purolite A-600) Nine different PFCAs could be detected from the water samples passing the AE (Figure 10). Among the PFCAs with shorter perfluorocarbon chain length (C3-C7), the removal efficiency were highest for PFOA (˃90 % after 12 840 BV, average concentration of 4.4 ng L-1 over the 42 days) and lowest for PFBA (~20 % after the 12 840 BV, average concentration 64 ng L-1 over the 42 days) (Figure 10A). The average concentration over the 42 days for PFPeA was 33 ng L-1, for PFHxA 21 ng L-1, and for PFHpA 9.0 ng L-1. The PFCAs with longer perfluorocarbon chain length (C8-C11) were more efficiently removed by the AE (˃80 % after 12 840 BV) (Figure 10B). The average concentrations over the 42 days were 2.1 ng L-1 (PFNA), 1.7 ng L-1 (PFDA), 1.8 ng L-1 (PFUnDA), and 3.0 ng L-1 (PFDoDA). In general, for the PFCAs, the removal efficiency decreased slowly with increasing BV.
A. B.
0
20
40
60
80
100
0 3000 6000 9000 12000 Rem
oval
effi
cien
cy (%
)
PFBA PFPeA PFHxA PFHpA PFOA 0
20
40
60
80
100
0 3000 6000 9000 12000 Bed volumes
PFNA PFDA PFUnDA PFDoDA
Figure 10. The removal efficiency for PFCAs with A) shorter perfluorocarbon chain length and B) longer perfluorocarbon chain length PFCAs from the AE column.
21
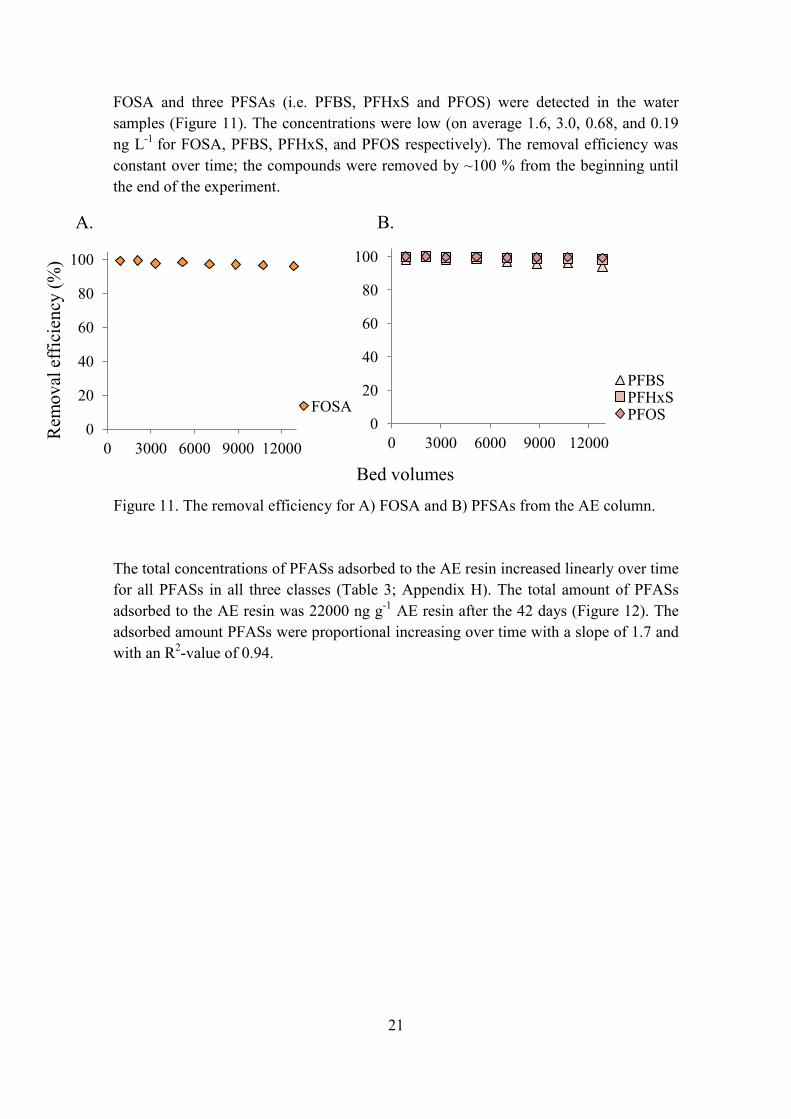
FOSA and three PFSAs (i.e. PFBS, PFHxS and PFOS) were detected in the water samples (Figure 11). The concentrations were low (on average 1.6, 3.0, 0.68, and 0.19 ng L-1 for FOSA, PFBS, PFHxS, and PFOS respectively). The removal efficiency was constant over time; the compounds were removed by ~100 % from the beginning until the end of the experiment.
A. B.
The total concentrations of PFASs adsorbed to the AE resin increased linearly over time for all PFASs in all three classes (Table 3; Appendix H). The total amount of PFASs adsorbed to the AE resin was 22000 ng g-1 AE resin after the 42 days (Figure 12). The adsorbed amount PFASs were proportional increasing over time with a slope of 1.7 and with an R2-value of 0.94.
0
20
40
60
80
100
0 3000 6000 9000 12000
Rem
oval
effi
cien
cy (%
)
FOSA 0
20
40
60
80
100
0 3000 6000 9000 12000
Bed volumes
PFBS PFHxS PFOS
Figure 11. The removal efficiency for A) FOSA and B) PFSAs from the AE column.

22
Table 3.The cumulative concentration of the PFASs adsorbed to the AE resin and the removal efficiency of them in the end of the experiments (12840 BV).
Substances Total concentration ng g-1 AE resin
Removal Efficiency (%)
PFBA 590 23
PFPeA 790 25
PFHxA 1600 56
PFHpA 1800 80
PFOA 2000 90
PFNA 2000 95
PFDA 1500 96
PFUnDA 880 96
PFDoDA 300 87
PFBS 2200 95
PFHxS 2100 98
PFOS 1300 99
FOSA 1400 95
y = 1.7x - 1500 R² = 0.94
0
5000
10000
15000
20000
25000
0 3000 6000 9000 12000
Con
cent
ratio
n (n
g g-1
ads
orbe
nt)
Bed volumes
PFASs
Figure 12. The cumulative concentration of all detected PFASs adsorbed to the AE resin in ng g-1 AE resin.
23
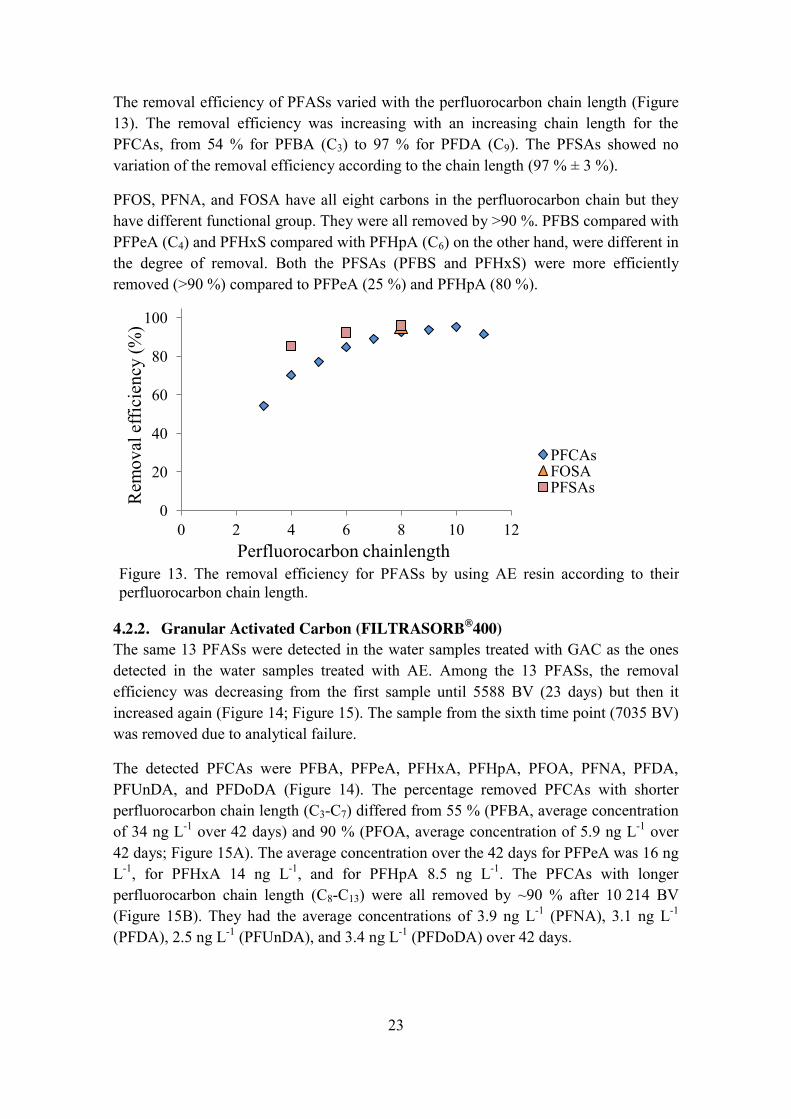
The removal efficiency of PFASs varied with the perfluorocarbon chain length (Figure 13). The removal efficiency was increasing with an increasing chain length for the PFCAs, from 54 % for PFBA (C3) to 97 % for PFDA (C9). The PFSAs showed no variation of the removal efficiency according to the chain length (97 % ± 3 %).
PFOS, PFNA, and FOSA have all eight carbons in the perfluorocarbon chain but they have different functional group. They were all removed by ˃90 %. PFBS compared with PFPeA (C4) and PFHxS compared with PFHpA (C6) on the other hand, were different in the degree of removal. Both the PFSAs (PFBS and PFHxS) were more efficiently removed (˃90 %) compared to PFPeA (25 %) and PFHpA (80 %).
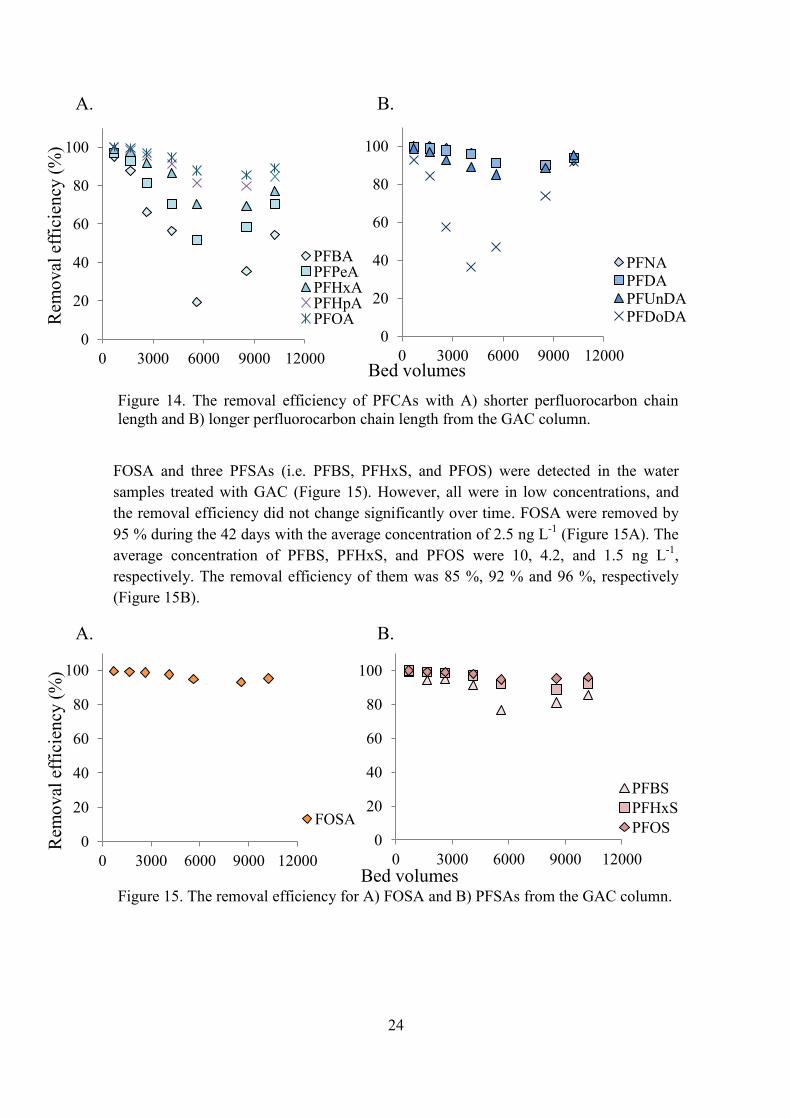
4.2.2. Granular Activated Carbon (FILTRASORB®400) The same 13 PFASs were detected in the water samples treated with GAC as the ones detected in the water samples treated with AE. Among the 13 PFASs, the removal efficiency was decreasing from the first sample until 5588 BV (23 days) but then it increased again (Figure 14; Figure 15). The sample from the sixth time point (7035 BV) was removed due to analytical failure.
The detected PFCAs were PFBA, PFPeA, PFHxA, PFHpA, PFOA, PFNA, PFDA, PFUnDA, and PFDoDA (Figure 14). The percentage removed PFCAs with shorter perfluorocarbon chain length (C3-C7) differed from 55 % (PFBA, average concentration of 34 ng L-1 over 42 days) and 90 % (PFOA, average concentration of 5.9 ng L-1 over 42 days; Figure 15A). The average concentration over the 42 days for PFPeA was 16 ng L-1, for PFHxA 14 ng L-1, and for PFHpA 8.5 ng L-1. The PFCAs with longer perfluorocarbon chain length (C8-C13) were all removed by ~90 % after 10 214 BV (Figure 15B). They had the average concentrations of 3.9 ng L-1 (PFNA), 3.1 ng L-1 (PFDA), 2.5 ng L-1 (PFUnDA), and 3.4 ng L-1 (PFDoDA) over 42 days.
Figure 13. The removal efficiency for PFASs by using AE resin according to their perfluorocarbon chain length.
0
20
40
60
80
100
0 2 4 6 8 10 12
Rem
oval
effi
cien
cy (%
)
Perfluorocarbon chainlength
PFCAs FOSA PFSAs
24
A. B.
FOSA and three PFSAs (i.e. PFBS, PFHxS, and PFOS) were detected in the water samples treated with GAC (Figure 15). However, all were in low concentrations, and the removal efficiency did not change significantly over time. FOSA were removed by 95 % during the 42 days with the average concentration of 2.5 ng L-1 (Figure 15A). The average concentration of PFBS, PFHxS, and PFOS were 10, 4.2, and 1.5 ng L-1,
respectively. The removal efficiency of them was 85 %, 92 % and 96 %, respectively (Figure 15B).
A. B.
0
20
40
60
80
100
0 3000 6000 9000 12000
Rem
oval
effi
cien
cy (%
)
FOSA 0
20
40
60
80
100
0 3000 6000 9000 12000 Bed volumes
PFBS PFHxS PFOS
Figure 14. The removal efficiency of PFCAs with A) shorter perfluorocarbon chain length and B) longer perfluorocarbon chain length from the GAC column.
0
20
40
60
80
100
0 3000 6000 9000 12000
Rem
oval
effi
cien
cy (%
)
PFBA PFPeA PFHxA PFHpA PFOA
0
20
40
60
80
100
0 3000 6000 9000 12000 Bed volumes
PFNA PFDA PFUnDA PFDoDA
Figure 15. The removal efficiency for A) FOSA and B) PFSAs from the GAC column.

25
The total concentrations of PFASs adsorbed to the GAC increased linearly over time for all PFASs (Table 4; Appendix I). The maximum of the total concentration of PFASs adsorbed to the GAC was 23500 ng g-1 GAC after the 42 days (Figure 16). The amount adsorbed PFASs to the GAC increased linearly over time with a slope of 2.2 and R2 value of 0.93.
Table 4.The cumulative concentration of the PFASs adsorbed to the GAC and the removal efficiency of them in the end of the experiments (10214 BV).
Substances Total concentration ng g-1 AE resin
Removal Efficiency (%)
PFBA 930 54
PFPeA 940 70
PFHxA 1400 77
PFHpA 1500 85
PFOA 1600 89
PFNA 1600 92
PFDA 1200 93
PFUnDA 730 95
PFDoDA 250 91
PFBS 1700 85
PFHxS 1700 92
PFOS 1100 96
FOSA 1200 95

26
The removal efficiency with respect to the PFASs’ perfluorocarbon chain length increased with increasing chain length (Figure 17). For the PFCAs the removal efficiency ranged from ~50 % (PFBA, C3) to 95 % (PFUnDA, C11). The removal efficiency for the PFSAs varied between 85 % (PFBS, C4) and 95 % (PFOS, C8).
The PFSAs PFBS (C4, 85 %) and PFHxS (C6, 92 %) showed a higher removal efficiency compared to the PFCAs PFPeA (C4, 70 %) and PFHpA (C6, 85 %). However, the difference was smaller than for the samples from the AE column. Furthermore, PFOS, PFNA, and FOSA (C8) were all removed by ~95 %.
Figure 17. The removal efficiency for PFASs by using GAC according to their perfluorocarbon chain length.
0
20
40
60
80
100
0 2 4 6 8 10 12
Rem
oval
effi
cien
cy (%
)
Perfluorocarbon chainlength
PFCAs FOSA PFSAs
Figure 16. The total concentration of all detected PFASs adsorbed to the GAC in ng g-1 GAC.
y = 2.2x - 1700 R² = 0.93
0
5000
10000
15000
20000
25000
0 3000 6000 9000 12000
Con
cent
ratio
n (n
g g-1
ads
orbe
nt)
Bed volumes
PFASs

27
5. DISCUSSION
5.1. LABORATORY BATCH EXPERIMENTS USING GRANULAR ACTIVATED CARBON AND ANION EXCHANGE
Both AE (Purolite A-600) and GAC (FILTRASORB®400) efficiently adsorbed PFASs from the water samples in the batch experiments. The equilibrium time for all PFASs using AE was fast (within five hours) for all concentration levels (200 ng L-1, 1000 ng L-1, and 5000 ng L-1; Figure 4; Figure 5; Appendix A1-2; Appendix B1-2). A fast equilibrium time (five hours) was also observed using GAC for the PFAS concentration of 200 ng L-1 (Figure 7; Figure 8). However, the GAC experiments for PFAS concentration of 1000 ng L-1 and 5000 ng L-1 had longer equilibrium times (16-24 hours; Appendix C1-2; Appendix D1-2). Factors which can contribute to rapid equilibrium times are the absence of organic compounds and high temperature. The presence of organic compounds in a solution may create competition with the PFASs to be adsorbed (Zhao et al., 2011). Temperature impacts on the adsorption such as higher temperature results in faster diffusion rate (Aktaş and Çeçen, 2011). The use of Millipore water (no organic compounds in the solutions) and the relatively high temperature of 30°C in this study may casued fast equilibrium time. This is in agreement with other studies showing fast equilibrium times (3-32 hours) using different adsorbents (Zhou et al. 2009; Zhou et al., 2012; Tang et al., 2010). For example, PFOS reached equilibrium already after three hours in a study where adsorption of PFOS onto goethite was investigated (Tang et al., 2010). However, some studies have shown that when GAC is used as an adsorbent, more time is needed to reach equilibrium (Yu et al., 2008; Hansen et al., 2010). Yu et al. (2008) investigated the kinetic and adsorption isotherms for PFOS and PFOA onto PAC, GAC, and AE (A1400) with an equilibrium time of 168 hours for the GAC and AE. In a study where the sorption properties of PFASs from contaminated water onto PAC (Silcarbon TH90 extra) and GAC (Silcarbon) were investigated, an equilibrium time of 4 weeks was predicted for the GAC (Hansen et al., 2010).
The adsorption efficiency of PFASs using AE and GAC was relatively high in the batch experiments. In general, the ratio from the last time point concentrations and the initial concentrations was lower for AE compared to GAC showing that most PFASs were absorbed by ˃90 %. The exceptions were the short perfluorocarbon chain length PFCAs (C8-C13; concentration of 200 ng L-1 and 1000 ng L-1) which were adsorbed between 50 % and 100 % (Figure 4; Appendix A1) and FOSA (concentration of 200 ng L-1), which was adsorbed ~80 % (Figure 5). Chularueangaksorn et al., (2013), achieved similar result when comparing adsorption properties between GAC Filtrasorb®400 with AE resin (PFA 300 and Dow Marathon A) and non-ion resin (XAD4). The AE resins had the highest removal efficiency of PFOA followed by GAC and then the non-ion-resin. The result was explained by PFOA’s presence as an anion in water which prefers to adsorb to AE resins. This can be assumed also for the current study and for all PFASs that occur as anions in water.

28
Even though the AE adsorbed PFASs better (on average 90 %) compared to the GAC (on average 65 %) in this study, the GAC adsorbed many of the PFASs in the lowest concentration level with more than 70 % (200 ng L-1; Figure 7; Figure 8). Based on results from previous studies, a sufficient removal efficiency using GAC, and Filtrasorb®400 in particular was expected (Chularueangaksorn et al., 2013; Ochoa Herrera, 2008; Senevirathna et al., 2010). Ochoa Herrera (2008) was investigating three different types of GAC (i.e. Filtrasorb®300, Filtrasorb®400, URV-MOD 1) for which the highest removal efficiency was observed for Filtrasorb®400. Senevirathna et al. (2010) also investigated GAC Filtrasorb®400 compared with a non-ion resin. The results showed that GAC had the highest sorption kinetic but lowest sorption capacity (~40 mg g-1 adsorbent) of the investigated methods. Zhao et al. (2011) also showed that GAC had high removal efficiency for PFOS, PFOA, PFBS, and PFBA (˃90 % for PFOS and 40-70 % for the PFASs with shorter perfluorocarbon chain length (C3-C7) using deionised water in absent and present of ultrasound.
For the samples treated with GAC for the higher concentration levels (1000 ng L-1 and 5000 ng L-1), the PFAS concentration ratios varied more after equilibrium had been reached for the longer chained PFCAs (40 % ± 25 %), FOSA (50 % ± 20 %), and PFSAs (40 % ± 30 %) (Appendix C1-2; Appendix D1-2). The reason for that the equilibrium concentrations did not stabilise may be desorption effects. It has been observed before that when the AC is saturated, it can start to desorb the PFASs instead of adsorbing those (Takagi et al., 2011). Moreover, adsorption is depending on temperature, while lower temperature entails stronger adsorption (Takagi et al., 2011). In this study, the unstable equilibrium concentrations occurred at higher concentration levels, with relatively high temperature (30°C) and when pure Millipore water was used where no other compounds (e.g. DOC) could enhance the equilibrium. Thus, desorption is a possible reason for the variation in the equilibrium concentrations.
Other studies have shown that the perfluorocarbon chain length has an effect on the adsorption behavior of PFASs, and that adsorption can be assumed to increase for molecules with higher molecular weight (Aktaş and Çeçen, 2011). The water solubility decreases with an increasing perfluorocarbon chain length, and thereby the PFASs with longer perfluorocarbon chain length are more inclined to adsorb to particles (Campbell et al., 2009; Kemikalieinspektionen 2013; Rahman et al., 2013). In this study, the reverse trend was seen for the samples treated with AE (c = 200 ng L-1 and 1000 ng L-1) and GAC (c = 1000 ng L-1 and 5000 ng L-1), i.e. decreasing adsorption efficiency with increasing perfluorocarbon chain length (Figure 6; Appendix A3; Appendix C3; Appendix D3). It is not clear what caused this trend. However, smaller PFAS molecules have weaker steric effect and quicker diffusion, which might contribute to quicker and even higher adsorption to porous GAC and AE resins of the shorter chained PFASs (Du et al. 2014). However, this might not be the main reason in this case, since steric effects are not likely in pure water, which was used in this study. Furthermore, the removal
29
efficiency increased with increasing concentration for the AE which indicate that the AE resin was not saturated for the lower concentration levels.
The influence of the PFASs’ functional group on the adsorption varied for the different concentration levels and between AE and GAC. The samples treated with AE (c = 1000 ng L-1) showed no differences between the different functional groups (Appendix A3), and all compounds from the solution with a concentration of 5000 ng L-1 were adsorbed with 100 % (Appendix B3). Furthermore, the samples treated with GAC (c = 200 ng L-
1) did not show any substantial variations in the adsorption behaviour according to the functional group (Figure 9). However, FOSA (C8), which is the only neutral compound of the investigated PFASs, was less adsorbed (79 %) than PFNA (C8) (97 %) and PFOS (C8) (92 %) in the water samples treated with AE (c = 200 ng L-1) and the water samples treated with GAC (c = 5000 ng L-1). In contrast, for the samples treated with GAC (c = 1000 ng L-1), FOSA was better adsorbed (66 %) than PFNA and PFOS (both 44 %). There were no clear differences between PFCAs and PFSAs in adsorption behaviour between the corresponding compounds, i.e. PFPeA and PFBS (C4), PFHpA and PFHxA (C6), and, PFNA and PFOS (C8) in the samples treated with AE. The samples treated with GAC (c = 1000 ng L-1 and 5000 ng L-1) had some higher adsorption for PFPeA (in average 84 %) and PFHpA (in average 57 %) than for PFBS (70 %) and PFHxA (48 %) but no difference between PFNA and PFOS (Appendix C3; Appendix D3). The adsorption of PFASs can be expected to vary between the different PFAS classes because of their differences in physical and chemical properties (Rahman et al., 2013). There have been cases where the PFSAs have been more adsorbed than the PFCAs, which can be assumed to be connected with their stronger hydrophobicity (Du et al., 2014; Zhou et al., 2009; Hansen et al., 2010).
There are limitations with the batch experiments which have to be considered for the results’ applicability. The use of Millipore water excluded the effects of influences from organic matters and the competition effects with other compounds for the adsorption to AE resin and GAC (Rahman et al., 2013). Furthermore, the temperature of raw water in DWTPs is depending on seasons, with cooler water during the winter and warmer water during the summer, and the constant temperature of 30°C which was used in this study does not entirely reflect the reality. The concentrations detected in raw water are in general lower, in Sweden normally <10 ng L-1 (Livsmedelsverket, 2014), and lower concentrations may result in lower removal efficiencies.
30
5.2. PILOT-SCALE COLUMN EXPERIMENTS AT BÄCKLÖSA DRINKING WATER TREATMENT PLANT
The column experiments were performed with drinking water stored in a reservoir tank at Bäcklösa DWTP. The water was spiked with 100 ng L-1 PFAS standard solution, but since the drinking water might contain other PFASs than the standard solution, these samples were analysed for all 26 PFASs that the HPLC-MS/MS can detect (Table 1). Although, only compounds from the spiking solution were detected in the samples, i.e. PFBA PFPeA, PFHxA, PFHpA, PFOA, PFNA, PFDA, PFUnDA, PFDoDA, PFBS, PFHxS, PFOS, and FOSA. The removal efficiency for these compounds were in general high for the samples treated with AE, with 100 % for FOSA and the PFSAs (Figure 11) and ˃80 % for the PFCAs with longer perfluorocarbon chains (˃C5) (Figure 10) during the whole experiment (42 days). The same trend was seen for the samples treated with GAC, but with some lower removal efficiency (Figure 14; Figure 15). Both AE resin and GAC have been reported to remove PFASs in previous pilot-scale studies (Rahman et al., 2013; Senevirathna et al., 2010, Takagi et al., 2011). GAC Filtrasorb®400 was compared with non-ion resins (Dow V493, Dow L493, and AMB XAD) in a column experiment (Senevirathna et al., 2010). The removal efficiency for PFOS was ˃80 % during the first 40 days, but it decreased to less than 70 % after 60 days. The same trend could be seen in a study using two different AC (one from coal and one from coconut shells) (Takagi et al., 2011). The first 100 days the removal efficiency was 100 % but after 200 days it decreased to less than 70 % for both AC for PFOA and PFOS. Furthermore, AE has been reported to have a better removal efficiency compared to GAC regarding the PFASs with short perfluorocarbon chain length (≤C6) (Rahman et al., 2013).
In this study, the removal efficiency was decreasing over time for the samples from the AE column, especially for the PFCAs with shorter perfluorocarbon chain length, with the lowest removal efficiency for PFBA with 23 % (Figure 10). For the longer perfluorocarbon chained PFCAs (C8-C13), FOSA and PFSAs, the removal efficiency decreased on average from 100 % to 87 % (Figure 11). A similar trend was observed for the GAC column over the first 23 days (5588 BV; Figure 14; Figure 15). However, the removal efficiency was increasing after 23 days until day 42 for all PFASs. Whether this trend will continue is unclear, since the last samples were collected at day 42 in this study. The presence of DOC in the GAC is a possible reason for the increase of removal efficiency. The adsorption of DOC material and the adsorption of PFASs to the GAC followed the same trend (Figure 18). For the last two samples, the PFAS concentration increased more than the concentration of DOC, and the DOC might have a positive effect on the adsorption of PFASs.
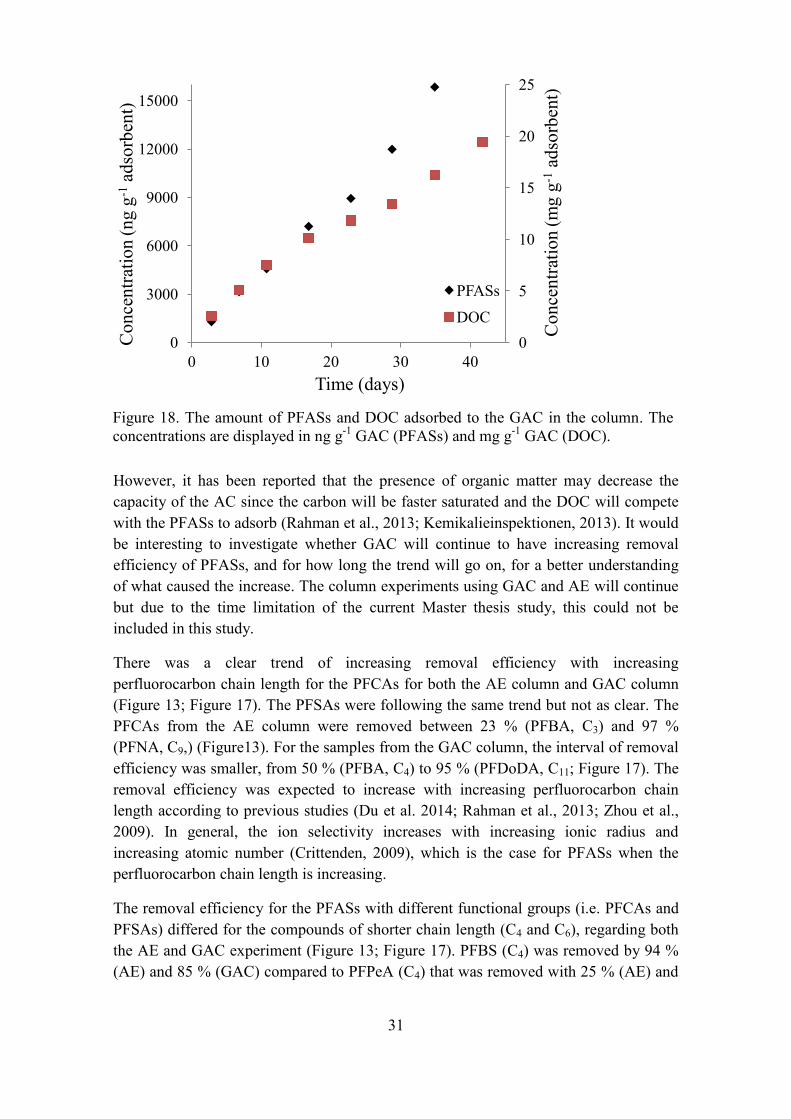
31
However, it has been reported that the presence of organic matter may decrease the capacity of the AC since the carbon will be faster saturated and the DOC will compete with the PFASs to adsorb (Rahman et al., 2013; Kemikalieinspektionen, 2013). It would be interesting to investigate whether GAC will continue to have increasing removal efficiency of PFASs, and for how long the trend will go on, for a better understanding of what caused the increase. The column experiments using GAC and AE will continue but due to the time limitation of the current Master thesis study, this could not be included in this study.
There was a clear trend of increasing removal efficiency with increasing perfluorocarbon chain length for the PFCAs for both the AE column and GAC column (Figure 13; Figure 17). The PFSAs were following the same trend but not as clear. The PFCAs from the AE column were removed between 23 % (PFBA, C3) and 97 % (PFNA, C9,) (Figure13). For the samples from the GAC column, the interval of removal efficiency was smaller, from 50 % (PFBA, C4) to 95 % (PFDoDA, C11; Figure 17). The removal efficiency was expected to increase with increasing perfluorocarbon chain length according to previous studies (Du et al. 2014; Rahman et al., 2013; Zhou et al., 2009). In general, the ion selectivity increases with increasing ionic radius and increasing atomic number (Crittenden, 2009), which is the case for PFASs when the perfluorocarbon chain length is increasing.
The removal efficiency for the PFASs with different functional groups (i.e. PFCAs and PFSAs) differed for the compounds of shorter chain length (C4 and C6), regarding both the AE and GAC experiment (Figure 13; Figure 17). PFBS (C4) was removed by 94 % (AE) and 85 % (GAC) compared to PFPeA (C4) that was removed with 25 % (AE) and
Figure 18. The amount of PFASs and DOC adsorbed to the GAC in the column. The concentrations are displayed in ng g-1 GAC (PFASs) and mg g-1 GAC (DOC).
0
5
10
15
20
25
0
3000
6000
9000
12000
15000
0 10 20 30 40
Con
cent
ratio
n (m
g g-1
ads
orbe
nt)
Con
cent
ratio
n (n
g g-1
ads
orbe
nt)
Time (days)
PFASs
DOC

32
0
20
40
60
80
100
0 3000 6000 9000 12000 15000
Rem
oval
effi
cien
cy (%
)
Bed volumes
AE GAC
70 % (GAC). The difference of removal efficiency between PFHxS (C6) and PFHpA (C6) was less pronounced, 98 % and 70 % (AE) and 92 % and 85 % (GAC). The higher removal efficiency of PFSAs compared to PFCAs has been seen in previously studies (Zhou et al., 2009). The PFSAs are stronger acids and more hydrophobic than PFCAs which contribute to the higher tendency to be adsorbed (Du et al., 2014; Rayne and Forest, 2009).
The results from the column experiments are affected by a multitude of parameters, such as flow rate, adsorbent properties, contact time, temperature, and PFAS concentration. These parameters were kept constant during the experiments as far as possible, to achieve consistent results. However, there were some deviations for the flow rate and PFAS concentration. The flow rate did not differ more than 5 % (in total 37 mL min-1±1.8) and the error can be assumed to be neglected. However, the PFAS concentration in the reservoir tank differed more (ΣPFCAs c = 676 ng L-1±134 ng L-1, ΣPFCAs c = 262 ng L-1±53.1 ng L-1, and FOSA c = 66.1 ng L-1±13.5 ng L-1), in particular for PFDoDA (c = 16.6 ng L-1±9.00 ng L-1), which might have an impact on the results (Appendix J).
The removal efficiency was ˃60 % for most of the PFASs, treated with both AE and GAC, after 42 days (12840 BV and 10214 BV, respectively), exception was the PFCAs with shorter perfluorocarbon chain length than C6 treated with AE. The average removal efficiencies of all PFASs were over 80 % for AE and over 75 % for GAC during the whole experiment
(Figure 19). On average the PFASs were removed almost with the same efficiency for both AE and GAC during the whole experiment. To define which technique is most suitable for full scale application there are more factors to take into account than the removal efficiency. The current study was going on for 42 days, whereas DWTP techniques are designed for longer term applications. The GAC has been reported to decrease in removal capacity over time and a regeneration of the GAC is needed (Rahman et al., 2013; Takagi et al., 2011; Senevirathna et al., 2010). Even though the GAC used in this study (Filtrasorb®400) can be reused after thermal reactivation, where the carbon is treated at 800°C (Calgon Carbon Corporation, 2004),
Figure 19. The average removal efficiency of ΣPFASs using AE and GAC.
33
this would be expensive over time. There is also a need to consider that each DWTP has specific conditions (e.g. DOC content in the raw water) for the selection of the most suitable adsorbent for the removal of PFASs. There may also be variations in some factors within the DWTP, e.g. seasonal temperature changes, pH variations and differences of concentrations of organic compounds. For example, the pH value in drinking water is normally between 6 and 9, but this should not affect the AE adsorption (Rahman et al., 2013) since the used AE resin (Purolite A-600) does not have any pH limitations (Purolite, 2010). A continuation of the column leaching experiments is needed to investigate how the removal efficiency for the shorter chain PFCAs will decrease or stabilise, since the shorter chained PFASs are, in general, not sufficiently removed.
In this study AE and GAC showed promising results for the removal of PFASs. However, to get a better understanding which one of them that is most suitable for the removal of PFASs more research is required. Therefore, it is of interest to continue these experiments at a pilot-scale, and thereafter continue with full-scale studies.

34
6. CONCLUSIONS PFASs are compounds with persistent and bioaccumulating features, and with possible harmful effects on humans and animals. In Sweden, high concentrations of PFASs have been detected in some municipalities’ drinking water due to contamination of AFFF from fire exercises areas. Most of the conventional treatment techniques in DWTP cannot remove PFASs, and more research is required to improve the removal efficiency of these compounds in DWTPs.
The results in this study showed that both AE (Purolite A600) and GAC (Filtrasorb®400) removed PFASs from Millipore water in the batch experiments, and drinking water in the column experiments. This is true for all investigated PFASs, but with varying results in the removal efficiency. In general, the AE removed the PFASs more efficiently than the GAC. In the batch experiments, AE removed PFASs on average by 92 % and in the column experiment on average by 86 %. For the GAC, the PFASs were removed on average by 65 % in the batch experiments, and on average by 86 % in the column experiments.
The differences in removal efficiency could be related to the length of the PFASs’ perfluorocarbon chain. However, the results differed between the batch and column experiments, which may be because of the performance in different water (Millipore water and drinking water). The batch experiment showed a decrease in the removal efficiency with increasing perfluorocarbon chain length, with the exception of the samples treated with AE (c = 5000 ng L-1) and the samples treated with GAC (c = 200 ng L-1), where no variation of the removal efficiency according to perfluorocarbon chain length could be seen. The column experiments had better removal efficiency with increasing perfluorocarbon chain length, which is in agreement with previous studies (Du et al. 2014; Rahman et al., 2013; Zhou et al., 2009).
The functional group also showed an influence on the removal efficiency. In the column experiments, the PFSAs were more efficiently removed (on average 97 % and 91 % for AE and GAC, respectively) compared to PFCAs (on average 67 % and 82 % for AE and GAC, respectively). There were no pronounced differences in the removal efficiency between FOSA and PFNA and PFOS, in the column experiments. In the batch experiments there were variations between all three PFASs classes; however, they were not following any clear trend. In all of the AE treated samples and in the GAC treated samples (c = 200 ng L-1), the removal efficiency was more or less the same for both classes. For the samples treated with GAC (c = 1000 ng L-1 and 5000 ng L-1), the average removal efficiency of PFSAs were 48 % and 63 % respectively, and 57 % for the PFCAs of both concentration levels. In the column experiments the average removal efficiency for PFSAs was 97 % for AE and 91 % for GAC compared to 67 % and 82 % for AE and GAC, respectively, for the PFCAs.
According to the PFAS concentration’s impact, the removal efficiency was highest (100 % for all compounds) for the highest concentration level (c = 5000 ng L-1) for the
35
samples treated with AE. For the samples treated with GAC, the removal efficiency was lowest for the lowest concentration level, but highest for the medium concentration level. On average, the PFASs were removed by 73 %, 60 % and 62 % for the concentration levels, 200 ng L-1, 1000 ng L-1 and 5000 ng L-1, respectively.
The achieved results were in agreement with the first hypotheses for this thesis. The removal efficiency of PFASs was depending on fluorocarbon chain length, functional group, and concentration. All the PFASs were removed in all experiments and thereby, also the second hypothesis can be confirmed, i.e. AE and AC can be used as alternative techniques for the removal of PFASs in drinking water.
The column experiments removed the PFASs relatively well in the end of this study (on average 86 % for both AE and GAC). The experiments will continue and reveal how the removal efficiency will change over time (this will not be part of this Master thesis). The lowest removal capacity was seen for the shorter chained PFASs (i.e. ≤C6 PFCAs for the AE and ≤C7 PFCAs for the GAC), which agrees with several previously studies (Du et al. 2014; Rahman et al., 2013; Zhou et al., 2009). Since these compounds are already globally spread both in the market and environment, it is of interest to find efficient removal treatment techniques for these PFASs.
36
7. REFERENCES Ahrens, L. (2011). Polyfluoroalkyl compounds in the aquatic environment: a review of
their occurrence and fate. Journal of Environmental Monitoring. vol 13.1, pp. 20-31.
Ahrens, L., Barber, J. L., Xie, Z. and Ebinghaus, R. (2009). Longitudinal and latitudinal
distribution of perfluoroalkyl compounds in the surface water of Atlantic ocean. Environ. Sci. Technol. vol. 43, pp. 3122-3127.
Ahrens, L., Harner, T., Shoeib, M., Lane, D. A. and Murphy, J. G. (2012). Improved
characterization of gas-particle partitioning for per- and polyfluoroalkyl substances in the atmosphere using annular diffusion denuder samplers. Environmental Sci. Technol. vol. 46, pp. 7199-7206.
Ahrens, L. and Bundschuh, M. (2014). Fate and effects of poly- and perfluoroalkyl
substances in the aquatic environment: A review. Environmental Toxicology and Chemistry. vol. 33, pp. 1921-1929. USA: SETAC.
Aktaş, Ö. and Çeçen, F. (2011). Activated carbon for water and wastewater treatment.
pp. 13-126. Hoboken, NJ, USA: Wiley-VCH [Imprint]. Appleman, T. D. (2013). The removal of poly- and perfluoroalkyl substances by North
American water treatment practices. Appleman T. D., Dickenson, E. R. V., Bellona, C. and Higgins, C. (2013a).
Nanofiltration and granular activated carbon treatment of perfluoroalkyl acids. Journal of Hazardous Materials. vol. 206, pp. 740-746. Elsevier B.V. Water Research 51.
Appleman, T. D., Higgins, C. P., Quiñones, O., Vanderford, B. J., Kolstad, Zeigler-
Holady, J. C. and Dickenson, E. R. V. (2013b). Treatment of poly- and perfluoroalkyl substances in U.S. full-scale water treatment systems.
Arvaniti, O. S., Andersen, H. R., Thomaidis, N. S. and Stasinakis, A., S. (2014).
Sorption of perfluorinated compounds onto different types of sewage sludge and assessment of its importance during wastewater treatment. Chemosphere. vol. 111, pp. 405-411. Elsevier Ltd.
Borg, D. and Håkansson, H. (2012). Environmental and health risk assessment of
perfluoroalkylated and polyfluoroalkylated substances (PFASs) in Sweden. Stockholm, Sweden: Naturvårdsverket.
Brooke, D., Footitt, A. and Nwaogu, T.A. (2004). Environmental risk evaluation report:
perfluorooctanesulphonate (PFOS). Environment Agency. UK. Buck, R. C., Franklin, J., Berger, U., Conder, J. M., Cousins, I. T., de Voogt, P., Jensen,
A. A. Kannan, K., Mabury, S. A. and Leeuwen. (2011). Perfluoroalkyl and polyfluoroalkyl substances in the environment: terminology, classification,

37
and origins. Integrated environment assessment and management. vol. 7, pp. 513-541. SETAC.
Butt, C. M., B, U., Bossi, R. and Tomy, G. T. (2010). Levels and trends of poly- and
perfluorinated compounds in the arctic environment. Science of Total Environment. vol.408.
Calgon Carbon Corporation. (2004). FILTRASORB®400 granular activated carbon for
municipal specifications. W-2075-E-20.12.2010. CPM-PB1042B-0108. Calgon Carbon Corporation. Pittsburgh, USA.
Campbell, T. Y., Vecitis, C. D., Mader, B. T. and Hoffmann, M. R. (2009). Fluorinated
surfactant chain-length effects on sonochemical kinetics. J. Phys. Chem. Minnesota, USA: American Chemical Society.
Chularueangaksorn, P., Tanaka, S., Fujii, S. and Kunacheva, C. (2013). Adsorption of
perfluorooctanoic acid (PFOA) onto anion exchange resin, non-ion exchange resin, and granular-activated carbon by batch and column. Deslaination and water treatment. vol. 52, pp. 6542-6548. Taylor & Francis.
Chowdhury, Z. K., Summers, R. S., Westerhoff, G. P., Leto, B. J., Nowack, K. O. and
Corwin, C. J. (2012). Activated carbon: solutions for improving water quality. Denver, CO, USA: American Water Works Assoc.
Crittenden, J.C. (2005). Water treatment principles and design. 3rd Edition, pp. 1245-
1357. Hoboken, NJ, USA: John Wiley & Sons. de Dardel, F. and Arden, T. V. (2008). Ion exchangers. Ullmann's encyclopedia of
industrial chemistry. pp. 474-545. Weineim, Germany: Wiley-VCH. Deng, S., Shuai, D., Yu Q., Huang, J. and Yu, G. (2009). Selective sorption of
perfluorooctane sulfonate molecularly imprinted polymer adsorbents. Front. Environ. Sci. vol. 3(2), pp. 171-177. Beijing, China.
Deng, S., Yu, Q., Huang, J. and Yu, G. (2010). Removal of perfluorooctane sulfonate
from wastewater by anion exchange resins: Effects of resin properties and solution chemistry. Water research. vol 44.
Deng, S., Nie, Y., Du, Z., Huang, Q., Meng, P., Wang, B., Huang, J. and Yu, G. (2014).
Enhanced adsorption of perfluorooctane sulfonate and perfluorooctanoate by bamboo-derived granular activated carbon. Journal of hazardous materials.
D’Hollander, W., de Voogt, P., De Coen, W. and Bervoets, L. (2010). Perfluorinated
substances in human food and other sources of human exposure. Reviews of Environmental Contamination and Toxicology. pp. 179-215. Antwerp, Belgium: Springer Science+Business Media.

38
Du, Z., Deng, S., Bei, Y., Huang, Q., Wang, B., Huang, J. and Yu, G. (2014). Adsorption behaviour and mechanism of perfluorinated compounds on various adsorbents- A review.Journal of Hazardous Materials. vol 274, pp. 443-454.
European Food Safety Authority. Perfluoroalkylated substances in food: occurrence and dietary exposure. (2012). Scientific report of EFSA. EFSA Journal. vol. 10. Parma, Italy. [online]. Available at: http://www.efsa.europa.eu/en/search/doc/2743.pdf [Accessed on 14 October 2014].
European Food Safety Authority. Results of the monitoring of perfluoroalkylated substances in food in the period 2000-2009. (2011). Scientific report of EFSA. EFSA Journal. vol. 9. Parma, Italy. [online]. Available at: http://www.efsa.europa.eu/en/efsajournal/doc/2016.pdf [Accessed on 15 October 2014].
Glynn, A., Cantillana, T. and Bjermo, H. (2013). Riskvärdering av perfluorerade alkylsyror i livsmedel och dricksvatten. Rapport 11 – 2013. Livsmedelverket, National food agency Sweden.
Hansen, M., Børresen, M. H., Schlabach, M. and Cornelissen, G. (2010). Sorption of perfluorinated compounds from contaminated water to activated carbon. Soil Sediments. vol. 10. pp.179-185. Springer-Verlag.
Hawley, E. L., Pancras, T. and Burdick, J. (2012). Remediation technologies for perfluorinated compounds (PFCs), including perflurooctane (PFOS) and perfluorooctanoic Acid (PFOA). ARCADIS U.S.
Hedenberg, G. (2014). Miljögifter i vatten – faroanalys behövs. Svenskt Vatten #1 2014. [online]. Available at: http://www.svensktvatten.se/Documents/Kategorier/Aktuellt/Tidningen%20Svenskt%20Vatten/PFAS%20i%20dricksvatten,%20Svenskt%20Vatten%20nr%201%202014.pdf [Accessed on 13 October 2014].
Inamuddin, Luqman, M. (2012). Ion exchange technology II. Springer Science+Business Media B.V. ISBN 978-94-007-4025-9.
Joensen, N. U., Bossi, R., Leffers, H., Jensen, A. A.,Skakkebæk, N. E. and Jørgensen, N. (2009). Do perfluoroalkyl compounds impair human semen quality? Environmental Health Perspectives vol. 117.
Kemikalieinspektionen. (2013). Brandskum som möjlig förorenare av dricksvattentäkter. [online]. Available at:
39
http://www.kemi.se/Documents/Publikationer/Trycksaker/PM/PM5-13.pdf [Accessed on 20 October 2014].
Lau, C., Anitole, K., Hodes, C., Lai, D., Pfales-Hutchens A. and Seed J. (2007). Perfluorolkyl acids: A review of monitoring and toxicological findings. toxicological sciences. Oxford University.
Liu, Y. (2005). Some consideration on the Langmuir isotherm equation. Colloids and aurfaces A: Physicochem. Eng. Aspects 274 34-36. Elsevier Ltd.
Livsmedelsverket. (2014). För dricksvattenproducenter och kontrollmydnigheter Riskhantering av PFAA I dricksvatten. [online] Available at: http://www.slv.se/sv/grupp1/Dricksvatten/Dricksvattenkvalitet/Perfluorerade-alkylsyror/Riskhanteringsatgard-PFAA/ [Accessed on 14 October 2014].
Misak, N. Z. (1993). Langmuir isotherm and its application in ion-exchange reactions. Reactive Polymers, 21 53-64. Amsterdam: Eslevier Science Publishers B.V.
Ochoa Herrera, V. L. (2008). Removal of perfluorooctane sulfonate (PFOS) and related compounds from industrial effluents. Arizona. U.S.
Post, G. B., Cohn, P. D. and Cooper, K. R. (2012). Perfluorooctanoic acid (PFOA), and emerging drinking water contaminant: A critical review of recent literature. Environmental Research. vol. 116, pp. 93-117.
Purolite. (2010). Purolite® Ion Exchange Resins, A-600 Anion Exchange Resin Strong Base, TYPE I.
Rahman, M. F.,Peldszus, S. and Anderson, W., B. (2013). Behaviour and fate of perfluoroalkyl and polyfluoroalkyl substances (PFASs) in drinking water treatment: a review. Water research. vol 50, pp. 318-340.
Rayne, S. and Forest, K. (2009). Perfluoroalkyl sulfonic and carboxylic acids: A critical review of physicochemical properties, levels and patterns in waters and wastewaters, and treatment methods. Journal of Environmental Science and Health. part A. vol. 44, pp. 1145-1199.
Senevirathna, S. T. M. L. D., Tanaka, S., Fujii, S., Kunaceva, C., Harada, H., Ariyadasa, B. H. A. K. T. and Shivakoti, B. R. (2010). Adsorption of perfluorooctane (n-PFOS) onto non ion-exchange polymers and granular activated carbon: batch and column test. Desalination. vol. 260, pp. 29-33. Elsevier B.V.
Stahl, T., Mattern, D. and Brunn, H. (2011). Toxicology of perfluorinated compounds. Environmental Science Europe. Springer.
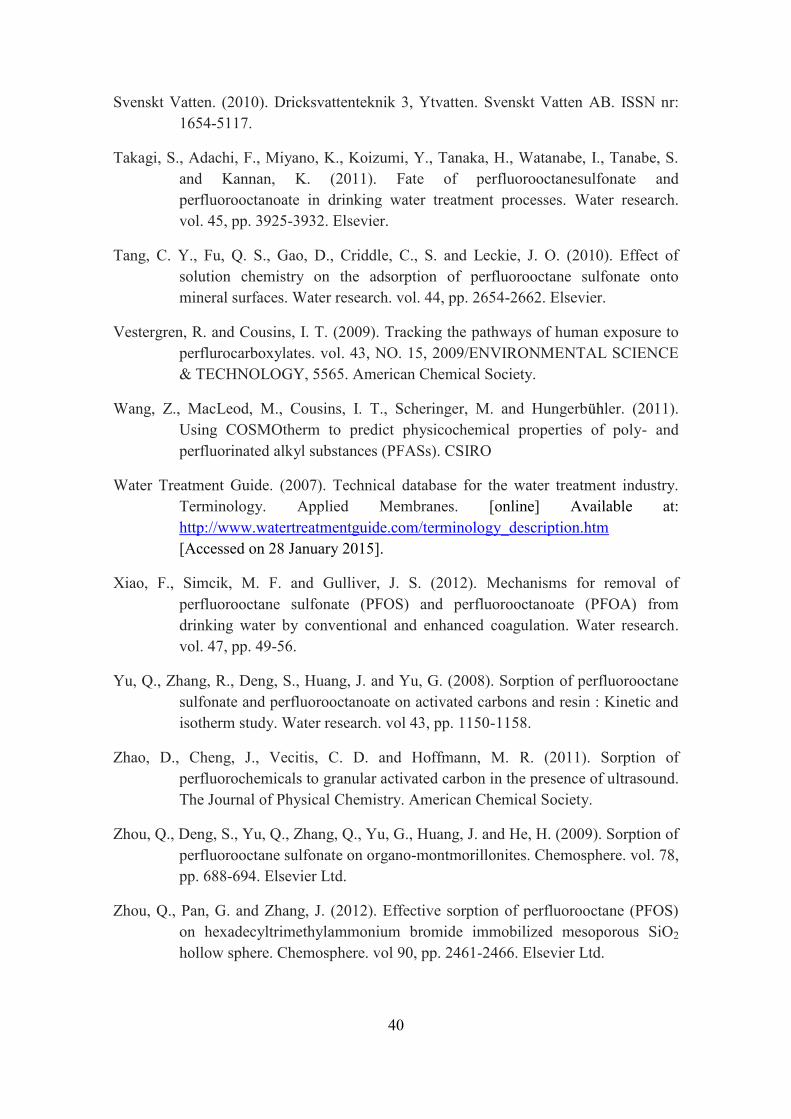
40
Svenskt Vatten. (2010). Dricksvattenteknik 3, Ytvatten. Svenskt Vatten AB. ISSN nr: 1654-5117.
Takagi, S., Adachi, F., Miyano, K., Koizumi, Y., Tanaka, H., Watanabe, I., Tanabe, S. and Kannan, K. (2011). Fate of perfluorooctanesulfonate and perfluorooctanoate in drinking water treatment processes. Water research. vol. 45, pp. 3925-3932. Elsevier.
Tang, C. Y., Fu, Q. S., Gao, D., Criddle, C., S. and Leckie, J. O. (2010). Effect of solution chemistry on the adsorption of perfluorooctane sulfonate onto mineral surfaces. Water research. vol. 44, pp. 2654-2662. Elsevier.
Vestergren, R. and Cousins, I. T. (2009). Tracking the pathways of human exposure to perflurocarboxylates. vol. 43, NO. 15, 2009/ENVIRONMENTAL SCIENCE & TECHNOLOGY, 5565. American Chemical Society.
Wang, Z., MacLeod, M., Cousins, I. T., Scheringer, M. and Hungerbühler. (2011). Using COSMOtherm to predict physicochemical properties of poly- and perfluorinated alkyl substances (PFASs). CSIRO
Water Treatment Guide. (2007). Technical database for the water treatment industry. Terminology. Applied Membranes. [online] Available at: http://www.watertreatmentguide.com/terminology_description.htm [Accessed on 28 January 2015].
Xiao, F., Simcik, M. F. and Gulliver, J. S. (2012). Mechanisms for removal of perfluorooctane sulfonate (PFOS) and perfluorooctanoate (PFOA) from drinking water by conventional and enhanced coagulation. Water research. vol. 47, pp. 49-56.
Yu, Q., Zhang, R., Deng, S., Huang, J. and Yu, G. (2008). Sorption of perfluorooctane sulfonate and perfluorooctanoate on activated carbons and resin : Kinetic and isotherm study. Water research. vol 43, pp. 1150-1158.
Zhao, D., Cheng, J., Vecitis, C. D. and Hoffmann, M. R. (2011). Sorption of perfluorochemicals to granular activated carbon in the presence of ultrasound. The Journal of Physical Chemistry. American Chemical Society.
Zhou, Q., Deng, S., Yu, Q., Zhang, Q., Yu, G., Huang, J. and He, H. (2009). Sorption of perfluorooctane sulfonate on organo-montmorillonites. Chemosphere. vol. 78, pp. 688-694. Elsevier Ltd.
Zhou, Q., Pan, G. and Zhang, J. (2012). Effective sorption of perfluorooctane (PFOS) on hexadecyltrimethylammonium bromide immobilized mesoporous SiO2 hollow sphere. Chemosphere. vol 90, pp. 2461-2466. Elsevier Ltd.

41
8. APPENDIX
8.1. APPENDIX A. RESULTS: LABORATORY BATCH EXPERIMENTS USING ANION EXCHANGE FOR PFASs CONCENTRATION OF 1000 ng L-1
A. B.
A. B.
Figure A1. The ratio between the individual PFCA concentration (C) at the respective time point and initial concentrations (C0) for the A) shorter perfluorocarbon chained and B) longer perfluorocarbon chained PFCAs from the water samples treated with AE (C0 = 1000 ng L-1). Error bars represent standard deviations of duplicate samples collected after 100 hours.
Figure A2. The ratio between the individual FOSA or PFSA concentrations (C) at the respective time point and initial concentrations (C0) for the A) FOSA and B) PFSAs from the water samples treated with AE (C0 = 1000 ng L-1). Error bars represent standard deviations of duplicated samples collected after 100 hours.
0.0
0.2
0.4
0.6
0.8
1.0
0 20 40 60 80 100
C/C
0
PFBA PFPeA PFHxA PFHpA PFOA
0.0
0.2
0.4
0.6
0.8
1.0
0 20 40 60 80 100 Time (h)
PFNA PFDA PFUnDA PFDoDA PFTeDA
0.0
0.2
0.4
0.6
0.8
1.0
0 20 40 60 80 100
C/C
0
FOSA
0.0
0.2
0.4
0.6
0.8
1.0
0 20 40 60 80 100 Time (h)
PFBS PFHxS PFOS

42
8.2. APPENDIX B. RESULTS: LABORATORY BATCH EXPERIMENTS USING ANION EXCHANGE FOR PFASs CONCENTRATION OF 5000 ng L-1
A. B.
Figure B1. The ratio between the individual PFCA concentration (C) at the respective time point and initial concentrations (C0) for the A) shorter perfluorocarbon chained and B) longer perfluorocarbon chained PFCAs from the water samples treated with AE (C0 = 5000 ng L-1). Error bars represent standard deviations of duplicate samples collected after 100 hours.
Figure A3. The ratio between the individual PFAS concentrations (C) at respective time point and initial concentrations (C0) for the PFASs treated with 2 g L-1 AE resin (C0 = 1000 ng L-1) after 100 hours treatment.
0.0
0.2
0.4
0.6
0.8
1.0
0 20 40 60 80 100
C/C
0
PFBA PFPeA PFHxA PFHpA PFOA
0.0
0.2
0.4
0.6
0.8
1.0
0 20 40 60 80 100 Time (h)
PFNA PFDA PFUnDA PFDoDA PFTeDA
0.0
0.2
0.4
0.6
0.8
1.0
0 2 4 6 8 10 12 14
C/C
0
Perfluorocarbon chain length
PFCAs FOSA PFSAs

43
A. B.
Figure B2. The ratio between the individual FOSA or PFSA concentrations (C) at the respective time point and initial concentrations (C0) for the A) FOSA and B) PFSAs from the water samples treated with AE (C0 = 5000 ng L-1). Error bars represent standard deviations of duplicated samples collected after 100 hours.
Figure B3. The ratio between the individual PFAS concentrations (C) at respective time point and initial concentrations (C0) for the PFASs treated with 2 g L-1 AE resin (C0 = 1000 ng L-1) after 100 hours treatment.
0.0
0.2
0.4
0.6
0.8
1.0
0 20 40 60 80 100
C/C
0
FOSA
0.0
0.2
0.4
0.6
0.8
1.0
0 20 40 60 80 100 Time (h)
PFBS PFHxS PFOS
0.0
0.2
0.4
0.6
0.8
1.0
0 2 4 6 8 10 12 14
C/C
0
Perfluorocarbon chain length
PFCAs FOSA PFSAs

44
8.3. APPENDIX C. RESULTS: LABORATORY BATCH EXPERIMENTS USING GAC FOR PFASs CONCENTRATION OF 1000 ng L-1
A. B.
A. B.
Figure C1. The ratio between the individual PFCA concentration (C) at the respective time point and initial concentrations (C0) for the A) shorter perfluorocarbon chained and B) longer perfluorocarbon chained PFCAs from the water samples treated with GAC (C0 = 1000 ng L-1). Error bars represent standard deviations of duplicate samples collected after 100 hours.
Figure C2. The ratio between the individual FOSA or PFSA concentrations (C) at the respective time point and initial concentrations (C0) for the A) FOSA and B) PFSAs from the water samples treated with GAC (C0 = 1000 ng L-1). Error bars represent standard deviations of duplicated samples collected after 100 hours.
0.0
0.2
0.4
0.6
0.8
1.0
0 20 40 60 80 100
C/C
0
FOSA
0.0
0.2
0.4
0.6
0.8
1.0
0 20 40 60 80 100 Time (h)
PFBS PFHxS PFOS
0.0
0.2
0.4
0.6
0.8
1.0
0 20 40 60 80 100 Time (h)
PFNA PFDA PFUnDA PFDoDA PFTeDA
0.0
0.2
0.4
0.6
0.8
1.0
0 20 40 60 80 100
C/C
0
PFBA PFPeA PFHxA PFHpA PFOA

45
8.4. APPENDIX D. RESULTS: LABORATORY BATCH EXPERIMENTS USING GAC FOR PFASs CONCENTRATION OF 5000 ng L-1
A. B.
Figure C3. The ratio between the individual PFAS concentrations (C) at respective time point and initial concentrations (C0) for the PFASs treated with 2 g L-1 GAC (C0 = 1000 ng L-1) after 100 hours treatment.
Figure D1. The ratio between the individual PFCA concentration (C) at the respective time point and initial concentrations (C0) for the A) shorter perfluorocarbon chained and B) longer perfluorocarbon chained PFCAs from the water samples treated with GAC (C0 = 5000 ng L-1). Error bars represent standard deviations of duplicate samples collected after 100 hours.
0.0
0.2
0.4
0.6
0.8
1.0
0 2 4 6 8 10 12 14
C/C
0
Perfluorocarbon chain length
PFCAs FOSA PFSAs
0.0
0.2
0.4
0.6
0.8
1.0
0 20 40 60 80 100 Time (h)
PFNA PFDA PFUnDA PFDoDA PFTeDA
0.0
0.2
0.4
0.6
0.8
1.0
0 20 40 60 80 100
C/C
0
PFBA PFPeA PFHxA PFHpA PFOA
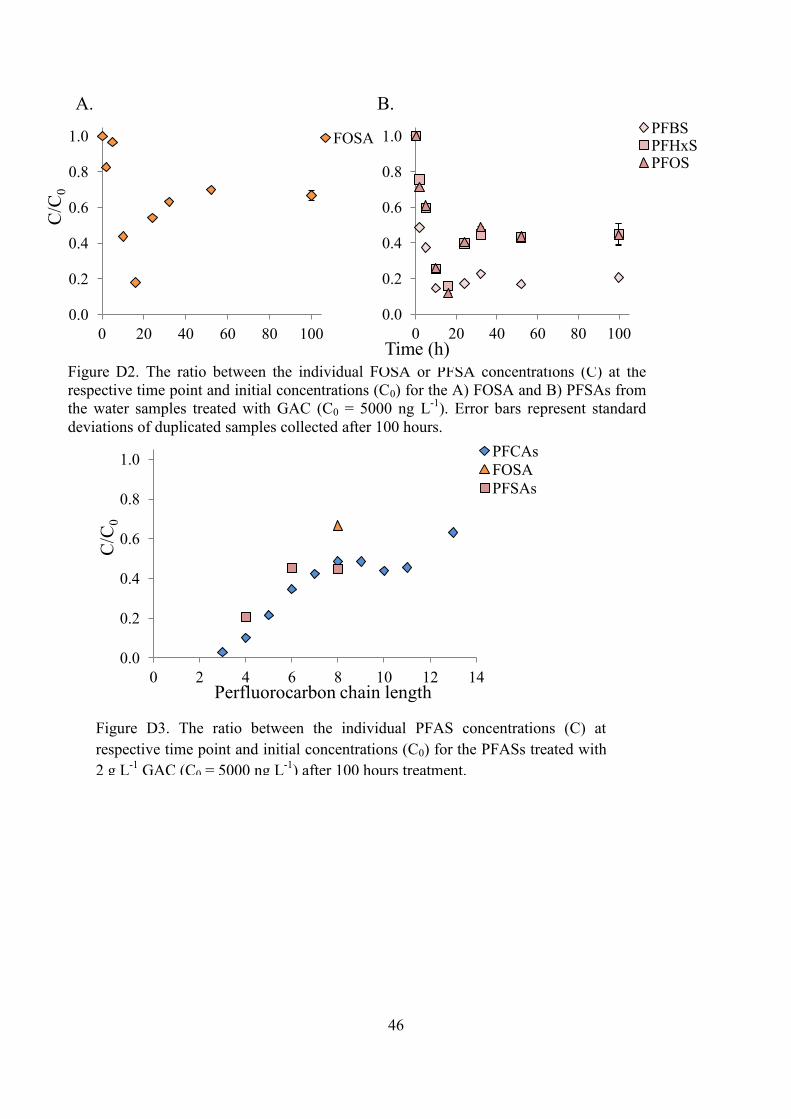
46
A. B.
Figure D2. The ratio between the individual FOSA or PFSA concentrations (C) at the respective time point and initial concentrations (C0) for the A) FOSA and B) PFSAs from the water samples treated with GAC (C0 = 5000 ng L-1). Error bars represent standard deviations of duplicated samples collected after 100 hours.
Figure D3. The ratio between the individual PFAS concentrations (C) at respective time point and initial concentrations (C0) for the PFASs treated with 2 g L-1 GAC (C0 = 5000 ng L-1) after 100 hours treatment.
0.0
0.2
0.4
0.6
0.8
1.0
0 2 4 6 8 10 12 14
C/C
0
Perfluorocarbon chain length
PFCAs FOSA PFSAs
0.0
0.2
0.4
0.6
0.8
1.0
0 20 40 60 80 100
C/C
0
FOSA
0.0
0.2
0.4
0.6
0.8
1.0
0 20 40 60 80 100 Time (h)
PFBS PFHxS PFOS

47
8.5. APPENDIX E. METHODOLOGY: LABORATORY BATCH EXPERIMENTS USING GRANULAR ACTIVATED CARBON AND ANION EXCHANGE
8.6. APPENDIX F. THE COLUMNEXPERIMENT AT BÄCKLÖSA DWTP
Figure E. The setup of the batch experiments. The first beaker contains the positive control without any treatment techniques. The three thereafter are treated with AE and the last three with GAC
Figure F. The column experiments performed at Bäcklösa DWTP.
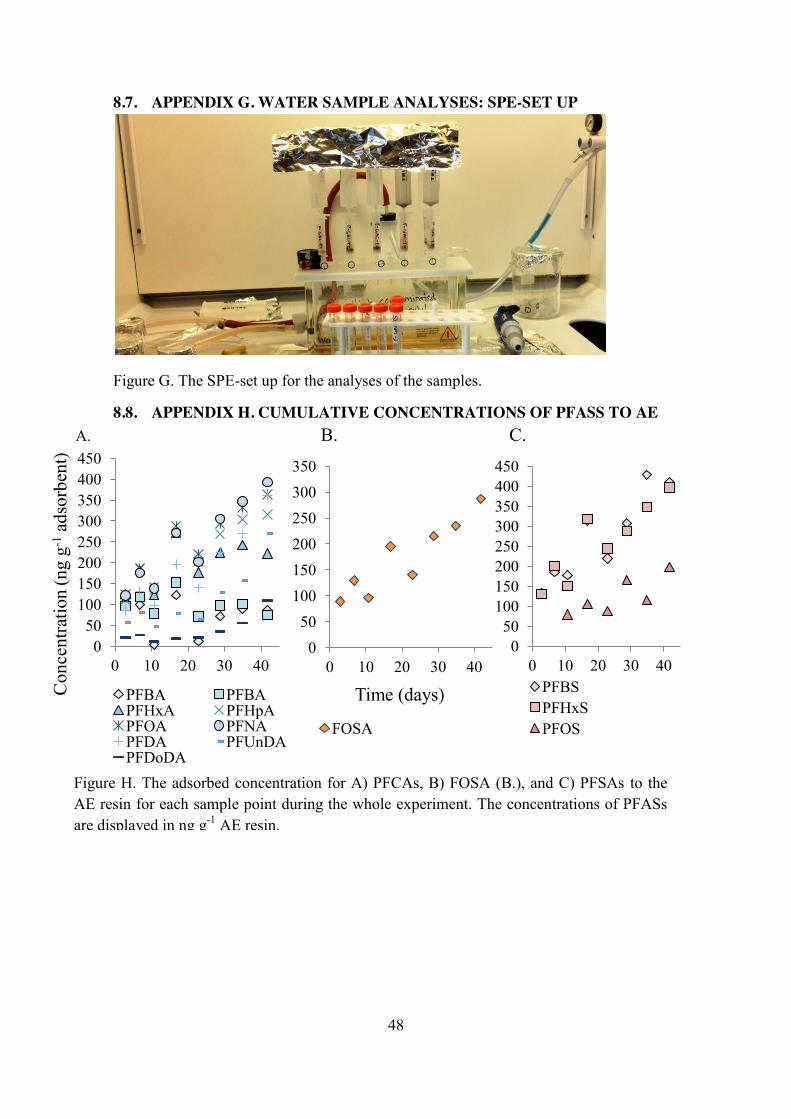
48
8.7. APPENDIX G. WATER SAMPLE ANALYSES: SPE-SET UP
Figure G. The SPE-set up for the analyses of the samples.
8.8. APPENDIX H. CUMULATIVE CONCENTRATIONS OF PFASS TO AE A. B. C.
Figure H. The adsorbed concentration for A) PFCAs, B) FOSA (B.), and C) PFSAs to the AE resin for each sample point during the whole experiment. The concentrations of PFASs are displayed in ng g-1 AE resin.
0 50
100 150 200 250 300 350 400 450
0 10 20 30 40
Con
cent
ratio
n (n
g g-1
ads
orbe
nt)
PFBA PFBA PFHxA PFHpA PFOA PFNA PFDA PFUnDA PFDoDA
0 50
100 150 200 250 300 350
0 10 20 30 40
Time (days)
FOSA
0 50
100 150 200 250 300 350 400 450
0 10 20 30 40 PFBS PFHxS PFOS

49
8.9. APPENDIX I. CUMULATIVE CONCENTRATIONS OF PFASS TO GAC A. B. C.
0 50
100 150 200 250 300 350 400 450
0 10 20 30 40
Con
cent
ratio
n (n
g g-1
ads
orbe
nt)
PFBA PFPeA PFHxA PFHpA PFOA PFNA PFDA PFUnDA PFDoDA
0
50
100
150
200
250
300
0 10 20 30 40 Time (days)
FOSA
0 50
100 150 200 250 300 350 400
0 10 20 30 40
PFBS PFHxS PFOS
Figure I. Total adsorbed concentration of A) PFCAs, B) FOSA, and C) PFSAs to the GAC for each sample point during the whole experiment. The concentrations of PFASs are displayed in ng g-1 GAC.
50
8.10. APPENDIX J. VARIATIONS IN CONCENTRATION LEVEL IN RAW WATER
Table J. The concentration for the different PFASs in the raw water in the reservoir before the columns. The concentrations are the average concentration over time and their std in percent (n =8).
Substances Average concentration (ng L-1)
Std (%)
PFCAs
PFBA 94.4 14.3
PFPeA 73.4 12.8
PFHxA 97.1 16.5
PFHpA 93.0 18.2
PFOA 95.7 17.0
PFNA 92.8 20.9
PFDA 70.6 29.2
PFUnDA 42.2 45.2
PFDoDA 16.6 54.1
PFSAs
PFBS 104 21.1
PFHxS 97.6 14.9
PFOS 60.6 30.2
FOSAs
FOSA 66.1 20.4