evaluation of the radiation protection at the new ... · the evaluation of the radiation protection...
TRANSCRIPT
Sara Andersson
Spring 2010
Master thesis, 30 hp
Engineering physics – Medical physicist, 300 hp
Evaluation of the radiation protection at the
new radiotherapy treatment department
at the University Hospital of Umeå
Client: Radiation Physics Department, University Hospital of Umeå (NUS)
Mentors: Magnus Karlsson, Medical Physicist PhD; Jörgen Olofsson, Medical Physicist PhD
Sara Andersson

2
Abstract At the University Hospital of Umeå, NUS, a new radiation treatment department is being
built. The purpose of this master thesis is to evaluate the actual radiation protection outside
three out of five treatment rooms in the building, including two Varian and one Siemens
accelerator, and to verify that the radiation limits for the staff and the general public, stated by
the Swedish Radiation Safety Authority, are obeyed.
The evaluation of the radiation protection shielding is made through measurements. The
nominal photon beam energies 6 and 15 MV (dose rates up to 500 MU/min) can be used,
which means that both photons and neutrons will contribute to the effective dose. For the
photon measurements, two different GM counters have been used and for the neutron
measurements a Neutron detector with a polyethylene moderator and a 3He recoil proton
counter tube was applied. The thesis also includes a literature study of the photon and neutron
energy spectra outside the treatment rooms in order to check that the measurement
equipments are suitable to use.
The measured doses of the radiation shielding are below the radiation limits per week and
year but the measurements indicate too high values per hour, i.e. momentary dose rate, at the
height of isocenter of the primary walls and at the gap under the door for all three
accelerators. The rooms with the Varian accelerators also show too high values per hour at the
secondary wall where the door is attached. However, the limiting value per hour is only a
recommendation and no extra reinforcement in therefore required. Nevertheless, one should
avoid placing a workplace, for example a writing desk, close to the secondary and primary
walls.

3
Kartläggning av strålskyddet på den nya
strålbehandlingsavdelningen vid
Norrlands Universitetssjukhus
Sara Andersson
Sammanfattning
En ny strålbehandlingsavdelning har byggts vid Norrlands Universitetssjukhus, NUS. Syftet
med detta arbete är att utvärdera det faktiska strålskyddet vid tre av byggnadens
behandlingsrum som innehåller två Varian- och en Siemensaccelerator. Detta för att verifiera
att gränsvärdena för personalen på strålbehandlingsavdelningen och allmänheten, satta av
Strålsäkerhetsmyndigheten (SSM), är följda.
Utvärderingen av strålskyddet är utförd genom mätningar. Fotonenergierna 6 och 15 MV
(dosrater upp till 500 MU/min) kan användas, vilket betyder att både fotoner och neutroner
kommer att bidra till den effektiva dosen. Vid fotondosmätningarna användes två GM-rör och
vid neutronmätningarna användes en neutrondetektor som består av en polyetylenmoderator
och en 3He proportionalitetsräknare. Rapporten innehåller även en litteraturstudie av
energispektrat för fotoner och neutroner utanför bunkrarna för att verifiera att
mätinstrumenten är lämpliga att använda.
De uppmätta värdena ligger under gränsvärdena per vecka och år. Men mätningarna visar
på för höga värden per timme, dvs. momentan dosrat, i jämnhöjd med isocenter vid de
primära väggarna och vid dörrspringan under dörren för alla tre acceleratorer. Rummen med
Varianacceleratorerna har också för höga värden per timme vid de sekundära väggarna där
dörren är monterad. Gränsvärdet per timme är dock endast en rekommendation och ingen
förstärkning av strålskyddet behövs därför. Däremot ska man undvika att bygga en
arbetsplats, tillexempel ett skrivbord, nära de sekundära och primära väggarna.

4
Content
1. Introduction ............................................................................................................................ 5
2. Background ............................................................................................................................ 6
2.1. The linear accelerator ...................................................................................................... 6
2.2. Types of radiation in the treatment room ........................................................................ 7
2.3. Shielding materials .......................................................................................................... 9
2.4. Shielding design calculations ........................................................................................ 10
2.5. The final design ............................................................................................................. 14
3. Survey equipment ................................................................................................................. 17
3.1. Photon dose measuring instruments .............................................................................. 17
3.2. The photon energy spectrum ......................................................................................... 18
3.3. Neutron dose measuring instrument .............................................................................. 22
3.4. The neutron energy spectrum ........................................................................................ 23
4. Measurements ....................................................................................................................... 25
4.1. Measuring points ........................................................................................................... 26
4.2. The procedures of measurement .................................................................................... 26
4.3. Calculations ................................................................................................................... 28
5. Results .................................................................................................................................. 30
6. Discussion ............................................................................................................................ 36
7. Conclusion ............................................................................................................................ 39
8. References ............................................................................................................................ 40
9. Appendix .............................................................................................................................. 41
9.1. Siemens, Lin1 (photons) ................................................................................................ 41
9.2. Siemens, Lin1 (neutrons) ............................................................................................... 50
9.3. Varian, Lin2 (photons) .................................................................................................. 53
9.4. Varian, Lin2 (neutrons) ................................................................................................. 58
9.5. Varian, Lin3 (photons) .................................................................................................. 61
9.6. Varian, Lin3 (neutrons) ................................................................................................. 70

5
1. Introduction
At the University Hospital of Umeå, NUS, a new radiation treatment department is being
built. It consists of a complete radiotherapy clinic located in the ground floor with five
treatment rooms with radiation treatment accelerators. The radiation protection shielding is
designed by Magnus Karlsson and Jörgen Olofsson, both working as medical physicists at
NUS. The calculations are reported in "Strålskyddsberäkningar för strålbehandlingsbunkrar,
byggnad 27" [5].
The purpose of this master thesis is to evaluate the actual radiation protection at three
treatment rooms of the building, which includes two Varian- and one Siemens accelerator and
to verify that the radiation limits for staff and general public are followed. The task of this
master thesis is therefore an assignment that has to be done before the building can be used.
The first part of the thesis is to understand the calculations and design of the radiation
protection in order to identify reliable measuring points to get a proper evaluation of the
radiation protection. An understanding of radiation interactions in the gantry of the linear
accelerator and in the surrounding material is also required in order to choose measuring
points and suitable measuring instruments.
The evaluation of the radiation protection will be made by measurements. Walls, ceiling,
door and other openings, machine operating station and the surrounding environment need to
be investigated. Both photons and neutrons are present and will contribute to the effective
dose. For the photon measurements, two different GM counters are used (Rados RDS-110 and
DGM-1500 Turva) and for the neutron measurements a Neutron Probe LB 6411 (Berthold
technologies) with a polyethylene moderator and a 3He recoil proton counter tube is applied.
In order to determine if the measuring instruments yield reliable results, the photon and
neutron energy spectra after the radiation protection barrier need to be approximated. The
spectrum shows how the photons and neutrons are distributed in energy and will be compared
to the energy response curves of the instruments. These spectra are difficult to estimate
through measurements and are therefore approximated with the help of literature.
The unit used in radiation protection is the equivalent dose and the effective dose. The
equivalent dose is a measure of the radiation dose to tissue or organs and considers different
relative biological effects of different types of ionizing radiation, such as photons, neutrons or
electrons. The effective dose is the sum of all the equivalent doses to tissue and organs and
consider their different sensibilities for radiation. The limiting values stated by SSM are
written in effective dose. When only dose is written in the report it refers to the effective dose.
All the measured values of the radiation protection shielding are presented in tables in the
appendix section and the highest and most critical measured doses are given in the result
section.

6
2. Background
2.1. The linear accelerator
The linear accelerator (linac) is used for external beam radiation treatments for patients with
cancer and can treat all parts and organs of the body. It delivers a laterally nearly dose of
high-energy x-rays to the region where the tumor is located and can destroy cancer cells,
while sparing the surrounding normal tissue. A basic image of the different parts of the linear
accelerator can be seen in figure 1.
A linac is a particle accelerator where electrons are accelerated with the help of strong
electric fields (microwaves). The electron beam is controlled by magnets and collides with a
target of heavy metal. In the target the electrons get deflected and decelerated by the atomic
nuclei and lose energy which is converted into electromagnetic radiation called
bremsstrahlung. The resulting beam of high energy x-rays is shaped as the projection of the
tumor by collimator jaws and/or a multileaf collimator (MLC).
The beam comes out from the gantry, which can be rotated around the patient. The
patient lies on a moveable treatment couch and alignment lasers are used to make sure that the
patient is in the right position. Radiation can be delivered in any direction by rotating the
gantry and moving the couch.
Inside the gantry the photon beam also passes through a transmission dose monitor
(ionization chamber) before the collimators. This device monitors and controls the delivered
dose, dose rate and beam symmetry. In order to quantify the delivered dose, the concept of
monitor units (MU) is applied, which is a measure of the photon fluence exiting the linear
accelerator. At NUS, the linacs are calibrated such that 100 or 130 MU, depending on beam
energy, corresponds to an absorbed dose of 1 Gray (Gy) at 10 cm depth for a field size of
10x10 cm and a source-to-surface distance (SSD) of 90 cm.
Figure 1. A basic picture of a medical linear accelerator used in radiotherapy.
7
2.2. Types of radiation in the treatment room
Photons, neutrons and electrons of different energies are produced in the treatment room. The
electrons can be ignored due to their short range and the shielding needs only to consider
photons and neutrons. The created radiation inside the linear accelerator and in the room is
described below.
Photon interactions
The primary radiation which has to be considered in the shielding design is the photons used
in the treatments. The photons are produced when accelerated electrons hit the target in the
medical linear accelerator. The fraction of the electron energy converted into bremsstrahlung
increases with increasing electron energy and higher atomic number of the target material.
The photons interact with the surrounding material in the accelerator and in the room
through the photoelectric effect, Compton scattering and pair production, which generate
electrons and photons with degraded energies. However, the electrons have a very short range
and are not of interest in the shielding design. Photoelectric effect is dominating in the low
region of the photon energy, pair production in the higher region and Compton scattering in
the region between the other two.
In photoelectric effect a photon undergoes an interaction with an absorbing atom and the
photon completely disappears. An energetic photoelectron is ejected by the atom and an
ionized atom is created with a vacancy in one of its bound shells. The vacancy is filled
through capture of an outer shell electron and one or more characteristic x-rays may be
generated.
In Compton scattering the incoming photon transfers a fraction of its energy to an
electron in the atom. The photon gets deflected and the electron becomes a recoil electron. All
the angels of scattering are possible and the energy transferred to the electron can vary from
zero to a large fraction of the photon energy.
The pair production is only possible when the photon energy exceeds twice the rest-mass
energy of an electron (1.022 MeV) and the probability of interaction remains very low until
the energy reaches several MeV. The high-energy photon interacts in the coulomb field of the
nucleus and disappears and an electron and a positron are created instead. All the excess
energy above 1.022 MeV carried by the photon goes into kinetic energy, which is shared by
the electron-positron pair. Just before stopping, the positron undergoes annihilation with an
electron and two 0.511 MeV photons are created [7].
When the medical electron accelerator is operated at energies higher than 10 MeV the created
photon beam will contain neutrons. These neutrons are called photoneutrons and are produced
when photons interact with the atomic nuclei of the material, both in the accelerator head and
in the room shielding. The photon transfer energy to the nucleus and excites it to a higher
energy level. The nucleus then ejects a neutron to compensate for the extra added energy,
becomes radioactive and decays through β+ and γ rays. The reaction can be written as
𝑋𝑍𝐴 (𝛾, 𝑛) 𝑋𝑍
𝐴−1 (1)
The interaction can also occur with electrons instead of photons but the neutron yield is
several orders of magnitude smaller and can therefore be ignored. Neutrons are also produced

8
through the reactions 𝛾, 2𝑛 and 𝛾,𝑝𝑛 but the yield is lower than for the previous one [9
10].
The yield of photoneutrons depends on the atomic number of the material and the photon
energy. Higher atomic number gives higher probability for photon interactions and therefore
higher number of neutrons. The cross section, or probability of an interaction to occur, of
photoneutron interactions is a function of the photon energy and can be seen in figure 2 for
medium and high atomic number materials.
Figure 2. The photoneutron cross section at different photon energies for medium and high atomic number
materials.
The cross section of reaction 1 has a threshold value of the photon energy, Et. Under this
value the energy is lower than the neutron binding energy, which is about 8 MeV, and the
photons will not generate any neutrons. Neutrons are therefore only a shielding problem when
the accelerator is operated above 10 MeV, which is the case at NUS. The cross section has a
maximum value, Em, at 3-7 MeV above the threshold energy and then decreases with higher
photon energy.
Two kinds of photoneutrons are produced, the evaporation and the direct neutrons. The
evaporation neutrons have a Maxwellian energy distribution and represent the largest part.
The direct neutrons, which are produced by a direct interaction between the photon and the
neutron in the nucleus, have a higher energy than the evaporation. The neutron spectrum that
is present in the treatment room will have a degraded energy because of neutron interactions
in the accelerator structure and scattering from the surfaces of the room [9].
Neutron interactions
The produced neutrons will also undergo interactions with the surrounding material.
Neutrons, like photons, do not carry any charge and are therefore not influenced by the
Coulomb force from the atoms. A neutron can travel many centimeters through matter
without any interaction with the material and subsequent energy loss.
Neutrons can interact with an absorbing atom through neutron-induced nuclear reactions
like neutron capture and through elastic and inelastic scattering.
In neutron capture reactions, neutrons collide with an atomic nucleus and form a heavier
nucleus. Neutrons can enter a nucleus more easily than a charged particle because they have
no charge. The nucleus than emits a photon, which is called a neutron capture gamma ray, to
compensate for the added energy. The capture reaction (n,γ) has the highest probability in
mainly all materials and is very important in the attenuation and shielding of neutrons. Most
of the neutron capture gamma rays are produced in the shielding of the room.
Cross
Section
Et Em
Photon Energy
9
In an elastic scattering the neutron transfers some of its energy to the nucleus of the target
which becomes a recoil nucleus. The neutron changes its direction and gets a degraded
energy. The total kinetic energy of the particles is the same before and after the interaction.
An inelastic scattering with the atomic nucleus can only take place when the neutrons
have sufficiently high energy. In the collision the neutron loses a greater fraction of its energy
to the nucleus than in an elastic collision and the nucleus gets excited to a higher energy level
and emits a gamma ray to de-excite [9 10 7].
The cross section for neutron interactions does not have a simple atomic number dependence,
which is the case for photons, and the relative probabilities for the different neutron
interactions change significantly with neutron energy.
Slow neutrons (0.5 eV and lower) interact through elastic scattering with the absorbing
nuclei and neutron-induced nuclear reactions, like neutron capture. In an elastic scattering the
neutron can only transfer a small amount of energy to the nucleus because its kinetic energy is
very small. This reaction has a high probability and often brings the slow neutrons into a
thermal equilibrium with the absorber medium. Therefore, most of the neutrons in the low
energy range will be thermal neutrons with an energy of 0.025 eV. Inelastic scattering is not
possible because the energy of the neutron is too low.
For fast neutrons (0.5 eV and higher), the probability of most of the neutron-induced
reactions decreases drastically with increasing neutron energy. But as the neutrons have
higher energy they can transfer a larger amount of energy in one collision and elastic and
inelastic scattering becomes more important [9].
2.3. Shielding materials
The shielding materials of the walls, floor and ceiling need to consider both photons and
neutrons. Photons get attenuated by the photoelectric effect, Compton scattering and pair
production. The material requires high mass and high atomic number for efficient attenuation,
otherwise the shielding needs to be very thick in order to generate enough protection.
Neutrons, especially fast neutrons, lose energy through scattering with the nuclei of the
material and get moderated to a lower speed. When the neutrons have lower energy they
undergo capture reactions and gamma rays are emitted. The most effective moderator for
neutrons is hydrogen. A neutron can lose parts or all of its energy in one collision with a
hydrogen nucleus as it is a very light nucleus of nearly the same mass as the neutron. For
heavier nuclei the neutron can only lose parts of its energy.
In addition to hydrogen, both boron and cadmium have a large cross section for slow
neutron capture and a few millimeters of the materials will absorb almost all the neutrons.
Boron can be integrated into polyethylene, which has a high hydrogen content, to form an
efficient neutron shield for both fast and slow neutrons. The polyethylene moderates the fast
and intermediate energy neutrons through scattering to slow neutrons, which react with the
boron and produce photons (neutron capture gamma rays). Polyethylene with 5% boron,
surrounded by lead (in order to attenuate photons), is therefore usually used in neutron-
shielded doors for treatment rooms [9 10].
The materials typically used for shielding purposes are ordinary concrete, heavy concrete,
lead, steel, polyethylene, paraffin, earth and wood.
Concrete has many advantages and is commonly used. It gives good x-ray and neutron
shielding (concrete contains hydrogen), good structural strength and is relatively inexpensive.
The required thickness to attenuate the incident photons to one tenth, the tenth-value layer

10
(TVL), in concrete is much larger than for neutrons and therefore an adequate shielding for
photons is more than enough for photoneutrons.
Lead has a very high density and is a very good X- and gamma ray shielding material, but
it will need support by a second material to handle the neutrons, which it is nearly transparent
to, albeit that the high-energy neutrons get attenuated by inelastic scattering. Lead is also
toxic and more expensive than concrete.
Steel is also expensive compared to concrete, but is not toxic. It is more efficient than
concrete as an X- and gamma ray shielding material, but less efficient than lead. It is also
nearly transparent to neutrons, but is a good structure material.
Polyethylene is probably the best neutron shielding material, but it is relatively
expensive. It is available both with and without boron to increase the thermal neutron capture.
Paraffin has the same percentage of hydrogen (14.3%) as polyethylene and is less expensive,
but is has lower density and is flammable.
Earth is commonly used as a shielding material by simply placing the accelerator room
underground. Wood is inexpensive and easy to fabricate but has low density [9 10].
At NUS, heavy concrete is used as shielding material in all walls and in the ceiling. The
concrete contains iron oxide Magnetite and has a density of 3.8 g·cm-3
. It is about 60%
heavier than ordinary concrete, which has a density of approximately 2.3 g·cm-3
.
2.4. Shielding design calculations
There are two types of barriers surrounding a treatment room; primary and secondary. The
primary barriers are located directly in the direction of the x-ray beam of the accelerator and
need therefore better shielding. The secondary barrier is only exposed to scattered radiation,
e.g. from the patient lying in the x-ray field or from the surfaces of the treatment room and
also to radiation leaking through the accelerator head (head leakage).
The thickness of the primary barrier is calculated regarding to primary radiation and is
therefore more than enough for the scattered radiation which has a much lower energy. The
secondary barrier thickness is calculated concerning the secondary radiation [9 10].
The calculations of the thicknesses of the barriers for medical radiation therapy facilities are
based on figure 3. The location L must be protected from the radiation source S at distance d
by the thickness of barrier B.
Figure 3. The basic shielding design where the thickness of the barrier B must protect the location L from the
radiation source S at distance d.
S L
d B
11
The level of protection at point L is given by the radiation limits stated by the Swedish
Radiation Safety Authority. The limiting values depend on whether the person being protected
is a member of the staff of the treatment department or the public.
To determine the required barrier thicknesses for both the primary and secondary shielding,
the barrier transmission factors, B, for different types of radiation need to be calculated. [9
10]. Primary barrier
The transmission factor of the primary barrier is stated as [9 10]
𝐵𝑝𝑟𝑖 =𝑃 𝑑𝑝𝑟𝑖
2
𝑊𝑈𝑇, (2)
where P is the radiation limit beyond the barrier expressed in effective dose (usually given in
Sv/week) and 𝑑𝑝𝑟𝑖 is the distance from the x-ray target to the point being protected in meters.
All the distances are referenced to a distance of 1 m from the source. 𝑃𝑑𝑝𝑟𝑖2 is therefore,
according to the inverse square law, the dose limit recalculated to the reference distance of 1
m.
W is the workload or photon absorbed dose delivered at 1 m from the x-ray target per
week (Gy/week), U is the use factor or the fraction of the workload that the primary beam is
directed at the barrier in question and T is the occupancy factor for the protected location
which means the fraction of the workweek that a person is present beyond the barrier.
The thickness of the barrier can then be determined using tenth-value-layers (TVL), which are
based on the photon beam energy of the accelerator and type of shielding material. For 20
MeV the TVL is 0.50 m for concrete (2.2 g·cm-3
), 0.25 m for heavy concrete (3.2 g·cm-3
),
0.10 m for iron (7.8 g·cm-3
) and 0.05 m for lead (11.4 g·cm-3
). One tenth-value-layer will
attenuate the dose to one-tenth. The required number of layers, n, or TVL:s to get the
calculated transmission factor is [9 10]
𝐵𝑝𝑟𝑖 =1
10𝑛⇒ 𝑛 = −log Bpri (3)
and the thickness of the barrier is given by
𝑡𝑏𝑎𝑟𝑟𝑖𝑒𝑟 = 𝑇𝑉𝐿1 + 𝑛 − 1 𝑇𝑉𝐿𝑒 , (4)
where TVL1 is the first tenth-value-layer and TVLe is the equilibrium tenth-value-layer and
they are used to account for the spectral changes in the radiation as it passes through the
barrier. The thickness should be calculated for the perpendicularly incident beam because this
is the shortest way through the shielding.
When equation 2 is solved for P and the calculated barrier transmission factor, B, is used, it
determines the effective dose per week behind the barriers for the primary radiation.
12
Secondary barrier
The secondary barriers need to attenuate leakage radiation from the accelerator, scattered
radiation from the patient, scattered radiation from the surfaces of the room (usually ignored
because of the low energy of the photons). Since the leakage radiation and the scattered
radiation have very different energies, two separate calculations are needed.
The barrier transmission factor for radiation scatter in the patient is [9 10]
𝐵𝑝𝑠 =𝑃
𝑎𝑊𝑇𝑑𝑠𝑐𝑎
2 𝑑𝑠𝑒𝑐2 400
𝐹 , (5)
where dsca is the distance in meter from the x-ray target to the patient (normally 1 m), dsec is
the distance in meter from the scattering object to the point being protected, a is the scatter
fraction or fraction of the primary beam absorbed dose that scatters from the patient at a
particular angle, F is the field area in cm2 at mid-depth of the patient at 1 m and the symbols
P, W and T are the same as in equation 2. The value of 400 assumes that the scatter fractions
are normalized to those measured for a 20x20 cm filed size. The use factor U for patient-
scattered radiation is set to 1 and all the distances are referenced to a distance of 1 m from the
source as in equation 2.
The barrier transmission factor of leakage radiation is given by [9 10]
𝐵𝐿 =𝑃𝑑𝐿
2
10−3𝑊𝑇 (6)
In equation 6 the factor 10-3
arises from the requirement that the leakage radiation from the
accelerator head is less than 0.1% of the useful beam. The use factor U is set to 1 as for
patient scatter and dL is the distance from the isocenter, referenced to a distance of 1 m from
the source, if it can be assumed that the used accelerator gantry angles are, on average,
symmetric.
Equation 3 and 4 are then used to determine the required barrier thickness of the shielding
material for the secondary barrier for patient scatter and leakage radiation.
When equation 5 and 6 are solved for P and the calculated transmission factors are used they
determine the effective dose per week behind the barriers for the scattered and leakage
radiations respectively.

13
Neutrons and neutron capture gamma rays
If the primary and secondary barriers are made of concrete (either ordinary or heavy) and the
previous calculations are followed, the material will also absorb all photoneutrons and neutron
capture gamma rays and no further protection is required. Concrete consists of a relatively
high hydrogen content and has therefore a high neutron absorption cross section. If other
materials are used, for example lead or steal, further protection is needed.
Nevertheless, one should verify that the calculated thickness values for the shielding are
sufficient even for neutrons (photoneutrons) and neutron capture gamma rays. The dose
equivalent for neutrons can be calculated using equation 7 [9 10].
𝐻 = 𝑊𝐻0 𝑑𝑜
𝑑1
2
10−𝑡/𝑇𝑉𝐿𝑁 , (7)
where H is the dose equivalent for neutrons, W is the workload, H0 is the neutron dose
equivalent (mSv) per x-ray (Gy) at 1.41 m (d0) from the isocenter and d1 is the distance from
the isocenter to the measuring point. 10−𝑡/𝑇𝑉𝐿𝑁 is the barrier transmission factor, where t is
the thickness of the barrier and TVLN is the tenth-value layer for neutrons.
The effective dose for neutron capture gamma rays can be calculated using equation 8 [9 10].
𝐷𝑐𝑔 = 𝐷 0 ∙ 𝐾 ∙ Ф ∙ 10−𝑡/𝑇𝑉𝐿 , (8)
where D(0) is the effective dose of x-ray at isocenter, Ф is the total neutron fluence (cm-2
) at a
point per unit dose (Gy) of x-ray at the isocenter, K is the ratio of the capture gamma dose to
the total neutron fluence at the same point and 10−𝑡/𝑇𝑉𝐿 is the barrier transmission factor,
where t is the thickness of the shielding.
The door of the treatment room
At the new radiation treatment department at NUS, the rooms will have direct entrance, i.e. no
maze, to reduce the floor space. The direct shielded doors need the same radiation protection
shielding as the wall to which it is attached, in this case a secondary barrier. Leakage radiation
from the accelerator (photons and neutrons) and neutron capture gamma rays need to be
considered. Scattered radiation from the patient can be ignored because of the low energy
[10].
The doors are not made of concrete at NUS because the required thickness will make them
too thick. Lead has a higher density and atomic number than concrete and can therefore be
used to reduce the thickness. Lead has the disadvantages of high cost and low strength and
must be supported by for example steel. The design of the door is described in 2.3.
An unwanted passage for scattered radiation might be created at the edges of the door. The
problem is illustrated in figure 4. The figure illustrates the door and the secondary wall from
above. The three x-rays A, B and C are leakage radiation from isocenter. Ray A passes
through lead and BPE, ray B passes through a reduced thickness of heavy concrete and ray C
passes through a thickness of concrete that will give the needed radiation protection shielding.
Ray B will therefore not be sufficient attenuated. The problem can be solved by making the
door overlap with the wall at all sides or to make a shielded doorstop. In addition, lead and

14
BPE (5% boron) can to be added in the doorframe [9 10]. The side of the door which is
visible from the isocenter will be exposed to more radiation and therefore needs longer
overlap than the opposite side.
Figure 4. The problem with incomplete door shielding. The side of the door which is visible from isocenter will
need extra reinforcement, such as larger overlap with the door or a thick doorstop. In this picture, the right side
of the door is attached to the wall.
The required thicknesses, t, of the lead and BPE layers of the door can be calculated using
equation 6 solved for P, equation 7 and 8.
2.5. The final design
The chosen material for the shielding at NUS is heavy concrete which has a density of 3.8
g·cm-3
. The floor will need no extra radiation protection shielding as there are no rooms under
the radiation treatment department. The maximum energy of the photon beams investigated
here is 15 MV, but because the accelerators may be changed over time to accelerators with
higher energies, the radiation protection shielding is designed for 20 MV.
The doors used at NUS are manufactured and installed by Nelco (USA) and consists of
30.5 cm polyethylene with 5% boron between two layers of lead (8.9 cm and 7.6 cm) and 1.9
cm strength structure of steel at the front and back of the door. In the doorframe there are
back-ups of lead and polyethylene with 5% boron [5].
The final design of the treatment rooms can be viewed in figure 5-8.

15
Figure 5. The figure shows two radiation treatment rooms (bunkers) from above. Side A and H are primary
barriers and sides B and C are secondary barriers [5]. The machine operating desk is where the staff of the
treatment department is running the linear accelerator. The demountable part of the wall at the door was never
realized and the outline of the door and door opening was not final in this layout.
Figure 6. The figure shows one of the treatment rooms viewed from side B in figure 5. Point G is at the top and
E is at the edge of the roof [5]. The outline of the door and door opening was not final in this layout.

16
Figure 7. The figure shows one of the radiation treatment rooms viewed from side H in figure 5. The radiation
protection of the ceiling is not the same in reality. The architect wanted the roof to be symmetrical and therefore
the slope at point D is moved to the left [5].
Figure 8. The figure shows the surrounding facilities to the radiation treatment department, which have to be
considered in the calculations and design of the radiation protection [5].

17
3. Survey equipment
3.1. Photon dose measuring instruments
Two different survey equipments were used for the photon measurements to get a reliable
result; the RDS-110 Multi-purpose Survey Meter and the DGM-1500 Turva Personal Survey
meter. Both are Geiger Mueller (GM) counters.
The RDS-110 detects gamma and x-rays with energies from 50 keV up to 1.3 MeV and
beta radiation with an external probe. It manages a dose rate range from 0.05 µSv/h up to
99.99 mSv/h when a continuous beam is used. However, at this thesis, the dose rate of the
pulses are up to 1000 times higher than the average and the equipment can only be trusted up
to 100 µSv/h. The device can handle an integrated dose range from 0.001 up to 999.9 mSv
and a pulse rate range from 0.1 to 9999 CPS (counts per second). The detector consists of one
halogen quenched energy-compensated GM-tube and the energy response follows the ambient
dose equivalent H*(10). The calibration accuracy is, at 300 µSv/h and 20°C, ±5% of the
reading with a 137
Cs gamma source, the dose linearity is ±15% from 0.1 µSv/h to 100 mSv/h
and the energy response is ±30% from 50 keV to 1.3 MeV [14].
The DGM-1500 detects gamma and x-rays with energies from 35 keV to 15 MeV. It
manage a dose rate from 0.01 to 100 000 mSv/h, a dose range from 0.001 to 1000 mSv and
has a sensitivity of 150 cpm/(µSv/h) (cpm = counts per minute). The detector consist of one
neon and halogen quenched energy-compensated GM-tube and the energy response follow the
ambient dose equivalent H*(10). The calibration accuracy is ±5% of the reading when 137
Cs is
used at 20°C and the dose linearity is ±10% at 20°C [3].
A GM counter consists of a tube with low pressure gas (~0.1 atm) such as neon, helium or
argon. The anode, a conducting wire, is placed in the center of the tube and the wall of the
tube is the cathode. When ionizing radiation passes through the tube some of the gas
molecules get ionized and positive ions and electrons are created. The strong electric field,
which is created by the electrodes, accelerates the ions towards the cathode and the electrons
towards the anode.
The electric field is so strong that the electrons gain sufficient energy to ionize further gas
molecules on their way to the electrode and an avalanche of charged particles is created.
Under proper conditions, the secondary electrons in one avalanche excite the gas molecules,
which emit photons to return to the ground state. The produced photons generate new free
electrons and more avalanches. This chain reaction results in a Geiger discharge which grows
in both directions of the wire until the entire anode is involved. This gives a short pulse of
current which is measured or counted.
The positive ions have less mobility than the free electrons and remain almost at the same
place during the collection of the electrons by the anode. When the concentration of these
positive ions is sufficient large, their collected charge begins to reduce the magnitude of the
electric field which terminates the discharge. Because each discharge is terminated after
developing about the same total charge, all pulses from a Geiger tube are of the same
amplitude despite the number of original created ion pairs. The output gives therefore little
information about the dose.
Because most GM tubes are constructed of materials with higher atomic number than
tissue and air, they have stronger response for photoelectric effect below ~100 keV. The
energy dependence of the response per unit of tissue dose is five times stronger for 50 keV x-
rays than for 670 keV photons depositing the same tissue dose. If the tube is enclosed in a

18
suitable high-Z filter, the curve of the response will be flattened out at low energies. Such an
energy compensated GM-tube can respond to photons over a limited range of energies that is
reasonably proportional to the tissue dose or to exposure. In this way, with a proper
calibration, a GM counter can be used as a dose rate or exposure rate meter [1 7].
The GM counter has the advantages of simplicity, low cost and ease of operation and has
no need of external amplification. It is therefore one of the best choices when a simple and
economical counting system is needed. The GM counter also has a great advantage when the
examined field contains both photons and neutrons. When neutrons interact in the gas they
give rise to heavy secondary charged particles which produce pulses with the same amplitude
as the secondary electrons created by the gamma rays with low energy. The response per unit
dose is therefore much smaller for neutrons than for gamma rays and the neutron dose can be
separated from the photons.
One of the disadvantages with the GM-tube is the large dead time, which is the time the
tube has to recover between two detections. These detectors are therefore only useful at
relatively low counting rates (up to 100 µSv/h) [1 7].
3.2. The photon energy spectrum
In order to find out if the measuring instruments give a reliable result, the photon energy
spectrum outside the radiation protection shielding needs to be approximated. The photon
spectrum shows how the photons are distributed in energy and will be compared to the
response of the measuring instrument as a function of the photon energy. This spectrum is
hard to derive and it is approximated with the help of literature.
According to Maruyama et al [11], the average energy of the primary spectrum in the
treatment room is 3.22 MeV for 10 MV and 4.53 MeV for 20 MV. After the primary radiation
has penetrated a 40 cm heavy concrete layer with density of 3.31 g·cm-3
, the average energy is
5.39 MeV for 10 MV and 8.76 MeV for 20 MV and the most probable energy is about 4.5
MeV for both energies. All the measurements are carried out using an NaI(Tl) scintillation
spectrometer. The average energy of the spectra will increase with larger thickness of the
shielding due to the hardening of the x-rays. After an initial buildup of secondary photons, the
increase of the average energy will be steep until the thickness is around one tenth value layer,
then it becomes gradual. This fact should be noted during radiation protection measurements.
One should keep in mind that the average energy says nothing about the amount of radiation
which has penetrated the barrier, it only gives an indication of the energy distribution.
The highest energy at NUS is 15 MV and the shielding at the primary walls is 165 cm of
heavy concrete. As the average energy will increase with both the energy of the photons and
the thickness of the radiation protection barrier, the spectrum for 20 MV is better as an
approximation for the spectrum outside the treatment room at NUS than the spectrum for 10
MV. The higher energy will probably compensate slightly for that the barriers have thinner
thickness than at NUS. The average energy for 30 MV is 10.4 MeV and it can also be used as
an approximation due to the fact that the thickness at NUS is about four times the thickness
used during the estimations of the energy spectra.
The average energy at NUS will therefore be approximated to about 9 MeV, which is
somewhere in between the values for 20 and 30 MV. When 40 cm heavy concrete is used,
some photons with higher energy than 15 MeV, which is the highest energy the detectors can
handle, are present. But as the thickness increases four times at NUS, these photons will be
reduced in energy.

19
The incident and transmitted photon spectra for 6, 10 and 25 MV photons after penetrating a
60 cm concrete layer are plotted in figure 9 [12]. The spectrum is referred to 90º leakage
radiation and is obtained from the Monte Carlo code MORSE [12]. The histograms are
normalized so that the total number of photons is one.
According to figure 9, there are more low energy photons after the shielding than before.
For 6 and 10 MeV the average energy decreases after the concrete layer, but for the energy of
25 MeV, the average photon energy is increasing slightly. According to Nelson et al [12], this
may be due to that pair production dominates above 10 MeV.
The observations that the average energy will decrease for two energies and that the
number of low energy photons will increase after the shielding are a contradiction according
to the hardening of the x-rays in the barrier. One reason for the strange result could be that the
incident and transmitted photon spectra in figure 9 have been mixed up. Nevertheless, because
the average energies for the incident and transmitted spectra are very similar and the maximal
energy is nearly the same before and after, the histograms can be used as an approximation for
the energy spectrum of the scattered radiation outside the treatment room.
The concrete thickness of the secondary walls at NUS is 110 cm. They are made of
heavy concrete instead of ordinary concrete, which is the case in figure 9, and the energy used
at NUS is 6 and 15 MV. The energy spectrum outside the radiation protection shielding at
NUS will be somewhere in between the spectra for 10 and 25 MV, where the average energy
is 1.2 and 1.7 MeV respectively. But because the thickness of the shielding is only 60 cm in
figure 9 and 15 MV is the most interesting energy, the energy spectrum at 25 MV will be
more reliable and is compared with the energy response of the measuring device. For 25
MeV, the maximal energy is approximately 12 MeV and the most probable energy is about
0.2-0.4 MeV.
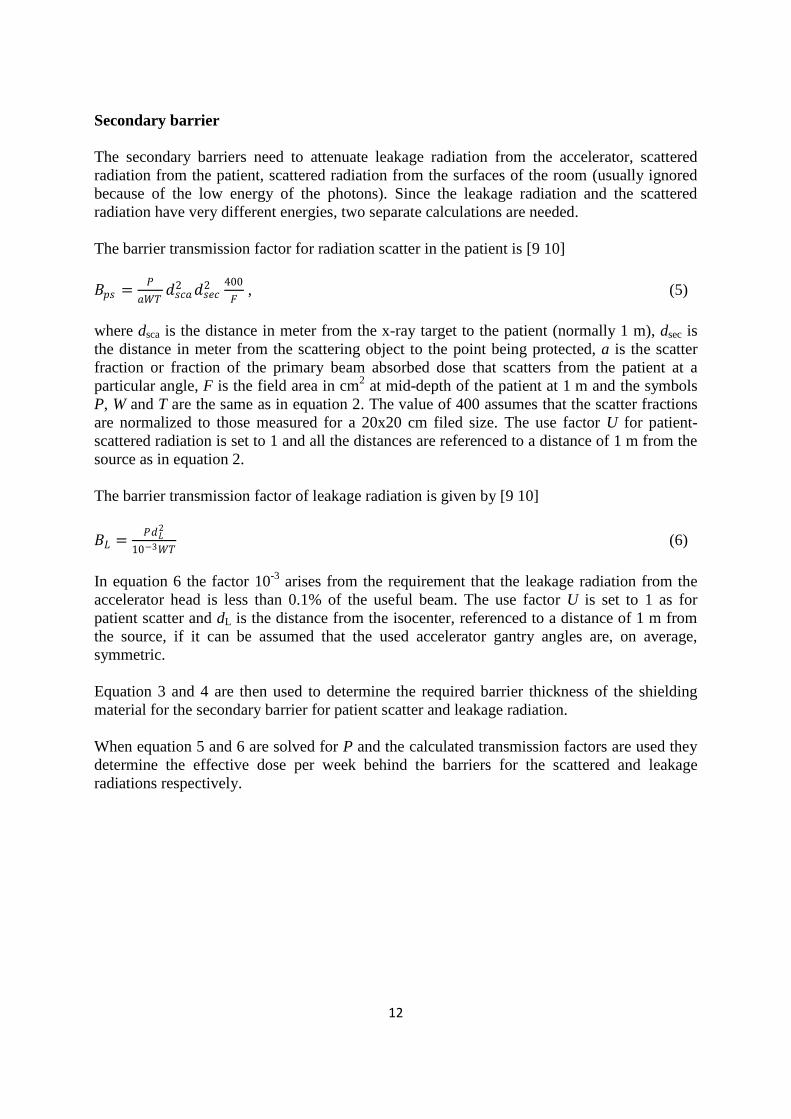
In figure 10 [4], the energy spectrum for capture gamma rays produced by neutrons from a 15
MV accelerator after a 25 and 50 cm concrete layer respectively is plotted. In the histogram, it
can be seen that gamma rays up to 10 MeV is produced, which are highly penetrating, and the
most probable energy is about 0.1-0.2 MeV. This penetration is on the other hand
significantly reduced when the barrier thickness is increased and the spectrum will be less
pronounced at NUS.
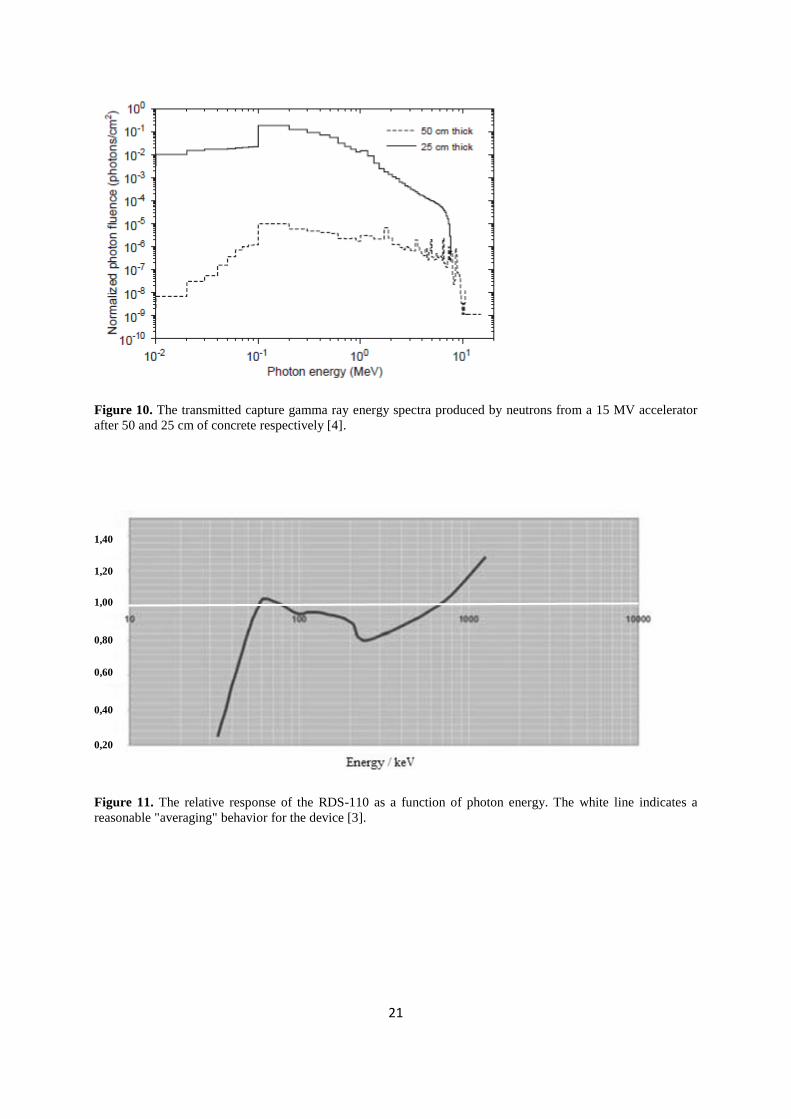
The DGM-1500 manages an energy range from 35 keV to 15 MeV and over- and
underestimates the response with ± 30 % in the energy range of 30 keV-1.25 MeV. The RDS-
110 manage an energy range of only 50 keV-1.3 MeV and has a response that is ± 30 % in the
same energy range. The response curve of the RDS-110 is plotted in figure 11 as a function of
photon energy [3]. The white line indicates a reasonable "averaging" behavior for the device.
According to this, the RDS cannot be used alone, because it will not give a reliable result
at the primary shielding, where the average energy is about 9 MeV, and at highest energies at
the secondary barriers, which is about 12 MeV. The DGM could have a little too small
measuring range for some high energy photons at the primary barrier, but if the photons have
too high energy, it will be noticed as an unrealistic high measured dose, because the device
will give an over response to the radiation. However, according to studied spectra, there will
be very few photons in the range above 15 MeV.
The most probable energy after the primary barriers is lower than 4.5 MeV and can be
detected by the DGM without problem. The average and the most probable values in the
energy range for the secondary barriers are about 1.7 MeV and 0.2 MeV respectively, which
are in the energy range where both measuring instruments have the lowest under- or
overestimation.

20
As a conclusion, the DGM can be considered as a reliable device in the estimated energy
range, while the RDS can be used as a backup at low energies in order to compare the results.
Figure 9. The incident and transmitted photon energy spectra after 60 cm of concrete for 6, 10 and 25 MV
photons. The headers of the spectra should e.g. use the unit MV instead of MeV as it refers to the hole spectra.
The dashed lines are the incident spectrum and the solid lines are the transmitted spectrum after 60 cm of
concrete. kave is the average energy for the spectrum [12].
21
Figure 10. The transmitted capture gamma ray energy spectra produced by neutrons from a 15 MV accelerator
after 50 and 25 cm of concrete respectively [4].
Figure 11. The relative response of the RDS-110 as a function of photon energy. The white line indicates a
reasonable "averaging" behavior for the device [3].
1,40
1,20
1,00
0,80
0,60
0,40
0,20

22
3.3. Neutron dose measuring instrument
The Neutron Probe LB 6411 is used as the measuring instrument for neutrons. It measures the
ambient dose equivalent H*(10) rate in Sv/h directly in accordance with the 1991
recommendations of the International Commission on Radiation Protection (ICRP) [2 6 13].
The LB 6411 probe consists of a polyethylene moderator sphere with a diameter of 25
cm, a specially developed and patented cylindrical 3He proportional counter tube at its center
and Cd absorbers. The probe includes a high voltage supply, a discriminator and a
preamplifier.
The measuring range of the LB 6411 lies between 30 nSv/h and 100 mSv/h and it can
detect neutrons in the energy range from thermal to 20 MeV. The dose response is 2.83 counts
per nSv or 0.79 cps per µSv/h. In the energy range between 1 eV and 20 MeV the LB 6411
deviates from the ICRP 60 values by a maximum factor of 2.3 in either direction, relative to
the calibration value in the range 2-4 MeV. The response for gamma radiation is
approximately 0.001 counts per nSv [2 6 13].
The 3He proportional counter is a thermal neutron detector which is filled with
3He and
methane at partial pressures 3.5 bar and 1 bar, respectively. Neutrons get detected through
nuclear reactions with the nuclei of the gas in the detector, which give rise to detectable
protons. The reaction can be written as
𝐻𝑒 + 𝑛 → 𝐻13 + 𝑝1
101
23 (9)
The probability of this nuclear reaction decreases rapidly when the energy of the neutron
increases. In order to detect neutrons in a wider energy region and eliminate the need for
complex neutron spectral measurements, the detector consists of a neutron moderator of the
hydrogenous material polyethylene, which surrounds the thermal detector. The fast and
intermediate neutrons interact with the moderator material through elastic scattering and
transfer part of its energy to the scattering nuclei and eventually become thermal neutrons.
The slow neutrons pass through the moderator to the detector material without losing much
energy.
The moderator is designed so that the response rate of the detector per unit neutron flux is
a suitable function of the neutron energy and the detecting device is calibrated using a neutron
source with a known energy spectrum, for example 252
Cf. The determined calibration factor is
used to relate the instrument response to the neutron equivalent dose rate. In this way the
detector can detect both slow and fast neutrons. Devices which are based upon this neutron
interaction are referred to as proton recoil detectors.
The energy dependence of the Neutron Probe is optimized by the neutron absorbers (Cd)
in the moderator and the special composite 3He recoil proton counter tube. The sensitivity is
increased by approximately 3 counts per nSv in the energy range between 1 and 10 MeV due
to that the detector has a relatively large volume and contains a special gas (patent applied
for), which gives rise to additional recoil protons in the counting gas.
Because gamma rays are found in the neutron field, the detector needs to be able to
separate neutrons from gamma. The Q-value for a reaction is the amount of energy released
by that reaction and the greater this value is, the greater is the energy given to the reaction
products and the easier it is to separate neutrons from photons using a single amplitude
discriminator. The Q-value of equation 9 is 0.765 MeV which is sufficiently large [7 10].

23
3.4. The neutron energy spectrum
In order to find out if the measuring instrument gives a reliable result, the neutron energy
spectrum after the radiation protection shielding needs to be approximated. The neutron
spectrum shows how the neutrons are distributed in energy and will be compared to the
response curve of the measuring device as a function of the neutron energy. This spectrum is
very hard to estimate and it is approximated with the help of literature.
According to Facure et al [4], the photoneutron emission spectra produced in the
accelerator is dominated by neutrons with energies up to 2 MeV. The average neutron energy
is 1.15 MeV, 1.25 MeV, 1.31 MeV and 1.46 MeV for the maximum photon energy of 15 MV,
18 MV, 20 MV and 25 MV, respectively, and the most probable energy is approximately 0.50
MeV for all four spectra.
The neutron spectrum produced by the linear accelerator is slowed down in energy as a
result of particle interaction with the material of the accelerator. The average neutron energy
is then found to be 0.4 MeV for the four studied spectra and the most probable energy is about
0.20 MeV [4].
The energy spectra from a 15 MV linear accelerator outside the treatment room after
crossing standard concrete barriers of 25, 50, 75 and 100 cm respectively can be seen in figure
12. The barriers have a density of 2.26 g·cm-3
. The resulting spectrum shows that fast
neutrons (100 keV-10 MeV) are attenuated in intensity and energy through scattering inside
the concrete, which generates epithermal (1 eV-100 keV) and thermal (1 meV-1 eV) neutron
fluxes. When the thickness of the concrete is increased, the normalized flux of fast and
epithermal neutrons is reduced significantly, while the thermal neutron flux is almost constant
which is explained by the transformation of fast and epithermal neutrons into thermal [4].
Figure 12. The neutron spectra from a 15 MV linear accelerator, after crossing concrete barriers of 25, 50, 75
and 100 cm respectively [4].
The primary wall thickness of the primary walls at NUS is 165 cm and the secondary walls
are 110 cm and they are made of heavy concrete instead of regular concrete which is the used
material in figure 12. But nevertheless, the curves give a good approximation of what the
neutron energy spectrum looks like outside the treatment room.
24
The energy of each neutron is reduced rapidly in size when the thickness of the barrier is
increasing and because the primary walls are very thick, nearly no neutrons manage to pass
through them. The secondary walls on the other hand can be compared to the curve of the
thickness of 100 cm. Most of the neutrons are in the epithermal region of 1 keV-10 keV and
fast region of 1-10 MeV, which is the maximum energy.
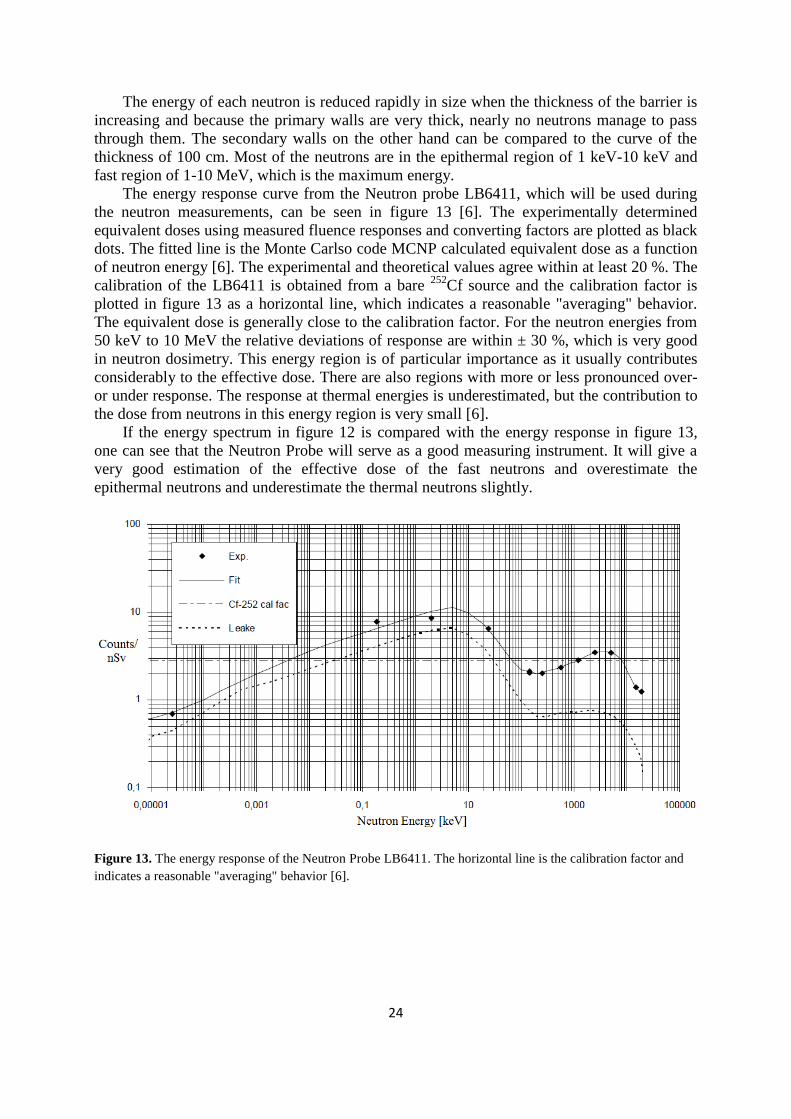
The energy response curve from the Neutron probe LB6411, which will be used during
the neutron measurements, can be seen in figure 13 [6]. The experimentally determined
equivalent doses using measured fluence responses and converting factors are plotted as black
dots. The fitted line is the Monte Carlso code MCNP calculated equivalent dose as a function
of neutron energy [6]. The experimental and theoretical values agree within at least 20 %. The
calibration of the LB6411 is obtained from a bare 252
Cf source and the calibration factor is
plotted in figure 13 as a horizontal line, which indicates a reasonable "averaging" behavior.
The equivalent dose is generally close to the calibration factor. For the neutron energies from
50 keV to 10 MeV the relative deviations of response are within ± 30 %, which is very good
in neutron dosimetry. This energy region is of particular importance as it usually contributes
considerably to the effective dose. There are also regions with more or less pronounced over-
or under response. The response at thermal energies is underestimated, but the contribution to
the dose from neutrons in this energy region is very small [6].
If the energy spectrum in figure 12 is compared with the energy response in figure 13,
one can see that the Neutron Probe will serve as a good measuring instrument. It will give a
very good estimation of the effective dose of the fast neutrons and overestimate the
epithermal neutrons and underestimate the thermal neutrons slightly.
Figure 13. The energy response of the Neutron Probe LB6411. The horizontal line is the calibration factor and
indicates a reasonable "averaging" behavior [6].
25
4. Measurements
The measurements of the radiation protection need to be planned carefully in order to get a
proper evaluation which corresponds to the reality. Each wall, ceiling, door and the adjacent
environment need to be surveyed with suitable measuring instruments.
Effective and equivalent dose is the recommended quantity for shielding design and radiation
protection when photons and neutrons are present and the unit is sievert (Sv). The radiation
limits for the effective dose, stated by the Swedish Radiation Safety Authority
(Strålsäkerhetsmyndigheten, SSM), can be seen in table 1 and 2.
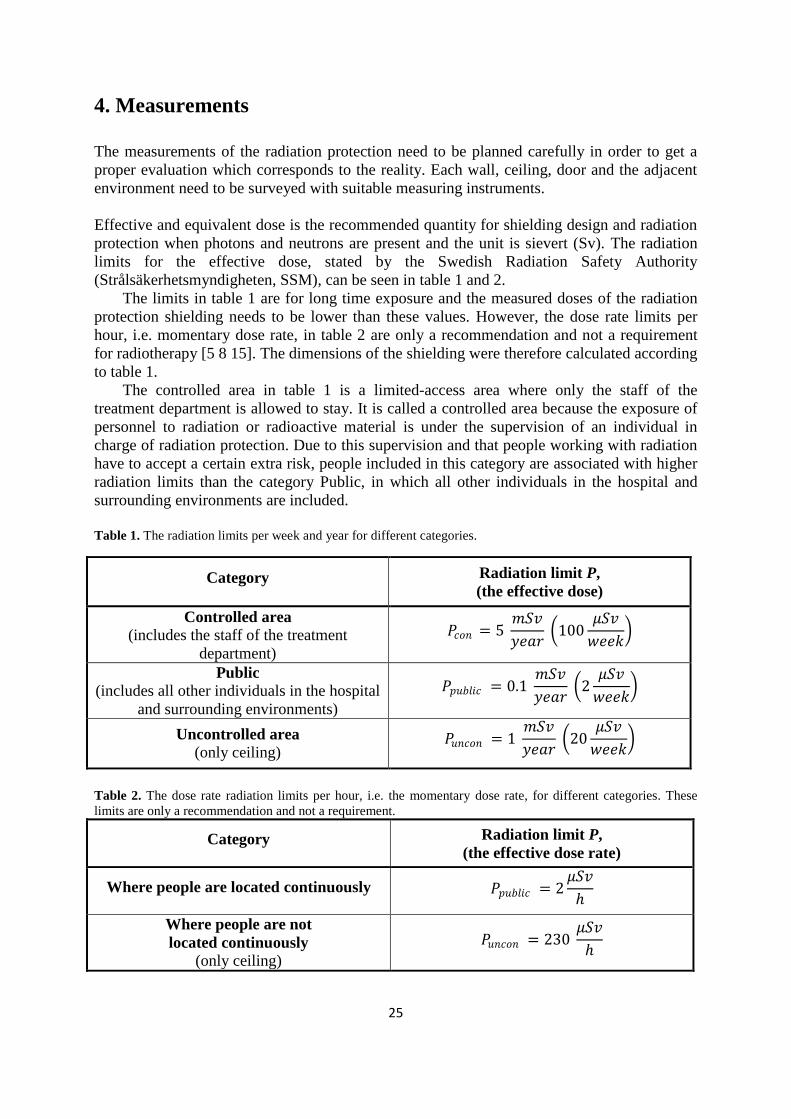
The limits in table 1 are for long time exposure and the measured doses of the radiation
protection shielding needs to be lower than these values. However, the dose rate limits per
hour, i.e. momentary dose rate, in table 2 are only a recommendation and not a requirement
for radiotherapy [5 8 15]. The dimensions of the shielding were therefore calculated according
to table 1.
The controlled area in table 1 is a limited-access area where only the staff of the
treatment department is allowed to stay. It is called a controlled area because the exposure of
personnel to radiation or radioactive material is under the supervision of an individual in
charge of radiation protection. Due to this supervision and that people working with radiation
have to accept a certain extra risk, people included in this category are associated with higher
radiation limits than the category Public, in which all other individuals in the hospital and
surrounding environments are included.
Table 1. The radiation limits per week and year for different categories.
Category Radiation limit P,
(the effective dose)
Controlled area
(includes the staff of the treatment
department)
𝑃𝑐𝑜𝑛 = 5 𝑚𝑆𝑣
𝑦𝑒𝑎𝑟 100
𝜇𝑆𝑣
𝑤𝑒𝑒𝑘
Public
(includes all other individuals in the hospital
and surrounding environments)
𝑃𝑝𝑢𝑏𝑙𝑖𝑐 = 0.1 𝑚𝑆𝑣
𝑦𝑒𝑎𝑟 2
𝜇𝑆𝑣
𝑤𝑒𝑒𝑘
Uncontrolled area
(only ceiling) 𝑃𝑢𝑛𝑐𝑜𝑛 = 1
𝑚𝑆𝑣
𝑦𝑒𝑎𝑟 20
𝜇𝑆𝑣
𝑤𝑒𝑒𝑘
Table 2. The dose rate radiation limits per hour, i.e. the momentary dose rate, for different categories. These
limits are only a recommendation and not a requirement.
Category Radiation limit P,
(the effective dose rate)
Where people are located continuously 𝑃𝑝𝑢𝑏𝑙𝑖𝑐 = 2𝜇𝑆𝑣
ℎ
Where people are not
located continuously
(only ceiling)
𝑃𝑢𝑛𝑐𝑜𝑛 = 230 𝜇𝑆𝑣
ℎ
26
4.1. Measuring points
There are a number of measuring points which need to be considered during the survey in
order to get a proper evaluation of the radiation protection shielding. The points are:
Primary walls, see point A and H in figure 5-6.
Secondary walls, see point B and C in figure 5.
Primary part of ceiling, see point G in figure 7.
Secondary part of ceiling, see point E, D and F in figure 7.
Door, see figure 5-6.
Openings in the walls for cooling pipes, ventilation and cables.
Machine operation desk, see figure 5.
Adjacent rooms to the treatment room.
Adjacent buildings to the treatment room, see figure 8.
Skyshine radiations, see 4.2.
There are no rooms under the treatment department and investigation of the radiation
protection shielding of the floor is therefore not needed.
4.2. The procedures of measurement
The measurements should be performed when the accelerator is operated at its maximal x-ray
dose rate (Siemens: 500 MU/min for 15 MV and 300 MU/min for 6 MV, Varian: 500
MU/min for 15 MV and 6 MV) and maximal field size (40x40 cm2) to get a worst-case
scenario. Higher dose rate and larger field size generate more radiation and therefore higher
dose. To get the longest field size along the wall, which is the diagonal of the field, the
collimator of the accelerator is rotated 45 degrees.
The accelerator can be operated at the energies 15 MV and 6 MV. For the photon
measurements, 15 MV is tested for all measuring points and 6 MV is only tested where high
levels have been measured for 15 MV. This is because lower energy photons will be more
efficiently attenuated. For the neutron measurements, only 15 MV is tested due to that 6 MV
will not generate any neutrons. The surveys are performed at a distance of 30 cm from the
examined objects (walls and doors) and two different measuring devices are used for photons,
to verify the results and one for neutrons.
The three accelerators consist of one Siemens and two identical Varian machines. One of
the Varian machines are therefore only tested at the most critical points; the walls, the door,
the openings and the machine operating station and only 15 MV and the largest field size are
used. The ceiling is just investigated for one accelerator.
The primary walls, the secondary wall containing the door, the door and the machine
operating station are also examined with the field size 15x15 cm2 at 15 MV for Siemens and
one Varian. This is because this field is more commonly used during radiation treatments than
the maximum field size.
Primary walls
The radiation beam from the accelerator should be pointed directly at the wall in question.
Scattered radiation is not of interest and no phantom, which would illustrate the patient

27
attenuation and scatter, is used in the beam. The center of the beam is located at the outer side
of the wall with a measuring-tape.
The survey equipments are held at a distance of 30 cm from the wall at the height of
isocenter and around to investigate the wall. The junction between the floor and wall is also
examined because the bottom edge of the beam is hitting part of the floor. The floor consists
of concrete while the wall is made of heavy concrete, which has a higher density and gives
better attenuation of the photons. Photons, which scatter and pass through the floor instead of
the wall to the other side, will therefore be less attenuated.
Secondary walls
To investigate the secondary walls, four different angels of the accelerator need to be used to
measure the scattered radiations from all directions. The four angels are: 0° (the accelerator
head is directed towards the floor), 90° (the accelerator head is directed to the right seen from
the gantry's point of view), 180° (the accelerator head is directed towards the ceiling) and
270° (the accelerator head is directed to the left seen from the gantry's point of view). To
illustrate the radiation scatter in the patient, a pelvis phantom is put in the center of the beam.
Both the energies 15 MV and 6 MV are used for the wall containing the door, but for the
opposite wall the doses for 15 MV is very low and 6 MV was not tested. Only 15 MV is used
for the neutron measurements.
The secondary wall which contains the door is especially examined at the outline region
of the door which overlaps with the wall at all sides. When the radiation protection shielding
goes from door to heavy concrete, the attenuation efficiency can change, see figure 4.
The dose is also measured when the collimators are closed for one accelerator to see how
efficiently the collimators stop the photons and potentially also create more neutrons.
Ceiling
The gantry is directed towards the ceiling without a phantom in the field. Only 15 MV is used
with the largest field size. The ceiling is investigated at the primary- and secondary shielding
and at the junction between them both.
Door
The door is located in one of the secondary walls and the same four angels of the accelerator
head as for the secondary walls and a phantom is used. Both energies and dose rates are tested
for photons and only 15 MV for neutrons. The entire door needs to be scanned; the door gaps
around and under the door and in front of the door. The distance to the survey instrument is
less than 30 cm.
Openings
All openings for ventilation, cooling pipes and cables in the walls will not provide any
radiation shielding and need to be surveyed. The ventilation is below the floor and will not be
investigated, but the cooling pipes and the cables are located in the upper part of the wall and
need to be examined. As the openings are in the secondary wall, all four angels are used with
a phantom placed in the beam. Only 15 MV is used because the measured doses were very
low.

28
Machine operating desk and adjacent rooms
The machine operation desk is where the staff of the treatment department is situated when
they run the accelerator. The station and the adjacent rooms are located outside the secondary
wall and four angels of the accelerator are used with a phantom. Only 15 MV is tested
because of the low measured doses. One machine operating station is situated between two
treatment rooms and the dose is also measured when both the accelerators are running. The
dose is also measured at 15 MV without a phantom when the beam is directed at the primary
walls for Siemens and one Varian.
Adjacent buildings
The gantry is directed upward towards the ceiling to get as much radiation as possible to
scatter to the adjacent buildings, see figure 8. Skyshine can also be a problem here. No
phantom is used. The four floors of the surrounding facility are examined by scanning the
windows closest to the treatment room below. Only 15 MV is used. The neutrons do not need
to be tested at all three floors; it is enough if the part of the ceiling that is closest to the
windows of the second floor is investigated.
Skyshine radiations
Some facilities are designed with a thin thickness of the shielding in the ceiling above the
accelerator. The radiation can then scatter in the atmosphere (air) to points at ground level
outside the treatment room. This is referred to as skyshine and concerns both photons and
neutrons. The dose increases with increasing distance from the barrier until a maximum is
reached at a distance which is equal to the height of the barrier and then decreases slowly
after.
The beam is pointed upward towards the ceiling without a phantom and the skyshine is
measured at different distance from the treatment room outside. The neutrons do not need to
be tested, because the energy of the photons is too low for the neutrons to gain enough energy
to be a protecting problem outside the building (this was determined after the photon
measurements).
4.3. Calculations
The measured values have to be lower than the radiation limits stated in table 1 and 2. Table 2
lists the effective dose rate in µSv/h and can be compared directly to the measured values. But
in table 1 the radiation limits are specified in µSv/week and because the dose is measured in
µSv/h, different factors need to be considered in order to compare them and the following
equation is used
𝐷 𝑐𝑎𝑙𝑐 =𝐷 𝑚𝑒𝑎𝑠𝑢𝑟𝑒𝑑
𝐷 𝑖𝑠𝑜∙ 𝑊 ∙ 𝑈 ∙ 𝑇 < 𝑃 (10)
where 𝐷 𝑐𝑎𝑙𝑐 is the calculated effective dose in µSv/week, which should be smaller than the
limiting value P. 𝐷 𝑚𝑒𝑎𝑠𝑢𝑟𝑒𝑑 is the measured effective dose rate in µSv/h at a certain distance,
𝐷 𝑖𝑠𝑜 is the absorbed dose rate in Gy/h at isocenter, W is the workload in Gy/week at isocenter,
U is the use factor and T is the occupancy factor.

29
In the calculations, 𝐷 𝑖𝑠𝑜 is set to 5.0 Gy/min (300 Gy/h), W is set to 800 Gy/week, U is
0.25 for primary walls and 1 for secondary walls and T is 1 for the staff of the treatment
department, 1/5 for the public and 1/40 at the ceiling [10]. The values can also be found in
table 9 in the appendix. The unit for the absorbed dose is Gy, equivalent to J/kg, which is the
mean energy imparted per mass by ionizing radiation to matter. U is 0.25 for primary walls
because only one-fourth of the workload of the primary beam is directed at the barrier in
question. Secondary walls on the other hand are hit by scattered radiation for all gantry angels
and the use factor is therefore 1.
30
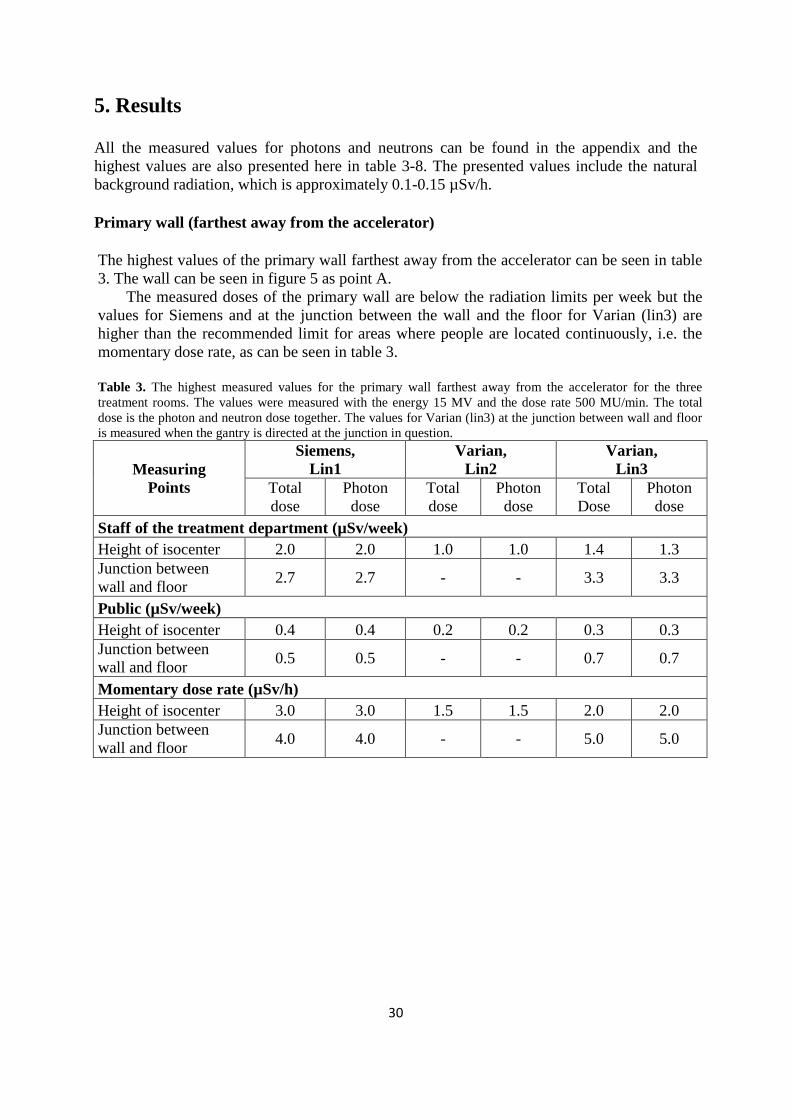
5. Results All the measured values for photons and neutrons can be found in the appendix and the
highest values are also presented here in table 3-8. The presented values include the natural
background radiation, which is approximately 0.1-0.15 µSv/h.
Primary wall (farthest away from the accelerator)
The highest values of the primary wall farthest away from the accelerator can be seen in table
3. The wall can be seen in figure 5 as point A.
The measured doses of the primary wall are below the radiation limits per week but the
values for Siemens and at the junction between the wall and the floor for Varian (lin3) are
higher than the recommended limit for areas where people are located continuously, i.e. the
momentary dose rate, as can be seen in table 3.
Table 3. The highest measured values for the primary wall farthest away from the accelerator for the three
treatment rooms. The values were measured with the energy 15 MV and the dose rate 500 MU/min. The total
dose is the photon and neutron dose together. The values for Varian (lin3) at the junction between wall and floor
is measured when the gantry is directed at the junction in question.
Measuring
Points
Siemens,
Lin1
Varian,
Lin2
Varian,
Lin3
Total
dose
Photon
dose
Total
dose
Photon
dose
Total
Dose
Photon
dose
Staff of the treatment department (µSv/week)
Height of isocenter 2.0 2.0 1.0 1.0 1.4 1.3
Junction between
wall and floor 2.7 2.7 - - 3.3 3.3
Public (µSv/week)
Height of isocenter 0.4 0.4 0.2 0.2 0.3 0.3
Junction between
wall and floor 0.5 0.5 - - 0.7 0.7
Momentary dose rate (µSv/h)
Height of isocenter 3.0 3.0 1.5 1.5 2.0 2.0
Junction between
wall and floor 4.0 4.0 - - 5.0 5.0

31
Primary wall (closest to the accelerator)
The highest doses of the primary wall closest to the accelerator can be seen in table 4. The
wall can be seen in figure 5 as point H.
The values of the primary wall are below the radiation limits per week but the dose rates
are higher than the recommended limit per hour (except at the junction between wall and floor
for Siemens), as can be seen in table 4.
Table 4. The highest measured values for the primary wall closest to the accelerator for the three treatment
rooms. The values were measured with the energy 15 MV and the dose rate 500 MU/min. The total dose is the
photon and neutron dose together. The values for Varian (lin3) at the junction between wall and floor are
measured when the gantry is directed at the junction in question.
Measuring
Points
Siemens,
Lin1
Varian,
Lin2
Varian,
Lin3
Total
dose
Photon
dose
Total
dose
Photon
dose
Total
Dose
Photon
dose
Staff of the treatment department (µSv/week)
Height of isocenter 4.7 4.7 5.4 5.3 2.7 2.7
Junction between
wall and floor 1.0 1.0 1.7 1.7 3.3 3.3
Public (µSv/week)
Height of isocenter 0.9 0.9 1.1 1.1 0.5 0.5
Junction between
wall and floor 0.2 0.2 0.3 0.3 0.7 0.7
Momentary dose rate (µSv/h)
Height of isocenter 7.0 7.0 8.0 8.0 4.0 4.0
Junction between
wall and floor 1.5 1.5 2.5 2.5 5.0 5.0

32
Secondary wall (with door)
The highest doses are located where the door is attached to the wall and can be seen in table 5.
The secondary wall with door can be seen in figure 5 as point C.
The measured values per week are below the radiation limits, but the dose rates for both
Varian accelerators are higher than the recommended limit per hour for areas where people
are located continuously, i.e. the momentary dose rate. The values for the public are not of
interest because this is a controlled area and they are not allowed to be located close to the
wall.
Table 5. The highest measured values for the secondary wall with the door for the three treatment rooms. The
highest values are located where the door is attached, which is to the right of the door for Siemens and Varian
(lin3) and to the left of the door for Varian (lin2). The values were measured with the energy 15 MV and the
dose rate 500 MU/min. The total dose is the photon and neutron dose together.
Measuring
Points
Siemens,
Lin1
Varian,
Lin2
Varian,
Lin3
Total
dose
Photon
dose
Total
Dose
Photon
dose
Total
Dose
Photon
dose
Staff of the treatment department (µSv/week)
Gantry angle: 90° 3.7 1.9 13.3 8.0 7.5 5.3
Gantry angle: 270° 5.0 3.2 10.4 6.7 11.5 8.0
Gantry angle: 180° 4.0 2.7 10.4 6.7 7.5 5.3
Gantry angle: 0° 4.0 2.7 12.3 8.0 7.2 5.3
Momentary dose rate (µSv/h)
Gantry angle: 90° 1.4 0.7 5.0 3.0 2.8 2.0
Gantry angle: 270° 1.9 1.2 3.9 2.5 4.3 3.0
Gantry angle: 180° 1.5 1.0 3.9 2.5 2.8 2.0
Gantry angle: 0° 1.5 1.0 4.6 3.0 2.7 2.0
Secondary wall (outside)
All the measured doses are below the radiation limits. The total measured dose lies between
0.1-0.2 µSv/h, which corresponds to the background radiation. The secondary wall can be
seen in figure 5 as point B.

33
Ceiling
The primary and secondary part of the ceiling can be seen in figure 7 as points G and E, D and
F respectively. The ceiling is an uncontrolled area where people are not located continuously.
The highest doses can be seen in table 6 and they are all below the radiation limits.
Table 6. The highest measured values for the secondary wall for one treatment room. The values were measured
with the energy 15 MV and the dose rate 500 MU/min. The total dose is the photon and neutron dose together.
Measuring
Points
Varian,
Lin2
Total
dose
Photon
dose
Uncontrolled area (µSv/week)
Primary shielding 1.0 1.0
Secondary shielding 0.1 0.1
Momentary dose rate (µSv/h)
Primary shielding 60.2 60.0
Secondary shielding 0.9 0.9
Door
The highest doses at the door are found by the gap under the door and can be seen in table 7.
The values are below the radiation limits per week and year but are higher than the
recommended limit for areas where people are located continuously, i.e. the momentary dose
rate. The public is not of interest because this is a controlled area and they are not allowed to
be close to the door. The measured doses around and in front of the door are very low.
Table 7. The highest measured values for the door for the three treatment rooms. The values were measured with
the energy 15 MV and the dose rate 500 MU/min. The total dose is the photon and neutron dose together.
Measuring
Points
Siemens,
Lin1
Varian,
Lin2
Varian,
Lin3
Total
dose
Photon
dose
Total
dose
Photon
dose
Total
Dose
Photon
dose
Staff of the treatment department (µSv/week)
Gantry angle: 90° 38.4 37.33 37.3 34.7 41.6 40.0
Gantry angle: 270° 30.9 29.3 41.3 40.0 26.9 24.0
Gantry angle: 180° 28.8 26.7 40.5 37.3 32.0 29.3
Gantry angle: 0° 44.8 42.7 48.0 45.3 55.2 53.3
Momentary dose rate (µSv/h)
Gantry angle: 90° 14.4 14.0 14.0 13.0 15.6 15.0
Gantry angle: 270° 11.6 11.0 15.5 15.0 10.1 9.0
Gantry angle: 180° 10.8 10.0 15.2 14.0 12.0 11.0
Gantry angle: 0° 16.8 16.0 18.0 17.0 20.7 20.0

34
Openings, machine operating desk and adjacent rooms
All the measured doses at these places are low and below the limits. The maximum total dose
at the openings is 1.7 µSv/h and for the machine operation desk and adjacent room the
maximum total dose is 0.9 µSv/h. The location of the machine operating desk can be seen in
figure 5.
Adjacent buildings and skyshine
The measured doses at the adjacent buildings at all floors and the skyshine are about 0.1
µSv/h, which is the radiation background. The location of the adjacent building can be seen in
figure 8.

35
Field 15x15 cm2
The highest doses when a 15x15 cm2 field is used are presented in table 8. Some values are
higher than the recommended limit per hour, i.e. the momentary dose rate. The neutron dose
is not measured with this field size and is not added to the values. The public is not of interest
at the secondary wall and door because they are not allowed to be here.
Table 8. The highest measured values for the field size 15x15 cm for two treatment rooms. The values were
measured with the energy 15 MV and the dose rate 500 MU/min. The neutron dose is not added to the values.
The background is approximately 0.1-0.15 µSv/h and is included in the values.
Measuring
Points
Siemens,
Lin1
Varian,
Lin3
Staff of the treatment department (µSv/week)
Primary wall (farthest away
from the accelerator),
height of isocenter
2.0 1.1
Primary wall (closest to the
accelerator),
height of isocenter
4.0 2.3
Secondary wall
with door, max value 2.7 8.0
Gap under door,
Max value 18.7 26.7
Public (µSv/week)
Primary wall no.1,
height of isocenter 0.4 0.2
Primary wall no.2,
height of isocenter 0.8 0.5
Momentary dose rate (µSv/h)
Primary wall no.1,
height of isocenter 3.0 1.7
Primary wall no.2,
height of isocenter 6.0 3.5
Secondary wall
with door, max value 1.0 3.0
Gap under door,
Max value 7.0 10.0

36
6. Discussion Primary walls
The measured values of the primary walls for all three rooms are below the radiation limits
per week for both staff of the treatment department and public (table 1). But some of the
measured doses at the height of isocenter and at the junction between the wall and floor are
higher than the recommended limit per hour (table 2), i.e. the momentary dose rate. The
junction between the wall and floor receives high doses when the field is large or when the
gantry is directed towards it. The limits per hour are on the other hand only a recommendation
and no reinforcement of the shielding is necessary. However, one should avoid placing a
workplace outside the primary walls.
In the calculations regarding the radiation protection, the approximated maximal dose
rate at the primary walls is 3.8 µSv/h, which is already too high. According to the
calculations, a wall thickness of 172 cm is needed in order to get below the limit of 2 µSv/h,
but the thickness was chosen to 165 cm after the calculations concerning the radiation limits
per week [5].
Even if a too small thickness of the walls was chosen to get below the limit per hour the
measured values should not be larger than 3.8 µSv/h, which they are at the wall closest to the
accelerators. The exact TVL of the heavy concrete used in the shielding is not known and one
source of error in the calculations could be that the used TVL is too low. If the correct TVL is
determined through test measurements the calculated dose could agree with the measured, but
this procedure is too time consuming. Another source of error is the accuracy of
measurements.
Two different survey instruments were used to secure the results for photons and in some
cases they gave different results. The result of the RDS-110 is up to 1 µSv/h larger at the
highest values of the primary walls compared to the DGM-1500. This could be due to that the
RDS-110 manages a smaller energy range than the DGM-1500 and will overestimate the dose
when the energy is higher than 1.3 MeV. The DGM-1500 manages photon energies up to 15
MeV. The measured difference is on the other hand relatively small and even and when the
measured values get lower, both detectors give the same result. The measured values from
both devices can therefore be considered as reliable and the highest values, detected by the
RDS-110, are chosen to be presented in the result.
For the neutron measurements the LB 6411 can only measure in the range from 30 nSv/h
to 100 mSv/h, which makes the measured values of 0.01 and 0.02 µSv/h for the primary walls
somewhat insecure, but it also prove that there is nearly no neutrons present.
Secondary walls
The measured values of the secondary walls for Siemens are below the radiation limits per
week and per hour for both energies and dose rates. But for the Varian accelerators, the
maximal total measured doses are higher than the limit per hour, i.e. the momentary dose rate.
However, as mentioned before, this limit is only a recommendation and no extra shielding is
needed. But one should avoid placing a workplace close to the secondary walls.
In the calculations regarding the radiation protection, the TVL is chosen to be the same as
for the primary walls, even if the TVL is smaller for leakage and scattered radiation and the
thickness of the walls was determined after consideration of the calculated dose per week.
This should provide a good approximation for all rooms, but it is only for the Siemens
37
accelerator that the calculated total dose that corresponds to the measured value. The higher
dose levels at the secondary shielding for the Varian accelerators may be due to that their
treatment head might have poorer radiation shielding than expected, which results in more
scattered radiation reaching the walls. This could also be the reason why lin2 and 3 have
higher neutron levels at the secondary shielding.
For the secondary wall containing the door, the maximum dose is measured where the
door is attached, which is to the right of the door for Siemens and Varian (lin3) and to the left
for Varian (lin2). The door overlaps with the wall at all sides when it is closed and when the
radiation protection shielding goes from door to heavy concrete, the attenuation efficiency
changes and a passage for scattered radiation is created at the outer region of the door, see
figure 4. The side to where the door is attached has higher values because the overlap is
smaller here than on the other side, which needs extra reinforcement due to that it is visible
from isocenter and will be exposed to more radiation.
For Siemens the collimators were closed to check how much they stop the photons and
increase the neutron production. Nearly no photons manage to reach the walls and the neutron
dose stayed almost the same, which shows that the collimators and the accelerator shielding
are very effective.
Two different survey instruments were used to verify the result and the difference
between them was minimal and the measured values can be considered as reliable. The
measured values for neutrons are higher than 30 nSv/h and smaller than 100 mSv/h, which is
the measuring range for Lb 6411, and can also be considered as valid.
Ceiling
The maximal measured dose of the ceiling is 60 µSv/h for the primary shielding and 0.9
µSv/h for the secondary shielding. The measured and estimated values are determined when
the beam is directed towards the ceiling without the presence of a patient that attenuated the
beam, which is very rare situation. Even if the measured value is much lower than the
radiation limits one should keep in mind that this is supposed to be an area where people
should not be located continuously. If the ceiling is used by building workers etc they should
not stay at this location for a longer time because they could be exposed to a too high dose.
Door
The measured values at the gap under the door are below the critical limit per week, but they
are much higher than the recommended limit per hour, i.e. the momentary dose rate.
However, the high dose levels are not a large protection problem because the radiation
limiting values in table 1-2 are for total body protection and there are only the feet and maybe
part of the legs which will be located in the beam under the door gap and the limit for these
parts are 500 mSv/year compared to 5 mSv/year for the total body. There is therefore no need
for extra shielding.
There are two main reasons why one would expect to find the highest dose under the
door; the gap is an open space of approximately 12 mm without radiation protection shielding
and the space is located near the floor where it is easier for photons to pass through to the
other side because it is made of ordinary concrete instead of heavy concrete.
The measurements were performed with two different survey devices (RDS-110 and
DGM-1500) and they gave very different results at the gap under the door. The DGM-1500
has its detecting device closer to the floor than the RDS-110 and will therefore detect more
photons and gives a more correct result. The values from the RDS-110 are presented together

38
with the other results in appendix, but they are not considered as reliable under the door. In all
other measurements the two survey equipments gave nearly the same result.
The neutron detector LB 6411 does not have its detecting device close to the floor and the
measured neutron dose can be considered as slightly too low.
Openings, machine operating desk and adjacent rooms
All the doses at these measuring points are low. The Varian accelerators have higher neutron
doses 1 meter from the openings in the wall close to the ceiling than Siemens. This could be
due to that the gantry of the Varian machines have poorer radiation shielding, which may be
the reason for the secondary walls.
Two different survey instruments were used to secure the result for photons. The
difference between them was minimal and the measured values can be considered as correct.
The detected values for neutrons were sometimes unstable but they were never higher than the
presented data in the result and appendix sections. The results were usually only slightly
higher than 30 nSv/h, which is the lowest detecting value for the Neutron probe, and this is
probably the reason why the detector was little unstable. This proves on the other hand that
there is nearly no neutrons present and that the result can be considered as correct.
Adjacent buildings and skyshine
The measured doses at all floors at the adjacent building and at the ground outside the
treatment rooms are about 0.1 µSv/h, which is the radiation background. The contribution to
the dose from the accelerators are therefore very small.
Field size 15x15 cm
2
This field size will not generate a worst-case scenario because smaller field results in less
scatter and usually less dose, but it is more commonly used than the 40x40 cm2 field and it is
therefore interesting to investigate.
The height of isocenter should have approximately the same dose as a 40x40 cm2 field
and the largest difference should be in the outer region of the field where scattered photons
give rise to higher dose, which is the case here.
The field size 15x15 cm2 will not reach the floor when it is directed towards the primary
walls and therefore the measured effective dose for the junction between the wall and the
floor is lower than for 40x40 cm2. The measured dose will be higher and closer to the
measured value for the larger field if the gantry is directed towards the junction.
The measured doses at the secondary wall containing the door, the gap under and around
the door have approximately the same values as for the field size 40x40 cm2. The collimators
are used to block part of the field to make it smaller, which results in that the accelerator head
generates more scattered radiation which compensates for the smaller field size.
Two different survey instruments were used to secure the results and the difference was
very small and the measured values can therefore be considered as correct.
39
7. Conclusion All the measured values of the radiation shielding are below the critical radiation limits per
week. However, the measured values for momentary dose rate at the gap under the door, at
the height of isocenter at the primary walls and at the side of the secondary wall to where the
door is attached (Varian accelerators) are higher than the recommended limit for areas where
people are located continuously.
Owing to that the radiation protection shielding manages the most critical values per
week and year, no extra shielding is needed. However, one should avoid placing a workplace,
for example a writing desk, close to the secondary and primary walls and the ceiling should
not be used during longtime radiation treatments.
If the accelerators are replaced with accelerators with higher energies, for example 20
MV, a new evaluation of the radiation protection shielding at some points may be needed. The
TVL for photons are nearly the same for 15 and 20 MV and the efficiency of the shielding
will not differ much between the two energies. The increase in the photon energy will on the
other hand generate more photoneutrons with higher energies, but because the radiation
protection shielding contains concrete, the required thickness for photons will be sufficient
even for neutrons. However, the door, which contains other material than concrete, and the
measuring points where the measured doses were close to the radiation limits should be
surveyed.
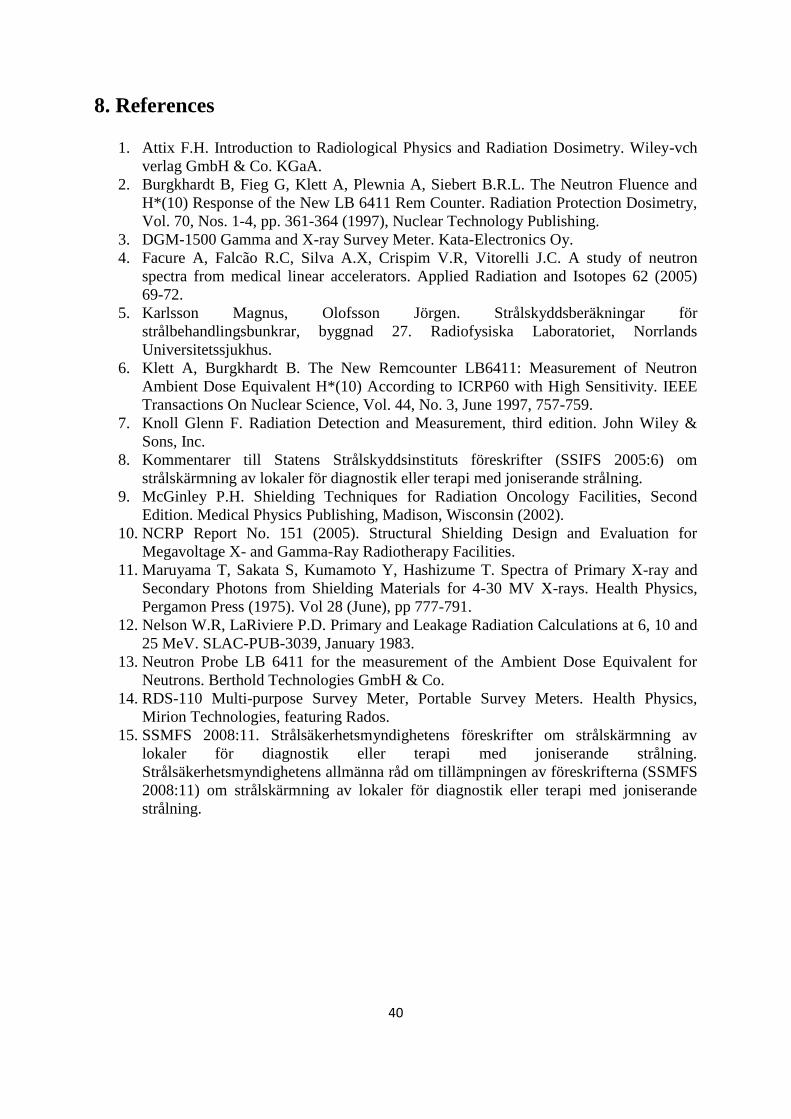
40
8. References
1. Attix F.H. Introduction to Radiological Physics and Radiation Dosimetry. Wiley-vch
verlag GmbH & Co. KGaA.
2. Burgkhardt B, Fieg G, Klett A, Plewnia A, Siebert B.R.L. The Neutron Fluence and
H*(10) Response of the New LB 6411 Rem Counter. Radiation Protection Dosimetry,
Vol. 70, Nos. 1-4, pp. 361-364 (1997), Nuclear Technology Publishing.
3. DGM-1500 Gamma and X-ray Survey Meter. Kata-Electronics Oy.
4. Facure A, Falcão R.C, Silva A.X, Crispim V.R, Vitorelli J.C. A study of neutron
spectra from medical linear accelerators. Applied Radiation and Isotopes 62 (2005)
69-72.
5. Karlsson Magnus, Olofsson Jörgen. Strålskyddsberäkningar för
strålbehandlingsbunkrar, byggnad 27. Radiofysiska Laboratoriet, Norrlands
Universitetssjukhus.
6. Klett A, Burgkhardt B. The New Remcounter LB6411: Measurement of Neutron
Ambient Dose Equivalent H*(10) According to ICRP60 with High Sensitivity. IEEE
Transactions On Nuclear Science, Vol. 44, No. 3, June 1997, 757-759.
7. Knoll Glenn F. Radiation Detection and Measurement, third edition. John Wiley &
Sons, Inc.
8. Kommentarer till Statens Strålskyddsinstituts föreskrifter (SSIFS 2005:6) om
strålskärmning av lokaler för diagnostik eller terapi med joniserande strålning.
9. McGinley P.H. Shielding Techniques for Radiation Oncology Facilities, Second
Edition. Medical Physics Publishing, Madison, Wisconsin (2002).
10. NCRP Report No. 151 (2005). Structural Shielding Design and Evaluation for
Megavoltage X- and Gamma-Ray Radiotherapy Facilities.
11. Maruyama T, Sakata S, Kumamoto Y, Hashizume T. Spectra of Primary X-ray and
Secondary Photons from Shielding Materials for 4-30 MV X-rays. Health Physics,
Pergamon Press (1975). Vol 28 (June), pp 777-791.
12. Nelson W.R, LaRiviere P.D. Primary and Leakage Radiation Calculations at 6, 10 and
25 MeV. SLAC-PUB-3039, January 1983.
13. Neutron Probe LB 6411 for the measurement of the Ambient Dose Equivalent for
Neutrons. Berthold Technologies GmbH & Co.
14. RDS-110 Multi-purpose Survey Meter, Portable Survey Meters. Health Physics,
Mirion Technologies, featuring Rados.
15. SSMFS 2008:11. Strålsäkerhetsmyndighetens föreskrifter om strålskärmning av
lokaler för diagnostik eller terapi med joniserande strålning.
Strålsäkerhetsmyndighetens allmänna råd om tillämpningen av föreskrifterna (SSMFS
2008:11) om strålskärmning av lokaler för diagnostik eller terapi med joniserande
strålning.

41
9. Appendix Table 9. The stated values for the dose rate at isocenter, the workload at isocenter, the use factor for primary and
secondary walls and the occupancy factor for staff of the treatment department, public and ceiling [10]. These
values are used in equation 10 to determine the effective dose rate per week.
𝑫 𝒊𝒔𝒐
(Gy/h)
W
(Gy/week)
U
(primary)
U
(secondary)
T
(staff)
T
(public)
T
(ceiling)
300 800 0.25 1 1 0.20 1/40
9.1. Siemens, Lin1 (photons)
Primary wall (farthest away from the accelerator)
Table 10. Energy 15 MV and dose rate 500 MU/min. The measured effective dose rates 𝐷 (𝑚𝑒𝑎𝑠𝑢𝑟𝑒𝑑) in µSv/h
and the calculated effective dose rates 𝐷 𝑐𝑎𝑙𝑐 in µSv/week for staff of the treatment department and public using
equation 10 and the values in table 9. Two different survey equipments are used; RDS-110 and DGM-1500.
When no detector is specified, the two detectors gave the same result. The background is approximately 0.1-0.15
µSv/h and is included in the values.
15 MV,
500MU/min
𝑫 (measured)
(µSv/h)
𝑫 𝒄𝒂𝒍𝒄 (staff)
(µSv/week)
𝑫 𝒄𝒂𝒍𝒄 (public)
(µSv/week)
Height of isocenter,
max value
RDS-110: 3.0 2.0 0.4
DGM-1500: 2.5 1.7 0.3
Around the height of
isocenter 2.0 1.3 0.3
At the edges 0.3 0.2 0.04
Junction wall-floor,
max value
RDS-110: 4.0 2.7 0.5
DGM-1500: 3.5 2.3 0.5
Junction wall-floor,
average value 1.0 0.7 0.1
Closed collimators 0.1 0.1 0.01
Table 11. Energy 6 MV and dose rate 300 MU/min. The measured effective dose rates 𝐷 (𝑚𝑒𝑎𝑠𝑢𝑟𝑒𝑑) in µSv/h
and the calculated effective dose rates 𝐷 𝑐𝑎𝑙𝑐 in µSv/week for staff of the treatment department and public using
equation 10 and the values in table 9. Two different survey equipments are used; RDS-110 and DGM-1500. When
no detector is specified, the two detectors gave the same result. The background is approximately 0.1-0.15 µSv/h
and is included in the values.
6 MV,
300 MU/min
𝑫 (measured)
(µSv/h)
𝑫 𝒄𝒂𝒍𝒄 (staff)
(µSv/week)
𝑫 𝒄𝒂𝒍𝒄 (public)
(µSv/week)
Height of isocenter 0.2 0.1 0.03
Junction wall-floor 0.2 0.1 0.03

42
Primary wall (closest to the accelerator)
Table 12. Energy 15 MV and dose rate 500 MU/min. The measured effective dose rates 𝐷 (𝑚𝑒𝑎𝑠𝑢𝑟𝑒𝑑) in µSv/h
and the calculated effective dose rates 𝐷 𝑐𝑎𝑙𝑐 in µSv/week for staff of the treatment department and public using
equation 10 and the values in table 9. Two different survey equipments are used; RDS-110 and DGM-1500.
When no detector is specified, the two detectors gave the same result. The background is approximately 0.1-0.15
µSv/h and is included in the values.
15 MV,
500MU/min
𝑫 (measured)
(µSv/h)
𝑫 𝒄𝒂𝒍𝒄 (staff)
(µSv/week)
𝑫 𝒄𝒂𝒍𝒄 (public)
(µSv/week)
Height of isocenter,
max value
RDS-110: 7.0 4.7 0.9
DGM-1500: 6.0 4.0 0.8
Around the height of
isocenter
RDS-110: 5.0 3.3 0.7
DGM-1500: 4.0 2.7 0.5
At the edges 2.0 1.3 0.3
Outside the field 0.2 0.1 0.03
Junction wall-floor,
max value 1.5 1.0 0.2
Closed collimators 0.2 0.1 0.03
Table 13. Energy 6 MV and dose rate 300 MU/min. The measured effective dose rates 𝐷 (𝑚𝑒𝑎𝑠𝑢𝑟𝑒𝑑) in µSv/h
and the calculated effective dose rates 𝐷 𝑐𝑎𝑙𝑐 in µSv/week for staff of the treatment department and public using
equation 10 and the values in table 9. Two different survey equipments are used; RDS-110 and DGM-1500. When
no detector is specified, the two detectors gave the same result. The background is approximately 0.1-0.15 µSv/h
and is included in the values.
6 MV,
300 MU/min
𝑫 (measured)
(µSv/h)
𝑫 𝒄𝒂𝒍𝒄 (staff)
(µSv/week)
𝑫 𝒄𝒂𝒍𝒄 (public)
(µSv/week)
Height of isocenter,
max value 0.3 0.2 0.04
Junction, wall-floor 0.3 0.2 0.04

43
Secondary wall (with door)
Table 14. Energy 15 MV and dose rate 500 MU/min. The measured effective dose rates 𝐷 (𝑚𝑒𝑎𝑠𝑢𝑟𝑒𝑑) in µSv/h
and the calculated effective dose rates 𝐷 𝑐𝑎𝑙𝑐 in µSv/week for staff of the treatment department using equation 10
and the values in table 9. The public is not of interest because they are not allowed to be close to the wall. The
maximum values of the wall are located to the right of the door; otherwise the dose is very low. The closing
direction of the door is to the left. Two different survey equipments are used; RDS-110 and DGM-1500. When no
detector is specified, the two detectors gave the same result. The background is approximately 0.1-0.15 µSv/h and
is included in the values.
15 MV,
500MU/min
𝑫 (measured)
(µSv/h)
𝑫 𝒄𝒂𝒍𝒄 (staff)
(µSv/week)
Gantry angle: 90°
Wall, max value 0.7 1.9
Over the door 0.3 0.8
Gantry angle: 270°
Wall, max value 1.2 3.2
Over the door 0.3 0.8
Gantry angle: 180°
Wall, max value 1.0 2.7
Over the door 0.4 1.1
Gantry angle: 0°
Wall, max value 1.0 2.7
Over the door 0.3 0.8
Table 15. Energy 6 MV and dose rate 300 MU/min. The measured effective dose rates 𝐷 (𝑚𝑒𝑎𝑠𝑢𝑟𝑒𝑑) in µSv/h
and the calculated effective dose rates 𝐷 𝑐𝑎𝑙𝑐 in µSv/week for staff of the treatment department using equation 10
and the values in table 9. The public is not of interest because they are not allowed to be close to the wall. The
maximum values of the wall are located to the right of the door; otherwise the dose is very low. The closing
direction of the door is to the left. Two different survey equipments are used; RDS-110 and DGM-1500. When no
detector is specified, the two detectors gave the same result. The background is approximately 0.1-0.15 µSv/h and
is included in the values.
6 MV,
300 MU/min
𝑫 (measured)
(µSv/h)
𝑫 𝒄𝒂𝒍𝒄 (staff)
(µSv/week)
Gantry angle: 90°
Wall, max value 0.1 0.3
Over the door 0.1 0.3
Gantry angle: 270°
Wall, max value 0.2 0.5
Over the door 0.1 0.3
Gantry angle: 180°
Wall, max value 0.1 0.3
Over the door 0.1 0.3
Gantry angle: 0°
Wall, max value 0.1 0.3
Over the door 0.1 0.3

44
Secondary wall (outside)
Table 16. Energy 15 MV and dose rate 500 MU/min. The measured effective dose rates 𝐷 (𝑚𝑒𝑎𝑠𝑢𝑟𝑒𝑑) in µSv/h
and the calculated effective dose rates 𝐷 𝑐𝑎𝑙𝑐 in µSv/week for staff of the treatment department and public using
equation 10 and the values in table 9. The measured values for 15 MV are small and therefore the values for 6
MV will not be checked. Two different survey equipments are used; RDS-110 and DGM-1500. When no detector
is specified, the two detectors gave the same result. The background is approximately 0.1-0.15 µSv/h and is
included in the values.
15 MV,
500MU/min
𝑫 (measured)
(µSv/h)
𝑫 𝒄𝒂𝒍𝒄 (staff)
(µSv/week)
𝑫 𝒄𝒂𝒍𝒄 (public)
(µSv/week)
Gantry angle: 90° 0.1 0.3 0.1
Gantry angle: 270° 0.2 0.5 0.1
Gantry angle: 180° 0.1 0.3 0.1
Gantry angle: 0° 0.1 0.3 0.1
Door
Table 17. Energy 15 MV and dose rate 500 MU/min. The measured effective dose rates 𝐷 (𝑚𝑒𝑎𝑠𝑢𝑟𝑒𝑑) in µSv/h
and the calculated effective dose rates 𝐷 𝑐𝑎𝑙𝑐 in µSv/week for staff of the treatment department using equation 10
and the values in table 9. The public is not if interest because they are not allowed to be close to the door. The
maximum measured values under the door are located in the middle of the gap and slightly to the right. Two
different survey equipments are used; RDS-110 and DGM-1500. When no detector is specified, the two detectors
gave the same result. The background is approximately 0.1-0.15 µSv/h and is included in the values.
15 MV,
500MU/min
𝑫 (measured)
(µSv/h)
𝑫 𝒄𝒂𝒍𝒄 (staff)
(µSv/week)
Gantry angle: 90°
Door gap 0.1 0.3
Gap under door,
max value
RDS-110: 7.0 18.7
DGM-1500: 14.0 37.3
Gap under door,
average value
RDS-110: 4.5 12.0
DGM-1500: 9.0 24.0
30 cm from door,
at floor (max)
RDS-110: 6.0 16.0
DGM-1500: 10.0 26.7
In front of the door 0.2 0.5
Gantry angle: 270°
Door gap 0.2 0.5
Gap under door,
max value
RDS-110: 5.0 13.3
DGM-1500: 11.0 29.3
Gap under door,
average value
RDS-110: 4.0 10.7
DGM-1500: 8.0 21.3
30 cm from door,
at floor (max)
RDS-110: 5.0 13.3
DGM-1500: 8.0 21.3
In front of the door 0.3 0.8

45
Gantry angle: 180°
Door gap 0.3 0.8
Gap under door,
max value
RDS-110: 5.0 13.3
DGM-1500: 10.0 26.7
Gap under door,
average value
RDS-110: 3.0 8.0
DGM-1500: 7.0 18.7
30 cm from door,
at floor (max)
RDS-110: 6.0 16.0
DGM-1500: 10.0 26.7
In front of the door 0.2 0.5
Gantry angle: 0°
Door gap 0.2 0.5
Gap under door,
max value
RDS-110: 6.0 16.0
DGM-1500: 16.0 42.7
Gap under door,
average value
RDS-110: 4.0 10.7
DGM-1500: 10.0 26.7
30 cm from door,
at floor (max)
RDS-110: 6.0 16.0
DGM-1500: 12.0 32.0
In front of the door 0.2 0.5
Table 18. Energy 6 MV and dose rate 300 MU/min. The measured effective dose rates 𝐷 (𝑚𝑒𝑎𝑠𝑢𝑟𝑒𝑑) in µSv/h
and the calculated effective dose rates 𝐷 𝑐𝑎𝑙𝑐 in µSv/week for staff of the treatment department using equation 10
and the values in table 9. The public is not of interest because they are not allowed to be close to the door. The
maximum measured values under the door are located in the middle of the gap and slightly to the right. Two
different survey equipments are used; RDS-110 and DGM-1500. When no detector is specified, the two detectors
gave the same result. The background is approximately 0.1-0.15 µSv/h and is included in the values.
6 MV,
300 MU/min
𝑫 (measured)
(µSv/h)
𝑫 𝒄𝒂𝒍𝒄 (staff)
(µSv/week)
Gantry angle: 90°
Door gap 0.1 0.3
Under door,
max value
RDS-110: 2.0 5.3
DGM-1500: 5.0 13.3
Under door,
average value
RDS-110: 1.5 4.0
DGM-1500: 4.0 10.7
30 cm from door,
at floor (max)
RDS-110: 3.0 8.0
DGM-1500: 5.0 13.3
In front of the door 0.1 0.3

46
Gantry angle: 270°
Door gap 0.1 0.3
Under door,
max value
RDS-110: 2.0 5.3
DGM-1500: 4.0 10.7
Under door,
average value
RDS-110: 1.5 4.0
DGM-1500: 2.5 6.7
30 cm from door,
at floor (max)
RDS-110: 2.0 5.3
DGM-1500: 4.0 10.7
In front of the door 0.1 0.3
Gantry angle: 180°
Door gap 0.2 0.5
Under door,
max value
RDS-110: 2.0 5.3
DGM-1500: 4.0 10.7
Under door,
average value
RDS-110: 1.5 4.0
DGM-1500: 3.0 8.0
30 cm from door,
at floor (max)
RDS-110: 3.0 8.0
DGM-1500: 4.0 10.7
In front of the door 0.2 0.5
Gantry angle: 0°
Door gap 0.2 0.5
Under door,
max value
RDS-110: 3.0 8.0
DGM-1500: 7.0 18.7
Under door,
average value
RDS-110: 2.0 5.3
DGM-1500: 4.5 12.0
30 cm from door,
at floor (max)
RDS-110: 3.0 8.0
DGM-1500: 5.0 13.3
In front of the door 0.2 0.5
Openings
Table 19. Energy 15 MV and dose rate 500 MU/min. The measured effective dose rates 𝐷 (𝑚𝑒𝑎𝑠𝑢𝑟𝑒𝑑) in µSv/h
and the calculated effective dose rates 𝐷 𝑐𝑎𝑙𝑐 in µSv/week for staff of the treatment department and public using
equation 10 and the values in table 9. Two different survey equipments are used; RDS-110 and DGM-1500.
When no detector is specified, the two detectors gave the same result. The values of 15 MV are very low and the
values for 6 MV are not investigated. The background is approximately 0.1-0.15 µSv/h and is included in the
values.
15 MV,
500MU/min
𝑫 (measured)
(µSv/h)
𝑫 𝒄𝒂𝒍𝒄 (staff)
(µSv/week)
𝑫 𝒄𝒂𝒍𝒄 (public)
(µSv/week)
Gantry angle: 90°
Holes for cables 0.2 0.5 0.1
Cooling pipes 0.2 0.5 0.1
Gantry angle: 270°
Holes for cables 0.3 0.8 0.2
Cooling pipes 0.4 1.1 0.2

47
Gantry angle: 180°
Holes for cables 0.2 0.5 0.1
Cooling pipes 0.2 0.5 0.1
Gantry angle: 0°
Holes for cables 0.3 0.8 0.2
Cooling pipes 0.2 0.5 0.1
Machine operating station and adjacent rooms
Table 20. Energy 15 MV and dose rate 500 MU/min. The measured effective dose rates 𝐷 (𝑚𝑒𝑎𝑠𝑢𝑟𝑒𝑑) in µSv/h
and the calculated effective dose rates 𝐷 𝑐𝑎𝑙𝑐 in µSv/week for staff of the treatment department and public using
equation 10 and the values in table 9. Two different survey equipments are used; RDS-110 and DGM-1500.
When no detector is specified, the two detectors gave the same result. The background is approximately 0.1-0.15
µSv/h and is included in the values.
15 MV,
500MU/min
𝑫 (measured)
(µSv/h)
𝑫 𝒄𝒂𝒍𝒄 (staff)
(µSv/week)
𝑫 𝒄𝒂𝒍𝒄 (public)
(µSv/week)
Gantry angle: 90°
Machine operating
station 0.2 0.5 0.1
Adjacent rooms 0.2 0.5 0.1
Gantry angle: 270°
Machine operating
station 0.2 0.5 0.1
Adjacent rooms 0.2 0.5 0.1
Gantry angle: 180°
Machine operating
station 0.1 0.3 0.1
Adjacent rooms 0.1 0.3 0.1
Gantry angle: 0°
Machine operating
station 0.2 0.5 0.1
Adjacent rooms 0.2 0.5 0.1
Gantry angle: 90°, no phantom
Machine operating
station 0.2 0.5 0.1
Adjacent rooms, max
value 0.7 1.9 0.4
Adjacent rooms,
average value 0.2 0.5 0.1
Gantry angle: 270°, no phantom
Machine operating
station 0.2 0.5 0.1
Adjacent rooms 0.2 0.5 0.1
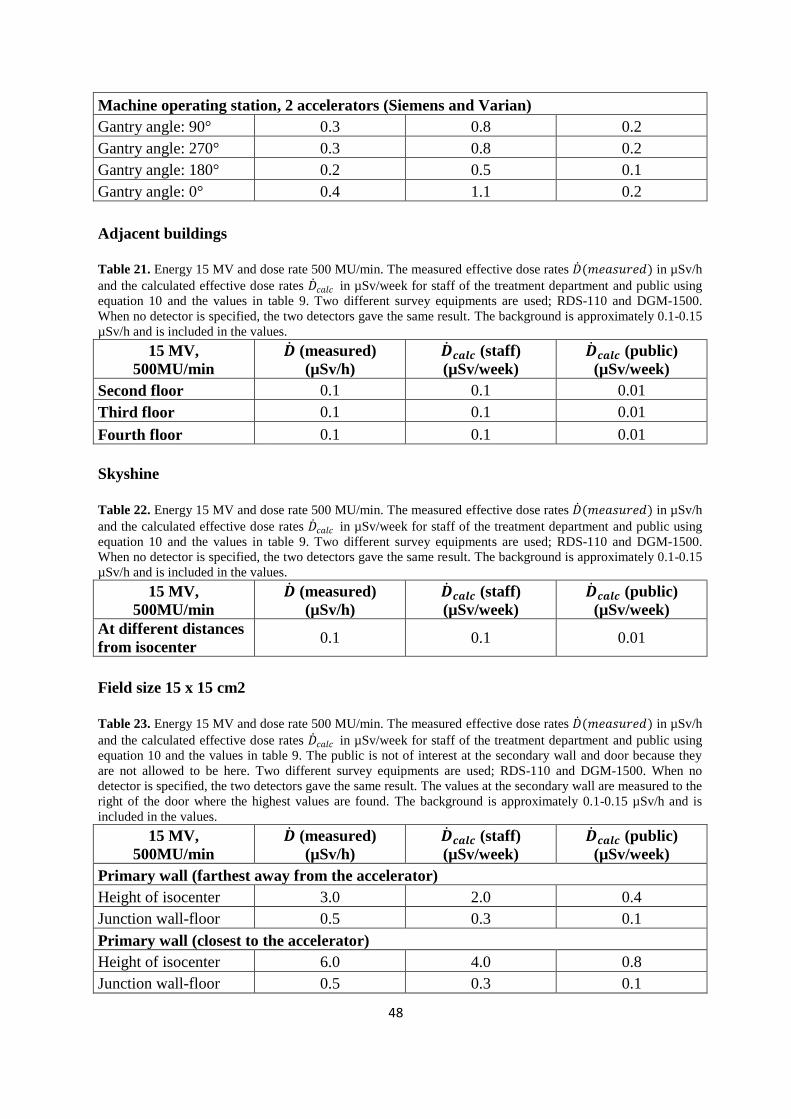
48
Machine operating station, 2 accelerators (Siemens and Varian)
Gantry angle: 90° 0.3 0.8 0.2
Gantry angle: 270° 0.3 0.8 0.2
Gantry angle: 180° 0.2 0.5 0.1
Gantry angle: 0° 0.4 1.1 0.2
Adjacent buildings Table 21. Energy 15 MV and dose rate 500 MU/min. The measured effective dose rates 𝐷 (𝑚𝑒𝑎𝑠𝑢𝑟𝑒𝑑) in µSv/h
and the calculated effective dose rates 𝐷 𝑐𝑎𝑙𝑐 in µSv/week for staff of the treatment department and public using
equation 10 and the values in table 9. Two different survey equipments are used; RDS-110 and DGM-1500.
When no detector is specified, the two detectors gave the same result. The background is approximately 0.1-0.15
µSv/h and is included in the values.
15 MV,
500MU/min
𝑫 (measured)
(µSv/h)
𝑫 𝒄𝒂𝒍𝒄 (staff)
(µSv/week)
𝑫 𝒄𝒂𝒍𝒄 (public)
(µSv/week)
Second floor 0.1 0.1 0.01
Third floor 0.1 0.1 0.01
Fourth floor 0.1 0.1 0.01
Skyshine
Table 22. Energy 15 MV and dose rate 500 MU/min. The measured effective dose rates 𝐷 (𝑚𝑒𝑎𝑠𝑢𝑟𝑒𝑑) in µSv/h
and the calculated effective dose rates 𝐷 𝑐𝑎𝑙𝑐 in µSv/week for staff of the treatment department and public using
equation 10 and the values in table 9. Two different survey equipments are used; RDS-110 and DGM-1500.
When no detector is specified, the two detectors gave the same result. The background is approximately 0.1-0.15
µSv/h and is included in the values.
15 MV,
500MU/min
𝑫 (measured)
(µSv/h)
𝑫 𝒄𝒂𝒍𝒄 (staff)
(µSv/week)
𝑫 𝒄𝒂𝒍𝒄 (public)
(µSv/week)
At different distances
from isocenter 0.1 0.1 0.01
Field size 15 x 15 cm2
Table 23. Energy 15 MV and dose rate 500 MU/min. The measured effective dose rates 𝐷 (𝑚𝑒𝑎𝑠𝑢𝑟𝑒𝑑) in µSv/h
and the calculated effective dose rates 𝐷 𝑐𝑎𝑙𝑐 in µSv/week for staff of the treatment department and public using
equation 10 and the values in table 9. The public is not of interest at the secondary wall and door because they
are not allowed to be here. Two different survey equipments are used; RDS-110 and DGM-1500. When no
detector is specified, the two detectors gave the same result. The values at the secondary wall are measured to the
right of the door where the highest values are found. The background is approximately 0.1-0.15 µSv/h and is
included in the values.
15 MV,
500MU/min
𝑫 (measured)
(µSv/h)
𝑫 𝒄𝒂𝒍𝒄 (staff)
(µSv/week)
𝑫 𝒄𝒂𝒍𝒄 (public)
(µSv/week)
Primary wall (farthest away from the accelerator)
Height of isocenter 3.0 2.0 0.4
Junction wall-floor 0.5 0.3 0.1
Primary wall (closest to the accelerator)
Height of isocenter 6.0 4.0 0.8
Junction wall-floor 0.5 0.3 0.1
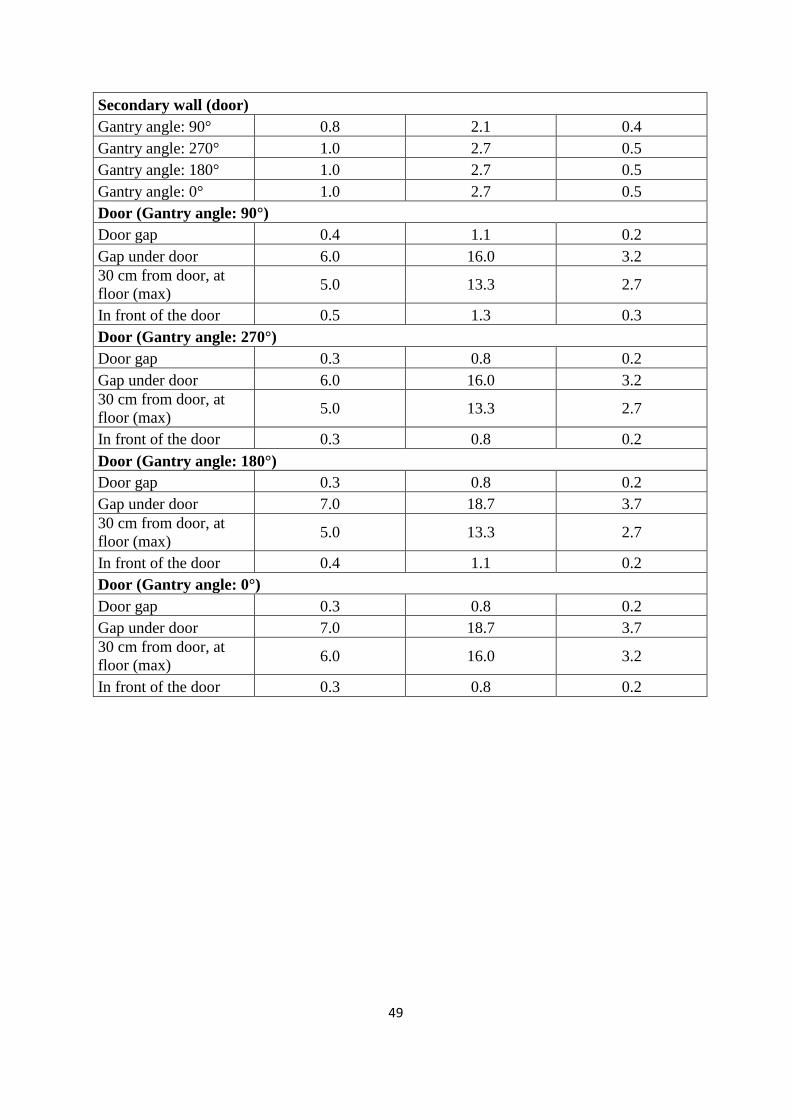
49
Secondary wall (door)
Gantry angle: 90° 0.8 2.1 0.4
Gantry angle: 270° 1.0 2.7 0.5
Gantry angle: 180° 1.0 2.7 0.5
Gantry angle: 0° 1.0 2.7 0.5
Door (Gantry angle: 90°)
Door gap 0.4 1.1 0.2
Gap under door 6.0 16.0 3.2
30 cm from door, at
floor (max) 5.0 13.3 2.7
In front of the door 0.5 1.3 0.3
Door (Gantry angle: 270°)
Door gap 0.3 0.8 0.2
Gap under door 6.0 16.0 3.2
30 cm from door, at
floor (max) 5.0 13.3 2.7
In front of the door 0.3 0.8 0.2
Door (Gantry angle: 180°)
Door gap 0.3 0.8 0.2
Gap under door 7.0 18.7 3.7
30 cm from door, at
floor (max) 5.0 13.3 2.7
In front of the door 0.4 1.1 0.2
Door (Gantry angle: 0°)
Door gap 0.3 0.8 0.2
Gap under door 7.0 18.7 3.7
30 cm from door, at
floor (max) 6.0 16.0 3.2
In front of the door 0.3 0.8 0.2

50
9.2. Siemens, Lin1 (neutrons)
Primary walls
Table 24. Energy 15 MV and dose rate 500 MU/min. The measured effective dose rates 𝐷 (𝑚𝑒𝑎𝑠𝑢𝑟𝑒𝑑) in µSv/h
and the calculated effective dose rates 𝐷 𝑐𝑎𝑙𝑐 in µSv/week for staff of the treatment department and public using
equation 10 and the values in table 9. The background is approximately 0.1-0.15 µSv/h and is included in the
values.
15 MV,
500MU/min
𝑫 (measured)
(µSv/h)
𝑫 𝒄𝒂𝒍𝒄 (staff)
(µSv/week)
𝑫 𝒄𝒂𝒍𝒄 (public)
(µSv/week)
Primary wall
(farthest away from the accelerator) 0.01 0.01 0.0
Primary wall
(closest to the accelerator) 0.02 0.01 0.0
Secondary wall (with door)
Table 25. Energy 15 MV and dose rate 500 MU/min. The measured effective dose rates 𝐷 (𝑚𝑒𝑎𝑠𝑢𝑟𝑒𝑑) in µSv/h
and the calculated effective dose rates 𝐷 𝑐𝑎𝑙𝑐 in µSv/week for staff of the treatment department using equation 10
and the values in table 9. The public is not of interest because they are not allowed to be close to the wall. The
closing direction of the door is to the left. The background is approximately 0.1-0.15 µSv/h and is included in the
values.
15 MV,
500MU/min
𝑫 (measured)
(µSv/h)
𝑫 𝒄𝒂𝒍𝒄 (staff)
(µSv/week)
Gantry angle: 90°
Wall, left of door 0.1 0.3
Wall, right of door 0.7 1.9
Gantry angle: 270°
Wall, left of door 0.2 0.5
Wall, right of door 0.7 1.9
Gantry angle: 180°
Wall, left of door 0.1 0.3
Wall, right of door 0.5 1.3
Gantry angle: 0°
Wall, left of door 0.2 0.5
Wall, right of door 0.5 1.3

51
Secondary wall (outside)
Table 26. Energy 15 MV and dose rate 500 MU/min. The measured effective dose rates 𝐷 (𝑚𝑒𝑎𝑠𝑢𝑟𝑒𝑑) in µSv/h
and the calculated effective dose rates 𝐷 𝑐𝑎𝑙𝑐 in µSv/week for staff of the treatment department and public using
equation 10 and the values in table 9. The background is approximately 0.1-0.15 µSv/h and is included in the
values.
15 MV,
500MU/min
𝑫 (measured)
(µSv/h)
𝑫 𝒄𝒂𝒍𝒄 (staff)
(µSv/week)
𝑫 𝒄𝒂𝒍𝒄 (public)
(µSv/week)
Gantry angle: 90° 0.03 0.1 0.02
Gantry angle: 270° 0.03 0.1 0.02
Gantry angle: 180° 0.05 0.1 0.03
Gantry angle: 0° 0.04 0.1 0.02
Door
Table 27. Energy 15 MV and dose rate 500 MU/min. The measured effective dose rates 𝐷 (𝑚𝑒𝑎𝑠𝑢𝑟𝑒𝑑) in µSv/h
and the calculated effective dose rates 𝐷 𝑐𝑎𝑙𝑐 in µSv/week for staff of the treatment department using equation 10
and the values in table 9. The public is not of interest because they are not allowed to be close to the door. The
maximum measured values under the door are located in the middle of the gap. The background is approximately
0.1-0.15 µSv/h and is included in the values.
15 MV,
500MU/min
𝑫 (measured)
(µSv/h)
𝑫 𝒄𝒂𝒍𝒄 (staff)
(µSv/week)
Gantry angle: 90°
In front of door 0.1 0.3
Gap under door 0.4 1.1
Gantry angle: 270°
In front of door 0.2 0.5
Gap under door 0.6 1.6
Gantry angle: 180°
In front of door 0.1 0.3
Gap under door 0.8 2.1
Gantry angle: 0°
In front of door 0.1 0.3
Gap under door 0.8 2.1
Openings
Table 28. Energy 15 MV and dose rate 500 MU/min. The measured effective dose rates 𝐷 (𝑚𝑒𝑎𝑠𝑢𝑟𝑒𝑑) in µSv/h
and the calculated effective dose rates 𝐷 𝑐𝑎𝑙𝑐 in µSv/week for staff of the treatment department and public using
equation 10 and the values in table 9. The cooling pipes are located over the door and the cables to the right of the
door in the ceiling. The values are measured approximately 1 m from the openings. The background is
approximately 0.1-0.15 µSv/h and is included in the values.
15 MV,
500MU/min
𝑫 (measured)
(µSv/h)
𝑫 𝒄𝒂𝒍𝒄 (staff)
(µSv/week)
𝑫 𝒄𝒂𝒍𝒄 (public)
(µSv/week)
Gantry angle: 90°
Cooling pipes 0.1 0.3 0.1
Holes for cables 0.3 0.8 0.2

52
Gantry angle: 270°
Cooling pipes 0.4 1.1 0.2
Holes for cables 0.2 0.5 0.1
Gantry angle: 180°
Cooling pipes 0.2 0.5 0.1
Holes for cables 0.2 0.5 0.1
Gantry angle: 0°
Cooling pipes 0.4 1.1 0.2
Holes for cables 0.2 0.5 0.1
Machine operating station and adjacent rooms
Table 29. Energy 15 MV and dose rate 500 MU/min. The measured effective dose rates 𝐷 (𝑚𝑒𝑎𝑠𝑢𝑟𝑒𝑑) in µSv/h
and the calculated effective dose rates 𝐷 𝑐𝑎𝑙𝑐 in µSv/week for staff of the treatment department and public using
equation 10 and the values in table 9. The background is approximately 0.1-0.15 µSv/h and is included in the
values.
15 MV,
500MU/min
𝑫 (measured)
(µSv/h)
𝑫 𝒄𝒂𝒍𝒄 (staff)
(µSv/week)
𝑫 𝒄𝒂𝒍𝒄 (public)
(µSv/week)
Gantry angle: 90°
Machine operating
station 0.1 0.3 0.1
Adjacent rooms 0.1 0.3 0.1
Gantry angle: 270°
Machine operating
station 0.04 0.1 0.02
Adjacent rooms 0.1 0.3 0.1
Gantry angle: 180°
Machine operating
station 0.1 0.3 0.1
Adjacent rooms 0.1 0.3 0.1
Gantry angle: 0°
Machine operating
station 0.1 0.3 0.1
Adjacent rooms 0.04 0.1 0.02

53
9.3. Varian, Lin2 (photons)
Primary wall (farthest away from the accelerator)
Table 30. Energy 15 MV and dose rate 500 MU/min. The measured effective dose rates 𝐷 (𝑚𝑒𝑎𝑠𝑢𝑟𝑒𝑑) in µSv/h
and the calculated effective dose rates 𝐷 𝑐𝑎𝑙𝑐 in µSv/week for staff of the treatment department and public using
equation 10 and the values in table 9. Two different survey equipments are used; RDS-110 and DGM-1500. When
no detector is specified, the two detectors gave the same result. The background is approximately 0.1-0.15 µSv/h
and is included in the values.
15 MV,
500MU/min
𝑫 (measured)
(µSv/h)
𝑫 𝒄𝒂𝒍𝒄 (staff)
(µSv/week)
𝑫 𝒄𝒂𝒍𝒄 (public)
(µSv/week)
Height of isocenter,
max value 1.5 1.0 0.2
Primary wall (closest to the accelerator)
Table 31. Energy 15 MV and dose rate 500 MU/min. The measured effective dose rates 𝐷 (𝑚𝑒𝑎𝑠𝑢𝑟𝑒𝑑) in µSv/h
and the calculated effective dose rates 𝐷 𝑐𝑎𝑙𝑐 in µSv/week for staff of the treatment department and public using
equation 10 and the values in table 9. Two different survey equipments are used; RDS-110 and DGM-1500. When
no detector is specified, the two detectors gave the same result. The background is approximately 0.1-0.15 µSv/h
and is included in the values.
15 MV,
500MU/min
𝑫 (measured)
(µSv/h)
𝑫 𝒄𝒂𝒍𝒄 (staff)
(µSv/week)
𝑫 𝒄𝒂𝒍𝒄 (public)
(µSv/week)
Height of isocenter,
max value
RDS-110: 8.0 5.3 1.1
DGM-1500: 7.0 4.7 0.9
Around the height of
isocenter 5.0 3.3 0.7
At the edges 2.0 1.3 0.3
Junction wall-floor
RDS-110: 2.5 1.7 0.3
DGM-1500: 2.0 1.3 0.3
Outside the field 0.7 0.5 0.1
Secondary wall (with door)
Table 32. Energy 15 MV and dose rate 500 MU/min. The measured effective dose rates 𝐷 (𝑚𝑒𝑎𝑠𝑢𝑟𝑒𝑑) in µSv/h
and the calculated effective dose rates 𝐷 𝑐𝑎𝑙𝑐 in µSv/week for staff of the treatment department using equation 10
and the values in table 9. The public is not of interest because they are not allowed to be close to the wall. The
maximal value is located to the left of the door. The closing direction of the door is to the right. Two different
survey equipments are used; RDS-110 and DGM-1500. When no detector is specified, the two detectors gave the
same result. The background is approximately 0.1-0.15 µSv/h and is included in the values.
15 MV,
500MU/min
𝑫 (measured)
(µSv/h)
𝑫 𝒄𝒂𝒍𝒄 (staff)
(µSv/week)
Gantry angle: 270°
Wall, left of door 2.5 6.7
Wall, right of door 0.4 1.1
Gantry angle: 90°
Wall, left of door 3.0 8.0
Wall, right of door 0.4 1.1

54
Gantry angle: 180°
Wall, left of door 2.5 6.7
Wall, right of door 0.3 0.8
Gantry angle: 0°
Wall, left of door 3.0 8.0
Wall, right of door 0.3 0.8
Secondary wall (outside)
Table 33. Energy 15 MV and dose rate 500 MU/min. The measured effective dose rates 𝐷 (𝑚𝑒𝑎𝑠𝑢𝑟𝑒𝑑) in µSv/h
and the calculated effective dose rates 𝐷 𝑐𝑎𝑙𝑐 in µSv/week for staff of the treatment department and public using
equation 10 and the values in table 9. Two different survey equipment were used; RDS-110 and DGM-1500.
When no detector is specified, the two detectors gave the same result. The background is approximately 0.1-0.15
µSv/h and is included in the values.
15 MV,
500MU/min
𝑫 (measured)
(µSv/h)
𝑫 𝒄𝒂𝒍𝒄 (staff)
(µSv/week)
𝑫 𝒄𝒂𝒍𝒄 (public)
(µSv/week)
Gantry angle: 90° 0.2 0.5 0.1
Gantry angle: 270° 0.2 0.5 0.1
Gantry angle: 180° 0.2 0.5 0.1
Gantry angle: 0° 0.2 0.5 0.1
Ceiling
Table 34. Energy 15 MV and dose rate 500 MU/min. The measured effective dose rates 𝐷 (𝑚𝑒𝑎𝑠𝑢𝑟𝑒𝑑) in µSv/h
and the calculated effective dose rates 𝐷 𝑐𝑎𝑙𝑐 in µSv/week for ceiling using equation 10 and the values in table 9.
Two different survey equipments are used; RDS-110 and DGM-1500. When no detector is specified, the two
detectors gave the same result. The dose is very small closest to the windows of the adjacent building. The
background is approximately 0.1-0.15 µSv/h and is included in the values.
15 MV,
500MU/min
𝑫 (measured)
(µSv/h)
𝑫 𝒄𝒂𝒍𝒄 (ceiling)
(µSv/week)
Primary shielding, max 60.0 1.0
Junction primary-secondary shielding 0.2 0.0
Secondary shielding,
near adjacent building 0.9 0.1
Secondary shielding,
near the fore-edge 0.5 0.03

55
Door
Table 35. Energy 15 MV and dose rate 500 MU/min. The measured effective dose rates 𝐷 (𝑚𝑒𝑎𝑠𝑢𝑟𝑒𝑑) in µSv/h
and the calculated effective dose rates 𝐷 𝑐𝑎𝑙𝑐 in µSv/week for staff of the treatment department using equation 10
and the values in table 9. The public is not of interest because they are not allowed to be close to the door. The
maximum measured values under the door are located in the middle of the gap and slightly to the right. Two
different survey equipments are used; RDS-110 and DGM-1500. When no detector is specified, the two detectors
gave the same result. The background is approximately 0.1-0.15 µSv/h and is included in the values.
15 MV,
500MU/min
𝑫 (measured)
(µSv/h)
𝑫 𝒄𝒂𝒍𝒄 (staff)
(µSv/week)
Gantry angle: 90°
Door gap 0.4 1.1
Gap under door,
max value DGM-1500: 13.0 34.7
Gap under door,
average value DGM-1500: 8.6 22.9
30 cm from door,
at floor (max) DGM-1500: 9.0 24.0
In front of the door 0.4 1.1
Gantry angle: 270°
Door gap 0.3 0.8
Gap under door,
max value DGM-1500: 15.0 40.0
Gap under door,
average value DGM-1500: 10.5 28.0
30 cm from door,
at floor (max) DGM-1500: 13.0 34.7
In front of the door 0.4 1.1
Gantry angle: 180°
Door gap 0.3 0.8
Gap under door,
max value DGM-1500: 14.0 37.3
Gap under door,
average value DGM-1500: 10.7 28.5
30 cm from door,
at floor (max) DGM-1500: 10.0 26.7
In front of the door 0.3 0.8
Gantry angle: 0°
Door gap 0.3 0.8
Gap under door,
max value DGM-1500: 17.0 45.3
Gap under door,
average value DGM-1500: 11.3 30.1
30 cm from door,
at floor (max) DGM-1500: 15.0 40.0
In front of the door 0.3 0.8

56
Openings
Table 36. Energy 15 MV and dose rate 500 MU/min. The measured effective dose rates 𝐷 (𝑚𝑒𝑎𝑠𝑢𝑟𝑒𝑑) in µSv/h
and the calculated effective dose rates 𝐷 𝑐𝑎𝑙𝑐 in µSv/week for staff of the treatment department and public using
equation 10 and the values in table 9. The cooling pipes are located over the door and the cables to the right of the
door in the ceiling. Two different survey equipments are used; RDS-110 and DGM-1500. When no detector is
specified, the two detectors gave the same result. The background is approximately 0.1-0.15 µSv/h and is
included in the values.
15 MV,
500MU/min
𝑫 (measured)
(µSv/h)
𝑫 𝒄𝒂𝒍𝒄 (staff)
(µSv/week)
𝑫 𝒄𝒂𝒍𝒄 (public)
(µSv/week)
Gantry angle: 90°
Holes for cables 0.7 1.9 0.4
Cooling pipes 0.7 1.9 0.4
Gantry angle: 270°
Holes for cables 0.2 0.5 0.1
Cooling pipes 0.2 0.5 0.1
Gantry angle: 180°
Holes for cables 0.7 1.9 0.4
Cooling pipes 0.7 1.9 0.4
Gantry angle: 0°
Holes for cables 0.3 0.8 0.2
Cooling pipes 0.3 0.8 0.2
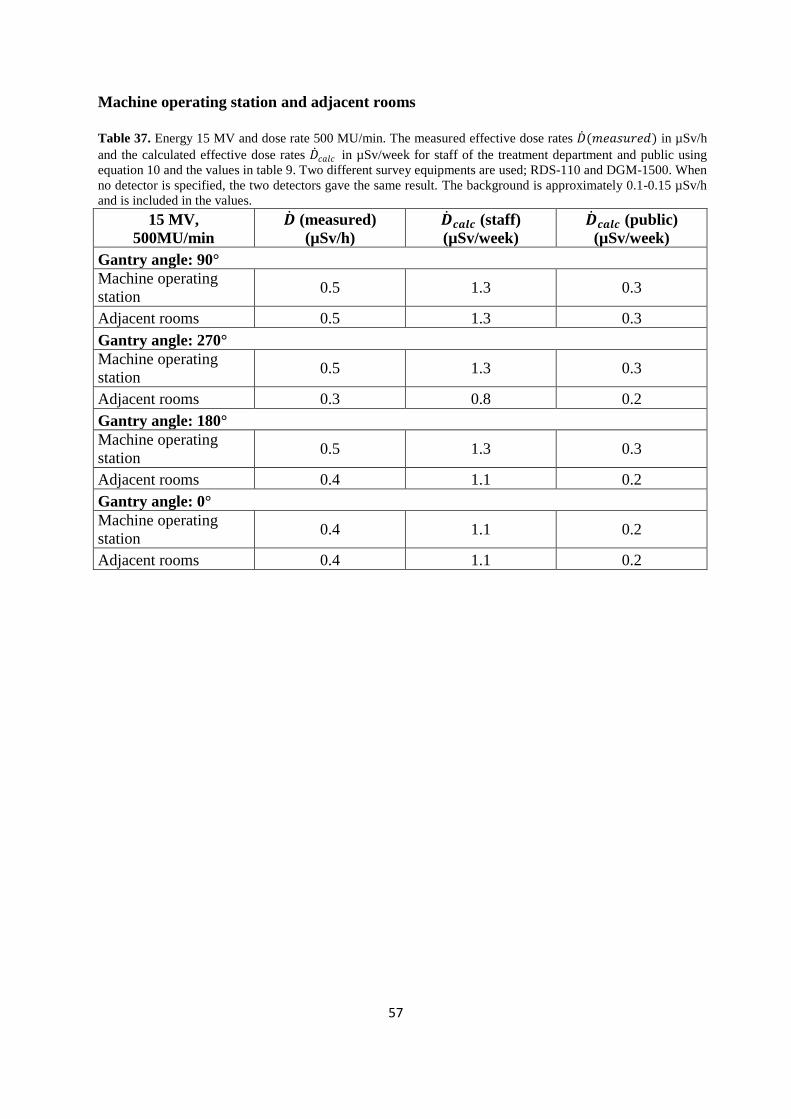
57
Machine operating station and adjacent rooms
Table 37. Energy 15 MV and dose rate 500 MU/min. The measured effective dose rates 𝐷 (𝑚𝑒𝑎𝑠𝑢𝑟𝑒𝑑) in µSv/h
and the calculated effective dose rates 𝐷 𝑐𝑎𝑙𝑐 in µSv/week for staff of the treatment department and public using
equation 10 and the values in table 9. Two different survey equipments are used; RDS-110 and DGM-1500. When
no detector is specified, the two detectors gave the same result. The background is approximately 0.1-0.15 µSv/h
and is included in the values.
15 MV,
500MU/min
𝑫 (measured)
(µSv/h)
𝑫 𝒄𝒂𝒍𝒄 (staff)
(µSv/week)
𝑫 𝒄𝒂𝒍𝒄 (public)
(µSv/week)
Gantry angle: 90°
Machine operating
station 0.5 1.3 0.3
Adjacent rooms 0.5 1.3 0.3
Gantry angle: 270°
Machine operating
station 0.5 1.3 0.3
Adjacent rooms 0.3 0.8 0.2
Gantry angle: 180°
Machine operating
station 0.5 1.3 0.3
Adjacent rooms 0.4 1.1 0.2
Gantry angle: 0°
Machine operating
station 0.4 1.1 0.2
Adjacent rooms 0.4 1.1 0.2

58
9.4. Varian, Lin2 (neutrons)
Primary walls
Table 38. Energy 15 MV and dose rate 500 MU/min. The measured effective dose rates 𝐷 (𝑚𝑒𝑎𝑠𝑢𝑟𝑒𝑑) in µSv/h
and the calculated effective dose rates 𝐷 𝑐𝑎𝑙𝑐 in µSv/week for staff of the treatment department and public using
equation 10 and the values in table 9. The background is approximately 0.1-0.15 µSv/h and is included in the
values.
15 MV,
500MU/min
𝑫 (measured)
(µSv/h)
𝑫 𝒄𝒂𝒍𝒄 (staff)
(µSv/week)
𝑫 𝒄𝒂𝒍𝒄 (public)
(µSv/week)
Primary wall
(farthest away from the accelerator) 0.01 0.01 0.0
Primary wall
(closest to the accelerator) 0.03 0.02 0.0
Secondary wall (with door)
Table 39. Energy 15 MV and dose rate 500 MU/min. The measured effective dose rates 𝐷 (𝑚𝑒𝑎𝑠𝑢𝑟𝑒𝑑) in µSv/h
and the calculated effective dose rates 𝐷 𝑐𝑎𝑙𝑐 in µSv/week for staff of the treatment department using equation 10
and the values in table 9. The public is not of interest because they are not allowed to be close to the wall. The
closing direction of the door is to the right. The background is approximately 0.1-0.15 µSv/h and is included in the
values.
15 MV,
500MU/min
𝑫 (measured)
(µSv/h)
𝑫 𝒄𝒂𝒍𝒄 (staff)
(µSv/week)
Gantry angle: 90°
Wall, left of door 2.0 5.3
Wall, right of door 0.4 1.1
Gantry angle: 270°
Wall, left of door 1.4 3.7
Wall, right of door 0.2 0.5
Gantry angle: 180°
Wall, left of door 1.4 3.7
Wall, right of door 0.4 1.1
Gantry angle: 0°
Wall, left of door 1.6 4.3
Wall, right of door 0.4 1.1

59
Secondary wall (outside)
Table 40. Energy 15 MV and dose rate 500 MU/min. The measured effective dose rates 𝐷 (𝑚𝑒𝑎𝑠𝑢𝑟𝑒𝑑) in µSv/h
and the calculated effective dose rates 𝐷 𝑐𝑎𝑙𝑐 in µSv/week for staff of the treatment department and public using
equation 10 and the values in table 9. The background is approximately 0.1-0.15 µSv/h and is included in the
values.
15 MV,
500MU/min
𝑫 (measured)
(µSv/h)
𝑫 𝒄𝒂𝒍𝒄 (staff)
(µSv/week)
𝑫 𝒄𝒂𝒍𝒄 (public)
(µSv/week)
Gantry angle: 90° 0.02 0.1 0.01
Gantry angle: 270° 0.02 0.1 0.01
Gantry angle: 180° 0.01 0.03 0.01
Gantry angle: 0° 0.01 0.03 0.01
Ceiling
Table 41. Energy 15 MV and dose rate 500 MU/min. The measured effective dose rates 𝐷 (𝑚𝑒𝑎𝑠𝑢𝑟𝑒𝑑) in µSv/h
and the calculated effective dose rates 𝐷 𝑐𝑎𝑙𝑐 in µSv/week for ceiling using equation 10 and the values in table 9.
The background is approximately 0.1-0.15 µSv/h and is included in the values.
15 MV,
500MU/min
𝑫 (measured)
(µSv/h)
𝑫 𝒄𝒂𝒍𝒄 (ceiling)
(µSv/week)
Primary shielding, max 0.2 0.0
Secondary shielding 0.03 0.0
Door
Table 42. Energy 15 MV and dose rate 500 MU/min. The measured effective dose rates 𝐷 (𝑚𝑒𝑎𝑠𝑢𝑟𝑒𝑑) in µSv/h
and the calculated effective dose rates 𝐷 𝑐𝑎𝑙𝑐 in µSv/week for staff of the treatment department using equation 10
and the values in table 9. The public is not of interest because they are not allowed to be close to the door. The
maximum measured values under the door are located in the middle of the gap. The background is approximately
0.1-0.15 µSv/h and is included in the values.
15 MV,
500MU/min
𝑫 (measured)
(µSv/h)
𝑫 𝒄𝒂𝒍𝒄 (staff)
(µSv/week)
Gantry angle: 90°
In front of door 0.5 1.3
Gap under door 1.0 2.7
Gantry angle: 270°
In front of door 0.1 0.3
Gap under door 0.5 1.3
Gantry angle: 180°
In front of door 0.5 1.3
Gap under door 1.2 3.2
Gantry angle: 0°
In front of door 0.5 1.3
Gap under door 1.0 2.7
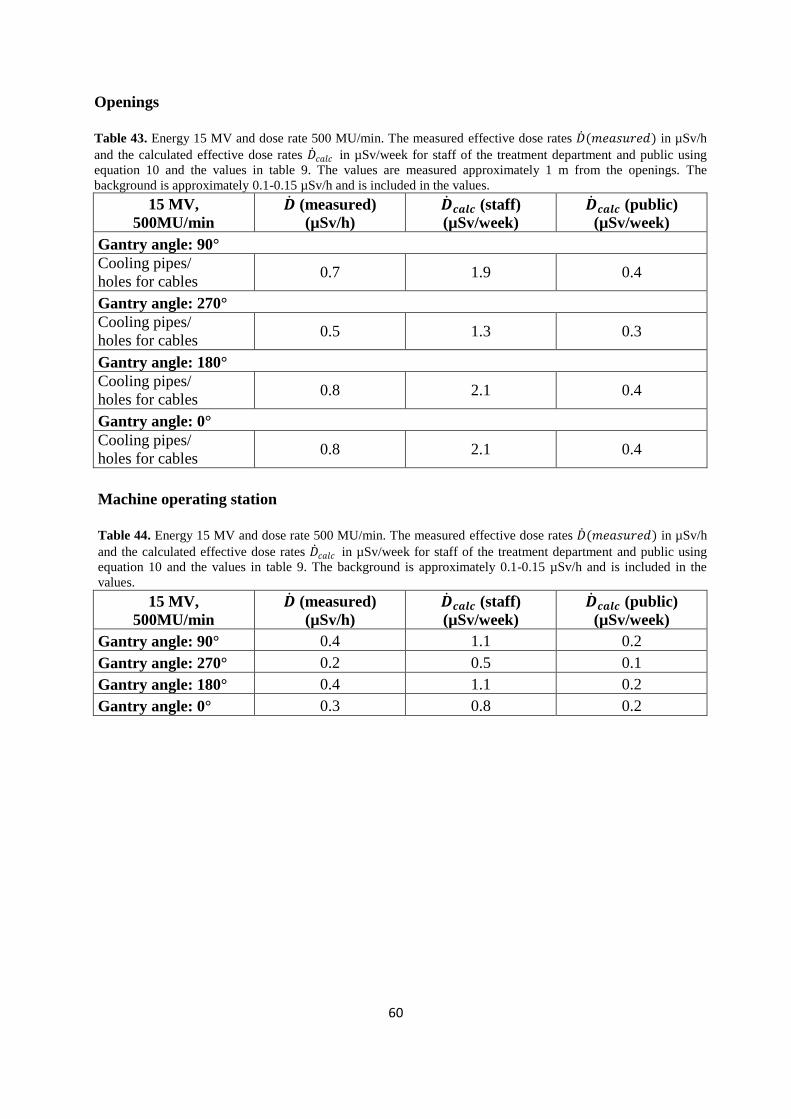
60
Openings
Table 43. Energy 15 MV and dose rate 500 MU/min. The measured effective dose rates 𝐷 (𝑚𝑒𝑎𝑠𝑢𝑟𝑒𝑑) in µSv/h
and the calculated effective dose rates 𝐷 𝑐𝑎𝑙𝑐 in µSv/week for staff of the treatment department and public using
equation 10 and the values in table 9. The values are measured approximately 1 m from the openings. The
background is approximately 0.1-0.15 µSv/h and is included in the values.
15 MV,
500MU/min
𝑫 (measured)
(µSv/h)
𝑫 𝒄𝒂𝒍𝒄 (staff)
(µSv/week)
𝑫 𝒄𝒂𝒍𝒄 (public)
(µSv/week)
Gantry angle: 90°
Cooling pipes/
holes for cables 0.7 1.9 0.4
Gantry angle: 270°
Cooling pipes/
holes for cables 0.5 1.3 0.3
Gantry angle: 180°
Cooling pipes/
holes for cables 0.8 2.1 0.4
Gantry angle: 0°
Cooling pipes/
holes for cables 0.8 2.1 0.4
Machine operating station
Table 44. Energy 15 MV and dose rate 500 MU/min. The measured effective dose rates 𝐷 (𝑚𝑒𝑎𝑠𝑢𝑟𝑒𝑑) in µSv/h
and the calculated effective dose rates 𝐷 𝑐𝑎𝑙𝑐 in µSv/week for staff of the treatment department and public using
equation 10 and the values in table 9. The background is approximately 0.1-0.15 µSv/h and is included in the
values.
15 MV,
500MU/min
𝑫 (measured)
(µSv/h)
𝑫 𝒄𝒂𝒍𝒄 (staff)
(µSv/week)
𝑫 𝒄𝒂𝒍𝒄 (public)
(µSv/week)
Gantry angle: 90° 0.4 1.1 0.2
Gantry angle: 270° 0.2 0.5 0.1
Gantry angle: 180° 0.4 1.1 0.2
Gantry angle: 0° 0.3 0.8 0.2

61
9.5. Varian, Lin3 (photons)
Primary wall (farthest away from the accelerator)
Table 45. Energy 15 MV and dose rate 500 MU/min. The measured effective dose rates 𝐷 (𝑚𝑒𝑎𝑠𝑢𝑟𝑒𝑑) in µSv/h
and the calculated effective dose rates 𝐷 𝑐𝑎𝑙𝑐 in µSv/week for staff of the treatment department and public using
equation 10 and the values in table 9. Two different survey equipments are used; RDS-110 and DGM-1500. When
no detector is specified, the two detectors gave the same result. The values of the junction wall-floor are measured
when the gantry is directed towards the junction in question. The background is approximately 0.1-0.15 µSv/h and
is included in the values.
15 MV,
500MU/min
𝑫 (measured)
(µSv/h)
𝑫 𝒄𝒂𝒍𝒄 (staff)
(µSv/week)
𝑫 𝒄𝒂𝒍𝒄 (public)
(µSv/week)
Height of isocenter,
max value
RDS-110: 2.0 1.3 0.3
DGM-1500: 1.8 1.2 0.2
Around the height of
isocenter 1.0 0.7 0.1
Junction wall-floor 5.0 3.3 0.7
Table 46. Energy 6 MV and dose rate 500 MU/min. The measured effective dose rates 𝐷 (𝑚𝑒𝑎𝑠𝑢𝑟𝑒𝑑) in µSv/h
and the calculated effective dose rates 𝐷 𝑐𝑎𝑙𝑐 in µSv/week for staff of the treatment department and public using
equation 10 and the values in table 9. Two different survey equipments are used; RDS-110 and DGM-1500. When
no detector is specified, the two detectors gave the same result. The values of the junction wall-floor are measured
when the gantry is directed towards the junction in question. The background is approximately 0.1-0.15 µSv/h and
is included in the values.
6 MV,
500 MU/min
𝑫 (measured)
(µSv/h)
𝑫 𝒄𝒂𝒍𝒄 (staff)
(µSv/week)
𝑫 𝒄𝒂𝒍𝒄 (public)
(µSv/week)
Height of isocenter 0.2 0.1 0.03
Primary wall (closest to the accelerator)
Table 47. Energy 15 MV and dose rate 500 MU/min. The measured effective dose rates 𝐷 (𝑚𝑒𝑎𝑠𝑢𝑟𝑒𝑑) in µSv/h
and the calculated effective dose rates 𝐷 𝑐𝑎𝑙𝑐 in µSv/week for staff of the treatment department and public using
equation 10 and the values in table 9. Two different survey equipments are used; RDS-110 and DGM-1500. When
no detector is specified, the two detectors gave the same result. The values of the junction wall-floor are measured
when the gantry is directed towards the junction in question. The background is approximately 0.1-0.15 µSv/h and
is included in the values.
15 MV,
500MU/min
𝑫 (measured)
(µSv/h)
𝑫 𝒄𝒂𝒍𝒄 (staff)
(µSv/week)
𝑫 𝒄𝒂𝒍𝒄 (public)
(µSv/week)
Height of isocenter,
max value
RDS-110: 4.0 2.7 0.5
DGM-1500: 3.0 2.0 0.4
Around the height of
isocenter
RDS-110: 3.0 2.0 0.4
DGM-1500: 2.0 1.3 0.3
At the edges 1.0 0.7 0.1
Junction wall-floor,
max value
RDS-110: 5.0 3.3 0.7
DGM-1500: 4.0 2.7 0.5
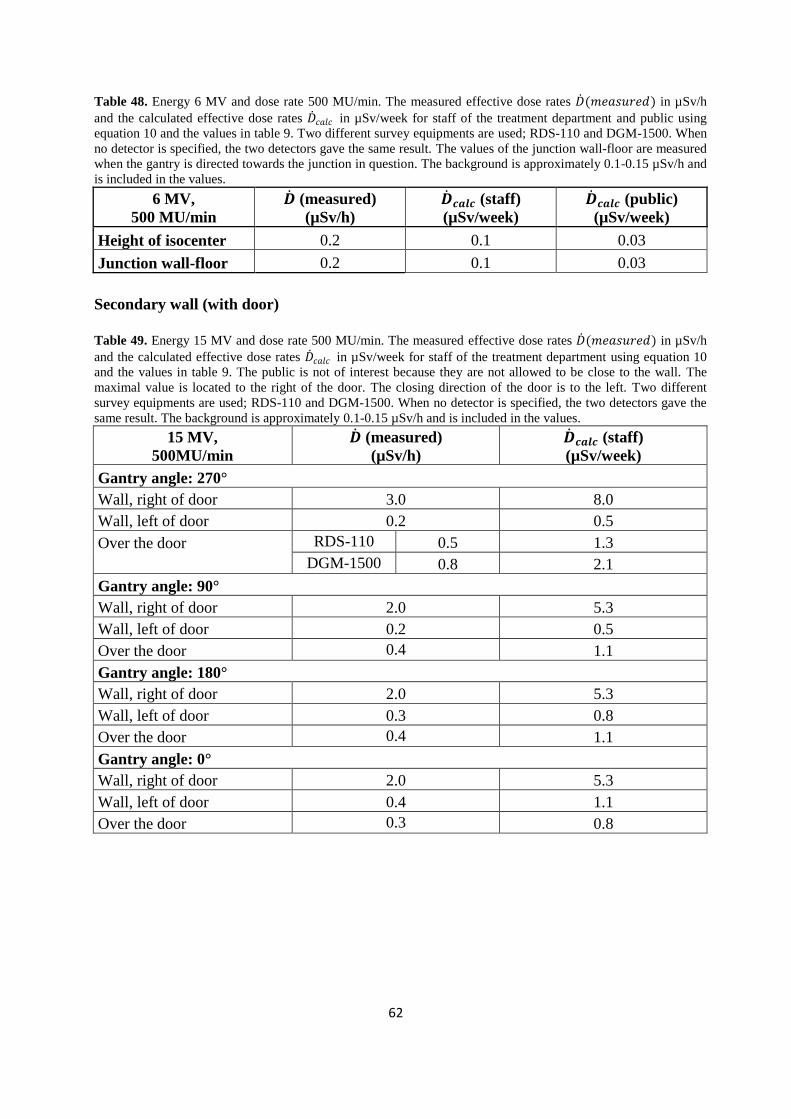
62
Table 48. Energy 6 MV and dose rate 500 MU/min. The measured effective dose rates 𝐷 (𝑚𝑒𝑎𝑠𝑢𝑟𝑒𝑑) in µSv/h
and the calculated effective dose rates 𝐷 𝑐𝑎𝑙𝑐 in µSv/week for staff of the treatment department and public using
equation 10 and the values in table 9. Two different survey equipments are used; RDS-110 and DGM-1500. When
no detector is specified, the two detectors gave the same result. The values of the junction wall-floor are measured
when the gantry is directed towards the junction in question. The background is approximately 0.1-0.15 µSv/h and
is included in the values.
6 MV,
500 MU/min
𝑫 (measured)
(µSv/h)
𝑫 𝒄𝒂𝒍𝒄 (staff)
(µSv/week)
𝑫 𝒄𝒂𝒍𝒄 (public)
(µSv/week)
Height of isocenter 0.2 0.1 0.03
Junction wall-floor 0.2 0.1 0.03
Secondary wall (with door)
Table 49. Energy 15 MV and dose rate 500 MU/min. The measured effective dose rates 𝐷 (𝑚𝑒𝑎𝑠𝑢𝑟𝑒𝑑) in µSv/h
and the calculated effective dose rates 𝐷 𝑐𝑎𝑙𝑐 in µSv/week for staff of the treatment department using equation 10
and the values in table 9. The public is not of interest because they are not allowed to be close to the wall. The
maximal value is located to the right of the door. The closing direction of the door is to the left. Two different
survey equipments are used; RDS-110 and DGM-1500. When no detector is specified, the two detectors gave the
same result. The background is approximately 0.1-0.15 µSv/h and is included in the values.
15 MV,
500MU/min
𝑫 (measured)
(µSv/h)
𝑫 𝒄𝒂𝒍𝒄 (staff)
(µSv/week)
Gantry angle: 270°
Wall, right of door 3.0 8.0
Wall, left of door 0.2 0.5
Over the door
RDS-110 0.5 1.3
DGM-1500 0.8 2.1
Gantry angle: 90°
Wall, right of door 2.0 5.3
Wall, left of door 0.2 0.5
Over the door 0.4 1.1
Gantry angle: 180°
Wall, right of door 2.0 5.3
Wall, left of door 0.3 0.8
Over the door 0.4 1.1
Gantry angle: 0°
Wall, right of door 2.0 5.3
Wall, left of door 0.4 1.1
Over the door 0.3 0.8

63
Table 50. Energy 6 MV and dose rate 500 MU/min. The measured effective dose rates 𝐷 (𝑚𝑒𝑎𝑠𝑢𝑟𝑒𝑑) in µSv/h
and the calculated effective dose rates 𝐷 𝑐𝑎𝑙𝑐 in µSv/week for staff of the treatment department using equation 10
and the values in table 9. The public is not of interest because they are not allowed to be close to the wall. The
maximal value is located to the right of the door. The closing direction of the door is to the left. Two different
survey equipments are used; RDS-110 and DGM-1500. When no detector is specified, the two detectors gave the
same result. The background is approximately 0.1-0.15 µSv/h and is included in the values.
6 MV,
500 MU/min
𝑫 (measured)
(µSv/h)
𝑫 𝒄𝒂𝒍𝒄 (staff)
(µSv/week)
Gantry angle: 270°
Wall, right of door 0.2 0.5
Wall, left of door 0.3 0.8
Over the door 0.2 0.5
Gantry angle: 90°
Wall, right of door 0.2 0.5
Wall, left of door 0.2 0.5
Over the door 0.2 0.5
Gantry angle: 180°
Wall, right of door 0.2 0.5
Wall, left of door 0.2 0.5
Over the door 0.2 0.5
Gantry angle: 0°
Wall, right of door 0.1 0.3
Wall, left of door 0.1 0.3
Over the door 0.1 0.3
Secondary wall (outside)
Table 51. Energy 15 MV and dose rate 500 MU/min. The measured effective dose rates 𝐷 (𝑚𝑒𝑎𝑠𝑢𝑟𝑒𝑑) in µSv/h
and the calculated effective dose rates 𝐷 𝑐𝑎𝑙𝑐 in µSv/week for staff of the treatment department and public using
equation 10 and the values in table 9. The measured values for 15 MV are small and therefore the values for 6
MV will not be checked. Two different survey equipments are used; RDS-110 and DGM-1500. When no detector
is specified, the two detectors gave the same result. The background is approximately 0.1-0.15 µSv/h and is
included in the values.
15 MV,
500MU/min
𝑫 (measured)
(µSv/h)
𝑫 𝒄𝒂𝒍𝒄 (staff)
(µSv/week)
𝑫 𝒄𝒂𝒍𝒄 (public)
(µSv/week)
Gantry angle: 90° 0.1 0.3 0.1
Gantry angle: 270° 0.1 0.3 0.1
Gantry angle: 180° 0.1 0.3 0.1
Gantry angle: 0° 0.1 0.3 0.1

64
Door
Table 52. Energy 15 MV and dose rate 500 MU/min. The measured effective dose rates 𝐷 (𝑚𝑒𝑎𝑠𝑢𝑟𝑒𝑑) in µSv/h
and the calculated effective dose rates 𝐷 𝑐𝑎𝑙𝑐 in µSv/week for staff of the treatment department using equation 10
and the values in table 9. The public is not of interest because they are not allowed to be close to the door. The
maximum measured values under the door are located in the middle of the gap and slightly to the right. Two
different survey equipments are used; RDS-110 and DGM-1500. When no detector is specified, the two detectors
gave the same result. The background is approximately 0.1-0.15 µSv/h and is included in the values.
15 MV,
500MU/min
𝑫 (measured)
(µSv/h)
𝑫 𝒄𝒂𝒍𝒄 (staff)
(µSv/week)
Gantry angle: 90°
Door gap 0.3 0.8
Under door,
max value
RDS-110: 8.0 21.3
DGM-1500: 15.0 40.0
Under door,
average value
RDS-110: 4.8 12.8
DGM-1500: 11.2 29.9
30 cm from door,
at floor (max)
RDS-110: 7.0 18.7
DGM-1500: 11.0 29.3
In front of the door 0.3 0.8
Gantry angle: 270°
Door gap 0.4 1.1
Under door,
max value
RDS-110: 6.0 16.0
DGM-1500: 9.0 24.0
Under door,
average value
RDS-110: 4.5 12.0
DGM-1500: 7.5 20.0
30 cm from door,
at floor (max)
RDS-110: 4.0 10.7
DGM-1500: 8.0 21.3
In front of the door 0.4 1.1
Gantry angle: 180°
Door gap 0.4 1.1
Under door,
max value
RDS-110: 5.0 13.3
DGM-1500: 11.0 29.3
Under door,
average value
RDS-110: 4.0 10.7
DGM-1500: 9.0 24.0
30 cm from door,
at floor (max)
RDS-110: 4.0 10.7
DGM-1500: 9.0 24.0
In front of the door 0.4 1.1
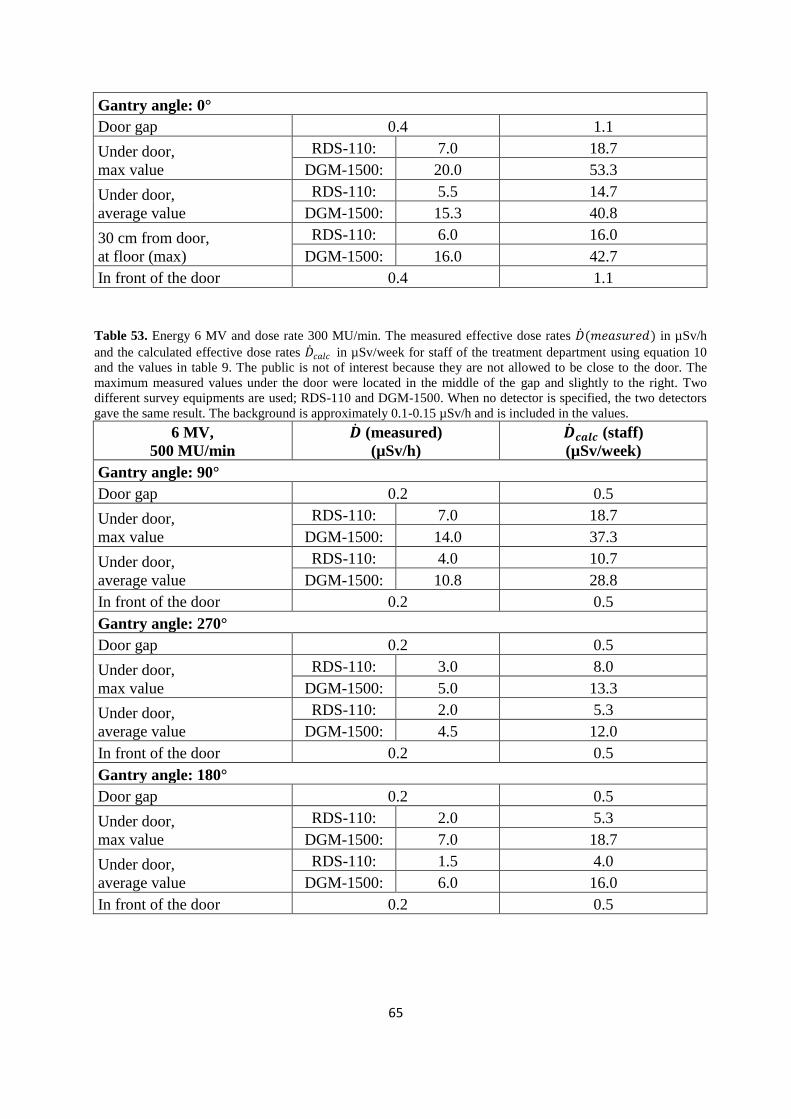
65
Gantry angle: 0°
Door gap 0.4 1.1
Under door,
max value
RDS-110: 7.0 18.7
DGM-1500: 20.0 53.3
Under door,
average value
RDS-110: 5.5 14.7
DGM-1500: 15.3 40.8
30 cm from door,
at floor (max)
RDS-110: 6.0 16.0
DGM-1500: 16.0 42.7
In front of the door 0.4 1.1
Table 53. Energy 6 MV and dose rate 300 MU/min. The measured effective dose rates 𝐷 (𝑚𝑒𝑎𝑠𝑢𝑟𝑒𝑑) in µSv/h
and the calculated effective dose rates 𝐷 𝑐𝑎𝑙𝑐 in µSv/week for staff of the treatment department using equation 10
and the values in table 9. The public is not of interest because they are not allowed to be close to the door. The
maximum measured values under the door were located in the middle of the gap and slightly to the right. Two
different survey equipments are used; RDS-110 and DGM-1500. When no detector is specified, the two detectors
gave the same result. The background is approximately 0.1-0.15 µSv/h and is included in the values.
6 MV,
500 MU/min
𝑫 (measured)
(µSv/h)
𝑫 𝒄𝒂𝒍𝒄 (staff)
(µSv/week)
Gantry angle: 90°
Door gap 0.2 0.5
Under door,
max value
RDS-110: 7.0 18.7
DGM-1500: 14.0 37.3
Under door,
average value
RDS-110: 4.0 10.7
DGM-1500: 10.8 28.8
In front of the door 0.2 0.5
Gantry angle: 270°
Door gap 0.2 0.5
Under door,
max value
RDS-110: 3.0 8.0
DGM-1500: 5.0 13.3
Under door,
average value
RDS-110: 2.0 5.3
DGM-1500: 4.5 12.0
In front of the door 0.2 0.5
Gantry angle: 180°
Door gap 0.2 0.5
Under door,
max value
RDS-110: 2.0 5.3
DGM-1500: 7.0 18.7
Under door,
average value
RDS-110: 1.5 4.0
DGM-1500: 6.0 16.0
In front of the door 0.2 0.5

66
Gantry angle: 0°
Door gap 0.2 0.5
Under door,
max value
RDS-110: 4.0 10.7
DGM-1500: 20.0 53.3
Under door,
average value
RDS-110: 3.0 8.0
DGM-1500: 14.9 39.7
In front of the door 0.2 0.5
Openings
Table 54. Energy 15 MV and dose rate 500 MU/min. The measured effective dose rates 𝐷 (𝑚𝑒𝑎𝑠𝑢𝑟𝑒𝑑) in µSv/h
and the calculated effective dose rates 𝐷 𝑐𝑎𝑙𝑐 in µSv/week for staff of the treatment department and public using
equation 10 and the values in table 9. The cooling pipes are located over the door and the cables to the right of the
door in the ceiling. Two different survey equipments are used; RDS-110 and DGM-1500. When no detector is
specified, the two detectors gave the same result. The background is approximately 0.1-0.15 µSv/h and is
included in the values.
15 MV,
500MU/min
𝑫 (measured)
(µSv/h)
𝑫 𝒄𝒂𝒍𝒄 (staff)
(µSv/week)
𝑫 𝒄𝒂𝒍𝒄 (public)
(µSv/week)
Gantry angle: 90°
Holes for cables 0.3 0.8 0.2
Cooling pipes 0.3 0.8 0.2
Gantry angle: 270°
Holes for cables 0.3 0.8 0.2
Cooling pipes 0.2 0.5 0.1
Gantry angle: 180°
Holes for cables 0.2 0.5 0.1
Cooling pipes 0.4 1.1 0.2
Gantry angle: 0°
Holes for cables 0.2 0.5 0.1
Cooling pipes 0.3 0.8 0.2

67
Machine operating station and adjacent rooms
Table 55. Energy 15 MV and dose rate 500 MU/min. The measured effective dose rates 𝐷 (𝑚𝑒𝑎𝑠𝑢𝑟𝑒𝑑) in µSv/h
and the calculated effective dose rates 𝐷 𝑐𝑎𝑙𝑐 in µSv/week for staff of the treatment department and public using
equation 10 and the values in table 9. Two different survey equipments are used; RDS-110 and DGM-1500. When
no detector is specified, the two detectors gave the same result. The background is approximately 0.1-0.15 µSv/h
and is included in the values.
15 MV,
500MU/min
𝑫 (measured)
(µSv/h)
𝑫 𝒄𝒂𝒍𝒄 (staff)
(µSv/week)
𝑫 𝒄𝒂𝒍𝒄 (public)
(µSv/week)
Gantry angle: 90°
Machine operating
station 0.4 1.1 0.2
Adjacent rooms 0.4 1.1 0.2
Gantry angle: 270°
Machine operating
station 0.4 1.1 0.2
Adjacent rooms 0.3 0.8 0.1
Gantry angle: 180°
Machine operating
station 0.6 1.6 0.3
Adjacent rooms 0.4 1.1 0.2
Gantry angle: 0°
Machine operating
station 0.3 0.8 0.2
Adjacent rooms 0.3 0.8 0.2
Gantry angle: 90°, no phantom
Machine operating
station 0.2 0.5 0.1
Adjacent rooms 0.2 0.5 0.1
Gantry angle: 270°, no phantom
Machine operating
station 0.2 0.5 0.1
Adjacent rooms 0.2 0.5 0.1
Adjacent buildings
Table 56. Energy 15 MV and dose rate 500 MU/min. The measured effective dose rates 𝐷 (𝑚𝑒𝑎𝑠𝑢𝑟𝑒𝑑) in µSv/h
and the calculated effective dose rates 𝐷 𝑐𝑎𝑙𝑐 in µSv/week for staff of the treatment department and public using
equation 10 and the values in table 9. Two different survey equipments are used; RDS-110 and DGM-1500.
When no detector is specified, the two detectors gave the same result. The background is approximately 0.1-0.15
µSv/h and is included in the values.
15 MV,
500MU/min
𝑫 (measured)
(µSv/h)
𝑫 𝒄𝒂𝒍𝒄 (staff)
(µSv/week)
𝑫 𝒄𝒂𝒍𝒄 (public)
(µSv/week)
Second floor 0.2 0.1 0.03
Third floor 0.2 0.1 0.03
Fourth floor 0.2 0.1 0.03

68
Skyshine
Table 57. Energy 15 MV and dose rate 500 MU/min. The measured effective dose rates 𝐷 (𝑚𝑒𝑎𝑠𝑢𝑟𝑒𝑑) in µSv/h
and the calculated effective dose rates 𝐷 𝑐𝑎𝑙𝑐 in µSv/week for staff of the treatment department and public using
equation 10 and the values in table 9. Two different survey equipments are used; RDS-110 and DGM-1500.
When no detector is specified, the two detectors gave the same result. The background is approximately 0.1-0.15
µSv/h and is included in the values.
15 MV,
500MU/min
𝑫 (measured)
(µSv/h)
𝑫 𝒄𝒂𝒍𝒄 (staff)
(µSv/week)
𝑫 𝒄𝒂𝒍𝒄 (public)
(µSv/week)
At different distances
from isocenter 0.1 0.1 0.01
Field size 15 x 15 cm2
Table 58. Energy 15 MV and dose rate 500 MU/min. The measured effective dose rates 𝐷 (𝑚𝑒𝑎𝑠𝑢𝑟𝑒𝑑) in µSv/h
and the calculated effective dose rates 𝐷 𝑐𝑎𝑙𝑐 in µSv/week for staff of the treatment department and public using
equation 10 and the values in table 9. The public is not of interest at the secondary wall and the door because they
are not allowed to be here. Two different survey equipments are used; RDS-110 and DGM-1500. When no
detector is specified, the two detectors gave the same result. The values at the secondary wall are measured to the
right of the door where the highest values are found. The background is approximately 0.1-0.15 µSv/h and is
included in the values.
15 MV,
500MU/min
𝑫 (measured)
(µSv/h)
𝑫 𝒄𝒂𝒍𝒄 (staff)
(µSv/week)
𝑫 𝒄𝒂𝒍𝒄 (public)
(µSv/week)
Primary wall (farthest away from the accelerator)
Height of isocenter,
max value 1.7 1.1 0.2
Junction wall-floor 0.8 0.5 0.1
Junction wall-floor,
gantry directed towards
the junction
2.0 1.3 0.3
Primary wall (closest to the accelerator)
Height of isocenter,
max value 3.5 2.3 0.5
Junction wall-floor 3.0 2.0 0.4
Junction wall-floor,
gantry directed towards
the junction
3.8 2.5 0.5
Secondary wall (door)
Gantry angle: 90° 2.0 5.3 1.1
Gantry angle: 270° 3.0 8.0 1.6
Gantry angle: 180° 2.0 5.3 1.1
Gantry angle: 0° 3.0 8.0 1.6
Door (Gantry angle: 90°)
Door gap 0.3 0.8 0.2
Under door, max value 6.5 17.3 3.5
30 cm from door,
at floor (max) 6.0 16.0 3.2
In front of the door 0.3 0.8 0.2

69
Door (Gantry angle: 270°)
Door gap 0.3 0.8 0.2
Under door, max value 7.0 18.7 3.7
30 cm from door,
at floor (max) 6.0 16.0 3.2
In front of the door 0.3 0.8 0.2
Door (Gantry angle: 180°)
Door gap 0.4 1.1 0.2
Under door, max value 10.0 26.7 5.3
30 cm from door,
at floor (max) 8.0 21.3 4.3
In front of the door 0.4 1.1 0.2
Door (Gantry angle: 0°)
Door gap 0.4 1.1 0.2
Under door, max value 10.0 26.7 5.3
30 cm from door,
at floor (max) 8.0 21.3 4.3
In front of the door 0.4 1.1 0.2

70
9.6. Varian, Lin3 (neutrons)
Primary walls
Table 59. Energy 15 MV and dose rate 500 MU/min. The measured effective dose rates 𝐷 (𝑚𝑒𝑎𝑠𝑢𝑟𝑒𝑑) in µSv/h
and the calculated effective dose rates 𝐷 𝑐𝑎𝑙𝑐 in µSv/week for staff of the treatment department and public using
equation 10 and the values in table 9. The background is approximately 0.1-0.15 µSv/h and is included in the
values.
15 MV,
500MU/min
𝑫 (measured)
(µSv/h)
𝑫 𝒄𝒂𝒍𝒄 (staff)
(µSv/week)
𝑫 𝒄𝒂𝒍𝒄 (public)
(µSv/week)
Primary wall
(farthest away from the accelerator) 0.03 0.02 0.0
Primary wall
(closest to the accelerator) 0.03 0.02 0.0
Secondary wall (with door)
Table 60. Energy 15 MV and dose rate 500 MU/min. The measured effective dose rates 𝐷 (𝑚𝑒𝑎𝑠𝑢𝑟𝑒𝑑) in µSv/h
and the calculated effective dose rates 𝐷 𝑐𝑎𝑙𝑐 in µSv/week for staff of the treatment department using equation 10
and the values in table 9. The public is not of interest because they are not allowed to be close to the wall. The
closing direction of the door is to the left. The background is approximately 0.1-0.15 µSv/h and is included in the
values.
15 MV,
500MU/min
𝑫 (measured)
(µSv/h)
𝑫 𝒄𝒂𝒍𝒄 (staff)
(µSv/week)
Gantry angle: 90°
Wall, left of door 0.2 0.5
Wall, right of door 0.8 2.1
Gantry angle: 270°
Wall, left of door 0.2 0.5
Wall, right of door 1.3 3.5
Gantry angle: 180°
Wall, left of door 0.4 1.1
Wall, right of door 0.8 2.1
Gantry angle: 0°
Wall, left of door 0.4 1.1
Wall, right of door 0.7 1.9
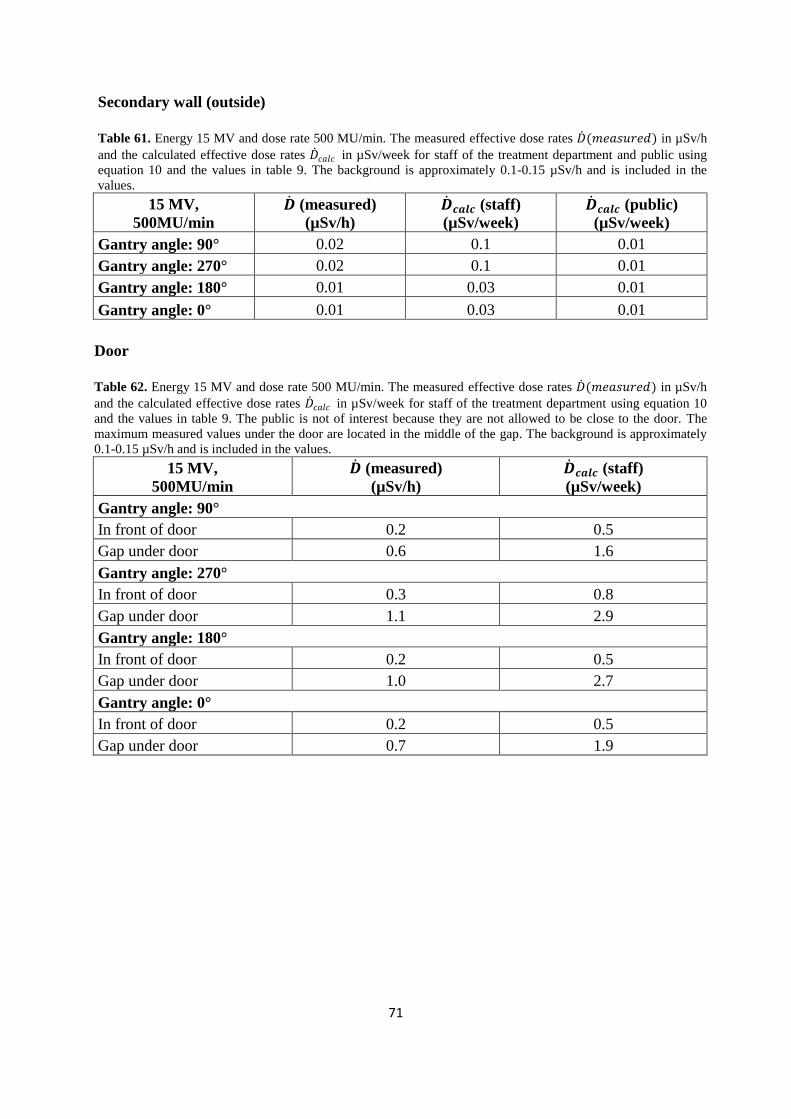
71
Secondary wall (outside)
Table 61. Energy 15 MV and dose rate 500 MU/min. The measured effective dose rates 𝐷 (𝑚𝑒𝑎𝑠𝑢𝑟𝑒𝑑) in µSv/h
and the calculated effective dose rates 𝐷 𝑐𝑎𝑙𝑐 in µSv/week for staff of the treatment department and public using
equation 10 and the values in table 9. The background is approximately 0.1-0.15 µSv/h and is included in the
values.
15 MV,
500MU/min
𝑫 (measured)
(µSv/h)
𝑫 𝒄𝒂𝒍𝒄 (staff)
(µSv/week)
𝑫 𝒄𝒂𝒍𝒄 (public)
(µSv/week)
Gantry angle: 90° 0.02 0.1 0.01
Gantry angle: 270° 0.02 0.1 0.01
Gantry angle: 180° 0.01 0.03 0.01
Gantry angle: 0° 0.01 0.03 0.01
Door
Table 62. Energy 15 MV and dose rate 500 MU/min. The measured effective dose rates 𝐷 (𝑚𝑒𝑎𝑠𝑢𝑟𝑒𝑑) in µSv/h
and the calculated effective dose rates 𝐷 𝑐𝑎𝑙𝑐 in µSv/week for staff of the treatment department using equation 10
and the values in table 9. The public is not of interest because they are not allowed to be close to the door. The
maximum measured values under the door are located in the middle of the gap. The background is approximately
0.1-0.15 µSv/h and is included in the values.
15 MV,
500MU/min
𝑫 (measured)
(µSv/h)
𝑫 𝒄𝒂𝒍𝒄 (staff)
(µSv/week)
Gantry angle: 90°
In front of door 0.2 0.5
Gap under door 0.6 1.6
Gantry angle: 270°
In front of door 0.3 0.8
Gap under door 1.1 2.9
Gantry angle: 180°
In front of door 0.2 0.5
Gap under door 1.0 2.7
Gantry angle: 0°
In front of door 0.2 0.5
Gap under door 0.7 1.9

72
Openings
Table 63. Energy 15 MV and dose rate 500 MU/min. The measured effective dose rates 𝐷 (𝑚𝑒𝑎𝑠𝑢𝑟𝑒𝑑) in µSv/h
and the calculated effective dose rates 𝐷 𝑐𝑎𝑙𝑐 in µSv/week for staff of the treatment department and public using
equation 10 and the values in table 9. The values are measured approximately 1 m from the openings. The
background is approximately 0.1-0.15 µSv/h and is included in the values.
15 MV,
500MU/min
𝑫 (measured)
(µSv/h)
𝑫 𝒄𝒂𝒍𝒄 (staff)
(µSv/week)
𝑫 𝒄𝒂𝒍𝒄 (public)
(µSv/week)
Gantry angle: 90°
Cooling pipes/
holes for cables 0.8 2.1 0.4
Gantry angle: 270°
Cooling pipes/
holes for cables 1.4 3.7 0.7
Gantry angle: 180°
Cooling pipes/
holes for cables 1.0 2.7 0.5
Gantry angle: 0°
Cooling pipes/
holes for cables 0.8 2.1 0.4
Machine operating station and adjacent rooms
Table 64. Energy 15 MV and dose rate 500 MU/min. The measured effective dose rates 𝐷 (𝑚𝑒𝑎𝑠𝑢𝑟𝑒𝑑) in µSv/h
and the calculated effective dose rates 𝐷 𝑐𝑎𝑙𝑐 in µSv/week for staff of the treatment department and public using
equation 10 and the values in table 9. The background is approximately 0.1-0.15 µSv/h and is included in the
values.
15 MV,
500MU/min
𝑫 (measured)
(µSv/h)
𝑫 𝒄𝒂𝒍𝒄 (staff)
(µSv/week)
𝑫 𝒄𝒂𝒍𝒄 (public)
(µSv/week)
Gantry angle: 90°
Machine operating
station 0.1 0.3 0.1
Adjacent rooms 0.1 0.3 0.1
Gantry angle: 270°
Machine operating
station 0.2 0.5 0.1
Adjacent rooms 0.2 0.5 0.1
Gantry angle: 180°
Machine operating
station 0.1 0.3 0.1
Adjacent rooms 0.1 0.3 0.1
Gantry angle: 0°
Machine operating
station 0.2 0.5 0.1
Adjacent rooms 0.1 0.3 0.1