evaluation of the possibility of producing statistics on … · 2013-11-17 · evaluation of the...
TRANSCRIPT

2005:7
Evaluation of the possibility of producing statistics on
production in the construction industry on a monthly basis

The series Background facts presents background material for statistics produced by the Department of Economic Statistics at Statistics Sweden. Product descriptions, methodology reports and various statistic compilations are exampels of background material that give an overview and facilitate the use of statistics.
Publications in the series Background facts on Economic Statistics
2001:1 Offentlig och privat verksamhet – statistik om anordnare av välfärdstjänster 1995, 1997 och 1999
2002:1 Forskar kvinnor mer än män? Resultat från en arbetstidsundersökning riktad till forskande och undervisande personal vid universitet och högskolor år 2000
2002:2 Forskning och utveckling (FoU) i företag med färre än 50 anställda år 2000
2002:3 Företagsenheten i den ekonomiska statistiken
2002:4 Statistik om privatiseringen av välfärdstjänster 1995–2001. En sammanställning från SCB:s statistikkällor
2003:1 Effekter av minskad detaljeringsgrad i varunomenklaturen i Intrastat – från KN8 till KN6
2003:2 Consequences of reduced grade in detail in the nomenclature in Intrastat – from CN8 to CN6
2003:3 SAMU. The system for co-ordination of frame populations and samples from the Business Register at Statistics Sweden
2003:4 Projekt med anknytning till projektet “Statistik om den nya ekonomin”. En kart- läggning av utvecklingsprojekt och uppdrag
2003:5 Development of Alternative Methods to Produce Early Estimates of the Swedish Foreign Trade Statistics
2003:6 Övergång från SNI 92 till SNI 2002: Underlag för att bedöma effekter av tids- seriebrott
2003:7 Sveriges industriproduktionsindex 1913–2002 – Tidsserieanalys The Swedish Industrial Production Index 1913–2002 – Time Series Analysis
2003:8 Cross-country comparison of prices for durable consumer goods: Pilot study – washing machines
2003:9 Monthly leading indicators using the leading information in the monthly Business Tendency Survey
2003:10 Privat drift av offentligt finansierade välfärdstjänster. En sammanställning av statistik
2003:11 Säsongrensning av Nationalräkenskaperna – Översikt
2003:12 En tillämpning av TRAMO/SEATS: Den svenska utrikeshandeln 1914–2003
2003:13 A note on improving imputations using time series forecasts
2003:14 Definitions of goods and services in external trade statistics
Continued on inside of the back cover!
These publications and others can be ordered from: Statistics Sweden, Publication Services, SE 701 89 ÖREBRO, Sweden phone +46 19 17 68 00 or fax +46 19 17 64 44.
You can also purchase our publications at our Statistics Shop: Karlavägen 100, Stockholm, Sweden

Bakgrundsfakta
Evaluation of the possibility of producing statistics on
production in the construction industry on a monthly basis
2005:7
Statistics Sweden 2005
Economic Statistics
Evaluation of the possibility of producing statistics on production in the construction industry on a monthly basis Statistics Sweden 2005 Tidigare publicering Publicerad årligen sedan 2001 Previous publication Previous publication has been made since 2001 Producent SCB, Avdelningen för ekonomisk statistik Producer Box 24 300 104 51 Stockholm Förfrågningar Anita Ullberg, tfn: +46 8 506 946 50 Inquiries [email protected] Omslag: Ateljén, SCB Om du citerar ur denna publikation, var god uppge källan: Källa: SCB, Bakgrundsfakta © 2005 Statistiska centralbyrån Enligt lagen (1960:729) om upphovsrätt till litterära och konstnärliga verk är det förbjudet att helt eller delvis mångfaldiga innehållet i denna publikation utan medgivande från Statistiska centralbyrån ISSN 1650-9447 Printed in Sweden SCB-tryck, Örebro 2005:02

Background Facts 2005:7
Statistiska centralbyrån 3
Preface In the period from January to September 2004, Statistics Sweden (SCB) carried out feasibility studies on the implementation of the agreement with the EU Member States on the amendment of Council Regulation (EC) No 1165/98 of 19 May 1998 concerning short-term statistics, which states that the Member States should submit a monthly indicator on production in the construction industry (IPC) before 45 days after the end of the reference month.
This report concludes the development work carried out in order to re-commend methods for producing a monthly indicator on production in the construction industry. The report presents the investigation into possibili-ties of a new monthly survey on production in the construction industry, discusses existing administrative data and statistics for possible use in the estimation of production industry and draws conclusions of the results.
This report has been produced by the project leader Karl-Johan Dahllöf at the unit for Short-term Indicators. The project group also included metho-dologists and persons from the short-term indicators and the national accounts. Their efforts are highly appreciated.
Statistics Sweden, April 2005
Anita Ullberg Head of the Unit for Short-term Indicators

4 Statistiska centralbyrån
Background Facts 2005:7
Statistiska centralbyrån 5
Innehåll
Preface.......................................................................................................3
1 Summary........................................................................................7
2 Description of the construction industry, value added and production figures.........................................................................8 2.1 The population.................................................................................8 2.2 Annual value added.........................................................................9 2.3 Quarterly figures on production in the construction industry from the National Accounts ...........................................................11
3 Possible variables for a new sample survey.............................12 3.1 Output quantities as basic data .....................................................12 3.2 Gross production value as basic data............................................12 3.3 Turnover as the basic data ............................................................12 3.4 Work input as basic data ...............................................................12 3.5 Building materials as basic data ....................................................13
4 Use of existing statistics for the estimation of production in the construction industry .......................................................14 4.1 Administrative information – building permits, output or input VAT as basic data .........................................................................14 4.2 Work input .....................................................................................15 4.3 Building materials used .................................................................22 4.4 Swedish Road Administration (SRA) .............................................24
5 Conclusions.................................................................................26 5.1 Variables .......................................................................................26 5.2 Compilation of the index ................................................................26
6 Appendix A Estimated Sampling Error for the Annual Change of Hours worked in the Labour Force Survey (LFS).............................................................................................30

Bakgrundsfakta 2005:04
Statistiska centralbyrån 6

Background Facts 2005:7
Statistiska centralbyrån 7
1 Summary The amendment of Council Regulation (EC) No 1165/98 of 19 May 1998 concerning short-term statistics states that the Member States should sub-mit a monthly indicator on production in the construction industry (IPC) before 45 days after the end of the reference month.
The prerequisites for the project are given in Methodology of short-term busi-ness statistics – interpretations and guidelines 2002 edition: “The outputs of the production process in construction are new structures and extensions on the one hand and repair, maintenance and improvement on the other hand. Structures are classified according to the Construction Classification (CC). In this context the IPC can be considered as an aggregation of the two sub-indicators the *IPCB and the **IPCCE, which are distinguished by their cover-age of different constructions. There is no direct link to the activity classi-fication NACE Rev. 1 for these two sub-indicators but it is accepted that the development of the construction activity is described representatively by an IPC based on the combination of the two sub-indices.”
The IPC should cover NACE Rev. 1 section F. At present, SCB has no sepa-rate survey on production in the construction industry. The quarterly figures sent to Eurostat are calculated within the National Accounts system. The National Accounts system cannot be used to calculate production figures on a monthly basis as figures are only produced quarterly in the National Accounts. SCB has therefore investigated the possibilities of carrying out a new monthly survey. There are two main problems: firstly that there is already a significant non-response rate in surveys on the construction industry and secondly, there are obvious difficulties in eva-luating one month’s production in projects that may last for several months or years. Therefore, SCB has considered the possibilities of using some kind of administrative data for estimation or already existing statistics.
Chapter 2 describes the construction industry. In chapter 3, the investiga-tion into the possibilities of a new monthly survey on production in the construction industry is presented. Chapter 4 discusses existing admi-nistrative data and statistics for possible use in the estimation of produc-tion in the construction industry. In chapter 5, the results are discussed and conclusions are drawn.
* IPCB is the IPC concerning building work. ** IPCCE is the IPC concerning civil engineering work.

Background Facts 2005:7
Statistiska centralbyrån 8
2 Description of the construction industry, value added and production figures This chapter describes the population of construction companies in terms of size classes, some of their properties and existing statistics on value added.
2.1 The population The construction industry in Sweden consists of a large number of small companies with less than ten employees and a few large companies with more than 1000 employees. Companies with less than ten employees have an aggregated turnover of approximately 29 per cent of the total turnover in the construction industry.
Table 1 Number of operating units, employees and turnover distributed into size class
01-04-2004 Number of units
Number of employees
Turnover
Number of employees
Number Per cent of total
Number Per cent of total
Amount Per cent of total
0 35 806 61.1 35 806 14.3 19 204 857 7.4 1–4 15 722 26.8 45 469 18.1 30 395 847 11.7 5–9 3 751 6.4 28 311 11.3 25 108 453 9.6 10–99 3 249 5.5 71 799 28.6 82 601 891 31.7 100–999 100 0.2 24 963 9.9 30 339 459 11.6 1000+ 11 0.0 44 775 17.8 72 899 210 28.0 All 58 639 100 251 123 100 260 549 717 100
Source: Swedish Business Register
On a yearly basis different company size classes correlate poorly with other size classes in terms of value added tendency.

Background Facts 2005:7
9
Figure 1 Index of value added, distributed by size class, 1997 = 100
80
100
120
140
160
180
1997 1998 1999 2000 2001
Year
Ind
ex
0-19 employees 20-49 employees 50-99 employees
100-249 employees 250+ employees Mean
Source: Business Statistics
This indicates that a sample survey with a cut-off limit that would exclude small companies should not be carried out. On the other hand, short-term investigations of small companies are difficult to carry out with such a tight response deadline. SCB has experience of a problematic non-response rate in some annual surveys on the construction industry, especially from small companies, which would likely increase for a survey carried out on a monthly basis and be damaging for the quality of the statistics produced.
2.2 Annual value added Annual surveys of value added in the construction industry are carried out by SCB with questionnaires to companies in all the different size classes. Value added is normally based on net turnover but, in some cases, the accounting procedures in large companies may affect the outcome of the value added. In such cases, it may be preferable to base the value added on the companies’ invoicing instead of their net turnover. In figure 2, value added is shown unadjusted based on net turnover and also adjusted using information on invoicing.

Background Facts 2005:7
Statistiska centralbyrån 10
Figure 2 Value added in the construction industry, unadjusted and adjusted series, in current prices. Index 1999 = 100
75
85
95
105
115
125
135
1997 1998 1999 2000 2001 2002
Year
Ind
ex
Unadjusted Adjusted
Source: Business Statistics
In 2000, the unadjusted series differs somewhat more from the adjusted series than in other years. This is an effect of accounting procedures in a few large companies.
National Accounts’ annual data on value added in the construction industry are based on data from Business Statistics 1993–2002. However, a single imputation for 2003 has been made and the data are deflated into constant prices. The adjusted value added according to National Accounts is used as a reference throughout the paper for annual data.

Background Facts 2005:7
11
Figure 3 Value added in constant prices, according to National Accounts
80
85
90
95
100
105
1993 1994 1995 1996 1997 1998 1999 2000 2001 2002
Year
Ind
ex
Value Added
Source: National Accounts, Business Statistics
2.3 Quarterly figures on production in the construction industry from the National Accounts Quarterly figures from the National Accounts on changes in production in the construction industry, in constant prices, between year(t) and year(t-1) are based on the hours worked by employees and self-employed persons. To account for changes in labour productivity, the figures are adjusted using estimates of productivity changes for year(t-2) and year(t-3). The calculations of the change in production in current prices are made using the price indices for buildings and housing used in the National Accounts system for the formation of gross fixed counts. The figures on hours worked and the num-ber of employees used are from SCB’s Labour Force Survey (LFS), Short-Term Statistics, Wages and Salaries (KLP) and Short-Term Statistics, Num-ber of Employees (KS). The division into buildings and civil engineering is based on information on different types of investments on a quarterly basis. The investment statistics are not available on a monthly basis, which is why the National Accounts system for updating the IPCB and IPCCE cannot be applied monthly.

Background Facts 2005:7
Statistiska centralbyrån 12
3 Possible variables for a new sample survey In Eurostat’s Methodology of short-term business statistics – interpretations and guidelines 2002 edition (MSTBS), it is described that IPC may be compiled from gross output data (quantity, production value or turnover), input data (hours worked, employment or materials used) or administrative declara-tions such as building permits.
3.1 Output quantities as basic data The handbook on price and volume measures in the National Accounts considers output quantity information on structures in cubic metres of volume, for example, as an unacceptable method for estimating the IPC. SCB agrees with the arguments given in MSTBS for not using output quanti-ties as basic data and does not intend to estimate the IPC in such a way.
3.2 Gross production value as basic data Regarding gross production value as basic data, MSTBS mentions a num-ber of problems that need to be solved before an indicator on gross pro-duction value can be created for the estimation of the IPC. The difficulties of valuating structures, combined with the need for deflating such data, makes it almost impossible to use this method and maintain an adequate link to the production process in the reference period. The structure of the construction industry also means that there is a risk for double counting, and there are difficulties in linking a certain amount of the produced structures to a specific reference period. Both the trade organisation and the trade association in the construction industry consider it too difficult to investigate this variable with adequate precision. SCB has therefore not chosen gross production value as basic data.
3.3 Turnover as the basic data Short-term statistics on production based on turnover do not reflect acti-vities in the reference period. Companies can receive payment in advance, after construction is completed or continuously during production. MSTBS mentions that the short-term development of turnover in construction is, to a great extent, determined by agreements and contracts and the link to actual economic activity is rather loose. This also presents a problem on a yearly basis when comparing value added and turnover in construction, as is dis-cussed in 2.2. On a monthly basis, this type of bias would be even more notable and the statistics would be unacceptable for updating the IPC.
3.4 Work input as basic data The Swedish National Accounts use work input, among other variables, as basic data to calculate the quarterly IPC. This alternative would not necessa-rily require a new survey, as SCB already has two different monthly surveys on hours worked: the Labour Force Survey (LFS) and Short-term statistics,
Background Facts 2005:7
13
wages and salaries, private sector1 (KLP). Therefore, the possibility of using work input as basic data will be discussed in the chapter concerning the use of already existing statistics.
3.5 Building materials as basic data SCB has considered a survey of building materials used but, in accordance with MSTBS, has concluded that such a survey of building companies would be too difficult. A survey on producers of building materials is however a possibility. One could consider using data on building materials for two different reasons: 1) The delivery/use of any specific building materials would be a good
indicator of value added in the construction industry. 2) If building materials represent a substantial part of the production
value, they can be used as proxy for value added.
There are a few different types of materials of interest and the problem of defining what types of materials are actually building materials has also been discussed.
There are different ways of defining what types of materials are building materials. These could be defined as the materials that account for say 90 per cent of the building companies’ purchased materials, minus the mate-rials that are not trade-specific for the construction industry. Another possibility would be to interview people with knowledge of the industry and ask them to define the most important building materials. A survey of building materials produced for the domestic market would also require a survey of imports and of the amount of materials in storage and materials sold from ex-stock, for those that can be stored.
3.5.1 Concrete One building material that would not require an investigation of storage is floating concrete. This is a very important material that is used in most construction work. It is an extreme, fresh product and building companies calculate the amount to be used carefully for each construction project. Therefore, an investigation on the amount of floating concrete produced can be treated in the same way as the amount of floating concrete used. However, roads and railways, which constitute a considerable part of the civil engineering industry, do not use concrete to such a great extent as other construction work. This means that an investigation of concrete may result in undercoverage of the whole construction industry.
3.5.2 Piling It has been argued that the amount of piling done in a reference period could be used as an indicator for the construction industry since piling is generally carried out in larger construction projects. However, on an annual basis, data on piling did not correlate adequately with value added statistics for the construction industry. An investigation on piling will therefore not be carried out to estimate the IPC. 1 The private sector includes: private firms, partnership firms, trading companies, limited partnership companies, limited liability companies, co-operative and non-profit associations and foundations. Publicly owned limited liability companies, the public service enterprises and the central bank are also included.
Background Facts 2005:7
Statistiska centralbyrån 14
4 Use of existing statistics for the estimation of production in the construction industry For some of the variables mentioned above, surveys are already carried out regularly for other purposes than measuring the IPC. However, the results of these surveys could also be used to estimate a monthly IPC. To evaluate whether the existing statistics could be used as proxy for the IPC, they are compared with annual data on the value added of production in the con-struction industry according to the National Accounts, in constant prices. Unfortunately, the annual data do not divide into buildings and civil engineering so only statistics measuring the total construction industry can be compared with the annual value added data. Most of the variables in-vestigated and presented in this paper do not divide into buildings and civil engineering. However, any variable that is considered a good estima-tor of the monthly production in the construction industry can be used for updating the total IPC in combination with IPCB and IPCCE. Some of the variables mentioned above already exist in surveys carried out by SCB, other institutions or organisations.
4.1 Administrative information – building permits, output or input VAT as basic data
4.1.1 Building permits Building permits are valid for two years which means that, as basic data, building permits might not reflect the production in the reference period. Permits also do not contain information on the value of the construction project in question. In addition, SCB only has data on building permits covering buildings. SCB will therefore not use building permits to update the IPC.
4.1.2 Output VAT There are similar problems with using output VAT on construction to esti-mate the IPC as with using turnover. Companies are allowed to pay their VAT in three different ways: in advance, on account and up to two months after the construction is finished. It is therefore clear that an estimate of the IPC based on output VAT would not represent the reference period. A government investigation to adapt the Swedish VAT legislation to the EU VAT legislation has been started but the proposed law has been delayed. Therefore, before any new legislation is adopted, no investigation of the possibilities of using VAT on construction to estimate the IPC can be done.
4.1.3 Input VAT The use of input VAT would not cause the same problems as with output VAT. In general, companies account input VAT as soon as possible. How-ever, as most companies account input VAT when invoiced for the purchased service or product, there would still be some problems when the

Background Facts 2005:7
15
invoicing for a reference month is done in advance of or after the reference month. The data would then not be representative for the reference month.
If investments that are not directly tied to production are included in the input VAT, the data would clearly be misleading in terms of updating the IPC. However, on a quarterly basis, input VAT on investments can be withdrawn from the total input VAT by using available data on invest-ments in the construction industry from Business Investments (BI) data.
Input VAT must be deflated for comparisons with value added data in constant prices. The data on input VAT below are deflated using the same price index as used for deflating the value added data. Data on input VAT are available for SCB within 40 days for large companies and within 70 days for smaller companies. As described in 2.1, all company size classes must be surveyed to obtain a fair picture of the construction industry. SCB can therefore not use input VAT for updating the IPC due to the late availability of the data.
Figure 4 Comparison of value added from the National Accounts with input VAT, in constant prices
80
85
90
95
100
105
1993 1994 1995 1996 1997 1998 1999 2000 2001 2002 2003
Year
Ind
ex
Value Added Input VAT
Source: National Accounts and Swedish National Tax Board
4.2 Work input As mentioned in 3.4, SCB already carries out two different monthly surveys on hours worked, the Labour Force Survey (LFS) and Short-term statistics. The Swedish Construction Trade Union also assembles information on hours worked. Comparisons with annual value added in the construction industry will not be done here, as the quarterly figures on production are based on hours worked from both the LFS and the Short-term statistics, so a comparison would be meaningless.

Background Facts 2005:7
Statistiska centralbyrån 16
4.2.1 Hours worked according to the Labour Force Survey The Labour Force Survey is a monthly survey. The purpose of the survey is to describe the current development in the labour market. Among the most important users of LFS statistics are the Labour Market Board, the Ministry of Trade, the Ministry of Finance, the Economic Research Institute and the labour market organisations. The LFS target population is composed of per-sons resident in Sweden, aged 15–74 years, although the publication refers to persons aged 16–64 years. The sample system is set up so that monthly samples consist of approximately 21 000 individuals aged between sixteen and sixty-four years.
Approximately five per cent of the sample population work in the con-struction industry. Different samples are drawn every week during one quarter and each individual participates in a total of eight surveys over a time span of two years. Calculations of the variance of the relative change in the number of hours worked gives a standard deviation of approxima-tely five per cent. The variance of the relative change was theoretically calculated to 0.00095, which gives a standard deviation of 3.1 per cent. Considering that the variance of matching individuals is set as zero, which is a considerable underestimation, the 5 per cent standard deviation according to the LFS seems reasonable. This gives a confidence interval of approximately ±10 per cent for the relative change. The LFS, however, can increase the precision by adding a sample to the original sample, with special stratification that increases the probability of a person in the new sample working in the construction industry. This variable is available within 45 days after the end of the reference month but does not divide into buildings and civil engineering.
On an annual basis, data on hours worked correlate well with data on value added in the construction industry.

Background Facts 2005:7
17
Figure 5 Annual value added in construction compared with hours worked (LFS), 2000 = 100
85
90
95
100
105
110
1993 1994 1995 1996 1997 1998 1999 2000 2001 2002 2003
Year
Ind
ex
Value Added LFS Workers, Hours Worked
LFS Self-Employed, Hours Worked LFS Total, Hours Worked
Source: National Accounts and Labour Force Survey
Data on hours worked by self-employed persons seem to contradict data on value added and also affects the LFS total, to differ somewhat more from value added than hours worked. However, since the turnover of self-employed persons is only about seven per cent of total turnover in the construction industry, the LFS total should be aggregated by the weighted indices LFS employees and LFS self-employed.

Background Facts 2005:7
Statistiska centralbyrån 18
Figure 6 Annual value added in construction compared with weighted hours worked (LFS), 2000 = 100. Weights: self-employed persons = 0.074 and employees = 0.926
85
90
95
100
105
110
1993 1994 1995 1996 1997 1998 1999 2000 2001 2002 2003
Year
Ind
ex
Value Added LFSw, Hours Worked
Source: SCB
4.2.2 Short-term statistics on wages and salaries in the private sector, hours worked (KLP) The main focus of these statistics is to highlight the levels of wages and salaries and their development over time in the private sector, but informa-tion on hours worked is also collected. The frame population is made up of companies in the Swedish Business Database with more than five employees. In 2003, the sample size was 7 967 companies. Since 1996, this survey has been carried out on a monthly basis. The results are published about seven weeks after the end of the reference month and do not divide into buildings and civil engineering.
Background Facts 2005:7
19
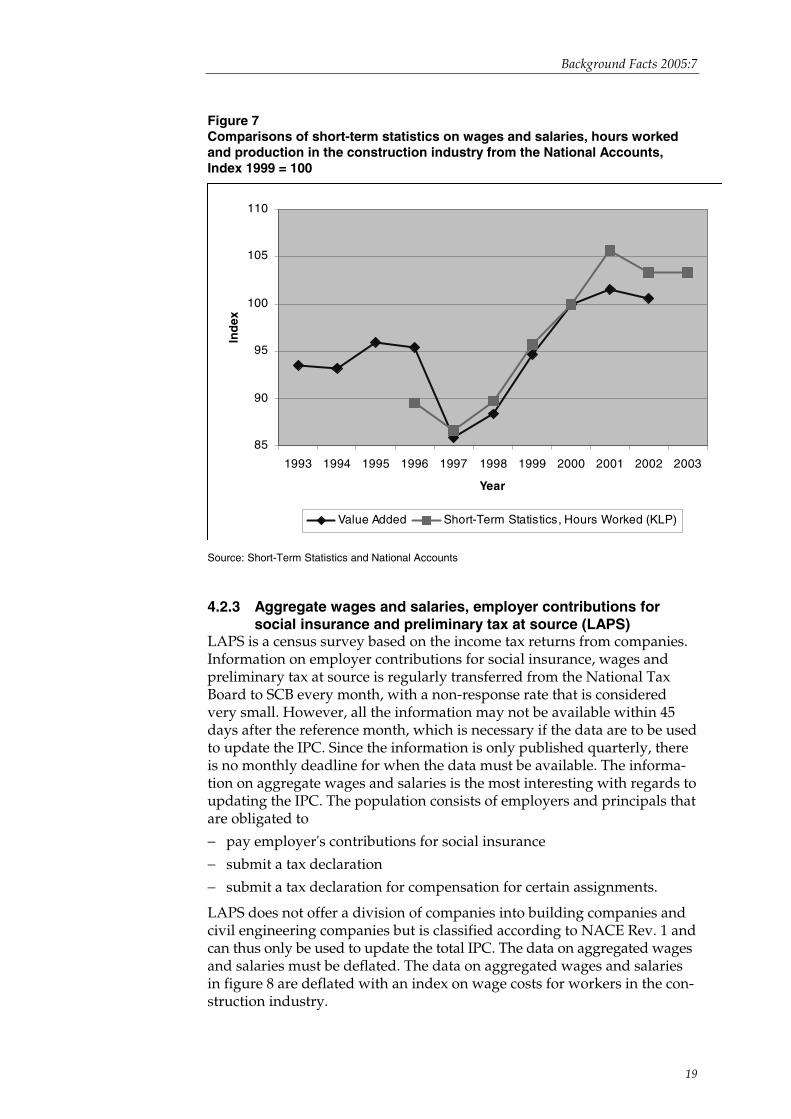
Figure 7 Comparisons of short-term statistics on wages and salaries, hours worked and production in the construction industry from the National Accounts, Index 1999 = 100
85
90
95
100
105
110
1993 1994 1995 1996 1997 1998 1999 2000 2001 2002 2003
Year
Ind
ex
Value Added Short-Term Statistics, Hours Worked (KLP)
Source: Short-Term Statistics and National Accounts
4.2.3 Aggregate wages and salaries, employer contributions for social insurance and preliminary tax at source (LAPS) LAPS is a census survey based on the income tax returns from companies. Information on employer contributions for social insurance, wages and preliminary tax at source is regularly transferred from the National Tax Board to SCB every month, with a non-response rate that is considered very small. However, all the information may not be available within 45 days after the reference month, which is necessary if the data are to be used to update the IPC. Since the information is only published quarterly, there is no monthly deadline for when the data must be available. The informa-tion on aggregate wages and salaries is the most interesting with regards to updating the IPC. The population consists of employers and principals that are obligated to
− pay employer's contributions for social insurance
− submit a tax declaration
− submit a tax declaration for compensation for certain assignments.
LAPS does not offer a division of companies into building companies and civil engineering companies but is classified according to NACE Rev. 1 and can thus only be used to update the total IPC. The data on aggregated wages and salaries must be deflated. The data on aggregated wages and salaries in figure 8 are deflated with an index on wage costs for workers in the con-struction industry.

Background Facts 2005:7
Statistiska centralbyrån 20
Figure 8 Comparison of deflated aggregate wages and salaries and production in the construction industry from the National Accounts, in constant prices. Index 2000 = 100
85
87
89
91
93
95
97
99
101
103
105
1993 1994 1995 1996 1997 1998 1999 2000 2001 2002 2003
Year
Ind
ex
Value Added LAPS
Source: Swedish National Tax Board
4.2.4 Hours worked according to the Construction Trade Union The Swedish Construction Trade Union (CTU) assembles information on hours worked in all unionised building companies on a weekly basis. The statistics are published quarterly and annually, but could easily be compiled monthly. The CTU covers all companies with union agreements, which also provides information of hours worked by employees that are not union members. The Construction Trade Union also has different agreements for buildings and civil engineering, which can be separated for compiling the indices IPCB and IPCCE. About 90 000 construction workers are surveyed, which is approximately 40 per cent of the total number of active employees in the construction industry. Another union that also organises construction workers is the Union of Service and Communication Employees (SEKO). The union agreements of SEKO are similar to those of the CTU and SEKO believes that an index of figures on hours worked delivered by the CTU would be similar to an index of figures on hours worked by SEKO mem-bers. However, it is not possible for SEKO to deliver these figures to SCB.

Background Facts 2005:7
21
Figure 9 Comparison of value added in the construction industry from the National Accounts with hours worked according to the Construction Trade Union. Index 2000 = 100
85
87
89
91
93
95
97
99
101
103
105
1993 1994 1995 1996 1997 1998 1999 2000 2001 2002 2003
Year
Ind
ex
Value Added Construction Trade Union, Hours Worked
Sources: National Accounts and Swedish Construction Trade Union
4.2.5 Productivity factor If the IPC is to be updated with hours worked, the changes in labour pro-ductivity must be taken into account. The construction industry is not con-sidered to be very receptive to changes in building methods and the change in labour productivity is slow. Therefore, an annual update of the change in labour productivity could be sufficient. A new survey to compile a new productivity factor is also possible.

Background Facts 2005:7
Statistiska centralbyrån 22
Figure 10 Value added in constant prices compared with hours worked according to productivity-adjusted series from the Construction Trade Union, short-term statistics (KLP) and the weighted Labour Force Survey
85
90
95
100
105
110
1993 1994 1995 1996 1997 1998 1999 2000 2001
Year
Ind
ex
Value Added
Construction Trade Union, Hours Worked (p)
Short-Term Statistics, Hours Worked (KLP)(p)
LFSw, Hours Worked (p)
Source: SCB and CTU
A change in labour productivity will probably occur in relation to the transfer from NACE 2002 to NACE 2007 because of the structural change in section F. In NACE 2002, factories manufacturing components such as concrete walls, roofs, etc. for prefabricated constructions belonged to section D whereas these factories will belong to section F in NACE 2007. Thus, an increase in productivity in section F is to be expected.
4.3 Building materials used As mentioned above, the definition of building materials is somewhat problematic in the sense that not every product used in the construction industry is trade-specific. Doors and windows are some typical products for buildings, whereas concrete is used for both buildings and civil engineering. Monthly short-term statistics exist on delivered floating con-crete, which can be assumed to be both trade-specific and represent floating concrete used in the reference period.
A sample of 48 large companies, which could be classified as suppliers of building materials and which existed in the database every month from January 1999 to December 2003, were selected from the short-term statistics database. The aggregated deliveries from these companies amounted to SEK 17 billion per year, which is about ten per cent of the total deliveries from selected industry sectors. Concrete and concrete products constituted 48.3 per cent of the total deliveries from the 48 companies. It can be assumed

Background Facts 2005:7
23
that concrete and concrete products constitute the largest share of the total deliveries to the construction industry. The development of the 48 large companies was compared to the industry sectors above.
If domestic deliveries of building products or materials are to be used as basic data, imports of these products should also be considered. Foreign trade is not only published according to the Combined Nomenclature (CN) and the Standard International Trade Classification (SITC), but also the Swedish Standard Classification of Products by Activity (SPIN 2002).
A division of building materials used in the construction of buildings and civil engineering can be done to a certain extent, for example construction described as one-family housing obviously relates to the construction of a building but, in general, a division of materials used in buildings and civil engineering is difficult since most important building materials are used in both.
Four different index series aiming to describe materials used in the construction industry are compared with annual value added.
− Concrete
− Short-term statistics for five producer sectors
− 48 large companies
− Imports of materials
Figure 11 below shows that the data on delivered building materials gene-rally correlate poorly with data on value added. Only the series Imports of materials2 seems to correlate well with the data on value added. It should be noted, however, that the series Short-term statistics for five producer sectors correlates well during the period 1997–2002 but not for 1993–1996.
2 Imports of materials actually refers to short-term statistics for five producer sectors + imports of building materials.

Background Facts 2005:7
Statistiska centralbyrån 24
Figure 11 Comparison of data on delivered building materials with data on value added according to the National Accounts. Index 1999 = 100
70
75
80
85
90
95
100
105
110
115
120
1990
1991
1992
1993
1994
1995
1996
1997
1998
1999
2000
2001
2002
2003
Year
Ind
ex
ConcreteShort-Term Stat. for Five Producer Sectors48 Large CompaniesValue Added according to National AccountsImport of Materials
Source: SCB
When comparing short data series, there is a danger that apparently strong correlations may be false and, since the series Imports of materials is based on the series Short-term statistics for five producer sectors, it can be concluded that the correlation with the value added series is not reliable.
Turnover from building materials in the wholesale and retail trade sector has also been considered for estimating the IPC. The retail trade for iron products, paint and glass (NACE Rev. 1 section 5246) has a national divi-sion 52461 that only includes building materials, iron products and sanitation.
However, the division 52461 also includes clothes, furniture, machinery, etc. and the data on turnover is only divided into subgroups, such as building materials, every fifth year. Thus the data cannot be used for esti-mating the IPC since it is not adequately trade-specific. It is clear that a division of the IPC, based on building materials in the wholesale and retail trade, into IPCB and IPCCE is not possible.
4.4 Swedish Road Administration (SRA) The SRA is the national authority with the overall sectoral responsibility for the road transport system. The SRA is also responsible for drawing up and applying road transport regulations. In addition, the SRA carries out

Background Facts 2005:7
25
the planning, construction, operation and maintenance of national roads. The sectoral responsibility involves representing the state at national level in issues relating to the environmental impact of the road transport system, road traffic safety, accessibility, level of service, efficiency and contributions to the regional balance, as well as in issues relating to intelligent transport systems, vehicles, public transport, modifications for the disabled, commer-cial traffic in addition to applied research, development and demonstration activities within the road transport system.
SCB has considered using data on accrued expenses from the SRA on acti-vities linked to production, repair and maintenance of the national road transport system for updating the IPCCE. However, since the data only cover the national road transport system and there are no corresponding data available for the local road system, the railways, sports grounds etc., the lack of coverage of the whole civil engineering sector is too great for SCB to use the data from SRA.

Background Facts 2005:7
Statistiska centralbyrån 26
5 Conclusions In the chapters above, arguments for and against the use of different variables as basic data for updating the IPC are outlined. The conclusions here are based on the results of the comparisons with annual data on value added from the National Accounts. Conclusions will only focus on the variables that are considered possible for use for updating the IPC.
5.1 Variables
5.1.1 Hours worked according to the Construction Trade Union Data on hours worked from the Construction Trade Union will be used as a basis on which to update the IPC, since they are only data discussed here that divides into buildings and civil engineering.
5.1.2 Hours worked by employees according to the Labour Force Survey Data on hours worked from the Labour Force Survey include information on the hours worked by employees in the construction industry and also by self-employed persons. The data on hours worked by self-employed persons and employees will be aggregated with the weights 0.074 and 0.926 respectively, which are derived from data on turnover in the different company size classes.
5.1.3 Hours worked by employees according to short-term statistics (KLP) on the private sector Hours worked by employees in the construction industry from the KLP may be used as an additional source. However, it is crucial that the data are made available 45 days after the reference month.
5.1.4 Aggregate wages and salaries, employer's contributions for social insurance and preliminary tax at the source (LAPS) Data on aggregate wages and salaries from LAPS also contain information on aggregate wages of self-employed persons in the construction industry. LAPS is regarded as having very good coverage and will be used as one source for the updating of the IPC.
5.2 Compilation of the index Let m,y,B)CTU(X and m,y,CE)CTU(X denote the number of hours worked
by building workers and civil engineering workers year y and month m according to the statistics of the Construction Trade Union. Let
m,y,CEm,y,Bm,y )CTU(X)CTU(X)CTU(X += denote the total number of
hours worked in the construction sector based on this information.
Let m,y)S(X denote number of hours worked (or any other relevant
indicator of construction volume) based on the statistical source S. The
Background Facts 2005:7
27
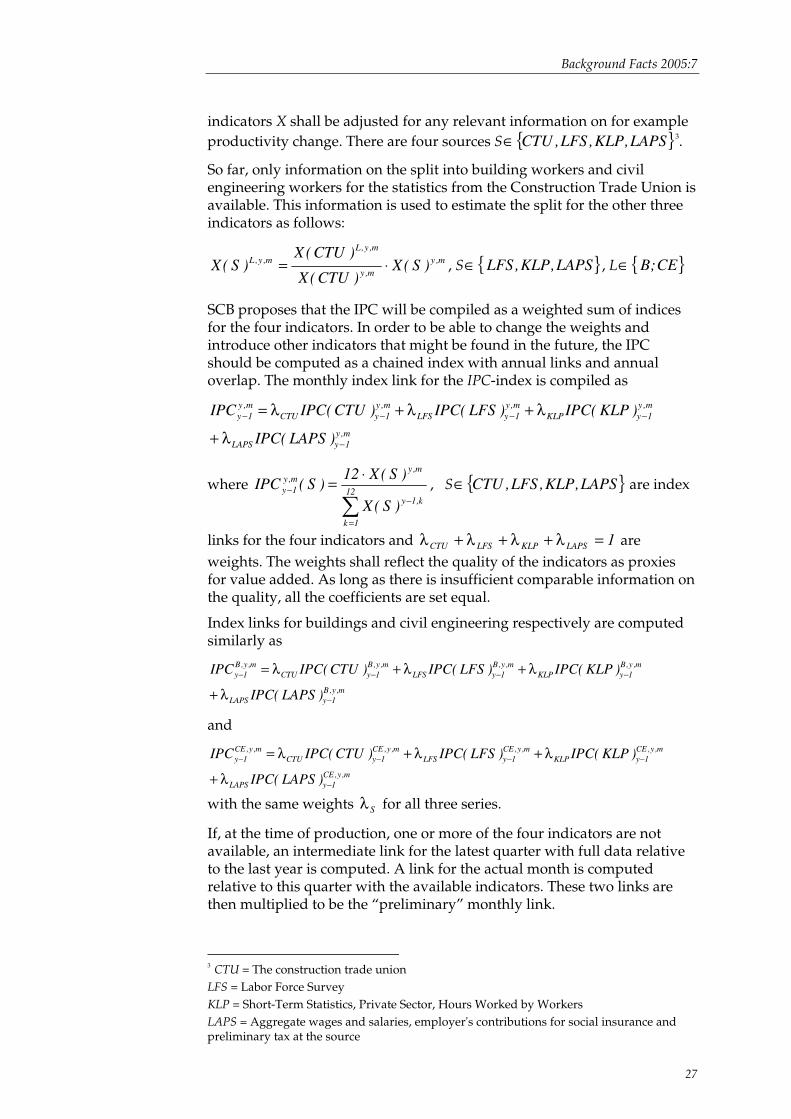
indicators X shall be adjusted for any relevant information on for example productivity change. There are four sources S { }LAPS,KLP,LFS,CTU∈ 3.
So far, only information on the split into building workers and civil engineering workers for the statistics from the Construction Trade Union is available. This information is used to estimate the split for the other three indicators as follows:
m,ym,y
m,y,Lm,y,L )S(X
)CTU(X
)CTU(X)S(X ⋅= , S { }LAPS,KLP,LFS∈ , L { }CE;B∈
SCB proposes that the IPC will be compiled as a weighted sum of indices for the four indicators. In order to be able to change the weights and introduce other indicators that might be found in the future, the IPC should be computed as a chained index with annual links and annual overlap. The monthly index link for the IPC-index is compiled as
m,y1yLAPS
m,y1yKLP
m,y1yLFS
m,y1yCTU
m,y1y
)LAPS(IPC
)KLP(IPC)LFS(IPC)CTU(IPCIPC
−
−−−−
λ+
λ+λ+λ=
where
∑=
−−
⋅=12
1k
k,1y
m,ym,y1y
)S(X
)S(X12)S(IPC , S { }LAPS,KLP,LFS,CTU∈ are index
links for the four indicators and 1LAPSKLPLFSCTU =λ+λ+λ+λ are weights. The weights shall reflect the quality of the indicators as proxies for value added. As long as there is insufficient comparable information on the quality, all the coefficients are set equal.
Index links for buildings and civil engineering respectively are computed similarly as
m,y,B1yLAPS
m,y,B1yKLP
m,y,B1yLFS
m,y,B1yCTU
m,y,B1y
)LAPS(IPC
)KLP(IPC)LFS(IPC)CTU(IPCIPC
−
−−−−
λ+
λ+λ+λ=
and
m,y,CE1yLAPS
m,y,CE1yKLP
m,y,CE1yLFS
m,y,CE1yCTU
m,y,CE1y
)LAPS(IPC
)KLP(IPC)LFS(IPC)CTU(IPCIPC
−
−−−−
λ+
λ+λ+λ=
with the same weights Sλ for all three series.
If, at the time of production, one or more of the four indicators are not available, an intermediate link for the latest quarter with full data relative to the last year is computed. A link for the actual month is computed relative to this quarter with the available indicators. These two links are then multiplied to be the “preliminary” monthly link.
3 CTU = The construction trade union LFS = Labor Force Survey KLP = Short-Term Statistics, Private Sector, Hours Worked by Workers LAPS = Aggregate wages and salaries, employer's contributions for social insurance and preliminary tax at the source

Background Facts 2005:7
Statistiska centralbyrån 28
The index for year y and month m with reference base year 2000 is computed as
m,y,L1y
12
1k
k,1y,L2y
12
1k
k,2001,L2000
m,y,L2000 IPCIPC
12
1IPC
12
1IPC −
=
−−
=
⋅⎟⎠
⎞⎜⎝
⎛⋅⋅⋅⎟⎠
⎞⎜⎝
⎛= ∑∑ ,
L { }CE,B,total∈
Figures 12 and 13 below contain a test IPC that is compiled with yearly data available at the time. The test IPC is compiled by all four variables only in the period 2000 – 2002 in figure 12 and 2000–2001 in figure 13.
Figure 12 The proposed IPC Compiled by the Variables Above and all Components Separately Compared with the Value Added Constant Prices
80
85
90
95
100
105
110
1993 1994 1995 1996 1997 1998 1999 2000 2001 2002 2003
Year
Ind
ex
CTU KLP LFS w
LAPS IPC Test Value added
Source: SCB, Swedish National Tax Board and CTU
Background Facts 2005:7
29
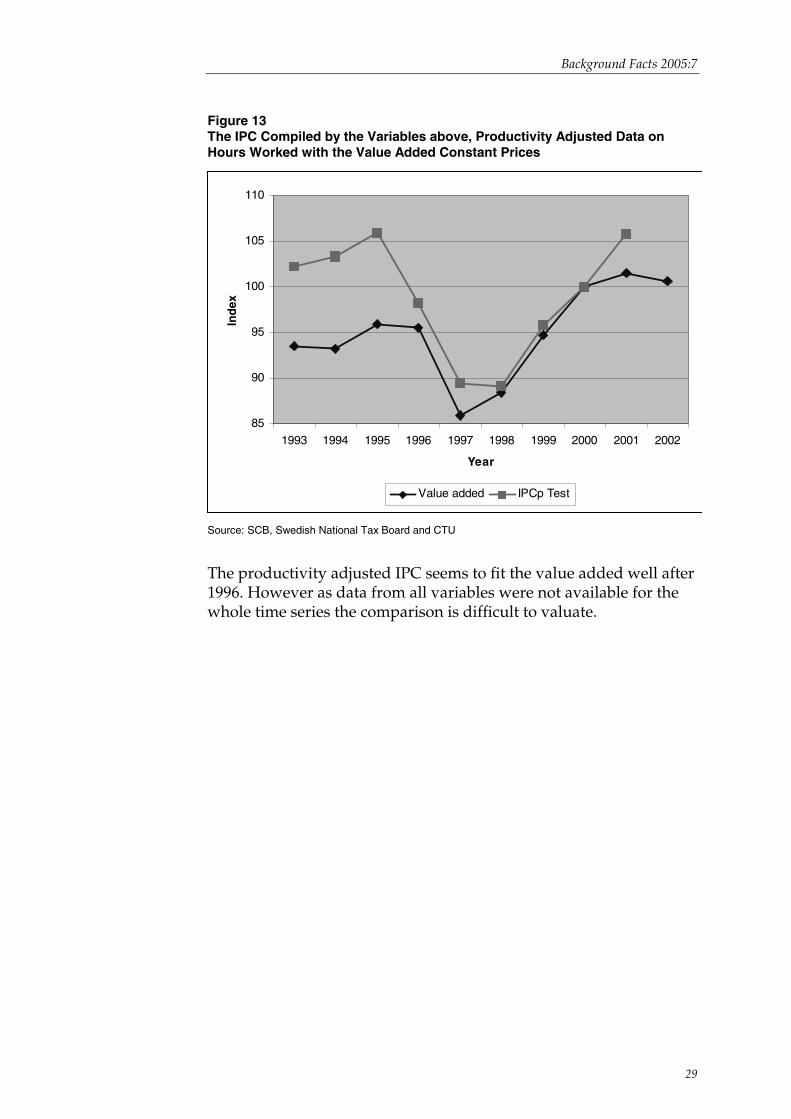
Figure 13 The IPC Compiled by the Variables above, Productivity Adjusted Data on Hours Worked with the Value Added Constant Prices
85
90
95
100
105
110
1993 1994 1995 1996 1997 1998 1999 2000 2001 2002
Year
Ind
ex
Value added IPCp Test
Source: SCB, Swedish National Tax Board and CTU
The productivity adjusted IPC seems to fit the value added well after 1996. However as data from all variables were not available for the whole time series the comparison is difficult to valuate.
Background Facts 2005:7
Statistiska centralbyrån 30
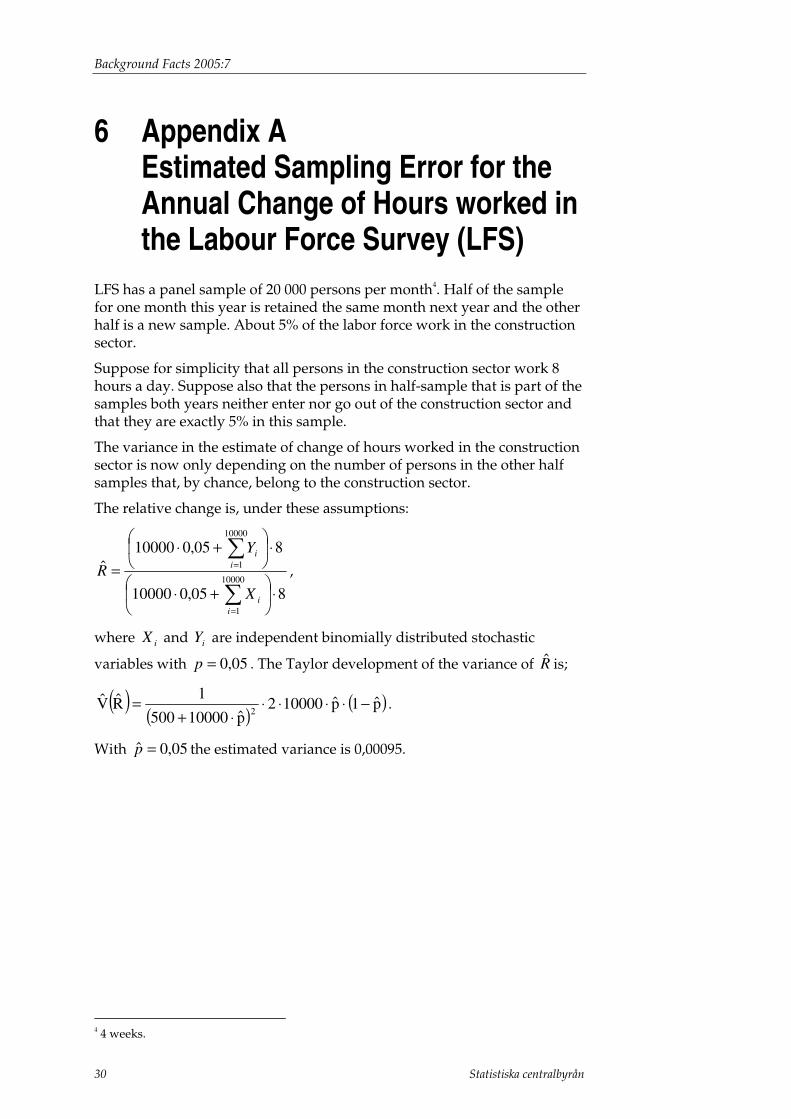
6 Appendix A Estimated Sampling Error for the Annual Change of Hours worked in the Labour Force Survey (LFS) LFS has a panel sample of 20 000 persons per month4. Half of the sample for one month this year is retained the same month next year and the other half is a new sample. About 5% of the labor force work in the construction sector.
Suppose for simplicity that all persons in the construction sector work 8 hours a day. Suppose also that the persons in half-sample that is part of the samples both years neither enter nor go out of the construction sector and that they are exactly 5% in this sample.
The variance in the estimate of change of hours worked in the construction sector is now only depending on the number of persons in the other half samples that, by chance, belong to the construction sector.
The relative change is, under these assumptions:
805,010000
805,010000ˆ
10000
1
10000
1
⋅⎟⎠
⎞⎜⎝
⎛ +⋅
⋅⎟⎠
⎞⎜⎝
⎛ +⋅=
∑
∑
=
=
ii
ii
X
Y
R ,
where iX and iY are independent binomially distributed stochastic
variables with 05,0=p . The Taylor development of the variance of R̂ is;
( )( )
( )p̂1p̂100002p̂10000500
1R̂V̂
2−⋅⋅⋅⋅
⋅+= .
With 05,0ˆ =p the estimated variance is 0,00095.
4 4 weeks.

2004:1 Hjälpverksamhet. Avrapportering av projektet Systematisk hantering av hjälpverksamhet
2004:2 Report from the Swedish Task Force on Time Series Analysis
2004:3 Minskad detaljeringsgrad i Sveriges officiella utrikeshandelsstatistik
2004:4 Finansiellt sparande i den svenska ekonomin. Utredning av skillnaderna i finansiellt sparande Nationalräkenskaper, NR – Finansräkenskaper, FiR Bakgrund – jämförelser – analys
2004:5 Designutredning för KPI: Effektiv allokering av urvalet för prismätningarna i butiker och tjänsteställen. Examensarbete inom Matematisk statistik utfört på Statistiska centralbyrån i Stockholm
2004:6 Tidsserieanalys av svenska BNP-revideringar 1980–1999
2004:7 Labor Quality and Productivity: Does Talent Make Capital Dance?
2004:8 Slutrapport från projektet Uppsnabbning av den ekonomiska korttidsstatistiken
2004:9 Bilagor till slutrapporten från projektet Uppsnabbning av den ekonomiska kort- tidsstatistiken
2004:10 Förbättring av bortfallsprocessen i Intrastat
2004:11 PLÖS. Samordning av produktion, löner och sysselsättning
2004:12 Net lending in the Swedish economy. Analysis of differences in net lending National accounts (NA) – Financial accounts (FA). Background – comparisons - analysis
2004:13 Testing for Normality and ARCH. An Empirical Study of Swedish GDP Revisions 1980–1999
2004:14 Combining leading indicators and a flash estimate
2004:15 Comparing welfare of nations
2004:16 ES-avdelningens utvecklingsplan 2004
2004:17 Den svenska konsumentprisindexserien (KPI), 1955–2004. En empirisk studie av säsongsmönstret. En tillämpning av TRAMO/SEATS
2004:18 Skola, vård och omsorg i privat regi. En sammanställning av statistik
2005:1 An ignorance measure of macroeconomic variables
2005:2 Svenska hälsoräkenskaper. Ett system framtaget inom ramen för de svenska nationalräkenskaperna
2005:3 The sample project. An evaluation of pps sampling for the producer and import price index
2005:4 Finansiellt sparande i den svenska ekonomin. Utredning av skillnaderna i finan- siellt sparande. Nationalräkenskaper, NR – Finansräkenskaper, FiR. Slutrapport
2005:5 Net lending in the Swedish economy. Analysis of differences in net lending National accounts, NA – Financial accounts, FA. Final report
2005:6 Varför får NR motstridiga uppgifter? Statistikens samanvändbarhet studerad inom ramen för Nationalräkenskaperna
