evaluation of the pi3k pathway and downstream effects … · evaluation of the pi3k pathway and...
TRANSCRIPT

Univers
ity of
Cap
e Tow
n
Evaluation of the PI3K pathway and
downstream effects in Her-2 positive and
negative breast carcinomas
by
ANNA MAGDALENA (ANINA) RADEMAN
VJRANN002
SUBMITTED TO THE UNIVERSITY OF CAPE TOWN
In fulfilment of the requirements for the degree
MSc (Med) in Anatomical Pathology
Division of Anatomical Pathology
Department of Clinical Laboratory Sciences
Faculty of Health Sciences
UNIVERSITY OF CAPE TOWN
Date of Submission: February 2014
Supervisor: Professor D. Govender
Division of Anatomical Pathology
UNIVERSITY OF CAPE TOWN

The copyright of this thesis vests in the author. No quotation from it or information derived from it is to be published without full acknowledgement of the source. The thesis is to be used for private study or non-commercial research purposes only.
Published by the University of Cape Town (UCT) in terms of the non-exclusive license granted to UCT by the author.
Unive
rsity
of C
ape
Town

DECLARATION
I, ANNA MAGDALENA (ANINA) RADEMAN, hereby declare that the work on
which this dissertation is based is my original work (except where
acknowledgements indicate otherwise) and that neither the whole work nor
any part of it has been, is being, or is to be submitted for another degree in
this or any other university. I empower the university to reproduce for the
purpose of research either the whole or any portion of the contents in any
manner whatsoever.
Signature: …………………………………
Date: …………………………………….

ACKNOWLEDGEMENTS
First of all to my supervisor Professor Dhiren Govender, thank you for your
guidance, advice, patience and assistance with this project. I would not have
been able to do this without you.
To Heather Mcleod, thank you for your willingness and patience in teaching
me to cut FFPE sections and sharing your expertise on IHC techniques.
Henri Carrara, (Biostatistician) thank you so much for all your patience, help
and assistance and sharing your statistical knowledge and expertise.
Dr H-T (Tony) Wu (NHLS), thank you for your input in this study.
Prof R Abratt, Dr I Parker and all staff at Radiation Oncology at GSH, thank
you for allowing me access to the medical records. Dr Albert van Jaarsveld,
thank you for your help in deciphering all those clinical records.
Dr George Loots, Michelle Jansen and nursing staff at GVI oncology,
Bellville, for allowing me access to your medical records, for your assistance
and patience and the wonderful work that you do, I thank you
Dr Margie Venter, Dr Ronne Uijs, Lorraine Sefela and Wilna Beneke at GVI
oncology, Panorama, thank you so much for your willingness to cooperate
and providing me with the much needed clinical information
Dr Francois Joubert (Knysna), a special thank you for going out of your way
to find me that critical clinical information.
Dr Elizabeth Coertse, Karin and Mathilda at Cape oncology, thank you so
much for allowing me access to your medical records and all your assistance
in the process.

Dr Ross Millin, Nolene Behr and staff at the Pathcare laboratory, N1city,
thank you for allowing me access to your tissue blocks. Ingrid, thank you for
all your help in retrieving all those pathology reports
Dr Willouw de Klerk (then Davies pathology), thank you for allowing me the
use of your tissue blocks and all your help in making it possible
To my mom who bravely fought but whom I have lost to breast cancer and all
those affected it, you were my inspiration.
Lastly, I want to thank my Heavenly Father for giving me the strength and
perseverance to complete this project.

ABSTRACT
Breast cancer management continues to be a challenge due to the
heterogeneity of the disease and the fact that individuals with the same stage
and pathological diagnosis may respond differently to treatment as a result of
differences in gene expression. Several components of the Her-2/PI3K/Akt
pathway were evaluated for their relevance as potential prognostic markers or
indicators for treatment. A secondary objective was to evaluate the CISH
technique for its suitability for analysis of Her-2 gene amplification on archived,
Papanicolaou-stained fine needle aspiration (FNA) samples.
Tissue blocks from a retrospective series of 93 primary breast carcinoma
cases were selected, based on their Her-2 status. Twenty six of these cases
received trastuzumab treatment while 67 did not. Expression of Her-2, ER,
PI3K, PTEN, p-Akt, BCL2, NFκB, MDM2 and p53 were analysed and
compared with various clinicopathological features. The CISH technique was
evaluated for its suitability for analysis of Her-2 gene amplification on
archived, Papanicolaou-stained FNA samples.
Her-2(+) patients showed clear benefit from trastuzumab treatment although it
was not significant. Comparing Her-2 expression with downstream components
in the PI3K/Akt pathway and clinicopathological parameters, significant
associations were found between Her-2(+) and high NFκB expression
(p=0.035), Her-2(+) and ductal carcinomas (p=0.006) and Her-2(+) and high
tumour grade (p=0.004). There was no significant association between PI3K
and PTEN expression. A significant association was found between PI3K
expression and lymphovascular invasion (p=0.012). This study also found a
strong association between both lymphovascular and lymph node involvement
and a subgroup of breast cancers: Her-2(+)/ER(+)/PI3K(high expression), which
was even stronger than the previously reported Her-2(+)/ER(+) subgroup. High
p-Akt expression was an indicator of good prognosis. The absence of p-Akt
expression was associated with a five fold increase in the risk of death
compared to cases showing high p-Akt expression (HR 5.1; CI1.5-17.3).
Significant associations were also found between high p-Akt and high MDM2

expression (p=0.040) and between high p-Akt and high NFκB expression
(p=0.014). High MDM2 expression was associated with an absence of distant
metastasis (p=0.017) and reduced risk for death. Patients with tumours
showing low MDM2 expression had a significant 3.2 fold increase in risk of
death compared to those with MDM2 high category tumours (HR 3.2; CI1.1 –
16.7). A strong association was also found between high MDM2 expression
and ductal carcinomas (p=0.051).
This study confirmed the value of some markers already identified by other
studies but also identified new markers as possible indicators of prognosis and
treatment. These findings however need to be evaluated in a larger study.
In addition, a 100% concordance was found between Her-2 CISH results on
corresponding cytopathology and histopathology samples which serve as
evidence that the Her-2 CISH technique can be successfully performed not only
on paraffin embedded tissue sections but also on stained and archived FNA
samples that have been de-stained.

TABLE OF CONTENTS
Title page
Declaration ii
Acknowledgement iii
Abstract v
Table of Contents vii
Abbreviations xvii
Chapter 1 Introduction 1
Chapter 2 Literature Review 3
2. Components of the Her-2/PI3K/Akt pathway 3
2.1 HER-2 3
2.1.1 Structure and function 3
2.1.2 Interactions with other proteins 5
2.1.3 Clinical implications 5
2.2 PI3K 9
2.2.1 Structure and function 9
2.2.2 Clinical implications 11
2.3 PTEN 12
2.3.1 Structure and function 12
2.3.2 Clinical implications 14
2.4 Akt 16
2.4.1 Structure and function 16
2.4.2 Clinical implications 20
2.5 NF-κB 21
2.5.1 Structure and function 21
2.5.2 Clinical implications 24
2.6 p53 25
2.6.1 Structure and function 25
2.6.2 p53 activation following DNA damage 27
2.6.3 Cell cycle arrest and DNA repair 28
2.6.4 Apoptosis 30

2.6.5 Interactions with other proteins / cellular components 31
2.6.6 Clinical implications 32
2.7 MDM2 35
2.7.1 Structure and function 35
2.7.2 Clinical implications 37
2.8 BCL2 37
2.8.1 Structure and function 37
2.8.2 Clinical implications 40
2.9 Oestrogen Receptor 40
2.9.1 Structure and function 40
2.9.2 Clinical implications 42
2.10 Aims 43
Chapter 3 Materials and methods 44
3.1 Ethical Approval 44
3.2 Sample selection 44
3.3 Data Collection 44
3.4 Immunohistochemistry (IHC) 45
3.4.1 Buffers and reagents used 45
3.4.1.1 Phosphate buffered saline (PBS) pH7.6 45
3.4.1.2 Tris-HCl buffered saline (TBS) pH7.6 46
3.4.1.3 0.1M Citrate buffer pH6.0 46
3.4.1.4 1mM EDTA pH8.0 46
3.4.1.5 1% Copper sulphate 46
3.4.1.6 Scotts tap water 47
3.4.2 Controls 47
3.4.3 Method for IHC 47
3.4.4 Evaluation of slides 51
3.5 Chromogenic in-situ hibridization (CISH) 52
3.5.1 Probe 52
3.5.2 Sample pre-treatment for CISH 52
3.5.3 Preparation of archived cytology slides for CISH 52
3.5.4 Histopathological sample pre-treatment 52

3.5.5 Deparaffinization 52
3.5.6 Heat pre-treatment 53
3.5.7 Enzyme digestion 53
3.5.8 Dehydration in graded ethanol series 53
3.5.9 Denaturation and hybridization 53
3.5.10 Stringent wash (Day 2) 54
3.5.11 Immunodetection 54
3.5.12 Counterstaining and mounting 54
3.5.13 Slide evaluation 55
3.6 Her-2 IHC and Her-2 CISH on corresponding histopathology
and cytopathology specimens
55
3.7 Determining the apoptotic index 56
3.8 Statistical analysis 56
Chapter 4 Results 58
4.1 Age distribution 58
4.2 Racial profile 58
4.3 Clinicopathological characteristics 59
4.4 Treatment 59
4.5 Immunohistochemistry results 61
4.5.1 Her-2 61
4.5.2 ER 62
4.5.3 PI3K 63
4.5.4 PTEN 64
4.5.5 p-Akt 65
4.5.6 MDM2 67
4.5.7 NFκB 68
4.5.8 BCL2 69
4.5.9 p53 69
4.6 Association between clinicopathological variables and protein
expression
70
4.6.1 Age 70
4.6.2 Tumour type 71

4.6.3 Tumour grade 71
4.6.4 Lymphovascular invasion 72
4.6.5 Lymph node involvement 72
4.6.6 Distant metastasis 72
4.6.7 Apoptotic index 72
4.7 Survival analyses 73
4.7.1 Survival analysis according to trastuzumab treatment 73
4.7.2 Survival analysis according to Her-2 expression 74
4.7.3 Survival analysis according to PI3K expression 75
4.7.4 Survival according to PTEN expression 76
4.7.5 Survival analysis according to p-Akt expression 78
4.7.6 Survival analysis according to NFκB expression 79
4.7.7 Survival analysis according to MDM2 expression 79
4.7.8 Survival analysis according to BCL2 expression 80
4.7.9 Survival analysis according to p53 expression 80
4.7.10 Survival analysis according to the apoptotic index 83
4.7.11 Survival analysis according to age group 85
4.8 Comparing test methods IHC and CISH in Her-2 evaluation
on corresponding histopathological and cytopathological
specimens
87
Chapter 5 Discussion 93
5.1 Introduction 93
5.2 Trastuzumab benefit 93
5.3 Her-2 93
5.4 PI3K 97
5.5 PTEN 99
5.6 p-Akt 101
5.7 BCL2 103
5.8 MDM2 104
5.9 NFκB 105
5.10 p53 107
5.11 Oestrogen receptor (ER) 108

5.12 Age 108
5.13 Her-2 ISH and CISH on matched cytopathology and
histopathology samples
111
Chapter 6 Conclusion and future research 113
References 115
Appendices 142

Tables
Table 1 Summary of antibodies, antigen retrieval, clones, dilutions,
controls and incubation times
50
Table 2 Scoring of Her-2 results 51
Table 3 ER evaluation 51
Table 4 Evaluation of all other IHC results 51
Table 5 Clinicopathological characteristics 60
Table 6 Treatment combinations 61
Table 7 Comparison between Her-2 IHC and Her-2 CISH and
between Her-2 CISH on corresponding histopathological
and cytopathological specimens
88

Figures
Figure 1 The Her-2/PI3K/Akt signalling pathway 3
Figure 2 Cell cycle regulation by p53 29
Figure 3 The p53-mediated apoptotic pathway 31
Figure 4 Histogram showing the age distribution of patients 58
Figure 5 Representative IHC staining of Her-2 62
Figure 6 Representative IHC staining of ER 63
Figure 7 Representative IHC staining of PI3K 64
Figure 8 Representative IHC staining of PTEN 65
Figure 9 Representative IHC staining of p-Akt 66
Figure 10 Representative IHC staining of MDM2 67
Figure 11 Representative IHC staining of NFκB 68
Figure 12 Representative IHC staining of BCL2 69
Figure 13 Representative IHC staining of p53 70
Figure 14 The Kaplan-Meier graph comparing overall survival
between cohort C and cohort B
73
Figure 15 The Kaplan-Meier graph comparing disease free
survival between cohort C and cohort B
74
Figure 16 The Kaplan-Meier graph for OS for cohort A
according to Her-2 expression
74
Figure 17 The Kaplan-Meier graph for OS for cohort B
according to Her-2 expression
75
Figure 18 The Kaplan-Meier graph for overall survival for
cohort A according to PI3K expression
76
Figure 19 The Kaplan-Meier graph for overall survival in
cohort C according to PTEN expression
77
Figure 20 The Kaplan-Meier graph for overall survival for
cohort A according to p-Akt expression
79
Figure 21 The Kaplan-Meier graph for DFS for cohort A
according to MDM2 expression
80
Figure 22 The Kaplan-Meier graph for overall survival
according to p53 expression for cohort A
81

Figure 23 The Kaplan-Meier graph for overall survival
according to p53 expression for cohort B
82
Figure 24 The Kaplan-Meier graph for disease free survival for
cohort A according to p53 expression
83
Figure 25 The Kaplan-Meier graph for overall survival for
cohort A according to the apoptotic index
84
Figure 26 The Kaplan-Meier graph for DFS for cohort A
according to the apoptotic index
85
Figure 27 The Kaplan-Meier graph for overall survival for
cohort A according to age category
86
Figure 28 The Kaplan-Meier graph for overall survival
according to age category for cohort B
87
Figure 29 Her-2 CISH results (control slides) 89
Figure 30 Her-2 CISH results 90
Figure 31 Her-2 CISH results 91
Figure 32 Her-2 CISH results 92

Appendices
Appendix 1 Correlation or Her-2 results with protein expression 142
Appendix 2 Correlation of ER status with protein expression 143
Appendix 3 Correlation of PI3K results with protein expression 144
Appendix 4 Correlation of PTEN results with protein expression 145
Appendix 5 Correlation of p-Akt results with protein expression 146
Appendix 6 Correlation of MDM2 results with protein expression 147
Appendix 7 Correlation of NFκB results with protein expression 148
Appendix 8 Correlation of BCL2 results with protein expression 149
Appendix 9 Correlation of p53 results with protein expression 150
Appendix 10 Association between age and level of protein
expression
151
Appendix 11 Association between tumour type and protein
expression
152
Appendix 12 Association between tumour grade and protein
expression
153
Appendix 13 Association between lymphovascular invasion and
level of protein expression
154
Appendix 14 Association between lymph node metastasis and protein expression
155
Appendix 15 Association between distant metastasis (other than
regional lymph nodes) and level of protein
expression
156
Appendix 16 Association between apoptotic index and protein
expression
157
Appendix 17 Median and 5 year OS and DFS for the total
population of 93 subjects according to the Kaplan-
Meier graph
158
Appendix 18 Median and 5 year OS and DFS for the cohort of 67
patients that did not receive trastuzumab treatment
according to the Kaplan-Meier graph
159

Appendix 19 Median and 5 year OS and DFS for the cohort of 26
patients that did receive trastuzumab treatment
according to the Kaplan-Meier graph
160
Appendix 20 Analysis of overall survival (OS) of complete sample
of 93 cases, using Cox regression analysis adjusted
for age
161
Appendix 21 Analysis of overall survival for the cohort of 67 cases
that has not received trastuzumab treatment, using
Cox regression analysis adjusted for age
163
Appendix 22 Analysis for disease free survival (DFS) of complete
sample, using Cox regression analysis adjusted for
age (N=79)
164

ABBREVIATIONS
AIB1 amplified in breast cancer 1
ARF alternate reading frame
Akt acute transforming retrovirus from AKR thymoma
AMP adenosine monophosphate
AMPK AMP-activated protein kinase
Apaf-1 apoptotic protease-activity factor 1
ATM ataxia-telangiectasia mutated
BAFF B-cell activating factor
BAX BCL2-associated X protein
BCL2 B-cell lymphoma 2
BH3 Bcl-2 homology domain 3
CAF cyclophosphamide, doxorubicin (Adriamycin) and 5-
fluorouracil
c-AMP cyclic adenosine monophosphate
CBP CREB-binding protein
c-Cbl Casitas B-lineage lymphoma
c-FLIP (FADD-like IL-1β-converting enzyme) inhibitory protein
CDC37 cell division cycle-37
Chk2 checkpoint kinase 2
c-IAP1 cellular inhibitor of apoptosis protein 1
c-IAP2 cellular inhibitor of apoptosis protein 2
CISH chromogenic in-situ hybridization
CDK cyclin dependent kinase
CK2 casein kinase 2
C-RAF RAF proto-oncogene serine/threonine-protein kinase (cellular-
RAF gene)
CREB c-AMP response element-binding protein
CTMP carboxyl-terminal modulator protein
DAB 3,3’-diaminobenzidine-tetrahydrochloride
DFS disease free survival
DNA-DK DNA dependent kinase
ECD extracellular domain
EGF epidermal growth factor
EGFR epidermal growth factor receptor
ELAM1 endothelial-leukocyte adhesion molecule 1
ER oestrogen receptor
ERK extracellular signal-related kinase
FAC fluorouracil, doxorubicin (Adriamycin) and cyclophosphamide
FADD Fas-associated death domain
FAK focal adhesion kinase
FDA food and drug administration
FISH fluorescent in-situ hybridization
FLIPL Fas-associated death domain-like interleukin-1-ß-converting
enzyme-inhibitory protein
FKHRL1 forkhead-related family of mammalian transcription factor-1
FOXO forkhead box O
GADD45 growth arrest and DNA damage-inducible 45 proteins
GDP guanosine diphosphate
GEF guanine nucleotide exchange factor
GM-CSF Granulocyte-macrophage colony-stimulating factor
GRB2 growth factor receptor-bound protein-2
GROα growth-regulated oncogene α
GSK-3 glycogen synthase kinase 3
GT Gallotannin
GTP guanosine triphosphate
HR hazard ratio
HSP90 heat shock protein-90
IGF1R insulin-like growth factor 1 receptor
HF hinge fragment
ICAM1 intercellular adhesion molecule 1
IHC immunohistochemistry
IκB nuclear factor of kappa light polypeptide gene enhancer in B-
cells inhibitor
IKK IκB kinase
IL interleukin
ILK integrin-linked kinase
IRS insulin receptor signaling
JAK Janus kinase
JNK c-Jun N-terminal kinase
K-RAS V-Ki-ras2 Kirsten rat sarcoma viral oncogene homolog
LTβ lymphotoxin β
mTOR mammalian target of rapamycin
mTORC1 mammalian target of rapamycin complex 1
MAPK mitogen-activated protein kinase
MAPKAPK2 mitogen-activated protein kinase activated protein kinase-2
MCP-1 monocyte chemotactic protein-1
MDM2 mouse double minute 2 homolog
MEK MAPK/ERK kinase
MMP mitochondrial membrane permeabilization
MMP2 matrix metalloproteinase 2
MMP9 matrix metalloproteinase 9
NFκB nuclear factor-kappa B
Nck non-catalytic region of tyrosine kinase adaptor protein
NCoR Nuclear hormone receptor Co-Repressor
NEMO NF-kappa-B essential modulator
NES nuclear export signal
NIK NF-κB inducing kinase
NLS nuclear localization sequence
NO nitric oxide
NoLS nucleolar localization signal
NPI Nottingham prognostic index
OS overall survival
PBS phosphate buffered saline
PCAF p300/CBP-associated factor
PCNA proliferating cell nuclear antigen
PDK1 phosphoinositide dependent kinase-1
PH plekstrin homology
PHLPP PH domain leucine-rich repeat phosphatases

PI phosphatidylinositol
PI3K phosphoinositide 3 kinase
PIDD p53-induced death domain protein
PIK phosphoinositide kinase
PIP2 phosphatidylinositol (4,5)-bisphosphate
PIP3 phosphatidylinositol (3,4,5)-triphosphate
PKB protein kinase B (Akt)
PKC protein kinase C
PLC-γ phospholipase-C-gamma
PR progesterone receptor
pRb retinoblastoma protein / tumour suppressor
PRK2 protein kinase C-related kinase-2
PtdIns phosphoinositol
PTEN phosphatase and tensin homolog deleted on chromosome 10
PTK protein tyrosine kinase
PUMA p53 up-regulated modulator of apoptosis
Pxn paxillin
RAF rapidly accelerated fibrosarcoma
RAS rat sarcoma
RE response elements
RH Rel homology
RING really interesting new gene
RIP receptor-interacting protein
rRNA ribosomal RNA
RTK receptor tyrosine kinase
5S rRNA 5S ribosomal RNA in eukaryotes binds to the L5 ribosomal
protein
SH2 Src homology-2 domain
SH3 Src homology-3 domain
SHC SH2 domain containing transforming protein
SHIP SH2-containing inositol phosphatase
SMRT Silencing mediator or Retinoic acid and Thyroid hormone
receptors

SOS sun of sevenless
SRC1 steroid receptor co-activator 1
STAT signal transducer and activator of transcription
TBS tris-HCl buffered saline
TopIIα topoisomerase II alpha
TNF tumor necrosis factor
TNF–R1 tumour necrosis factor-receptor1
TRADD tumour necrosis factor receptor 1-associated death domain
TRAF2 TNF receptor-associated factor 2
TSC1 tuberous sclerosis complex 1
TSC2 tuberous sclerosis complex 2
VCAM1 vascular cell adhesion molecule 1
VEGF vascular endothelial growth factor
V-RAF virus-induced rapidly accelerated fibrosarcoma
WNT wingless-related integration site
XIAP X-linked inhibitor of apoptosis

CHAPTER 1
INTRODUCTION
1
Breast carcinoma is the most common malignancy in woman in many
industrialized countries but its management continues to be challenging
because of the heterogeneity of the disease (Jemal et al. 2005). It is widely
acknowledged that individuals with the same stage and pathological diagnosis
may respond differently to treatment as a result of differences in gene
expression. The gene expression profile predicts the tumour phenotype and the
sensitivity to treatment (Pusztai 2008). Despite the substantial effort that has
been invested in the identification and validation of additional prognostic
markers aimed at improving risk stratification and treatment of breast cancer,
very few molecular markers have proven reliable in the clinical setting.
Clinically relevant molecular tests currently performed on breast carcinomas
that can be used for early detection, prediction of prognosis, disease monitoring
and gene-specific therapy, are limited.
One of the molecular markers that is currently available and for which a
targeted monoclonal antibody therapy is available, is Her-2. Overexpression of
Her-2 is usually associated with the amplification of the Her-2 gene and a poor
prognosis (Owens et al. 2004).
Trastuzumab, better known as Herceptin®, is a humanised targeted antibody
against the extracellular domain (ECD) of the Her-2 protein. The mechanisms
of action of trastuzumab include internalization and degradation of the Her-2
receptor resulting in reduced downstream signalling through the PI3K and
MAPK pathways which in turn lead to the induction of the cyclin dependent
kinase inhibitor, p27Kip1, responsible for promoting cell cycle arrest and
apoptosis.
Other mechanisms of action include the phosphorylation and activation of the
Akt/PI3K-inhibiting molecule, PTEN, inhibition of PI3K downstream effectors
such as Akt and mTOR, inhibition of Her-2 ECD proteolysis and reduced VEGF
production (Sliwkowski et al. 1999; Cuello M et al. 2001; Lane et al. 2001;
Molina et al. 2001; Yakes et al. 2002; Nagata et al. 2004; Owens et al. 2004).
The theory that trastuzumab inhibits proteolysis of Her-2 ECD is controversial

2
though. According to a study by Liu et al. (2007), trastuzumab had little or no
effect on the shedding of Her-2 ECD.
Trastuzumab has been shown to reduce the risk of recurrence of Her-2 positive
tumours by half and the mortality rate by one third in patients with early stage
breast cancer (Romond et al. 2005). Despite the clear benefit of trastuzumab
treatment in terms of disease free survival (DFS) and overall survival (OS),
about one third of patients with Her-2 overexpressing carcinomas exhibit
primary resistance to this treatment and the majority of patients with metastatic
breast cancer, who initially respond to trastuzumab, show disease progression
within one year of commencement of treatment (Nahta and Esteva 2006).
The reported cardiac failure in 28% of patients treated with trastuzumab and the
cost of trastuzumab treatment (around R400 000,00 per annum), clearly
indicate the need for improved knowledge of factors that would predict
treatment response (Suter et al. 2004). Further studies could ensure the
selection of only patients that would benefit from this or any other treatment and
enable oncologists to select the treatment best suited for each individual based
on the genetic profile of their cancer. Based on these facts, Her-2 status alone
does not seem to be sufficient to justify trastuzumab treatment. Recently, a
number of biomarkers have been identified as potentially useful predictors of
response to trastuzumab-based therapies. These include components of the
Her-2 downstream signalling pathway, such as PTEN whose activity contributes
to the efficacy of trastuzumab, while PI3K co-amplification may render
trastuzumab ineffective (Nagata et al. 2004).
We have evaluated these as well as other components of the Her-2/PI3K/Akt
pathway for their relevance as potential prognostic markers.

CHAPTER 2 LITERATURE REVIEW

3
Figure 1: The Her-2/PI3K/Akt signalling pathway
Adapted from Hennessy et al. (2005)
2. Components of the Her-2/PI3K/Akt pathway
2.1 HER-2
2.1.1 Structure and function
The Her-2 gene is a proto-oncogene located on the long arm of human
chromosome 17(q11.2-q12). This gene encodes a 185kD transmembrane
tyrosine kinase receptor protein (p185HER,Her-2/neu, erbB-2) which is one of
four related cell surface receptors, Her-1(erbB-1,EGFR), Her-2 (erbB-2), Her-3
(erbB-3) and Her-4 (erbB-4)(Rubin and Yarden 2001). These receptors (with
the exception of Her-2 which has a closed ligand binding site) have an
extracellular domain that is cysteine rich and acts as a ligand/growth factor
receptor binding site, a lipophilic transmembrane domain as well as an
intracellular protein tyrosine kinase (PTK) domain (van der Geer et al. 1994).
Her2 EGFR
Growth factor Her3 Her4
P P P
P IRS
PTEN
p110 p85
Akt
P P P P MDM2 NF- κB Bad BCL2
SHC
P v
GRB2
PIP3 PIP2
PIP2 PIP3
p53
MAPK/ERK signaling
PI3K
Apoptosis
K-RAS
GDP
GTP
Cell cycle arrest DNA repair Apoptosis

4
Binding of an epidermal growth factor (EGF) to the epidermal growth factor
receptor (EGFR) binding site or high receptor density (overexpression) leads to
the formation of homo- or heterodimers with other members of the Her-family.
Receptor dimerization leads to the activation of intrinsic PTK activity, as well as
tyrosine autophosphorylation. This in turn leads to the recruitment of a variety
of signalling proteins, including the adaptor proteins, growth factor receptor-
bound protein-2 (GRB2), Src homology-2 (SH2) domain containing transforming
protein (SHC), nck adaptor protein (Nck), phospholipase-C-gamma (PLC-γ),
signal transducer and activator of transcription (STAT), amongst other proteins
(Klapper et al. 2000; Kuhnen and Winter 2006; Smith et al. 2006). Sequentially,
these proteins are responsible for kinase-mediated activation of downstream
signal transduction pathways such as the PI3K/Akt pathway, the mitogen-
activated protein kinase (MAPK) pathway, the Janus kinase/activator and signal
transducer pathway (JAK) and the PLC-γ pathway (Ross et al. 2003). The SH2
domain of GRB2 can either bind directly to phosphotyrosines of the activated
EGFR or it can bind EGFR indirectly through the adaptor protein SHC. The
SH3 domains of GRB2 are known to bind Son of Sevenless (SOS), which is an
exchange factor for the GTPase, K-RAS, as well as c-Cbl, a regulator of EGFR
endocytosis. Binding of the GRB2-SOS complex to the activated EGFR leads
to GTP loading of K-RAS and then to the activation of K-RAS effectors, such as
C-RAF kinases and PI3K. C-RAF in turn is responsible for the phosphorylation
or activation of extracellular signal-related kinase (ERK) and MAPK/ERK kinase
(MEK) (Figure 1) (Meng S et al. 2005; Immervoll et al. 2006).
The Her-2 surface receptor has no ligand binding domain of its own and
therefore cannot bind growth factors. It does however, bind tightly to other
ligand-bound EGFR family members to form heterodimers that stabilize ligand
binding. In fact, Her-2 is found to be the preferred dimer partner for other
members of the HER family. Heterodimers and especially those containing
Her-2, result in stronger and prolonged signalling (Klapper et al. 2000). The
reason for this is the relatively slow rate of ligand dissociation from Her-2
containing heterodimers as well as its slower rate of internalisation (Alroy and
Yarden 1997). This effect is enhanced when Her-2 is amplified or
overexpressed and leads to enhanced responsiveness to growth factors and

5
ultimately malignant growth (Rubin and Yarden 2001). The most potent
heterodimer combination is Her2-Her3, which is also the combination most
commonly found in malignancy (Alroy and Yarden 1997; Pinkas-Kramarski et al.
1998). In fact, Her-2 and Her-3 were described as obligate heterodimers due to
their inability to signal as homodimers. This is attributed to their unique
structural features. Her-2 has a closed ligand-binding domain and Her-3 an
inactive kinase domain and yet when combined, they form the most potent
signalling unit when it comes to cell growth and development (Garrett et al.
2003 ).
The Her-2 pathway can also be activated via proteolytic cleavage of its
extracellular domain (ECD) resulting in a 95 kDa NH2-terminally truncated
membrane-bound fragment with kinase activity (Christianson et al. 1998).
2.1.2 Interactions with other proteins
A protein that was found to potentially play a role in Her-2 overexpression and
tumourigenesis is Muc4, which is a heterodimeric transmembrane glycoprotein
consisting of a mucin subunit (muc4α) and a transmembrane subunit (muc4β)
(Sheng et al. 1990; Kozloski et al. 2010). Muc4 is a cell surface mucin with a
protective function, protecting the epithelium from injuries and infections by
keeping it lubricated (Hattrup and Gendler 2008). Abnormal expression of
Muc4 has been reported in a number of malignancies where it is believed to
play a role in cancer development by influencing cellular mechanisms that
promote cancer development, such as cell adhesion, promotion of oncogenesis
as well as cell signalling potential (Komatsu et al. 1997; Ponnusamy et al. 2008;
Yonezawa et al. 2008; Kozloski et al. 2010). Muc4 is found to increase
phosphorylation of Her-2 and this ultimately results in the activation of the Akt
pathway (Carraway et al. 1999). Muc4 was also found to be responsible for
suppressing the internalization of Her2-Her3 and thus enhancing the surface
concentration of Her2-Her3 heterodimers (Funes et al. 2006).
2.1.3 Clinical implications
Her-2 is overexpressed in about 20-30% of breast carcinomas and associated
with high grade breast carcinomas, high incidence of recurrence, short

6
remission time, distant metastases and overall poor prognosis, especially in
lymph node positive disease (Slamon et al. 1987; Slamon et al. 1989; Owens et
al. 2004; Yaziji et al. 2004). Her-2 overexpression is rare in benign breast
disease and when present it is associated with an increased risk of subsequent
invasive breast cancer (Klapper et al. 2000; Stark et al. 2000).
In addition to predicting more aggressive tumour behaviour, Her-2
overexpression may also be predictive of response to both hormonal- and
chemotherapeutic agents. Her-2 overexpression has been associated with
resistance to tamoxifen treatment (Dowsett 2001; Konecny et al. 2003;
Johnston 2006). In fact, a few studies reported tamoxifen treatment to be
beneficial in Her-2(-)/ER(+) tumours, but not in Her-2(+)/ER(+) tumours. One
study suggested that tamoxifen treatment may actually have a detrimental effect
on Her-2(+) tumours (Borg et al. 1994; Lohrisch and Piccart 2001). According
to two preclinical studies, trastuzumab treatment is able to enhance the growth
inhibitory activity of anti-oestrogens (including tamoxifen) in Her-2(+)/ER(+)
breast tumours and may even reverse resistance of Her-2(+)/ER(+) tumours to
anti-oestrogens (Witters et al. 1997; Kunisue et al. 2000). One study reported
an improved outcome when Her-2(+)/ER(+) breast cancers in postmenopausal
patients were treated with cyclophosphamide, doxorubicin, and 5-fluorouracil
(CAF) regimen and tamoxifen (Albain et al. 2009). Her-2(+) tumours show
sensitivity to dose-intensive treatment with CAF but resistance to non-
anthracycline, non-taxane containing chemotherapeutic agents (Thor et al.
1998; Ellis et al. 2001; Ménard et al. 2001). Järvinen et al. (1999) suggested
that the mechanism of anthracyclin sensitivity in Her-2(+) tumours may be
related to the coexpression of Her-2 and TopIIα. They found TopIIα
amplifications or deletions in more than 80% of Her-2(+) tumours while no
TopIIα aberrations were found in Her-2(-) tumours.
Her-2 status is mainly detected by the immunohistochemistry (IHC), but the
methodological and specimen variability, the variety of antibodies available, the
lack of antibody sensitivity, the various scoring systems and the fact that the
score is not always very objective, raises questions about the reliability of this
method (Mezzelani et al. 1999). Fluorescent in-situ hybridization (FISH)

7
analysis on the other hand, is more objective, sensitive and reliable, but
requires more sophisticated equipment and experience in cytogenetics (Slamon
et al. 1987). Additionally, it is also much more expensive than the IHC method.
Chromogenic in-situ hybridization (CISH) could be a more economical
alternative to FISH, as it is said to be as sensitive and reliable as FISH. The
only downside is that it only allows for a single colour detection of one probe at
a time and in the case of polysomy of chromosome 17, it does not allow for
correction of Her-2 amplification (Vocaturo et al. 2006). At the time of this
study, only 2 CISH kits had FDA approval, namely Invitrogen’s “SPOT-light” kit
for Her-2 testing and more recently the HER2 CISH pharmDx™ Kit from DAKO.
Staining for Her-2 receptor overexpression by IHC and testing for Her-2/erb-B2
oncogene amplification by FISH or CISH encompass the current standard for
determining patient eligibility for trastuzumab-based therapy (Jemal et al. 2005).
Currently, local medical aid schemes will only approve trastuzumab treatment
for patients with cancers shown to overexpress Her-2 by FISH analysis and
may not accept an IHC (3+) result. A cost effective alternative would be to stain
for Her-2 with IHC and then to confirm only the (2+) cases with CISH or FISH.
One of the most important reasons for determining the Her-2 status of a patient
is that the intensity of the IHC staining or level of amplification with FISH would,
to an extent, predict the response to trastuzumab treatment (Burstein et al.
2001; Slamon et al. 2001). Vogel et al. (2002) reported a 35% response rate for
carcinomas with a Her-2 IHC score of (3+), while the (2+) cases showed only
negligible benefit from trastuzumab treatment. Likewise, Burstein et al. (2001)
reported a response rate of 34% in IHC (3+) carcinomas versus a 13%
response rate in IHC (2+) carcinomas.
Lane et al. (2000) reported that although treatment of Her-2 overexpressing
cells with monoclonal antibodies against the extracellular domain of Her-2
reduced phosphorylation and signalling of Her-2, it did not inhibit downstream
signalling. As a result of these findings, this group postulated that inhibiting
Her-2 receptor activity in Her-2 overexpressing tumours with the use of targeted
antibodies, does not necessarily predict the cellular response to the treatment.

8
One possible downside of the existing Her-2 tests is that they only detect gene
amplification or protein overexpression which does not necessarily reflect the
functional activity of the receptor. Interestingly, in Her-2(+) invasive breast
cancers, only 12% of Her-2 receptors appeared to be activated or
phosphorylated while more that 58% were found to be phosphorylated in ductal
carcinoma in situ (DiGiovanna et al. 2002). In a study involving 800 cases of
Her-2 overexpressing breast cancers, adverse prognosis was limited to the
cases displaying phosphorylated Her-2, suggesting that phosphorylated Her-2
may be a more powerful prognostic marker that Her-2 overexpression (Thor et
al. 2000).
Elevated levels of Her-2 ECD (p95) have been found in the sera of patients with
breast, ovarian and prostatic cancer (Leitzel et al. 1992; Myers et al. 1996;
Meden et al. 1997). The level of p95 in the serum was found to correspond to
the level of Her-2 expression and tumour load. Furthermore, this is also used
as a marker for metastatic disease and predictor of recurrence, survival and
response to anti-oestrogen therapy. Serum p95 has been reported to neutralize
the activity of anti-Her-2 antibodies like trastuzumab that has been designed
against the p95 domain of the Her-2 molecule (Leitzel et al. 1995; Molina et al.
1996; Brodowicz et al. 1997; Krainer et al. 1997). In addition, Christianson et al.
(1998) found a strong correlation between p95 expression and nodal positivity
in breast carcinomas but no significant correlation between p185 expression
and nodal status or any of the other prognostic factors. In a study by Scaltriti et
al. (2007), breast cancer cells were transfected with p95/Her-2 and Her-2 (full
length) and subjected to treatment with trastuzumab and lapatinib, a Her-2
tyrosine kinase inhibitor. The cells transfected with p95/Her-2 were resistant to
trastuzumab but responded well to lapatinib, indicating that breast cancers
expressing p95/Her-2 require alternative or additional anti-Her-2 treatment to
trastuzumab which is the current standard for Her-2-positive tumours. Finn et
al. (2009), however did not find p95/Her-2 status to be a predictor of lapatinib
benefit in Her-2(+) patients, although it correlated well with patient outcome,
regardless of treatment.

9
Other potential mechanisms of trastuzumab resistance includes alternative or
increased signalling through the PI3K/Akt pathway, downregulation of PTEN,
decreased receptor-antibody interaction due to cell surface proteins such as
Muc4. Muc4 was found to prevent trastuzumab binding by masking the
receptor or Her-2 related receptors and non-Her-2 receptors such as insulin-like
growth factor 1 receptor (IGF1R). IGF1R was found to be involved in crosstalk
with Her-2 in trastuzumab resistant cells (Price-Schiavi et al. 2002; Nagata et al.
2004; Diermeier et al. 2005; Nahta et al. 2005)
Multiple studies have shown that Her-2 overexpression or amplification does
play a substantial role in the prognosis of breast cancer and should be done on
all breast cancers. In fact, Her-2 amplification was found to be of greater
prognostic value than any other prognostic indicator, hormonal-receptor status
included (Slamon et al. 1987; Slamon 2004).
2.2 PI3K
2.2.1 Structure and function
There are three families of phosphoinositide kinases; phosphoinositide 3-
kinases (PI3Ks), PtdIns 4-kinases (PtdIns4Ks) and PtdIns-P(PIP) kinases
(PIP5Ks). These phosphoinositide kinases are responsible for phosphorylating
phosphoinositol (PtdIns), a phospholipid and phospholipase substrate that
forms part of the cell membrane and consists of a head group and five free
hydroxyl groups that can be phosphorylated.
Phosphorylated derivatives of phosphoinositol are called phosphoinositides (or
inositol phosphate second messengers) and are responsible for regulating
proliferation, vesicle trafficking, glucose transport, organisation of the
cytoskeleton, location and activity of intracellular proteins, platelet function as
well as cell survival (Fruman et al. 1998).
PI3K is a protein encoded by the gene, PIK3CA, which is a 34 kilobase gene
situated on chromosome 3q26.3 and contains 20 exons. Class IAPI3Ks are
composed of heterodimers or subunits, a 110-120 kDa catalytic domain or
kinase domain, p110, as well as an associated 61 kDa regulatory or adaptor
10
subunit, p85. The catalytic domain consists of an N-terminal region which binds
to the regulatory subunit, p85, a RAS protein (small GTP-binding protein)
binding region as well as a phosphoinositide kinase (PIK) region (Fruman et al.
1998). The catalytic domain possesses intrinsic protein kinase activity apart
from lipid kinase activity. The protein kinase phosphorylates serine residues
within the catalytic domain itself or within its associated regulatory subunit. This
phosphorylation of p85α by p110α at serine 608, results in downregulation of
the lipid kinase activity of p110α (Carpenter et al. 1993; Dhand et al. 1994;
Stoyanova et al. 1997; Vanhaesebroeck et al. 1997). The regulatory subunit,
p85, which usually associates with PI3K, lacks enzymatic activity but contains
the following modular units: an N-terminal Src-homology 3 (SH3) domain, two or
three proline-rich regions, a region similar to GTPase-activating proteins for Rho
protein binding (Rho GAPs), as well as two Src-homology 2 (SH2) domains,
one at the C-terminal (C-SH2) and one at the N-terminal (N-SH2) (Fruman et al.
1998). p85 is also responsible for regulating the activation and location of
p110α within the cell. At the cell membrane, the p85 subunit binds to the
phosphorylated receptor tyrosine kinase (RTK) which leads to conformational
changes in the p110 domain and in turn, results in kinase activation (Pommery
and Henichart 2005). Another way in which class IA PI3Ks are activated or
regulated is by RAS, which binds to the RAS protein binding region of p110.
RAS, in turn, is activated when the bound GDP is replaced by GTP during a
process of transition mediated by enzymes known as guanosine nucleotide
exchange factors (GEFs). Reverse transition is modulated by GTPase-
activating proteins (GAPs) which are responsible for promoting hydrolysis of the
bound GTP molecules at the end of the stimulation cycle (Riuz et al. 2007).
The RAS-GTP complex then activates downstream targets such as p110
(Rodriquez-Viciana et al. 1994). It is found that most of the activators of p110
via p85/pYMXM interaction, are also responsible for activating RAS (Druker et
al. 1990; Ling et al. 1992). RAS and most of the YMXM- containing proteins are
associated with the cell membrane, therefore recruitment of p85/p110
heterodimers not only enhances catalytic activity, but also moves the PI3K from
the cytoplasm to the cell membrane where its substrates and activator RAS
reside (Fruman et al. 1998). Activated PI3K is responsible for the
phosphorylation of membrane bound PIP2 (Phosphatidylinositol-3,4-

11
bisphosphate)to generate PIP3 (Phosphatidylinositol-3,4,5-trisphosphate)
(Pommery and Henichart 2005).
2.2.2 Clinical implications
Amplifications, deletions and somatic mutations of PIK3CA have been
implicated in many cancer types, such as breast, colon, stomach, lung, liver and
brain (Karakas et al. 2006). Campbell et al. (2004) discovered the highest
frequency (up to 40%) of PIK3CA missense mutations in breast cancers. “Hot
spots” for somatic mutations map to E542 and E545K in the helical (exon 9) and
H1047R in the catalytic (exon 20) domain of p110α (Campbell et al. 2004).
PIK3CA mutations lead to gain of function in PI3K signalling, which in turn leads
to disturbances in control of cell growth and survival resulting in a competitive
growth advantage, metastatic growth advantage and often therapy resistance.
In fact, mutations in exon 20 are believed to inhibit the therapeutic response to
EGFR-targeted therapies in patients with metastatic colorectal cancer (Kang et
al. 2005; De Roock et al. 2010).
Wang et al. (2011) found PIK3CA mutations to be more frequent in elderly
patients. Saal et al. (2005) reported a strong correlation between PIK3CA
mutations, ER, PR and Her-2 expression and lymph node metastases. In fact,
in the subgroup ER(+)/Her-2(+) and lymph node positive breast cancers,
PIK3CA mutations were present in 58% of cases. A strong inverse relation to
PTEN mutation was described where PTEN was functional or positive in 86% of
cancers bearing PIK3CA mutations. Mutations in both PIK3CA and PTEN
were rare. They could however not establish any significant relation between
PI3K status and disease free survival or overall survival (Saal et al. 2005).
Jensen et al. (2011) found that patients with PIK3CA mutations or high PI3K
pathway activation had a significantly worse overall survival despite adequate
treatment. They found no significant correlation between PTEN or pHer-2 and
patient outcome (Jensen et al. 2011). In an independent study, Aleskandarany
et al. (2010) found PI3K expression to be associated with poor prognostic
variables such as a higher grade and size, a higher proliferation factor, nodal
involvement and vascular invasion in breast cancer. Their findings concurred
with other studies that found PI3K to be an independent indicator of overall

12
survival and disease free survival, except perhaps of tumour grade
(Aleskandarany et al. 2010).
Johnston (2006) reported an association between the activation of the PI3K/Akt
pathway and resistance to tamoxifen or conventional cytotoxic drugs and also
lack of response to Her-2 targeted therapy. He also reported that in preclinical
studies mTOR antagonists were able to restore sensitivity to endocrine therapy
in breast cancer cells (Johnston 2006). Campbell et al. (2001) demonstrated
that the activated PI3K/Akt pathway interacts directly and indirectly with ER,
protecting cancer cells from tamoxifen-induced apoptosis and activating ER in a
hormone-independent fashion. Clinical evidence suggests that PI3K and K-
RAS contribute to the modulation of ER while ER in turn, activates the PI3K/Akt
pathway. The activated PI3K/Akt pathway has been shown to confer anti-
oestrogen resistance while inhibition of this pathway reverses the resistance
(Chandarlapaty et al. 2011). Wang et al. (2011) suggested that PI3K activation
may lead to resistance to trastuzumab as well as lapatinib (Wang et al. 2011).
In support of these findings, studies in human cancer xenografts have shown
that combinations of inhibitors, targeting Her-2 and PI3K, or Her-2 and AKT are
superior to single-agent treatments (Chandarlapaty et al. 2011; Chakrabarty et
al. 2011 ).
Assessment of PI3K pathway activation may provide an additional method of
identifying patients less likely to respond to Herceptin-based therapy (Berns et
al. 2007).
2.3 PTEN
2.3.1 Structure and function
PTEN (phosphatase and tensin homologue deleted on chromosome ten) is a
tumour suppressor gene (10q23.3) that is mutated at high frequency in a large
number of cancers. PTEN plays a major role as regulator of signal transduction
pathways that are involved in growth, adhesion, migration, invasion and
apoptosis (Cully et al. 2006). PTEN has also been found to be of critical
importance in early embryologic development (Wechsler-Reya and Scott 2001).

13
The protein encoded by the PTEN gene contains a catalytic or phosphatase
domain at the N-terminal region which has both lipid phosphatase and protein
tyrosine phosphatase activity. In other words, PTEN is able to dephosphorylate
both tyrosine and serine/threonine residues, although its tumour suppressor
function is completely reliant on its lipid phosphatase activity (Myers et al.
1997). An enlarged active site allows for binding phosphatidylinositol (PI)
substrates, while its actin-binding and SH2 domains are responsible for binding
phosphotyrosine-containing proteins. The N-terminal domain of PTEN displays
a close similarity to the cytoskeletal protein tensin, which is responsible for
maintaining the cellular structure and is also thought to play a role in signal
transduction by binding to actin filaments at focal adhesions (Davis et al. 1991b;
Li et al. 1997). As part of its protein phosphatase activity, PTEN is able to
dephosphorylate and thus down-regulate the actions of focal adhesion kinase
(FAK) and adaptor proteins, SHC and IRS, leading to complex dissociation
between adaptor proteins and GRB2/SOS which in turn results in inactivation of
the RAS/MAPK pathway (Gu et al. 1998; Weng et al. 2001). RAS is found to
have the exact opposite effect to that of PTEN. While PTEN dephosphorylates
PIP3 and SHC, leading to inactivation of the Akt and MAPK pathways, RAS is
able to activate both the Akt and MAPK pathways by phosphorylating MEK via
RAF and PIP3 via PI3K (Serrano et al. 1997). Both the FAK-p130Cas and SHC-
ERK/MAPK pathways are implicated in cell adhesion, migration and invasion
(Gates et al. 1994; Cary et al. 1996; Tamura et al. 1998; Gu et al. 1999). A C2
domain in the C-terminal region binds phospholipids and is believed to be
responsible for anchoring PTEN to the plasma membrane. As the C2 domain is
situated in close proximity to the catalytic domain on the PTEN protein, it is
believed to position the catalytic domain in relation to its substrate,
phosphatidylinositol, in the cell membrane (Lee et al. 1999; Yamada and Araki
2001). As part of its lipid phosphatase activity, PTEN dephosphorylates
phosphoinositide substrates (at the D3 positions) and therefore negatively
regulates the levels of second messengers, PIP3 and PIP2 to PIP2 and PIP
respectively (Maehama and Dixon 1998). Activated PI3K is responsible for
phosphorylating PIP2 and PIP to PIP3 and PIP2 respectively, which clearly
illustrates the antagonistic functions of both PTEN and PI3K. Accumulation of
14
PIP3 at the cell membrane results in recruitment of proteins containing a
plekstrin homology domain from the cytoplasm to the cell membrane. One such
protein is Akt/protein kinase B (PKB). Binding of Akt by PIP3 causes
conformational changes in the Akt molecule, allowing phosphorylation at both
Thr-308 and Ser-473 by phosphoinositide dependent kinase-1/protein kinase C-
related kinase-2 (PDK1/PRK2) complex, triggering the Akt pathway (Balendran
A et al. 1999; Eugene S et al. 1999). By dephosphorylating PIP3, PTEN acts as
a tumour suppressor that negatively regulates Akt/PKB and therefore also the
Akt/PI3K pathway. In the absence of PTEN, PIP3 and PIP2 accumulate which
has the same effect as activated PI3K, triggering downstream effectors such as
Akt/PKB, PDK1, protein kinase C (PKC) and GEFs amongst others (Stocker et
al. 2002). Apart from negatively regulating Akt, PTEN also controls the
transcription of the anti-apoptotic factor, NF-κB (Mayo et al. 2002b). PTEN is
also responsible for downregulating transcription of anti-apoptotic protein BCL2,
while BCL2 in turn is known to inhibit PTEN-induced chemosensitivity (Zhang et
al. 2001). PTEN, when overexpressed, was found to play a role in recruiting
p27Kip1 to the cyclin-E/CDK2 complex, resulting in decreased cyclin-E/CDK2
activity which in turn leads to diminished pRb phosphorylation and cell cycle
arrest at the S phase (Cheney et al. 1999). PTEN is able to autoregulate its
function and expression through stabilization of another tumour suppressor,
p53. PTEN and p53 are mutually dependent on each other; PTEN enhances
the transactivation of p53, while p53 facilitates the transcription of PTEN (Shu et
al. 1988; Stambolic et al. 2001; Mayo et al. 2002a; Sheng et al. 2002). PTEN is
also responsible for protecting p53 against proteasomal degradation mediated
by MDM2 (Mayo et al. 2002b).
2.3.2 Clinical implications
Wang et al. (2011) reported PTEN loss in about one third of Her-2(+) breast
cancer and did not find PIK3CA mutation and PTEN loss to be mutually
exclusive as other studies have suggested (Saal et al. 2005; Wang et al. 2011).
Perez-Tenorio et al. (2007) found PTEN loss in 37% of cases which were
associated with PIK3CA mutations, ER(+), small tumour size, low Her-2
expression and high Akt1 and cyclin D1 expressions. Saal et al. (2005)
observed PTEN loss with nodal metastases, increased PIP3 production and

15
subsequent activation of the Akt pathway, supporting findings that PTEN inhibits
cell migration while PIP3 is responsible for regulating cell motility (Depowski et
al. 2001; Huang et al. 2003; Raftopoulou et al. 2004).
PTEN deletions or mutations have been found to generally occur late in tumour
development, with a high frequency in high grade tumours while rarely present
in low grade tumours (Rasheed et al. 1997). PTEN activity has also been found
to contribute to the efficacy of trastuzumab and radiation therapy while PTEN
loss was associated with increased PI3K/Akt activity and resistance to
trastuzumab-based therapy in Her-2 overexpressing breast tumours, suggesting
that PTEN loss could serve as a predictor of trastuzumab resistance (Nagata et
al. 2004; Hennessy et al. 2005). Fabi et al. (2010) evaluated the protein
expression of PI3K, p-Akt and PTEN in 73 metastatic breast cancer patients
treated with trastuzumab and found that patients co-expressing PTEN and p-Akt
had a significantly longer progression free survival (PFS) (p = 0.01) than those
that were only PTEN positive (p = 0.06). They suggested that co-expression of
PTEN and p-Akt may identify those patients more likely to benefit from
trastuzumab-based therapy. They found co-expression of PTEN and p-Akt in
29 out of 73 Her-2(+) metastatic breast cancers (Fabi et al. 2010). Similar
findings were reported by Esteva et al. (2010) who observed that PTEN loss
was associated with a shorter survival time and poor response to trastuzumab
therapy.
A study by Nagata et al. (2004) found that PI3K inhibitors were able to
overcome trastuzumab resistance induced by PTEN loss, suggesting that
therapies targeting PI3K could overcome this resistance.
The EGFR-selective tyrosine kinase inhibitor, gefitinib (ZD1839, “Iressa”) was
found to be effective against both EGFR, Her-2 and Her-3 overexpressing
tumour cells by dephosphorylating these receptors and reducing PI3K and Akt
activation as a result (Moasser et al. 2001). It was shown that gefitinib
resistance in EGFR overexpressing cells was the result of PTEN loss with
subsequent hyperactivation of the Akt pathway. Reconstitution of PTEN re-

16
established EGFR driven Akt signalling and restored gefitinib sensitivity (She et
al. 2003).
2.4 Akt
2.4.1 Structure and function
The Akt protein family, also known as the Protein Kinase-B (PKB) or
serine/threonine-specific protein kinase family, plays an important role in
regulating cell survival, growth, proliferation, metabolism, angiogenesis and
migration in response to insulin, growth factors or inflammatory agents (Franke
et al. 1995; Datta et al. 1999). Akt is the cellular homologue of v-Akt, a protein
encoded by a gene in the acute transforming retrovirus, Akt8, that was isolated
from a mouse T-cell lymphoma (Belacossa et al. 1991). The three isoforms of
Akt are Akt1/PKB-α, Akt2/PKB-β and Akt3/PKB-γ. Akt1/PKB-α is involved in the
cellular survival pathway, Akt2/PKB-β plays an important role in the insulin
signalling pathway and Akt3/PKB-γ appears to be involved in growth and
development of the brain (Yang et al. 2004). Akt1 is encoded by the gene, Akt1
(14q32.32-32.33). The three isoforms of this protein show an 80% sequence
correlation and consist of three regions namely, the N-terminal region that
contains a PH domain, a centre region also referred to as the catalytic or kinase
region and a C-terminal region which is the regulatory domain and contains a
hydrophobic (HF) motif (Kannan et al. 2007; Yang et al. 2002). The PH domain
shows high affinity for PI3K products, PIP2 and PIP3, regulates intracellular
trafficking of the protein and is responsible for translocating Akt/PKB from the
cytosol to the cell membrane for activation/phosphorylation (Currie et al. 1999;
Cantley 2002). Association with PIP2 and PIP3 at the plasma membrane is
believed to induce conformational changes in the Akt/PKB molecule, exposing
two crucial amino acids, threonine (Thr308) within the activation loop of
Akt/PKB and serine (Ser473) within the HF motif near the C-terminus of
Akt/PKB (Stokoe et al. 1997; Milburn et al. 2003). In order to activate the
kinase activity of Akt, both Thr 308 and Ser473 residues needs to be
phosphorylated (Alessi and Cohen 1998; Wang et al. 2003; Hennessy et al.
2005). The kinase responsible for the phosphorylation of Thr308, is
phosphoinositide-dependent protein kinase-1 (PDK1) (Walker et al. 1998).
PDK1 contains a PH domain in its C-terminal region and is located at the cell

17
membrane as a result of translocation in the same manner as its substrate,
Akt/PKB (Alessi et al. 1997). The HF motif on Akt/PKB contributes to the
activating process by serving as a docking site for PDK1, allowing
phosphorylation of Thr308 by PDK1 in the activation loop of the kinase domain
(Balendran et al. 2000). For many years the identity of the kinase responsible
for phosphorylating Akt/PKB on Ser473 has eluded scientists until 2005 when
Sarbassov et al. (2005) demonstrated that it was in fact the mammalian target
of rapamycin (mTOR)-rictor complex (mTOR2) that was responsible for
phosphorylating Ser473 in the hydrophobic motif creating full activation of
Akt1/PKB. Other factors that are reported to also phosphorylate Akt are heat
shock protein-90 (HSP90), cell division cycle-37 (CDC37) and mitogen-
activated protein kinase activated protein kinase-2 (MAPKAPK2) (Taniyama et
al. 2004). Integrins are known to also activate Akt via focal adhesion kinase
(FAK), integrin-linked kinase (ILK) and paxillin (Pxn). Akt can also be activated
in response to cellular stress such as ultraviolet light, ischaemia, hypoxia,
hypoglycaemia, heat shock and oxidative stress. There are also a variety of
genetic events capable of activating Akt such as activating point mutations or
amplifications of Akt, PI3K, RAS family members or growth factor receptors and
loss of PTEN expression or function (Li et al. 1997; Yuan and Cantley 2008).
The negative regulators of Akt are PTEN, SH2-containing inositol phosphatase
(SHIP), carboxyl-terminal modulator protein (CTMP) and PH domain leucine-
rich repeat phosphatases (PHLPP) (Basso et al. 2002; Fornaro et al. 2003;
Pommery and Henichart 2005; Mendoza and Blenis 2007).
Akt promotes cellular survival by phosphorylating and inactivating the function
of several pro-apoptotic proteins which include several BCL2 homology domain
3 (BH3)-only proteins. These proteins include antagonists of cell death: BAD,
caspase-9, forkhead-related family of mammalian transcription factor-1
(FKHRL1) and glycogen synthase kinase 3 (GSK3) (Wang et al. 2002; Fornaro
et al. 2003; Hennessy et al. 2005). In order to induce apoptosis, BAD, in its
unphosphorylated state, associates with Bcl-xL. Phosphorylation of BAD
mediated by Akt creates a binding site for 14-3-3 proteins. BAD dissociates
from Bcl-xL and interacts with 14-3-3 proteins in order to prevent apoptosis (Zha
et al. 1996; Datta et al. 2000). Survival factors can suppress apoptosis by

18
inducing phosphorylation of FKHRL1 by Akt, resulting in association with 14-3-3
proteins and subsequent cytoplasmic retention of FKHRL1. Another substrate
that is inactivated by Akt phosphorylation is GSK3, which is responsible for
inactivating pro-survival BCL2 member, MCL-1 (Cross et al. 1995; Maurer et al.
2006). Phosphorylation of the protease, caspase-9, by Akt decreases its
protease activity and therefore also apoptosis (Cardone et al. 1998). Akt
upregulates anti-apoptotic factors including c-AMP response element-binding
protein (CREB), NF-κB, BCL2 and MDM2, leading to chromosome instability
and cancer (Brunet et al. 1999; Carroll et al. 1999; Hennessy et al. 2005).
MDM2, an E3 ubiquitin ligase, is responsible for p53 degradation once it has
been activated by Akt and translocated into the nucleus (Mayo and Donner
2001). Akt can also activate NF-κB by phosphorylating IκB kinase (IKK),
resulting in transcription of pro-survival genes (Wu et al. 1996; Sovak et al.
1997). Another substrate of Akt is the forkhead box O (FOXO) family of
forkhead transcription factors which are activated under stress conditions when
it accumulates in the nucleus where it plays a role in the expression of pro-
apoptotic genes.
Phosphorylation by Akt creates a 14-3-3 binding site, resulting in FOXO
inactivation by cytoplasmic sequestration (Accili and Arden 2004).
Phosphorylation by Akt down-regulates the cell-cycle inhibitory effects of both
p27Kip1 and p21WAF1 by nuclear export and cytoplasmic localization through 14-
3-3 binding (Zhou et al. 2001; Liang et al. 2002; Shin et al. 2002; Viglietto et al.
2002). Akt is able to inhibit the expression of p27Kip1 through phosphorylation
and inhibition of the FOXO transcription factors (Medema et al. 2000). Cell-
cycle regulators c-Myc and cyclin D1 and E, and transcription factors c-jun and
β-catenin all play a role in G1-to-S-phase cell-cycle transition and are all
targeted by GSK3 for proteasomal degradation. Phosphorylation by Akt
inhibits GSK3 function and enhances the stability of these proteins and their
functions which amongst others also involve the WNT signalling pathway (Diehl
et al. 1998; Welcker et al. 2003; Wei et al. 2005).

19
One of the functions of Akt is promotion of cell growth which happens primarily
through the activation of mTOR-raptor complex (mTORC1) and is regulated by
both nutrients and growth factor signalling. mTORC1 regulates translation
initiation and plays a role in controlling cell growth. The tuberous sclerosis
complex 1 (TSC1) forms a complex with tuberous sclerosis complex 2 (TSC2),
thereby acting as a stabilizer of TSC2 (Chong-Kopera et al. 2006). By
phosphorylating TSC2, Akt inactivates TSC2 and therefore indirectly activates
mTORC1 resulting in cell growth (Gao and Pan 2001; Tapon et al. 2001;
Manning et al. 2002). By inactivating mTORC1, activated TSC2 and its
activator, AMP-activated protein kinase (AMPK), protects cells from energy
deprivation-induced apoptosis (Inoki et al. 2003). mTORC1 not only promotes
cell growth, but is also involved in regulation of cell proliferation and Akt also
controls the translation of proteins essential for cell-cycle progression through
phosphorylation of TSC2 and subsequent activation of mTORC1(Skeen et al.
2006). Akt regulates nutrient uptake and metabolism through downstream
targets and stimulates glucose uptake in response to insulin. The PI3K/Akt
pathway is also critical in maintaining cellular metabolism in conditions of limited
growth factors such as hypoxia and glucose deprivation found in solid tumours,
by regulating the expression of glycolytic enzymes (Elstrom et al. 2004;
Hammerman et al. 2004). Akt is found to be involved in both normal and
pathological angiogenesis stimulated by endothelial cells, cells producing
angiogenic signals, such as tumour cells or in hypoxic conditions. In endothelial
cells, the PI3K/Akt pathway is activated by vascular endothelial growth factor
(VEGF) upon which activated Akt mediates endothelial cell survival, growth and
proliferation (Fujio and Walsh 1999). One of the targets of phosphorylated Akt
and more specific, Akt1, is endothelial nitric oxide synthase (eNOS) which upon
activation by Akt produces nitric oxide (NO). NO is a major role player in
endothelial cell migration and angiogenesis by stimulating vasodilation and
vascular remodelling (Dimmeler et al. 1999; Ackah et al. 2005). Surprisingly,
activated Akt1 but not Akt2 has been found to decrease mammary epithelial cell
migration (Irie et al. 2005).
Studies done on mouse tumour models have suggested that in epithelial cells,
Akt1 inhibits metastases, while Akt2 promotes metastases but that the opposite

20
is true in fibroblasts, where Akt1 promotes metastases while Akt2 inhibits it
(Arboleda et al. 2003; Hutchinson et al. 2004; Zhou et al. 2006).
2.4.2 Clinical implications
Sun et al. (2001) found activated Akt1 to be present in tumour cells of high
grade tumours that were late stage and had a poor outcome while Perez-
Tenorio et al. (2002) linked Akt1 with poor response to endocrine therapy.
Bacus et al. (2002) found Akt2 to be frequently associated with aggressive, Her-
(2+) breast tumours and metastases. Stemke-Hale et al. (2008) reported the
incidence of Akt1 mutation of only 1.4% in a study involving more than 400
breast cancers. Akt2 and Akt3 mutations were not detected. Perez-Tenorio et
al. (2007) found no significant association between p-Akt expression, nodal
status or PIK3CA mutation. They did however observe elevated levels of p-Akt,
total Akt and Cyclin D1 with mutated PIK3CA and/or Her-2 overexpression.
Davies et al. (2009) measured the levels of p-Akt and PTEN in melanomas and
found that almost all cases with elevated levels of p-Akt had low PTEN levels.
Interestingly, they also found significantly higher p-Akt and lower PTEN levels in
melanomas that metastasised to the brain compared to those that metastasized
to the liver or lung (Davies et al. 2009). Shah et al. (2005) found that when p-
Akt expression was located primarily in the nucleus, it was associated with
nodal metastases and a poor prognosis in non-small cell lung cancers.
High levels of p-Akt were found in immune-resistant tumours and associated
with upregulation of anti-apoptotic molecules. This finding suggests that the
PI3K/Akt pathway may represent a mechanism for immune escape and has
implications in immunotherapy and presents a challenge to develop
immunotherapy against immune-resistant tumour cells (Noh et al. 2009).
Recently the first human trial for MK-2206, a potent oral allosteric Akt inhibitor
has been concluded. The results were promising, particularly in tumours where
Akt activation was the result of PTEN loss, but needs further evaluation in larger
studies (Yap et al. 2011).

21
2.5 NF-κB
2.5.1 Structure and function
NF-κB is a nuclear transcription factor complex that controls the expression of a
large number of genes responsible for controlling normal but crucial cellular and
organisational processes, such as, inflammatory and immune responses,
cellular proliferation and survival. As a result, loss of NF-κB regulation has
been implicated in a number of disease states, such as inflammatory,
autoimmune diseases and cancer and neurodegenerative diseases, such as
Parkinson and Alzheimer’s disease (Gilmore 1999; Mattson and Camandola
2001; Soós et al. 2004; Collister and Albensi 2005). The NF-κB protein, first
discovered in the laboratory of the Nobel Prize winner David Baltimore in 1986,
is encoded by the gene NF-κB (4q24). The NF-κB protein forms part of a family
of proteins that are structurally related through a conserved N-terminal DNA-
binding domain called the Rel homology (RH) domain (Sen and Baltimore
1986). The RH domain serves as a dimerization interface to other NF-κB
transcription factors and also binds to the inhibitory protein, nuclear factor of
kappa light polypeptide gene enhancer in B-cells inhibitor, IκB, as well as DNA.
NF-κB proteins can be divided into two classes or sub-families. The class I or
‘NF-κB’ sub-family includes p105 and p100 and the class II or ‘Rel’ sub-family
includes RelA, RelB, and c-Rel. The class I proteins contain a large number of
ankyrin repeats that masks the nuclear localization sequence (NLS) and
renders the protein inactive. The long C-terminal domain prevents nuclear
localization and DNA-binding (Kieran et al. 1990; Davis et al. 1991a; Haskill et
al. 1991; Rice et al. 1992; Grilli et al. 1993). These large precursors, p105 (NF-
κB1) and p100 (NF-κB2) undergo phosphorylation followed by ubiquitination
and proteasomal degradation of the C-terminus to form shorter, active DNA-
binding subunits, p50 and p52 respectively (Ghosh et al. 1990; Naumann and
Scheidereit 1994; Palombella et al. 1994). On their own these sub-units do not
activate transcription, except when they form heterodimers with members of the
class II sub-family. In addition, the p50 and p52 homodimers can also form
complexes with nuclear protein Bcl-3 and as such activate transcription (Bours
et al. 1993). In contrast, the class II proteins contain transcription activation
domains in their C-terminus. All NF-κB proteins can form either homodimers or
heterodimers except for RelB, which can only form heterodimers. The most

22
common heterodimer is p50-RelA, also commonly referred to as NF-κB and
happens to be the major Rel/NF-κB complex in most cells (Grilli et al. 1993;
Siebenlist et al. 1994).
In an inactive state the Rel/NF-κB heterodimer is located in the cytoplasm
sequestered by the inhibitory protein IκB that is responsible for masking the
NLS of NF-κB proteins by means of their ankyrin repeat domains (Davis et al.
1991a; Haskill et al. 1991; Henkel et al. 1992). IκB proteins are also capable of
removing the Rel/NF-κB complex from its DNA-binding locus (Davis et al.
1991a; Ernst et al. 1995; Thompson et al. 1995; Beauparlant et al. 1996). A
number of studies have demonstrated that IκB molecules bind specific targets
therefore different IκB molecules inhibit specific Rel/NF-κB dimers (Baeuerle
and Baltimore 1989; Beg et al. 1992; Thompson et al. 1995).
NF-κB is activated by 3 major pathways; the canonical or classical pathway, the
non-canonical or alternative pathway and the casein kinase 2 (CK2) pathway.
In the canonical pathway, activation of the Rel/NF-κB dimers occur when the
enzyme IκB kinase (IKK) is activated mainly in response to bacterial and viral
infections or pro-inflammatory cytokines (Baeuerle and Baltimore 1988; Rayet
and Gélinas 1999). IKK, also referred to as the IKK complex, contains two
kinase subunits, IKKα and IKKβ, and an associated regulatory protein IKKγ also
referred to as NEMO (Zabel U and Baeuerle PA 1990). IKK, in turn
phosphorylates the inhibitory protein, IκB and p105, which results in dissociation
of IκB from the NF-κB complex, ubiquitination and finally proteasomal
degradation of IκB and p105 resulting in the release of p50-, p65- and c-Rel-
containing dimers (Baeuerle and Baltimore 1988; Hayden and Ghosh 2004).
Degradation of the Rel/NF-κB inhibitor, IκB, uncovers the NLS and gives rise to
an active Rel/NF-κB heterodimer. Activated Rel/NF-κB translocates into the
nucleus where it binds to specific sequences of DNA called the response
elements (RE). This DNA/NF-κB complex then recruits other role players such
as co-activators and RNA polymerase, which are responsible for transcribing
downstream DNA into mRNA. mRNA in turn, is translated into protein, which
results in a change of biological function of proteins involved in immune and

23
inflammatory response, cell growth and proliferation to name a few (Baldwin
1996).
In the alternative pathway, IKK is activated mainly by cytokines such as B-cell
activating factor (BAFF), CD40 and lymphotoxin β (LTβ) via NF-κB inducing
kinase (NIK) (Coope et al. 2002; Dejardin et al. 2002; Kayagaki et al. 2002).
IKK, in turn mediates selective phosphorylation and processing of p100 in the
RelB/p100 complex to generate an active RelB/p52 complex through the
process of ubiquitination and proteasomal degradation (Pomerantz and
Baltimore 2002). This active RelB/p52 complex is now able to enter the nucleus
to facilitate transcription.
The third pathway is IKK independent and activated in response to UV-C
irradiation independent of DNA damage and is believed to activate CK2 via the
p38 pathway. CK2 is responsible for phosphorylating IκB directly (Kato et al.
2003; Tergaonkar et al. 2003). Activated NF-κB turns on the genes responsible
for cell proliferation and protects the cell against processes that would induce
apoptosis. Activated NF-κB is responsible for the increased expression of pro-
inflammatory cytokines (IL1, IL2, IL6, TNF), chemokines (IL-8, MCP-1, GROα),
growth factors (VEGF, GM-CSF, MMP2, MMP9), adhesion molecules (ICAM1,
VCAM1, ELAM1) and anti-apoptotic proteins (c-IAP1, c-IAP2, c-FLIP, XIAP,
BCL2 family members) (Shishodia and Aggarwal 2004; Li et al. 2005). The
external apoptotic pathway starts at the cell membrane and involves membrane
death receptors. One such receptor is tumour necrosis factor-receptor1 (TNF–
R1), which transduces both death and survival signals via two complexes.
Complex I is situated at the cell membrane and constitutes TNF-R1, tumour
necrosis factor receptor 1-associated death domain (TRADD), receptor-
interacting protein (RIP), TNF receptor-associated factor 2 (TRAF2) and cellular
inhibitor of apoptosis protein 1 (c-IAP1). Complex I transduces survival signals
and activates NF-κB. Complex II on the other hand is located in the cytosol,
constitutes Fas-associated death domain (FADD) and procaspases 9 and 10
and transduces apoptotic signals should NF-κB fail to upregulate anti-apoptotic
Fas-associated death domain-like interleukin-1-ß-converting enzyme-inhibitory

24
protein (FLIPL) (Sheikh and Huang 2003). As a result, defective NF-κB function
would render cells vulnerable to apoptosis and result in cell death.
Regulation of NF-κB transcription factors is of critical importance as
deregulation has serious pathological implications. Persistent inhibition leads to
inappropriate immune cell development, delayed cell growth and infertility, while
persistent activation by upstream kinases (including PI3K via Akt) or genes
encoding NF-κB transcription factors or mutations inactivating IκB on the other
hand, lead to cancer (Micheau and Tschopp 2003; Danial and Korsmeyer 2004;
Gilmore 2006; Escárcega et al. 2007; Perkins 2007). DNA binding by Rel/NF-
κB transcription factors is regulated at multiple levels which include:
dimerization, inhibition by IκB, DNA binding, interaction with other transcriptional
co-activators and also with the basal transcriptional mechanism (Brasier 2006).
2.5.2 Clinical implications
There is strong evidence to support the roles of Rel/NF-κB proteins and their
IκB regulators in cell proliferation and oncogenesis (Rayet and Gélinas 1999).
As a matter of fact, c-Rel, RelA, p100, p105, Bcl-3 and IκB have all been
associated with oncogenesis as a result of gene amplification, overexpression,
re-arrangement, translocation and mutation. Constitutive activation of Rel/NF-
κB proteins were found in most cancer cell lines and in many tumour types
(Shishodia and Aggarwal 2004). Houldsworth et al. (1996) found genes
encoding Rel/NF-κB proteins to be amplified or rearranged in up to 25% of
certain human lymphoid tumours while Biswas et al. (2004) reported activated
Rel/NF-κB to be present in 86% of ER- and Her2(+) breast carcinomas. Some
studies have shown p100 to be overexpressed in up to 75% of breast cancer
biopsies examined. In contrast to p100 rearrangements found in lymphomas,
overexpression of p100 in breast cancer cells due to failure of cytokines to
induce processing of p100, results in a high cytoplasmic concentration of
precursor p100 as well as p52. In this setting, p100 forms tertiary complexes
with p50/RelB and p50/p65 heterodimers, leading to cytoplasmic sequestration
and inhibition of NF-κB-related proteins which according to Dejardin et al.
(1995) could play a role in oncogenesis. Although NF-κB was initially linked to
ER negative breast cancers, new evidence associates NF-κB with a subset of

25
ER(+) breast cancers that are at increased risk for relapse despite adequate
hormonal treatment (Zhou et al. 2005).
Chronic inflammation has long been associated with carcinogenesis and tumour
progression. The production of pro-inflammatory cytokines, chemokines,
growth factors and anti-apoptotic proteins as a result of inflammation induced
NF-κB activation were found to be involved in cancer progression and
chemoresistance (Coussens and Werb 2002; Chen et al. 2007).
Recently the drug Gallotannin (GT) has been found to be effective in inhibiting
NF-κB signalling and tumour growth in colon cancer (Al-Halabi et al. 2011).
Phytoestrogens, genistein and quercetin have also been shown to inhibit NF-κB
signalling and induce apoptosis in Her-2(+) breast cancer cells (Seo et al.
2011).
2.6 p53
2.6.1 Structure and function
The p53 gene that is situated on the short arm of chromosome 17(17p13.1) was
discovered in 1979. As a sequence specific transcription factor, the p53
molecule is composed of an N-terminal activation domain, a central DNA-
binding domain, an MDM2 binding site and a C-terminal tetramerization domain
that also includes the nuclear export signal, followed by a regulatory domain
that contains the DNA-damage recognition site and nuclear localization signals
(Harris 1996; Somasundaram 2000).
One of the most important functions of p53 is to guard the cell against malignant
transformation. p53 is activated by cellular stresses like DNA damage,
oncogene activation, hypoxia and nutrient deprivation. p53 regulates the target
genes that induce cell cycle arrest, DNA repair, apoptosis, cellular senescence
or changes in metabolism (Lee et al. 1995; Maya et al. 2001; Harris and Levine
2005; Bensaad et al. 2006; Efeyan et al. 2006; Vousden and Lane 2007).
Depending on the type or duration of stress, DNA damage or conditions of
cellular growth, p53 would selectively activate a subset of target genes in order
to achieve growth arrest, apoptosis, DNA repair or a change in differentiation

26
(Hupp et al. 1992; el-Deiry 1998). p53 regulates G1-S checkpoint in response
to minimal DNA damage or other minor stress factors like heat shock, hyperoxia
or hypoxia. Under these conditions, p53 would target p21WAF-1 or 14-3-3 to
induce G1 arrest to allow repair of damaged DNA (Kastan et al. 1991; Kuerbitz
et al. 1992; McKay et al. 1999). Under conditions of extreme stress or severe
DNA damage, p53 activates pro-apoptotic genes, such as, BAX, PIDD, Noxa or
Puma (Miyashita and Reed 1995; Owen-Schaub et al. 1995; Polyak et al.
1997).
p53 regulates the expression of target genes by binding to the regulatory region
of the target DNA (Ryan et al. 1993; Kaufmann 1995; Teyssier et al. 1999). p53
is able to regulate target genes due to its ability to selectively associate with
different transcription factors, each with its own unique regulatory function. The
association and regulatory function of p53 is determined by post translational
modifications that are able to change the conformation of the p53 molecule and
as a result its association with transcription factors and regulatory proteins
(Adler et al. 1997; Sionov and Haupt 1999; Ashcroft et al. 2000). The p53
molecule has more than 18 phosphorylation sites that can be modified in
response to stress or DNA damage and determines the function of the
molecule. Phosphorylation of p53 was found to change during the course of a
normal cell cycle and corresponds with its ability to associate with its regulatory
proteins p300, MDM2 and JNK (Fuchs et al. 1998; Buschmann et al. 2000).
Phosphorylation of p53 is regulated by phosphatases (Li et al. 2000).
p53 is kept at low levels in normal, unstressed cells to safeguard the cell
against disruption of the cell cycle and untimely cell death. This is attained
through the fact that p53 has a relatively short half-life and a mechanism by
which unphosphorylated p53 is continuously being ubiquitinated largely by
MDM2 ubiquitin ligase, a major negative regulator of p53 and degraded by the
26S proteasome. MDM2 inhibits p53 by binding its transactivation sites and by
targeting p53 for proteolytic degradation. MDM2 is one of the transcriptional
targets of p53. Since MDM2 is responsible for inhibiting p53 activity, this gives
rise to a negative feedback loop (Ghosh and Bose 2005; Francoz et al. 2006).
p53 positively regulates MDM2 levels while MDM2 negatively regulates p53

27
levels and activity. MDM2 is able to form a complex with both mutant and wild-
type p53 (Barak et al. 1993; Wu et al. 1993; Freedman et al. 1999). MDM2
functions as an E3 ubiquitin ligase and degrades p53 by targeting it for
ubiquitination. This is achieved by three mechanisms. Firstly, MDM2
recognizes, binds and blocks the N-terminal transactivation domain of p53,
inhibiting its function as a transcription factor. Secondly, by binding lysine
residues in the p53 C-terminus, MDM2 mediates a covalent attachment of
ubiquitin to p53 and labels p53 for proteasomal degradation. Ubiquitinated p53
is then degraded by the 26S proteasome. Lastly, MDM2 exports p53 from the
nucleus to the cytoplasm which is essential for p53 degradation. In the absence
of MDM2-mediated degradation, p53 is activated (Barak et al. 1993; Wu et al.
1993; Kubbutat et al. 1997; Ghosh and Bose 2005; Francoz et al. 2006).
2.6.2 p53 activation following DNA damage
In the event of DNA damage, either by UV or ionising radiation or a chemical
agent, multiple molecular pathways are able to activate p53, resulting in both an
increase in the levels of p53 protein and its binding affinity for specific DNA
sequences (Maltzman and Czyzyk 1984; Liu et al. 1996b). Following genotoxic
stress, p53 is phosphorylated by different upstream mediators at various sites
resulting in both an increased half life and transactivation activity (Meek 1994).
Transcriptional activation of p53 results in both G1 and G2 arrest. Some of the
upstream mediators that play a role in the activation and stabilization of p53 in
response to DNA damage include ataxia-telangiectasia mutated (ATM), kinase
families such as MAP kinases, cyclin dependent kinases (CDKs) and DNA
dependent kinase (DNA-DK) as well as tumour suppressor proteins p19ARF and
p16INK4a (Bischoff et al. 1990; Marshall 1994; Zhang et al. 1998). ATM is a DNA
damage checkpoint gene and its product is one of the major regulators of p53 in
response to ionizing-radiation induced damage. ATM kinase phosphorylates
p53 on serine 15 and dephosphorylates p53 on serine 376 in order to facilitate
specific binding of 14-3-3proteins to p53 and to increase sequence specific
DNA binding by p53 (Matsushime et al. 1992; Waterman et al. 1998). ATM
kinase phosphorylates and activates checkpoint kinase 2 (Chk2) and nuclear
tyrosine kinase c-Abl, in response to DNA damage (Baskaran et al. 1997).
Activated Chk2 not only regulates cell cycle arrest at G2 but is also able to

28
phosphorylate p53 at serine 20, which is known to interfere with MDM2 binding,
preventing ubiquitination in response to DNA damage resulting in an increase in
p53 stability. Activated c-Abl binds p53 and enhances its sequence specific
transactivation ability (Goga et al. 1995; Hirao et al. 2000). Recent studies have
shown that tumour suppressor p14ARFis able to stabilize p53 by binding and
promoting MDM2 for degradation. The ARF-INK4 gene locus encodes two
unrelated tumour suppressor proteins; p16INK4a and p19ARF. p16INK4a binds and
inhibits CDK4 and CDK6, while p19ARF binds and promotes the rapid
degradation of MDM2, while modifying, stabilizing and increasing p53 levels at
the same time. Ubiquitination of p53 is suppressed and p53 accumulates in the
nucleus where it is stabilized and activated (Stott et al. 1998; Zhang et al.
1998).
Acetylation by p300/CBP-associated factor (PCAF) is another modification of
p53 that inhibits ubiquitination by MDM2 and aids in stabilizing p53. Acetylation
of p53 also aids in p53 DNA binding and stimulates p53-mediated
transactivation of downstream targets through recruitment of co-activators
(Dornan et al. 2003; Cesková et al. 2006).
c-Myc is a transcription factor responsible for increasing both the transcription
and stabilization of p53, while c-Myc transcription in turn, is downregulated
following p53 activation as part of a negative regulatory feedback loop
(Hermeking and Eick 1994).
2.6.3 Cell cycle arrest and DNA repair
The first step in the process of DNA repair is to arrest the cell cycle to prevent
proliferation of cells containing damaged DNA which would otherwise pose a
threat of tumour development. The cell is arrested at checkpoints in the G1/S
and G2/M phases of the cell cycle. CDK1 is a major regulator of cell cycle
progression and requires phosphorylation at T161 and association with cyclin B
in order to be activated. In contrast, phosphorylation of CDK1 at Y15 and T14
during G2 phase results in deactivation of CDK1, which is directly inhibited by
three transcriptional targets of p53 that are p21WAF1, Gadd45 and 14-3-3. p53
mediated transcriptional induction of p21WAF1 plays a major role in mediating the

29
G1 arrest. p21WAF1 binds to and inhibits cyclin B/CDK1 complexes by
sequestering them in the nucleus. The resulting accumulation of pRb binds
members of the E2F transcription family in order to constrain them. This
process brings about G1 arrest. Phosphorylation of pRb by CDK4 or CDK6 in
mid or late G1 phase has the effect of dissociating pRb from E2F. Free E2F is
now able to activate target genes needed for the cell to enter into S phase. The
next step involves the biochemical processes involved in DNA repair. Both
Gadd45 and 14-3-3 play a mediating role in G2 arrest. 14-3-3 is responsible for
sequestering cyclin B/CDK1 in the cytoplasm while Gadd45 prevents binding of
cyclin B and CDK1 through direct interaction with CDK1. p53 is also
responsible for the transcriptional repression of cyclin B. Gadd45 and p21WAF1
are believed to play a role in DNA repair through their interaction with
proliferating cell nuclear antigen (PCNA) (Serrano et al. 1993; Dyson 1998;
Chan et al. 1999; Moore et al. 1999; Taylor and Stark 2001).
Once repair is completed successfully, the cellular functions can progress to cell
division.
Should repair not be possible as a result of excessive damage, the p53-
mediated apoptotic pathway comes into play (Ma et al. 2005).
Figure 2: Cell cycle regulation by p53
Adapted from Somasundaram (2000)
Transcriptional activation
G2 arrest
Transcriptional repression of Cyclin B
p21WAF1
Cyclin B/CDK1
Rb:E2F RbP + E2F
Gadd45 14-3-3
PCNA CDK1 Cyclin B CDK1
DNA repair G2 arrest
G2 arrest
G1 arrest
S G1
p53

30
2.6.4 Apoptosis
p53 upregulates the synthesis of the pro-apoptotic protein BAX, while it
downregulates the synthesis of the anti-apoptotic protein, BCL2 (Figure 3).
BAX together with other pro-apoptotic proteins aids in the release of
cytochrome C proteins from the mitochondria. Cytochrome C is an apoptogenic
factor, which when released into the cytosol, binds apoptotic protease activating
factor-1 (Apaf-1). Apaf-1binds and hydrolyses dATP to ATP. Together, the
hydrolysed dATP, Cytochrome C and Apaf-1 forms the Apaf-1/cytochrome C
complex. This apoptosome complex in turn cleaves and activates procaspase-
9 to yield active caspase-9 which in turn cleaves bound procaspase-3 to
produce the active effector molecule caspase-3. Executioner caspase-3 cleaves
key cellular proteins and dismantles the cell resulting in apoptosis. Caspases
are cysteine proteases that act in a proteolytic cascade to dismantle and
remove dying cells and can be divided into upstream caspases (caspases 2, 8,
9, 10 and 12) and downstream or effector caspases (caspases 3, 6 and 7).
Upstream procaspases are activated by dimerization while downstream
procaspases are activated by the proteolytic action of activated upstream
caspases (Liu et al. 1996a; Zamzami et al. 1998; Fesik and Shi 2001; Boatright
et al. 2003; Czerski and Nuñez 2004; Renatus et al. 2001). Caspase-3 is also
responsible for cleaving and downregulating anti-apoptotic BCL2 while p21WAF1,
which is upregulated by p53, is in turn responsible for downregulating caspase-
3. BCL2 protein suppresses the pro-apoptotic activity of BAX. BCL2 also
prevents the binding of Apaf-1 to procaspase-9. The level of activation is
dependent on the competition between the pro- and anti-apoptotic agents
involved in the apoptotic pathway (Fussenegger et al. 2000; Hengartner 2000;
Bose and Ghosh 2007).
There is some evidence that p21WAF1 has a dual role in the p53-MDM2 network.
p21WAF1 assists in the arrest of the cell cycle when it is activated by p53, but
also has a second function of protecting the cell against apoptosis. MDM2 is
found to be a negative regulator of p21WAF1 independent of p53. MDM2
promotes p21WAF1 degradation by facilitating the binding of a proteasomal
subunit, which implies that MDM2 overexpression leads to lower p21WAF1 levels.

31
Figure 3: The p53-mediated apoptotic pathway
Adapted from Bose and Ghosh (2007)
Downregulation of p21WAF1 activity results in enhanced p14ARF expression. The
p14ARF protein in turn sequesters MDM2 in the nucleolus, which results in a
decrease in p53 degradation and therefore increased levels of p53 (Javelaue
and Besancon 2002; Vassilev et al. 2004).
2.6.5 Interactions with other proteins / cellular components
As mentioned before, PTEN and p53 are mutually dependant on each other.
p53 facilitates the transcription of PTEN, while PTEN enhances transactivation
of p53 and for this reason loss of p53 expression would result in a decrease in
PTEN expression (Wang et al. 2005). PTEN also protects p53 from survival
signals by opposing PI3K/Akt signalling that promotes translocation of MDM2
from the cytoplasm to the nucleus where it negatively regulates p53 (Mayo and
Donner 2001). PTEN restricts MDM2 to the cytoplasm by inhibiting nuclear
entry of MDM2. In the cytoplasm, MDM2 is degraded while cellular content and
transactivation of p53 is increased. By protecting p53, PTEN aids in the
process of sensitization of tumour cells to chemotherapeutic agents that rely on
p53 activity (Mayo et al. 2002b).
Procaspase-9
BCL-2
Bax
Bax
Apoptosome complex
p53
Cytochrome c release from mitochondria
Caspase-9
Caspase-3
Cleavage by caspase-3
Apaf-1
p21
Apoptosis
Procaspase-3

32
p53 and NF-κB are regarded as functional antagonists as they are responding
to different types of stress in entirely antagonistic ways. While p53 responds to
intrinsic stress, like DNA damage by initiating cell cycle arrest or cell death and
oxidative phosphorylation, NF-κB responds to extrinsic stress, like inflammation
or cytokine activation and initiates cell division and aerobic glycolysis. It is clear
that these two transcription factors cannot function in the same cell at the same
time. Regulatory proteins in the activation pathway of both these transcription
factors are responsible for ensuring that when the one is activated, the other is
inactivated (Ak and Levine 2010).
2.6.6 Clinical implications
Mutations in the p53 gene have been found in more than half of human cancers
and more than 30% of breast cancers. Over one thousand p53 mutation types
have been identified. The majority of the mutations occur in the core domain
which also contains the sequence-specific DNA binding function, resulting in
loss of its transcriptional activities and hence causes the loss of tumour
suppressor activity (Hollstein et al. 1991; Cho et al. 1994). In cancer cells
harbouring a mutant p53 gene, the p53 protein is unable to control cellular
proliferation, resulting in inefficient DNA repair and genetically unstable cells
(Levine 1997). Some mutations render p53 transcriptionally active against a
different target gene, resulting in gain of function phenotypes (Blandino et al.
1999; Deppert et al. 2000). Mutant p53 expression was found to be elevated
due to the fact that p53 was stabilized as a result of the inability of mutant p53
to induce expression of its major negative regulator, MDM2 (Lane 1994).
Overall phosphorylation of p53 (mutant as well as wild type) was found to be
substantially increased in cancer, irrespective of the type and was believed to
be due to the failure of one or more phosphatases (Minamoto et al. 2001).
Extensive phosphorylation is expected to cause conformational change in the
p53 molecule and alter its association with target molecules. This theory
provides a possible mechanism by which p53 activities are altered in cancers
harbouring wild type p53 (Buschmann et al. 2000).

33
Normal p53 protein is usually undetectable by IHC techniques due to its short
half-life, while mutant p53 proteins accumulate in the nucleus of tumour cells
due to an increased half-life and structural changes. It is noteworthy that IHC
techniques may in some instances give false positive results when wild-type
p53 is stabilized due to cellular stress while false negative results have been
seen in some cancers harbouring nonsense mutations or deletions (Schmitt et
al. 1998; Geisler et al. 2001).
p53 mutations and/or overexpression in breast carcinoma has been associated
with shorter disease free survival and overall survival, low ER content and high
proliferation rate. Exceptionally high p53 expression was found in ER-/PR-
medullary and high grade ductal carcinomas of the breast (Borg et al. 1995).
Cancers with mutations located in regions encoding parts of the protein involved
in zinc-binding were associated with significantly shorter disease free survival
and overall survival compared to mutations involving other domains (Borg A et
al. 1995; Borresen AL 1995). Patients with tumours overexpressing both Her-2
and p53 were found to have a significantly shorter disease free and overall
survival than when they were overexpressed individually (Yamashita et al.
2004).
p53 mutations have been associated with a good as well as poor treatment
response depending on the type and mode of action of a particular treatment
regimen. The fact that wild-type p53 is able to repair UV-type DNA damage is
proving useful clinically in that some types of cancer carrying mutant p53 genes
may be more sensitive to adjuvant radiotherapy and certain chemotherapeutic
drugs than those with wild-type p53 function. As p53 mutation is associated
with high grade malignancies and metastases, preferential killing of these cells
carrying mutated p53 would be of great benefit to cancer treatment (Sidransky
et al. 1992; Peyrat et al. 1995; Stal 1995). Cytotoxic drugs like 5-fluorouracil
and doxorubicin rely on functioning p53 to execute their cytotoxic effects.
Breast cancers expressing high levels of wild type p53 showed an increased
level of apoptosis and tumour regression after treatment with doxorubicin and
radiotherapy, while p53 deficient cancers continued to grow and showed little
evidence of apoptosis (Lowe et al. 1994). p53 mutations especially those

34
involving loop domains L2 and L3 were associated with resistance to
doxorubicin treatment and relapse as a result of defective apoptosis due to
inactive p53. p53 mutations were also associated with Her-2 expression, a high
histological tumour grade and lack of bcl-2 expression. All of these parameters
were also associated with chemoresistance, especially when present
simultaneously (Geisler et al. 2001).
p53 mutations were also found to be present at an increased frequency in triple
negative breast cancers and was shown to be a strong negative prognostic
indicator for disease free survival and overall survival in this group of cancers,
especially when treated with adjuvant anthracycline-based chemotherapy
(Cheang et al. 2008; Chae et al. 2009). Non-inflammatory breast cancers and
particularly the basal or triple negative type breast cancers with p53 mutations
showed increased sensitivity to high dose epirubicin-cyclophosphamide
treatment, while those with wild type p53 showed complete resistance
(Bertheau et al. 2002; Bertheau et al. 2007).
Bergh et al. (1995) found the mutational status of p53 of little value in predicting
treatment response to radiotherapy and tamoxifen treatment in node positive
breast cancers. Geisler et al. (2001) found no statistically significant relation
between p53 immunostaining and treatment response despite its association
with p53 mutation status.
No association was found between p53 status and the clinical efficacy of
trastuzumab (Köstler et al. 2005). Varna et al. (2011) found that p53 status
could be useful in selecting the best cancer treatment because of its strong
impact on the prognosis of breast cancer, provided that p53 status is
determined by DNA sequencing and not IHC. IHC was found to be unreliable in
determining p53 status. Soussi (2007) found that the prognostic significance of
p53 is in fact dependent on the specific p53 mutation present and explains why
determining p53 status with IHC would not be that reliable.
35
2.7 MDM2
2.7.1 Structure and function
MDM2, encoded by the MDM2 gene (12q14.3-q15), consists of 491 amino
acids and has a molecular weight of 56kDa. The MDM2 molecule contains
several structural domains including a N-terminal domain essential for p53
binding, a nuclear localization signal (NLS) and nuclear export signal (NES)
essential for nuclear-cytoplasmic trafficking of MDM2, a central acidic region, a
zinc finger (Zn) and RING finger motif as well as a nucleolar localization signal
(NoLS) (Ganguli and Wasylyk 2003). The acidic region facilitates interaction
between the ribosomal protein, L5 and associated 5S ribosomal RNA (rRNA)
(Marechal et al. 1994). The function of the zinc finger domain is still poorly
understood. The RING domain located near the C-terminal contains two
additional zinc fingers in a ring formation enabling the molecule to bind to
specific RNA structures. The RING domain contains a nucleotide binding motif,
a nucleolar localization sequence and has E3 ubiquitin ligase activity that may
contribute to p53 regulation. The MDM2 molecule also contains residues that
when phosphorylated, play a role in MDM2 regulation (Marechal et al. 1994).
Although the key target of MDM2 is probably p53, it also interacts with other
tumour suppressor proteins, such as, pRb, p73 and p14ARF / p19ARF (Xiao et al.
1995; Kamijo et al. 1998; Pomerantz et al. 1998; Zhang et al. 1998; Dobbelstein
et al. 1999). As discussed earlier in section 2.6.1, MDM2 is an important
negative regulator of p53 in normal, unstressed cells. MDM2 inhibits p53 by
binding its transactivation sites and by targeting p53 for proteolytic degradation
(Leng et al. 1995; Haupt et al. 1997; Kubbutat et al. 1997). Three domains of
the MDM2 molecule are involved in the ubiquitination process: the p53
interaction domain, the RING finger domain responsible for mono-ubiquitination
and the p300 interaction domain for poly-ubiquitination (Fang et al. 2000;
Grossman et al. 2003). MDM2 was found to differentially catalyze mono-
ubiquitination and poly-ubiquitination of p53 in a dosage-dependent manner
which implies that low levels of MDM2 would induce mono-ubiquitination and
nuclear export of p53, while high levels of MDM2 would result in poly-
ubiquitination and nuclear degradation of p53. The assumption was made that
these two mechanisms come into play under different physiological conditions.
For example, in normal unstressed cells where the MDM2 levels are kept low,

36
p53 is regulated by MDM2-mediated mono-ubiquitination and p53 cytoplasmic
translocation. MDM2-mediated poly-ubiquitination and nuclear degradation of
p53 on the other hand would be the most likely mechanism exploited when
MDM2 is overexpressed in malignancy or during late stage DNA damage
response (Freedman et al. 1999; Boyd et al. 2000; Shirangi et al. 2002; Li et al.
2004a; Stommel and Wahl 2004).
MDM2 not only promotes the proteolytic degradation of p53 but is also
responsible for its own proteolytic degradation as well as that of other proteins
(Honda and Yasuda 2000). MDM2 is regulated by phosphorylation of residues
in its acidic domain which could change its function, stabilize p53 and negatively
regulate p53-MDM2 interaction. As discussed earlier in section 2.6.2, p19ARF
directly interact with MDM2 to sequester MDM2 in the nucleolus, neutralising its
inhibitory effect on p53 (Pomerantz et al. 1998; Stott et al. 1998).
MDM2 serves as a substrate for Akt binding. Akt-mediated phosphorylation of
MDM2 enhances MDM2-mediated ubiquitination and degradation of p53.
Through this mechanism Akt indirectly reduces the levels of p53 and promotes
cellular survival, proliferation and tumourigenesis. Ogawara et al. (2002)
reported that Akt-mediated phosphorylation of MDM2 did not affect the
subcellular location of MDM2. Overexpression of MDM2 can result in excessive
inactivation of p53, diminishing its tumour suppressor function. MDM2 also
affects the cell cycle, apoptosis and tumourigenesis through interactions with
other proteins, including RAS, pRb and ribosomal protein L5 (Freedman et al.
1999).
There is some evidence to suggest that overexpression of MDM2 may also play
a p53-independent role in G1 cell cycle arrest by regulating DNA replication
provided that there is additional genetic damage (Lundgren et al. 1997; Jones et
al. 1998 ). MDM2 overexpression may be the result of one of three
mechanisms namely gene amplification, increased transcription or enhanced
translation (Oliner et al. 1992; Watanabe et al. 1994; Bueso-Ramos et al. 1996;
Landers et al. 1997).

37
2.7.2 Clinical implications
The most common mutations are found in the zinc finger domain of MDM2. It
disrupts the negative regulation of MDM2 by Rb protein L11, which no longer
recognizes the binding site and in doing so, creates a potential mechanism for
oncogenic activation (Lindström et al. 2007).
Increased levels of MDM2 have been found in a wide variety of tumours
including certain carcinomas, sarcomas, melanomas and some haematological
malignancies. MDM2 was found amplified in breast cancers at a frequency
ranging between 4% and 14% (Marchetti et al. 1995; McCann et al. 1995;
Momand et al. 1998; Turbin et al. 2006).
Momand et al. (1998) found that p53 mutations and MDM2 amplifications do not
generally occur within the same tumour, while Cordon-Cardo et al. (1994) found
a significant correlation between the overexpression of both p53 and MDM2 in
the same tumour and a poor survival rate (P<0.05) but found no correlation
between MDM2 on its own and clinical outcome. A study by Al-Kuraya et al.
(2004) based on more than 2000 cases, found no correlation between MDM2
amplification and disease free survival. Turbin et al. (2006) however, in a study
based on the same number of cases, found a strong negative correlation
between MDM2 IHC expression and disease free survival, independent of other
pathological or clinical factors. The intensity of IHC staining had little or no
effect on the clinical outcome (Turbin et al. 2006). McCann et al. (1995) found
no correlation between p53 and MDM2 expression.
According to Sheikh et al. (1993) ER(+) cells express higher levels of MDM2
compared to ER- cells. They suggested that oestrogen may play an important
role in growth stimulation of breast carcinoma by modulating the expression of
MDM2, which in turn may inactivate the function of p53.
2.8 BCL2
2.8.1 Structure and function
The BCL2 gene has been mapped to 18q21.3. The name is derived from a
B-cell lymphoma in which it was the second protein described to be
38
inappropriately expressed as a result of the chromosomal translocation
[t(14,18)] and associated with a poor outcome (Tsujimoto et al. 1984). The
BCL2 protein forms part of the BCL2 family of apoptosis regulating proteins,
which includes both anti-apoptotic and pro-apoptotic proteins. The anti-
apoptotic proteins include BCL2 proper, Bcl-x-protein long isoforms (Bcl-XL),
myeloid cell leukaemia sequence-1 (Mcl-1), CED-9, A1/Bfl-1 and BHRF-1.
The pro-apoptotic members are divided into multidomain pro-apoptotics that
include proteins like BCL2-associated X protein(BAX) and BCL2-agonist/killer
(BAK) while the BCL2-homology domain 3 (BH3)-only pro-apoptotics include
proteins like BCL2-agonist of cell death (BAD), BH3-interacting domain death
agonist (BID), BCL2-interacting mediator of cell death (BIM) and BCL2-
interacting killer (Bik). Members of the BCL2 family have one or more of four
characteristic BCL2 homology (BH) domains in common. The domains are
BH1, BH2, BH3 and BH4, which are crucial to the function of these members
(Fesik and Shi 2001; Petros et al. 2004). BH1 and BH2 play a role in the
function of the anion channel that regulates the release of cytochrome C from
the mitochondria. BH3 is essential for heterodimerization between members
and the minimum domain requirement for the pro-apoptotic function BH4
allows for dimerization with pro-apoptotic proteins (Kluck et al. 1997; Yang et
al. 1997; Kelekar and Thompson 1998).
Members of the BCL2 family share a general structure that consists of a
hydrophobic helix, surrounded by amphiphatic helices, which play a central
role in the intrinsic pathway of apoptosis. The anti-apoptotic members of the
BCL2 family form an integral part of the outer mitochondrial membrane
protein and regulate the mitochondrial membrane permeabilization (MMP).
MMP plays a pivotal role in the process of apoptosis and is controlled by
activation or inactivation of an inner mitochondrial permeability transition
pore, which regulates matrix Ca2+, pH and voltage. At least two possible
mechanisms have been described. The first mechanism involves a
permeability transition pore complex (PTPC) formed by cyclophilin-D,
peripheral-type benzodiazepine (PBR), adenine nucleotide transporter (ANT)
and the voltage-dependent anion channel (VDAC). This complex then
associates either with pro-apoptotic BCL2 proteins like BAX, BAK1 and BIM,
39
which accelerate the opening of the channel or with one of the anti-apoptotic
proteins like BCL-XL, which causes closure (Shimizu et al. 1999; Vyssokikh
and Brdiczka 2003). The second mechanism involves the pro-apoptotic
proteins and their translocation from the cytosol to the mitochondria where it
forms protein pores by oligomerization and association with other proteins or
by antagonizing the anti-apoptotic proteins by binding via their BH3 domains.
Pro-apoptotic members like BAX, BID and BIM are inactive and must
translocate from the cytosol to the mitochondria in order to induce apoptosis.
Pro-apoptotic members of the BCL2 family proteins induce the release of
cytochrome C from within the mitochondria into the cytosol, while the anti-
apoptotic members inhibit the release of cytochrome C. Apoptosis is
determined by the ratio of pro-apoptotic to anti-apoptotic proteins (Krajewski
et al. 1995; Ogura et al. 1999 ).
The mitochondrial pathway of apoptosis is activated by various types of intra-
and extra-cellular stress, including DNA damage, growth factor withdrawal,
oxidative stress, stresses in the endoplasmic reticulum, death receptor
stimulation, anticancer drugs and irradiation (Ron 2002; Green and Kroemer
2004). Stress, like Gamma- and UV radiation, cytotoxic drugs and removal
of cytokines induce apoptosis by a mechanism that alters the MMP with
subsequent cytochrome C release. Intracellular stress like oncogenes, DNA
damage, hypoxia and deprivation of survival factors, activate p53 (Marshall
1994; Baskaran et al. 1997; Zhang et al. 1998).
Growth factors influence apoptosis via the PI3K/Akt pathway. Growth factors
bind growth factor receptors and activate PI3K which in turn activates Akt.
Activated Akt is a negative regulator of BAD, a pro-apoptotic member of the
BCL2 family involved in mitochondrial apoptosis (Thompson et al. 1995).
p53 is responsible for transcriptional activation of the BAX, Noxa, p53-
upregulated modulator of apoptosis (PUMA) and BID while repressing the
anti-apoptotic proteins. Other transcriptional targets of p53 involved in the
apoptotic pathway include Apaf-1 and PTEN (Oda et al. 2000; Thornborrow
et al. 2002; Yu et al. 2003).

40
2.8.2 Clinical implications
As anti-apoptotic proteins, BCL2 and Bcl-XL are able to inhibit the mitochondrial
apoptotic pathway by preventing the release of cytochrome C from the
mitochondrion and the subsequent activation of caspases-9 and -3. As a result
both BCL2 and Bcl-XL are able to inhibit drug and radiation induced apoptosis
and therefore reduce the effectiveness of chemotherapeutic agents and even
more so when they are over-expressed (Huang 2000; Kim et al. 2002).
In a study by Silvestrini et al. (1994), BCL2 expression was associated with
small, slow growing, ER- and p53- tumours. The predictive value of BCL2 was
found to be dependent on p53 expression. Lee et al. (1997) found a strong
relation between hormonal status, histologic tumour and nuclear grade and
BCL2 expression. Although they found an association between BCL2 status
and survival, BCL2 was not a reliable indicator for overall survival. Charpin et
al. (1998) found BCL2 expression only of limited prognostic value. They
reported an association between BCL2 expression and a longer disease free
survival but not with overall survival. Callagy et al. (2006) evaluated 930 breast
tumours and found BCL2 to be an independent predictor of prognosis
particularly in the first 5 years after diagnosis and a useful addition to the
Nottingham prognostic index (NPI). In a study involving more than 11 000
early-stage breast cancer cases, Dawson et al. (2010) found BCL2 to be an
independent indicator of favourable prognosis for all types of early breast
cancer irrespective of ER or Her-2 status or type of adjuvant therapy received.
Similarly, Treré et al. (2007) found BCL2 to be an independent predictor of
clinical outcome, irrespective of nodal status. They associated BCL2(-)
carcinomas with a 5x higher risk for relapse and 7x higher risk for death,
compared with BCL2(+) carcinomas. Geisler et al. (2001) found Her-2
(+)/BCL2(-) cancers with a high histological grade to be resistant to doxorubicin.
2.9 Oestrogen Receptor
2.9.1 Structure and function
Oestrogen receptors (ER) are DNA-binding transcription factors that regulate
gene expression and are activated by the hormone 17β-oestradiol to mediate
the effects of oestrogen on tissue growth, development and maintenance. Two

41
different subtypes of oestrogen receptors, encoded by different genes, have
been identified. ERα (ESR1) is encoded by a gene located on chromosome 6
(6q25.1) while ERβ (ESR2) is encoded by a gene located on chromosome14
(14q) (Moggs and Orphanides 2001; Levin 2005; Dahlman-Wright et al. 2006).
The two subtypes show significant sequence homology and exhibit functional
domains characteristic of the nuclear receptor super family. Both are composed
of five domains (A-F), which include the A/B domain on the N-terminal which is
an agonist-independent transcriptional activation function (AF-1) domain. The
C-domain is a conserved DNA-binding domain that binds oestrogen response
elements in DNA. The D-domain is a hinge region that connects the C and E
domains. The E-domain is a dimerization region. The function of the F-domain
on the C-terminal is unclear. (Moggs and Orphanides 2001; Nilsson et al. 2001)
Although both ERα and ERβ are widely expressed in different tissue types,
notable differences are found in their expression patterns. ERα is expressed in
the endometrium, breast cancer cells, ovarian stromal cells and the
hypothalamus, while ERβ is expressed in the prostate, brain, bone, kidney,
intestinal mucosa, lungs, heart and endothelial cells. These two subtypes are
co-expressed in many cell types and may form homo- (αα or ββ) or
heterodimers (αβ) (Li et al. 2004b). In their inactive state, both receptors are
found in the cytosol, although a small amount of the ERs have also been found
within the nucleus and cell membrane (Htun et al. 1999). Oestrogen is a
steroidal hormone and can pass through the phospholipid of the cell membrane,
therefore ERs do not need to be membrane-bound in order to bind with
oestrogen. Oestrogen binding to the receptor triggers a number of events
starting off with receptor phosphorylation, dimerization and migration of the
receptor from the cytosol into the nucleus and subsequent binding of the
receptor dimer to the promoter region of target genes, also referred to as
hormone response elements. This DNA/receptor complex then recruits other
proteins that are responsible for the transcription of downstream DNA into
mRNA and finally protein that is able to change cellular function. This pathway
is known as the genomic pathway and is also influenced by several co-
repressors such as nuclear hormone receptor co-repressor (NCoR) and
silencing mediator or retinoic acid and thyroid hormone receptors (SMRT) and

42
co-activators such as amplified in breast cancer 1 (AIB1) or steroid receptor co-
activator 1 (SRC1) (Shou et al. 2004).
2.9.2 Clinical implications
More than half of breast cancers are found to be ER(+). Unfortunately only
about half of these ER(+) breast cancers show sensitivity to hormonal treatment
(e.g. tamoxifen) and a significant number of these cancers ultimately develop
secondary resistance to hormonal treatment, leading to tumour progression,
metastasis and death (Osborne 1998; Schiff et al. 2004). Richard et al. (1987)
reported a worse relapse-free survival and overall survival in ER(-) patients
compared to ER(+) patients. They also found a significantly worse relapse-free
and overall survival in ER(-)/EGFR(+) patients compared to ER(-)/EGFR(-)
patients. They also reported a significant association between tumour size and
differentiation. Onitilo et al. (2009) found tumours of the subtype
ER(+)/PR(+)/Her2(-) to benefit from chemotherapy while supporting the findings
of other studies which have shown the ER(-)/PR(-)/Her2(-) (triple negative)
subtype to be associated with large tumours, a high incidence of nodal positivity
and the worst overall and disease-free survival for the first four years. After four
years the mortality rate declines rapidly to be on par with other cancers.
One proposed mechanism for developing inherent resistance is the co-
amplification of both human epithelial growth factors, especially Her-2 and co-
activator AIB1 in ER(+) breast cancers (Osborne et al. 2003). In fact, tamoxifen
is found to play the role of an oestrogen agonist rather than antagonist in breast
carcinomas that express high levels of both Her-2 and AIB1, resulting in
stimulation rather than suppression of tumour growth (Shou et al. 2004).
Another mechanism by which oestrogen can promote growth is the fact that ER
located in or near the cell membrane has the ability to activate EGFR as well as
Her-2. This pathway is referred to as the non-genomic pathway. This receptor
cross-talk happens in both directions and therefore ER and AIB1 in turn can
also be phosphorylated by EGFR or HER-2 (Razandi et al. 2003). This non-
genomic pathway is believed to be the reason for tamoxifen monotherapy
failure and the introduction of gefitinib as an EGFR/Her-2 pathway inhibitor in
order to close the so-called “loophole” and restore tamoxifen’s antagonistic
43
effect on ER(+) tumours. Shou et al. (2004) found oestrogen withdrawal in
ER(+) tumour to be a valid alternative to a combination of tamoxifen and
gefitinib treatment. This approach would unfortunately only be beneficial to a
small fraction of ER(+) patients as less than 10% of ER(+) cancers express high
levels of Her-2, suggesting the existence of another mechanism through which
the majority of ER(+) cancers escape endocrine therapy.
2.10 Aims
To determine the expression and prognostic value of selected markers
in the Her-2/PI3K/Akt pathway
To evaluate the chromogenic in-situ hybridization (CISH) technique for its
suitability for analysis of Her-2 gene amplification on archived,
Papanicolaou-stained fine needle aspiration (FNA) samples.

CHAPTER 3
MATERIALS AND METHODS
44
MATERIALS AND METHODS
3.1 Ethical Approval
Ethical approval has been obtained from the Human Research Ethics
Committee at the University of Cape Town. (HREC reference number
082/2009)
3.2 Sample selection
We have selected a retrospective series of primary breast carcinoma cases
based on their Her-2 immunohistochemical results. Twenty seven cases
were Her-2 negative, 7 had a score of (1+), 17 had a score of (2+), while 42
had a score of (3+).
A total of 93 cases were selected for this study (referred to as cohort A).
Sixty seven cases were from the archives of the NHLS Division of Anatomical
Pathology at Groote Schuur hospital (cohort B), but since trastuzumab was
not offered at state facilities at the time of the study, a second cohort of 26
cases from the private sector that received trastuzumab treatment was
included (cohort C). These tissue blocks were obtained from two
independent private pathology laboratories in Cape Town.
A limiting factor in case selection and follow up period has been the fact that
routine Her-2 testing on all invasive breast cancer cases was only introduced
late in 2006. For this reason, only patients who had a mastectomy after the
introduction of routine Her-2 testing, unless they had Her-2 testing done on
request, were included in the study. The outcome was based on the patient
status on 1 July 2011. All cases were reviewed and appropriate tissue
blocks selected for study.
3.3 Data Collection
The histology and cytology reports were obtained from the NHLS Division of
Anatomical Pathology at Groote Schuur hospital or from private pathology
laboratories.

45
Clinical information was obtained with the help of clinical collaborators at the
oncology unit at Groote Schuur hospital and private practice oncology units.
Patients that were lost to follow up or died of unrelated causes were excluded
from the study.
The following clinical and pathological information was recorded:
Clinical stage of tumour at time of mastectomy
Histopathological grade
Tumour type
Age of patient at time of mastectomy
Date of onset of treatment
Lymph node status
Lymphovascular invasion
Her-2 IHC and ISH results
Oestrogen receptor (ER) status*
Treatment / therapy received
Follow up of patient – minimum of 4 years:
- Alive and disease free
- Alive with disease
- Dead
- Disease free survival (DFS)
- Overall survival (OS)
* The progesterone receptor (PR) status was not consistently tested for in the
treatment work-up during this particular period. In view of this inconsistency,
the PR results were not recorded in this study.
3.4 Immunohistochemistry (IHC)
IHC was performed on formalin-fixed, paraffin-embedded tissue sections.
3.4.1 Buffers and reagents used
3.4.1.1 Phosphate buffered saline (PBS) pH7.6
Used for diluting antibodies (without Tween 20) and rinsing (with Tween 20)
46
NaH2PO4 (2H20) 0.78g
Na2HPO4 6.4g
NaCL 42.5g
Dissolve the above in 5L distilled water.
Adjust to pH7.6 using HCL or NaOH.
Add 2.5ml Tween 20 for PBS with Tween when used for rinsing.
3.4.1.2 Tris-HCl buffered saline (TBS) pH7.6
Used for diluting antibodies and rinsing
(HOCH2)3CNH2 3g (TRIS hydroxymethylaminomethane)
NaCl 40.5g
1M HCl 19ml
Distilled water to 5L
3.4.1.3 0.1M Citrate buffer pH6.0
Used for antigen retrieval
Citric acid 10.5g
Dissolve in 4.0L of distilled water.
Adjust to pH6.0 with NaOH
Make up to 5L with distilled water.
3.4.1.4 1mM EDTA pH8.0
Used for antigen retrieval
EDTA 1.86g
Dissolve in 4.9L distilled water.
Adjust to pH8.0 with 1M NaOH.
Make up to 5L with distilled water.
3.4.1.5 1% Copper sulphate
Used to enhance DAB staining/colour
CUSO4 10g
Dissolve in 1L distilled water.

47
3.4.1.6 Scotts tap water
Used for “blueing” after counterstaining with haematoxylin
Na2CO3 3.5g
MgSO4.7H2O 20g
Dissolve in 1L tap water.
3.4.2 Controls
A Study cohorts
Within the total population (93 cases – cohort A), we had a cohort that
received trastuzumab treatment (26 cases – cohort C), while remaining
cohort did not receive trastuzumab treatment (67 cases – cohort B) and was
used as a control group.
B Test controls
Appropriate positive tissue controls were included in each test run*.
For negative controls (IHC), the primary antibody was substituted by PBS
buffer.
*Please refer to Table 1 for specific positive tissue controls that were used
for each antibody.
3.4.3 Method for IHC
Cut sections 4µm thick
Float sections onto APES coated slides and blot
Heat-fix the sections onto the slides by leaving slide on a hot plate
(~60ºC) for at least 10 min.
De-wax in xylene and hydrate slides in graded alcohols down to water
Rinse slides in running tap water
Perform the appropriate antigen retrieval by heat induced epitope
retrieval using Citrate buffer at pH6.0 for 2min or EDTA buffer at pH8.0
for 90 sec, depending on specific antibody requirements (See Table1).
Remove slides from pressure cooker and immerse in running tap
water to cool down.

48
Block for endogenous peroxidase activity by treating slides with 1%
H2O2 in distilled water for 5-10 min (to block non-specific staining)
Rinse in running tap water
Block for non-specific binding by treating slides with normal goat
serum (1:20) for 5-10 min (DAKO)
Drain the normal serum from the slides
Apply appropriately diluted primary antibody for required / optimised
incubation time. See Table 1 for specific antibody dilutions and
incubation times. Dilution of antibody p-Akt was done using TBS.
Rinse thoroughly with PBS
Apply Envision reagent (secondary antibody) for 25-30 min (DAKO)
(NB. use the appropriate Envision reagent for each antibody i.e. goat
anti-mouse OR goat anti-rabbit)
Rinse in running tap water
Apply the chromogenic substrate (1ml buffer + 1 drop 3,3’-
diaminobenzidine-tetrahydrochloride (DAB) for 3-5 min (DAKO)
Rinse in running tap water
Immerse slides in 1% copper sulphate for 3-5 min (enhances the DAB
staining)
Rinse in running tap water
Counter stain in haematoxylin
Rinse in running tap water
“Blue” the slides in Scott’s tap water
Rinse in running tap water
Dehydrate in graded alcohols, rinse in xylene and mount with DPX or
Entellan mounting medium.
The buffer used (either EDTA or Citrate) for antigen retrieval was determined
by the suggested pH requirement specified in the datasheet provided by the
supplier of the antibody.
Primary antibodies and normal goat sera were diluted in PBS without Tween
unless otherwise indicated.

49
All rinse steps are performed with PBS with Tween unless otherwise
indicated.
In the case of antibody p-Akt, PBS was substituted with TBS in all rinsing and
dilution steps.
To prevent further dilution of the reagents, excess fluid was mopped up
around sections before reagents were applied.
Staining was performed in a humidity chamber.
All antibodies were stored between 2-8°C.

Table 1: Summary of antibodies, antigen retrieval, clones, dilutions, controls and incubation times
Antibody Clone Supplier Secondary
Antibody Ag retrieval
Positive
tissue control Dilution
Incubation
time Buffer
Her-2 Polyclonal
Cat # A0485 DAKO Goat Anti-Mouse
EDTA buffer
pH8.0 90 sec Breast carcinoma 1: 250 30 min PBS
PI3K 3E7 Abnova Goat Anti-Mouse Citrate buffer
pH6.0 2min Adrenal gland 1:167 3 hours PBS
PTEN 6H2.1
Enzo Life
Sciences Goat Anti-Mouse
Citrate buffer
pH6.0 2min Endometrium 1:300 1 hour PBS
p-Akt LP18 Leica
Microsystems Goat Anti-Mouse
EDTA buffer
pH8.0 90 sec Skin 1:50 14 hours TBS
NF-κB Polyclonal
Cat # RB-9034
Thermo
Scientific Goat Anti-Rabbit
EDTA buffer
pH8.0 90 sec Prostate 1:100 40 min PBS
MDM2 1B10 Leica
Microsystems Goat Anti-Mouse
Citrate buffer
pH6.0 2min Leiomyosarcoma 1:100 60 min PBS
Bcl-2 124 DAKO Goat Anti-Mouse EDTA buffer
pH8.0 90 sec Tonsil 1:50 40 min PBS
p53 DO-7 DAKO Goat Anti-Mouse d EDTA buffer
pH8.0 90 sec
Colonic
adenocarcinoma 1:100 40 min PBS
Information obtained from package inserts provided by suppliers and further optimization done by researcher

51
3.4.4 Evaluation of slides
Evaluation of the IHC results was done simultaneously by two investigators.
Table 2: Scoring of Her-2 results
Staining pattern Score Assessment
No staining or membrane staining in less than 10% or tumour cells. 0 negative
Faint/barely perceptible membrane staining in more than 10% of
tumour cells. The cells exhibit incomplete membrane staining. 1+ negative
Weak to moderate staining of entire membrane in more than 10% of
tumour cells. 2+ equivocal
Strong staining of entire membrane in more than 10% of tumour cells. 3+ positive
Table 3: ER scoring
Based on the Allred scoring system (Allred et al. 2004)
Proportion
0 1 2 3 4 5
0% <1% 1%-10% 11%-33% 34%-66% >66%
Intensity
0 1 2 3
No staining Weak staining Moderate Strong
The sum of the proportion and intensity scores was regarded as the total ER
score out of a possible score of 8. According to recommended clinical
practice, scores from 0 to 2 were regarded as ER negative and scores from 3
to 8 as ER positive (Lester et al. 2012).
Table 4: Evaluation of all other IHC results
% of cells stained score
<5% 0
5% - 50% low
51% - 100% high
52
3.5 Chromogenic in-situ hibridization (CISH)
CISH was performed on 10 histopathological and corresponding cytological
samples. The cytological samples were archived, Papanicolaou-stained,
FNA slides taken prior to the mastectomy and the histopathological samples,
formalin-fixed, paraffin-embedded tissue sections taken from the mastectomy
specimen.
3.5.1 Probe
The Her-2 CISH probe (SPOT-Light® HER2 CISH kit from Invitrogen)
(FDA approved).
3.5.2 Sample pre-treatment for CISH
Information obtained from the SPOT-Light® HER2 CISH kit package insert
(Intended for use on formalin-fixed, paraffin-embedded tissue)
3.5.3 Preparation of archived cytology slides for CISH:
Immerse slides in xylene until coverslip and mounting medium is
removed.
De-stain in 2% acid alcohol until completely de-stained
Soak in 100% ethanol for 5min
Wash thoroughly in dH2O
3.5.4 Histopathological sample pre-treatment
Cut formalin-fixed, paraffin-embedded tissue into 4μm thick sections
and float onto Histo-bond or APES treated slides
Air dry slides or dry at 37°C, and then bake 2hours at 60°C
3.5.5 Deparaffinization
Immerse in xylene until wax is removed
Soak in 100% ethanol for 5min
Wash thoroughly in dH2O

53
Method for CISH for both histopathological and cytological specimens
3.5.6 Heat pre-treatment
Place slides in slide rack. (Including supplied test control slide)
Heat the Heat Pre-treatment solution in a beaker on a hotplate until
temperature reaches ≥98°C. Cover beaker to prevent evaporation.
Place slides in boiling solution and boil for 15 min. Ensure that the
temperature remains between 98°C and 100°C.
Transfer slides immediately to dH2O at room temperature
Wash in dH2O
3.5.7 Enzyme digestion
Remove enzyme pre-treatment solution (pepsin) from the fridge and
allow to reach room temperature
Add enough enzyme pre-treatment solution to cover the tissue
sections and incubate for 5 min at room temperature
Wash in dH2O
3.5.8 Dehydration in graded ethanol series
Dehydrate in graded alcohols
Allow slides to air dry
3.5.9 Denaturation and hybridization
Add 15µl of probe to the centre of a 22 x 22 mm coverslip
Place coverslip, probe side down, on the appropriate area of the tissue
sample on the slide
Seal the edges of the coverslip with rubber cement in order to prevent
evaporation
Allow rubber cement to dry (10 min)
Place slides in preheated hybridizer with humidity strips and set
program to:
A: Denature at 95°C for 5 min and
B: Incubate overnight (±14 hrs) at 37°C

54
3.5.10 Stringent wash (Day 2)
Prepare two Coplin jars containing saline sodium citrate (SSC) buffer,
one at room temperature and the other heated to 70°C
Peel off rubber cement from slides
To remove coverslip without tearing tissue, pre-soak slides in SSC at
room temperature for 2-3 min, until the coverslip slides off easily
Rinse in SSC at room temperature
Immerse slide in Coplin jar containing SSC at 70°C for 5 min
Wash in dH2O
3.5.11 Immunodetection
Immerse slides in 30% H2O2 in 100% methanol (1:9) (10 min)
Wash in PBS/Tween 20 (0.01%)
Add CAS-Block™ - 2-3 drops per slide and incubate (10 min)
Blot off reagent with tissue paper (do not rinse)
Add mouse anti-digoxigenin antibody – 2-3 drops per slide and
incubate
(30 min)
Wash in PBS/Tween 20 (0.01%)
Add goat anti-mouse HRP polymer conjugate – 2-3 drops per slide
and incubate (30 min)
Wash in PBS/Tween 20 (0.01%)
Prepare DAB substrate-chromogen solution: add one drop of each of
the 3 solutions to 1ml of dH2O
Add DAB – 2-3 drops per slide and incubate (30 min)
Place slides in slide rack
Wash in running tap water
3.5.12 Counterstaining and mounting
Counterstain tissue sections with haematoxylin (5 secs)
Evaluate intensity of counterstain and stain for further (3-5secs) if
needed
Wash in running tap water

55
Dehydration in graded ethanol series, immerse in xylene
Coverslip using DPX or Entellan
2.5.13 Slide evaluation
Slides were evaluated simultaneously by two investigators using an Olympus
BX43 light microscope.
An individual Her-2 gene appears as a small round single dot.
Non-amplification according to the Invitrogen Spot-light® HER2 CISH kit
package insert is defined as:
1-5 single dots in the majority (>50%) of carcinoma cells
Amplification according to the Invitrogen Spot-light® HER2 CISH kit package
insert is defined as:
>5 dots in the majority of carcinoma cells
Large clusters in the majority of carcinoma cells
A mixture of multiple dots and large clusters in the majority of
carcinoma cells
A mixture of multiple dots and small clusters in the majority of
carcinoma cells
Small clusters in the majority of carcinoma cells
Unclear cases of amplification or non-amplification according to the
Invitrogen Spot-light® HER2 CISH kit package insert is defined as:
Specimens that exhibit 4-6 dots in the majority of carcinoma cells
If the average number of dots is between 4 and 6 after 30 carcinoma
cells have been counted, an additional 30 cells should be counted for
a total of 60 cells.
3.6 Her-2 IHC and Her-2 CISH on corresponding histopathology and
cytopathology specimens
The IHC stained slides for Her-2, a test that is routinely performed on all
breast carcinomas, were re-evaluated simultaneously by two observers. We

56
have selected 10 cases which had both tissue blocks and archived FNA
slides available, for testing. We performed Her-2 CISH analysis on the
histopathology sample cut from a paraffin embedded tissue block taken from
the mastectomy specimen, as well as corresponding cytology sample. The
cytopathology sample was obtained by de-staining one archived, diagnostic
FNA slide that was taken shortly before the mastectomy was performed.
We used the ISH results to re-classify all equivocal IHC Her-2 (2+) cases.
3.7 Determining the apoptotic index
The apoptotic index was calculated as the average of the apoptotic cell count
in 50 consecutive high power fields (40X objective) in haematoxylin and
eosin-stained tumour sections of all cases, using a normal light microscope
(Olympus BX43). Areas of necrosis were avoided and multiple apoptotic
bodies in one small area that could have originated from one cell were
counted as one.
3.8 Statistical analysis
The Shapiro Wilk test was used to test whether continuous variables were
normally distributed. A value of >0.05 is regarded as normal distribution.
The association between clinicopathological variables and protein expression
was analyzed using analysis of variance (ANOVA) for continuous variables
and the chi-square or Fishers’ exact test for categorical variables. The
Fisher’s exact test was used if the expected cell frequency in any of the
contingency tables was <5. The level of significance was set at p <0.05 for all
analyses.
Survival curves according to key variables was plotted using Kaplan Meier
graphs and the Log Rank test for equality of survivor functions were used to
assess statistical significance.
The Cox-proportional hazards model was used to estimate the hazard ratios
(HR) and the 95% CI for overall and disease free survival between the
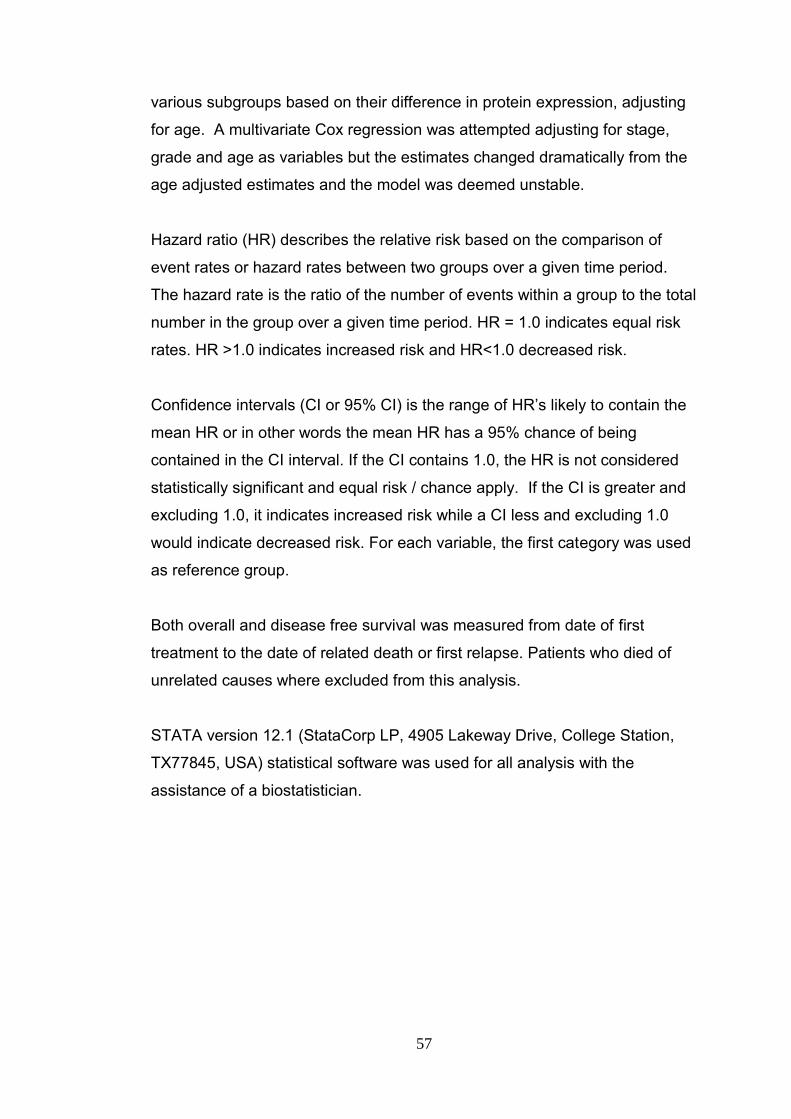
57
various subgroups based on their difference in protein expression, adjusting
for age. A multivariate Cox regression was attempted adjusting for stage,
grade and age as variables but the estimates changed dramatically from the
age adjusted estimates and the model was deemed unstable.
Hazard ratio (HR) describes the relative risk based on the comparison of
event rates or hazard rates between two groups over a given time period.
The hazard rate is the ratio of the number of events within a group to the total
number in the group over a given time period. HR = 1.0 indicates equal risk
rates. HR >1.0 indicates increased risk and HR<1.0 decreased risk.
Confidence intervals (CI or 95% CI) is the range of HR’s likely to contain the
mean HR or in other words the mean HR has a 95% chance of being
contained in the CI interval. If the CI contains 1.0, the HR is not considered
statistically significant and equal risk / chance apply. If the CI is greater and
excluding 1.0, it indicates increased risk while a CI less and excluding 1.0
would indicate decreased risk. For each variable, the first category was used
as reference group.
Both overall and disease free survival was measured from date of first
treatment to the date of related death or first relapse. Patients who died of
unrelated causes where excluded from this analysis.
STATA version 12.1 (StataCorp LP, 4905 Lakeway Drive, College Station,
TX77845, USA) statistical software was used for all analysis with the
assistance of a biostatistician.

CHAPTER 4 RESULTS

58
RESULTS
4.1 Age distribution
The study included 93 invasive breast carcinomas from patients with ages
ranging from 22 to 78 years. Age distribution was found to be normal
according to the Shapiro Wilk test for normality (p=0.9). The mean age was
53.5 years and the standard deviation (SD) 10.76. The highest frequency of
breast carcinoma cases was found in the 55-59 year old age group (Figure
4).
Figure 4: Histogram showing the age distribution of patients
4.2 Racial profile
The racial profile of the patients from Groote Schuur hospital was largely
Coloured (42/67, 62.7%), followed by African patients (10/67, 14.9%) and
White patients (3/67, 4.5%). The race was not stated in 12 (17.9%) cases.
The patients from the second cohort obtained from the private laboratories
were predominantly White (20/26, 76.9%), followed by Coloured patients
(3/26, 11.5%). The race was not stated in 3 (11.5%) cases.
Age distribution (years)
Fre
qu
en
cy (
nu
mbe
r)

59
4.3 Clinicopathological characteristics
Clinicopathological characteristics such as carcinoma classification, stage,
grade, lymphovascular invasion, presence of distant metastasis, presence of
nodal metastasis, treatment offered and patient outcome are listed in Table
5.
4.4 Treatment
All patients had surgical resection. None of these patients received
treatment before surgical resection. Patients who had received trastuzumab
were from the private sector. Two patients were treated with a single
treatment option. The majority of patients received a combination of 3 or
more of the treatment options, depending on hormonal status, tumour stage
and other clinical considerations (Table 6).

60
Table 5: Clinicopathological characteristics
Characteristics n=93 %
Carcinoma classification:
Ductal 85 91.4%
Lobular 8 8.6%
Stage:
I 14 15.1%
II 48 51.6%
III 30 32.3%
IV 1 1.1%
Grade:
1 14 15.1%
2 36 38.7%
3 43 46.2%
Lymphovascular invasion:
Y 70 75.3%
N 23 24.7%
Lymph node metastasis:
Y 59 63.4%
N 34 36.6%
Distant metastases:
Y 28 30.1%
N 65 69.9%
Treatment:
Surgery - Mastectomy 81 87.1%
Surgery – Wide local excision 12 12.9%
Hormonal Therapy 61 65.6%
Chemotherapy 71 73.3%
Radiotherapy 58 62.3%
Trastuzumab 26 28.0%
Outcome:
Disease free 59 63.4%
Alive with disease 14 15.1%
Dead 20 21.5%

61
Table 6: Treatment combinations
Chemotherapy only 4
Chemotherapy + hormone therapy 6
Chemotherapy + hormone therapy + trastuzumab 6
Chemotherapy + hormone therapy + radiotherapy 20
Chemotherapy + hormone therapy + radiotherapy + trastuzumab 10
Chemotherapy + radiotherapy 15
Chemotherapy + radiotherapy + trastuzumab 6
Chemotherapy + trastuzumab 4
Hormone therapy + radiotherapy 6
Hormone therapy only 13
Radiotherapy only 1
Surgery only 2
4.5 Immunohistochemistry results
4.5.1 Her-2
Twenty seven (29.0%) cases were Her-2 negative, 7 (7.5%) had a score of
(1+) (considered negative), 17 (18.3%) had a score of (2+) (considered
equivocal), while 42 (45.2%) had a score of (3+) (considered positive). Three
Her-2 (2+) results were reclassified as Her-2 negative, while 14 were re-
classified as Her-2 positive according to ISH results.
A statistically significant association was found between Her-2 results and
NFκB expression (p=0.035). NFκB expression was high in 63.2% (55/87) of
Her-2(+) cases compared to 36.8% (32/87) in Her-2(-) cases whereas NFκB
expression was low in 16.7% (1/6) of Her-2(+) cases and 83.3% (5/6) Her-2
(-) cases (Appendix 1).
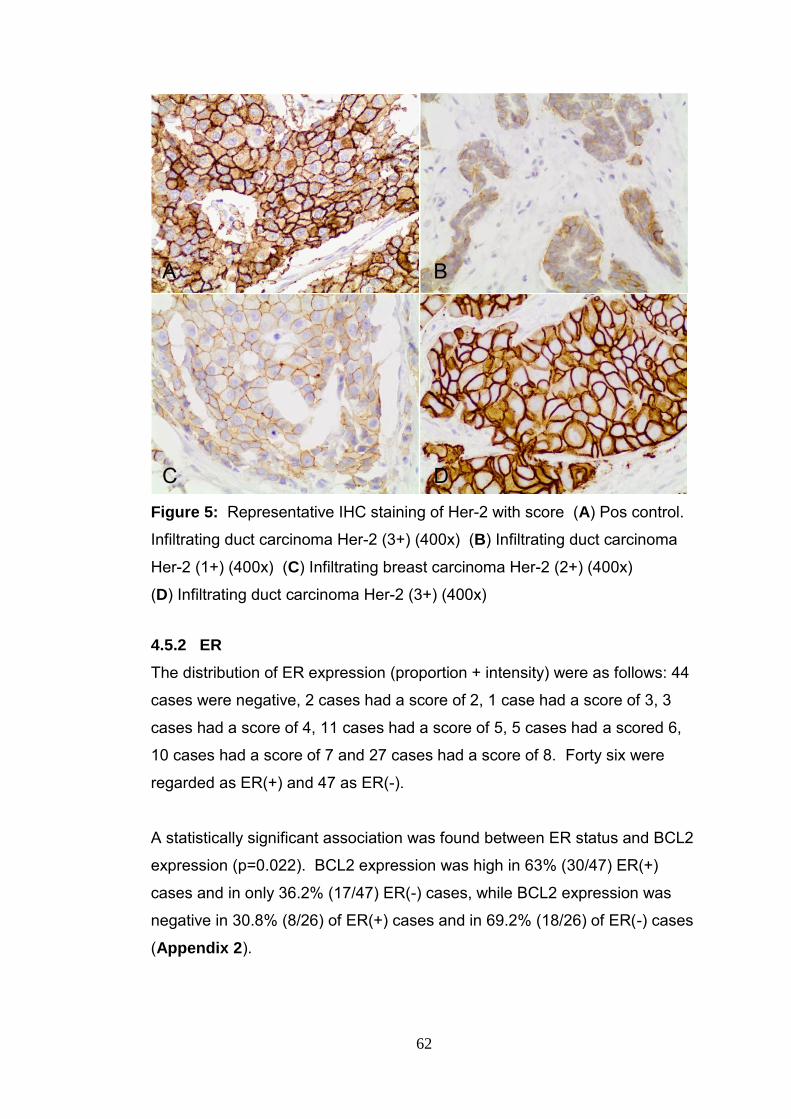
62
Figure 5: Representative IHC staining of Her-2 with score (A) Pos control.
Infiltrating duct carcinoma Her-2 (3+) (400x) (B) Infiltrating duct carcinoma
Her-2 (1+) (400x) (C) Infiltrating breast carcinoma Her-2 (2+) (400x)
(D) Infiltrating duct carcinoma Her-2 (3+) (400x)
4.5.2 ER
The distribution of ER expression (proportion + intensity) were as follows: 44
cases were negative, 2 cases had a score of 2, 1 case had a score of 3, 3
cases had a score of 4, 11 cases had a score of 5, 5 cases had a scored 6,
10 cases had a score of 7 and 27 cases had a score of 8. Forty six were
regarded as ER(+) and 47 as ER(-).
A statistically significant association was found between ER status and BCL2
expression (p=0.022). BCL2 expression was high in 63% (30/47) ER(+)
cases and in only 36.2% (17/47) ER(-) cases, while BCL2 expression was
negative in 30.8% (8/26) of ER(+) cases and in 69.2% (18/26) of ER(-) cases
(Appendix 2).
A B
C D

63
Figure 6: Representative IHC staining of ER with intensity score (A)
Positive control ER (3+) (400x) (B) Infiltrating duct carcinoma ER (1+) (400x)
(C) Infiltrating duct carcinoma ER (2+) (400x) (D) Infiltrating duct carcinoma
ER (3+)
4.5.3 PI3K
Seventy nine (84.9%) cases showed high PI3K expression, 13 (14.0%) low
and 1 (1.1%) was found to be negative for PI3K expression.
We found no significant association between PI3K and any of the other
components (Appendix 3).
A B
D C

64
Figure 7: Representative IHC staining for PI3K (A) Positive control.
Adrenal gland (400x) (B) Infiltrating breast carcinoma showing negative PI3K
expression (400x) (C) Infiltrating breast carcinoma showing low PI3K
expression (D) Infiltrating breast carcinoma showing high PI3K expression
(400x)
4.5.4 PTEN
PTEN showed high expression in 55 (59.1%) of cases, low expression in 27
(29.0%) cases and was negative in 11 (11.8%) cases.
An association was found between PTEN and p-Akt expression (p=0.053)
and between PTEN and Her-2 expression (p=0.065) although these were not
statistically significant.
p-Akt expression was high in 67.8% (40/59) of cases that showed high PTEN
expression, 23.7% (14/59) of cases that showed low PTEN expression and
8.5% (5/59) of cases that was negative for PTEN expression.
A
C
B
D

65
Her-2 was negative in 54.1% (20/37) of cases that showed high PTEN
expression, 24.3% (9/37) of cases that showed low PTEN expression and in
21.6% (8/37) of cases that were negative for PTEN expression (Appendix
4).
Figure 8: Representative IHC staining for PTEN (A) Positive and negative
control. Endometrium showing non-expressing neoplastic glands and normal
stroma showing high PTEN expression (400x) (B) Infiltrating duct carcinoma
showing negative PTEN expression (400x) (C) Infiltrating duct carcinoma
showing low PTEN expression (400x) (D) Infiltrating duct carcinoma showing
high PTEN expression (400x)
4.5.5 p-Akt
p-Akt showed high expression in 59 (63%) of cases, low expression in 26
(28%) cases and was negative in 8 (9%) cases.
Significant associations were found between both p-Akt and NFκB
expression (p=0.014) and p-Akt and MDM2 expression (p=0.040). High
NFκB expression was present in 66.7% (58/87) of cases that showed high p-
D
B A
C
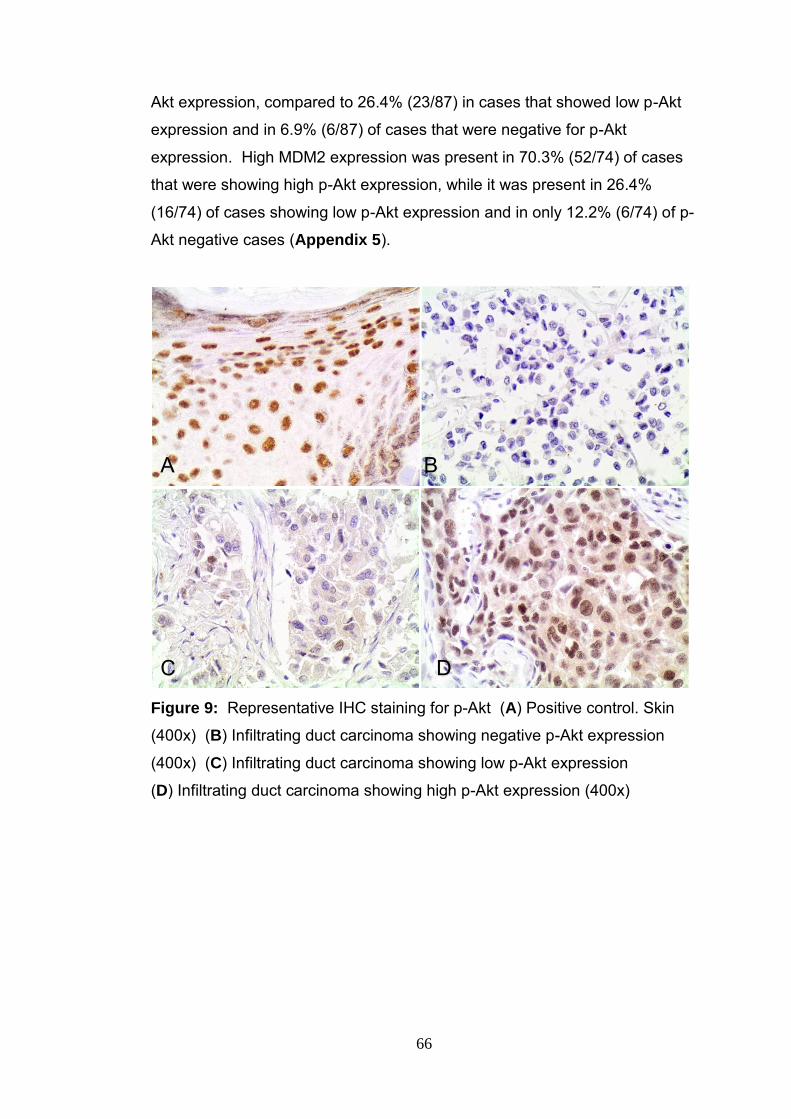
66
Akt expression, compared to 26.4% (23/87) in cases that showed low p-Akt
expression and in 6.9% (6/87) of cases that were negative for p-Akt
expression. High MDM2 expression was present in 70.3% (52/74) of cases
that were showing high p-Akt expression, while it was present in 26.4%
(16/74) of cases showing low p-Akt expression and in only 12.2% (6/74) of p-
Akt negative cases (Appendix 5).
Figure 9: Representative IHC staining for p-Akt (A) Positive control. Skin
(400x) (B) Infiltrating duct carcinoma showing negative p-Akt expression
(400x) (C) Infiltrating duct carcinoma showing low p-Akt expression
(D) Infiltrating duct carcinoma showing high p-Akt expression (400x)
A B
C D

67
4.5.6 MDM2
High expression of MDM2 was found in 74 (80%) cases, low expression in 14
(15%) cases and was negative in 5 (5%) cases.
Figure 10: Representative IHC staining for MDM2 (A) Positive control.
Leiomyosarcoma (400x) (B) Infiltrating duct carcinoma showing negative
MDM2 expression (400x) (C) Infiltrating duct carcinoma showing low MDM2
expression (200x) (D) Infiltrating duct carcinoma showing high MDM2
expression (400x)
A B
C D
68
4.5.7 NFκB
Cytoplasmic expression of NFκB was present in all cases. High cytoplasmic
expression of NFκB was seen in 87 (94%) cases while 6 (6%) cases showed
low expression.
Figure 11: Representative IHC staining for NFκB (A) Positive control.
Prostate (400x) (B) Infiltrating breast carcinoma showing low NFκB
expression (100x) (C) Infiltrating breast carcinoma showing low NFκB
expression (400x) (D) Infiltrating breast carcinoma showing high NFκB
expression (400x)
A B
C D

69
4.5.8 BCL2
High BCL2 expression was seen in 47 (50%) cases, low expression in 20
(22%) cases and was negative in 26 (28%) cases.
Figure 12: Representative IHC staining for BCL2 (A) Positive control.
Tonsil (100x) (B) Infiltrating breast carcinoma showing negative BCL2
expression (400x) (C) Infiltrating breast carcinoma showing low BCL2
expression (400x) (D) Infiltrating breast carcinoma showing high BCL2
expression (400x)
4.5.9 p53
High expression of p53 was found in 21 (23%) cases. The same number
showed low expression while 51 (55%) cases showed no p53 expression.
No statistically significant association was found between p53 and any of the
other protein markers. There was however a slight association between p53
and Her-2 expression (p=0.057). Her-2 expression was negative in 10.8%
A B
C D

70
(4/37) of cases showing high p53 expression, compared to 21.6% (8/37) of
cases showing low p53 expression and 67.6% (25/37) of cases where p53
expression was negative (Appendix 9).
Figure 13: Representative IHC staining for p53 (A) Positive control. Colonic
Adenocarcinoma (400x) (B) Infiltrating duct carcinoma showing negative p53
expression (400x) (C) Infiltrating duct carcinoma showing low p53
expression (400x) (D) Infiltrating duct carcinoma showing high p53
expression (400x)
4.6 Association between clinicopathological variables and protein
expression
4.6.1 Age
A statistically significant association was found between age and Her-2
expression (p=0.044). The mean age for Her-2 (+) expression was 51.6
years (SD 8.6) compared to a slightly older 56.2 years (SD 11.7) for Her-2 (-)
expression. No statistically significant association was found between age
and any of the other markers (Appendix 10).
A B
C B
D

71
4.6.2 Tumour type
A statistically significant association was found between tumour type and
Her-2 expression (p=0.006). Of the 56 cases that were Her-2 (+), 98.2%
(55/56) were ductal carcinomas compared to 1.8% (1/56) lobular carcinomas.
A strong association was also present between tumour type and MDM2
expression (p=0.051) and a slight association between tumour type and ER
expression (p=0.059). Of the 74 cases that showed high MDM2 expression,
91.9% (68/74) were ductal carcinomas and 8.1% (6/74) were lobular
carcinomas.
Of the 46 cases that were ER(-), 97.8% (45/46) were ductal carcinomas and
2.2% (1/47) were lobular carcinomas. In contrast, 85.1% (40/47) of the
ER(+) cases were ductal carcinomas and 6.7% (7/47) were lobular
carcinomas (Appendix 11).
4.6.3 Tumour grade
Significant associations were found between tumour grade and p53 (p =
0.013), Her-2 (p = 0.004) and NFκB (p = 0.051) expressions (Appendix 12).
p53 showed a significant increase in expression with higher tumour grades (p
= 0.013). High p53 expression was seen in 23.8% of grade 2 tumours and
76.2% of grade 3 tumours. High p53 expression was absent in grade 1
tumours.
Positive Her-2 expression was associated with high grade tumours and
varied from 5.4% in grade 1 tumours, 39.3% grade 2 tumours to 55.4% in
grade 3 tumours (p=0.004). Conversely, Her-2 expression was negative in
11 out of 14 (78.65%) grade 1 tumours.
Similarly, high NFκB expression was associated with high grade tumours and
increased from 12.6% in grade 1 tumours to 39.1% in grade 2 tumours and
48.3% in grade 3 tumours (p=0.051).

72
4.6.4 Lymphovascular invasion
Significant associations were evident between lymphovascular invasion and
both PI3K (p=0.010) and ER expression (p<0.001). High PI3K was seen in
79.7% (63/79) of cases that showed lymphovascular invasion compared to
20.3% (16/79) in cases that were negative for lymphovascular invasion.
ER was positive in 95.7% (45/47) of cases that showed lymphovascular
invasion compared to only 4.3% (2/47) expression when lymphovascular
invasion was absent (Appendix 13).
4.6.5 Lymph node metastasis
There was a significant association between ER expression and nodal
involvement (p=0.002). ER expression was positive in 78.7% (37/47) of
cases that showed lymph node involvement, compared to 21.3% (10.47)
expression in those cases that were negative for nodal involvement
(Appendix 14).
4.6.6 Distant metastasis
There was a statistically significant association between MDM2 and distant
metastasis (p=0.017). High MDM2 expression was seen in 75.7% (56/74) of
cases without distant metastases and in 24.3% (18/74) of cases with distant
metastasis while MDM2 was negative in 20.0% (1/5) of cases that showed no
distant metastasis and in 80.0% (4/5) of cases showed distant metastasis.
There was no association between the presence of distant metastases and
any of the other markers (Appendix 15).
4.6.7 Apoptotic index
There was a statistically significant association between the apoptotic index
and PI3K expression (p=0.014) (Appendix 16).

73
4.7 Survival analyses
4.7.1 Survival analysis according to trastuzumab treatment
The survival graph (Figure 14) shows a survival advantage for cohort C,
however this was not statistically significant (p=0.267). The median OS for
cohort C was 80 months. Due to the relatively short follow up period and low
number of regressions, the median OS for cohort B could not be determined.
The 5 year OS for cohort B was 75%, in contrast to 90% for cohort C. The
risk of death for cohort C was 2.5 fold less than that of cohort B (HR 0.4; CI
0.1 – 1.5) but this was not significant according to the age adjusted Cox
regression analysis (Appendix 20).
Figure 14: The Kaplan-Meier graph comparing overall survival between patients in cohort B and cohort C According to the log rank test there was no statistically significant difference
in DFS between cohort B and cohort C (p = 0.429). The Kaplan-Meier graph
shows a DFS advantage for cohort C but due to the low number of
regressions the median DFS could not be calculated for either of these two
groups. The 5 year DFS for cohort B was 70%, in contrast to 80% for cohort
C (Figure 15). The risk for recurrence for cohort C was 1.7 times less than
that of cohort B (HR 0.6; CI 0.2 – 2.1) (Appendix 22).
h= trastuzumab treatment

74
Figure 15: The Kaplan-Meier graph comparing disease free survival between patients in cohort B and cohort C
4.7.2 Survival analysis according to Her-2 expression
According to the log rank test, there was no statistically significant
association between Her-2 expression and OS in cohort A. The median OS
for Her-2 positive tumours was 80 months. The 5 year OS for Her-2 positive
tumours was 79% while that of the Her-2 negative tumours was 75% (Figure
16).
Figure 16: The Kaplan-Meier graph for OS cohort A according to Her-2 expression
The 5 year OS for the Her-2(+) cases in cohort B was 69%, while the OS for
the Her-2(-) group was 78% (Figure 17). The risk for death in the Her-2(+)
h= trastuzumab treatment
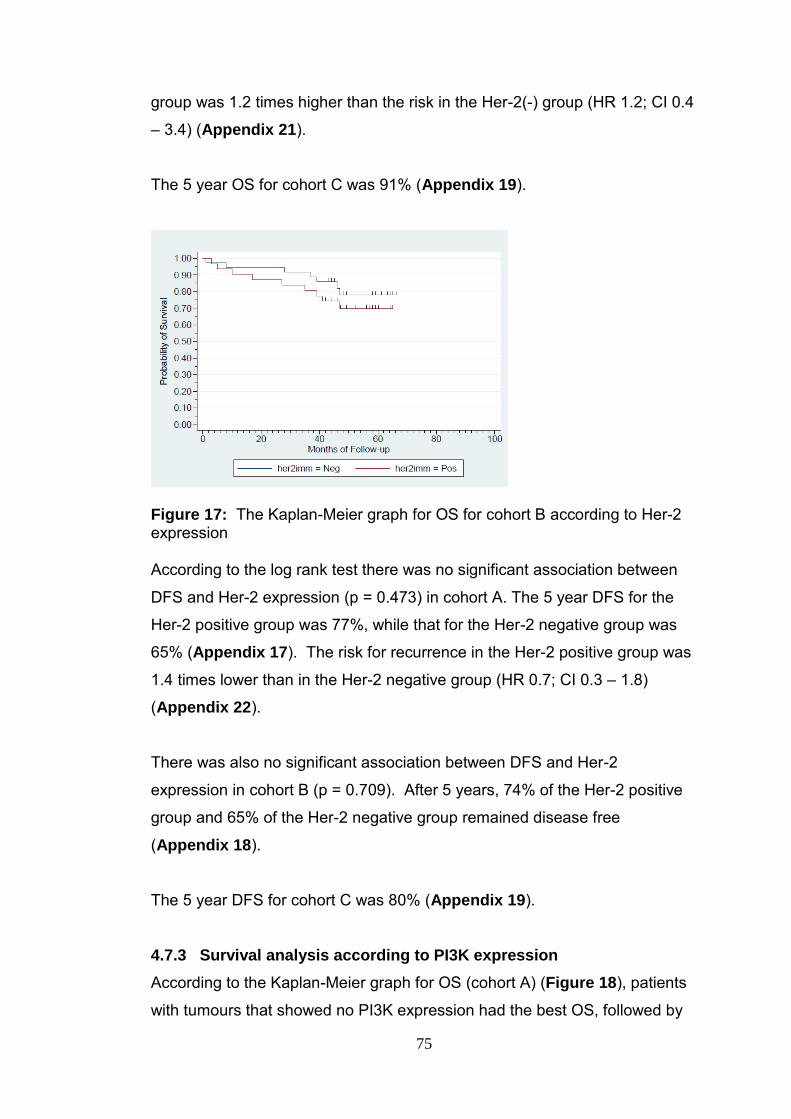
75
group was 1.2 times higher than the risk in the Her-2(-) group (HR 1.2; CI 0.4
– 3.4) (Appendix 21).
The 5 year OS for cohort C was 91% (Appendix 19).
Figure 17: The Kaplan-Meier graph for OS for cohort B according to Her-2 expression According to the log rank test there was no significant association between
DFS and Her-2 expression (p = 0.473) in cohort A. The 5 year DFS for the
Her-2 positive group was 77%, while that for the Her-2 negative group was
65% (Appendix 17). The risk for recurrence in the Her-2 positive group was
1.4 times lower than in the Her-2 negative group (HR 0.7; CI 0.3 – 1.8)
(Appendix 22).
There was also no significant association between DFS and Her-2
expression in cohort B (p = 0.709). After 5 years, 74% of the Her-2 positive
group and 65% of the Her-2 negative group remained disease free
(Appendix 18).
The 5 year DFS for cohort C was 80% (Appendix 19).
4.7.3 Survival analysis according to PI3K expression
According to the Kaplan-Meier graph for OS (cohort A) (Figure 18), patients
with tumours that showed no PI3K expression had the best OS, followed by

76
those with low PI3K expressing tumours. Patients with high PI3K expressing
tumours had a median OS of 80 months. The 5 year OS was 75% for
patients with tumours showing high PI3K expression, 92% for low PI3K
expression and 100% for negative PI3K expression (Appendix 17). The risk
for death in the PI3K low category was 3.3 fold less when compared to the
PI3K high category (HR0.3; CI 0.0 – 2.3). No deaths were recorded in the
PI3K negative category (Appendix 20).
The median DFS of patients according to PI3K expression could not be
calculated due to few recorded deaths. After 5 years 68% of PI3K high
category, 85% of PI3K low category and 100% of PI3K negative category
patients were disease free (Appendix 17). The risk of recurrence for the
PI3K negative category was half that of the PI3K high category (HR 0.5; CI
0.1 – 2.2) (Appendix 22).
Figure 18: The Kaplan-Meier graph for overall survival for cohort A according to PI3K expression 4.7.4 Survival according to PTEN expression
In cohort A, the median OS for the PTEN high category was 80 months. The
5 year OS for the PTEN high category was 80%, PTEN low category 73%
and PTEN negative category 91%. The age adjusted Cox regression
analysis shows that cases that showed low PTEN expression had a 1.9 fold
increased risk of death compared to cases that showed high PTEN

77
expression (HR 1.9; CI 0.7 – 5.2) but this was not statistically significant
(Appendix 20). No deaths were observed in the PTEN low category.
In cohort C, there was a significant association between PTEN expression
and OS (p=0.015). The median OS for the group that showed no PTEN
expression was 20 months, while the median OS for the group that showed
high PTEN was 80 months (Figure 19). The 5 year OS for the PTEN high
category was 89% and the OS for the PTEN low category was 100%. The
OS for the PTEN negative category was 0%, however this category only
contained 1 subject (Appendix 19). According to the age adjusted Cox
regression analysis (data not shown), the risk of death for the PTEN low
category was 2 times that of the PTEN high category (HR 2.0; CI 0.1 – 34.7).
Due to the limitations of small sample size of cohort C and low number of
deaths recorded as a result, these results although significant, may not be
reliable.
Figure 19: The Kaplan-Meier graph for overall survival in cohort C according to PTEN expression According to the log rank test, there was no significant difference in DFS in
cohort A according to the levels of PTEN expression (p = 0.367). After 5
years 70% of patients in the PTEN high category, 64% in the PTEN low
category and 90% in the PTEN negative category were disease free
(Appendix 17).

78
There was no significant difference in DFS according to categories of PTEN
expression in the cohort B (p = 0.0955). The 5 year DFS for the PTEN high
category was 68%, PTEN low category was 56% and the PTEN negative
category was 100% (Appendix 18).
In cohort C, patients with cancers that were PTEN expression negative had a
median DFS of approximately 19 months. After 5 years 80% of the PTEN
high category and 100% of the PTEN low category were disease free
(Appendix 19). The finding of 0% for the PTEN negative category was
disregarded due to the presence of only a single case in this category.
4.7.5 Survival analysis according to p-Akt expression
In cohort A, there was a statistically significant association between p-Akt
expression and OS (p = 0.046). The median OS for the cohort that did not
express Akt was 46 months compared to 80 months for the group that
showed high p-Akt expression. The 5 year OS for the p-Akt high category
was 83%, the OS for the p-Akt low category was 73% and the OS for the p-
Akt negative category was 46% (Figure 20). The p-Akt low category had a
2.1 fold increased risk of death compared to the p-Akt high category (HR 2.1;
CI 0.8 – 5.9), while the p-Akt negative category had a significant 5.1 fold
increased risk for death compared to the p-Akt high category (HR 5.1; CI 1.5
– 17.3) (Appendix 20).

79
Figure 20: The Kaplan-Meier graph for overall survival for cohort A according to p-Akt expression 4.7.6 Survival analysis according to NFκB expression
Patients with high NFκB expressing cancers showed a median OS of 80
months compared to those patients with low NFκB expressing cancers which
had a median OS of 48 months (cohort A). These results were not
statistically significant (p=0.169). The risk of death for the group showing low
NFκB expression was 3.6 times that of the group showing high NFκB
expression (HR 3.6; CI 1.0 – 13.1) (Appendix 20).
4.7.7 Survival analysis according to MDM2 expression
In cohort A, patients with cancers that showed high MDM2 expression had a
median survival of approximately 80 months. The limited number of deaths
recorded in patients with cancers showing low or negative MDM2 expression
prevented the determination of median survival in this group. The 5 year OS
for the MDM2 negative category was 60%, for the low category 65%, and for
the high category 80% (Appendix 17).
In cohort B, the 5 year OS for the MDM2 high category was 79%, for the low
category 58% and for the negative category 60% (Appendix 18). The risk of
death in the MDM2 low category was 3.2 fold higher than the risk in the
MDM2 high category (HR 3.2; CI 1.1 – 9.7), while the risk of death in the
MDM2 negative category was 2.6 fold higher than the MDM2 high category
(HR 2.6; CI 0.6 – 12.2) (Appendix 21).

80
No significant association was established between MDM2 expression and
DFS using the log rank analysis (p = 0.0871). The median DFS for cases
showing no MDM2 expression was 34 months. After 5 years 75% of MDM2
high category, 80% of MDM2 low category and 0% of MDM2 negative
category remained disease free (Figure 21). The risk for recurrence in the
MDM2 negative category showed a 3.5 fold increase compared to the MDM2
high category (HR 3.5; CI 1.01 – 12.1) and was significant (Appendix 22).
Figure 21: The Kaplan-Meier graph for DFS for cohort A according to MDM2 expression
4.7.8 Survival analysis according to BCL2 expression
There was no statistically significant association between BCL2 expression
and OS (p = 0.831) in cohort A. The median OS for the group that showed
high BCL2 expression was 80 months. The 5 year OS for BCL2 high
category was 80%, the OS for both BCL2 low and negative categories were
75% (Appendix 17). There was no significant association between BCL2
expression and DFS (p = 0.952).
4.7.9 Survival analysis according to p53 expression
There was a significant association between p53 expression and OS
(p=0.029) in cohort A (Figure 22). The median OS for patients with p53
negative cancers was 80 months. The low number of deaths recorded in the
p53 low and high categories prevented the calculation of median OS in these

81
groups. The 5 year OS for the p53 high category was 67%, for the p53 low
category 89% and for the p53 negative category 81% (Figure 23). Patients
with tumours expressing high levels p53 had a 5.5 fold increase in the risk of
death compared to those with tumours expressing low levels of p53 and this
was significant (HR 0.18; CI 0.0 – 0.9). Patients with tumours negative for
p53 expression had a 2.5 fold reduced risk for death, compared to those with
tumours expressing high p53 levels (HR 0.4; CI 0.2 – 1.0) (Appendix 22).
Figure 22: The Kaplan-Meier graph for overall survival according to p53 expression for cohort A In cohort B, there was a statistically significant association between p53
expression and OS (p=0.001). The median OS for patients with tumours
expressing high levels of p53 was 42 months (Figure 23). The 5 year OS for
the p53 high category was 40%, the low category was 85% and the negative
category was 83% (Appendix 18). According to the age adjusted Cox
regression analysis (Appendix 21), patients with tumours expressing high
levels of p53, had a 5 fold increased risk of death compared to those with
tumours showing low (HR 0.2; CI 0.0 – 0.9) or negative (HR 0.2; CI 0.1 – 0.7)
p53 expression. Both these findings were statistically significant.

82
Figure 23: The Kaplan-Meier graph for overall survival according to p53 expression for cohort B
In cohort C, the median OS for the p53 negative category was 80 months.
The 5 year OS for both the p53 low and high categories were 100%, while
the OS for the p53 negative category was 78% (Appendix 19).
As a result of too few regressions in cohort A, the median DFS could not be
determined in any of the categories of p53 expression (Figure 24). After 5
years 55% of the p53 high category, 79% of the p53 low category and 75% of
the p53 negative category remained disease free (Appendix 17). The risk
for recurrence in the p53 high category was 2.5 times more when compared
to the p53 low category (HR 0.4; CI 0.1 – 1.4) and double that of the p53
negative category (HR 0.5; CI 0.2 – 1.3) (Appendix 22).
In cohort B, the 5 year DFS for the p53 high category was 0%, for p53 low
category 75%, and for the p53 negative category 77% (Appendix 18). The
risk for recurrence in the p53 high category was 3.3 fold higher compared to
the p53 low (HR 0.3; CI 0.1 – 1.1) and negative (HR 0.3; CI 0.1 – 0.8)
categories (Appendix 23).

83
Figure 24: The Kaplan-Meier graph for disease free survival for cohort A according to p53 expression
In cohort C, the 5 year DFS for the p53 low and high categories were 100%,
while that of the p53 negative category was 63% (Appendix 19). The Cox
regression analysis for this cohort was deemed unstable due to the small
sample size and too few recurrences.
4.7.10 Survival analysis according to the apoptotic index
The median OS for the apoptotic category (5 <7) in cohort A was 80 months.
The 5 year OS for the (<3) category was 77%, for category (3 <5) 72%, for
category (5 <7) 85%, and 87% for category (≥7) (Figure 25).

84
Figure 25: The Kaplan-Meier graph for overall survival for cohort A according to the apoptotic index The overall survival according to the apoptotic index for cohort B did not
reach significance in any of the 4 categories. The 5 year OS for the category
(<3) was 75%, for category (3 <5) 65%, for category (5 <7) 80% and for
category (≥7) 72% (Appendix 18).
The median OS for cohort C according to the apoptotic index was 80 months.
The 5 year OS for the category (<3) was 85%, for category (3 <5) 90%, for
category (5 <7)100%, and for category (≥7) 80%. This was not statistically
significant (Appendix 19).
The median DFS for cohort C could not be established for any of the
apoptotic categories. The 5 year DFS for apoptotic category (<3) was 85%,
for category (3 <5) 67%, for category (5 <7) 64% and for category (≥7) 69%
(Figure 26) (Appendix 17).

85
Figure 26: The Kaplan-Meier graph for DFS for cohort A according to the apoptotic index A median DFS was not reached in any of the categories of apoptosis. The 5
year DFS for apoptotic category (<3) was 80%, for category (3 <5) 63%, for
category (5 <7) 65% and for category (≥7) 62% (Appendix 18).
In cohort C, the median DFS for apoptotic category (5 <7) was around 41
months. The 5 year DFS for apoptotic category (3 <5) was 75% and 0% for
both categories (5 <7) and (≥7). No cases were recorded for the category
(<3) (Appendix 19).
4.7.11 Survival analysis according to age group
Overall survival for cohort A showed a significant association with age
(p=0.028). The median OS for patients in the 45 to 65 year category was 80
months. The 5 year OS for the <45 year group was 65%, for the 45 to 65
year group 76%, and for the ≥65 year group 100% (Figure 27). When an
age adjusted Cox regression analysis was performed (Appendix 20),
patients in the 45 to 65 year category had half the risk of death compared to
the <45 year group (HR 0.5; CI 0.2 – 1.3). No deaths were recorded in the
≥65 year age group.

86
Figure 27: The Kaplan-Meier graph for overall survival for cohort A according to age category* *agecat 1 : <45 years (n=20), agecat 2 : 45 to 65 years (n=59) and agecat 3 : ≥65 years (n=14). Log Rank test: (2 degrees of freedom), Chi2 = 7.16, Pr>Chi2 = 0.028, N=93
The Kaplan-Meier graph for OS according to age category for the cohort of
patients who did not receive trastuzumab treatment (Figure 28) shows that
the overall survival in the age group ≥65 years was better than any other
group. Again the <45 year age group showed the worst overall survival of
the three groups. The 5 year OS for the <45 year age group was 57%, for
the 45 to 65 year old group 74% and for the ≥65 year group 100%. After 5
years 75% of the <45 year age group, 65% of the 45 to 65 year old group
and 88% of the ≥65 year group were disease free (Appendix 18).
The 5 year OS in cohort C for the age category <45 was 75%, for age
category 45 to 65 years 92% and for ≥65 year age group 100%. The 5 year
OS in cohort B for the <45 year age group was 57%, for the 45 to 65 year
age group 74% and for the ≥65 year old group 100%.

87
Figure 28: The Kaplan-Meier graph for overall survival according to age category for cohort B In cohort B, the 5 year DFS for the age group <45 was 75%, for the age
group 45 to 65 years 65% and for the ≥65 age group 88%. Due to the low
number of recurrences in cohort C, a median DFS could not be determined in
any of the age categories. After 5 years 85% the of the <45 year age group
was disease free, while no subject was disease free in either the 45 to 65
year old group or the ≥65 year age group (Appendix 19).
4.8 Comparing Her-2 evaluation by IHC and CISH on corresponding
histopathological and cytopathological specimens
We performed Her-2 CISH analysis on the histology as well as the
corresponding FNA (cytology) sample. An IHC score of <2 was regarded as
negative, a score of 2 was equivocal and a score of 3 was positive. CISH on
the other hand needs a score of >5 to be considered positive for
amplification. Comparing Her-2 CISH results performed on cytopathological
and histopathological specimens, there was a 100% correlation between Her-
2 CISH done on a de-stained, archived FNA (cytopathological) samples and
the corresponding histopathological samples cut from paraffin embedded
tissue blocks. In addition, there was a 100% correlation between the positive
and negative IHC and CISH results. Out of the 6 Her-2 (2+) IHC scores, we
found the Her-2 CISH to be amplified in 1 case and not amplified in 5 cases
on both histopathological and cytopathological samples.

88
Table 7: Comparison between Her-2 IHC and Her-2 CISH on corresponding histopathological and cytopathological specimens
Case no. Her-2 IHC Her-2 CISH on Histo Her-2 CISH on Cyto
54 2 6.2 >10
56 3 10 >10
60 0 1.6 1.6
65 2 2.1 3.6
73 2 3.8 3.9
79 2 2.3 2.7
83 3 7.5 10
87 3 6.2 7
103 2 2.1 3.9
231 2 1.5 2.3

89
Figure 29: Her-2 CISH control results (A) Pos control (cell line) 5-10 copies
(original magnification 400x) (B) Pos control 5-10 copies (±900x) (C) Pos
control (cell line) 10+ copies (original magnification 400x) (D) Pos control
10+ copies (±900x) (E) Positive control histology 10+ copies (original
magnification 400x) (F) Positive control histology 10+ copies (±900x)
A B
C D
E F
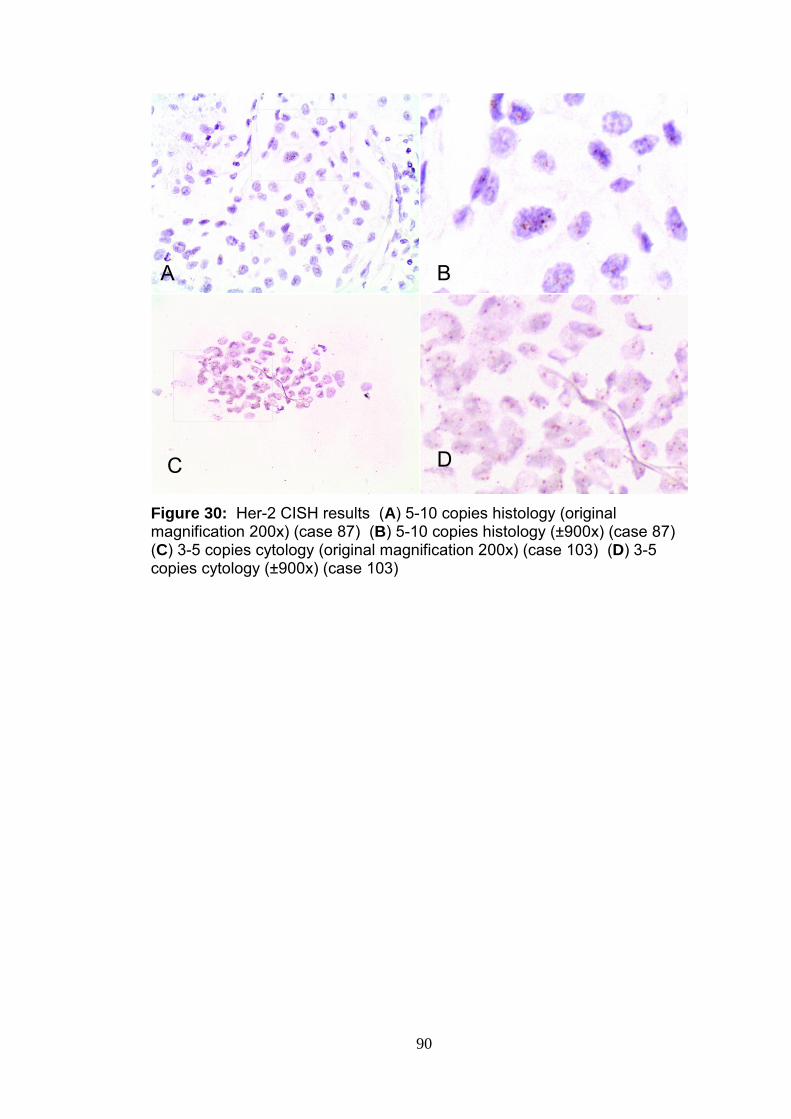
90
Figure 30: Her-2 CISH results (A) 5-10 copies histology (original magnification 200x) (case 87) (B) 5-10 copies histology (±900x) (case 87) (C) 3-5 copies cytology (original magnification 200x) (case 103) (D) 3-5 copies cytology (±900x) (case 103)
B
A
C
D
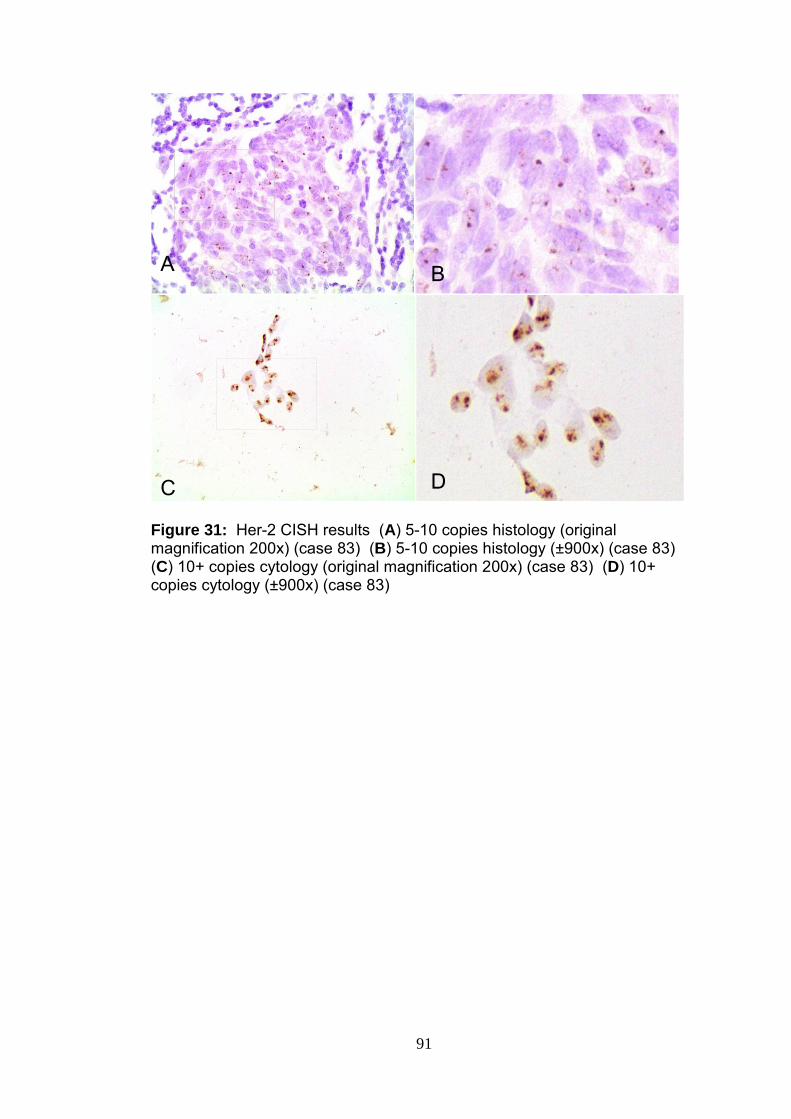
91
Figure 31: Her-2 CISH results (A) 5-10 copies histology (original magnification 200x) (case 83) (B) 5-10 copies histology (±900x) (case 83) (C) 10+ copies cytology (original magnification 200x) (case 83) (D) 10+ copies cytology (±900x) (case 83)
A
C
B
D

92
Figure 32: Her-2 CISH results (A) 3-5 copies histology (original
magnification 200x) (case 73) (B) 3-5 copies histology (±900x) (case 73)
(C) 3-5 copies cytology (original magnification 200x) (case 73) (D) 3-5
copies cytology (±900x) (case 73)
AG
C
B
D

CHAPTER 5 DISCUSSION

93
DISCUSSION
5.1 Introduction
Breast cancer is a multifaceted disease with almost unique protein signature,
prognosis and treatment response for each patient even for the same tumour
type and grade. These findings underline the importance of being able to
tailor cancer treatment based on the genetic profile for each individual. This
approach ensures that every patient gets the treatment that would benefit her
most, while at the same time minimizing the side effects of the treatment.
Our results reveal some statistically significant associations between
clinicopathological features, treatment response and protein expression.
Some of the proteins tested show promise as markers for prognostic profiling
and clinical management.
5.2 Trastuzumab benefit
In order to assess the benefit derived from trastuzumab treatment, we
compared the OS and DFS in cohort C which was given trastuzumab
treatment to cohort B that was not given trastuzumab treatment. Although
none of the results were statistically significant, it showed that trastuzumab
did in fact lower the risk for both death and recurrence in cohort C and
improved both the 5 year DFS and OS.
5.3 Her-2
Her-2 was positive in 60.8% of the breast cancers in our study. However this
most likely is an overestimation of the frequency of Her-2 positivity in our
population as our cases were selected based on their Her-2 status in order to
have representation of both Her-2 positive and negative cancers. Slamon et
al. (1987) reported Her-2 overexpression in 20 – 30% of breast cancers.
In an attempt to try and understand what effect Her-2 signalling has on
downstream components of the PI3K/Akt pathway, we compared the
expression of Her-2 to that of other components in the pathway. There was
no significant association between Her-2 expression and PI3K (p=0. 730), p-

94
Akt (p=0.803), MDM2 (p=0.197), BCL2 (p=0.109) or ER (p=0.581)
expression. The lack of an association between Her-2 and PI3K expression
suggests that Her-2 may not be responsible for the increase in PI3K
expression. The increase in PI3K expression may be due to the loss of
PTEN function or due to an activating mutation within the PIK3CA gene itself.
Since there was no association between PTEN and PI3K (p=0.812), the likely
reason for PI3K activation is an activating mutation in the PIK3CA gene. We
found no association between Her-2 and p-Akt expression which is in
contrast to the findings of Park and Kim (2007) who found significant
associations between both nuclear and cytoplasmic p-Akt expression and
Her-2 overexpression in a study involving 127 breast cancer cases. Similarly
Wu et al. (2008) reported a statistically significant association between p-Akt
and Her-2 expression in a study involving 141 breast cancer samples.
Vestey et al. (2005) on the other hand in a study involving 97 breast cancer
cases, found no association between p-Akt and Her-2 expression (p=0.545).
In the analysis it became evident that different immunohistochemical scoring
methods were employed in the various studies, which may explain the
discrepant findings. What the abovementioned studies did have in common
was the fact that they have used both the staining intensity and proportion in
scoring p-Akt expression, while our study used proportion of staining only
due to the subjectivity of intensity assessment and the variation in staining
batches. Another factor that may have influenced the results was the
number of categories and how the scores were re-categorized. There was
however a significant and direct association between Her-2 and NFκB
expression (p=0.035). NFκB expression was predominantly high in Her-2
positive cases and predominantly negative in Her-2 negative cases.
Similarly, Shapochka et al. (2013) reported a significant association between
Her-2 and NFκB expression. The positive association between Her-2 and
NFκB expression and the absence of any significant association between
Her-2 and PI3K or p-Akt, suggests that Her-2, in the majority of cases, may
be a factor responsible for the activation of NFκB. This finding confirms the
findings of Merkhofer et al. (2010) who showed that Her-2 activates NFκB
through the canonical pathway by inactivating IKKα.

95
A slight association was present between Her-2 and p53 (p=0.0566).
Yamashita et al. (2004) found that patients with tumours that were positive
for both Her-2 and p53 expression, had a significantly decreased DFS when
compared to patients with a larger tumour size and positive lymph node
status. It was also reported that patients with both Her-2 and p53 positive
tumours showed benefit when treated with high dose FAC (fluorouracil,
doxorubicin, cyclophosphamide) (Thor et al. 1992).
There was a slight association between Her-2 and PTEN expression
(p=0.065) where PTEN negative expression was predominantly observed in
Her-2(-) cases and PTEN low and high expression in Her-2(+) cases. The
influence of PTEN expression on the prognosis of Her-2 positive breast
cancer patients treated with trastuzumab or radiation is somewhat
controversial. A few studies have suggested that PTEN contributes towards
the efficacy of trastuzumab and radiation therapy and that PTEN loss is
associated with resistance to trastuzumab treatment (Nagata et al. 2004;
Hennessy et al. 2005; Esteva et al. 2010). Yet another study concluded that
PTEN status had no effect on trastuzumab benefit in Her-2 positive patients
(Perez et al. 2013).
A statistically significant association was found between Her-2 expression
and tumour type (p = 0.006). Of the 56 Her-2 positive cases the majority
were ductal carcinomas (55) and only one case was a lobular carcinoma.
Our observations are supported by the findings of both Porter et al. (1991)
and Hoff et al. (2002), who found Her-2 expression to be diminished or
absent in classic invasive lobular carcinoma. Hoff et al. (2002) reported
statistically significant associations between Her-2 gene amplification and
tumour type (p<0.005). They found absence of Her-2 amplification in 99% of
invasive lobular carcinomas and low grade ductal carcinomas and suggested
that should the Her-2 gene be amplified in any of the two abovementioned
conditions, those cases be re-evaluated to exclude a misclassification.
Similar results were reported by Porter et al. (1991) who found a single case
of Her-2 amplification amongst 62 cases of lobular carcinoma. Upon review
it was found that it might not have been a true amplification. A larger study

96
by Ariga et al. (2005) involving 390 invasive ductal carcinomas and 128
invasive lobular carcinomas, reported Her-2 amplification in 17% of ductal
carcinomas and 6% of lobular carcinomas. Their finding of 6% of lobular
carcinomas showing Her-2 amplification was higher than our findings as well
as the findings of Hoff et al. (2002) and Porter et al. (1991).
There was a statistically significant association between Her-2 expression
and tumour grade (p=0.004). Her-2 expression was found to be mostly
negative in the lower grade tumours but showed a significant increase with
increasing tumour grades. Her-2 expression increased from 5.4% in grade 1
tumours to 39.3% in grade 2 tumours and 55.4% in grade 3 tumours. Similar
findings were reported by Hoff et al. (2002) who found statistically significant
associations between Her-2 gene amplification and tumour grade. Ariga et
al. (2005) have also reported statistically significant associations between
Her-2 amplification and tumour grade. Hoff et al. (2002) found no Her-2
amplification in 72 out of 73 (99%) low grade ductal carcinomas, confirming a
significant association between tumour grade and Her-2 status. Although we
found no Her-2 expression in 11 of the 14 (78.6%) grade1 carcinomas, we
found Her-2 negative expression more or less evenly distributed between the
different tumour grades. It was suggested that the reason for the strong
association between Her-2 expression and tumour grade may in part be due
to the fact that both the rate of internalization and ligand dissociation from
Her-2-containing dimers are very slow, with longer and more intense
signalling as a result (Alroy and Yarden 1997; Klapper et al. 2000). The
effect is more pronounced when Her-2 is overexpressed and leads to
enhanced growth responsiveness and ultimately, malignant growth (Rubin
and Yarden 2001).
We did not find any association between Her-2 expression and
lymphovascular invasion, lymph node involvement or distant metastasis.
Widodo et al. (2013) showed significant associations between
lymphovascular invasion and p53 expression and between lymphovascular
invasion and proliferation rate, but also did not find any association between
lymphovascular invasion and Her-2 status.

97
According to the age adjusted Cox regression analysis, Her-2(+) expression
was associated with an increased risk of death, when compared to Her-2(-)
expression (HR1.2; CI 0.4 – 3.4) in cohort B. The 5 year OS for the Her-2(+)
cases in cohort B was 69%, compared to 91% in cohort C. The 5 year OS
for the Her-2(-) cases in cohort B was 78%. Although these results were not
statistically significant, it shows that trastuzumab treatment is effective in
reducing the risk of death in Her-2(+) tumours.
This study was not able to test the effectiveness of trastuzumab treatment on
Her-2(-) tumours but results of a recent retrospective study at the University
of Michigan showed that patients with Her-2(-) breast cancer that were
incorrectly categorized as Her-2(+) and were treated with trastuzumab
benefitted just as much as women who were actually Her-2(+). They found
Her-2 selectively expressed in cancer stem cells but because of the small
numbers it did not reach the Her-2(+) threshold. These tumour stem cells,
although present in small numbers stimulate tumour growth and spread and
are resistant to current chemo- and radiation treatments. Researchers also
found that primary Her-2(-) tumours showed higher Her-2 expression in bone
metastases compared to the primary tumour. Trastuzumab was able to
selectively target these metastatic cells leading to survival benefit (Boltz
2013).
5.4 PI3K
PI3K showed high expression in 85.4% of our total study population, low
expression in 12.7% and was negative in 1.8% of cases. PIK3CA mutations
or PI3K pathway activation has been associated with a poor OS irrespective
of treatment (Jensen et al. 2011). PI3K pathway activation has also been
associated with resistance to tamoxifen and conventional chemotherapeutic
drugs and lack of response to anti-Her-2 drugs. In an attempt to try and
understand the role of PI3K in the Her-2/PI3K/Akt pathway we compared
PI3K expression to other components in the pathway but did not find any
association between PI3K expression and any of the other components in the
pathway.
98
The relationship between PI3K and PTEN is somewhat controversial and
many different findings have been reported. In this study, PI3K was positive
in 79 cases (85%) of which PTEN was positive in 47 (59.5%), showed low
expression in 22 (27.8%) and negative in 10 (12.7%) cases. No case was
found to be negative for both PTEN and PI3K expression. Saal et al. (2005)
found an inverse relationship between PI3K mutations and PTEN loss, where
PTEN was positive or functional in 86% of cancers bearing PIK3CA
mutations. Our findings were not as striking as the findings of Saal et al.
(2005) although we looked at PI3K immunoexpression and not mutations as
they did. Wang et al. (2011), on the other hand, did not find PIK3CA
mutations and PTEN loss to be mutually exclusive as 3 out of 4 patients with
PI3K mutations were also found to have no PTEN expression.
No significant association between PI3K and tumour type was observed. A
significant association was present between PI3K expression and
lymphovascular invasion (p = 0.012) and a slight association between PI3K
expression and lymph node involvement (p=0.062). Of the cases with high
PI3K expression, 82.9% had lymphovascular invasion and 17.1% did not
have lymphovascular invasion. It could be argued that the PI3K/Akt pathway
would most likely be activated in high grade tumours and that
lymphovascular invasion would be more frequent in these tumours, but no
association was found between PI3K and tumour grade. There is no
literature on the association between lymphovascular invasion and PI3K
expression, although Saal et al. (2005) described a strong relationship
between PIK3CA mutations, Her-2 expression and ER/PR status in lymph
node positive breast cancers. They found PIK3CA mutations in 58% of Her-
2(+)/ER(+) breast cancers. We found a stronger association between PI3K
expression and Her-2(+)/ER(+) cancers. PI3K was overexpressed in 25 of
the 27 (92.6%) Her-2(+)/ER(+) cases in this study. Lymphovascular invasion
was present in 23 of these 25 (92.0%) Her-2(+)/ER(+)/PI3K high expression
cases. The lymphovascular status was not available in the remaining 2
cases. Lymph node involvement was present in 18 (72.0%) of these Her-
2(+)/ER(+)/PI3K high expression cases. Our findings not only confirms a

99
strong association between PI3K expression and the Her-2(+)/ER(+) subtype
but also shows a strong association between a subtype Her-2(+)/ER(+)/PI3K
high expression cancers and both lymphovascular and lymph node
involvement.
5.5 PTEN
We found PTEN loss in only 11.8% of breast cancer cases in our study.
Pérez-Tenorio et al. (2007) found PTEN loss in 37% of breast cancer cases,
while Panigrahi et al. (2004) reported PTEN loss in 8% of their study
population. Other studies have also reported a lack of consistency in PTEN
expression and suggested that it may be due to the use of different
antibodies, tissue processing methods, scoring methods and cut-off criteria.
Loss of PTEN expression reported in Her-2 positive cancers ranged between
15% and 65% (Nagata et al. 2004; Esteva et al. 2010; Jensen et al. 2011).
We observed loss of PTEN expression in 5.3% of Her-2(+) cancers which is
lower than the reported findings and suggests that loss of PTEN function in
our cohort population played a smaller role in tumour development than
reported by other studies.
According to our findings high PI3K expression was found in 90.9% of PTEN
negative tumours. Barbareschi et al. (2012) on the other hand reported
PTEN loss and PIK3CA mutations to be present in the same cancer in 13%
of their cases.
No association was found between PTEN and Her-2 expression (p=0.065)
and only a slight association between PTEN and p-Akt expression
(p=0.0534). Contrary to findings by Stemke-Hale et al. (2008) who found p-
Akt to be present in higher levels in PTEN low than PTEN high cancers, we
found high expression of p-Akt in 67.8% of cases that showed high PTEN
expression and only in 8.5% of cases that were negative for PTEN
expression. These results are surprising since Akt is supposedly activated
by loss of PTEN and/or PI3K activation. A study by Panigrahi et al. (2004)
assessing the role of PTEN in signalling pathways also reported findings of a
positive correlation rather than an inverse relationship between PTEN and
100
Akt. They suggested that ER, rather than PTEN, is the most common
regulator of Akt. When comparing ER(+) expression with p-Akt expression,
high p-Akt expression was present in (31/47) 66.0% of ER(+) cases, low
expression in (12/47) 25.5% and no expression in (4/47) 8.5%, similar to the
findings of Panigrahi et al. (2004). Esteva et al. (2010) found no correlation
between PTEN loss/PI3K mutations and p-Akt in a study involving 137 Her-2
overexpressing breast cancer cases. Interestingly, Fabi et al. (2010) found
co-expression of PTEN and p-Akt to be associated with a lower risk for
progression and an enhanced treatment response when treated with
trastuzumab.
No association was found between PTEN and PI3K, MDM2, BCL2, NFκB or
p53 expression. Nor was there any significant association between tumour
grade and PTEN expression (p=0.592). By contrast, Rasheed et al. (1997)
found PTEN expression to be associated with high grade tumours while
PTEN was rarely present in low grade tumours. The distribution of PTEN
expression was found to be similar across all tumour grades.
Loss of PTEN expression correlated with an increased risk of death in our
total study population. Low PTEN expression was associated with a 1.6 fold
increased risk of death compared to high PTEN expression. The number of
PTEN negative cases and recorded deaths were unfortunately too small to
produce a reliable result. A statistically significant association was present
between PTEN expression and OS in cohort C, which is consistent with
previous studies that found PTEN activity to contribute to the efficacy of
trastuzumab (Nagata et al. 2004; Hennessy et al. 2005; Esteva et al. 2010).
High PTEN expression was associated with a decreased risk for progression
in cohort C. Our findings support the findings of those studies who found
PTEN to be a valuable prognostic marker and powerful predictor of
trastuzumab resistance (Nagata et al. 2004; Esteva et al. 2010). A recent
study looking at activating mutations in PIK3CA as well as Her-2 and PTEN
status in patients with Her-2 amplified breast cancer that had recurrent
disease after adjuvant trastuzumab treatment or showed disease progression

101
while on trastuzumab treatment, found PTEN to be absent or significantly
diminished in 59% of cases and activating mutations in the PIK3CA gene in
29% of cases. Her-2 expression was lost in less than 5% of cases
(Chandarlapaty et al. 2011). Nagata et al. (2004) found that PI3K inhibitors
were able to overcome trastuzumab resistance caused by PTEN-loss and
subsequent PI3K/Akt pathway activation.
5.6 p-Akt
Since Akt seems to be a key player in the PI3K/Akt pathway, we compared p-
Akt expression with the expression of both upstream and downstream
components in this pathway. Phosphorylated Akt (p-Akt) was found to be
overexpressed in (59/93) 63.4% of breast cancers in our study.
No association was found between p-Akt and Her-2 or ER expression. Our
findings differ from that of Park and Kim (2007) who reported a significant
association between p-Akt and Her-2 overexpression. They also reported a
significant association between nuclear p-Akt expression and ER expression.
Stemke-Hale et al. (2008) found Akt mutations to be restricted to ER positive
cases and found no Akt mutations in Her-2 positive breast cancer.
Admittedly, they looked at Akt mutations and not protein expression.
There was no significant association between p-Akt and PI3K expression and
only a slight association between p-Akt and PTEN expression. Fabi et al.
(2010) reported significant associations between both p-Akt and PI3K and
between p-Akt and PTEN expression. Other studies found PTEN expression
to be lower when the levels of p-Akt were increased and the PI3K/Akt
pathway activated (Kang et al. 2005; Stemke-Hale et al. 2008). Since there
was no association between Her-2 and p-Akt expression or PI3K and p-Akt
expression, it is possible that p-Akt was activated by an activating mutation
within the Akt gene or by a mechanism other than the Her-2 pathway. Akt
mutations appear to be rare having been found in only 1.4% of cases in a
large breast cancer study (Stemke-Hale et al. 2008). A further possibility
perhaps could be that PTEN, in an attempt to overcome or compensate for
PI3K activity, was up-regulated by a negative control mechanism in response

102
to the increase in PIP3 concentration, which is the product of PI3K activity.
PTEN response was not effective enough to completely block PI3K
signalling.
We did find significant associations between p-Akt and NFκB expression
(p=0.014) and between p-Akt and MDM2 expression (p=0.040). Similarly,
deGraffenreid et al. (2004) reported a positive association between p-Akt and
NFκB expression. They suggested that NFκB may be the reason for
tamoxifen resistance in p-Akt positive breast cancers due to its role in
resistance to apoptosis and induction of angiogenesis and invasion. They
have suggested that inhibition of NFκB may be an effective strategy in
reversing tamoxifen resistance in these cases. A study by Schmitz et al.
(2006) involving 121 breast cancer cases reported a significant association
between p-Akt and its downstream effector, MDM2 as well. Breast cancers
expressing both p-Akt and MDM2 had a significantly worse prognosis
compared to cancers expressing p-Akt alone. The prognosis was even
worse when p53 in addition, was negative.
We found no association between p-Akt and BCL2 or p53 expression, nor did
we find any significant association between p-Akt expression and tumour
type, lymphovascular invasion, lymph node involvement, distant metastasis
or the apoptotic index. There was however a slight association between p-
Akt expression and tumour grade (p=0.066).
Patients with tumours showing low p-Akt expression had a 2.1 fold increased
risk of death compared to those that showed high p-Akt expression (HR 2.1;
CI 0.8 – 5.9), while the group that showed no p-Akt expression had a
significant 5.1 fold increased risk of death compared to those showing high p-
Akt expression (HR 5.1; CI 1.5 – 17.3). These results shows p-Akt
expression to be an independent prognostic factor but were unexpected as p-
Akt is supposedly associated with high grade tumours, treatment resistance
and poor outcome (Sun et al. 2001; Cicenas et al. 2005; Schmitz et al. 2006).
Looking at the findings of more recent studies it appears that the earlier
perceptions of the role of p-Akt in survival has somewhat changed as

103
reflected in recent findings. According to Yang et al. (2010), p-Akt
significantly improves DFS in node positive breast cancers treated with
paclitaxel. Aleskandarany et al. (2011), on the other hand did not find p-Akt
to be a prognostic marker but a study by Fohlin et al. (2013) found Akt2
expression to be associated with a good long term prognosis in ER(+) breast
cancer. We found p-Akt to be a prognostic indicator irrespective of ER
status. p-Akt expression is associated with a better outcome.
5.7 BCL2
In our study population, BCL2 was positive in 50.5% of cases which is
somewhat lower than the findings of Dawson et al. (2010), who reported
positive BCL2 expression of 73% of breast cancers. They found ER(+)
expression in 86% and Her-2(+) expression in 8% of these cases, while we
found ER(+) expression in 63.8% and Her-2(+) expression in 55.3% of BCL2
positive cases. We saw a significant association between BCL2 and ER
expression (p=0.022) but did not find any significant association between any
of the other upstream components and BCL2. Our findings are supported by
the findings of Silvestrini et al. (1994) who reported an association between
BCL2 expression and low grade, slowly proliferating, ER(+) tumours.
Since there was no significant association between BCL2 and p-Akt, it is
possible that BCL2may be activated in a p-Akt independent manner,
including an activating mutation within the BCL2 gene or another
independent mechanism.
In addition, we found no significant association between BCL2 expression
and any of the clinicopathological variables. We did not find a significant
association between OS or DFS and BCL2 expression. Dawson et al. (2010)
found BCL2 to be a favourable, independent, prognostic marker in early
stage breast cancer. They have also reported a strong association between
the intensity of BCL2 IHC staining and OS. Women, whose cancers showed
the most intense BCL2 staining, had the best OS. We have opted not to use
staining intensity but rather extent of staining to score protein expression

104
because staining intensity is subjective and is influenced by many factors
such as tissue fixation, detection method and batch variation.
5.8 MDM2
MDM2 showed high expression in 79.6% of cases, low expression in 15.1%
and no expression in 5.4% of cases. We saw a significant association
between MDM2 and p-Akt expression (p=0.040) but there was no association
between MDM2 and any of the other upstream components. These results
confirms the role of Akt in MDM2 activation and are consistent with those
previous studies that found associations between Akt and MDM2 activation
and is in keeping with the Akt signalling hypothesis (Wang et al. 2011).
There was no association between MDM2 and p53 expression. MDM2
showed high expression in 78.4% of cases in which p53 was negative and is
in keeping with normal p53 expression and negative control exerted by
MDM2. In addition, MDM2 showed high expression in 71.4% of cases in
which p53 was highly expressed. This may be explained by the presence of
dysfunctional MDM2 molecules that are unable to bind and label p53 for
degradation or alternatively, p53 has undergone post-translational
modification and has been stabilized as a result of oncogenic stress, leading
to an increase in its half life and making it resistant to MDM2-mediated
ubiquitination and degradation as MDM2 is unable to ubiquitinate p53 in its
phosphorylated state (Meek 1994; Goga et al. 1995; Hirao et al. 2000; Ghosh
and Bose 2005; Francoz et al. 2006).
There was also a slight association between MDM2 expression and tumour
type (p=0.051). MDM2 expression was associated with ductal rather than
lobular carcinomas.
A statistically significant association was found between MDM2 expression
and absence of distant metastasis (p=0.017). The highest expression of
MDM2 was found in cases that showed no distant metastasis. This may be
an indication of a protective role for MDM2 against distant metastasis and is
105
also in keeping with the findings of Hori et al. (2002) who associated MDM2
expression with favourable prognostic indicators. The role for MDM2 as
prognostic indicator is controversial as it has been associated with both
favourable and poor prognoses (Onel and Cordon-Cardo 2004).
A positive association was present between MDM2 expression and OS.
According to the age adjusted Cox regression analysis, low MDM2
expression was associated with a 2.4 fold increase in risk of dying compared
to high MDM2 expression, while no MDM2 expression, was associated with a
2.8 fold increased risk of dying compared to high MDM2 expression. Cases
that showed high MDM2 expression showed a noticeable survival advantage
to those cases that showed only low or no MDM2 expression. These findings
are in contrast with the findings from other studies which found MDM2
expression to be associated with a poor clinical outcome (Jiang et al. 1997;
Wang et al. 2005; Schmitz et al. 2006; Turbin et al. 2006). A few studies
have reported a positive relationship between MDM2 expression and clinical
outcome in both breast cancers and melanomas (Hori et al. 2002; Polsky et
al. 2002). Polskyet al. (2002) found MDM2 to be an independent predictor of
survival in primary malignant melanoma and reported statistically significant
associations between MDM2 overexpression and both DFS and. In support
of our findings, a study by Hori et al. (2002) reported a positive association
between MDM2 overexpression and favourable prognostic parameters such
as low grade tumours and the absence of lymph node involvement.
5.9 NFκB
NFκB expression was found to be linked to high grade carcinomas, with high
NFκB expression present in 12.6% of grade 1 tumours, 39.1% in grade 2
tumours and 48.3% in grade 3 tumours (p = 0.051). Our findings are
supported by the findings of Ozbek et al. (2012) who reported an association
between NFκB expression and tumour grade in renal cell carcinomas.
Tannahill et al. (2009) on the other hand, did not find any association
between cytoplasmic or nuclear NFκB expression (both total and
phosphorylated) and tumour grade. We found strong cytoplasmic staining for
NFκB but very little evidence of nuclear staining in our study. Where nuclear

106
staining was observed, it was present in less than 3% of the tumour cells.
The antibody datasheet provided by the manufacturer, indicated that
cytoplasmic staining should be expected. We contacted the manufacturer
and they indicated that the data sheet should in fact state that both nuclear
and cytoplasmic NFκB staining is expected. We subsequently found a paper
by Miyamoto et al. (1994), with very similar findings. They metabolically
labelled mature B cells and fragmented them into nuclear and cytoplasmic
pools before immuno-precipitating it with antibodies specific for NFκB and
IκB. They detected around 10% of the total NFκB protein in the nucleus of
unstimulated, mature B cells, while the rest of the NFκB proteins (around
90%) was found sequestered by IκB’s in the cytoplasm. It was the findings of
Cogswell et al. (2000) however that provided an explanation for our findings.
They demonstrated the presence of p52, p50 and c-Rel subunits in the
nucleus of almost all breast tumour cases, while the p65 subunit, which
happens to be the subunit our NFκB antibody was directed against, was
virtually undetected. Their findings explain why we could not demonstrate
significant nuclear staining for NFκB which in our case was directed
specifically at the p65 subunit of the classic p50/p65, NFκB heterodimer.
They suggested that a mechanism other than the typical mechanism of NFκB
activation may be involved. They also demonstrated the presence of p65 in
the nucleus of cell lines but found that it differs from p65 expression in breast
tumours. They suggested that difference in p65 behaviour may be due to the
extracellular environment which is the culture medium in cell lines or even the
number of genetic replications of the immortal cell line (Cogswell et al. 2000).
This fact would, to an extent, explain the discrepancy in the findings between
different studies. If the extracellular environment did in fact have an influence
on p65 activation, one could postulate that p65 is activated directly or
indirectly by an extracellular stimulus that is also present in the culture
medium. The reason for the increase in cytoplasmic NFκB expression with
increase in tumour grade remains unclear. We found no significant
association between NFκB expression and lymphovascular invasion.
We found statistically significant associations between NFκB and Her-2
expression (p = 0.035) and between p-Akt and NFκB expression (p=0.014).

107
5.10 p53
A statistically significant association was found between p53 expression and
tumour grade (p = 0.013). High p53 expression increased from 0% in grade1
tumours to 13.9% in grade 2 tumours and 37.2% in grade 3 tumours. This
confirms the findings of other studies who reported significant associations
between p53 expression and tumour grade (Ostrowski et al. 1991; Sirvent et
al. 1995). Since wild type p53 is usually not detected by
immunohistochemistry at normal levels of expression due to its short half life
and negative regulation by MDM2, an increase in p53 expression towards the
higher tumour grades suggests an increase in the frequency of p53
mutations or alternatively, an increase in p53 activity due to wild type p53
being stabilized as a result of an increase in oncogenic stress signals.
Similarly, in a large study, Olivier et al. (2006) found p53 mutations to be
more frequent in aggressive phenotypes such as high grade, large size,
lymph node positive and low hormone content cancers. These results
confirm our findings.
A slight association was present between p53 and Her-2 expression
(p=0.057). Camerini et al. (2011) found no association between p53 and
Her-2 expression but reported an association between p53 and tumour
stage.
Overexpression of nuclear p53 has been associated with a poor prognosis.
Sirvent et al. (2001) reported a statistically significant association between
p53 expression and shorter DFS and OS. Similarly, we found a statistically
significant association between p53 expression and OS (p = 0.029). Patients
with tumours expressing low levels p53 had a 5.5 fold reduction in risk for
dying compared to those with tumours expressing high levels of p53.
Patients with tumours negative for p53 expression had a 2.5 fold reduced risk
of dying, compared to those with tumours expressing high p53 levels (HR
0.4; CI 0.2 – 1.0). These findings confirm the findings of Sirvent et al. (2001)
who reported a significant association between nuclear p53 expression and
poor prognosis.

108
5.11 Oestrogen receptor (ER)
A statistically significant association was evident between ER and BCL2
expression (p=0.022) and ER expression and lymphovascular invasion (p<
0.001). ER expression was negative in all cases without lymphovascular
invasion and positive in 64.3% of cases with lymphovascular invasion.
In addition, a statistically significant association was found between ER
expression and lymph node involvement (p=0.002). These findings are in
contrast to those of Sofi et al. (2012) who did not find any correlation
between ER/PR expression and lymph node involvement in breast
carcinomas.
ER expression was more frequent in lobular compared to ductal carcinomas.
5.12 Age
A statistically significant association was present between patient age and
Her-2 expression (p=0,044). This is consistent with the findings of at least
one other study linking Her-2(+) tumours with a younger age and a possible
contributing factor to the more aggressive tumour behaviour and prognosis in
the younger population (Anders et al. 2011).
There was no other association found between age and protein expression.
p53, although not statistically significant, showed a decrease in expression
with increase in age, a finding that is supported by the findings of another
study (Stark et al. 2003). To try and find an explanation for this observation,
we looked at the various reasons for p53 immunoexpression. p53
expression could be linked to gain of function mutations in the p53 gene
which could be further enhanced by the inability of mutant p53 to induce
translation of MDM2, the negative regulator of p53. Another possible reason
for the accumulation of p53 could be that wild-type p53 is activated
(phosphorylated) and stabilized under conditions of stress which include
oncogenic stress. The half life of p53 is increased under these conditions of
stress. Negative regulation by MDM2 is inhibited due to the fact that MDM2

109
is degraded under these conditions. In addition, MDM2 is only able to
degrade unphosphorylated p53, which further enhances the level of wild type
p53 (Meek 1994; Stott et al. 1998; Zhang et al. 1998). Since it is impossible
to distinguish between mutated and wild type p53 looking at protein
expression, it is possible that some of the p53 expression observed was
actually wild-type p53 and not the product of mutated p53. It has been
shown that the efficiency of the immune system as well as DNA repair
diminish with age (Vyjayanti and Rao 2006; Woodland and Blackman 2006;
Yamada et al. 2006). One could postulate that the accumulation of DNA
mutations over a life time in the p53 gene itself or the proteins involved in its
activation in response to cellular stress or DNA damage, results in a decline
in p53 activity and/or efficiency with increasing age and could possibly be a
reason why most cancers arise in the last quarter of life and why we see
diminished p53 expression with age. Feng et al. (2007) tested this theory in
a mouse model where mice were irradiated with gamma rays at ages of 6
months, 20 months, 24 months and 28 months. Both the levels of p53
response to radiation as well as the level of p53 phosphorylation were lower
in the older mice. They also found lower levels of p53 mediated apoptosis in
the spleens of older mice compared to the younger mice. The decline in p53
activity correlated progressively with an increase in age. They also found a
decline in total RNA as well as protein levels of ATM kinase in older mice.
ATM kinase is responsible for stabilization and activation of p53 following
DNA damage or cellular stress and could be a possible mechanism by which
p53 activity is diminished in old age. This decline in activation was only seen
in the p53 pathway. Activation of the Akt and mTOR pathways did not show
a decline with an increase in age (Feng Z et al. 2007).
Olivier et al. (2006) in a comprehensive study reported a significant
association between p53 mutations and age with a noticeable decline in
mutations in the cancers of women older than 60 years of age (Olivier M et
al. 2006). Although this could be a reason for the decrease in p53
expression in older patients and confirms an association between p53
mutation and expression, the reason for the decline in p53 mutations with
increasing age is not clear.

110
A strong association was found between age and overall survival (OS)
across all three cohorts, which was statistically significant in cohort A, but not
in the two treatment dependent cohorts due to the limitation of sample size.
In all three cohorts, the <45 year group had the worst median overall survival
followed by the 45 <65 year group. The ≥65 year age group showed the best
median OS across all cohorts.
These findings suggest an association between age and survival and also
prove age to be a strong prognostic indicator in the premenopausal
population. This however is not a new finding but confirms that although the
incidence of cancer is lower in the premenopausal population, carcinomas in
this population tend to be more aggressive possibly as a result of oestrogen
stimulation. In keeping with this fact our study found that postmenopausal
women and in particular those who had an oophorectomy, also had the best
overall and disease free survival rates in the group that received trastuzumab
therapy. Looking at these findings, the use of anti-oestrogens or oestrogen-
deprivation therapy to either block the effect of oestrogen on these cancers
or diminish the level of circulating oestrogen, seems like an effective
treatment option. Unfortunately, as mentioned before, Her-2 overexpression
has been associated with resistance to anti-oestrogens, and in particular to
tamoxifen, one of the most popular anti-oestrogens (Dowsett 2001; Lipton et
al. 2002; Johnston 2006). More than one study has suggested that anti-
oestrogen therapy may actually have a detrimental effect on Her-2(+)
cancers (Borg A et al. 1994; Lohrisch and Piccart 2001). Results of a few in
vitro studies have shown that trastuzumab may actually be able to enhance
the growth inhibitory effect of anti-oestrogens and may even reverse the
resistance of Her-2(+) cancers to anti-oestrogens like tamoxifen and
suggested that the combination of trastuzumab and an anti-oestrogen may
actually be a powerful treatment approach (Witters et al. 1997; Kunisue et al.
2000; Argiris et al. 2004). The unfortunate reality is that unless trastuzumab
becomes more affordable, only a few of Her-2(+) patients will be able to
afford this benefit. One can only hope that with the original patent for
trastuzumab expiring in 2014, similar drugs will become more affordable and
available to patients with breast cancer and not just a privileged few.

111
5.13 Her-2 ICH and CISH on matched cytopathology and
histopathology samples
We assessed the newly available brightfield chromogenic in-situ hybridization
(CISH) method for effectiveness and suitability as a testing method for Her-2
status on both formalin fixed paraffin embedded tissue and archived, Pap-
stained, FNA samples. There was 80% concordance between Her-2 IHC
and Her-2 CISH results. Inaccuracy with both IHC and ISH remains a major
issue worldwide. The accuracy of Her-2 testing is crucial as a false positive
result will lead to unnecessary and wasteful expenditure. A false negative
result would deprive a patient of trastuzumab therapy. In an attempt to
improve the accuracy of Her-2 testing in routine practice, the American
Society of Clinical Oncology together with the College of American
Pathologists (2007) published guidelines for Her-2 testing and analysis.
They however could not clearly demonstrate the superiority of either the IHC
or ISH method for Her-2 testing, but found the IHC method to be more
dependent on pre-analytical variables than the ISH method, while the IHC
method proved more reliable in fresh frozen tissue than the ISH method
(Wolff AC et al. 2007). They identified a list of variables as possible sources
of Her-2 testing variation.
There was 100% concordance of Her-2 CISH results on corresponding
cytopathology and histopathology samples. These findings serve as
evidence that Her-2 CISH can be performed not only on paraffin embedded
tissue but also on stained and archived FNA samples that have been de-
stained for CISH. The advantage of being able to use stained FNA samples
over unstained FNA samples is that it allows you to assess the material
beforehand to make sure that you do in fact have adequate material and
mark areas of interest before de-staining it. We have also noticed a slightly
higher score in the cytology samples which we have attributed to the
possibility of antigen masking in formalin fixed paraffin embedded tissues.
The fact that some nuclei are sliced when tissue is sectioned as part of the
histology preparation may also explain the slightly lower average score. We
also observed that in cases where the nuclear detail on the FNA sample was
partly obscured mainly due to drying artefact, the gene amplification could

112
still be assessed but it was more difficult to identify nuclear borders. Liquid
based cytology preparations should be an ideal method for CISH analysis as
the material is normally very well preserved and concentrated in a small area
on the slide. The smaller area allows the use of a smaller amount of probe
which makes it more cost effective. The advantages of this method are that
there is no need for a special dark room or fluorescent microscope and the
signals will not fade as is the case with a fluorescent signal.

CHAPTER 6
CONCLUSION AND FUTURE RESEARCH

113
In spite of the limitations of this study on breast cancer, there are interesting
conclusions with potential clinical significance.
Her-2(+) immunoexpression was associated with ductal carcinomas and high
tumour grade.
High PI3K expression was associated with lymphovascular invasion and lymph
node metastasis.
This study also found a strong association between a specific subgroup of
breast cancer [Her-2(+)/ER(+)/PI3K (high expression)] and both lymphovascular
involvement and lymph node metastasis.
High p-Akt expression was an indicator for good prognosis. The absence of p-
Akt expression was associated with five fold increase in the risk of death
compared to cases showing high p-Akt expression.
High MDM2 expression was associated with an absence of distant metastasis
and reduced risk of death (3.2 fold decrease in risk of death compared to low
MDM2 expression).
One of the shortcomings of this project was the small sample size, especially
the cohort that received trastuzumab treatment, which in some instances
proved too small to produce a reliable or significant result.
Since this study focused on the immunohistochemical detection of proteins, it
would be important to confirm and correlate these results with molecular
genetic analyses.
In addition, the chromogenic in-situ hybridization (CISH) technique for
determining Her-2 amplification can be done successfully on archived, Pap-
stained, FNA samples.

114
Based on these findings we propose that liquid based cytological
preparations would be ideal for CISH analysis as the material is normally
very well preserved and concentrated in a small area on the slide. The
smaller area allows the use of a small amount of probe which makes it more
cost effective.

REFERENCES

Accili D, Arden K (2004). FoxOs at the crossroads of cellular
metabolism,differentiation, and transformation. Cell, 117, 421-426.
Ackah E, Yu J, Zoellner S, et al. (2005). Akt1/protein kinase Balpha is critical for ischemic and VEGF-mediated angiogenesis. J Clin Invest, 115, 2119-2127.
Adler V, Pincus M, Minamoto T, et al. (1997). Conformation-dependent phosphorylation of p53. Proc Natl Acad Sci U S A, 94, 1686 - 6891.
Ak P, Levine A (2010). p53 and NF-κB: different strategies for responding to stress lead to a functional antagonism. FASEB J, 24, 3643-3652.
Al-Halabi R, Bou Chedid M, Abou Merhi R et al. (2011). Gallotannin inhibits NFĸB signaling and growth of human colon cancer xenografts. Cancer Biol Ther, 12, 59-68.
Al-Kuraya K, Schraml P, Torhorst J, et al. (2004). Prognostic relevance of gene amplifications and coamplifications in breast cancer. Cancer Res, 64, 8534-8540.
Albain K, Barlow W, Ravdin P, et al. (2009). Adjuvant chemotherapy and timing of tamoxifen in postmenopausal patients with endocrine-responsive, node-positive breast cancer: a phase 3, open-label, randomised controlled trial. Lancet, 374, 2055-2063.
Aleskandarany M, Rakha E, Ahmed M, et al. (2010). PIK3CA expression in invasive breast cancer: a biomarker of poor prognosis. Breast Cancer Res Treat, 122.
Alessi D, Cohen P (1998). Mechanism of activation and function of protein kinase B. Curr Opin Genet Dev, 8, 5-62.
Alessi D, James S, Downes C, et al. (1997). Characterization of a 3-phosphoinositide-dependent protein kinase which phosphorylates and activates protein kinase Balpha. Curr Biol, 7, 261-269.
Allred DC, Brown P, Medina D (2004). The origins of estrogen receptor alpha-positive and estrogen receptor alpha-negative human breast cancer. Breast Cancer Res, 240-245.
Alroy I ,Yarden Y (1997). The ErbB signaling network in embryogenesis and oncogenesis: signal diversification through combinatorial ligand-receptor interactions. FEBS Lett, 410, 83-86.
Anders C, Fan C, Parker J, et al. (2011). Breast carcinomas arising at a young age: unique biology or a surrogate for aggressive intrinsic subtypes? J Clin Oncol, 29, e18-20.
Arboleda M, Lyons J, Kabbinavar F, et al. (2003). Overexpression of AKT2/protein kinase Bbeta leads to up-regulation of beta1 integrins, increased invasion, and metastasis of human breast and ovarian cancer cells. Cancer Res, 63, 196-206.
Ariga R, Zarif A, Korasick J, et al. (2005). Correlation of Her-2/ neu Gene Amplification with Other Prognostic and Predictive Factors in Female Breast Carcinoma. Breast Journal, 11, 278-280.
Argiris A, Wang C, Whalen S, DiGiovanna M (2004). Synergistic interactions between tamoxifen and trastuzumab (Herceptin). Clin Cancer Res, 1409-1420.
Ashcroft M, Taya Y,Vousden K (2000). Stress signals utilize multiple pathways to stabilize p53. Mol Cell Biol, 20, 3224-3233.

116
Bacus S, Altomare D, Lyass L, et al. (2002). AKT2 is frequently upregulated in HER-2/neu-positive breast cancers and may contribute to tumor aggressiveness by enhancing cell survival. Oncogene, 21, 3532-3540.
Baeuerle P, Baltimore D (1988). I kappa B: a specific inhibitor of the NF-kappa B transcription factor. Science, 242, 540-546.
Baeuerle P, Baltimore D (1989). A 65-kappaD subunit of active NF-kappaB is required for inhibition of NF-kappaB by I kappaB. Genes Dev, 3, 1689-1698.
Baldwin AJ (1996). The NF-kappa B and I kappa B proteins: new discoveries and insights. Annu Rev Immunol, 14, 649-683.
Balendran A, Casamayor A, Deak M, et al. (1999). PDK1 acquires PDK2 activity in the presence of a synthetic peptide derived from the carboxyl terminus of PRK2. Curr Biol., 9, 393-404.
Balendran A, Biondi R, Cheung P et al. (2000). A 3-phosphoinositide-dependent protein kinase-1 (PDK1) docking site is required for the phosphorylation of protein kinase Czeta (PKCzeta) and PKC-related kinase 2 by PDK1. J Biol Chem, 275, 20806-20813.
Barak Y, Juven T, Haffner R, Oren M (1993). mdm2 expression is induced by wild type p53 activity. EMBO J, 12, 461-468.
Barbareschi M, Cuorvo L, Girlando S, et al. (2012). PI3KCA mutations and/or PTEN loss in Her2-positive breast carcinomas treated with trastuzumab are not related to resistance to anti-Her2 therapy. Virchows Arch, 461, 129-139.
Baskaran R, Wood L, Whitaker L, et al. (1997). Ataxia telangiectasia mutant protein activates c-Abl tyrosine kinase in response to ionizing radiation. Nature, 387, 516-519.
Basso A, Soli D, Chiosis G, et al. (2002). Akt forms an intracellular complex with heat shock protein 90 (Hsp90) and Cdc37 and is destabilized by inhibitors of Hsp90 function. J Biol Chem, 18, 39858-39866.
Beauparlant P, Lin R, Hiscott J (1996). The role of the C-terminal domain of I kappa B alpha in protein degradation and stabilization. J Biol Chem, 271, 10690-10696.
Beg A, Ruben S, Scheinman R, et al. (1992). I kappa B interacts with the nuclear localization sequences of the subunits of NF-kappa B: a mechanism for cytoplasmic retention. Genes Dev, 6, 1899-1913.
Belacossa A, Testa J, Staal S, Tsichlis P (1991). A retroviral oncogene Akt, encoding a serine-threonine kinase containing an SH2-like region. Science, 254, 244-247.
Bensaad K, Tsuruta A, Selak M, et al. (2006). TIGAR, a p53-inducible regulator of glycolysis and apoptosis. Cell, 126, 107-120.
Bergh J, Norberg T, Sjogren S, Lindgren A, Holmberg L (1995). Complete sequencing of the p53 gene provides prognostic information in breast cancer patients, particularly in relation to adjuvant systemic therapy and radiotherapy. Nature Med, 1, 1029-1034.
Berns K, Horlings HM, Hennessy BT, et al. (2007). A functional genetic approach identifies the PI3K pathway as a major determinant of trastuzumab resistance in breast cancer. Cancer Cell, 12, 395-402.
Bertheau P, Plassa F, Espié M, et al. (2002). Effect of mutated TP53 on response of advanced breast cancers to high-dose chemotherapy. Lancet, 360, 852-854.
117
Bertheau P, Turpin E, Rickman D, et al. (2007). Exquisite sensitivity of TP53 mutant and basal breast cancers to a dose-dense epirubicin-cyclophosphamide regimen. PLoS Med, 4, e90.
Bischoff J, Friedman P, Marshak D, Prives C, Beach D (1990). Human p53 is phosphorylated by p60-cdc2 and cyclin B-cdc2. Proc Natl Acad Sci U S A, 87, 4766-4770.
Biswas D, Shi Q, Baily S, et al. (2004). NF-kappa B activation in human breast cancer specimens and its role in cell proliferation and apoptosis. Proc Natl Acad Sci U S A, 101, 10137-10142.
Blandino G, Levine A, Oren M (1999). Mutant p53 gain of function: differential effects of different p53 mutants on resistance of cultured cells to chemotherapy. Oncogene, 18, 477-485.
Boatright K, Renatus M, Scott F, et al. (2003). A unified model for apical caspase activation. Mol Cell, 11, 529-541.
Boltz K (2013) 17/11/2013, <http://www.oncologynurseadvisor.com/trastuzumab-may-also-be-effective-for-women-with-her2-negative-breast-cancer/article/283475/>
Borg A, Baldetorp B, Fernö M, et al. (1994). ERBB2 amplification is associated with tamoxifen resistance in steroid-receptor positive breast cancer. Cancer Lett, 81, 137-144.
Borg A, Lennerstrand J, Stenmark-Askmalm M, et al. (1995). Prognostic significance of p53 overexpression in primary breast cancer; a novel luminometric immunoassay applicable on steroid receptor cytosols. Br J Cancer, 71, 1013-1017.
Borresen AL (1995). TP53 mutations and breast cancer prognosis: Particularly poor survival rates for cases with mutations in the zinc-binding domains. Genes Chromosom. Cancer, 14,71-75.
Bose I, Ghosh B (2007). The p53-MDM2 network: from oscillations to apoptosis. J Biosci, 32, 991-997.
Bours V, Franzoso G, Azarenko V, et al. (1993). The oncoprotein Bcl-3 directly transactivates through kappa B motifs via association with DNA-binding p50B homodimers. Cell, 72, 729-739.
Boyd S, Tsai K, Jacks T (2000). An intact HDM2 RING-finger domain is required for nuclear exclusion of p53. Nat Cell Biol, 2, 563-568.
Brasier A (2006). The NF-kB regulatory network. Cardio vasc Toxicol, 6, 111-130.
Brodowicz T, Wiltschke C, Budinsky A, et al. (1997). Soluble HER-2/neu neutralizes biologic effects of anti-HER-2/neu antibody on breast cancer cells in vitro. Int J Cancer, 73, 875-879.
Brunet A, Bonni A, Zigmond M, et al. (1999). Akt promotes cell survival by phosphorylating and inhibiting a Forkhead transcription factor. Cell, 96, 857-868.
Bueso-Ramos C, Manshouri T, Haidar M, et al. (1996). Abnormal expression of MDM-2 in breast carcinomas. Breast Cancer Res Treat, 37, 179-188.
Burstein H, Kuter I, Campos S, Gelman R, et al. (2001). Clinical activity of trastuzumab and vinorelbine in women with HER2-overexpressing metastatic breast cancer. J Clin Oncology, 19, 2722-2730.
Buschmann T, Adler V, Matusevich E, Fuchs S, Ronai Z (2000). p53 phosphorylation and association with murine double minute 2, c-Jun

118
NH2-terminal kinase, p14ARF, and p300/CBP during the cell cycle and after exposure to ultraviolet irradiation. Cancer Res, 60, 896-900.
Callagy G, Pharoah P, Pinder S, et al. (2006). Bcl-2 is a prognostic marker in breast cancer independently of the Nottingham Prognostic Index. Clin Cancer Res, 12, 2468-2475.
Camerini A, Donati S, Viacava P, et al. (2011). Evaluation of HER2 and p53 expression in predicting response to docetaxel-based first-line chemotherapy in advanced breast cancer. J Exp Clin Cancer Res, 11, 30-38.
Campbell I, Russel S, Choong D, et al. (2004). Mutation of the PIK3CA gene in ovarian and breast cancer. Cancer Res, 64, 7677-7681.
Campbell R, Bhat-Nakshatri P, Patel N, et al. (2001). Phosphatidylinositol 3-kinase/AKT-mediated activation of estrogen receptor alpha: a new model for anti-estrogen resistance. J Biol Chem, 276, 9817-9824.
Cantley L (2002). The phosphoinositide 3-kinase pathway. Science, 296, 1655-1657.
Cardone, M, Roy, N, Stennicke, H et al. (1998). Regulation of cell death protease caspase-9 by phosphorylation. Science, 282, 1318-1321.
Carpenter C, Auger K, Duckworth B, et al. (1993). A Tightly Associated Serine/Threonine Protein Kinase Regulates Phosphoinositide 3-Kinase Activity. Mol Cell Biol, 13, 1657-1665.
Carraway KI, Rossi E, Komatsu M, et al. (1999). An intramembrane modulator of the ErbB2 receptor tyrosine kinase that potentiates neuregulin signaling. J Biol Chem, 274, 5263-5266.
Carroll P, Okuda M, Horn H, et al. (1999). Centrosome hyperamplification in human cancer: chromosome instability induced by p53 mutation and/or Mdm2 overexpression. Oncogene, 18, 1935-1944.
Cary L, Chang J, Guan J (1996). Stimulation of cell migration by overexpression of focal adhesion kinase and its association with Src and Fyn. J Cell Sci, 7, 1787-1789
Cesková P, Chichger H, Wallace M, Vojtesek B, Hupp T (2006). On the mechanism of sequence-specific DNA-dependent acetylation of p53: the acetylation motif is exposed upon DNA binding. J Mol Biol, 357, 442-456.
Chae B, Bae J, Lee A, et al. (2009). p53 as a specific prognostic factor in triple-negative breast cancer. Jpn J Clin Oncol, 39, 217-224.
Chakrabarty A, Sánchez V, Kuba M, Rinehart C, Arteaga C (2011). Feedback upregulation of HER3 (ErbB3) expression and activity attenuates antitumor effect of PI3K inhibitors. Proc Natl Acad Sci USA.
Chan T, Hermeking H, Lengauer C, Kinzler K,Vogelstein B (1999). 14-3-3 [sigma] is required to prevent mitotic catastrophe after DNA damage. Nature, 401, 616-620.
Chandarlapaty S, Sawai A, Scaltriti M, et al. (2011). AKT inhibition relieves feedback suppression of receptor tyrosine kinase expression and activity. Cancer Cell, 19, 58-71.
Charpin C, Garcia S, Bonnier P, et al. (1998). bcl-2 automated and quantitative immunocytochemical assays in breast carcinomas: correlation with 10-year follow-up. J Clin Oncol, 16, 2025-2031.
119
Cheang M, Voduc D, Bajdik C, et al. (2008). Basal-like breast cancer defined by five biomarkers has superior prognostic value than triple-negative phenotype. Clin Cancer Res, 14, 1368-1376.
Chen R, Alvero A, Silasi D, Mor G (2007). Inflammation, cancer and chemoresistance: taking advantage of the toll-like receptor signaling pathway. Am J Reprod Immunol, 57, 93-107.
Cheney I, Neuteboom S, Vaillancourt M, Ramachandra M, Bookstein R (1999). Adenovirus-mediated Gene Transfer of MMAC1/PTEN to Glioblastoma Cells Inhibits S Phase Entry by the Recruitment of p27Kip1 into Cyclin E/CDK2 Complexes. Cancer Res, 59, 2318-2323.
Cho Y, Gorina S, Jeffrey P, Pavletich N (1994). Crystal structure of a p53 tumor suppressor-DNA complex: understanding tumorigenic mutations. Science, 265, 346-355.
Chong-Kopera H, Inoki K, Li Y, et al. (2006). TSC1 stabilizes TSC2 by inhibiting the interaction between TSC2 and the HERC1 ubiquitin ligase. J Biol Chem, 281, 8313-8316.
Christianson T, Doherty J, Lin Y, et al. (1998). NH2-terminally truncated HER-2/neu protein: relationship with shedding of the extracellular domain and with prognostic factors in breast cancer. Cancer Res, 58, 5123-5129.
Cicenas J, Urban P, Vuaroqueaux V, et al. (2005). Increased level of phosphorylated akt measured by chemiluminescence-linked immunosorbent assay is a predictor of poor prognosis in primary breast cancer overexpressing ErbB-2. Breast Cancer Res, 7, 394-401.
Cogswell P, Guttridge D, Funkhouser W, Baldwin AJ (2000). Selective activation of NF-kappa B subunits in human breast cancer: potential roles for NF-kappa B2/p52 and for Bcl-3. Oncogene, 24, 1123-1131.
Collister K, Albensi B (2005). Potential therapeutic targets in the NF-kappaB pathway for Alzheimer's disease. Drug News Perspect, 18, 623-629.
Coope H, Atkinson P, Huhse B, et al. (2002). CD40 regulates the processing of NF-kappaB2 p100 to p52. EMBO J, 5375-5385.
Cordon-Cardo C, Latres E, Drobnjak M, et al. (1994). Molecular abnormalities of mdm2 and p53 genes in adult soft tissue sarcomas. Cancer Res, 54, 794-799.
Coussens L, Werb Z (2002). Inflammation and cancer. Nature, 420, 860-867. Cross D, Alessi D, Cohen P, Andjelkovich M, Hemmings B (1995). Inhibition
of glycogen synthase kinase-3 by insulin mediated by protein kinase B. Nature, 378, 785-789.
Cuello M, Ettenberg SA, Clark AS, et al. (2001). Down-regulation of the erbB-2 receptor by trastuzumab (herceptin) enhances tumor necrosis factor-related apoptosis-inducing ligand-mediated apoptosis in breast and ovarian cancer cell lines that overexpress erbB-2. Cancer Res, 61, 4892-4900.
Cully M, You H, Levine A, Mak T (2006). Beyond PTEN mutations: the PI3K pathway as an integrator of multiple inputs during tumorigenesis. Nat Rev Cancer.
Currie R, Walker K, Gray A, et al. (1999). Role of phosphatidylinositol 3,4,5-trisphosphate in regulating the activity and localization of 3-phosphoinositide-dependent protein kinase-1. Biochem J, 337, 575-583.

120
Czerski L, Nuñez G (2004). Apoptosome formation and caspase activation: is it different in the heart? J Mol Cell Cardiol, 37, 643-652.
Dahlman-Wright K, Cavailles V, Fuqua S et al. (2006). International Union of Pharmacology. LXIV. Estrogen receptors. Pharmacolo Rev, 58, 773-781.
Danial N, Korsmeyer S (2004). Cell death: critical control points. Cell, 116, 205-19.
Datta S, Brunet A, Greenberg M (1999). Cellular survival: a play in three Akts. Genes, 13, 2905-2927.
Datta S, Katsov A, Hu L, et al. (2000). 14-3-3 proteins and survival kinases cooperate to inactivate BAD by BH3 domain phosphorylation. Mol Cell, 6, 41-51.
Davies M, Stemke-Hale K, Lin E, et al. (2009). Integrated Molecular and Clinical Analysis of AKT Activation in Metastatic Melanoma. Clin Cancer Res, 15, 7538-7546.
Davis N, Ghosh S, Simmons D, et al. (1991a). Rel-associated pp40: an inhibitor of the rel family of transcription factors. Science, 253, 1268-12671.
Davis S, Lu M, Lo S, et al. (1991b). Presence of an SH2 domain in the actin-binding protein tensin. Science, 252, 712-715.
Dawson S, Makretsov N, Blows F, et al. (2010). BCL2 in breast cancer: a favourable prognostic marker across molecular subtypes and independent of adjuvant therapy received. Br J Cancer, 103, 668-675.
De Roock W, Claes B, Bernasconi D, et al. (2010). Effects of KRAS, BRAF, NRAS, and PIK3CA mutations on the efficacy of cetuximab plus chemotherapy in chemotherapy-refractory metastatic colorectal cancer: a retrospective consortium analysis. Lancet Oncol, 11, 753-762.
Dejardin E, Bonizzi G, Bellahcène A, et al. (1995). Highly-expressed p100/p52 (NFKB2) sequesters other NF-kappa B-related proteins in the cytoplasm of human breast cancer cells. Oncogene, 11, 1835-1841.
Dejardin E, Droin N, Delhase M, et al. (2002). The lymphotoxin-beta receptor induces different patterns of gene expression via two NF-kappaB pathways. Immunity, 525-535.
deGraffenried L, Chandrasekar B, Friedrichs W, et al. (2004). NF-kappa B inhibition markedly enhances sensitivity of resistant breast cancer tumor cells to tamoxifen. Ann Oncol, 15,885-890.
Depowski P, Rosenthal S, Ross J (2001). Loss of expression of the PTEN gene protein product is associated with poor outcome in breast cancer. Mod Pathol, 14, 672-6.
Deppert W, Göhler T, Koga H ,Kim E (2000). Mutant p53: "gain of function" through perturbation of nuclear structure and function? J Cell Biochem Suppl, Suppl 35, 115-122.
Dhand R, Hiles I, Panayotou G, et al. (1994). Pi 3-kinase is a dual specificity enzyme: autoregulation by an intrinsic protein-serine kinase activity. The EMBO Journal, 13.
Diehl J, Cheng M, Roussel M, Sherr C (1998). Glycogen synthase kinase-3beta regulates cyclin D1 proteolysis and subcellular localization. Genes Dev, 12, 3499-3511.
121
Diermeier S, Horváth G, Knuechel-Clarke R, et al. (2005). Epidermal growth factor receptor coexpression modulates susceptibility to Herceptin in HER2/neu overexpressing breast cancer cells via specific erbB-receptor interaction and activation. Exp Cell Res, 304, 604-619.
DiGiovanna M, Chu P, Davison T, et al. (2002). Active signaling by HER-2/neu in a subpopulation of HER-2/neu-overexpressing ductal carcinoma in situ: clinicopathological correlates. Cancer Res, 62, 6667-6673.
Dimmeler S, Fleming I, Fisslthaler B, et al. (1999). Activation of nitric oxide synthase in endothelial cells by Akt-dependent phosphorylation. Nature, 399, 601-605.
Dobbelstein M, Wienzek S, König C , Roth J (1999). Inactivation of the p53-homologue p73 by the mdm2-oncoprotein. Oncogene, 18, 2101-2106.
Dornan D, Shimizu H, Perkins N, Hupp, T (2003). DNA-dependent acetylation of p53 by the transcription coactivator p300. J Biol Chem, 278, 13431-13441.
Dowsett M (2001). Overexpression of HER-2 as a resistance mechanism to hormonal therapy for breast cancer. Endocrine-Related Cancer, 8, 191-195.
Druker B, Ling L, Cohen B, Roberts T, Schaffhausen B (1990). A Completely Transformation-Defective Point Mutant of Polyomavirus Middle T Antigen Which Retains Full Associated Phosphatidylinositol Kinase Activity. JOURNAL OF VIROLOGY, 64, 4454-4461.
Dyson N (1998). The regulation of E2F by pRB-family proteins. Genes Dev, 12, 2245-2262.
Efeyan A, Garcia-Cao I, Herranz D, Velasco-Miguel S, Serrano M (2006). Tumour biology: Policing of oncogene activity by p53. Nature, 443, 159.
el-Deiry W (1998). Regulation of p53 downstream genes. Semin Cancer Biol, 8, 345-357.
Ellis M, Coop A, Singh B, et al. (2001). Letrozole is more effective neoadjuvant endocrine therapy than tamoxifen for ErbB-1- and/or ErbB-2-positive, estrogen receptor-positive primary breast cancer: evidence from a phase III randomized trial. J Clin Oncol, 19, 3808-3816.
Elstrom R, Bauer D, Buzzai M, et al. (2004). Akt stimulates aerobic glycolysis in cancer cells. Cancer Res, 64, 3892-3899.
Ernst M, Dunn L, Rice N (1995). The PEST-like sequence of I kappa B alpha is responsible for inhibition of DNA binding but not for cytoplasmic retention of c-Rel or RelA homodimers. Mol Cell Biol, 15, 872-882.
Escárcega R, Fuentes-Alexandro S, García-Carrasco M, Gatica A, Zamora A (2007). The transcription factor nuclear factor-kappa B and cancer. Clin Oncol (R Coll Radiol), 19, 154-161.
Esteva F, Guo H, Zhang S, et al. (2010). PTEN, PIK3CA, p-AKT, and p-p70S6K status: association with trastuzumab response and survival in patients with HER2-positive metastatic breast cancer. Am J Pathol, 177, 1647-1656.
Eugene S, Hay K, Hay N (1999). The regulation and activities of the multifunctional serine/threonine kinase Akt/PKB. Exp. Cell Res, 253, 210-229.

122
Fabi A, Metro G, Di Benedetto A, et al. (2010). Clinical significance of PTEN and p-Akt co-expression in HER2-positive metastatic breast cancer patients treated with trastuzumab-based therapies. Oncology, 78, 141-149.
Fang S, Jensen J, Ludwig R, Vousden K, Weissman A (2000). Mdm2 is a RING finger-dependent ubiquitin protein ligase for itself and p53. J Biol Chem, 275, 8945-8951.
Feng Z, Hu W, Teresky A, et al. (2007). Declining p53 function in the aging process: a possible mechanism for the increased tumor incidence in older populations. Proc Natl Acad Sci USA, 104, 16633-16638.
Fesik S, Shi Y (2001). Controlling the caspases. Science, 294, 1477. Finn R, Gagnon R, Di Leo A, et al. (2009). Prognostic and predictive value of
HER2 extracellular domain in metastatic breast cancer treated with lapatinib and paclitaxel in a randomized phase III study. J Clin Oncol, 27, 5552-5558.
Fohlin H, Pérez-Tenorio G, Fornander T, et al. (2013). Akt2 expression is associated with good long-term prognosis in oestrogen receptor positive breast cancer. Eur J Cancer, 49.
Fornaro M, Plescia J, Chheang S, et al. (2003). Fibronectin protects prostate cancer cells from tumor necrosis factor-alpha-induced apoptosis via the AKT/survivin pathway. J Biol Chem, 12, 50402-50411.
Francoz S, Froment P, Bogaerts S, et al. (2006). Mdm4 and Mdm2 cooperate to inhibit p53 activity in proliferating and quiescent cells in vivo. Proc Natl Acad Sci U S A, 103, 3232-3237.
Franke T, Yang S, Chan T, et al. (1995). The protein kinase encoded by the Akt proto-oncogene is a target of the PDGF-activated phosphatidylinositol 3-kinase. Cell, 81, 727-736.
Freedman D, Wu L, Levine A (1999). Functions of phosphoinositide kinases. Annu Rev Biochem, 67, 481-507.
Fuchs S, Adler V, Buschmann T, et al. (1998). JNK targets p53 ubiquitination and degradation in nonstressed cells. Genes Dev, 12, 2658-2663.
Fujio Y, Walsh K (1999). Akt mediates cytoprotection of endothelial cells by vascular endothelial growth factor in an anchorage-dependent manner. J Biol Chem, 274, 16349-16354.
Funes M, Miller J, Lai C, Carraway KI, Sweeney C (2006). The mucin Muc4 potentiates neuregulin signaling by increasing the cell-surface populations of ErbB2 and ErbB3. J Biol Chem 281, 19310-19319.
Fussenegger M, Bailey J, Varner J (2000). A mathematical model of caspase function in apoptosis. Nat Biotechnol, 19, 768-774.
Ganguli G, Wasylyk B (2003). p53-independent functions of MDM2. Mol Cancer Res, 1, 1027-35.
Gao X, Pan D (2001). TSC1 and TSC2 tumor suppressors antagonise insulin signalling in cell growth. Genes Dev, 15, 1383-1392.
Garrett T, McKern N, Lou M, et al. (2003). The crystal structure of a truncated ErbB2 ectodomain reveals an active conformation, poised to interact with other ErbB receptors. Mol Cell, 11, 495-505.
Gates R, King LJ, Hanks S, Nanney L (1994). Potential role for focal adhesion kinase in migrating and proliferating keratinocytes near epidermal wounds and in culture. Cell Growth Differ, 8, 891-899.

123
Geisler S, Lønning P, Aas T, et al. (2001). Influence of TP53 gene alterations and c-erbB-2 expression on the response to treatment with doxorubicin in locally advanced breast cancer. Cancer Res, 61,2505-2512.
Ghosh B, Bose I (2005). Gene copy number and cell cycle arrest. Phys Biol, 3, 29-36.
Ghosh S, Gifford A, Riviere L, et al. (1990). Cloning of the p50 DNA binding subunit of NF-kappa B: homology to rel and dorsal. Cell, 62, 1019-1029.
Gilmore, T (1999). The Rel/NF-kB signal transduction pathway: introduction. Oncogene, 18, 6842-6844.
Gilmore T (2006). Introduction to NF-kB: players, pathways, perspectives. Oncogene, 25, 6680-6684.
Goga A, Liu X, Hambuch T, et al. (1995). p53 dependent growth suppression by the c-Abl nuclear tyrosine kinase. Oncogene, 11, 791-799.
Green D, Kroemer G (2004). The pathophysiology of mitochondrial cell death. Science, 305, 626-629.
Grilli M, Chiu J, Lenardo M (1993). NF-kB and rel-participants in a multiform transcriptional regulatory system. Int Rev Cytol, 143, 1-62.
Grossman S, Deato M, Brignone C, et al. (2003). Polyubiquitination of p53 by a ubiquitin ligase activity of p300. Science, 300, 342-344.
Gu J, Tamura M, Pankov R, et al. (1999). Shc and FAK differentially regulate cell motility and directionality modulated by PTEN. J Cell Biol, 146, 389-403.
Gu J, Tamura M, Yamada K (1998). Tumour seppressor PTEN inhibits integrin- and growth factor-mediated mitogen-activated protein (MAP) kinase signalling pathways. J Cell Biol, 143, 1375-1383.
Hammerman P, Fox C, Thompson C (2004). Beginnings of a signal-transduction pathway for bioenergetic control of cell survival. Trends Biochem Sci, 29, 586-592.
Harris C (1996). Structure and function of the p53 tumor suppressor gene: clues for rational cancer therapeutic strategies. J Natl Cancer Inst, 88, 1442-1455.
Harris S, Levine A (2005). The p53 pathway: positive and negative feedback loops. Oncogene, 24, 2899-2908.
Haskill S, Beg A, Tompkins S, et al. (1991). Characterization of an immediate-early gene induced in adherent monocytes that encodes I kappa B-like activity. Cell, 65, 1281-1289.
Hattrup C, Gendler S (2008). Structure and function of the cell surface (tethered) mucins. Annu Rev Physiol, 70, 431-457.
Haupt Y, Maya R, Kazaz A, Oren M (1997). Mdm2 promotes the rapid degradation of p53. Nature, 387, 296-299.
Hayden M, Ghosh S (2004). Signaling to NF-kappaB. Genes Dev, 18, 2195-2122.
Hengartner M (2000). The biochemistry of apoptosis. Nature (London), 407, 770-776.
Henkel T, Zabel U, van Zee K, et al. (1992). Intramolecular masking of the nuclear location signal and dimerization domain in the precursor for the p50 NF-kappa B subunit. Cell, 68, 1121-1133.

124
Hennessy B, Smith D, Ram P, Lu Y, Mills G (2005). Exploiting the PI3K/AKT pathway for cancer drug discovery. Nature reviews drug discovery, 4, 988-1004.
Hermeking H, Eick D (1994). Mediation of c-Myc-induced apoptosis by p53. Science, 265, 2091-2093.
Hirao A, Kong Y, Matsuoka S, et al. (2000). DNA damage-induced activation of p53 by the checkpoint kinase Chk2. Science, 287, 1824-1827.
Hoff E, Tubbs R, Myles J, Procop G (2002). HER2/neu amplification in breast cancer: stratification by tumor type and grade. Am J Clin Pathol, 117, 916-921.
Hollstein M, Sidransky D, Vogelstein B, Harris C (1991). p53 mutations in human cancers. Science, 253, 49-53.
Honda R, Yasuda H (2000). Activity of MDM2, a ubiquitin ligase, toward p53 or itself is dependent on the RING finger domain of the ligase. Oncogene, 19, 1473-1476.
Hori M, Shimazaki J, Inagawa S, Itabashi M, Hori M (2002). Overexpression of MDM2 oncoprotein correlates with possession of estrogen receptor alpha and lack of MDM2 mRNA splice variants in human breast cancer. Breast Cancer Res Treat, 71, 77-83.
Houldsworth J, Mathew S, Rao P, et al. (1996). REL proto-oncogene is frequently amplified in extranodal diffuse large cell lymphoma. Blood, 87, 25-29.
Htun H, Holt L, Walker D, Davie J, Hager G (1999). Direct visualization of the human estrogen receptor alpha reveals a role for ligand in the nuclear distribution of the receptor. Mol Cell Biol, 10, 471-486.
Huang Y, Lijima M, Parent C, et al. (2003). Receptor-mediated regulation of PI3Ks confines PI(3,4,5)P3 to the leading edge of chemotaxing cells. Mol Biol Cell, 14, 1913-1922.
Huang Z (2000). Bcl-2 family proteins as targets for anticancer drug design. Oncogene, 19, 6627-6631.
Hupp T, Meek D, Midgley C, Lane D (1992). Regulation of the specific DNA binding function of p53. Cell, 71, 875-886.
Hutchinson J, Jin J, Cardiff R, Woodgett J, Muller W (2004). Activation of Akt-1 (PKB-alpha) can accelerate ErbB-2-mediated mammary tumorigenesis but suppresses tumor invasion. Cancer Res, 64, 3171-3178.
Immervoll H, Hoem D, Kugarajh K, Steine S, Molven A (2006). Molecular analysis of the EGFR-RAS-RAF pathway in pancreatic ductal adenocarcinomas: lack of mutations in the BRAF and EGFR genes. Virchows Arch, Apr. 6.
Inoki K, Zhu T, Guan K (2003). TSC2 mediates cellular energy response to control cell growth and survival. Cell, 115, 577-590.
Irie H, Pearline R, Grueneberg D, et al. (2005). Distinct roles of Akt1 and Akt2 in regulating cell migration and epithelial-mesenchymal transition. J Cell Biol, 171, 1023-1034.
Järvinen T, Tanner M, Bärlund M, Borg A, Isola J (1999). Characterization of topoisomerase II alpha gene amplification and deletion in breast cancer. Genes Chromosomes Cancer, 26, 142-150.

125
Javelaue D, Besancon F (2002). Inactivation of p21 sensitizes cell to apoptosis via an increase of both p14 and p53 levels and an alteration of the BAX/Bcl-2 ratio. J Biol Chem, 277, 37949-37954.
Jemal A, Murray T, Ward E (2005). Cancer statisitics. CA Cancer J Clin, 55, 10-30.
Jensen J, Knoop A, Laenkholm A, et al. (2011). PIK3CA mutations, PTEN, and pHER2 expression and impact on outcome in HER2-positive early-stage breast cancer patients treated with adjuvant chemotherapy and trastuzumab. Ann Oncol, 15.
Jiang M, Shao Z, Wu J, et al. (1997). p21/waf1/cip1 and mdm-2 expression in breast carcinoma patients as related to prognosis. Int J Cancer, 74, 529-534.
Johnston S (2006). Targeting downstream effectors of epidermal growth factor receptor/HER2 in breast cancer with either farnesyltransferase inhibitors or mTOR antagonists. Int J Gynecol Cancer, 16, 543-548.
Jones S, Hancock A, Vogel H, Donehower L, Bradley A (1998 ). Overexpression of Mdm2 in mice reveals a p53-independent role for Mdm2 in tumorigenesis. Proc Natl Acad Sci U S A, 95, 15608-15612.
Kamijo T, Weber J, Zambetti G, et al. (1998). Functional and physical interactions of the ARF tumor suppressor with p53 and Mdm2. Proc Natl Acad Sci U S A, 95.
Kang S, Bader A, Vogt P (2005). Phosphatidylinositol 3-kinase mutations identified in human cancer are oncogenic. Proc Natl Acad Sci U S A, 102, 802-807.
Kannan N, Haste N, Taylor S, Neuwald A (2007). The hallmark of AGC kinase functional divergence is its C-terminal tail, a cis-acting regulatory module. Proc Natl Acad Sci U S A, 4,1272-1277
Karakas B, Bachman K, Park B (2006). Mutation of the PIK3CA oncogene in human cancers. British Journal of Cancer, 94, 455-459.
Kastan M, Onyekwere O, Sidransky D, Vogelstein B, Craig R (1991). Participation of p53 protein in the cellular response to DNA damage. Cancer Res, 51, 6304-6311.
Kato TJ, Delhase M, Hoffmann A, Karin M (2003). CK2 Is a C-Terminal IkappaB Kinase Responsible for NF-kappaB Activation during the UV Response. Mol Cell, 12, 829-839.
Kaufmann W (1995). Cell cycle checkpoints and DNA repair preserve the stability of the human genome. Cancer Metastasis Rev, 14, 31-41.
Kayagaki N, Yan M, Seshasayee D, et al. (2002). BAFF/BLyS receptor 3 binds the B cell survival factor BAFF ligand through a discrete surface loop and promotes processing of NF-kappaB2. Immunity, 515-524.
Kelekar A, Thompson C (1998). Bcl-2-family proteins: the role of the BH3 domain in apoptosis. Trends Cell Biol, 8, 324-330.
Khwaja A, Rodriquez-Viciana P, Wennstrom S, Warne P, Downward J (1997). Matrix adhesion and Ras transformation both activate a phosphoinositide 3-OH kinase and protein kinase B/Akt cellular survival pathway. The EMBO Journal, 16, 2783-2793.
Kieran M, Blank V, Logeat F, et al. (1990). The DNA binding subunit of NF-kappa B is identical to factor KBF1 and homologous to the rel oncogene product. Cell, 62, 1007-1018.

126
Kim R, Tanabe K, Uchida Y, et al. ( 2002). Current status of the molecular mechanisms of anticancer drug-induced apoptosis. The contribution of molecular-level analysis to cancer chemotherapy. Cancer Chemother Pharmacol, 50, 343-352.
Klapper L, Kirschbaum M, Sela M, Yarden Y (2000). Biochemical and clinical implications of the ErbB/HER signaling network of growth factor receptors. Adv Cancer Res, 77, 25-79.
Kluck R, Bossy-Wetzel E, Green D, Newmeyer D (1997). The release of cytochrome c from mitochondria: a primary site for Bcl-2 regulation of apoptosis. Science, 275, 1132-1136.
Komatsu M, Carraway C, Freigien N, Carraway K (1997). Reversible disruption of cell-matrix and cell-cell interactions by overexpression of sialomucin complex. J Biol Chem, 272, 33245-33254.
Konecny G, Pauletti G, Pegram M, et al. (2003). Quantitative association between HER-2/neu and steroid hormone receptors in hormone receptor-positive primary breast cancer. J Natl Cancer Inst, 95, 142-153.
Köstler W, Brodowicz T, Hudelist G, et al. (2005). The efficacy of trastuzumab in Her-2/neu-overexpressing metastatic breast cancer is independent of p53 status. J Cancer Res Clin Oncol, 131, 420-428.
Kozloski G, Carraway C,Carraway K (2010). Mechanistic and signaling analysis of Muc4-ErbB2 signaling module: New insights into the mechanism of ligand-independent ErbB2 activity. Journal of Cellular Physiology, 224, 649-657.
Krainer M, Brodowicz T, Zeillinger R, et al. (1997). Tissue expression and serum levels of HER-2/neu in patients with breast cancer. Oncology, 54, 475-481.
Krajewski S, Blomqvist C, Franssila K, et al. (1995). Reduced expression of proapoptotic gene BAX is associated with poor response rates to combination chemotherapy and shorter survival in women with metastatic breast adenocarcinoma. Cancer Res, 55, 4471-4478.
Kubbutat M, Jones S, Vousden K (1997). Regulation of p53 stability by Mdm2. Nature, 387, 299-303.
Kuerbitz S, Plunkett B, Walsh W, Kastan M (1992). Wild-type p53 is a cell cycle checkpoint determinant following irradiation. Proc Natl Acad Sci U S A, 89, 7491-7495.
Kuhnen C, Winter B (2006). EGFR-expression in pulmonary neuroendocrine cell hyperplasia. Pathologe, 27, 147-151.
Kunisue H, Kurebayashi J, Otsuki T, et al. (2000). Anti-HER2 antibody enhances the growth inhibitory effect of anti-oestrogen on breast cancer cells expressing both oestrogen receptors and HER2. Br J Cancer, 82, 46-51.
Landers J, Cassel S, George D (1997). Translational enhancement of mdm2 oncogene expression in human tumor cells containing a stabilized wild-type p53 protein. Cancer Res, 57, 3562-3568.
Lane D (1994). On the expression of the p53 protein in human cancer. Mol Biol Rep, 19, 23-29.
Lane H, Beuvink I, Motoyama A, et al. (2000). ErbB2 potentiates breast tumor proliferation through modulation of p27(Kip1)-Cdk2 complex

127
formation: receptor overexpression does not determine growth dependency. Mol Cell Biol, 9, 3210-3223.
Lane H, Motoyama A, Beuvink I, Hynes N (2001). Modulation of p27/Cdk2 complex formation through 4D5-mediated inhibition of HER2 receptor signaling. Ann Oncol, 12, S21-22.
Lee H, Koo J, Jung W (1997). Correlations of bcl-2 expression with clinicopathological features in breast cancer. Yonsei Med J, 38, 206-211.
Lee J, Yang H, Georgescu M, et al. (1999). Crystal structure of the PTEN tumor suppressor: implications for its phosphoinositide phosphatase activity and membrane association. Cell, 99, 232-334.
Lee S, Elenbaas B, Levine A, Griffith J (1995). p53 and its 14 kDa C-terminal domain recognize primary DNA damage in the form of insertion/deletion mismatches. Cell, 81, 1013-1020.
Leitzel K, Teramoto Y, Konrad K, et al. (1995). Elevated serum c-erbB-2 antigen levels and decreased response to hormone therapy of breast cancer. J Clin Oncol, 13, 1129-1135.
Leitzel K, Teramoto Y, Sampson E, et al. (1992). Elevated soluble c-erbB-2 antigen levels in the serum and effusions of a proportion of breast cancer patients. J Clin Oncol, 10, 1436-1443.
Leng P, Brown D, Shivakumar C, Deb S, Deb S (1995). N-terminal 130 amino acids of MDM2 are sufficient to inhibit p53-mediated transcriptional activation. Oncogene, 10, 1275-1282.
Lester C, Bose S, Chen Y, et al. (2012) <http://www.cap.org/apps/docs/committees/cancer/cancer_protocols/2012/BreastInvasive_12protocol_3100.pdf>
Levin E (2005). Integration of the extranuclear and nuclear actions of estrogen. Mol Endocrinol, 19, 1951-1959.
Levine A (1997). p53, the cellular gatekeeper for growth and division. Cell, 88, 323-331.
Li J, Yen C, Liaw D, et al. (1997). PTEN, a putative protein tyrosine phosphatase gene mutated in human brain, breast, and prostate cancer. Science, 275, 1943-1947.
Li L, Ljungman M, Dixon J (2000). The human Cdc14 phosphatases interact with and dephosphorylate the tumor suppressor protein p53. J Biol Chem, 275, 2410-2414.
Li M, Brooks C, Kon N, Gu W (2004a). A dynamic role of HAUSP in the p53-Mdm2 pathway. Mol Cell, 13, 879-886.
Li Q, Withoff S, Verma I (2005). Inflammation-associated cancer: NF-kappaB is the lynchpin. Trends Immunol, 26, 318-325.
Li X, Huang J, Yi P, et al. (2004b). Single-chain estrogen receptors (ERs) reveal that the ERalpha/beta heterodimer emulates functions of the ERalpha dimer in genomic estrogen signaling. Mol Cell Biol, 24, 7681-7694.
Liang J, Zubovitz J, Petrocelli T, et al. (2002). PKB/Akt phosphorylates p27, impairs nuclear import of p27 and opposes p27-mediated G1 arrest. Nat Med, 8, 1153-1156.
Lindström M, Jin A, Deisenroth C, White Wolf G, Zhang Y ( 2007). Cancer-associated mutations in the MDM2 zinc finger domain disrupt

128
ribosomal protein interaction and attenuate MDM2-induced p53 degradation. Mol Cell Biol, 27, 1056-1068.
Ling L, Druker B, Cantley L,Roberts T (1992). Transformation-Defective Mutants of Polyomavirus Middle T Antigen Associate with Phosphatidylinositol 3-Kinase (PI 3-Kinase) but Are Unable To Maintain Wild-Type Levels of PI 3-Kinase Products in Intact Cells. Journal of Virology, 66, 1702-1708.
Lipton A, Ali S, Leitzel K, et al. (2002). Elevated HER-2/neu level predicts decreased response to hormone therapy in metastatic breast cancer. J Clin Oncol 20, 1467-1472.
Liu C, Yang W, Li J, Sun S, Shou C (2007). [Effect of trastuzumab on tumor cell lines shedding high or low level of HER-2 ECD] [Article in Chinese]. Zhonghua Zhong Liu Za Zhi, 29, 101-105.
Liu X, Kim C, Yang J, Jemmerson R, Wang X (1996a). Induction of apoptotic program in cell-free extracts: requirement for dATP and cytochrome c. Cell, 86, 147-57.
Liu Z, Baskaran R, Lea-Chou E, et al. (1996b). Three distinct signalling responses by murine fibroblasts to genotoxic stress. Nature, 384, 273-276.
Lohrisch C, Piccart M (2001). HER2/neu as a predictive factor in breast cancer. Clin Breast Cancer, 2, 129-135.
Lowe S, Bodis S, McClatchey A, et al. (1994). p53 status and the efficacy of cancer therapy in vivo. Science, 266, 807-810.
Lundgren K, Montes de Oca Luna R, McNeill Y, et al. (1997). Targeted expression of MDM2 uncouples S phase from mitosis and inhibits mammary gland development independent of p53. Genes Dev, 11, 714-725.
Ma L, Wagner J, Rice J, et al. (2005). A plausable model for the digital response of p53 to DNA damage. J Cell Sci, 106, 1153-1168.
Maehama T, Dixon J (1998). The tumor suppressor, PTEN/MMAC1, dephosphorylates the lipid second messenger, phosphatidylinositol 3,4,5-trisphosphate. J Biol Chem, 29, 13375-13378.
Maltzman W, Czyzyk L (1984). UV irradiation stimulates levels of p53 cellular tumor antigen in nontransformed mouse cells. Mol Cell Biol, 4, 1689-1694.
Manning B, Tee A, Logsdon M, Blenis J, Cantley L (2002). Identification of the tuberous sclerosis complex-2 tumor suppressor gene product tuberin as a target of the phosphoinositide 3-kinase/Akt pathway. Mol Cell, 10, 151-162.
Marchetti A, Buttitta F, Girlando S, et al. (1995). mdm2 gene alterations and mdm2 protein expression in breast carcinomas. J Pathol, 175, 31-38.
Marechal V, Elenbaas B, Piette J, Nicolas J ,Levine A (1994). The ribosomal L5 protein is associated with mdm-2 and mdm-2-p53 complexes. Mol Cell Biol, 14, 7414-7420.
Marshall C (1994). MAP kinase kinase kinase, MAP kinase kinase and MAP kinase. Curr Opin Genet Dev, 4, 82-89.
Matsushime H, Ewen M, Strom D, et al. (1992). Identification and properties of an atypical catalytic subunit (p34PSK-J3/cdk4) for mammalian D type G1 cyclins. Cell, 71, 323-334.

129
Mattson M, Camandola S (2001). NF-kappaB in neuronal plasticity and neurodegenerative disorders. J Clin Invest, 107, 247-254.
Maurer U, Charvet C, Wagman A, Dejardin E, Green D (2006). Glycogen synthase kinase-3 regulates mitochondrial outer membrane permeabilization and apoptosis by destabilization of MCL-1. Mol Cell 21, 749-760.
Maya R, Balass M, Kim S, et al. (2001). ATM-dependent phosphorylation of Mdm2 on serine 395: role in p53 activation by DNA damage. Genes Dev, 15, 1067-1077.
Mayo L, Dixon J, Durden D, Tonks N, Doner D (2002a). PTEN protects p53 from Mdm2 and sensitizes cancer cells to chemotherapy. J Biol Chem, 277, 5484-5489.
Mayo L, Donner D (2001). A phosphatidylinositol 3-kinase/Akt pathway promotes translocation of Mdm2 from the cytoplasm to the nucleus. Proc Natl Acad Sci U S A, 98, 11598-11603.
Mayo M, Madrid L, Westerheide S, et al. (2002b). PTEN blocks tumor necrosis factor-induced NF-kappa B-dependent transcription by inhibiting the transactivation potential of the p65 subunit. J Biol Chem, 277, 11116-11125.
McCann A, Kirley A, Carney D, et al. (1995). Amplification of the MDM2 gene in human breast cancer and its association with MDM2 and p53 protein status. Br J Cancer, 71, 981-985.
McKay B, Ljungman M, Rainbow A (1999). Potential roles for p53 in nucleotide excision repair. Carcinogenesis, 20, 1389-1396.
Medema R, Kops G, Bos J, Burgering B (2000). AFX-like Forkhead transcription factors mediate cell-cycle regulation by Ras and PKB through p27kip1. Nature, 404, 782-787.
Meden H, Marx D, Schauer A, Wuttke W, Kuhn W (1997). Prognostic significance of p105 (c-erbB-2 HER2/neu) serum levels in patients with ovarian cancer. Anticancer Res, 17, 757-760.
Meek D (1994). Post-translational modification of p53. Semin Cancer Biol, 5, 203-210.
Ménard S, Valagussa P, Pilotti S, et al. (2001). Response to cyclophosphamide, methotrexate, and fluorouracil in lymph node-positive breast cancer according to HER2 overexpression and other tumor biologic variables. J Clin Oncol, 19, 329-335.
Mendoza M, Blenis J (2007). PHLPPing It off: Phosphatases Get in the Akt. Molecular Cel, 25, 798-800.
Meng S, Chen Z, Munoz-Antonia T, Wu J (2005). Participation of both Gab1 and Gab2 in the activation of the ERK/MAPK pathway by epidermal growth factor. Biochem. J, 391 (Pt1), 143-151.
Merkhofer E, Cogswell P, Baldwin A (2010). Her2 activates NF-kappaB and induces invasion through the canonical pathway involving IKKalpha. Oncogene, 29, 1238-1248.
Mezzelani A, Alasio L, Bartoli C, Bonora M, et al. (1999). c-erbB2/neu gene and chromosome 17 analysis in breast cancer by FISH on archival cytological fine-needle aspirates British Journal of Cancer, 80, 519-525.
Micheau O, Tschopp J (2003). Induction of TNF receptor I-mediated apoptosis via two sequential signaling complexes. Cell, 114, 181-190.

130
Milburn C, Deak M, Kelly S, et al. (2003). Binding of phosphatidylinositol 3,4,5-trisphosphate to the pleckstrin homology domain of protein kinase B induces a conformational change. Biochem J, 375, 531-538.
Minamoto T, Buschmann T, Habelhah H, et al. (2001). Distinct pattern of p53 phosphorylation in human tumors. Oncogene, 20, 3341-3347.
Miyamoto S, Chiao P, Verma I (1994). Enhanced I kappa B alpha degradation is responsible for constitutive NF-kappa B activity in mature murine B-cell lines. Mol Cell Biol, 14, 3276-3282.
Miyashita T, Reed J (1995). Tumor suppressor p53 is a direct transcriptional activator of the human bax gene. Cell, 80, 293-299.
Moasser M, Basso A, Averbuch S, Rosen N (2001). The tyrosine kinase inhibitor ZD1839 ("Iressa") inhibits HER2-driven signaling and suppresses the growth of HER2-overexpressing tumor cells. Cancer Res, 61, 7184-7188.
Moggs J, Orphanides G (2001). Estrogen receptors: orchestrators of pleiotropic cellular responses. EMBO reports, 2, 775-781.
Molina M, Codony-Servat J, Albanell J, et al. (2001). Trastuzumab (herceptin), a humanized anti-Her2 receptor monoclonal antibody, inhibits basal and activated Her2 ectodomain cleavage in breast cancer cells. Cancer Res, 61, 4744-4749.
Molina R, Jo J, Zanón G, et al. (1996). Utility of C-erbB-2 in tissue and in serum in the early diagnosis of recurrence in breast cancer patients: comparison with carcinoembryonic antigen and CA 15.3. Br J Cancer, 74, 1126-1131.
Momand J, Jung D, Wilczynski S, Niland J (1998). The MDM2 gene amplification database. Nucleic Acids Res, 26, 3453-3459.
Moore J, Yang J, Truant R , Kornbluth S (1999). Nuclear import of Cdk/cyclin complexes: identification of distinct mechanisms for import of Cdk2/cyclin E and Cdc2/cyclin B1. J Cell Biol, 144, 213-224.
Myers M, Stolarof J, Eng C, et al. (1997). P-TEN, the tumor suppressor from human chromosome 10q23, is a dual-specificity phosphatase. Proc Natl Acad Sci USA, 94, 9052-9057.
Myers R, Brown D, Oelschlager D, et al. (1996). Elevated serum levels of pl05 (ErbB-2) in patients with advanced-stage prostatic adenocarcinoma. Int J Cancer, 69, 398-402.
Nagata Y, Lan K, Zhou X, et al. (2004). PTEN activation contributes to tumor inhibition by trastuzumab, and loss of PTEN predicts trastuzumab resistance in patients. Cancer Cell, 6, 117-127.
Nahta R, Esteva F (2006). HER2 therapy: molecular mechanisms of trastuzumab resistance. Breast Cancer Res, 8, 215.
Nahta R, Yuan L, Zhang B, Kobayashi R, Esteva F (2005). Insulin-like growth factor-I receptor/human epidermal growth factor receptor 2 heterodimerization contributes to trastuzumab resistance of breast cancer cells. Cancer Res, 65, 11118-11128.
Naumann M, Scheidereit C (1994). Activation of NF-kappa B in vivo is regulated by multiple phosphorylations. EMBO J, 13, 4597-4607.
Nilsson S, Makela S, Treuter E, et al. (2001). Mechanisms of estrogen action. Physiol Rev, 81, 1535-1565.
Noh K, Kang T, Kim J, et al. (2009). Activation of Akt as a mechanism for tumor immune evasion. Mol Ther, 17, 439-447.

131
Oda E, Ohki R, Murasawa H, et al. (2000). Noxa, a BH3-only member of the Bcl-2 family and candidate mediator of p53-induced apoptosis. Science, 288, 1053-1058.
Ogawara Y, Kishishita S, Obata T, et al. (2002). Akt enhances Mdm2-mediated ubiquitination and degradation of p53. J Biol Chem, 277, 21843-21850.
Ogura E, Senzaki H, Yamamoto D, et al. (1999 ). Prognostic significance of Bcl-2, Bcl-xL/S, Bax and Bak expressions in colorectal carcinomas. Oncol Rep, 6, 365-369.
Oliner J, Kinzler K, Meltzer P, George D, Vogelstein B (1992). Amplification of a gene encoding a p53-associated protein in human sarcomas. Nature, 358, 80-83.
Olivier M, Langerød A, Carrieri P, et al. (2006). The clinical value of somatic TP53 gene mutations in 1,794 patients with breast cancer. Clin Cancer Res, 1157-1167.
Onel K, Cordon-Cardo C (2004). MDM2 and prognosis. Mol Cancer Res, 2. Onitilo A, Engel J, Greenlee R, Mukesh B (2009 ). Breast cancer subtypes
based on ER/PR and Her2 expression: comparison of clinicopathologic features and survival. Clin Med Res, 7, 4-13.
Osborne C, Bardou V, Hopp T, et al. (2003). Role of the estrogen receptor coactivator A1B1 (SRC-3) and Her-2/neu in tamoxifen resistance in breast cancer. J Natl Cancer Inst, 95, 353-361.
Osborne K (1998). Tamoxifen in the treatment of breast cancer. N Engl J Med, 339, 1609-1618.
Ostrowski J, Sawan A, Henry L, et al. (1991). p53 expression in human breast cancer related to survival and prognostic factors: an immunohistochemical study. J Pathol, 164, 75-81.
Owen-Schaub L, Zhang W, Cusack J, et al. (1995). Wild-type human p53 and a temperature-sensitive mutant induce Fas/APO-1 expression. Mol Cell Biol, 15, 3032-3040.
Ozbek E, Aliskan T, Otunctemur A, et al. (2012). Comparison of tumor grade and stage with nuclear factor kappa b and p38 mitogene activated protein kinase expressions in renal cell cancer. Arch Ital Urol Androl, 84, 53-60.
Owens M, Horten M, da Silvaa M (2004). Her2 amplificaiton ratios by immunofluorescence in situ hybridization and correlation with immunohistochemistry in a cohort of 6556 breast cancer tissues. Clin Breast Cancer, 5, 63-69.
Palombella V, Rando O, Goldberg A, Maniatis T (1994). The ubiquitin-proteasome pathway is required for processing the NF-kappa B1 precursor protein and the activation of NF-kappa B. Cell, 78, 773-785.
Panigrahi A, Pinder S, Chan S, et al. (2004). The role of PTEN and its signalling pathways, including AKT, in breast cancer; an assessment of relationships with other prognostic factors and with outcome. J Pathol, 204, 93-100.
Park S, Kim S (2007). Aktivated Akt signaling pathway in invasive ductal carcinoma of the breast: Correlation with Her2 overexpression. Oncology reports, 18, 139-143.
Perez E, Dueck A, McCullough A, et al. (2013). Impact of PTEN protein expression on benefit from adjuvant trastuzumab in early-stage human

132
epidermal growth factor receptor 2-positive breast cancer in the North Central Cancer Treatment Group N9831 trial. J Clin Oncol, 31, 2115-2122.
Pérez-Tenorio G, Alkhori L, Olsson B, et al. (2007). PIK3CA mutations and PTEN loss correlate with similar prognostic factors and are not mutually exclusive in breast cancer. Clin Cancer Res, 13, 3577-3584.
Pérez-Tenorio G, Stål O (2002). Activation of AKT/PKB in breast cancer predicts a worse outcome among endocrine treated patients. Br J Cancer, 86, 540-545.
Perkins N (2007). Integrating cell-signalling pathways with NF-kB ind IKK function. Nat Rev Mol Cell Biol, 8, 49-62.
Petros A, Olejniczak E, Fesik S (2004). Structural biology of the Bcl-2 family of proteins. Biochim Biophys Acta, 1644, 83-94.
Peyrat J, Bonneterre J, Lubin R, et al. (1995). Prognostic significance of circulating P53 antibodies in patients undergoing surgery for locoregional breast cancer. Lancet, 345, 621-622.
Pinkas-Kramarski R, Shelly M, Guarino B, et al. (1998). ErbB tyrosine kinases and the two neuregulin families constitute a ligand-receptor network. Mol Cell Biol, 18, 6090-101.
Polsky D, Melzer K, Hazan C, et al. (2002). MDM2 protein overexpression and prognosis in primary malignant melanoma. J Natl Cancer Inst, 94, 1803-1806.
Polyak K, Xia Y, Zweier J, Kinzler K, Vogelstein B (1997). A model for p53-induced apoptosis. Nature, 389, 300-305.
Pomerantz J, Baltimore D (2002). Two pathways to NF-kappaB. Mol Cell, 10, 693-695.
Pomerantz J, Schreiber-Agus N, Liégeois N, et al. (1998). The Ink4a Tumor Suppressor Gene Product, p19Arf, Interacts with MDM2 and Neutralizes MDM2's Inhibition of p53. Cell, 92, 713-723.
Pommery N, Henichart J (2005). Involvement of PI3K/Akt pathway in prostate cancer - potential strategies for developing targeted therapies. Mini Rev Med Chem, 5, 1125-1132.
Ponnusamy M, Singh A, Jain M, et al. (2008). MUC4 activates HER2 signalling and enhances the motility of human ovarian cancer cells. Br J Cancer, 99, 520-526.
Porter P, Garcia R, Moe R, Corwin D, Gown A (1991). C-erbB-2 oncogene proteinin in situ and invasive lobular breast neoplasia. Cancer, 68, 331-334.
Price-Schiavi S, Jepson S, Li P, et al. (2002). Rat Muc4 (sialomucin complex) reduces binding of anti-ErbB2 antibodies to tumor cell surfaces, a potential mechanism for herceptin resistance. Int J Cancer, 99, 783-791.
Pusztai L (2008). Current Status of Prognostic Profiling in Breast Cancer. The Oncologist, 13, 350-360.
Raftopoulou M, Etienne-Manneville, S, Sel, fA, Nicholls, S,Hall, A (2004). Regulation of cell migration by the C2 domain of the tumor suppressor PTEN. Science, 303, 1179-1181.
Rasheed B, Stenzel, T, McLendon, R et al. (1997). PTEN gene mutations are seen in high-grade but not in low-grade gliomas. Cancer Res, 19, 4187-4190.

133
Rayet B, Gélinas C (1999). Aberrant rel/nfkb genes and activity in human cancer. Oncogene, 18, 6938-6947.
Razandi M, Pedram A, Park S, Levin E (2003). Proximal Events in Signaling by Plasma Membrane Estrogen Receptors. The journal of Biological Chemistry, 278, 2701-2712.
Renatus M, Stennicke H, Scott F, Liddington R, Salvesen G ( 2001). Dimer formation drives the activation of the cell death protease caspase 9. Proc Natl Acad Sci U S A, 98, 14250-14255.
Rice N, MacKichan M, Israël A (1992). The precursor of NF-kappa B p50 has I kappa B-like functions. Cell, 71, 243-253.
Richard J, Sainsbury C, Farndon J, et al. (1987). Epidermal-growth-factor receptor status as predictor of early recurrence of and death from breast cancer. Lancet, 1, 1398-1402.
Riuz S, Santos E, Bustelo X (2007). RasGRF2, a Guanosine Nucleotide Exchange Factor for Ras GTPases, Participates in T-Cell Signaling Responses. Molecular and Cellular Biology, 27, 8127-8124.
Rodriquez-Viciana P, Warne P, Dhand R, et al. (1994). Phosphatidylinositol-3-OH kinase direct target of Ras. Nature, 370, 527-532.
Rodriquez-Viciana P, Warne P, Khwaja A et al. (1997). Role of phosphoinositide 3-OH kinase in cell transformation and control of the actin cytoskeleton by Ras. Cell Press, 89, 457-467.
Rodriquez-Viciana P, Warne P, Vanhaesebroeck B, Waterfield M, Downward J (1996). Activation of phosphoinositide 3-kinase by interaction with Ras and by point mutation. The EMBO Journal, 15, 2442-2451.
Romond E, Perez E, Bryant J, et al. (2005). Trastuzumab plus adjuvant chemotherapy for operable HER2-positive breast cancer. N Engl J Med, 353, 1673-1684.
Ron D (2002). Translational control in the endoplasmic reticulum stress response. J Clin Invest, 110,1383-1388.
Ross J, Fletcher J, Linette G (2003). The Her-2/neu gene and protein in breast cancer 2003: biomarker and target of therapy. The Oncologist, 8, 307-325.
Rubin I, Yarden Y (2001). The basic biology of HER2. Annals of Oncology, 12, S3-S8.
Ryan J, Danish R, Gottlieb C, Clarke M (1993). Cell cycle analysis of p53-induced cell death in murine erythroleukemia cells. Mol Cell Biol, 13, 711-719.
Saal L, Holm K, Maurer M, et al. (2005). PIK3CA mutations correlate with hormone receptors, node metastasis, and ERBB2, and are mutually exclusive with PTEN loss in human breast carcinoma. Cancer Res, 65, 2554-2559.
Sarbassov D, Guertin D, Ali S, Sabatin D (2005). Phosphorylation and Regulation of Akt/PKB by the Rictor-mTOR Complex. Science, 307, 1098-1101
Scaltriti M, Rojo F, Ocaña A, et al. (2007). Expression of p95HER2, a truncated form of the HER2 receptor, and response to anti-HER2 therapies in breast cancer. J Natl Cancer Inst, 99, 628-638.
Schiff R, Masserweh S, Osborne K (2004). Cross-talk between estrogen receptor and growth factor pathways as a molecular target for overcoming endocrine resistance. Clin Cancer Res, 10, 331-336.
134
Schmitt F, Soares R, Cirnes L,Seruca R (1998). P53 in breast carcinomas: association between presence of mutation and immunohistochemical expression using a semiquantitative approach. Pathol Res Pract, 194, 815-819.
Schmitz K, Grabellus F, Callies R, et al. (2006). Relationship and prognostic significance of phospho-(serine 166)-murine double minute 2 and Akt activation in node-negative breast cancer with regard to p53 expression. Virchows Arch, 448, 16-23.
Sen R, Baltimore D (1986). Multiple nuclear factors interact with the immunoglobulin enhancer sequences. Cell, 46, 705-716.
Seo H, Choi H, Choi Y, et al. (2011). Phytoestrogens induce apoptosis via extrinsic pathway, inhibiting nuclear factor-kappaB signaling in HER2-overexpressing breast cancer cells. Anticancer Res, 31.
Serrano M, Hannon G, Beach D (1993). A new regulatory motif in cell cycle control causing specific inhibition of cyclin D/CDK4. Nature, 366, 704-707.
Serrano M, Lin A, McCurrach M, Beach D, Lowe S (1997). Oncogenic ras provokes premature cell senescence associated with accumulation of p53 and p16INK4a. Cell, 88, 593-602.
Shah A, Swain W, Richardson D, et al. (2005). Phospho-akt expression is associated with a favorable outcome in non-small cell lung cancer. Clin Cancer Res, 11, 2930-2936.
Shapochka D, Zaletok S, Gnidyuk M (2013). Expression of Molecular Markers in Tumours of Patients with Breast Cancer. J Cytol Histol 4, 1-6.
She Q, Solit D, Basso A, Moasser M (2003). Resistance to gefitinib in PTEN-null HER-overexpressing tumor cells can be overcome through restoration of PTEN function or pharmacologic modulation of constitutive phosphatidylinositol 3'-kinase/Akt pathway signaling. Clin Cancer Res, 9, 4340-4346.
Sheikh M, Huang Y (2003). Death receptor activation complexes: it takes two to activate TNF receptor 1. Cell Cycle, 2, 550-552.
Sheikh M, Shao Z, Hussain A, Fontana J (1993). The p53-binding protein MDM2 gene is differentially expressed in human breast carcinoma. Cancer Res, 53, 3226-3228.
Sheng X, Koul D, Liu J, Liu T, Yung W (2002). Promoter analysis of tumor suppresson gene PTEN: identification of minimum promoter region. Biochem Biophys Res Commun, 292, 422-436.
Sheng Z, Hull S, Carraway K (1990). Biosynthesis of the cell surface sialomucin complex of ascites 13762 rat mammary adenocarcinoma cells from a high molecular weight precursor. J Biol Chem 265, 8505-8510.
Shimizu S, Narita M, Tsujimoto Y (1999). Bcl-2 family proteins regulate the release of apoptogenic cytochrome c by the mitochondrial channel VDAC. Nature, 399, 483-487.
Shin I, Yakes F, Rojo F, et al. (2002). PKB/Akt mediates cell-cycle progression by phosphorylation of p27(Kip1) at threonine 157 and modulation of its cellular localization. Nat Med, 8, 1145-1152.

135
Shirangi T, Zaika A, Moll U (2002). Nuclear degradation of p53 occurs during down-regulation of the p53 response after DNA damage. FASEB J, 16, 420-422.
Shishodia S, Aggarwal B (2004). Nuclear factor-kappaB: a friend or a foe in cancer? Biochem Pharmacol, 68, 1071-1080.
Shou J, Massarweh S, Osborne C, et al. (2004). Mechanisms of Tamoxifen resistance: increased estrogen receptor-Her-2/neu cross-talk in ER/Her-2 positive breast cancer. J Natl Cancer Inst, 96, 926-935.
Shu H, Kim M, Chen P, et al. (1988). The intrinsic radioresistance of glioblastoma-derived cell lines is associated with a failure of p53 to induce p21(BAX) expression. Proc Natl Acad Sci U S A 95, 14453-14458.
Sidransky D, Mikkelsen T, Schwechheimer K, et al. (1992). Clonal expansion of p53 mutant cells is associated with brain tumour progression. Nature, 355, 846-848.
Siebenlist U, Franzoso G, Brown K (1994). Structure, regulation and function of NF-kappa B. Annu Rev Cell Biol, 10, 405-55.
Silvestrini R, Veneroni S, Daidone MG, et al. (1994). The Bcl-2 protein: a prognostic indicator strongly related to p53 protein in lymph node-negative breast cancer patients. J Natl Cancer Inst, 86, 499-504.
Silvestrini R, Veneroni S, Daidone M, et al. (1994). The Bcl-2 protein: a prognostic indicator strongly related to p53 protein in lymph node-negative breast cancer patients. J Natl Cancer Inst, 86, 499-504.
Sionov R, Haupt Y (1999). The cellular response to p53: the decision between life and death. Oncogene, 18, 6145-6157.
Sirvent J, Fortuño-Mar A, Olona M , Orti A (2001). Prognostic value of p53 protein expression and clinicopathological factors in infiltrating ductal carcinoma of the breast. A study of 192 patients. Histol Histopathol, 16, 99-106.
Sirvent J, Salvadó M, Santafé M, et al. (1995). p53 in breast cancer. Its relation to histological grade, lymph-node status, hormone receptors, cell-proliferation fraction (ki-67) and c-erbB-2. Immunohistochemical study of 153 cases. Histol Histopathol, 10, 531-539.
Skeen J, Bhaskar P, Chen C, et al. (2006). Akt deficiency impairs normal cell proliferation and suppresses oncogenesis in a p53-independent and mTORC1-dependent manner. Cancer Cell, 10, 269-280.
Slamon D (2004). The Future or ErbB-1 and ErbB-2 Pathway Inhibition in Breast Cancer: Targeting Multiple Receptors. The Oncologist, 9 (suppl 3), 1-3.
Slamon D, Clark G, Wong S, et al. (1987). Human breast cancer: correlation of relapse and survival with amplification of the HER-2/neu oncogene. Science, 235, 177-182.
Slamon D, Godolphin W, Jones L, et al. (1989). Studies of the HER-2/neu proto-oncogene in human breast and ovarian cancer. Science, 244, 707-712.
Slamon D, Leyland-Jones B, Shak S (2001). Use of chemotherapy plus a monoclonal antibody against HER2 for metastatic breast cancer that overexpresses HER2. N Engl J Med, 344, 783-792.
136
Sliwkowski M, Lofgren J, Lewis G, et al. (1999). Nonclinical studies addressing the mechanism of action of trastuzumab (Herceptin). Seminars in Oncology, 26, 60-70.
Smith K, Wells A, Lauffenburger D (2006). Multiple signaling pathways mediate compaction of collagen by EGF-stimulated fibroblasts. Exp Cell Res, 312, 1970-1982.
Sofi G, Sofi J, Nadeem R, et al. (2012). Estrogen receptor and progesterone receptor status in breast cancer in relation to age, histological grade, size of lesion and lymph node involvement. Asian Pac J Cancer Prev, 13, 5047-5052.
Somasundaram K (2000). Tumor suppressor p53: regulation and function. Front Biosci, 5, D424-437.
Soós J, Engelhardt J, Siklós L, Havas L, Majtényi K (2004). The expression of PARP, NF-kappa B and parvalbumin is increased in Parkinson disease. Neuroreport, 15, 1715-1718.
Soussi T (2007). p53 alterations in human cancer: more questions than answers. Oncogene, 26, 2145-2156.
Sovak M, Bellas R, Kim D, et al. (1997). Aberrant nuclear factor-kappaB/Rel expression and the pathogenesis of breast cancer. J Clin Invest, 100, 2952-2960.
Stal O (1995). p53 expression and the result of adjuvant therapy of breast cancer. Acta Oncol, 34, 767-770.
Stambolic, V, MacPherson, D, Sas, D et al. (2001). Regulation of PTEN transcription by p53. Mol Cell, 8,317-325.
Stark A, Hugo H, Witzel P, Mihajlovic Z , Mehdorn H (2003). Age-related expression of p53, Mdm2, EGFR and Msh2 in glioblastoma multiforme. Zentralbl Neurochir, 64, 30-36.
Stark A, Hulka B, Joens S, et al. (2000). HER-2/neu amplification in benign breast disease and the risk of subsequent breast cancer. J Clin Oncol, 18, 267-274.
Stemke-Hale K, Gonzalez-Angulo A, Lluch A, et al. (2008). An integrative genomic and proteomic analysis of PIK3CA, PTEN, and AKT mutations in breast cancer. Cancer Res, 68, 6084-6091.
Stocker H, Andjelkovic M, Oldham S, et al. (2002). Living with lethal PIP3 levels: viability of flies lacking PTEN restored by a PH domain mutation in Akt/PKB. Science, 259, 2088-2091.
Stokoe D, Stephens L, Copeland T, et al. (1997). Dual role of phosphatidylinositol-3,4,5-trisphosphate in the activation of protein kinase B Science, 277, 567-570.
Stommel J, Wahl G (2004). Accelerated MDM2 auto-degradation induced by DNA-damage kinases is required for p53 activation. EMBO J.
Stott F, Bates S, James M, et al. (1998). The alternative product from the human CDKN2A locus, p14(ARF), participates in a regulatory feedback loop with p53 and MDM2. EMBO J, 17, 5001-5014.
Stoyanova S, Bulgarelli-Leva G, Kirsch C, et al. (1997). Lipid kinase and protein kinase activities of G-protein-coupled phosphoinositide 3-kinase c: structure–activity analysis and interactions with wortmannin. Biochem J, 324, 489-495.
Sun M, Wang G, Paciga J, et al. (2001). AKT1/PKBalpha kinase is frequently elevated in human cancers and its constitutive activation is required

137
for oncogenic transformation in NIH3T3 cells. Am J Pathol, 159, 431-437.
Suter T, Cook-Bruns N, Barton C (2004). Cardiotoxicity associated with trastuzumab (Herceptin) therapy in the treatment of metastatic breast cancer. Breast, 13, 173-183.
Tamura M, Gu J, Matsumoto K, et al. (1998). Inhibition of cell migration, spreading, and focal adhesions by tumour suppressor PTEN. Science, 280, 1614-1617.
Taniyama Y, Ushio-Fukai M, Hitomi H, et al. (2004). Role of p38 MAPK and MAPKAPK-2 in angiotensin II-induced Akt activation in vascular smooth muscle cells. Am J Physiol Cell Physiol, 287, 494-499.
Tannahill C, Obondo C, Al-Murri A, et al. (2009). The relationship between tumour NF-kB expression, hormone status, and clinicopathological factors in primary invasive breast cancer. Cancer Res, 69, 4038.
Tapon N, Ito N, Dickson B, Treisma J, Hariharan I (2001). The Drosophila tuberous sclerosis complex gene homologs restrict cell growth and cell proliferation. Cell, 105, 345-355.
Taylor, W,Stark, G (2001). Regulation of the G2/M transition by p53. Oncogene, 20,1803-1815.
Tergaonkar V, Bottero V, Ikawa M, Li Q, Verma I (2003). IkappaB kinase-independent IkappaBalpha degradation pathway: functional NF-kappaB activity and implications for cancer therapy. Mol Cell Biol, 23, 8070-8083.
Teyssier F, Bay J, Dionet C, Verrelle P (1999). Cell cycle regulation after exposure to ionizing radiation. Bull Cancer, 86, 345-357.
Thompson J, Phillips R, Erdjument-Bromage H, Tempst P, Ghosh S (1995). I kappa B-beta regulates the persistent response in a biphasic activation of NF-kappa B. Cell, 80, 573-582.
Thor A, Berry D, Budman D, et al. (1998). erbB-2, p53, and efficacy of adjuvant therapy in lymph node-positive breast cancer. Natl Cancer Inst, 90, 1346-1360.
Thor A, Liu S, Edgerton S, et al. (2000). Activation (tyrosine phosphorylation) of ErbB-2 (HER-2/neu): a study of incidence and correlation with outcome in breast cancer. J Clin Oncol, 18, 3230-3239.
Thor A, Moore DI, Edgerton S, et al. (1992). Accumulation of p53 tumor suppressor gene protein: an independent marker of prognosis in breast cancers. J Natl Cancer Inst, 84, 845-855.
Thornborrow E, Patel S, Mastropietro A, Schwartzfarb E, Manfredi J (2002). A conserved intronic response element mediates direct p53-dependent transcriptional activation of both the human and murine bax genes. Oncogene, 21, 990-999.
Treré D, Montanaro L, Ceccarelli C, et al. (2007). Prognostic relevance of a novel semiquantitative classification of Bcl2 immunohistochemical expression in human infiltrating ductal carcinomas of the breast. Ann Oncol, 18, 1004-1014.
Tsujimoto Y, Finger L, Yunis J, Nowell P, Croce C (1984). Cloning of the chromosome breakpoint of neoplastic B cells with the t(14;18) chromosome translocation. Science, 226, 1097-1099.

138
Turbin D, Cheang M, Bajdik C, et al. (2006). MDM2 protein expression is a negative prognostic marker in breast carcinoma. Mod Pathol, 19, 69-74.
van der Geer P, Hunter T, Lindberg R (1994). Receptor protein-tyrosine kinases and their signal transduction pathways. Annu Rev Cell Biol, 10, 251-337.
Vanhaesebroeck B, Welham M, Kotani K, et al. (1997). p110d, a novel phosphoinositide 3-kinase in leukocytes. Proc Natl Acad Sci, 94, 4330-4335.
Varna M, Bousquet G, Plassa L, Bertheau P, Janin A (2011). TP53 status and response to treatment in breast cancers. J Biomed Biotechnol, 2011, 1-9
Vassilev L, Vu B, Graves B, et al. (2004). In vivo activation of the p53 pathway by small-molecule antagonists of MDM2. Science, 303, 844-848.
Vestey S, Sen C, Calder C, et al. (2005). Activated Akt expression in breast cancer: correlation with p53, Hdm2 and patient outcome. Eur J Cancer, 41, 1017-1025.
Viglietto G, Motti M, Bruni P, et al. (2002). Cytoplasmic relocalization and inhibition of the cyclin-dependent kinase inhibitor p27(Kip1) by PKB/Akt-mediated phosphorylation in breast cancer. Nat Med, 8, 1136-1144.
Vyjayanti V, Rao K (2006). DNA double strand break repair in brain: reduced NHEJ activity in aging rat neurons. Neurosci Lett, 393, 18-22.
Vocaturo A, Novelli F, Benevolo M, et al. (2006). Chromogenic In Situ Hybridization to Detect HER-2/neu Gene Amplification in Histological and ThinPrepR-Processed Breast Cancer Fine-Needle Aspirates: A Sensitive and Practical Method in the Trastuzumab Era. The Oncologist, 11, 878-886.
Vogel C, Cobleigh M, Tripathy D, et al. (2002). Efficacy and safety of trastuzumab as a single agent in first-line treatment of HER2-overexpressing metastatic breast cancer. J Clin Oncol, 20,719-726.
Vousden, K ,Lane, D (2007). p53 in health and disease. Nat Rev Mol Cell Biol, 8, 275-283.
Vyssokikh M, Brdiczka D (2003). The function of complexes between the outer mitochondrial membrane pore (VDAC) and the adenine nucleotide translocase in regulation of energy metabolism and apoptosis. Acta Biochim Pol, 50, 389-404.
Walker K, Deak M, Paterson A, et al. (1998). Activation of protein kinase B beta and gamma isoforms by insulin in vivo and by 3-phosphoinositide-dependent protein kinase-1 in vitro: comparison with protein kinase B alpha. Biochem J, 331, 299-308.
Wang J, Ouyang W, Li J, et al. (2005). Loss of tumor suppressor p53 decreases PTEN expression and enhances signalling pathways leading to activation of activator protein 1 and nuclear factor kappaB induced by UV radiation. Cancer Res, 65, 6601-6611.
Wang L, Zhang Q, Zhang J, et al. (2011). PI3K pathway activation results in low efficacy of both trastuzumab and lapatinib. BMC Cancer, 11, 248-258.

139
Wang Q, Liu L, Pei L, et al. (2003). Control of Synaptic strength, a novel of Akt. Neuron, 38, 915-928.
Wang Q, Wang X, Hernandez A, et al. (2002). Regulation of TRAIL expression by the phosphatidylinositol 3-kinase/Akt/GSK-3 pathway in human colon cancer cells. J Biol Chem, 277, 36602-36610.
Watanabe T, Hotta T, Ichikawa A, et al. (1994). The MDM2 oncogene overexpression in chronic lymphocytic leukemia and low-grade lymphoma of B-cell origin. Blood, 84, 3158-3165.
Waterman M, Stavridi E, Waterman J, Halazonetis T (1998). ATM-dependent activation of p53 involves dephosphorylation and association with 14-3-3 proteins. Nat Genet, 19, 175-178.
Wechsler-Reya R, Scott M (2001). The developmental biology of brain tumours. Annu Rev Neurosci, 24, 385-428.
Wei W, Jin J, Schlisio S, Harper J, Kaelin WJ (2005). The v-Jun point mutation allows c-Jun to escape GSK3-dependent recognition and destruction by the Fbw7 ubiquitin ligase. Cancer Cell, 8, 25-33.
Welcker M, Singer J, Loeb K, et al. (2003). Multisite phosphorylation by Cdk2 and GSK3 controls cyclin E degradation. Mol Cell, 12, 381-392.
Weng L, Smith W, Brown J, Eng C (2001). PTEN inhibits insulin-stimulated MEK/MAPK activation and cell growth by blocking IRS-1 phosphorylation and IRS-1/Grb-2/Sos complex formation in a breast cancer model. Hum Mol Genet, 10, 605-616.
Widodo I, Ferronika P, Harijadi A, et al. (2013). Clinicopathological significance of lymphangiogenesis and tumor lymphovascular invasion in indonesian breast cancers. Asian Pac J Cancer Prev, 14,9 97-1001.
Witters L, Kumar R, Chinchilli V, Lipton A (1997). Enhanced anti-proliferative activity of the combination of tamoxifen plus HER-2-neu antibody. Breast Cancer Res Treat, 42, 1-5.
Wolff A, Hammond M, Schwartz J, et al. (2007). American Society of Clinical Oncology/College of American Pathologists guideline recommendations for human epidermal growth factor receptor 2 testing in breast cancer. J Clin Oncol, 25, 118-145.
Woodland D , Blackman M (2006). Immunity and age: living in the past? Trends Immunol, 27, 303-307.
Wu, M, Lee, H, Bellas, R et al. (1996). Inhibition of NF-kappaB/Rel induces apoptosis of murine B cells. EMBO J,4682-4690.
Wu X, Bayle J, Olson D, Levine A (1993). The p53-mdm-2 autoregulatory feedback loop. Genes Dev, 7, 1126-1132.
Wu Y, Mohamed H, Chillar R, et al. (2008). Clinical significance of Akt and HER2/neu overexpression in African-American and Latina women with breast cancer. Breast Cancer Res, 10.
Xiao Z, Chen J, Levine A, et al. (1995). Interaction between the retinoblastoma protein and the oncoprotein MDM2. Nature, 375, 694-698.
Yakes F, Chinratanalab W, Ritter C, et al. (2002). Herceptin-induced inhibition of phosphatidylinositol-3 kinase and Akt Is required for antibody-mediated effects on p27, cyclin D1, and antitumor action. Cancer Res, 62, 4132-4141.
140
Yamada K, Araki M (2001). Tumor suppressor PTEN: modulator of cell signaling, growth, migration, and apoptosis. J Cell Sci, 114, 2375-2382.
Yamada M, Udono M, Hori M, et al. (2006). Aged human skin removes UVB-induced pyrimidine dimers from the epidermis more slowly than younger adult skin in vivo. Arch Dermatol Res, 297, 294-302.
Yamashita H, Nishio M, Toyama T, et al. (2004). Coexistence of HER2 over-expression and p53 protein accumulation is a strong prognostic molecular marker in breast cancer. Breast Cancer Res, 6, R24-30.
Yang J, Cron P, Thompson V, et al. ( 2002). Molecular mechanism for the regulation of protein kinase B/Akt by hydrophobic motif phosphorylation. Mol Cell, 6, 1227-1240.
Yang J, Liu X, Bhalla K, et al. (1997). Prevention of apoptosis by Bcl-2: release of cytochrome c from mitochondria blocked. Science, 275, 1129-1132.
Yang S, Costantino J, Kim C, et al. (2010). Akt phosphorylation at Ser473 predicts benefit of paclitaxel chemotherapy in node-positive breast cancer. J Clin Oncol, 28, 2974-2981.
Yang Z, Tschopp O, Baudry A, et al. (2004). Physiological functions of protein kinase B/Akt. Biochem Soc Trans, 32, 350-354.
Yap T, Yan L, Patnaik A, et al. (2011). First-in-Man Clinical Trial of the Oral Pan-AKT Inhibitor MK-2206 in Patients With Advanced Solid Tumors. J Clin Oncol, 29, 4688-4695.
Yaziji H, Goldstein L, Barry T, et al. (2004). HER-2 testing in breast cancer using parallel tissue-based methods. JAMA, 291, 1972-1977.
Yonezawa S, Goto M, Yamada N, Higash iM, Nomoto M (2008). Expression profiles of MUC1, MUC2, and MUC4 mucins in human neoplasms and their relationship with biological behavior. Proteomics, 8, 3329-3341.
Yu J, Wang Z, Kinzler K, Vogelstein B, Zhang L (2003). PUMA mediates the apoptotic response to p53 in colorectal cancer cells. Proc Natl Acad Sci U S A, 100, 1931-1936.
Yuan T, Cantley L (2008). PI3K pathway alterations in cancer: variations on a theme. Oncogene, 27, 5497-5510.
Zabel U, Baeuerle PA (1990). Purified human I kappa B can rapidly dissociate the complex of the NF-kappa B transcription factor with its cognate DNA. Cell, 61, 255-265.
Zamzami N, Brenner C, Marzo I, Susin S, Kroemer G (1998). Subcellular and submitochondrial mode of action of Bcl-2-like oncoproteins. Oncogene, 16, 2265-2282.
Zha J, Harada H, Yang E, Jockel J, Korsmeyer S (1996). Serine phosphorylation of death agonist BAD in response to survival factor results in binding to 14-3-3 not BCL-X(L). Cell, 87, 619-628.
Zhang G, Zeng X, Li C, et al. (2001). PTEN induces chemosensitivity in PTEN-mutated prostate cancer cells by suppression of Bcl-2 expression. J Biol Chem, 276, 38830-38836.
Zhang Y, Xiong Y, Yarbrough W (1998). ARF promotes MDM2 degradation and stabilizes p53: ARF-INK4a locus deletion impairs both the Rb and p53 tumor suppression pathways. Cell, 92, 725-734.

141
Zhou B, Liao Y, Xia W, et al. (2001). Cytoplasmic localization of p21Cip1/WAF1 by Akt-induced phosphorylation in HER-2/neu-overexpressing cells. Nat Cell Biol, 3, 245-252.
Zhou G, Tucker D, Bae S, et al. (2006). Opposing roles for Akt1 and Akt2 in Rac/Pak signaling and cell migration. J Biol Chem, 281, 36443-36453.
Zhou Y, Eppenberger-Castori S, Eppenberger U, Benz C (2005). The NFkappaB pathway and endocrine-resistant breast cancer. Endocr Relat Cancer, 12, S37-46.

APPENDICES

142
Appendix 1: Correlation or Her-2 results with protein expression
Variable N Her-2 pos Her-2 neg p-value
PI3K high 79 48 (60.8%) 31 (39.2%) 0.730
PI3K low 13 7 (53.8%) 6 (46.2%)
PI3K neg 1 1 (100%) 0 (0%)
PTEN high 55 35 (63.6%) 20 (36.4%) 0.065
PTEN low 27 18 (66.7%) 9 (33.3%)
PTEN neg 11 3 (27.3%) 8 (72.7%)
p-Akt high 59 37 (62.7%) 22 (37.3%) 0.803
p-Akt low 26 14 (53.8%) 12 (46.2%)
p-Akt neg 8 5 (62.5%) 3 (37.5%)
NFκB high 87 55 (63.2%) 32 (36.8%) 0.035
NFκB low 6 1 (16.7%) 5 (83.3%)
MDM2 high 74 46 (62.2%) 28 (37.8%) 0.197
MDM2 low 14 9 (64.3%) 5 (35.7%)
MDM2 neg 5 1 (20%) 4 (80%)
BCL2 high 47 26 (55.3%) 21 (44.7%) 0.109
BCL2 low 20 10 (50%) 10 (50%)
BCL2 neg 26 20 (76.9%) 6 (23.1%)
p53 high 21 17 (81%) 4 (9%) 0.057
p53 low 21 13 (61.9%) 8 (38.1%)
p53 neg 51 26 (51%) 25 (49%)
ER pos 47 27 (57.4%) 20 (42.6%) 0.581
ER neg 46 29 (63.0%) 17 (37.0%)
Analysis was done using Fishers exact test and/or Chi square test as appropriate

143
Appendix 2: Correlation of ER status with protein expression
Variable N ER pos ER neg p-value
PI3K high 79 43 (54.4%) 36 (45.6%) 0.105
PI3K low 13 4 (52.0%) 9 (69.2%)
PI3K neg 1 0 (0%) 1 (100%)
PTEN high 55 31 (56.4%) 24 (43.6%) 0.370
PTEN low 27 12 (44.4%) 15 (55.6%)
PTEN neg 11 4 (36.4%) 7 (63.6%)
p-Akt high 59 31 (52.5%) 28 (47.5%) 0.898
p-Akt low 26 12 (46.2%) 14 (53.8%)
p-Akt neg 8 4 (50.0%) 4 (50.0%)
NFκB high 87 45 (51.7%) 42 (48.3%) 0.435
NFκB low 6 2 (33.3%) 4 (66.7%)
MDM2 high 74 37 (50.0%) 37 (50.0%) 0.384
MDM2 low 14 6 (42.9%) 8 (57.1%)
MDM2 neg 5 4 (80.0%) 1 (20.0%)
BCL2 high 47 30 (63.8%) 17 (36.2%) 0.022
BCL2 low 20 9 (45.0%) 11 (55%)
BCL2 neg 26 8 (30.8%) 18 (69.2%)
p53 high 21 9 (42.9%) 12 (57.1%) 0.367
p53 low 21 9 (42.9%) 12 (57.1%)
p53 neg 51 29 (56.9%) 22 (43.1%)
Her-2 pos* 56 27 (48.2%) 29 (51.8%) 0.581
Her-2 neg* 37 20 (54.1%) 17 (45.9%)
Analysis was done using Fishers exact test and/or Chi square test as appropriate * Her-2 IHC 2+ results were reclassified according to subsequent ISH results.

144
Appendix 3: Correlation of PI3K results with protein expression
Variable N PI3K high PI3K low PI3K neg p-value
PTEN high 55 47 (85.4%) 7 (12.7%) 1 (1.8%) 0.812
PTEN low 27 22 (81.5%) 5 (18.5%) 0 (0%)
PTEN neg 11 10 (90.9%) 1 (9.1%) 0 (0%)
p-Akt high 59 49 (83.1%) 9 (25.3%) 1 (1.7%) 0.827
p-Akt low 26 22 (84.6%) 4 (15.4%) 0 (0.0%)
p-Akt neg 8 8 (100%) 0 (0%) 0 (0%)
NFκB high 87 74 (85.1%) 12 (13.8%) 1 (1.1%) 0.616
NFκB low 6 5 (83.3%) 1 (16.7%) 0 (0%)
MDM2 high 74 64 (86.5%) 9 (14.1%) 1 (1.4%) 0.425
MDM2 low 14 10 (71.4%) 4 (28.6%) 0 (0%)
MDM2 neg 5 5 (100%) 0 (0%) 0 (0%)
BCL2 high 47 40 (85.1%) 7 (14.9%) 0 (0%) 0.666
BCL2 low 20 18 (90.0%) 2 (0.1%) 0 (0%)
BCL2 neg 26 21 (80.8%) 4 (15.4%) 1 (3.8%)
p53 high 21 16 (76.2%) 5 (23.8%) 0 (0%) 0.514
p53 low 21 18 (85.7%) 3 (14.3%) 0 (0%)
p53 neg 51 45 (88.2%) 5 (9.8%) 1 (2.0%)
ER pos 47 43 (91.5%) 4 (8.5%) 0 (0%) 0.105
ER neg 46 36 (78.3%) 9 (19.6%) 1 (2.2%)
Her-2 pos* 56 48 (85.7%) 7 (12.5%) 1 (1.8%) 0.730
Her-2 neg* 37 31 (83.8%) 6 (16.2%) 0 (0%)
Analysis was done using Fishers exact test and/or Chi square test as appropriate * Her-2 IHC 2+ results were reclassified according to subsequent ISH results.

145
Appendix 4: Correlation of PTEN results with protein expression
Variable N PTEN high PTEN low PTEN neg p-value
PI3K high 79 47 (67.1%) 22 (27.8%) 10 (12.7%) 0.812
PI3K low 13 7 (53.8%) 5 (38.5%) 1 (7.7%)
PI3K neg 1 1 (100%) 0 (0%) 0 (0%)
p-Akt high 59 40 (67.8%) 14 (23.7%) 5 (8.5%) 0.053
p-Akt low 26 13 (50.0%) 10 (38.5%) 3 (11.5%)
p-Akt neg 8 2 (25.0%) 3 (37.5%) 3 (37.5%)
NFκB high 87 53 (60.9%) 23 (26.4%) 11 (12.6%) 0.114
NFκB low 6 2 (33.3%) 4 (66.7%) 0 (0%)
MDM2 high 74 44 (59.5%) 20 (27.0%) 10 (13.5%) 0.213
MDM2 low 14 6 (42.9%) 7 (50.0%) 1 (7.1%)
MDM2 neg 5 5 (100%) 0 (0%) 0 (0)%
BCL2 high 47 32 (68.1%) 13 (27.7%) 2 (4.3%) 0.163
BCL2 low 20 10 (50.0%) 6 (30.0%) 4 (20.0%)
BCL2 neg 26 13 (50.0%) 8 (30.8%) 5 (19.2%)
p53 high 21 12 (57.1%) 8 (38.1%) 1 (4.8%) 0.236
p53 low 21 9 (42.9%) 8 (38.1%) 4 (19.0%)
p53 neg 51 34 (66.7%) 11 (21.6%) 6 (11.8%)
ER pos 47 31 (66.0%) 12 (25.5%) 4 (8.5%) 0.370
ER neg 46 24 (52.2%) 15 (32.6%) 7 (15.2%)
Her-2 pos* 56 35 (62.5%) 18 (32.1%) 3 (53.6%) 0.065
Her-2 neg* 37 20 (54.1%) 9 (24.3%) 8 (21.6%)
Analysis was done using Fishers exact test and/or Chi square test as appropriate * Her-2 IHC 2+ results were reclassified according to subsequent ISH results.

146
Appendix 5: Correlation of p-Akt results with protein expression
Variable N p-Akt high p-Akt low p-Akt neg p-value
PI3K high 79 49 (62.0%) 22 (27.8%) 8 (10.1%) 0.827
PI3K low 13 9 (69.2%) 4 (30.8%) 0 (0%)
PI3K neg 1 1 (100%) 0 (0%) 0 (0%)
PTEN high 55 40 (72.7%) 13 (23.6%) 2 (3.6%) 0.053
PTEN low 27 14 (51.9%) 10 (37.0%) 3 (11.1%)
PTEN neg 11 5 (45.4%) 3 (27.3%) 3 (27.3%)
NFκB high 87 58 (66.7%) 23 (26.4%) 6 (6.9%) 0.014
NFκB low 6 1 (16.7%) 3 (50.0%) 2 (33.3%)
MDM2 high 74 52 (70.3%) 16 (21.6%) 6 (12.2%) 0.040
MDM2 low 14 5 (35.7%) 7 (50.0%) 2 (14.3%)
MDM2 neg 5 2 (40.0%) 3 (60.0%) 0 (0%)
BCL2 high 47 33 (70.2%) 11 (23.4%) 3 (6.4%) 0.538
BCL2 low 20 10 (50.0%) 8 (40.0%) 2 (10.0%)
BCL2 neg 26 16 (61.5%) 7 (26.9%) 3 (11.5%)
p53 high 21 13 (61.9%) 5 (23.8%) 3 (14.3%) 0.754
p53 low 21 14 (66.7%) 5 (23.8%) 2 (9.5%)
p53 neg 51 32 (62.7%) 16 (31.4%) 3 (5.9%)
ER pos 47 31 (66.0%) 12 (25.5%) 4 (8.5%) 0.898
ER neg 46 28 (60.9%) 14 (30.4%) 4 (8.7%)
Her-2 pos* 56 37 (66.1%) 14 (25.0%) 5 (8.9%) 0.803
Her-2 neg* 37 22 (59.4%) 12 (32.4%) 3 (8.1%)
Analysis was done using Fishers exact test and/or Chi square test as appropriate * Her-2 IHC (2+) results were reclassified according to subsequent ISH results.

147
Appendix 6: Correlation of MDM2 results with protein expression
Variable N MDM2 high MDM2 low MDM2 neg p-value
PI3K high 79 64 (81.0%) 10 (12.7%) 5 (6.3%) 0.425
PI3K low 13 9 (69.2%) 4 (30.8%) 0 (0.0%)
PI3K neg 1 1 (100%) 0 (0%) 0 (0%)
PTEN high 55 44 (80.0%) 6 (10.9%) 5 (9.1%) 0.214
PTEN low 27 20 (74.1%) 7 (25.9%) 0 (0%)
PTEN neg 11 10 (90.9%) 1 (9.1%) 0 (0%)
p-Akt high 59 52 (88.1%) 5 (8.5%) 2 (3.4%) 0.040
p-Akt low 26 16 (61.5%) 7 (26.9%) 3 (11.5%)
p-Akt neg 8 6 (75.0%) 2 (25.0%) 0 (0%)
BCL2 high 47 34 (72.3%) 11 (23.4%) 2 (4.3%) 0.085
BCL2 low 20 18 (90.0%) 0 (0%) 2 (10.0%)
BCL2 neg 26 22 (84.6%) 3 (11.5%) 1 (3.8%)
p53 high 21 15 (71.4%) 4 (19.0%) 2 (13.3%) 0.603
p53 low 21 19 (90.5%) 2 (9.5%) 0 (0%)
p53 neg 51 40 (78.4%) 8 (15.7%) 3 (5.9%)
ER pos 47 37 (78.7%) 6 (12.8%) 4 (8.5%) 0.384
ER neg 46 37 (80.4%) 8 (17.4%) 1 (2.2%)
Her-2 pos* 56 46 (82.1%) 9 (16.1%) 1 (1.8%) 0.197
Her-2 neg* 37 28 (75.7%) 5 (13.5%) 4 (10.8%)
NFκB high 87 69 (79.3%) 13 (14.9%) 5 (5.7%) >0.999
NFκB low 6 5 (83.3%) 1 (16.7%) 0 (0%)
Analysis was done using Fishers exact test and/or Chi square test as appropriate * Her-2 IHC 2+ results were reclassified according to subsequent ISH results.

148
Appendix 7: Correlation of NFκB results with protein expression
Variable N NFκB high NFκB low p-value
PI3K high 79 74 (93.7%) 5 (6.3%) 0.616
PI3K low 13 12 (92.3%) 1 (7.7%)
PI3K neg 1 1 (100%) 0 (0%)
PTEN high 55 53 (96.4%) 2 (3.6%) 0.114
PTEN low 27 23 (85.2%) 4 (14.8%)
PTEN neg 11 11 (100%) 0 (0%)
MDM2 high 74 69 (93.2%) 5 (6.8%) >0.999
MDM2 low 14 13 (92.9%) 1 (7.1%)
MDM2 neg 5 5 (100%) 0 (0%)
p-Akt high 59 58 (98.3%) 1 (1.7%) 0.014
p-Akt low 26 23 (88.5%) 3 (11.5%)
p-Akt neg 8 6 (75.0%) 2 (25.0%)
BCL2 high 47 44 (93.6%) 3 (6.4%) 0.74
BCL2 low 20 18 (90.0%) 2 (10.0%)
BCL2 neg 26 25 (96.2%) 1 (3.8%)
p53 high 21 21 (100%) 0 (0%) 0.180
p53 low 21 18 (85.7%) 3 (14.3%)
p53 neg 51 48 (94.1%) 3 (5.9%)
ER pos 47 45 (95.7%) 2 (4.3%) 0.435
ER neg 46 42 (91.3%) 4 (8.7%)
Her-2 pos* 56 55 (98.2%) 1 (1.8%) 0.035
Her-2 neg* 37 32 (86.5%) 5 (13.5%)
Analysis was done using Fishers exact test and/or Chi square test as appropriate
* Her-2 IHC 2+ results were reclassified according to subsequent ISH results.
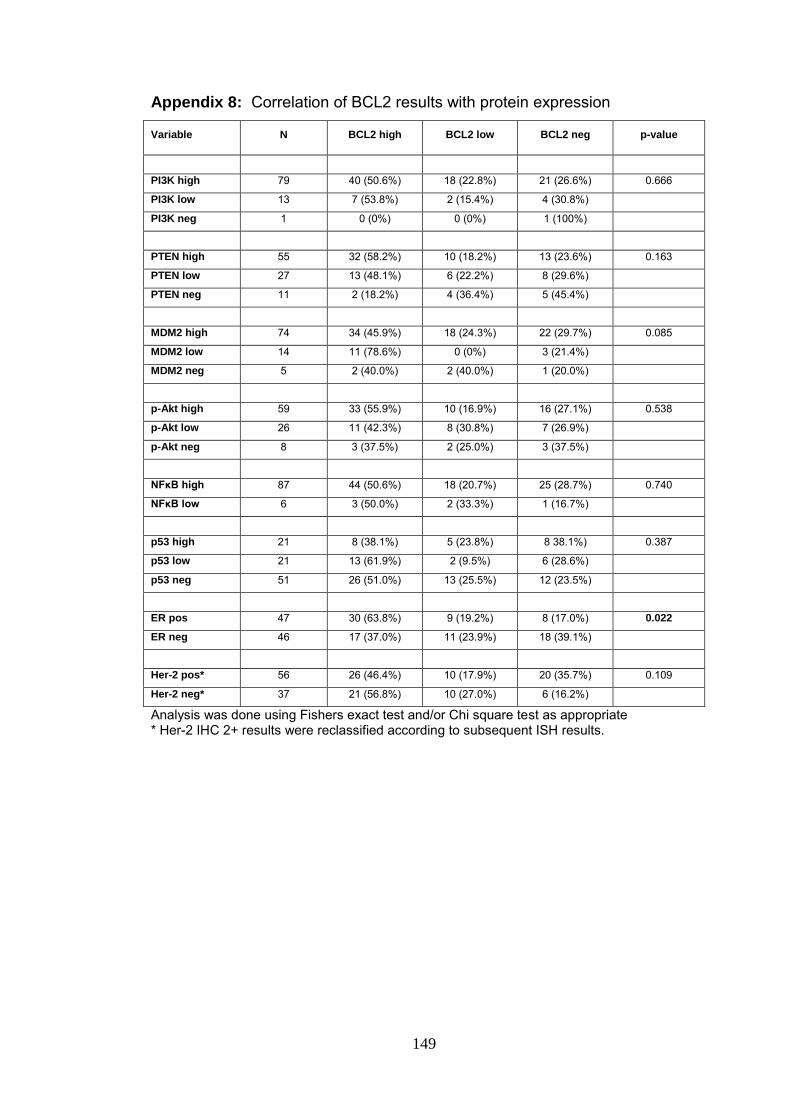
149
Appendix 8: Correlation of BCL2 results with protein expression
Variable N BCL2 high BCL2 low BCL2 neg p-value
PI3K high 79 40 (50.6%) 18 (22.8%) 21 (26.6%) 0.666
PI3K low 13 7 (53.8%) 2 (15.4%) 4 (30.8%)
PI3K neg 1 0 (0%) 0 (0%) 1 (100%)
PTEN high 55 32 (58.2%) 10 (18.2%) 13 (23.6%) 0.163
PTEN low 27 13 (48.1%) 6 (22.2%) 8 (29.6%)
PTEN neg 11 2 (18.2%) 4 (36.4%) 5 (45.4%)
MDM2 high 74 34 (45.9%) 18 (24.3%) 22 (29.7%) 0.085
MDM2 low 14 11 (78.6%) 0 (0%) 3 (21.4%)
MDM2 neg 5 2 (40.0%) 2 (40.0%) 1 (20.0%)
p-Akt high 59 33 (55.9%) 10 (16.9%) 16 (27.1%) 0.538
p-Akt low 26 11 (42.3%) 8 (30.8%) 7 (26.9%)
p-Akt neg 8 3 (37.5%) 2 (25.0%) 3 (37.5%)
NFκB high 87 44 (50.6%) 18 (20.7%) 25 (28.7%) 0.740
NFκB low 6 3 (50.0%) 2 (33.3%) 1 (16.7%)
p53 high 21 8 (38.1%) 5 (23.8%) 8 38.1%) 0.387
p53 low 21 13 (61.9%) 2 (9.5%) 6 (28.6%)
p53 neg 51 26 (51.0%) 13 (25.5%) 12 (23.5%)
ER pos 47 30 (63.8%) 9 (19.2%) 8 (17.0%) 0.022
ER neg 46 17 (37.0%) 11 (23.9%) 18 (39.1%)
Her-2 pos* 56 26 (46.4%) 10 (17.9%) 20 (35.7%) 0.109
Her-2 neg* 37 21 (56.8%) 10 (27.0%) 6 (16.2%)
Analysis was done using Fishers exact test and/or Chi square test as appropriate * Her-2 IHC 2+ results were reclassified according to subsequent ISH results.
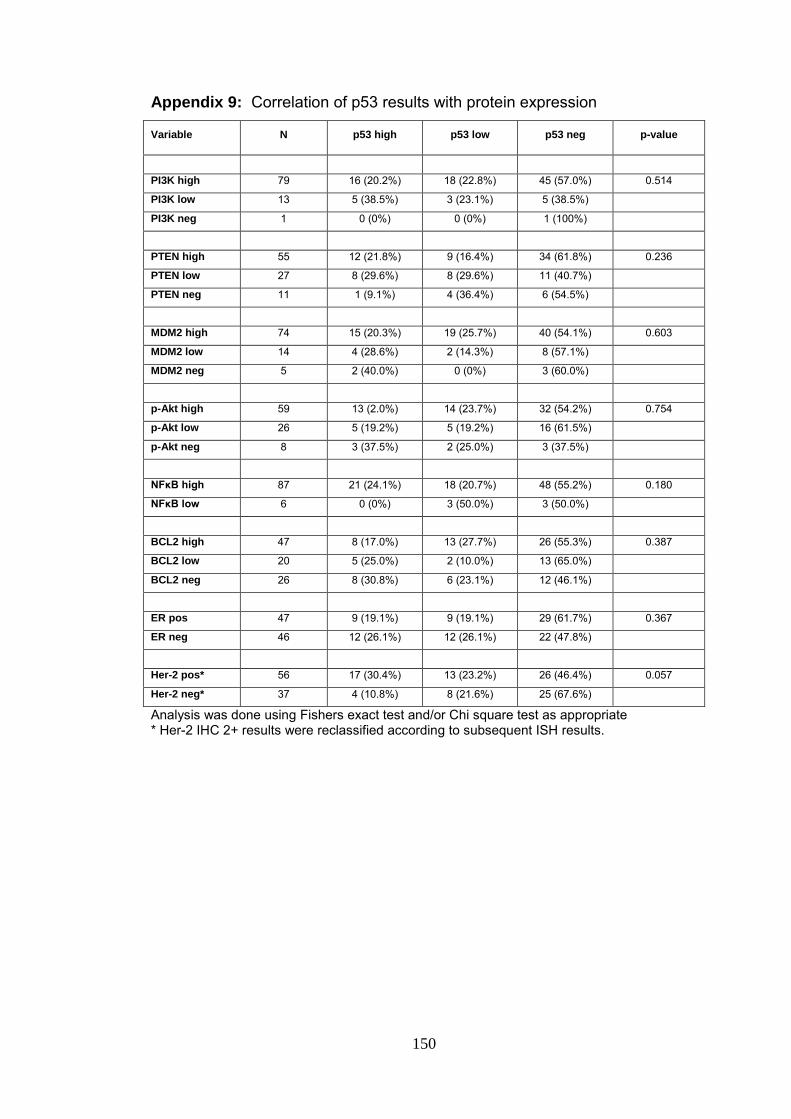
150
Appendix 9: Correlation of p53 results with protein expression
Variable N p53 high p53 low p53 neg p-value
PI3K high 79 16 (20.2%) 18 (22.8%) 45 (57.0%) 0.514
PI3K low 13 5 (38.5%) 3 (23.1%) 5 (38.5%)
PI3K neg 1 0 (0%) 0 (0%) 1 (100%)
PTEN high 55 12 (21.8%) 9 (16.4%) 34 (61.8%) 0.236
PTEN low 27 8 (29.6%) 8 (29.6%) 11 (40.7%)
PTEN neg 11 1 (9.1%) 4 (36.4%) 6 (54.5%)
MDM2 high 74 15 (20.3%) 19 (25.7%) 40 (54.1%) 0.603
MDM2 low 14 4 (28.6%) 2 (14.3%) 8 (57.1%)
MDM2 neg 5 2 (40.0%) 0 (0%) 3 (60.0%)
p-Akt high 59 13 (2.0%) 14 (23.7%) 32 (54.2%) 0.754
p-Akt low 26 5 (19.2%) 5 (19.2%) 16 (61.5%)
p-Akt neg 8 3 (37.5%) 2 (25.0%) 3 (37.5%)
NFκB high 87 21 (24.1%) 18 (20.7%) 48 (55.2%) 0.180
NFκB low 6 0 (0%) 3 (50.0%) 3 (50.0%)
BCL2 high 47 8 (17.0%) 13 (27.7%) 26 (55.3%) 0.387
BCL2 low 20 5 (25.0%) 2 (10.0%) 13 (65.0%)
BCL2 neg 26 8 (30.8%) 6 (23.1%) 12 (46.1%)
ER pos 47 9 (19.1%) 9 (19.1%) 29 (61.7%) 0.367
ER neg 46 12 (26.1%) 12 (26.1%) 22 (47.8%)
Her-2 pos* 56 17 (30.4%) 13 (23.2%) 26 (46.4%) 0.057
Her-2 neg* 37 4 (10.8%) 8 (21.6%) 25 (67.6%)
Analysis was done using Fishers exact test and/or Chi square test as appropriate * Her-2 IHC 2+ results were reclassified according to subsequent ISH results.

151
Appendix 10: Association between age and level of protein expression
Variable N Mean age SD p-value
PTEN neg 11 52.1 8.2 0.154
PTEN low 27 54.7 9.8
PTEN high 55 53.1 11.7
NFκB low 6 60.2 10.5 0.595
NFκB high 87 53.1 10.7
MDM2 neg 5 53.8 5.8 0.850
MDM2 low 14 51.1 13.6
MDM2 high 74 53.9 10.5
p53 neg 51 54.2 10.3 0.148
p53 low 21 53.5 9.9
p53 high 21 51.6 12.8
BCL2 neg 26 55.2 3.7 0.813
BCL2 low 20 50.6 10.9
BCL2 high 47 53.7 10.4
p-Akt neg 8 51.4 3.7 0.874
p-Akt low 26 53.6 10.9
p-Akt high 59 53.7 10.4
PI3K neg 1 40.0 - 0.392
PI3K low 13 55.3 11.3
PI3K high 17 53.3 10.7
ER neg 46 52.8 10.8 0.476
ER pos 47 54.1 10.8
Her-2 Neg 37 56.2 8.6 0.044
Her-2 Pos 56 51.6 11.7
Analysis of variance (ANOVA) was used to analyze level of protein expression and age (continues variable).

152
Appendix 11: Association between tumour type and protein expression
Variable N Ductal Lobular p-value
PTEN high 55 50 (90.9%) 5 (9.1%) >0.999
PTEN low 27 25 (92.6%) 2 (7.4%)
PTEN neg 11 10 (90.9%) 1 (9.1%)
NFκB high 87 81 (93.1%) 6 (6.9%) 0.082
NFκB low 6 4 (66.7%) 2 (33.3%)
MDM2 high 74 68 (91.9%) 6 (8.1%) 0.051
MDM2 low 14 14 (100%) 0 (0%)
MDM2 neg 5 3 (60.0%) 2 (40.0%)
p53 high 21 21 (100%) 0 (0%) 0.172
p53 low 21 20 (95.2%) 1 (4.8%)
p53 neg 51 44 (86.3%) 7 (13.7%)
BCL2 high 47 42 (89.4%) 5 (10.6%) 0.135
BCL2 low 20 17 (85.0%) 3 15.0%)
BCL2 neg 26 26 (100%) 0 (0%)
p-Akt high 59 54 (91.5%) 5 (8.5%) 0.183
p-Akt low 26 25 (96.2%) 1 (3.8%)
p-Akt neg 8 6 (75.0%) 2 (25.0%)
PI3k high 79 72 (91.1%) 7 (8.9%) 0.630
PI3k low 13 12 (92.3%) 1 (7.7%)
PI3k neg 1 1 (100%) 0 (0%)
ER pos 47 40 (85.1%) 7 (6.7%) 0.059
ER neg 46 45 (97.8%) 1 (2.2%)
Her-2 pos* 56 55 (98.2%) 1 (1.8%) 0.006
Her-2 neg* 37 30 (81.1%) 7 (18.9%)
Analysis was done using Fishers exact test and/or Chi square test as appropriate * Her-2 IHC 2+ results were reclassified according to subsequent ISH results.
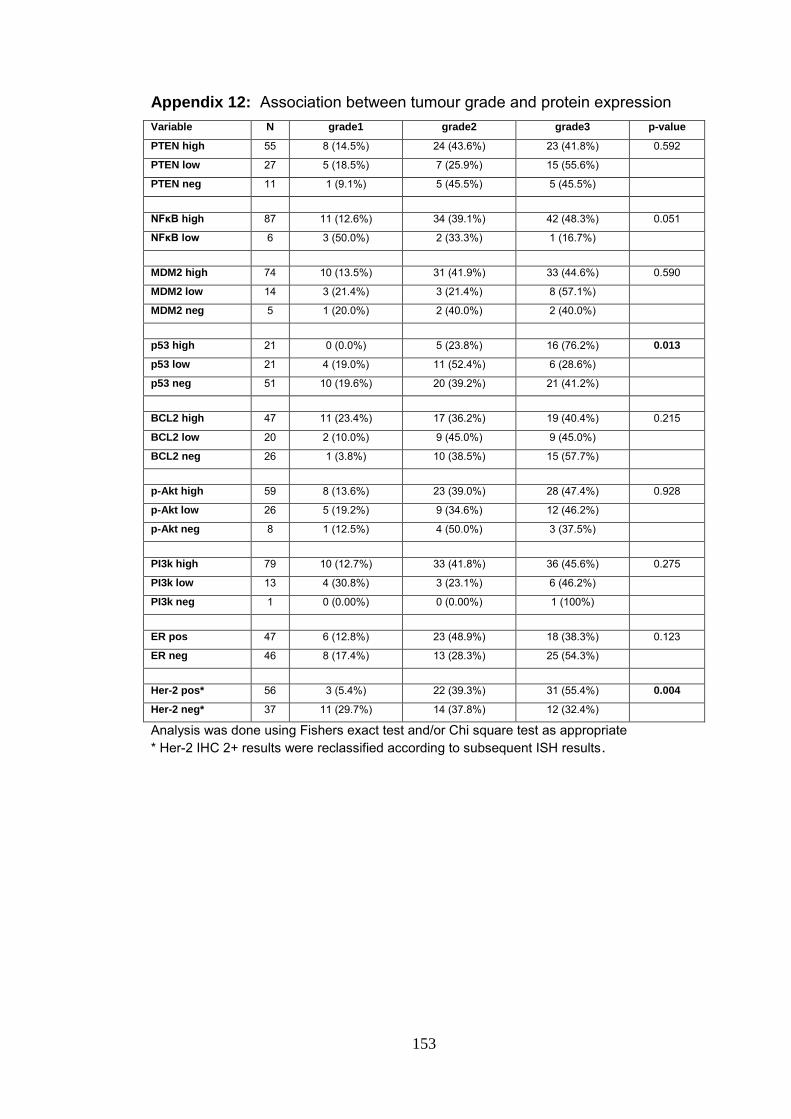
153
Appendix 12: Association between tumour grade and protein expression
Variable N grade1 grade2 grade3 p-value
PTEN high 55 8 (14.5%) 24 (43.6%) 23 (41.8%) 0.592
PTEN low 27 5 (18.5%) 7 (25.9%) 15 (55.6%)
PTEN neg 11 1 (9.1%) 5 (45.5%) 5 (45.5%)
NFκB high 87 11 (12.6%) 34 (39.1%) 42 (48.3%) 0.051
NFκB low 6 3 (50.0%) 2 (33.3%) 1 (16.7%)
MDM2 high 74 10 (13.5%) 31 (41.9%) 33 (44.6%) 0.590
MDM2 low 14 3 (21.4%) 3 (21.4%) 8 (57.1%)
MDM2 neg 5 1 (20.0%) 2 (40.0%) 2 (40.0%)
p53 high 21 0 (0.0%) 5 (23.8%) 16 (76.2%) 0.013
p53 low 21 4 (19.0%) 11 (52.4%) 6 (28.6%)
p53 neg 51 10 (19.6%) 20 (39.2%) 21 (41.2%)
BCL2 high 47 11 (23.4%) 17 (36.2%) 19 (40.4%) 0.215
BCL2 low 20 2 (10.0%) 9 (45.0%) 9 (45.0%)
BCL2 neg 26 1 (3.8%) 10 (38.5%) 15 (57.7%)
p-Akt high 59 8 (13.6%) 23 (39.0%) 28 (47.4%) 0.928
p-Akt low 26 5 (19.2%) 9 (34.6%) 12 (46.2%)
p-Akt neg 8 1 (12.5%) 4 (50.0%) 3 (37.5%)
PI3k high 79 10 (12.7%) 33 (41.8%) 36 (45.6%) 0.275
PI3k low 13 4 (30.8%) 3 (23.1%) 6 (46.2%)
PI3k neg 1 0 (0.00%) 0 (0.00%) 1 (100%)
ER pos 47 6 (12.8%) 23 (48.9%) 18 (38.3%) 0.123
ER neg 46 8 (17.4%) 13 (28.3%) 25 (54.3%)
Her-2 pos* 56 3 (5.4%) 22 (39.3%) 31 (55.4%) 0.004
Her-2 neg* 37 11 (29.7%) 14 (37.8%) 12 (32.4%)
Analysis was done using Fishers exact test and/or Chi square test as appropriate
* Her-2 IHC 2+ results were reclassified according to subsequent ISH results.

154
Appendix 13: Association between lymphovascular invasion and level of protein expression Variable N No Invasion Invasion p- value
PTEN high 55 13 (23.6%) 42 (76.4%) 0.777
PTEN low 27 8 (29.6%) 19 (70.4%)
PTEN neg 11 2 (18.2%) 9 (81.8%)
NFκB high 87 22 (25.3%) 65 (74.7%) >0.999
NFκB low 6 1 (16.7%) 5 (83.3%)
MDM2 high 74 17 (23.0%) 57 (77.0%) 0.656
MDM2 low 14 5 (35.7%) 9 (64.3%)
MDM2 neg 5 1 (20.0%) 4 (80.0%)
p53 high 21 6 (28.6%) 15 (71.4%) 0.403
p53 low 21 7 (33.3%) 14 (66.6%)
p53 neg 51 10 (19.6%) 41 (80.4%)
BCL2 high 47 13 (27.7%) 34 (72.3%) 0.858
BCL2 low 20 4 (20.0%) 16 (80.0%)
BCL2 neg 26 6 (23.1%) 20 (76.9%)
p-Akt2 high 59 12 (20.3%) 47 (79.7%) 0.175
p-Akt2 low 26 10 (38.5%) 16 (61.5%)
p-Akt2 neg 8 1 (12.5%) 7 (87.5%)
PI3K high 79 16 (20.3%) 63 (79.7%) 0.010
PI3K low 13 7 (53.8%) 6 (46.1%)
PI3K neg 1 0 (0.0%) 1 (100%)
ER pos 47 2 (4.3%) 45 (95.7%) <0.001
ER neg 46 21 (45.7%) 25 (54.3%)
Her-2 pos* 56 16 (28.6%) 40 (71.4%) 0.337
Her-2 neg* 37 7 (18.9%) 30 (81.1%)
Analysis was done using Fishers exact test and/or Chi square test as appropriate * Her-2 IHC 2+ results were reclassified according to subsequent ISH results.
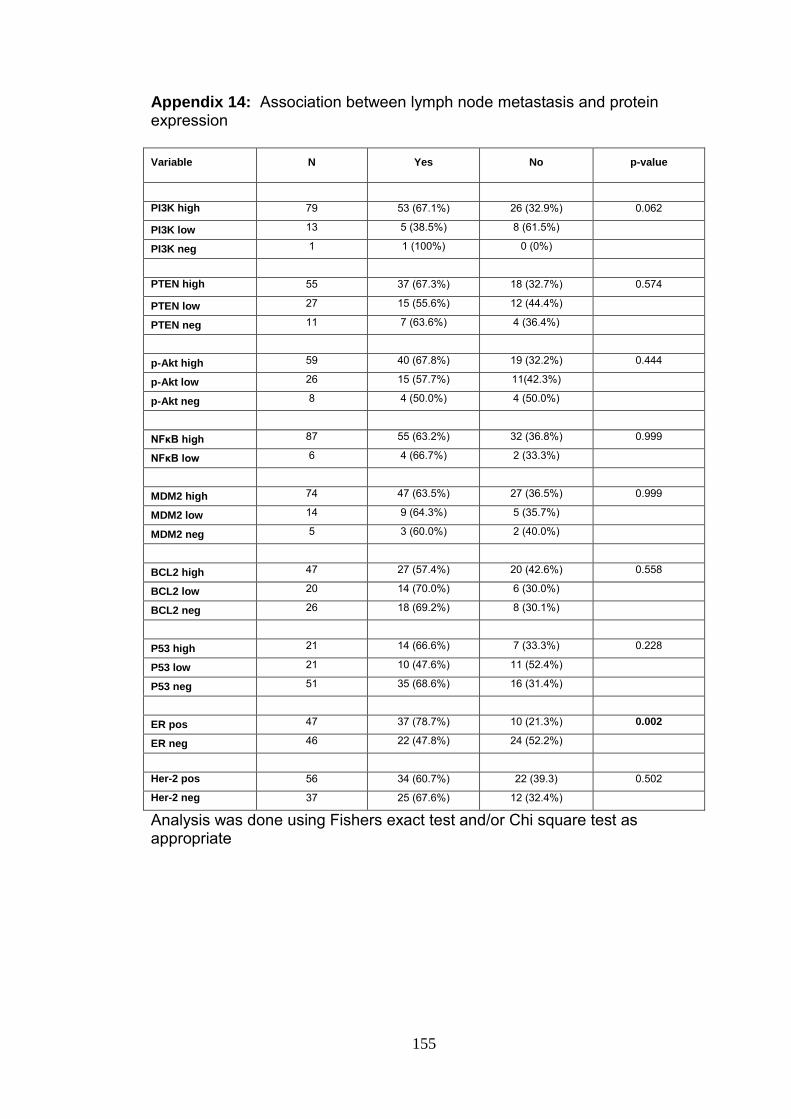
155
Appendix 14: Association between lymph node metastasis and protein expression
Variable N Yes No p-value
PI3K high 79 53 (67.1%) 26 (32.9%) 0.062
PI3K low 13 5 (38.5%) 8 (61.5%)
PI3K neg 1 1 (100%) 0 (0%)
PTEN high 55 37 (67.3%) 18 (32.7%) 0.574
PTEN low 27 15 (55.6%) 12 (44.4%)
PTEN neg 11 7 (63.6%) 4 (36.4%)
p-Akt high 59 40 (67.8%) 19 (32.2%) 0.444
p-Akt low 26 15 (57.7%) 11(42.3%)
p-Akt neg 8 4 (50.0%) 4 (50.0%)
NFκB high 87 55 (63.2%) 32 (36.8%) 0.999
NFκB low 6 4 (66.7%) 2 (33.3%)
MDM2 high 74 47 (63.5%) 27 (36.5%) 0.999
MDM2 low 14 9 (64.3%) 5 (35.7%)
MDM2 neg 5 3 (60.0%) 2 (40.0%)
BCL2 high 47 27 (57.4%) 20 (42.6%) 0.558
BCL2 low 20 14 (70.0%) 6 (30.0%)
BCL2 neg 26 18 (69.2%) 8 (30.1%)
P53 high 21 14 (66.6%) 7 (33.3%) 0.228
P53 low 21 10 (47.6%) 11 (52.4%)
P53 neg 51 35 (68.6%) 16 (31.4%)
ER pos 47 37 (78.7%) 10 (21.3%) 0.002
ER neg 46 22 (47.8%) 24 (52.2%)
Her-2 pos 56 34 (60.7%) 22 (39.3) 0.502
Her-2 neg 37 25 (67.6%) 12 (32.4%)
Analysis was done using Fishers exact test and/or Chi square test as appropriate

156
Appendix 15: Association between distant metastasis (other than regional lymph nodes) and level of protein expression
Variable N No Yes p-value
PTEN high 52 39 (75.0%) 16 (25.0%) 0.165
PTEN low 27 16 (59.3%) 11 (40.7%)
PTEN neg 11 10 (90.9%) 1 (9.1%)
NFκB high 87 62 (71.3%) 25 (28.7%) 0.361
NFκB low 6 3 (50.0%) 3 (50.0%)
MDM2 high 74 56 (75.7%) 18 (24.3%) 0.017
MDM2 low 14 8 (57.1%) 6 (42.9%)
MDM2 neg 5 1 (20.0%) 4 (80.0%)
p53 high 21 12 (57.1%) 9 (42.9%) 0.122
p53 low 21 18 (85.7%) 3 (14.3%)
p53 neg 51 35 (68.6%) 16 (31.4%)
BCL2 high 47 33 (70.2%) 14 (29.8%) 0.837
BCL2 low 20 13 (65.0%) 7 (35.0%)
BCL2 neg 26 19 (73.1%) 7 (26.9%)
p-Akt high 59 42 (71.2%) 17 (28.8%) 0.882
p-Akt low 26 18 (69.2%) 8 (30.8%)
p-Akt neg 8 5 (62.5%) 3 (37.5%)
PI3K high 79 53 (67.1%) 26 (32.9%) 0.532
PI3K low 13 11 (84.6%) 2 (15.4%)
PI3K neg 1 1 (100%) 0 (0%)
ER pos 47 30 (63.8%) 17 (36.2%) 0.198
ER neg 46 35 (76.1%) 11 (23.9%)
Her-2 pos 56 39 (69.6%) 17 (30.4%) >0.999
Her-2 neg 37 26 (70.3%) 11 (29.7%)
Analysis was done using Fishers exact test and/or Chi square test as appropriate

157
Appendix 16: Association between apoptotic index and protein expression
Variable N < 3 3 <5 5 <7 ≥7 p- value
PTEN high 55 19 (34.5%) 16 (29.1%) 12 (21.8%) 7 (12.7%) 0.479
PTEN low 27 4 (14.8%) 9 (33.3%) 8 (29.6%) 6 (22.2%)
PTEN neg 11 2 (18.2%) 3 (27.3%) 3 (27.3%) 3 (27.3%)
NFκB high 87 23 (26.4%) 26 (29.9%) 21 (24.1%) 18 (20.7%) 0.798
NFκB low 6 2 (33.3%) 2 (33.3%) 2 (33.3%) 0 (0.0%)
MDM2 high 74 21 (28.4%) 22 (29.7%) 18 (24.3%) 12 (16.2%) 0.439
MDM2 low 14 4 (28.6%) 4 (28.6%) 2 (14.3%) 4 (28.6%)
MDM2 neg 5 0 (0.0%) 2 (40.0%) 3 (60.0%) 0 (0.0%)
p53 high 21 4 (19.0%) 8 (38.0%) 3 (14.3%) 6 (28.6%) 0.490
p53 low 21 5 (23.8%) 7 (33.3%) 7 (33.3%) 2 (9.5%)
p53 neg 51 16 (31.4%) 13 (25.5%) 13 (25.5%) 8 (15.7%)
BCL2 high 47 11 (23.4%) 13 (27.7%) 14 (29.8%) 8 (17.0%) 0.887
BCL2 low 20 7 (35.0%) 6 (30.0%) 3 (15.0%) 4 (20.0%)
BCL2 neg 26 7 (26.9%) 9 (34.6%) 6 (23.1%) 4 (15.4%)
p-Akt high 59 16 (27.1%) 16 (27.1%) 15 (25.4%) 11 (18.6%) 0.643
p-Akt low 26 8 (30.8%) 10 (38.5%) 4 (15.4%) 4 (15.4%)
p-Akt neg 8 1 (12.5%) 2 (25.0%) 4 (50.0%) 1 (12.5%)
PI3K high 79 17 (21.5%) 26 (32.9%) 21 (26.6%) 13 (16.5%) 0.014
PI3K low 13 8 (61.5%) 1 (7.7%) 1 (7.7%) 3 (23.1%)
PI3K neg 1 0 (0.0%) 1 (100%) 0 (0.0%) 0 (0.0%)
ER pos 47 12 (25.5%) 15 (31.9%) 13 (27.7%) 7 (14.9%) 0.854
ER neg 46 13 (28.3%) 13 (28.3%) 10 (21.7%) 9 (19.6%)
Her-2 pos 56 15 (26.8%) 19 (33.9%) 13 (23.2%) 9 (16.1%) 0.838
Her-2 neg 37 10 (27.0%) 9 (24.3%) 10 (27.0%) 7 (18.9%)
Analysis was done using Fishers exact test and/or Chi square test as appropriate
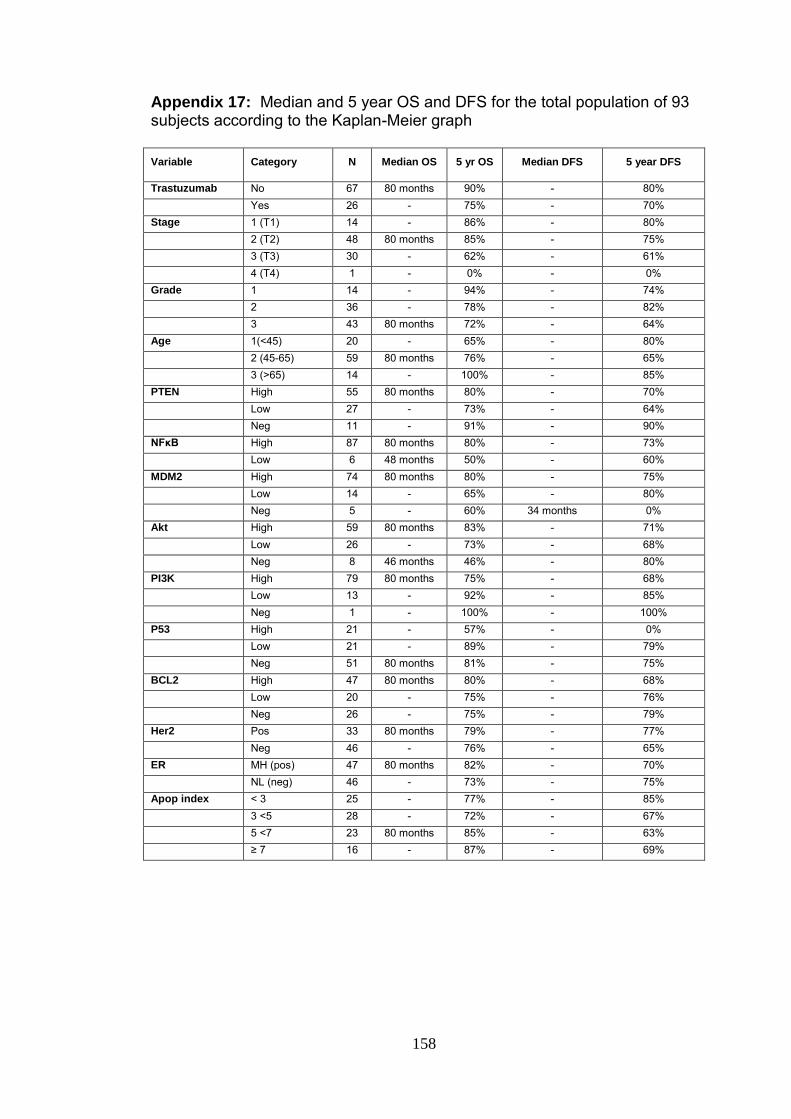
158
Appendix 17: Median and 5 year OS and DFS for the total population of 93 subjects according to the Kaplan-Meier graph
Variable Category N Median OS 5 yr OS Median DFS 5 year DFS
Trastuzumab No 67 80 months 90% - 80%
Yes 26 - 75% - 70%
Stage 1 (T1) 14 - 86% - 80%
2 (T2) 48 80 months 85% - 75%
3 (T3) 30 - 62% - 61%
4 (T4) 1 - 0% - 0%
Grade 1 14 - 94% - 74%
2 36 - 78% - 82%
3 43 80 months 72% - 64%
Age 1(<45) 20 - 65% - 80%
2 (45-65) 59 80 months 76% - 65%
3 (>65) 14 - 100% - 85%
PTEN High 55 80 months 80% - 70%
Low 27 - 73% - 64%
Neg 11 - 91% - 90%
NFκB High 87 80 months 80% - 73%
Low 6 48 months 50% - 60%
MDM2 High 74 80 months 80% - 75%
Low 14 - 65% - 80%
Neg 5 - 60% 34 months 0%
Akt High 59 80 months 83% - 71%
Low 26 - 73% - 68%
Neg 8 46 months 46% - 80%
PI3K High 79 80 months 75% - 68%
Low 13 - 92% - 85%
Neg 1 - 100% - 100%
P53 High 21 - 57% - 0%
Low 21 - 89% - 79%
Neg 51 80 months 81% - 75%
BCL2 High 47 80 months 80% - 68%
Low 20 - 75% - 76%
Neg 26 - 75% - 79%
Her2 Pos 33 80 months 79% - 77%
Neg 46 - 76% - 65%
ER MH (pos) 47 80 months 82% - 70%
NL (neg) 46 - 73% - 75%
Apop index < 3 25 - 77% - 85%
3 <5 28 - 72% - 67%
5 <7 23 80 months 85% - 63%
≥ 7 16 - 87% - 69%

159
Appendix 18: Median and 5 year OS and DFS for the cohort of 67 patients that did not receive trastuzumab treatment according to the Kaplan-Meier graph
Variable Category N Median OS 5 yr OS Median DFS 5 year DFS
Stage 1 (T1) 8 - 80% - 86%
2 (T2) 37 - 84% - 73%
3 (T3) 21 - 56% - 56%
4 (T4) 1 - 0% - 0%
Grade 1 12 - 92% - 71%
2 27 - 79% - 78%
3 28 - 63% - 60%
Age 1(<45) 12 - 57% - 75%
2 (45-65) 47 - 74% - 65%
3 (>65) 8 - 100% - 88%
PTEN High 38 - 76% - 68%
Low 19 - 62% - 56%
Neg 10 - 100% - 100%
NFκB High 61 - 77% - 70%
Low 6 47 months 50% - 60%
MDM2 High 50 - 79% - 74%
Low 12 - 58% - 78%
Neg 5 - 60% 36 months 0%
Akt High 34 - 81% - 67%
Low 25 - 72% - 68%
Neg 8 47 months 47% - 80%
PI3K High 57 - 72% - 67%
Low 10 - 90% - 80%
Neg 0 - - - -
P53 High 14 42 months 40% 45 months 41%
Low 16 - 85% - 75%
Neg 37 - 83% - 77%
BCL2 High 35 - 77% - 76%
Low 15 - 77% - 76%
Neg 17 - 70% - 70%
Her2 Pos 36 - 70% - 74%
Neg 31 78% 65%
ER MH (pos) 32 - 76% - 69%
NL (neg) 35 - 72% - 70%
Apop index < 3 18 - 75% - 80%
3 <5 18 - 65% - 64%
5 <7 19 - 80% - 66%
≥ 7 11 - 72% - 63%

160
Appendix 19: Median and 5 year OS and DFS for the cohort of 26 patients that did receive trastuzumab treatment according to the Kaplan-Meier graph
Variable Category N Median OS 5 yr OS Median DFS 5 year DFS
Grade 1 (T1) 2 - 100% 80 months 94%
2 (T2) 9 80 months 91% - -
3 (T3) 15 - 78% - 78%
4 (T4) 0 - - - -
Stage 1 6 - 100% - 100%
2 11 - 78% - -
3 9 80 months 94% 80 months 94%
Age 1 (<45) 8 - 75% - 85%
2 (45-65) 12 80 months 92% - 0%
3 (>65) 6 - 100% - 0%
PTEN High 17 80 months 89% - 80%
Low 8 - 100% - 100%
Neg 1 18 months 0% 18 months 0%
NFκB High 26 80 months 88% - 80%
Low 0 - - - -
MDM2 High 24 80 months 87% - 87%
Low 2 - 100% - 100%
Neg 0 - - - -
Akt High 25 80 months 87% - 80%
Low 1 - 100% - -
Neg 0 - - - -
PI3K High 22 80 months 86% - 71%
Low 3 - - - -
Neg 1 - - - -
P53 High 7 - 100% - 100%
Low 5 - 100% - 100%
Neg 14 80 months 78% - 63%
BCL2 High 12 - 92% - 68%
Low 5 - 0% - 100%
Neg 9 80 months 0% - 87%
Her2 Pos 26 80 months 92% - 80%
ER MH (pos) 15 80 months 94% - 66%
NL (neg) 11 - 0% - 89%
Apop index < 3 25 - 85% - -
3 <5 28 - 90% - 75%
5 <7 23 80
months100
100% 41 months 0%
≥ 7 16 - 80% - 0%

161
Appendix 20: Analysis of overall survival (OS) of complete sample of 93 cases, using Cox regression analysis adjusted for age
Variable Category N Person time Deaths Death rate 95% CI HR 95%CI
Trastuzumab No 67 3177 16 5.0 (3.1 – 8.2) 1.0 (ref)
Yes 26 1237 4 3.2 (1.2 - 8.6) 0.4 (0.1 – 1.5)
Stage 1 (T1) 14 747 1 1.3 (0.2 - 9.5) 1.0 (ref)
2 (T2) 48 2338 8 3.4 (1.7 – 6.8) 2.1 (0.2 – 17.1)
3 (T3) 30 1287 11 8.5 (4.7 – 15.4) 5.0 (0.6 – 42.4)
4 (T4) 1 42 0 0.0 - - -
Grade 1 14 731 1 1.4 (0.2 – 9.7) 1.0 (ref)
2 36 1758 7 4.0 (1.9 – 8.4) 3.1 (0.4 – 25.6)
3 43 1925 12 6.2 (3.5 – 11.0) 3.8 (0.5 – 29.6)
Age 1(<45) 20 796 7 8.8 (4.2 – 18.4) 1.0 (ref)
2 (45-65) 59 2873 13 4.5 (2.6 – 7.8) 0.5 (0.2 – 1.3)
3 (>65) 14 745 0 0.0 - - -
PTEN High 55 2606 12 4.6 (2.6 – 8.1) 1.0 (ref)
Low 27 1273 7 5.5 (2.6 – 11.5) 1.6 (0.6 – 4.3)
Neg 11 535 1 1.9 (0.3 – 13.3) 0.4 (0.1 – 3.5)
NFκB High 87 4110 17 4.1 (2.6 – 6.7) 1.0 (ref)
Low 6 304 3 9.9 (3.2 – 30.6 ) 3.6 (1.0 – 13.1)
MDM2 High 74 3614 13 3.6 (2.1 – 6.2) 1.0 (ref)
Low 14 550 5 9.1 (3.8 – 21.8) 2.4 (0.8 – 6.9)
Neg 5 250 2 8.0 (2.0 – 32.0) 2.8 (0.6 – 13.0)
Akt High 59 2836 9 3.2 (1.7 – 6.1) 1.0 (ref)
Low 26 1261 7 5.6 (2.6 – 11.6) 2.1 (0.8 – 5.9)
Neg 8 317 4 12.6 (4.7 – 33.6) 5.1 (1.5 – 17.3)
PI3K High 79 3738 19 5.1 (3.2 – 8.0) 1.0 (ref)
Low 13 625 1 1.6 (0.2 – 11.4) 0.3 0.0 – 2.3)
Neg 1 51 0 0.0 - - -
P53 High 21 839 8 9.5 (4.8 – 19.1) 1.0 (ref)
Low 21 1073 2 1.9 (0.5 – 7.4) 0.18 (0.0 – 0.9)
Neg 51 2502 10 4.0 (2.1 – 7.4) 0.4 (0.2 – 1.0)
BCL2 High 47 2338 10 4.3 (2.3 – 7.9) 1.0 (ref)
Low 20 976 4 4.1 (1.5 – 11.0) 0.9 (0.3 – 2.8)
Neg 26 1100 6 5.5 (2.5 – 12.1) 1.6 (0.5 – 4.4)
Her2 Neg 33 1780 8 4.5 (2.2 – 9.0) 1.0 (ref)
Pos 46 2634 12 4.6 (2.6 – 8.0) 0.7 (0.2 -1.7)
ER MH (pos) 47 2303 9 3.9 (2.0 – 7.5) 1.0 (ref)
NL (neg) 46 2111 11 5.2 (2.9 – 9.4) 1.2 (0.5 – 3.1)
Apop index < 3 25 1079 5 4.6 (1.9 – 11.1) 1.0 (ref)
3 <5 28 1335 7 5.2 (2.5 – 11.0) 1.1 (0.4 – 4.6)
5 <7 23 1202 4 3.3 (1.2 – 8.9) 0.7 (0.2 – 3.4)
≥ 7 16 759 4 5.3 (2.0 – 14.1) 1.2 (0.4 – 5.3)

162
Appendix 21: Analysis of overall survival for the cohort of 67 cases that has not received trastuzumab treatment, using Cox regression analysis adjusted for age
Variable Category N Person time Deaths Death rate 95% CI HR 95% CI
Stage 1 (T1) 14 425 1 2.4 (0.3 – 16.7) - (ref)
2 (T2) 48 1850 6 3.2 (1.5 – 7.2) 1.4 (0.2 – 11.5)
3 (T3) 30 860 9 10.5 (5.4 – 20.1) 4.3 (0.5 – 34.3)
4 (T4) 1 42 0 0.0 - - -
Grade 1 14 644 1 1.6 (0.22 – 11.0) - (ref)
2 36 1346 50 3.7 (1.5 – 8.9) 2.5 (0.3 – 21.2)
3 43 1187 10 8.4 (4.5 – 15.7) 4.5 (0.6 – 36.0)
Age 1(<45) 12 448 5 11.2 (4.65 – 26.8) 1.0 (ref)
2 (45-65) 47 2299 11 4.8 (2.6 – 8.6) 0.4 (0.1 – 1.2)
3 (>65) 8 430 0 - - - -
PTEN High 38 1825 9 4.0 (2.6 – 9.5) 1.0 (ref)
Low 19 835 7 8.4 (4.0 – 17.6) 1.9 (0.7 - 5.2)
Neg 10 517 0 - - - -
NFκB High 61 2873 13 4.5 (2.6 – 7.8) 1.0 (ref)
Low 6 304 3 9.9 (3.2 – 30.6) 2.8 (0.8 – 10.2)
MDM2 High 50 2495 9 3.6 (1.9 – 6.9) 1.0 (ref)
Low 12 432 5 4.8 (4.8 – 27.8) 3.2 (1.1 – 9.7)
Neg 5 250 2 2.0 (2.0 – 32.0) 2.6 (0.6 – 12.2)
Akt High 34 1670 5 3.0 (1.2 – 7.2) 1.0 (ref)
Low 25 1190 7 5.9 (2.8 – 12.3) 2.0 (0.6 – 6.3)
Neg 8 317 4 12.6 (4.7 – 33.6) 4.4 (1.2 – 16.7)
PI3K High 57 2689 15 5.6 (3.3 – 9.3) 1.0 (ref)
Low 10 488 1 2.1 (0.3 – 14.5) 0.4 (0.1 – 2.9)
Neg 0 - - - - - -
P53 High 14 518 8 15.4 (7.7 – 30.9) 1.0 (ref)
Low 16 796 2 2.5 (0.6 – 10.0) 0.2 (0.0 – 0.9)
Neg 37 1863 6 3.2 (1.4 – 7.2) 0.2 (0.1 – 0.7)
BCL2 High 35 1678 8 4.8 (2.4 – 9.5) 1.0 (ref)
Low 15 758 3 4.0 (1.3 – 12.3) 0.6 (0.2 – 2.3)
Neg 17 741 5 6.7 (2.8 – 16.2) 1.8 (0.6 – 5.9)
Her2 Neg 36 1762 7 4.0 (1.9 – 8.3) 1.0 (ref)
Pos 31 1415 9 6.4 (3.3 – 12.2) 1.2 (0.4 – 3.4)
ER MH (pos) 32 1504 7 4.7 (2.2 – 9.8) 1.0 (ref)
NL (neg) 35 1673 9 5.4 (2.8 – 10.3) 1.1 (0.4 – 2.9)
Apop index < 3 25 804 4 5.0 (1.9 – 13.3) 1.0 (ref)
3 <5 28 816 6 7.4 (3.3 – 16.4) 1.8 (0.5 – 6.5)
5 <7 23 983 3 3.1 (1.0 – 9.5) 0.7 (0.2 – 3.1)
≥ 7 16 535 3 5.6 (1.8 – 17.4) 0.9 (0.89 – 0.99)
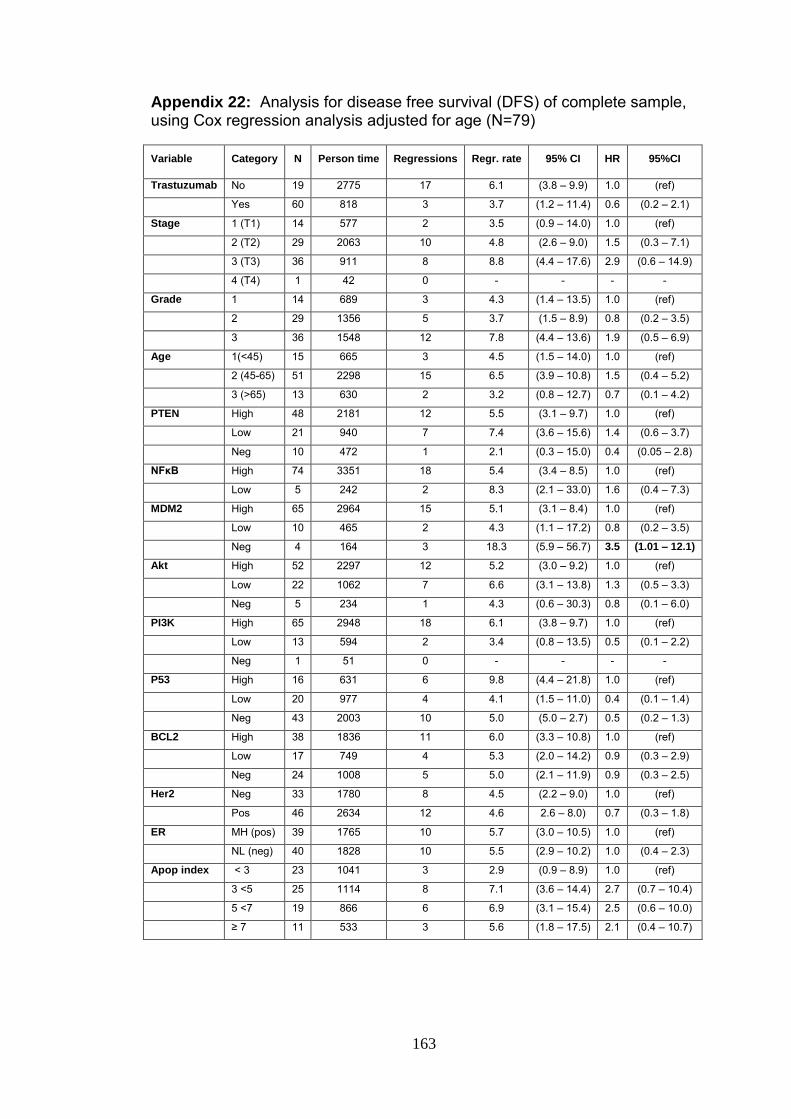
163
Appendix 22: Analysis for disease free survival (DFS) of complete sample, using Cox regression analysis adjusted for age (N=79)
Variable Category N Person time Regressions Regr. rate 95% CI HR 95%CI
Trastuzumab No 19 2775 17 6.1 (3.8 – 9.9) 1.0 (ref)
Yes 60 818 3 3.7 (1.2 – 11.4) 0.6 (0.2 – 2.1)
Stage 1 (T1) 14 577 2 3.5 (0.9 – 14.0) 1.0 (ref)
2 (T2) 29 2063 10 4.8 (2.6 – 9.0) 1.5 (0.3 – 7.1)
3 (T3) 36 911 8 8.8 (4.4 – 17.6) 2.9 (0.6 – 14.9)
4 (T4) 1 42 0 - - - -
Grade 1 14 689 3 4.3 (1.4 – 13.5) 1.0 (ref)
2 29 1356 5 3.7 (1.5 – 8.9) 0.8 (0.2 – 3.5)
3 36 1548 12 7.8 (4.4 – 13.6) 1.9 (0.5 – 6.9)
Age 1(<45) 15 665 3 4.5 (1.5 – 14.0) 1.0 (ref)
2 (45-65) 51 2298 15 6.5 (3.9 – 10.8) 1.5 (0.4 – 5.2)
3 (>65) 13 630 2 3.2 (0.8 – 12.7) 0.7 (0.1 – 4.2)
PTEN High 48 2181 12 5.5 (3.1 – 9.7) 1.0 (ref)
Low 21 940 7 7.4 (3.6 – 15.6) 1.4 (0.6 – 3.7)
Neg 10 472 1 2.1 (0.3 – 15.0) 0.4 (0.05 – 2.8)
NFκB High 74 3351 18 5.4 (3.4 – 8.5) 1.0 (ref)
Low 5 242 2 8.3 (2.1 – 33.0) 1.6 (0.4 – 7.3)
MDM2 High 65 2964 15 5.1 (3.1 – 8.4) 1.0 (ref)
Low 10 465 2 4.3 (1.1 – 17.2) 0.8 (0.2 – 3.5)
Neg 4 164 3 18.3 (5.9 – 56.7) 3.5 (1.01 – 12.1)
Akt High 52 2297 12 5.2 (3.0 – 9.2) 1.0 (ref)
Low 22 1062 7 6.6 (3.1 – 13.8) 1.3 (0.5 – 3.3)
Neg 5 234 1 4.3 (0.6 – 30.3) 0.8 (0.1 – 6.0)
PI3K High 65 2948 18 6.1 (3.8 – 9.7) 1.0 (ref)
Low 13 594 2 3.4 (0.8 – 13.5) 0.5 (0.1 – 2.2)
Neg 1 51 0 - - - -
P53 High 16 631 6 9.8 (4.4 – 21.8) 1.0 (ref)
Low 20 977 4 4.1 (1.5 – 11.0) 0.4 (0.1 – 1.4)
Neg 43 2003 10 5.0 (5.0 – 2.7) 0.5 (0.2 – 1.3)
BCL2 High 38 1836 11 6.0 (3.3 – 10.8) 1.0 (ref)
Low 17 749 4 5.3 (2.0 – 14.2) 0.9 (0.3 – 2.9)
Neg 24 1008 5 5.0 (2.1 – 11.9) 0.9 (0.3 – 2.5)
Her2 Neg 33 1780 8 4.5 (2.2 – 9.0) 1.0 (ref)
Pos 46 2634 12 4.6 2.6 – 8.0) 0.7 (0.3 – 1.8)
ER MH (pos) 39 1765 10 5.7 (3.0 – 10.5) 1.0 (ref)
NL (neg) 40 1828 10 5.5 (2.9 – 10.2) 1.0 (0.4 – 2.3)
Apop index < 3 23 1041 3 2.9 (0.9 – 8.9) 1.0 (ref)
3 <5 25 1114 8 7.1 (3.6 – 14.4) 2.7 (0.7 – 10.4)
5 <7 19 866 6 6.9 (3.1 – 15.4) 2.5 (0.6 – 10.0)
≥ 7 11 533 3 5.6 (1.8 – 17.5) 2.1 (0.4 – 10.7)

164
Appendix 23: Analysis of DFS of cohort of cases that has not trastuzumab treatment, using Cox regression analysis adjusted for age (N=60)
Variable Category N Person time Regressions Regr. rate 95% CI HR 95%CI
Stage 1 (T1) 7 370 1 2.7 (0.4 – 19.2) 1.0 (ref)
2 (T2) 36 1679 9 5.4 (2.8 – 10.3) 2.0 (0.2 – 15.5)
3 (T3) 16 684 7 10.2 (10.2 - 21.5) 3.9 (0.5 – 13.8)
4 (T4) 1 42 0 - - - -
Grade 1 12 602 3 5.0 (1.6 – 15.5) 1.0 (ref)
2 25 1184 5 4.2 (1.8 – 10.1) 0.8 (0.2 – 3.5)
3 23 989 9 9.1 (4.7 – 17.5) 2.0 (0.5 – 7.3)
Age 1(<45) 8 334 2 6.0 (1.5 – 24.0) 1.0 (ref)
2 (45-65) 44 2012 14 6.9 (4.1 – 11.7) 1.2 (0.3 – 5.1)
3 (>65) 8 422 1 2.4 (0.3 – 16.8) 0.4 (0.03 – 4.2)
PTEN High 35 1614 10 6.2 (3.3 – 11.5) 1.0 (ref)
Low 16 708 7 9.9 (4.7 – 20.7) 1.6 (0.6 – 4.2)
Neg 9 453 0 - - - -
NFκB High 55 2533 15 5.9 (3.6 – 9.8) 1.0 (ref)
Low 5 242 2 8.3 (2.1 – 33.0) 1.5 (0.3 – 6.8)
MDM2 High 47 2193 12 5.5 (3.1 – 9.6) 1.0 (ref)
Low 9 418 2 4.8 (1.2 – 19.1) 0.8 (0.2 – 3.8)
Neg 4 164 3 18.3 (5.9 – 56.7) 3.2 (0.9 – 11.3)
Akt High 33 1479 9 6.1 (3.2 – 11.7) 1.0 (ref)
Low 22 1062 7 6.6 (3.1 – 13.8) 1.1 (0.4 – 3.1)
Neg 5 234 1 4.3 (0.6 – 30.3) 0.7 (0.1 – 5.4)
PI3K High 50 2318 15 6.5 (3.9 – 10.7) 1.0 (ref)
Low 10 457 2 4.4 (1.1 – 17.5) 0.7 (0.1 – 2.9)
Neg 0 - 0 - - - -
P53 High 11 406 6 14.8 (6.6 – 32.9) 1.0 (ref)
Low 16 771 4 5.2 (1.9 – 13.8) 0.3 (0.1 – 1.1)
Neg 33 1598 7 4.4 (2.1 – 9.2) 0.3 (0.1 – 0.8)
BCL2 High 31 1498 9 6.0 (3.1 – 11.5) 1.0 (ref)
Low 13 580 4 6.9 (2.6 – 18.4) 1.2 (0.3 – 4.1)
Neg 16 697 4 5.7 (2.2 – 15.3) 1.0 (0.3 – 3.1)
Her2 Neg 33 1509 10 6.6 (3.6 – 12.3) 1.0 (ref)
Pos 27 1266 7 5.5 (2.6 – 11.6) 0.8 (0.3 – 2.2)
ER MH (pos) 29 1319 8 6.1 (3.0 – 12.1) 1.0 (ref)
NL (neg) 31 1456 9 6.2 (3.2 – 11.9) 1.0 (0.4 – 2.7)
Apop index < 3 17 784 4 3.8 (1.2 – 11.9) 1.0 (ref)
3 <5 17 757 6 7.9 (3.6 – 17.6) 2.2 (0.5 – 8.8)
5 <7 17 788 3 6.3 (2.6 – 15.2) 1.6 (0.4 – 6.9)
≥ 7 8 407 3 7.4 (2.4 – 22.9) 2.1 (0.4 – 10.2)
