evaluation of the inca project in bangladesh
TRANSCRIPT

Evaluation of the Improving Nutrition through Community Approaches (INCA) Project in Bangladesh Outcome and Impact Evaluation
October 2020Eval
uatio
n


Evaluation of the Improving Nutrition through Community Approaches (INCA) Project in BangladeshOutcome and Impact Evaluation
Shusmita Khan, D4I, UNC at Chapel Hill Gustavo Angeles, D4I, UNC at Chapel HillMizanur Rahman, D4I, UNC at Chapel HillNitai Chakraborty, D4I, UNC at Chapel HillM. Moinuddin Haider, icddr,bGabriela Escudero, D4I, UNC at Chapel HillKarar Zunaid Ahsan, D4I, UNC at Chapel HillRashida-E Ijdi, D4I, UNC at Chapel Hill
Data for Impact (D4I)
University of North Carolina at Chapel Hill123 West Franklin Street, Suite 330Chapel Hill, North Carolina 27516 USAPhone: 919-445-9350 | Fax: [email protected]
October 2020
Eval
uatio
n
This publication was produced with the support of the United States Agency for International Development (USAID) under the terms of the Data for Impact (D4I) associate award 7200AA18LA00008, which is implemented by the Carolina Population Center at the University of North Carolina at Chapel Hill, in partnership with Palladium International, LLC; ICF Macro, Inc.; John Snow, Inc.; and Tulane University. The views expressed in this publication do not necessarily reflect the views of USAID or the United States government. TRE-20-30 D4IISBN: 978-1-64232-263-7

2 Evaluation of the INCA Project in Bangladesh
Acknowledgments
We thank the United States Agency for International Development (USAID) for its support of this work.
Many people and organizations made this endline survey possible. We express our appreciation to the community women and household members who kindly participated in both of the surveys. We appreciate the support of the team members of the Improving Nutrition through Community Approaches (INCA) project—especially those on the leadership and evaluation teams. They provided the information and documents necessary to explain the project’s interventions and modalities and helped us better understand the project’s context. We thank Rehan Uddin Ahmed, Rafiq Islam, Lily Gomes, Humaira Alif, and Md. Harun Ar Rashid for their continuous support. Mitra and Associates conducted the survey in a characteristically efficient and professional manner, providing high-quality data processing and data editing and cleaning. We thank Mr. S.N. Mitra, Mr. Shahidul Islam, and other senior staff members for their efforts and dedication. We also thank Dr. Siân Curtis, who provided feedback on the design and supported many different stages of the survey.
The USAID mission in Dhaka provided financial support for this evaluation. We are particularly grateful to Dr. Kanta Jamil, USAID’s senior monitoring, evaluation, and research advisor, for her continued assistance, support, and encouragement. Dr. Jamil provided valuable and insightful suggestions at different stages of the design and analysis. Finally, we are thankful to MEASURE Evaluation’s knowledge management team for editorial, design, and production services.
Cover photos provided by the INCA Project.
Suggested citation:
Khan, S., Angeles, G., Rahman, M., Chakraborty, N., Moinuddin Haider, M., Escudero, G., Ahsan, K.Z., Ijdi, R.E. (2020). Evaluation of the Improving Nutrition through Community Approaches (INCA) Project in Bangladesh: Outcome and Impact Evaluation. Chapel Hill, NC, USA: Data for Impact.

Evaluation of the INCA Project in Bangladesh 3
Contents
Acknowledgments ............................................................................................................................................. 1
Figures .............................................................................................................................................................. 5
Tables ................................................................................................................................................................ 6
Abbreviations .................................................................................................................................................... 8
Executive Summary ........................................................................................................................................... 9
Background and Objective ........................................................................................................................ 9
Methods .................................................................................................................................................. 9
Main Findings ....................................................................................................................................... 10
Program Exposure .............................................................................................................................. 10
Nutrition Knowledge .......................................................................................................................... 10
Nutrition Practices ............................................................................................................................. 11
Use of Health Services ........................................................................................................................ 11
Nutritional Status ............................................................................................................................... 12
CNP and Health Facility Characteristics ............................................................................................. 13
Discussion ............................................................................................................................................. 13
Conclusion and Recommendations ......................................................................................................... 14
1. Introduction ............................................................................................................................................... 15
1.1. Country Context ............................................................................................................................. 15
1.2. The Development Problem .............................................................................................................. 15
2. USAID’s Response: The INCA Project ...................................................................................................... 17
2.1. Target Areas .................................................................................................................................... 18
3. Purpose of the Evaluation and Evaluation Questions .................................................................................. 19
3.1. Evaluation Questions ...................................................................................................................... 19
4. Evaluation Methods ................................................................................................................................... 20
4.1. Outcome Monitoring Design ........................................................................................................... 20
4.2. Impact Evaluation Design................................................................................................................ 20
4.3. Data ............................................................................................................................................... 21
4.3.1. Sampling Design ....................................................................................................................... 21
4.3.2. Data Collection ......................................................................................................................... 22
4.3.3. Balance between Treatment and Comparison Areas at Baseline .................................................. 23
4.4. Ethical Considerations ..................................................................................................................... 23
5. Results ....................................................................................................................................................... 24
5.1. Women’s Contact with INCA Interventions ..................................................................................... 24
5.1.1. Program Coverage: INCA Registration ...................................................................................... 24
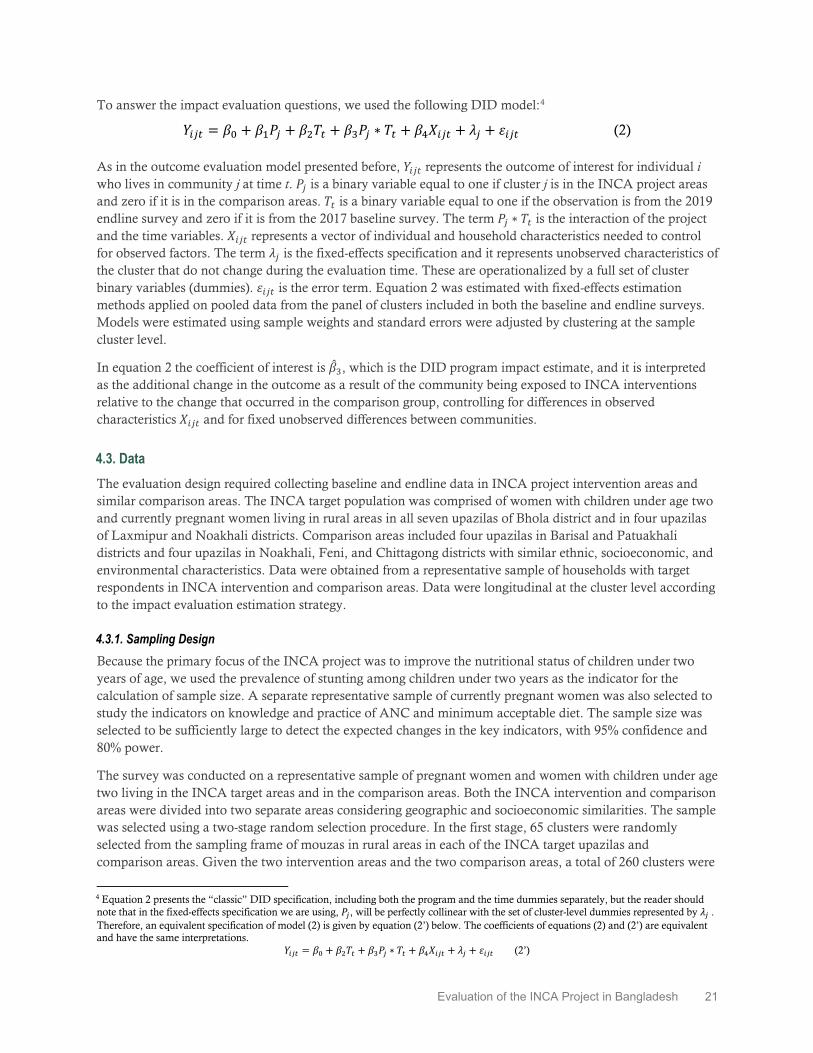
5.1.2. Exposure to INCA Activities: Mothers with Children Under Two Years of Age .......................... 24
5.1.3. Exposure to INCA Activities: Pregnant Women ........................................................................ 25
5.2. Nutrition-Related Knowledge .......................................................................................................... 25
5.2.1. Nutrition Knowledge of Mothers with Children Under Age Two ................................................ 26

4 Evaluation of the INCA Project in Bangladesh
5.2.2. Nutrition Knowledge of Pregnant Women ................................................................................. 27
5.3. Nutritional Practices ........................................................................................................................ 27
5.3.1.Nutritional Practices of Mothers with Children Under Two Years of Age .................................... 28
5.3.2. Nutritional Practices of Pregnant Women .................................................................................. 30
5.4. Awareness about Availability of Health Services ............................................................................... 31
5.4.1. Awareness of Health Services among Mothers with Children Under Two Years of Age ............... 31
5.4.2. Awareness of Health Services among Pregnant Women ............................................................. 32
5.5. Access to and Use of Health Facilities/Services ................................................................................ 33
5.5.1. Access to and Use of Health Services by Mothers with Children Under Two Years of Age .......... 33
5.5.2. Access and Use of Health Services by Pregnant Women ............................................................. 36
5.6. Nutritional Status ............................................................................................................................ 37
5.6.1. Mothers of Children Under Two Years of Age ........................................................................... 37
5.6.2. Stunting among Children Under Two Years of Age .................................................................... 38
5.6.3. Underweight among Children Under Two Years of Age ............................................................. 39
5.7. CNP and Health Facility Characteristics .......................................................................................... 40
5.7.1. CNP Characteristics .................................................................................................................. 40
5.7.2. CNP Workload ......................................................................................................................... 42
5.7.3. Health Facility Characteristics ................................................................................................... 43
6. Discussion ................................................................................................................................................. 44
6.1. About the Project and Key Findings ................................................................................................. 44
The Project......................................................................................................................................... 44
Key Findings ...................................................................................................................................... 44
6.2. Programmatic Implications .............................................................................................................. 45
6.3. Limitations ..................................................................................................................................... 47
6.4. Lessons Learned .............................................................................................................................. 47
7. Recommendations ..................................................................................................................................... 48
8. Conclusion ................................................................................................................................................. 49
9. References .................................................................................................................................................. 51
Appendix A. Summary Tables by INCA Project and Comparison Areas ........................................................... 52
Appendix B. Summary Tables by INCA-Registered and Non-Registered Participants ....................................... 54
Appendix C. INCA Endline Survey Detailed Tables ......................................................................................... 55
Appendix D. INCA Monitoring and Management Observations ....................................................................... 78
Questions for INCA Project ................................................................................................................... 78

Evaluation of the INCA Project in Bangladesh 5
Figures
Figure 1. Map of upazila areas, by intervention and comparison areas, Bangladesh INCA project ..................... 18
Figure 2. Registration to INCA project among mothers of children under age two and pregnant women, endline 2019 ..................................................................................................................................................... 24
Figure 3. Exposure to household and community activities in the last three months among mothers with children under age two, who are registered vs. non-registered with INCA, endline 2019 .................................... 25
Figure 4. Exposure to household and community activities in the last three months among pregnant women who are registered vs. non-registered with INCA, endline 2019 ......................................................................... 25
Figure 5. Percentage of children ages 6–23 months receiving a minimum acceptable diet in INCA and comparison areas during baseline and endline, endline 2019 .............................................................................. 28
Figure 6. Percentage of children ages 6–23 months receiving a minimum acceptable diet who are registered vs. non-registered with INCA, endline 2019 ...................................................................................................... 29
Figure 7. Percentage of lactating mothers consuming a diet of minimum diversity in INCA and comparison areas during baseline and endline, endline 2019 ................................................................................................ 29
Figure 8. Percentage of lactating mothers consuming a diet of minimum diversity who are registered vs. non-registered with INCA, endline 2019 ........................................................................................................... 30
Figure 9. Percentage of pregnant women consuming a diet of minimum diversity in INCA and comparison areas during baseline and endline, endline 2019 ................................................................................................ 30
Figure 10. Percentage of pregnant women consuming a diet of minimum diversity who are registered vs. non-registered with INCA, endline 2019 ........................................................................................................... 31
Figure 11. Percentage of lactating women with knowledge of available health services (at least two services) at targeted health facilities (community clinic) in INCA and comparison areas during baseline and endline, endline 2019 ..................................................................................................................................................... 32
Figure 12. Percentage of lactating women with knowledge of available health services (at least two services) at targeted health facilities (community clinic) who are registered vs. non-registered with INCA, endline 2019 ...... 32
Figure 13. Percentage of pregnant women with knowledge of available health services (at least two services) at targeted health facilities (community clinic) in INCA and comparison areas during baseline and endline, endline 2019 ..................................................................................................................................................... 33
Figure 14. Percentage of pregnant women with knowledge of available health services (at least two services) at targeted health facilities (community clinic) who are registered vs. non-registered with INCA, endline 2019 ...... 33
Figure 15. Percentage of children under age two receiving any nutrition services and/or counselling from health facilities in the last three months in INCA and comparison areas during baseline and endline, endline 2019 ...... 34
Figure 16. Percentage of children under age two receiving any nutrition services and/or counselling from health facilities in the last three months who are registered vs. non-registered with INCA, endline 2019 ............ 34
Figure 17. Percent of children under age two receiving growth monitoring services in the last three months in INCA and comparison areas during baseline and endline, endline 2019 ............................................................ 35
Figure 18. Percent of children under age two receiving growth monitoring services in the last three months who are registered vs. non-registered with INCA, endline 2019 ......................................................................... 35
Figure 19. Percentage of pregnant women seeking any nutrition services/counselling from health facilities in the last three months in INCA and comparison areas during baseline and endline, endline 2019........................ 37
Figure 20. Percentage of pregnant women seeking any nutrition services/counselling from health facilities in the last three months who are registered vs. non-registered with INCA, endline 2019 ........................................ 37
Figure 21. Prevalence of underweight among mothers with children under age two in INCA and comparison areas during baseline and endline, endline 2019 ................................................................................................ 38

6 Evaluation of the INCA Project in Bangladesh
Figure 22. Prevalence of underweight among mothers with children under age two who are registered vs. non-registered with INCA, endline 2019 ........................................................................................................... 38 Figure 23. Prevalence of stunting among children ages 0–23 months in INCA and comparison areas during baseline and endline, endline 2019 .................................................................................................................... 39
Figure 24. Prevalence of stunting among children ages 0–23 months who are registered vs. non-registered with INCA, endline 2019 .................................................................................................................................. 39
Figure 25. Prevalence of underweight among children ages 0–23 months in INCA and comparison areas during baseline and endline, endline 2019 ......................................................................................................... 40
Figure 26. Prevalence of underweight among children ages 0–23 months who are registered vs. non-registered with INCA, endline 2019 .................................................................................................................................. 40
Tables
Table I. Nutrition-related knowledge indicators by INCA and comparison areas, and program impact .............. 10
Table II. Nutritional practice-related indicators by INCA and comparison areas, and program impact ............... 11
Table III. Use of health services-related indicators by INCA and comparison areas, and program impact .......... 12 Table IV. Nutritional status-related indicators by INCA and comparison areas, and program impact ................. 12
Table 1. Nutrition knowledge of mothers with children under two years of age in INCA and comparison areas during baseline and endline, endline 2019 ................................................................................................ 26
Table 2. Nutrition knowledge of mothers with children under two years of age who are registered vs. non-registered with INCA, endline 2019 ........................................................................................................... 27
Table 3. Nutrition knowledge of pregnant women in INCA and comparison areas during baseline and endline, endline 2019 ........................................................................................................................................ 27
Table 4. Nutrition knowledge of pregnant women who are registered vs. non-registered with INCA, endline 2019 .. 27
Table 5. Maternal health care indicators among mother with children under two years of age in INCA and comparison areas during baseline and endline, endline 2019 .............................................................................. 36
Table 6. Maternal health care indicators among mothers with children under two years of age who are registered vs. non-registered with INCA, endline 2019...................................................................................... 36
Table 7. CNP presence in survey clusters and individual characteristics, endline 2019 ....................................... 41
Table 8. CNP workload, total monthly and per CNP ........................................................................................ 42
Table 9. Facility readiness in INCA and comparison areas during baseline and endline, endline 2019 ............... 43
Table 10. Evidence from INCA endline and recommendations, endline 2019 .................................................... 48
Table A.1. Indicators by project and comparison area, by baseline and endline, by difference between endline and baseline in project and comparison area, simple DID, and impact .............................................................. 52
Table B.1. Indicator summary table by INCA registration status, project area, 2019 endline .............................. 54
Table C.1. Percentage of lactating women with appropriate knowledge of exclusive breastfeeding, by background characteristics, INCA 2017 baseline and 2019 endline .................................................................... 55
Table C.2. Percentage of mothers with 0-23 months children with knowledge of minimum acceptable diet, by background characteristics, INCA 2017 baseline and 2019 endline ............................................................... 56
Table C.3. Percentage of mothers of 0-23 months children with knowledge of critical times when hand washing with soap is necessary, by background characteristics, INCA 2017 baseline and 2019 endline .............. 57
Table C.4. Percentage of pregnant women with knowledge of proper diet during pregnancy, by background characteristics, INCA 2017 baseline and 2019 endline ....................................................................................... 58

Evaluation of the INCA Project in Bangladesh 7
Table C.5. Percentage of lactating mothers of children ages 0-23 months consuming a diet of minimum diversity, by background characteristics, INCA 2017 baseline and 2019 endline ................................................ 59
Table C.6. Percentage of children ages 0-23 months who initiated breastfeeding within one hour of birth, by background characteristics, INCA 2017 baseline and 2019 endline ............................................................... 60
Table C.7. Percentage of children ages 0-5 months exclusively breastfed, by background characteristics, INCA 2017 baseline and 2019 endline .............................................................................................................. 61
Table C.8. Percentage of children ages 6-23 months receiving a minimum acceptable diet, by background characteristics, INCA 2017 baseline and 2019 endline ....................................................................................... 62
Table C.9. Percentage of pregnant women consuming a diet of minimum diversity, by background characteristics, INCA 2017 baseline and 2019 endline ....................................................................................... 63
Table C.10. Percentages of lactating women with knowledge of at least two health services at targeted community clinics, by background characteristics, INCA 2017 baseline and 2019 endline ................................. 64
Table C.11. Percentages of pregnant women with knowledge of at least two health services at targeted community clinics, by background characteristics, INCA 2017 baseline and 2019 endline ................................. 65
Table C.12. Percentage of children ages 0–23 months who received nutrition services or counseling from health facilities in the last three months, by background characteristics, INCA 2017 baseline and 2019 endline .. 66
Table C.13. Percentage of children ages 0–23 months who received growth monitoring services from a health facility in the last three months, by background characteristics, INCA 2017 baseline and 2019 endline .... 67
Table C.14. Percentage of births who received ANC4+ with at least one from MTP, by background characteristics, INCA 2017 baseline and 2019 endline ...................................................................................... 68
Table C.15. Percentage of deliveries by SBA, by background characteristics, INCA 2017 baseline and 2019 endline ..................................................................................................................................................... 69
Table C.16. Percentage of births who received PNC from MTP, by background characteristics, INCA 2017 baseline and 2019 endline ................................................................................................................................ 70
Table C.17. Percentage of pregnant women seeking any nutrition services/counseling from health facilities in the last three months, by background characteristics, INCA 2017 baseline and 2019 endline .......................... 71
Table C.18. Percentage of mothers of children ages 6–23 months who are under-weight (BMI<18.5), by background characteristics, INCA 2017 baseline and 2019 endline ............................................................... 72
Table C.19. Percentage of children ages 0–23 months who are stunted, by background characteristics, INCA 2017 baseline and 2019 endline .............................................................................................................. 73
Table C.20. Percentage of children ages 0–23 months who are stunted, by background characteristics, INCA 2017 baseline and 2019 endline .............................................................................................................. 74
Table C.21. Background characteristics of mothers of children under two years of age, INCA 2017 baseline and 2019 endline ............................................................................................................................................... 75
Table C.22. Background characteristics of pregnant women, INCA 2017 baseline and 2019 endline .................. 76
Table C.23. Background of children ages 0–23 months, by background characteristics, INCA 2017 baseline and 2019 endline .............................................................................................................................................. 77
8 Evaluation of the INCA Project in Bangladesh
Abbreviations
ANC antenatal care
BDHS Bangladesh demographic and health survey
BMI body mass index
CC community clinic
CCSG community clinic support group
CHSG community health support group
CNP community nutrition promoters
CNSG community nutrition support group
DID difference-in-differences
FWC family welfare center
GMP growth monitoring and promotion
HPNSP health, population, and nutrition sector program
INCA improving nutrition through community-based approaches
IR intermediate results
IYCF infant and young child feeding
MAD minimum acceptable diet
MCH maternal and child health
MEL monitoring, evaluation, and learning
MTP medically-trained provider
MUAC mid-upper arm circumference
NNS national nutrition services
PNC postnatal care
SBA skilled birth attendant
SBCC social behavior change communication
UHC upazila health complex
UNICEF United Nations Children’s Fund
UNFWC union health and family welfare center
USAID United States Agency for International Development
WIC women information centers
WHO World Health Organization

Evaluation of the INCA Project in Bangladesh 9
Executive Summary
Background and Objective This document is an endline report resulting from the evaluation of USAID/Bangladesh’s Improving Nutrition through Community-Based Approaches (INCA) project, which was designed to provide a comprehensive set of community and service strengthening activities with the objective of strengthening nutrition knowledge, practices, and use of services to improve the nutritional status of pregnant women and children under age two (0–23 months) living in selected areas in southern Bangladesh. INCA was a three-year project (May 2017‒May 2020) with the specific objective to improve nutritional practices during the “first 1,000 days of life” to prevent irreversible stunting in children under the age of two. The project was implemented by Caritas Bangladesh and United Purpose. The INCA project was targeted to “1,000-day households” (households having pregnant women, lactating mothers, and children age two or younger) located in 11 hard-to-reach and disadvantaged coastal upazilas of the Bhola, Laxmipur, and Noakhali districts (an estimation suggests that there were about 3,004,228 people, including 106,420 pregnant women, and 100,407 live births, in 2015 in these upazilas). INCA used an array of interventions implemented mainly through a core of about 471 community nutrition promoters (CNPs). The CNPs counselled pregnant women and mothers of children under age two through sessions at the household, community, and facility levels. In addition, the project facilitated linking women and communities with health facilities (predominantly community clinics [CCs] and family welfare centers [FWCs]). INCA also built the nutrition skills of selected members from existing community clinic-based support groups (CCSGs) to act as nutrition focal points and to form community nutrition support groups (CNSGs).
The overall purpose of the INCA evaluation was to assess how well the project achieved those objectives, by examining changes in key population-level indicators of knowledge, practices, use of services, and nutritional status between the 2017 baseline and the 2019 endline surveys. Findings from this evaluation will serve three purposes: 1) to establish the impact of INCA interventions on a rural and undernourished area of the country; 2) to help USAID/Bangladesh design future nutrition interventions; and 3) to promote learning for other government or donor-funded projects that work in the field of nutrition. This evaluation also adds to the common evidence base of community-based interventions in low- and middle-income countries.
Methods The evaluation consisted of baseline and endline surveys, conducted in September 2017–October 2017 and December 2019–January 2020, respectively, with mothers with children under two years and pregnant women in the project and comparison areas (eight upazilas bordering/neighboring the INCA areas). The evaluation was based on a prospective, quasi-experimental difference-in-differences (DID) design and used data from representative household surveys conducted in the 2017 baseline and 2019 endline. The endline survey was conducted on a representative sample of pregnant women and women with children under age two living in the INCA target areas and in the comparison areas. In total, 5,810 households were surveyed in INCA intervention areas and 5,271 households in comparison areas, along with 457 facilities and 272 out of 471 CNPs, in the endline survey—the sample size was selected to be sufficiently large to detect the expected changes in the key indicators, with 95% confidence and 80% power.
Data were collected through face-to-face interviews to ensure confidentiality. Informed consent was obtained from participants prior to the interview, and ethical clearance for the study protocol and data collection instruments was obtained from the Bangladesh Medical Research Council and the University of North Carolina at Chapel Hill Institutional Review Board.

10 Evaluation of the INCA Project in Bangladesh
Main Findings Program Exposure Registration of eligible women (mothers with children under age two and pregnant women) in INCA intervention areas was low—only 37% of mothers with children under age two and 23% of pregnant women reported that their households were registered with the project. Exposure to any INCA interventions (covering an array of activities at the household and community levels) in the three months before the endline survey was 54% among INCA-registered pregnant women and 27% among registered mothers with children under age two. Only 2% of non-registered pregnant women and mothers with children under age two reported having exposure to any INCA interventions. Thus, overall, only 15% of pregnant women and 12% of mothers with children under age two in the INCA intervention areas reported any exposure to the key INCA activities in the three months prior to the endline survey. Since the proportion of registered households reported was low, INCA program performance is also assessed by examining whether in INCA intervention areas registered members’ nutrition knowledge, practices, and status were significantly different from those who were not registered with INCA.
Nutrition Knowledge Three out of four key knowledge indicators improved significantly in INCA project areas between baseline and endline (see Table I). In INCA areas, the percentage of mothers with children ages 6–23 months with knowledge of minimum acceptable diet improved significantly (p<0.01) and the DID model shows that INCA had a significant program impact (p<0.01).
In INCA areas, appropriate knowledge of exclusive breastfeeding among lactating mothers improved significantly (p<0.01) and substantively (by 17.7 percentage points); knowledge of critical times when handwashing with soap is necessary among mothers of children under age two also improved significantly (p<0.05). However, the DID model did not show any significant program impact for these two indicators.
The proportion of pregnant women with knowledge of proper diet during pregnancy shows a slight decrease in INCA areas but the change was not statistically significant. In comparison areas, this knowledge level decreased substantively (by 17 percentage points). Thus, the DID model shows a significant program impact in this indicator (p<0.01), implying that INCA was effective in preventing a decline in the level of knowledge.
In INCA areas at endline, knowledge levels on all four indicators were slightly higher among registered women compared to women who were not registered, but the differences were not statistically significant for any of the knowledge indicators. This may indicate some spill-over effects of knowledge from program participants to nonparticipants.
Table I. Nutrition-related knowledge indicators by INCA and comparison areas, and program impact
Indicators
INCA intervention area (%)
Comparison area (%) Program
impact (DID) B E
Diff (E-B) B E
Diff (E-B)
Percentage of lactating women with appropriate knowledge of exclusive breastfeeding 55.1 72.8 17.7**
* 54.1 69.1 15.0*** No (3.4)
Percentage of mothers with 6-23 months children with knowledge of minimum acceptable diet 68.1 82.2 14.1**
* 64.3 71.3 7.0*** Yes (6.6***)
Percentage of mothers of 0-23 months children with knowledge of critical times when hand washing with soap is necessary
26.8 30.0 3.2** 34.2 33.5 -0.7 No (4.0)
Percentage of pregnant women with knowledge of proper diet during pregnancy 62.5 60.8 -1.6 70.4 53.2 -
17.1*** Yes
(-15.9***) B=Baseline survey, Sept. 2017‒Jan. 2019; E=Endline survey, Nov. 2019‒Jan. 2020; *** p<0. 01; **p<0.05; the DID impact estimates are presented in parenthesis.

Evaluation of the INCA Project in Bangladesh 11
Nutrition Practices Three out of four key nutritional practice indicators improved significantly in INCA areas between baseline and endline (see Table II), but the improvement was similar in both INCA and comparison areas. The proportion of children under age six months exclusively breastfeed was high at baseline and it increased from 84% to 87% in INCA areas between baseline and endline, but the change was not significant. A significant increase (p<0.05) in exclusive breastfeeding was observed in comparison areas. The DID model did not show any significant program impact. The proportion of exclusive breastfeeding among INCA-registered mothers was similar to non-registered mothers.
The proportion of lactating mothers consuming a diet of minimum diversity and the proportion of children ages 6–23 months receiving a minimum acceptable diet increased significantly in both INCA and comparison areas. The proportion of pregnant women consuming a diet of minimum diversity increased significantly between baseline and endline in the INCA intervention areas. Similar significant (p<0.01) increases also occurred in comparison areas, thus the DID model did not find any significant program impact. The proportion consuming a diet of minimum diversity among INCA-registered lactating mothers was significantly (p<0.05) higher (60%) than that of non-registered lactating mothers (55%).
Table II. Nutritional practice-related indicators by INCA and comparison areas, and program impact
Indicators
INCA intervention area (%)
Comparison area (%) Program
impact (DID) B E
Diff (E-B) B E
Diff (E-B)
Percentage of children ages 0-5 months exclusively breastfed 83.7 87.3 3.5 79.2 84.3 5.2** No
(-1.5) Percentage of lactating mothers of children ages 0-23 months consuming a diet of minimum diversity 48.3 56.8 8.5*** 51.5 59.9 8.4*** No
(0.3) Percentage of pregnant women consuming a diet of minimum diversity 52.3 62.1 9.7*** 59.2 66.7 7.5*** No
(2.8) Percentage of children ages 6-23 months receiving a minimum acceptable diet 30.3 33.5 3.2** 30.5 32.8 2.3 No
(1.4) B=Baseline survey, Sept. 2017‒Jan. 2019; E=Endline survey, Nov. 2019‒Jan. 2020; *** p<0.01; **p<0.05; the DID impact estimates are presented in parenthesis.
The proportion of children ages 6–23 months receiving a minimum acceptable diet increased significantly (p<0.05) between baseline and endline in INCA areas. However, this increase was not large enough for the DID model to show any significant program impact. The proportion receiving a minimum acceptable diet among INCA-registered children was significantly (p<0.01) higher (37%) than non-registered children (31%).
Use of Health Services In INCA areas, the proportion of children under age two receiving growth monitoring and promotion from a health facility in the last three months prior to the survey increased notably and significantly (p<0.01) between baseline and endline (see Table III), but the DID model does not show any program impact since a similar increase in seeking nutrition-related services was observed in comparison areas. However, in INCA intervention areas, the proportion receiving growth monitoring services among INCA-registered children was double (16%) that of non-registered children (8%), and the difference was statistically significant (p<0.01).

12 Evaluation of the INCA Project in Bangladesh
Table III. Use of health services-related indicators by INCA and comparison areas, and program impact
Indicators
INCA intervention area (%)
INCA comparison area (%) Program
impact (DID) B E
Diff (E-B) B E
Diff (B-E)
Percentage of children ages 0-23 months who received growth monitoring services from a health facility in the last 3 months 3.0 11.0 8.0*** 4.6 13.6 9.0*** No
(-1.1) Percentage of pregnant women seeking any nutrition services/counseling from health facilities in the last 3 months 6.5 24.9 18.4*** 12.1 23.8 11.7**
* No
(5.8) Percentage of births who received ANC4+ with at least one from a medically trained provider 15.1 17.7 2.7** 23.5 24.2 0.7 No
(2.7) B=Baseline survey, Sept 2017‒Jan. 2019; E=Endline survey, Nov. 2019‒Jan. 2020; *** p<0.01; **p<0.05; the DID impact estimates are presented in parenthesis.
The percentage of pregnant women seeking any nutrition services/counselling from health facilities increased significantly (p<0.01) in INCA and comparison areas; the DID model shows no statistically significant program impact for this indicator. However, seeking nutrition services among INCA-registered pregnant women was significantly (p<0.01) higher (42%) than non-registered pregnant women (20%).
The percentage of births who received at least four antenatal care visits (ANCs), with at least one from a medically-trained provider (MTP) increased by 2.7 percentage points and was statistically significant (p<0.05), but this increase was not large enough to show any program impact in the DID model. The proportion of live births that received 4+ ANCs among INCA-registered participants was significantly (p<0.01) higher (22%) than non-registered participants (15%).
Nutritional Status The prevalence of underweight among mothers with children under age two decreased significantly (p<0.01) in both INCA and comparison areas (see Table IV). However, the DID model did not find any significant program impact. The prevalence of underweight among INCA-registered mothers was significantly (p<0.05) lower than non-registered mothers (16% and 20%, respectively).
The prevalence of stunting among children under age two (0–23 months) increased similarly between baseline and endline in both INCA and comparison areas, and the change was not statistically significant in either area. The DID model did not find any significant change in stunting levels during this period. The level of stunting among INCA-registered and non-registered children remained the same.
Between baseline and endline, the prevalence of underweight among children under age two (0–23 months) decreased significantly (p<0.01) in both INCA and comparison areas. The decline was greater in INCA areas compared to comparison areas. The DID model shows a statistically significant (p<0.05) program impact in reducing underweight among children. The prevalence of underweight remained almost similar among INCA-registered and non-registered children (17% and 18%, respectively).
Table IV. Nutritional status-related indicators by INCA and comparison areas, and program impact
Indicators
INCA intervention area
INCA comparison area Program
impact (DID) B E
Diff (E-B) B E
Diff (E-B)
Percentage of mothers of children ages 6-23 months who are under-weight (BMI<18.5) 24.1 18.0 -6.0*** 19.9 15.8 -4.2*** No
(-1.2) Percentage of children ages 0-23 months who are stunted 28.6 30.7 2.1 22.6 24.7 2.1 No
(-0.15) Percentage of children ages 0-23 months who are under-weight 24.4 17.8 -6.6*** 18.8 15.1 -3.7*** Yes
(-2.9**) B=Baseline survey, Sept. 2017‒Jan. 2019; E=Endline survey, Nov. 2019‒Jan. 2020; *** p<0.01; **p<0.05; the DID impact estimates are presented in parenthesis.

Evaluation of the INCA Project in Bangladesh 13
CNP and Health Facility Characteristics CNPs were present in 98% of the endline clusters and almost all (99%) had received the basic training provided by INCA. However, the management information system (MIS) information provided by the project indicated that one-third (34%) of the CNPs dropped out at some point during project implementation. The project MIS also indicated a heavy daily workload for CNPs. On average, each CNP visited 10 women and conducted three meetings of courtyard sessions or food demonstrations per day, allowing only 15 to 20 minutes of actual information exchange between recipients and the CNPs. This time might not have been sufficient to provide individual and effective communication efforts. Also, an hourly session of courtyard meeting and food demonstration might have not been sufficient to draw the individual attention of participants, mainly because the CNPs had to spend time inviting and gathering the target participants from the neighborhood.
Facility assessments in the endline evaluation found that all the sampled facilities offered nutrition services and had staff in charge of these activities. Between baseline and endline, the proportion of facilities with at least one staff trained in growth monitoring and promotion (GMP) in the last two years increased in INCA areas but decreased in comparison areas. In terms of availability of resources, presence of GMP guidelines increased by 15 percentage points in INCA areas, and by 38 percentage points in comparison areas. Availability of other relevant resources like mid-upper arm circumference (MUAC) tape, child growth charts, and height-for-age tables decreased in both INCA and comparison areas.
Discussion INCA’s program reach was low—that is, it could not register1
1 The INCA program MIS indicates a higher level of registration of the target population than reported in the survey. It is possible that survey respondents could not recall being registered by CNPs or did not understand what was meant by “being registered” by the INCA program. However, the non-registered respondents hardly had any exposure to INCA interventions. An estimation based on the INCA MIS data indicates that a substantial proportion of the target population was not reached.
a notable proportion of the target population, women with children under age two and pregnant women. The limited coverage of the target population is likely associated with CNPs’ lack of skills in identifying mothers with children under two years of age and pregnant women. In addition, exposure to INCA interventions among the registered population was also low, particularly among women with children under the age of two. Heavy workloads of the CNPs might have led to low intensity of communication inputs and thus less intervention effect. Despite low registration and inadequate exposure to INCA interventions among those registered, most nutrition knowledge, practice, status, and health care use indicators show statistically significant improvements in INCA intervention areas. However, similar improvements were also observed in comparison areas for most of the indicators.
INCA’s impact was quite limited—it had the program effect of improving a couple of nutrition knowledge indicators and underweight among children under age two. It is very difficult to see program impact with program reach as low as is seen here. Also, the extent of improvements on nutrition knowledge, practice, and status were low to moderate for most indicators in INCA intervention areas. Some other possible reasons for the program’s limited impact could be that INCA interventions were implemented in hard to reach coastal areas and the socioeconomic status of the population in these areas was somewhat worse than for those in comparison areas. There were also inadequacies in the facilities to provide appropriate nutrition and growth monitoring services. The project intervention implementation period was relatively short; it may take a longer period of time to transform community norms for eating/feeding practices of appropriate food consumption that ensures diversified nutrients, vitamins, and minerals. Another reason for the low level of change in nutrition knowledge and behavior is the possibility that the information and messages the project staff (mostly CNPs) provided, and the demonstrations shown, were not internalized by the recipients, and thus did not lead to actual changes in feeding practices and nutritional outcomes. Pre- or field-testing of the messages in the project area prior to the full-fledged implementation would have helped to enhance the effectiveness of the messages provided.
Obtaining a comparison group with similar characteristics to the INCA areas was a limitation for the impact evaluation. We included control variables and cluster-level fixed effects in the impact estimation models, but it is likely that other time-varying unobserved factors influencing the outcomes examined in the evaluation were
14 Evaluation of the INCA Project in Bangladesh
not controlled for appropriately. If that is the case, the “parallel trends” assumption—on which the validity of DID models rest—will not be held.
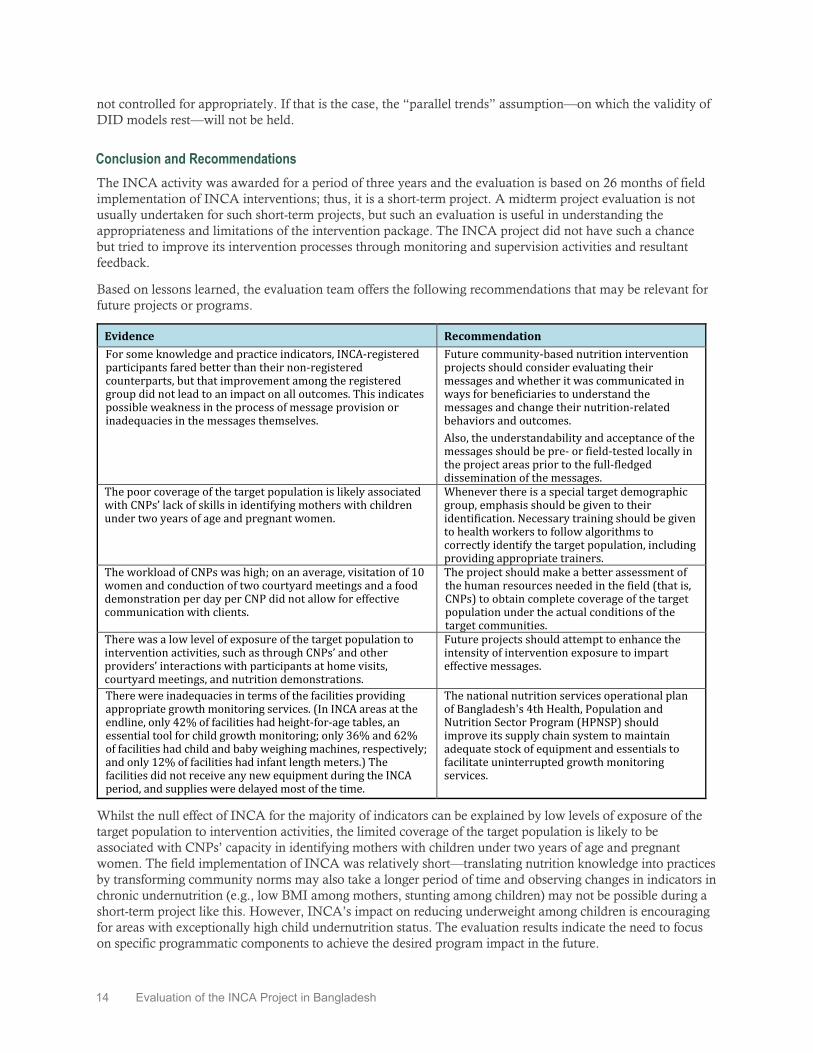
Conclusion and Recommendations The INCA activity was awarded for a period of three years and the evaluation is based on 26 months of field implementation of INCA interventions; thus, it is a short-term project. A midterm project evaluation is not usually undertaken for such short-term projects, but such an evaluation is useful in understanding the appropriateness and limitations of the intervention package. The INCA project did not have such a chance but tried to improve its intervention processes through monitoring and supervision activities and resultant feedback.
Based on lessons learned, the evaluation team offers the following recommendations that may be relevant for future projects or programs.
Evidence Recommendation For some knowledge and practice indicators, INCA-registered participants fared better than their non-registered counterparts, but that improvement among the registered group did not lead to an impact on all outcomes. This indicates possible weakness in the process of message provision or inadequacies in the messages themselves.
Future community-based nutrition intervention projects should consider evaluating their messages and whether it was communicated in ways for beneficiaries to understand the messages and change their nutrition-related behaviors and outcomes. Also, the understandability and acceptance of the messages should be pre- or field-tested locally in the project areas prior to the full-fledged dissemination of the messages.
The poor coverage of the target population is likely associated with CNPs’ lack of skills in identifying mothers with children under two years of age and pregnant women.
Whenever there is a special target demographic group, emphasis should be given to their identification. Necessary training should be given to health workers to follow algorithms to correctly identify the target population, including providing appropriate trainers.
The workload of CNPs was high; on an average, visitation of 10 women and conduction of two courtyard meetings and a food demonstration per day per CNP did not allow for effective communication with clients.
The project should make a better assessment of the human resources needed in the field (that is, CNPs) to obtain complete coverage of the target population under the actual conditions of the target communities.
There was a low level of exposure of the target population to intervention activities, such as through CNPs’ and other providers’ interactions with participants at home visits, courtyard meetings, and nutrition demonstrations.
Future projects should attempt to enhance the intensity of intervention exposure to impart effective messages.
There were inadequacies in terms of the facilities providing appropriate growth monitoring services. (In INCA areas at the endline, only 42% of facilities had height-for-age tables, an essential tool for child growth monitoring; only 36% and 62% of facilities had child and baby weighing machines, respectively; and only 12% of facilities had infant length meters.) The facilities did not receive any new equipment during the INCA period, and supplies were delayed most of the time.
The national nutrition services operational plan of Bangladesh's 4th Health, Population and Nutrition Sector Program (HPNSP) should improve its supply chain system to maintain adequate stock of equipment and essentials to facilitate uninterrupted growth monitoring services.
Whilst the null effect of INCA for the majority of indicators can be explained by low levels of exposure of the target population to intervention activities, the limited coverage of the target population is likely to be associated with CNPs’ capacity in identifying mothers with children under two years of age and pregnant women. The field implementation of INCA was relatively short—translating nutrition knowledge into practices by transforming community norms may also take a longer period of time and observing changes in indicators in chronic undernutrition (e.g., low BMI among mothers, stunting among children) may not be possible during a short-term project like this. However, INCA’s impact on reducing underweight among children is encouraging for areas with exceptionally high child undernutrition status. The evaluation results indicate the need to focus on specific programmatic components to achieve the desired program impact in the future.

Evaluation of the INCA Project in Bangladesh 15
1. Introduction
This document is the endline report of the evaluation of USAID/Bangladesh’s Improving Nutrition through Community-Based Approaches (INCA) project. INCA was designed to provide a comprehensive set of community and service strengthening activities with the objective of improving nutrition knowledge, practices, and use of services, which will lead to improvements in the nutritional status of pregnant women and children under age two living in selected areas in southern Bangladesh. The overall purpose of the INCA evaluation presented here is to assess how well the project achieved those objectives. To that end, the evaluation included an outcome monitoring component which tracked changes in key population-level indicators of knowledge, practices, use of services, and nutritional status between the 2017 baseline and the 2019 endline surveys. The evaluation also included an impact evaluation to assess the impact of the INCA interventions on those key indicators in the project target population.
Findings from this evaluation will serve three purposes: 1) to establish the impact of INCA interventions on a rural and undernourished area of the country; 2) to help USAID/Bangladesh design future nutrition interventions; and 3) to promote learning for other government or donor-funded projects that work in the field of nutrition. This evaluation also adds to the common evidence base of community-based interventions in low- and middle-income countries.
1.1. Country Context Despite the challenge of having one of the highest population densities in the world, Bangladesh has made important improvements in regards to the health of its population in recent decades. Between 1990 and 2017, life expectancy in the country has increased from 56 to 72 years, and utilization of critical reproductive health services has increased steadily during this period—antenatal care (ANC) from a skilled provider increased from 20% to 82%, and the proportion of births delivered by a skilled birth attendant (SBA) increased from 9% to 53% (BBS, 1994; BBS, 2018; NIPORT & ICF, 2019). The prevalence of underweight in children under five years of age declined from 66% in 1990 to 22% in 2017, which exceeded the Millennium Development Goals (MDG) target for the country. The under-five mortality rate was reduced to 45 per 1,000 live births in 2017, also exceeding the MDG target. During this period, overall socioeconomic status also improved in Bangladesh—the country moved from being “low-income” to “lower-middle-income” country status in 2014 due to rapid economic growth, and the poverty rate decreased from 57% to 24% between 1990 and 2017 (Government of Bangladesh [GOB], 2018). With support from USAID and several other donor-funded interventions, Bangladesh has made notable progress in reducing stunting and the underlying causes of malnutrition in recent years. Estimates show a 12% reduction in childhood stunting and a 16% reduction in the prevalence of poverty in the areas where the USAID-supported Feed the Future program has worked since 2011 (Feed the Future, 2020). National vitamin A campaigns, implemented by the GOB with support from UNICEF, deliver vitamin A supplements twice per year to children ages 6‒59 months and reach an estimated 79% of children (NIPORT & ICF, 2019). USAID and GOB-funded Population Services International established the Social Marketing Company, which supplies 55% of all commercially prepared oral rehydration packets across Bangladesh through a wide network of pharmacies (Mosites, et al., 2012).
1.2. The Development Problem Despite this notable progress, the overall state of malnutrition among children and women in Bangladesh remains unacceptably high. According to the most recent Bangladesh Demographic and Health Survey (BDHS) in 2017, stunting remains at a high rate of 31% of children under age five, and nearly one-in-10 children under age five are severely stunted. Inadequate household food security and diet diversity, inadequate maternal and childcare, insufficient services, and an unhealthy environment are the main causes of malnutrition in the country, with only one-in-three children ages 6–23 months being fed appropriately

16 Evaluation of the INCA Project in Bangladesh
according to the recommended infant and young child feeding (IYCF) practices. There also exists notable geographic variation in terms of childhood nutritional status—stunting prevalence is 29% higher in rural areas compared with urban areas, and both the divisions (Barishal and Chattogram) where the INCA program has been implemented fare worse than the national average for childhood stunting and IYCF practices (NIPORT & ICF, 2019).
Earlier estimates from the Multiple Indicator Cluster Survey (MICS) 2012–2013 showed stunting prevalence at 49% in both Bhola and Noakhali districts, and 45% in Laxmipur (BBS & UNICEF, 2014). Such high levels of stunting are an indication of chronic malnutrition and give an indication of the prevailing environmental and socioeconomic situation that results in low levels of nutrition-related knowledge and low utilization of nutrition and health services, particularly in the rural areas within the lowlands of South-Central Bangladesh. This will have a long term impact on the physical and cognitive development of the children in these districts that will further hinder their educational attainment, economic productivity, and health status for their entire lives, which fuels a perpetual cycle of poverty (Haddad, 2002).
Evaluation of the INCA Project in Bangladesh 17
2. USAID’s Response: The INCA Project
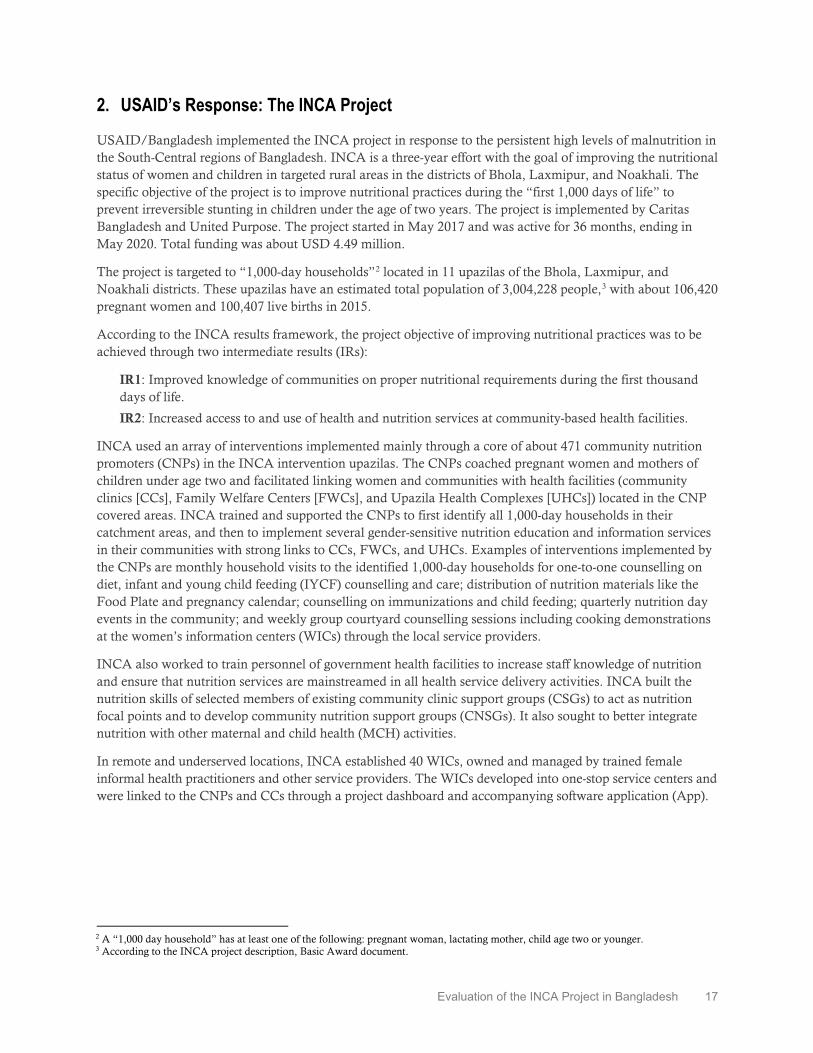
USAID/Bangladesh implemented the INCA project in response to the persistent high levels of malnutrition in the South-Central regions of Bangladesh. INCA is a three-year effort with the goal of improving the nutritional status of women and children in targeted rural areas in the districts of Bhola, Laxmipur, and Noakhali. The specific objective of the project is to improve nutritional practices during the “first 1,000 days of life” to prevent irreversible stunting in children under the age of two years. The project is implemented by Caritas Bangladesh and United Purpose. The project started in May 2017 and was active for 36 months, ending in May 2020. Total funding was about USD 4.49 million.
The project is targeted to “1,000-day households”2
2 A “1,000 day household” has at least one of the following: pregnant woman, lactating mother, child age two or younger.
located in 11 upazilas of the Bhola, Laxmipur, and Noakhali districts. These upazilas have an estimated total population of 3,004,228 people,3
3 According to the INCA project description, Basic Award document.
with about 106,420 pregnant women and 100,407 live births in 2015.
According to the INCA results framework, the project objective of improving nutritional practices was to be achieved through two intermediate results (IRs):
IR1: Improved knowledge of communities on proper nutritional requirements during the first thousand days of life.
IR2: Increased access to and use of health and nutrition services at community-based health facilities.
INCA used an array of interventions implemented mainly through a core of about 471 community nutrition promoters (CNPs) in the INCA intervention upazilas. The CNPs coached pregnant women and mothers of children under age two and facilitated linking women and communities with health facilities (community clinics [CCs], Family Welfare Centers [FWCs], and Upazila Health Complexes [UHCs]) located in the CNP covered areas. INCA trained and supported the CNPs to first identify all 1,000-day households in their catchment areas, and then to implement several gender-sensitive nutrition education and information services in their communities with strong links to CCs, FWCs, and UHCs. Examples of interventions implemented by the CNPs are monthly household visits to the identified 1,000-day households for one-to-one counselling on diet, infant and young child feeding (IYCF) counselling and care; distribution of nutrition materials like the Food Plate and pregnancy calendar; counselling on immunizations and child feeding; quarterly nutrition day events in the community; and weekly group courtyard counselling sessions including cooking demonstrations at the women’s information centers (WICs) through the local service providers.
INCA also worked to train personnel of government health facilities to increase staff knowledge of nutrition and ensure that nutrition services are mainstreamed in all health service delivery activities. INCA built the nutrition skills of selected members of existing community clinic support groups (CSGs) to act as nutrition focal points and to develop community nutrition support groups (CNSGs). It also sought to better integrate nutrition with other maternal and child health (MCH) activities.
In remote and underserved locations, INCA established 40 WICs, owned and managed by trained female informal health practitioners and other service providers. The WICs developed into one-stop service centers and were linked to the CNPs and CCs through a project dashboard and accompanying software application (App).
18 Evaluation of the INCA Project in Bangladesh
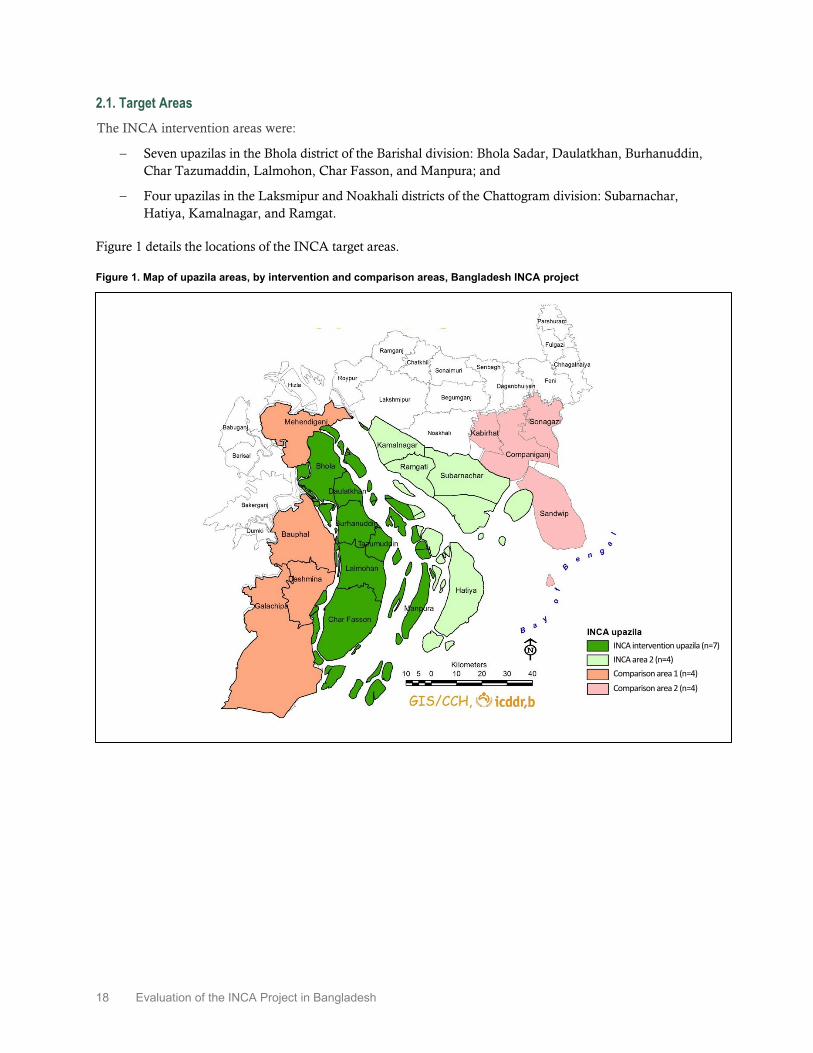
2.1. Target Areas The INCA intervention areas were:
− Seven upazilas in the Bhola district of the Barishal division: Bhola Sadar, Daulatkhan, Burhanuddin, Char Tazumaddin, Lalmohon, Char Fasson, and Manpura; and
− Four upazilas in the Laksmipur and Noakhali districts of the Chattogram division: Subarnachar, Hatiya, Kamalnagar, and Ramgat.
Figure 1 details the locations of the INCA target areas.
Figure 1. Map of upazila areas, by intervention and comparison areas, Bangladesh INCA project
INCA intervention upazila (n=7) INCA area 2 (n=4) Comparison area 1 (n=4) Comparison area 2 (n=4)

Evaluation of the INCA Project in Bangladesh 19
3. Purpose of the Evaluation and Evaluation Questions
The main purpose of this evaluation is to inform USAID/Bangladesh and other stakeholders about changes observed in key outcome indicators between the 2017 baseline and the 2019 endline, as well as about project impacts obtained at the target population level. Results from this evaluation will also be helpful in the design of future early life nutrition interventions.
3.1. Evaluation Questions The evaluation will answer the following specific evaluation questions:
1. Has stunting among children under age two declined in INCA target areas?
2. Has knowledge about nutritional requirements improved among household members in project areas?
3. What changes in nutrition-related practices have occurred in project areas?
4. What changes in use of health facilities for nutrition and NCH services have occurred in project areas?
5. Did the INCA project have any impact on reducing stunting among children under age two?
6. Did the INCA project have any impact on improving knowledge among community members in target areas?
7. Did the INCA project have any impact on nutrition-related practices?
8. Did the INCA project have any impact on use of facilities for nutrition services?
9. For the questions above, are there differences by geographic location in project areas?

20 Evaluation of the INCA Project in Bangladesh
4. Evaluation Methods
The INCA evaluation conducted an outcome evaluation which monitored changes in key outcome indicators in the project target population, and it also conducted an impact evaluation to determine changes in key outcomes that could be attributed to the INCA project. The evaluation was based on a prospective, quasi-experimental difference-in-differences (DID) design and used data from representative household surveys conducted in 2017 (baseline) and 2019/2020 (endline). The surveys were conducted in collaboration with Mitra and Associates and other Bangladeshi researchers.
4.1. Outcome Monitoring Design This component was designed to answer the first four evaluation questions about changes over time in project areas. The model used to examine whether significant changes occurred in key indicators is presented below in equation 1.
𝑌𝑌𝑖𝑖𝑖𝑖𝑖𝑖 = 𝛼𝛼0 + 𝛼𝛼1𝑇𝑇𝑖𝑖 + 𝜀𝜀𝑖𝑖𝑖𝑖𝑖𝑖 (1)
Where 𝑌𝑌𝑖𝑖𝑖𝑖𝑖𝑖 represents the outcome of interest for individual i who lives in community j at time t, 𝑇𝑇𝑖𝑖 is a binary variable equal to one if the observation is from the 2019 endline survey and zero if it is from the 2017 baseline survey. 𝜀𝜀𝑖𝑖𝑖𝑖𝑖𝑖 is the error term. Equation 1 was estimated with a pooled data set combining the baseline and endline sample of observations from the INCA areas. The estimated coefficient 𝛼𝛼�0 gives the mean prevalence of the outcome in 2017 (baseline) in the INCA target population. The sum of the estimated coefficients (𝛼𝛼�0 +𝛼𝛼�1) is the mean prevalence of the outcome in 2019 (endline). Therefore, the estimated coefficient 𝛼𝛼�1 is the (endline – baseline) difference in the prevalence of the indicator. If 𝛼𝛼�1 is statistically significant, it indicates that a significant change occurred in the outcome in project areas between baseline and endline.
Equation 1 was estimated with regression analysis, using linear probability models for binary outcomes, applied to the pooled sample of households or individuals from the panel of clusters. Regression models were estimated using sample weights and standard error estimates were adjusted for clustering at the sample cluster level.
4.2. Impact Evaluation Design The assessment of program impact requires estimating what would have happened if the project had not been implemented. That condition requires having a comparison group; that is, a group with characteristics as similar as possible to the INCA areas but where the interventions were not implemented. Since the INCA project areas were purposely selected based on the objective of the project and before the evaluation began, it was not feasible to implement a randomized control design. The evaluation strategy was, therefore, the second-best alternative: a prospective, quasi-experimental, DID design. This design estimates program impact by comparing changes in outcomes in the INCA project areas between baseline and endline to changes in the comparison group over the same period of time. The comparison group was obtained by selecting upazilas adjacent to the INCA areas with characteristics deemed similar by a group of Bangladeshi experts.
Due to the quasi-experimental nature of the design, it is important to control for differences between the INCA and comparison groups. The estimation models included additional variables of individual and household characteristics to control for observed characteristics that were not expected to be affected by the program. In order to control for unobserved differences between the groups, we included cluster-level fixed effects in the estimation models. This model specification was possible because the evaluation surveys were designed to be longitudinal at the cluster level—that is, the same baseline project and comparison clusters were used for the endline survey.
Evaluation of the INCA Project in Bangladesh 21
To answer the impact evaluation questions, we used the following DID model:4
4 Equation 2 presents the “classic” DID specification, including both the program and the time dummies separately, but the reader should note that in the fixed-effects specification we are using, 𝑃𝑃𝑖𝑖, will be perfectly collinear with the set of cluster-level dummies represented by 𝜆𝜆𝑖𝑖 . Therefore, an equivalent specification of model (2) is given by equation (2’) below. The coefficients of equations (2) and (2’) are equivalent and have the same interpretations.
𝑌𝑌𝑖𝑖𝑖𝑖𝑖𝑖 = 𝛽𝛽0 + 𝛽𝛽1𝑃𝑃𝑖𝑖 + 𝛽𝛽2𝑇𝑇𝑖𝑖 + 𝛽𝛽3𝑃𝑃𝑖𝑖 ∗ 𝑇𝑇𝑖𝑖 + 𝛽𝛽4𝑋𝑋𝑖𝑖𝑖𝑖𝑖𝑖 + 𝜆𝜆𝑖𝑖 + 𝜀𝜀𝑖𝑖𝑖𝑖𝑖𝑖 (2)
As in the outcome evaluation model presented before, 𝑌𝑌𝑖𝑖𝑖𝑖𝑖𝑖 represents the outcome of interest for individual i who lives in community j at time t. 𝑃𝑃𝑖𝑖 is a binary variable equal to one if cluster j is in the INCA project areas and zero if it is in the comparison areas. 𝑇𝑇𝑖𝑖 is a binary variable equal to one if the observation is from the 2019 endline survey and zero if it is from the 2017 baseline survey. The term 𝑃𝑃𝑖𝑖 ∗ 𝑇𝑇𝑖𝑖 is the interaction of the project and the time variables. 𝑋𝑋𝑖𝑖𝑖𝑖𝑖𝑖 represents a vector of individual and household characteristics needed to control for observed factors. The term 𝜆𝜆𝑖𝑖 is the fixed-effects specification and it represents unobserved characteristics of the cluster that do not change during the evaluation time. These are operationalized by a full set of cluster binary variables (dummies). 𝜀𝜀𝑖𝑖𝑖𝑖𝑖𝑖 is the error term. Equation 2 was estimated with fixed-effects estimation methods applied on pooled data from the panel of clusters included in both the baseline and endline surveys. Models were estimated using sample weights and standard errors were adjusted by clustering at the sample cluster level.
In equation 2 the coefficient of interest is �̂�𝛽3, which is the DID program impact estimate, and it is interpreted as the additional change in the outcome as a result of the community being exposed to INCA interventions relative to the change that occurred in the comparison group, controlling for differences in observed characteristics 𝑋𝑋𝑖𝑖𝑖𝑖𝑖𝑖 and for fixed unobserved differences between communities.
4.3. Data The evaluation design required collecting baseline and endline data in INCA project intervention areas and similar comparison areas. The INCA target population was comprised of women with children under age two and currently pregnant women living in rural areas in all seven upazilas of Bhola district and in four upazilas of Laxmipur and Noakhali districts. Comparison areas included four upazilas in Barisal and Patuakhali districts and four upazilas in Noakhali, Feni, and Chittagong districts with similar ethnic, socioeconomic, and environmental characteristics. Data were obtained from a representative sample of households with target respondents in INCA intervention and comparison areas. Data were longitudinal at the cluster level according to the impact evaluation estimation strategy.
4.3.1. Sampling Design Because the primary focus of the INCA project was to improve the nutritional status of children under two years of age, we used the prevalence of stunting among children under two years as the indicator for the calculation of sample size. A separate representative sample of currently pregnant women was also selected to study the indicators on knowledge and practice of ANC and minimum acceptable diet. The sample size was selected to be sufficiently large to detect the expected changes in the key indicators, with 95% confidence and 80% power.
The survey was conducted on a representative sample of pregnant women and women with children under age two living in the INCA target areas and in the comparison areas. Both the INCA intervention and comparison areas were divided into two separate areas considering geographic and socioeconomic similarities. The sample was selected using a two-stage random selection procedure. In the first stage, 65 clusters were randomly selected from the sampling frame of mouzas in rural areas in each of the INCA target upazilas and comparison areas. Given the two intervention areas and the two comparison areas, a total of 260 clusters were
𝑌𝑌𝑖𝑖𝑖𝑖𝑖𝑖 = 𝛽𝛽0 + 𝛽𝛽2𝑇𝑇𝑖𝑖 + 𝛽𝛽3𝑃𝑃𝑖𝑖 ∗ 𝑇𝑇𝑖𝑖 + 𝛽𝛽4𝑋𝑋𝑖𝑖𝑖𝑖𝑖𝑖 + 𝜆𝜆𝑖𝑖 + 𝜀𝜀𝑖𝑖𝑖𝑖𝑖𝑖 (2’)

22 Evaluation of the INCA Project in Bangladesh
selected. In each of the selected clusters, a household listing was conducted to identify households with either pregnant women or women with children under the age of two (these were the eligible households). A complete list of the target population (women with a child under two years and/or pregnant women) was prepared and served as the sampling frame for the second stage sampling. Thirty-one households with a mother of a child or children under two years of age were randomly selected from the list of households having one or more mothers with children under two years of age. For pregnant women, 13 households with a residing pregnant woman were randomly selected from the list of eligible households with a pregnant woman in each selected cluster. All women who were either pregnant and/or had children under the age of two in the selected households were interviewed.
Altogether, 7,795 households with mothers with a child under two years of age from 260 clusters were selected. For pregnant women, 2,516 households with a currently pregnant woman from 260 clusters were selected. Further details on the baseline sampling design and results are available in the INCA Baseline Survey 2017 report (Gustavo, et al., 2019). As the impact evaluation was designed to be longitudinal at the cluster level, the INCA endline survey was conducted in the same baseline clusters with an updated household listing.
Health facility and provider surveys were also implemented in INCA intervention and comparison areas. These surveys sought to capture information on access and awareness of the target population on the availability of health facilities at the community level. As per the survey plan, the same facilities (UH & FWCs, CCs, Smiling Sun nongovernmental organization [NGO] clinics) were covered in the endline survey as were covered in the baseline survey. Community nutrition promoters (CNPs) who were working in the selected clusters or adjacent areas were covered from the INCA project areas.
4.3.2. Data Collection The main data for the outcome monitoring and impact evaluation activities were collected from currently married women of reproductive age (15‒49 years) with children under two years of age and pregnant women, interviewed through population-based household surveys. In total, five different sets of questionnaires were used: (1) women with children under two questionnaire; (2) pregnant women questionnaire; (3) household schedule and questionnaire; (4) facility assessment questionnaire; and (5) CNP questionnaire.
Women with children under two years of age provided information on background characteristics, birth history, use and knowledge of health services (contraception, ANC, postnatal care [PNC]), knowledge of key nutritional practices, feeding patterns, and hand washing. The questionnaire included an anthropometry for child component, which was administered to all children under two years of age in the sampled households. Pregnant women provided the same information as in the women’s questionnaire, as well as knowledge about health and nutrition practices during pregnancy. The surveys also collected information on individual, household, and neighborhood characteristics associated with these outcomes. The endline survey used the same questionnaires as the baseline survey, with additional questions on exposure to INCA activities.
Fieldwork for the endline survey was undertaken two years after the baseline survey, with fieldwork occurring from November 2019 to January 2020. A total of 5,810 households were surveyed in the INCA intervention areas and 5,271 in the comparison areas. The household response rate was approximately 97%. A total of 5,420 mothers with a child under the age of two in INCA areas and 4,891 in comparison areas were successfully interviewed. The number of successfully interviewed pregnant women was 1,469 from INCA areas and 1,047 from comparison areas. The response rate for mothers with children under two was 93%, and among pregnant women the rate was around 91%. Appendix A presents the response rates and sample sizes for the INCA endline survey by study domain. The response rate for the endline household survey was slightly lower than the response rate of the baseline household survey, while the response rate among pregnant women was higher in the endline survey compared to the baseline.

Evaluation of the INCA Project in Bangladesh 23
To assess the provision of nutrition services, training of service providers, and availability of supplies/nutrition equipment in facilities, data were collected from sampled health facilities and CNPs in both INCA and comparison areas. Data collection for the health facility and provider surveys was also carried out over a period of three months, from December 2019 to February 2020. A total of 457 facilities were completed in the endline survey, from which 441 were also covered in the baseline survey and 16 were new facilities providing services to the community. A total of 272 CNPs were interviewed from the INCA intervention areas in the endline survey, from which 184 were interviewed in the baseline survey and 88 were new CNPs.
4.3.3. Balance between Treatment and Comparison Areas at Baseline To assess the similarities, or balance, between the intervention and comparison areas, we conducted tests of differences between means of the groups. We used linear regression models corrected for clustering applied to 53 household-level indicators, 22 indicators for mothers with children under age two, and 22 indicators for pregnant women. We found that 63% of the indicators on household characteristics tested were significantly different between intervention and comparison areas at baseline. The number of indicators that significantly differed between intervention and comparison areas at baseline by indicator group were 77% for characteristics of mothers with children under two years of age, and 50% for pregnant women. Complete details of the balance tests are available in the baseline report (Angeles, et al., 2019).
4.4. Ethical Considerations Prior to baseline and endline data collection, ethical clearance for the study protocol and data collection instruments was obtained from the Bangladesh Medical Research Council and the University of North Carolina at Chapel Hill Institutional Review Board. Data were collected using sex-matched interviewers through face-to-face interviews to ensure confidentiality. Informed consent was obtained from participants prior to the interview.

24 Evaluation of the INCA Project in Bangladesh
5. Results
This chapter presents the main results of outcome monitoring and impact evaluation analyses on mothers with children under two years of age and pregnant women’s contact and exposure to INCA activities, knowledge on nutrition and nutritional practices, awareness of availability of health facilities and services, access and use of health services, and nutritional status. The analyses were based on key indicators from the INCA project results framework and evaluation plan.
5.1. Women’s Contact with INCA Interventions To assess the impact of any intervention, it is important to assess to what extent the project reached the target population and what is the extent of exposure of the project activities among the target population. In the next segment of this chapter, the reach of the INCA project and exposure to INCA interventions among the target population were evaluated based on the following three sub-indicators.
5.1.1 Program Coverage: INCA Registration Figure 2 shows that registration of eligible women (mothers with children under two years and pregnant women) in INCA intervention areas was low. Among mothers of children under age two (0‒23 months), 37% reported that their households were registered with the project. Less than one-quarter of pregnant women reported that their households were registered with the project.
Figure 2. Registration to INCA project among mothers of children under age two and pregnant women, endline 2019
37.0
23.0
0
10
20
30
40
50
60
70
Mothers of children undertwo years
Pregnant women
Perc
ent
5.1.2. Exposure to INCA Activities: Mothers with Children Under Two Years of Age Exposure to INCA activities was assessed based on contact, participation, or support from any of the five key activities (visit by CNP, attend courtyard meeting, attend nutrition day event, attend food preparation demonstration, and receive support from CNSG) in the three months preceding the endline survey. Figure 3 shows that only 12% of mothers with children under age two in INCA intervention areas reported any exposure to the key INCA activities. Since the proportion of exposure was very low among all mothers of children under the age of two, the evaluation team looked at exposure among the INCA-registered mothers with children under age two and found a higher exposure (27%) among them.
When investigating individual activities, it was found that only seven percent of the mothers with children under age two in INCA intervention areas reported CNP visits and attending any courtyard meeting in the three months preceding the survey. However, among INCA-registered mothers with children under age two,
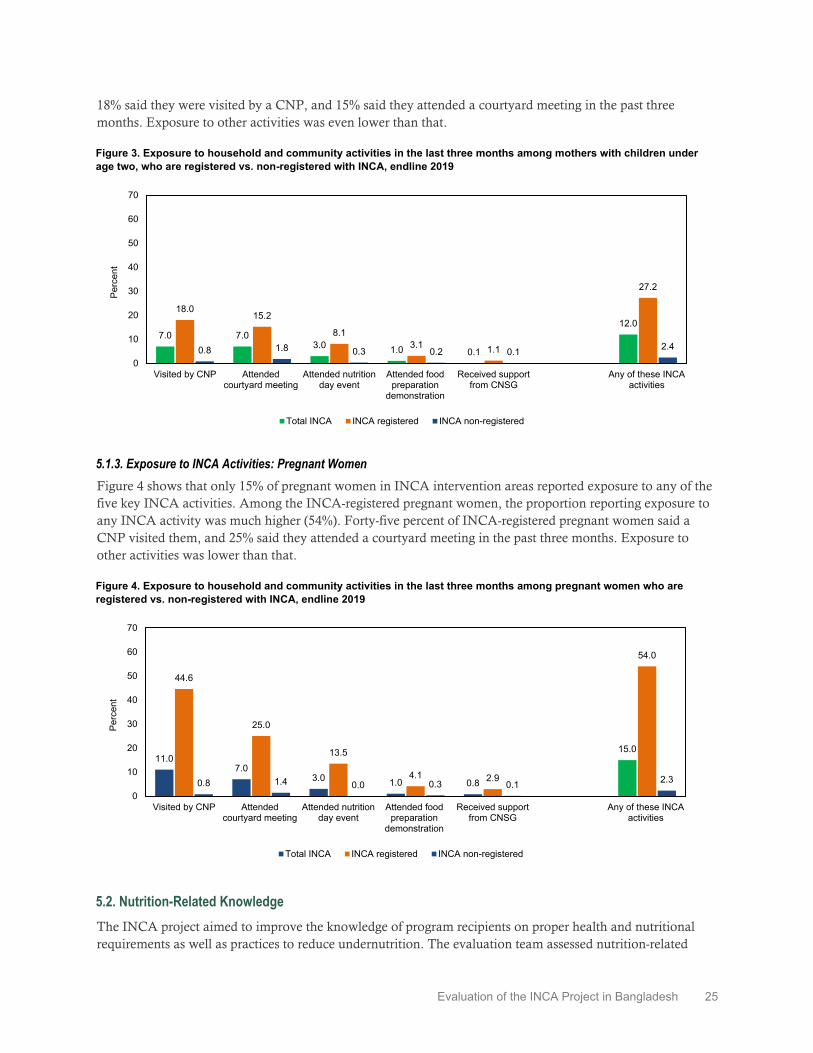
Evaluation of the INCA Project in Bangladesh 25
18% said they were visited by a CNP, and 15% said they attended a courtyard meeting in the past three months. Exposure to other activities was even lower than that.
Figure 3. Exposure to household and community activities in the last three months among mothers with children under age two, who are registered vs. non-registered with INCA, endline 2019
7.0 7.03.0 1.0 0.1
12.018.0
15.2
8.13.1 1.1
27.2
0.8 1.8 0.3 0.2 0.1 2.4
0
10
20
30
40
50
60
70
Visited by CNP Attendedcourtyard meeting
Attended nutritionday event
Attended foodpreparation
demonstration
Received supportfrom CNSG
Any of these INCAactivities
Perc
ent
Total INCA INCA registered INCA non-registered
5.1.3. Exposure to INCA Activities: Pregnant Women Figure 4 shows that only 15% of pregnant women in INCA intervention areas reported exposure to any of the five key INCA activities. Among the INCA-registered pregnant women, the proportion reporting exposure to any INCA activity was much higher (54%). Forty-five percent of INCA-registered pregnant women said a CNP visited them, and 25% said they attended a courtyard meeting in the past three months. Exposure to other activities was lower than that.
Figure 4. Exposure to household and community activities in the last three months among pregnant women who are registered vs. non-registered with INCA, endline 2019
11.07.0
3.0 1.0 0.8
15.0
44.6
25.0
13.5
4.1 2.9
54.0
0.8 1.4 0.0 0.3 0.1 2.3
0
10
20
30
40
50
60
70
Visited by CNP Attendedcourtyard meeting
Attended nutritionday event
Attended foodpreparation
demonstration
Received supportfrom CNSG
Any of these INCAactivities
Perc
ent
Total INCA INCA registered INCA non-registered
5.2. Nutrition-Related Knowledge The INCA project aimed to improve the knowledge of program recipients on proper health and nutritional requirements as well as practices to reduce undernutrition. The evaluation team assessed nutrition-related

26 Evaluation of the INCA Project in Bangladesh
knowledge based on the INCA Monitoring, Evaluation and Learning (MEL) plan. Questions on assessing knowledge were based on the contents of INCA’s project messaging. The nutrition-related knowledge among the target population was evaluated based on the following four sub-indicators.
5.2.1. Nutrition Knowledge of Mothers with Children Under Age Two The change between baseline and endline in appropriate knowledge of exclusive breastfeeding among lactating women was 18 percentage points in INCA areas and 15 percentage points in comparison areas, both of which are statistically significant improvements (p<0.01) (Table 1). However, the DID model did not show any significant program impact. Appropriate knowledge of exclusive breastfeeding among INCA-registered mothers (74%) was slightly higher than among the non-registered mothers (72%), and this difference was not statistically significant (Table 2).
Between baseline and endline, the proportion of mothers with children ages 6–23 months with knowledge of minimum acceptable diet (MAD) increased by 14 percentage points in INCA areas and seven percentage points in comparison areas (both increases were statistically significantly (p<0.01) (Table 1). The DID model shows a significant program impact (p<0.01) on increasing knowledge of minimum acceptable diet among mothers with children under age two. The level of knowledge among INCA-registered mothers (84%) was slightly higher than non-registered mothers (81%), though the difference was not statistically significant (Table 2).
The proportion of mothers of children under age two with knowledge of critical times when handwashing with soap is necessary (e.g., handling food/feeding child/after defecation) increased significantly (p<0.05) from baseline (27%) to endline (30%) in INCA areas and remained the same (34%) in comparison areas (Table 1). The level of knowledge of handwashing among INCA-registered mothers (32%) was slightly higher than among non-registered mothers (29%), and the difference was not statistically significant (Table 2).
Table 1. Nutrition knowledge of mothers with children under two years of age in INCA and comparison areas during baseline and endline, endline 2019
Knowledge indicators
INCA area (%) Comparison area (%)
B E C B E C
% of lactating women with appropriate knowledge of exclusive breastfeeding 55.1 72.8 17.7*** 54.1 69.1 15.0***
% of mothers with children ages 6–23 months with knowledge of minimum acceptable diet (MAD) 68.1 82.2 14.1*** 64.3 71.3 7.0***
% of mothers with children under two with knowledge of critical times when hand washing with soap is necessary (handling food/feeding child/after defecation)
26.8 30.0 3.2** 34.2 33.5 -0.7
B=Baseline; E=Endline; C= Change; * = p< 0.10; ** = p< 0.05; *** = p< 0.01
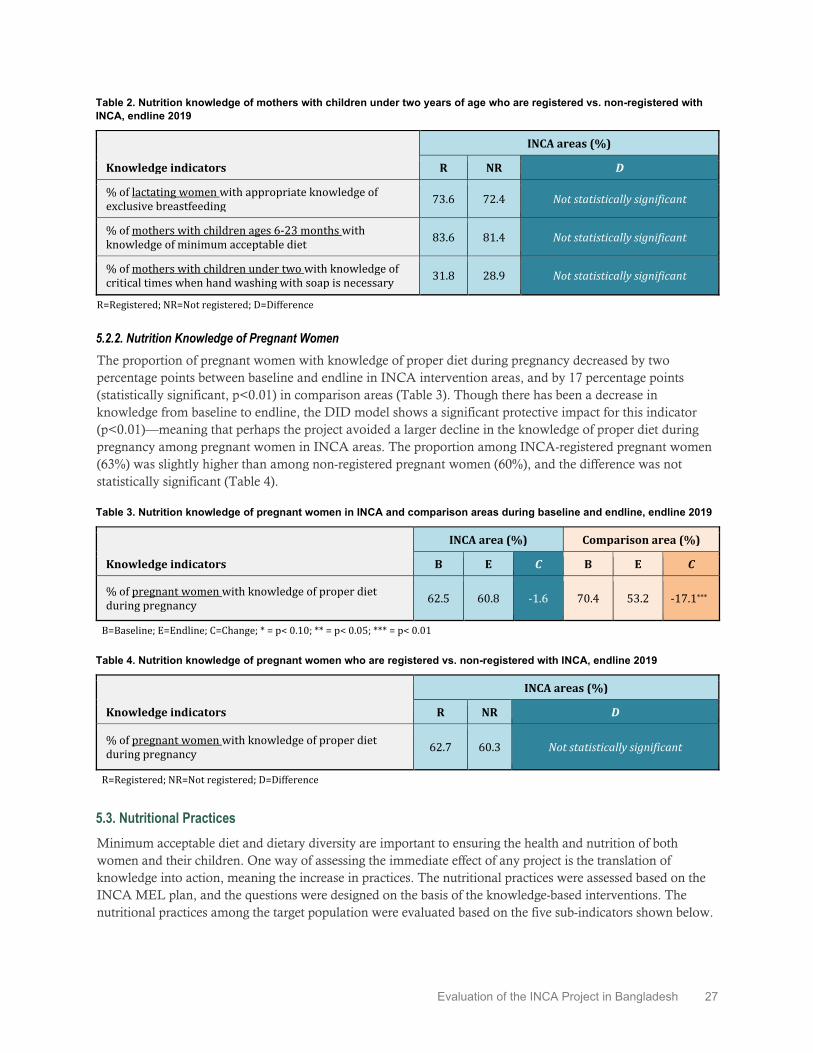
Evaluation of the INCA Project in Bangladesh 27
Table 2. Nutrition knowledge of mothers with children under two years of age who are registered vs. non-registered with INCA, endline 2019
Knowledge indicators
INCA areas (%)
R NR D
% of lactating women with appropriate knowledge of exclusive breastfeeding 73.6 72.4 Not statistically significant
% of mothers with children ages 6-23 months with knowledge of minimum acceptable diet 83.6 81.4 Not statistically significant
% of mothers with children under two with knowledge of critical times when hand washing with soap is necessary 31.8 28.9 Not statistically significant
R=Registered; NR=Not registered; D=Difference
5.2.2. Nutrition Knowledge of Pregnant Women The proportion of pregnant women with knowledge of proper diet during pregnancy decreased by two percentage points between baseline and endline in INCA intervention areas, and by 17 percentage points (statistically significant, p<0.01) in comparison areas (Table 3). Though there has been a decrease in knowledge from baseline to endline, the DID model shows a significant protective impact for this indicator (p<0.01)—meaning that perhaps the project avoided a larger decline in the knowledge of proper diet during pregnancy among pregnant women in INCA areas. The proportion among INCA-registered pregnant women (63%) was slightly higher than among non-registered pregnant women (60%), and the difference was not statistically significant (Table 4).
Table 3. Nutrition knowledge of pregnant women in INCA and comparison areas during baseline and endline, endline 2019
Knowledge indicators
INCA area (%) Comparison area (%)
B E C B E C
% of pregnant women with knowledge of proper diet during pregnancy 62.5 60.8 -1.6 70.4 53.2 -17.1***
B=Baseline; E=Endline; C=Change; * = p< 0.10; ** = p< 0.05; *** = p< 0.01
Table 4. Nutrition knowledge of pregnant women who are registered vs. non-registered with INCA, endline 2019
Knowledge indicators
INCA areas (%)
R NR D
% of pregnant women with knowledge of proper diet during pregnancy 62.7 60.3 Not statistically significant
R=Registered; NR=Not registered; D=Difference
5.3. Nutritional Practices Minimum acceptable diet and dietary diversity are important to ensuring the health and nutrition of both women and their children. One way of assessing the immediate effect of any project is the translation of knowledge into action, meaning the increase in practices. The nutritional practices were assessed based on the INCA MEL plan, and the questions were designed on the basis of the knowledge-based interventions. The nutritional practices among the target population were evaluated based on the five sub-indicators shown below.

28 Evaluation of the INCA Project in Bangladesh
5.3.1. Nutritional Practices of Mothers with Children Under Two Years of Age The proportion of children under six months of age exclusively breastfeed was already high during the baseline. It further increased from baseline (84%) to endline (87%) in INCA areas, but the change was not significant. However, the increase in exclusive breastfeeding practices was significant in comparison areas (from 79% to 84%, p<0.05). The DID model did not show any significant program impact (data not shown here; please refer to Appendix A for details). The proportion of exclusive breastfeeding among INCA-registered mothers was similar to that for non-registered mothers and the difference was not statistically significant (data not shown here; please refer to Appendix B for details).
The proportion of children under age two who initiated breastfeeding within the first hour of birth remained the same (69%) from baseline to endline in INCA areas, and declined by one percentage point (from 61 to 60%) in comparison areas. The DID model did not show any significant program impact (data not shown here; please refer to Appendix A for details). The proportion of early initiation of breastfeeding among INCA-registered children also remained similar to the proportion for non-registered children (data not shown here; please refer to Appendix B for details).
The proportion of children ages 6–23 months receiving a minimum acceptable diet increased by three percentage points between baseline and endline in INCA areas (a statistically significant increase, p<0.05), and by two percentage points in comparison areas (Figure 5). However, the DID model did not show any significant program impact. The proportion receiving a minimum acceptable diet among INCA-registered children was six percentage points higher than non-registered participants (Figure 6), and the difference was statistically significant (p<0.01).
Figure 5. Percentage of children ages 6–23 months receiving a minimum acceptable diet in INCA and comparison areas during baseline and endline, endline 2019
30.333.5
30.532.8
0
10
20
30
40
50
60
70
Baseline Endline Baseline Endline
INCA Area Comparison Area
Perc
ent
Note: The increase in INCA areas was statistically significant (p<0.05).

Evaluation of the INCA Project in Bangladesh 29
Figure 6. Percentage of children ages 6–23 months receiving a minimum acceptable diet who are registered vs. non-registered with INCA, endline 2019
37.4
31.2
0
10
20
30
40
50
60
70
INCA registered INCA non-registered
Perc
ent
Note: The difference between INCA-registered and non-registered children was statistically significant (p<0.01).
The proportion of lactating mothers consuming a diet of minimum diversity increased significantly in both INCA and comparison areas (by nine and eight percentage points, respectively; p<0.01) between baseline and endline (Figure 7). The DID model did not find any significant program impact on this indicator. The proportion consuming a diet of minimum diversity among INCA-registered lactating mothers (60%) was significantly (p<0.05) higher than among non-registered mothers (55%) (Figure 8).
Figure 7. Percentage of lactating mothers consuming a diet of minimum diversity in INCA and comparison areas during baseline and endline, endline 2019
48.3
56.8
51.5
59.9
0
10
20
30
40
50
60
70
Baseline Endline Baseline Endline
INCA Area Comparison Area
Perc
ent
Note: The increases in both INCA and comparison areas were statistically significant (p<0.01).

30 Evaluation of the INCA Project in Bangladesh
Figure 8. Percentage of lactating mothers consuming a diet of minimum diversity who are registered vs. non-registered with INCA, endline 2019
59.855.0
0
10
20
30
40
50
60
70
INCA registered INCA non-registered
Perc
ent
Note: The difference between INCA-registered and non-registered mothers was statistically significant (p<0.05).
5.3.2. Nutritional Practices of Pregnant Women The proportion of pregnant women consuming a diet of minimum diversity increased significantly (p<0.01) between baseline and endline both in INCA and comparison areas (by ten and eight percentage points, respectively) (Figure 9). Though there has been a notable increase between the baseline and endline in the project area, the DID model did not find any significant program impact. The proportion consuming a diet of minimum diversity among INCA-registered pregnant women was five percentage points higher than their non-registered counterparts (Figure 10), and the difference was not statistically significant.
Figure 9. Percentage of pregnant women consuming a diet of minimum diversity in INCA and comparison areas during baseline and endline, endline 2019
52.3
62.159.2
66.7
0
10
20
30
40
50
60
70
Baseline Endline Baseline Endline
INCA Area Comparison Area
Perc
ent
Note: The increases in both INCA and comparison areas were statistically significant (p<0.01).
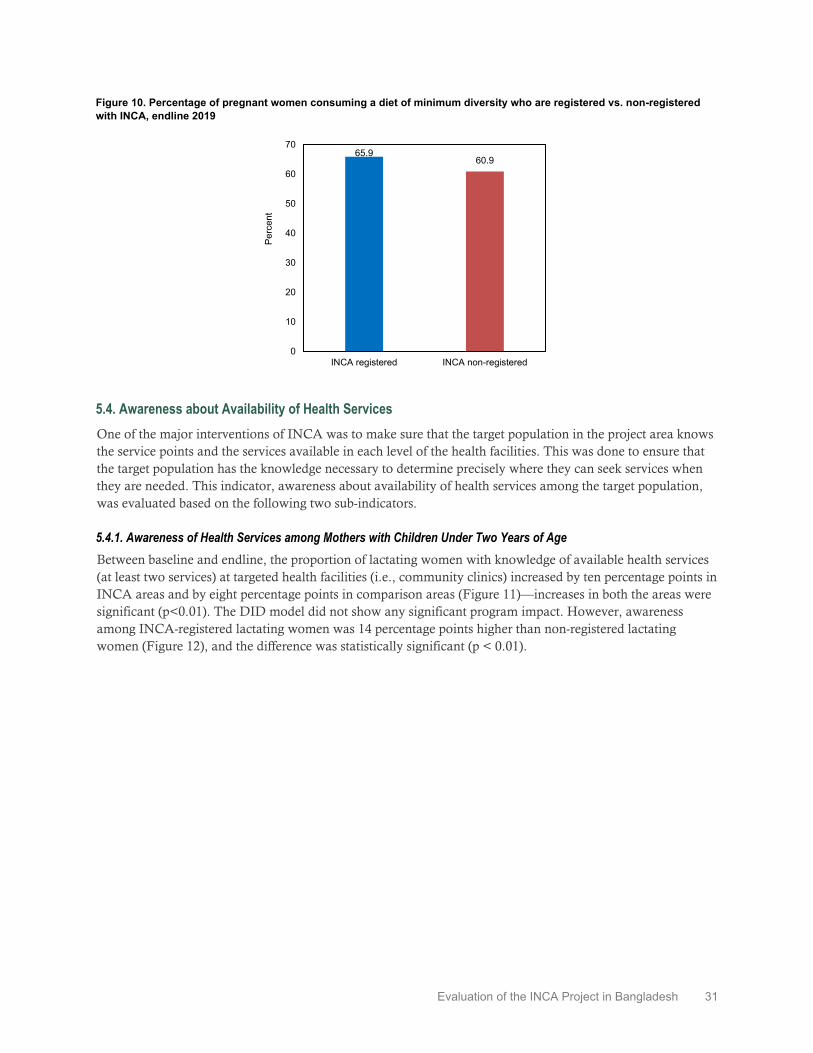
Evaluation of the INCA Project in Bangladesh 31
Figure 10. Percentage of pregnant women consuming a diet of minimum diversity who are registered vs. non-registered with INCA, endline 2019
65.960.9
0
10
20
30
40
50
60
70
INCA registered INCA non-registered
Perc
ent
5.4. Awareness about Availability of Health Services One of the major interventions of INCA was to make sure that the target population in the project area knows the service points and the services available in each level of the health facilities. This was done to ensure that the target population has the knowledge necessary to determine precisely where they can seek services when they are needed. This indicator, awareness about availability of health services among the target population, was evaluated based on the following two sub-indicators.
5.4.1. Awareness of Health Services among Mothers with Children Under Two Years of Age Between baseline and endline, the proportion of lactating women with knowledge of available health services (at least two services) at targeted health facilities (i.e., community clinics) increased by ten percentage points in INCA areas and by eight percentage points in comparison areas (Figure 11)—increases in both the areas were significant (p<0.01). The DID model did not show any significant program impact. However, awareness among INCA-registered lactating women was 14 percentage points higher than non-registered lactating women (Figure 12), and the difference was statistically significant (p < 0.01).

32 Evaluation of the INCA Project in Bangladesh
Figure 11. Percentage of lactating women with knowledge of available health services (at least two services) at targeted health facilities (community clinic) in INCA and comparison areas during baseline and endline, endline 2019
40.4
50.2
30.7
38.6
0
10
20
30
40
50
60
70
Baseline Endline Baseline Endline
INCA Area Comparison Area
Perc
ent
Note: The increases in both INCA and comparison areas were statistically significant (p<0.01).
Figure 12. Percentage of lactating women with knowledge of available health services (at least two services) at targeted health facilities (community clinic) who are registered vs. non-registered with INCA, endline 2019
59.2
44.8
0
10
20
30
40
50
60
70
INCA registered INCA non-registered
Perc
ent
Note: The difference between INCA-registered and non-registered mothers was statistically significant (p<0.01)
5.4.2. Awareness of Health Services among Pregnant Women Even with the project interventions, the proportion of pregnant women with knowledge of available health services (at least two services) at targeted health facilities (i.e., community clinics) decreased by nine percentage points between baseline and endline in INCA areas, and by 13 percentage points in comparison areas (Figure 13)—both the changes were statistically significant (p<0.01). The DID model did not show any significant program impact. However, awareness of available health services at community clinics among INCA-registered pregnant women was significantly (p=0.01) higher than non-registered pregnant women (Figure 14).

Evaluation of the INCA Project in Bangladesh 33
Figure 13. Percentage of pregnant women with knowledge of available health services (at least two services) at targeted health facilities (community clinic) in INCA and comparison areas during baseline and endline, endline 2019
40.9
32.2 32.1
19.6
0
10
20
30
40
50
60
70
Baseline Endline Baseline Endline
INCA Area Comparison Area
Perc
ent
Note: The increases in both INCA and comparison areas were statistically significant (p<0.01).
Figure 14. Percentage of pregnant women with knowledge of available health services (at least two services) at targeted health facilities (community clinic) who are registered vs. non-registered with INCA, endline 2019
46.2
28.0
0
10
20
30
40
50
60
70
INCA registered INCA non-registered
Perc
ent
Note: The difference between INCA-registered and non-registered women was statistically significant (p<0.01).
5.5. Access to and Use of Health Facilities/Services A direct outcome of knowing where services are is to access the services when needed. Hence, the evaluation team also investigated the access to and use of health facilities and services, respectively, among the target population. The evaluation questions were designed based on the INCA activities in the health facilities, and on how well the target population accessed the services in those facilities. This indicator was evaluated based on the following two sub-indicators.
5.5.1. Access to and Use of Health Services by Mothers with Children Under Two Years of Age Between baseline and endline, the proportion of children under age two receiving any nutrition services and/or counselling from health facilities in the three months preceding the survey increased by 11 percentage points both in INCA and comparison areas (Figure 15), and both the increases were statistically significant (p<0.01). The DID model did not show any program impact. However, the proportion receiving any nutrition

34 Evaluation of the INCA Project in Bangladesh
services and/or counselling from health facilities among INCA-registered children was double that of non-registered children (Figure 16), and the difference was statistically significant (p<0.01).
Figure 15. Percentage of children under age two receiving any nutrition services and/or counselling from health facilities in the last three months in INCA and comparison areas during baseline and endline, endline 2019
3.7
15.0
4.8
15.7
0
10
20
30
40
50
60
70
Baseline Endline Baseline Endline
INCA Area Comparison Area
Perc
ent
Note: The increases in both INCA and comparison areas were statistically significant (p<0.01).
Figure 16. Percentage of children under age two receiving any nutrition services and/or counselling from health facilities in the last three months who are registered vs. non-registered with INCA, endline 2019
21.9
10.9
0
10
20
30
40
50
60
70
INCA registered INCA non-registered
Perc
ent
Note: The difference between INCA-registered and non-registered children was statistically significant (p<0.01).
Growth monitoring and promotion (GMP) is one of the key services delivered under the INCA project. The percentage of children under age two receiving GMP services in the three months preceding the survey increased by eight percentage points between baseline and endline in INCA areas, and by nine percentage points in comparison areas (Figure 17)—both the increases were statistically significant (p<0.01). The DID model did not show any significant program impact. However, the proportion receiving GMP services among INCA-registered children was nearly double that of non-registered children (Figure 18), and the difference was statistically significant (p<0.01).

Evaluation of the INCA Project in Bangladesh 35
Figure 17. Percent of children under age two receiving growth monitoring services in the last three months in INCA and comparison areas during baseline and endline, endline 2019
3.0
11.0
4.6
13.6
0
10
20
30
40
50
60
70
Baseline Endline Baseline Endline
INCA Area Comparison Area
Perc
ent
Note: The increases in both INCA and comparison areas were statistically significant (p<0.01).
Figure 18. Percent of children under age two receiving growth monitoring services in the last three months who are registered vs. non-registered with INCA, endline 2019
15.9
8.2
0
10
20
30
40
50
60
70
INCA registered INCA non-registered
Perc
ent
Note: The difference between INCA-registered and non-registered children was statistically significant (p<0.01)
The percentage of births receiving at least four ANC visits during pregnancy, with at least one visit from a medically-trained provider (MTP), increased by three percentage points between baseline and endline in INCA areas (statistically significant, p<0.05) and by nearly one percentage point in comparison areas (Table 5). The DID model did not find any program impact for this indicator. However, the proportion of live births among INCA-registered participants was six percentage points higher than that from the non-registered participants (Table 6), and the difference was statistically significant (p<0.01).
The percentage of deliveries by a skilled birth attendant (SBA) also increased by six percentage points between baseline and endline in INCA areas, and by seven percentage points in comparison areas (Table 5) (both increases were significant, p<0.01). The DID model did not find any significant program impact. However, the proportion of SBA among INCA-registered women was six percentage points higher than among non-registered women (Table 6), and the difference was statistically significant (p<0.01).

36 Evaluation of the INCA Project in Bangladesh
The percentage of births that received postnatal care (PNC) from an MTP increased by seven percentage points between baseline and endline in INCA areas, and by eight percentage points in comparison areas (Table 5) (both increases were significant, p<0.01). The DID model did not show any significant program impact for this indicator. The proportion receiving PNC among INCA-registered women was five percentage points higher than among non-registered women (Table 6), and the difference was statistically significant (p<0.05).
Table 5. Maternal health care indicators among mother with children under two years of age in INCA and comparison areas during baseline and endline, endline 2019
Maternal health care indicators
INCA area (%) Comparison area (%)
B E C B E C
% of births received at least 4 ANC with at least one from MTP 15.1 17.7 2.7** 23.5 24.2 0.7
% of deliveries by SBA 19.5 25.2 5.7*** 32.3 39.6 7.3***
% of births received PNC from MTP 18.5 25.1 6.6*** 30.9 39.3 8.3***
B=Baseline; E=Endline; C=Change; * = p< 0.10; ** = p< 0.05; *** = p< 0.01
Table 6. Maternal health care indicators among mothers with children under two years of age who are registered vs. non-registered with INCA, endline 2019
Maternal health care indicators
INCA areas (%)
R NR D
% of births received at least 4 ANC with at least one from MTP 21.6 15.4 Statistically significant (p<0.01)
% of deliveries by SBA 28.7 23.2 Statistically significant (p<0.01)
% of births received PNC from MTP 28.1 23.3 Statistically significant (p<0.05)
R=Registered; NR=Not registered; D=Difference
5.5.2. Access and Use of Health Services by Pregnant Women The percentage of pregnant women seeking any nutrition services/counselling from health facilities increased by 18 percentage points between baseline and endline in INCA areas and by 12 percentage points in comparison areas, both were statistically significant (p<0.01) (Figure 19). The DID model shows statistically significant program impact for this indicator (p<0.05). Also, seeking nutrition services/counselling from health facilities among INCA-registered pregnant women was 23 percentage points higher than non-registered pregnant women (Figure 20), and the difference was statistically significant (p<0.01).

Evaluation of the INCA Project in Bangladesh 37
Figure 19. Percentage of pregnant women seeking any nutrition services/counselling from health facilities in the last three months in INCA and comparison areas during baseline and endline, endline 2019
6.5
24.9
12.1
23.8
0
10
20
30
40
50
60
70
Baseline Endline Baseline Endline
INCA Area Comparison Area
Perc
ent
Note: The increases in both INCA and comparison areas were statistically significant (p<0.01).
Figure 20. Percentage of pregnant women seeking any nutrition services/counselling from health facilities in the last three months who are registered vs. non-registered with INCA, endline 2019
42.2
19.6
0
10
20
30
40
50
60
70
INCA registered INCA non-registered
Perc
ent
Note: The difference between INCA-registered and non-registered women was statistically significant (p<0.01).
5.6. Nutritional Status The goal of the INCA project was to improve the nutritional status of the project target population. The evaluation team followed the INCA MEL plan and evaluated the nutritional status of the target population in both the surveys. Thus, the nutritional status among the target population was evaluated based on the following three sub-indicators.
5.6.1. Mothers of Children Under Two Years of Age Underweight is defined as when the mother’s body mass index (BMI) is less than 18.5 kg/m2. The percentage of underweight among mothers of children under age two decreased by six percentage points between baseline and endline in INCA areas, and by four percentage points in comparison areas (Figure 21)—both these reductions were statistically significant (p<0.01). However, the DID model did not find any significant program impact. The prevalence of underweight among INCA-registered mothers was four percentage points lower than for non-registered mothers (Figure 22), which was statistically significant (p<0.05).

38 Evaluation of the INCA Project in Bangladesh
Figure 21. Prevalence of underweight among mothers with children under age two in INCA and comparison areas during baseline and endline, endline 2019
24.1
18.0 19.915.8
0
10
20
30
40
50
60
70
Baseline Endline Baseline Endline
INCA Area Comparison Area
Perc
ent
Note: The reductions in both INCA and comparison areas were statistically significant (p<0.01).
Figure 22. Prevalence of underweight among mothers with children under age two who are registered vs. non-registered with INCA, endline 2019
15.619.5
0
10
20
30
40
50
60
70
INCA registered INCA non-registered
Perc
ent
Note: The difference between INCA-registered and non-registered women was statistically significant (p<0.05).
5.6.2. Stunting among Children Under Two Years of Age Stunting is a height-for-age measurement that reflects chronic undernutrition. A child who is more than two standard deviations below the median (-2 SD) of the World Health Organization (WHO) child growth standards is considered stunted. The prevalence of stunting among children under two years of age (0–23 months) increased by two percentage points between baseline and endline in both INCA and comparison areas (Figure 23)—neither of which was statistically significant. The DID model did not find any significant change in stunting levels during this period. The level of stunting among INCA-registered and non-registered children remained the same, at around 30% (Figure 24).

Evaluation of the INCA Project in Bangladesh 39
Figure 23. Prevalence of stunting among children ages 0–23 months in INCA and comparison areas during baseline and endline, endline 2019
28.630.7
22.624.7
0
10
20
30
40
50
60
70
Baseline Endline Baseline Endline
INCA Area Comparison Area
Perc
ent
Figure 24. Prevalence of stunting among children ages 0–23 months who are registered vs. non-registered with INCA, endline 2019
30.8 30.4
0
10
20
30
40
50
60
70
INCA registered INCA non-registered
Perc
ent
5.6.3. Underweight among Children Under Two Years of Age A child is considered underweight if her weight-for-age is below two standard deviations (-2 SD) from the median of the WHO child growth standards. Between baseline and endline, the prevalence of underweight among children under two years of age (0–23 months) decreased by seven percentage points in INCA areas and by four percentage points in comparison areas (Figure 25), both the reductions were statistically significant (p<0.01). The DID model shows a statistically significant (p<0.05) program impact in reducing underweight among children. The prevalence of underweight remained similar among INCA-registered and non-registered children (Figure 26).

40 Evaluation of the INCA Project in Bangladesh
Figure 25. Prevalence of underweight among children ages 0–23 months in INCA and comparison areas during baseline and endline, endline 2019
24.4
17.8 18.815.1
0
10
20
30
40
50
60
70
Baseline Endline Baseline Endline
INCA Area Comparison Area
Perc
ent
Note: The reductions in both INCA and comparison areas were statistically significant (p<0.01).
Figure 26. Prevalence of underweight among children ages 0–23 months who are registered vs. non-registered with INCA, endline 2019
17.3 18.1
0
10
20
30
40
50
60
70
INCA registered INCA non-registered
Perc
ent
5.7. CNP and Health Facility Characteristics The INCA project conducted activities to support the provision of nutrition services to the target population. The main intervention was establishing a cadre of 471 CNPs who made monthly visits to the identified target households. INCA also provided training to personnel of public health facilities to increase staff knowledge of nutrition and to increase their competence in the provision of health services. Both the baseline and endline surveys included a CNP module and a health facility survey. The CNP module collected basic information on demographic characteristics.
5.7.1. CNP Characteristics The CNPs were the main intervention used by INCA to provide information and promote nutrition-related behaviors. Because there was low turnover in CNPs, we present key findings from the 2019 endline CNP module in Table 7. Background characteristics in 2017 were similar as in 2019. We found presence of CNPs in almost all 130 endline clusters—98% of clusters had at least one CNP, and 70% of clusters had two CNPs. All CNPs were female, with the majority being 20–29 years old (62.2%) and having completed at least secondary school (96.3%). As expected, almost all received basic training (99.3%) and two-out-of-three had worked for INCA for at least two years, as 66.5% received basic training during 2017. However, the majority had no

Evaluation of the INCA Project in Bangladesh 41
previous experience in INCA-type projects (57.4%). Almost all reported receiving in-service training in specific areas of nutrition and in conducting counseling in key nutrition aspects to women and conducting courtyard meetings within the month before the interview.
Communication received from the INCA project (see Appendix D) about CNPs’ workloads indicates that in the first two years of the project a CNP was responsible for target households in two wards in a union. In year 3, each CNP was assigned between 250 to 350 households located within the corresponding community clinic and UHFWC catchment populations. CNPs were expected to work eight hours per day, with at least five hours dedicated to household visits. They were to conduct courtyard sessions with beneficiaries (22 sessions per month, on average, which is about one per day). They also worked at health facilities delivering nutrition services and met with CSNG members once a week. Monthly activities included meetings at health facilities and at the cluster office. CNPs also organized and conducted Nutrition Days and other nutrition events on a quarterly basis. Their monthly salary was between Tk. 5,500 and Tk. 6,500 (about USD 65.89 to USD 77.87, using the 2018 average exchange rate of Tk. 83.47 per 1 USD).
Table 7. CNP presence in survey clusters and individual characteristics, endline 2019
Number of CNPs interviewed 272
Percentage of survey clusters with 1+ CNPs 98.0
CNP characteristics:
Percentage female 100.0
Age
― <20 3.9
― 20-24 33.5
― 25-29 28.7
― 30+ 33.9
Years of education
― < 9 3.7
―10-13 73.5
― 14+ 22.8
Percentage who received basic training 99.3
When basic training was received:
― January – December 2017 66.5
― January – December 2018 16.2
― January – October 2019 17.3
Work experience other than INCA
― With SPRING, SHIKHA, Food for Peace, Mamoni, Feed the Future 11.8
― Other project 30.8
― No previous experience 57.4
Ever received in-service training in following topic:
― Growth monitoring and promotion (GMP) 99.6
― Food and nutrition 99.6
― Malnutrition 99.6
― Breastfeeding counseling 99.6
― Complementary feeding counseling 99.6

42 Evaluation of the INCA Project in Bangladesh
― Nutrition during pregnancy 99.6
― Counseling skills 99.6
Provided service within last month
― GMP 95.6
― Breastfeeding counseling 100
― Complementary feeding counseling 100
― Nutrition during pregnancy 100
― Courtyard meeting 100
5.7.2. CNP Workload Table 8 provides an estimation of the daily workload of a CNP during the last four months of 2019, based on the information provided by the INCA project. Our calculations are based on the monthly number of women with children under two years of age and the number of pregnant women visited by the CNP that were reported in the INCA project management information system (see Appendix D). During September to December 2019, each CNP had a heavy daily workload—on average, each CNP visited 10 women and conducted three meetings of courtyard sessions or food demonstrations per day, five days a week, working between 21 and 23 days per month. The calculations in Table 8 assume 30 minutes were spent per women visited, and that courtyard meetings and food demonstrations needed one hour each. The daily workload estimates do not include the time needed to go to the villages where the beneficiaries were located or the time to move to different households. They also do not include the time for accompanying some beneficiaries to health facilities for growth monitoring and nutrition counseling services, or the time for the monthly meetings at the health facilities or the cluster office. Thus, CNPs had a heavy workload.
If we consider that it might have taken 10 to 15 minutes for the movement from one house to another and exchange of greetings, then, the actual information exchange between the recipients and CNPs might have been between 15 to 20 minutes. This time might not have been sufficient to provide individual and effective communication efforts. An hourly session of courtyard meetings and food demonstrations might have not been sufficient to draw the individual attention of each of the participants, mainly because the CNPs had to spend time inviting and gathering the target participants from the neighborhood. There might have been a more difficult situation between those times when some CNPs quit their job and were then replaced by new recruits.
Table 8. CNP workload, total monthly and per CNP
Sept. 2019 Oct. 2019 Nov. 2019 Dec. 2019 Mean
Number of CNPs 470 466 462 463 465
Activities per month Number of women with under-2 children visited by CNPs 95,707 62,644 58,665 61,463 69,620
Number of pregnant women visited by CNPs 32,889 30,559 28,991 31,092 30,883
Number of courtyard meetings conducted by CNPs 10,697 10,329 10,380 10,296 10,426 Number of food preparation demonstrations conducted by CNPs 18,264 20,512 19,566 20,499 19,710
Daily workload per CNP*
# of women with under-2 children and number of pregnant women visited per CNP per day 13 9 9 9 10
# of courtyard meetings and food demonstrations per CNP per day 3 3 3 3 3
Estimated actual daily time in hours spent conducting visits and demonstrations 9.4 7.2 7.6 7.9 8.0
*Calculations based on volume of CNP activities conducted per month (see also Appendix D).

Evaluation of the INCA Project in Bangladesh 43
5.7.3. Health Facility Characteristics Under the INCA project, it was expected that there would be an increase in utilization of nutritional services from health facilities such as CCs and FWCs. The project also aimed to improve the nutrition-service readiness of the above facilities as well as community awareness of nutrition services through community mobilization activities. We found from facility assessments that all the sampled facilities offered nutrition services and had staff in charge of these activities. Between baseline and endline, the proportion of facilities with at least one staff trained in GMP in the last two years increased in INCA areas but decreased in comparison areas (Table 9). In terms of availability of resources, presence of GMP guidelines increased by 15 percentage points in INCA areas, and by 38 percentage points in comparison areas. Availability of other relevant resources like MUAC table, child growth chart, and height-for-age table decreased in both INCA and comparison areas.
Though the availability of functional baby weighing scales increased more in comparison areas than INCA areas (by 22 and 9 percentage points, respectively) between baseline and endline, the availability of child weighing scales only increased in INCA areas (17 percentage points) during this period (Table 9). The availability of functional infant length meters slightly decreased in both INCA and comparison areas between baseline and endline.
Table 9. Facility readiness in INCA and comparison areas during baseline and endline, endline 2019
Indicators
INCA area (%) Comparison area (%)
Baseline Endline Diff Baseline Endline Diff
Percentage of facilities offering nutrition services 100 100 0 100 100 0
Percentage of facilities having staff in charge of nutrition 100 100 0 100 100 0
Percentage of facilities providing GMP services 88 95 7 90 84 -6
At least one staff trained on GMP in last two years 32 60 28 65 44 -21
Presence of growth monitoring and promotion guidelines 69 84 15 50 88 38
Presence of MUAC-for-age tables 24 10 -14 14 6 -8
Presence of weight-for-age tables/child health growth charts
60 52 -8 46 36 -10
Presence of height-for-age tables 45 42 -3 25 24 -1
Functional baby weighing scales available 53 62 9 35 57 22
Functional child weighing scales available 19 36 17 28 27 -1
Functional infantometers (infant length meter) available 17 12 -5 9 2 -7
Number of facilities 223 230 224 227

44 Evaluation of the INCA Project in Bangladesh
6. Discussion
6.1. About the Project and Key Findings The Project The INCA project was targeted to “1,000-day households” (households having pregnant women, lactating mothers, children age two or younger) located in 11 hard-to-reach and disadvantaged coastal upazilas of the Bhola, Laxmipur, and Noakhali districts (an estimation suggests that there were about 3,004,228 people, including 106,420 pregnant women and 100,407 live births, in 2015 in these upazilas.). INCA used an array of interventions implemented mainly through a core of about 471 community nutrition promoters (CNPs). The CNPs counselled pregnant women and mothers of children under age two through sessions at the household, community, and facility levels. In addition, the project facilitated linking women and communities with health facilities (predominantly CCs and FWCs). INCA also built the nutrition skills of selected members of existing community clinic-based support groups (CCSGs) to act as nutrition focal points and form community nutrition support groups (CNSGs).
These interventions were expected to bring about improvements in nutrition knowledge and related practices, resulting in a decrease of stunting and underweight of children under two years of age. It was also expected that there would be an increase in utilization of nutritional services from CCs and FWCs. The project also aimed to improve the nutrition-service readiness of the above facilities as well as community awareness of nutrition services through community mobilization activities.
The primary activities of the CNPs were to: (1) identify (a) mothers with children under two years of age and (b) pregnant women; (2) register them through household visitations; and (3) subsequently visit the women mentioned above on a monthly basis to provide nutrition information and demonstrate healthy nutrition practices through household visits, sessions at courtyard meetings, facilities and special events, and food demonstrations. These activities continued from November 2018 through December 2019 in the project area.
This impact evaluation undertook baseline (conducted September 2017–January 2018) and endline (conducted November 2019–January 2020) surveys of mothers with children under two years of age and pregnant women residing in the project and comparison areas (eight upazilas bordering/neighboring the INCA areas). The surveys collected information on: (1) the coverage of and exposure to INCA interventions; (2) nutrition knowledge and practices; and (3) anthropometric indicators of the target groups (children under age two and pregnant women). Impact is estimated through the DID analysis—i.e., by measuring the changes in the project area during the project period and comparing the changes in the comparison area.
Key Findings Service provision level: The CNPs were well educated (75% with 10–13 years of schooling and 23% with 14 or more years). Over 40% had previous experience working in similar interventions; and all received INCA training, refreshers, and orientations. However, one-third of the CNPs dropped out of the project, which loosened the relationship between the beneficiaries and the CNPs and may have hindered the project coverage. Almost all facilities in the INCA areas reported providing GMP services; 60% reported receiving training for at least one staff, and 84% reported having GMP guidelines. However, at the endline, only 42% of facilities had height-for-age tables, an essential tool for child growth monitoring; only 36% and 62% of facilities had child and baby weighing machines, respectively; and only 12% of facilities had infant length meters. Thus, the facilities suffered from inadequacies in the provision of appropriate growth monitoring services due to the lack of necessary equipment.
Community level: At the endline survey, 37% of mothers with children under age two and 23% of pregnant women reported that they were registered by CNPs. About 12% of mothers with children under age two reported that they were exposed to INCA intervention activities in the three months preceding the endline

Evaluation of the INCA Project in Bangladesh 45
survey; this exposure was 27% among registered mothers with children under age two. Among pregnant women,15% reported being exposed to INCA activities in the project area while 54% of registered pregnant women reported exposure. Knowledge of exclusive breastfeeding and minimum acceptable diet increased in both project and comparison areas, and the increase was significantly higher in INCA areas, indicating program impact in these two indicators. There were no changes in the knowledge of critical times when handwashing with soap is necessary in both project and comparison areas. These knowledge indicators were similar between registered and non-registered mothers. These results indicate a limited project effect in increasing nutrition-related knowledge.
Nutritional practices of mothers with children under two years of age and pregnant women moderately changed in both INCA intervention and comparison areas almost equally, indicating no definitive project effect. However, INCA-registered lactating women showed improved practices compared to non-registered women. The nutrition practices include minimal acceptable diet and a diet of minimum diversity for children under age two and lactating and pregnant women. Awareness about nutrition-services and availability of maternal and child health services increased in both project and comparison areas. However, INCA-registered women had higher awareness than non-registered women. The utilization of nutrition services or growth monitoring by children under age two increased from low to moderate levels in both project and comparison areas; however, utilization of services was higher among registered women than non-registered women. There was no effect of the project on ANC, PNC, or skilled birth attendance, but these indicators were higher among registered than non-registered women within the INCA areas.
One point to be noted is that the project did not introduce any new information or messaging to the beneficiaries. It used only GOB-approved messages and materials which already had proven impact. All the social behavior change communication (SBCC) messages that were used were developed for blanket communities and may not have been appropriate for a hard to reach area or population. In addition, the project started with a package of interventions with a comprehensive SBCC approach. The short duration of the project (26 months of implementation) did not enable it to bring massive changes in implementation strategy, which might have led to better impact.
The project had an impact in reducing underweight of children ages 0–23 months, but it did not have any effect on improving stunting of children ages 0–23 months and women with children under two years of age. Within the INCA areas, there were no differences between the INCA-registered women and non-registered women, except that underweight was lower among INCA-registered lactating mothers.
6.2. Programmatic Implications The limited effect of the INCA project can be explained in the following ways: poor (or low) coverage or reach of the program; low levels of exposure of the target population to intervention activities; low to moderate levels of improvements of knowledge, practice, and service utilization among those who were reached; and inadequacies in the facilities to provide appropriate growth monitoring services.
The poor coverage of the target population is likely associated with CNPs’ lack of skills in identifying mothers with children under two years of age and pregnant women. Field workers need to use a certain algorithm for identifying such demographic groups. Data collection agencies use such algorithms and thus, in most cases, are able to identify the group in question; it is not clear if the CNPs were taught about the algorithm for identifying the groups of mothers or women they were looking for.
For some indicators, especially certain knowledge and practice indicators, the registered group fared better than the non-registered one, but the strength of improvement was not that substantial for practice and knowledge indicators. Given the better practice and knowledge among registered participants, would the project have an impact if the reach were higher? Could the project have an impact if it were run for three or four years? The answer lies in the degree of reach and exposure of the project, which we saw was very low in
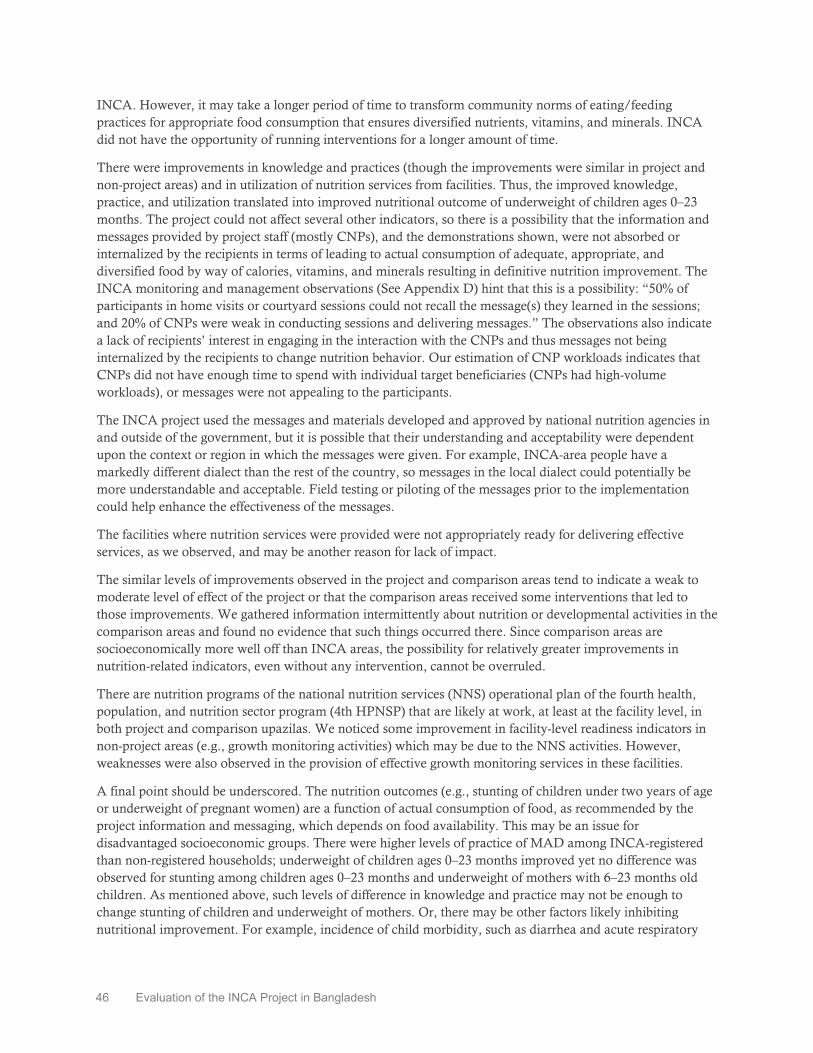
46 Evaluation of the INCA Project in Bangladesh
INCA. However, it may take a longer period of time to transform community norms of eating/feeding practices for appropriate food consumption that ensures diversified nutrients, vitamins, and minerals. INCA did not have the opportunity of running interventions for a longer amount of time.
There were improvements in knowledge and practices (though the improvements were similar in project and non-project areas) and in utilization of nutrition services from facilities. Thus, the improved knowledge, practice, and utilization translated into improved nutritional outcome of underweight of children ages 0–23 months. The project could not affect several other indicators, so there is a possibility that the information and messages provided by project staff (mostly CNPs), and the demonstrations shown, were not absorbed or internalized by the recipients in terms of leading to actual consumption of adequate, appropriate, and diversified food by way of calories, vitamins, and minerals resulting in definitive nutrition improvement. The INCA monitoring and management observations (See Appendix D) hint that this is a possibility: “50% of participants in home visits or courtyard sessions could not recall the message(s) they learned in the sessions; and 20% of CNPs were weak in conducting sessions and delivering messages.” The observations also indicate a lack of recipients’ interest in engaging in the interaction with the CNPs and thus messages not being internalized by the recipients to change nutrition behavior. Our estimation of CNP workloads indicates that CNPs did not have enough time to spend with individual target beneficiaries (CNPs had high-volume workloads), or messages were not appealing to the participants.
The INCA project used the messages and materials developed and approved by national nutrition agencies in and outside of the government, but it is possible that their understanding and acceptability were dependent upon the context or region in which the messages were given. For example, INCA-area people have a markedly different dialect than the rest of the country, so messages in the local dialect could potentially be more understandable and acceptable. Field testing or piloting of the messages prior to the implementation could help enhance the effectiveness of the messages.
The facilities where nutrition services were provided were not appropriately ready for delivering effective services, as we observed, and may be another reason for lack of impact.
The similar levels of improvements observed in the project and comparison areas tend to indicate a weak to moderate level of effect of the project or that the comparison areas received some interventions that led to those improvements. We gathered information intermittently about nutrition or developmental activities in the comparison areas and found no evidence that such things occurred there. Since comparison areas are socioeconomically more well off than INCA areas, the possibility for relatively greater improvements in nutrition-related indicators, even without any intervention, cannot be overruled.
There are nutrition programs of the national nutrition services (NNS) operational plan of the fourth health, population, and nutrition sector program (4th HPNSP) that are likely at work, at least at the facility level, in both project and comparison upazilas. We noticed some improvement in facility-level readiness indicators in non-project areas (e.g., growth monitoring activities) which may be due to the NNS activities. However, weaknesses were also observed in the provision of effective growth monitoring services in these facilities.
A final point should be underscored. The nutrition outcomes (e.g., stunting of children under two years of age or underweight of pregnant women) are a function of actual consumption of food, as recommended by the project information and messaging, which depends on food availability. This may be an issue for disadvantaged socioeconomic groups. There were higher levels of practice of MAD among INCA-registered than non-registered households; underweight of children ages 0–23 months improved yet no difference was observed for stunting among children ages 0–23 months and underweight of mothers with 6–23 months old children. As mentioned above, such levels of difference in knowledge and practice may not be enough to change stunting of children and underweight of mothers. Or, there may be other factors likely inhibiting nutritional improvement. For example, incidence of child morbidity, such as diarrhea and acute respiratory
Evaluation of the INCA Project in Bangladesh 47
illness, probably was high and interrupted nutritional growth. The evaluation team did not collect any morbidity information.
6.3. Limitations Obtaining a comparison group with similar characteristics to the INCA areas was a limitation for the impact evaluation. The comparison area had higher levels of education, more households were in the upper asset quintiles, and had less disadvantageous and/or hard-to-reach localities than the project area. We included control variables and cluster-level fixed effects in impact estimation models, but it is likely that other unobserved factors influencing the outcomes examined in the evaluation were not controlled for appropriately. If that is the case, the “parallel trends” assumption—on which the validity of DID models rest—will not be held.
In terms of measurement issues, did the survey appropriately measure the degree of reach and exposure? We feel the indicators “registered in INCA” and “had a contact with CNP or participated in INCA activities” are robust. The surveys commonly use such indicators in measuring program reach; e.g., “Were you contacted by FP workers in the last three or six months?” is commonly used in program planning and monitoring. However, nutrition status measured by anthropometric indicators is a tangible outcome—i.e., it does not suffer from reporting error—and the baseline and endline timing of the surveys was appropriate to rightly capture the project impact.
6.4. Lessons Learned The field implementation of the INCA project was for 26 months; thus, it is a short-term project. A midterm project evaluation is not usually undertaken for such short-term projects, but such an evaluation is useful in understanding the appropriateness and limitations of the intervention package. Projects benefit from midterm evaluations as they can adjust, revise, and thus improve the modus operandi for the rest of the project period. The INCA project did not have such a chance, but tried to improve its intervention processes through monitoring and supervision activities and resultant feedback. However, it is not clear if processes improved over the life of the project. Having some a priori procedures to identify the appropriateness of its intervention methods in the initial months would have been useful. It would also have been important to understand if the coverage of the target population was at an acceptable level.
Although the coverage or reach of INCA interventions was low, it was similar across socioeconomic groups meaning that the project did not deliberately exclude any section(s) of the community.
Child morbidity is a nutrition-inhibiting factor. Collecting some information on child morbidity could have been useful for the evaluation.

48 Evaluation of the INCA Project in Bangladesh
7. Recommendations
The success of a community-based program like INCA that aims to improve nutrition knowledge and practice, and thus improve nutrition status, likely depends on the extent of the program reach and target beneficiaries’ exposure to interventions. Information should be effectively provided to the beneficiaries so that they internalize the intrinsic meaning of the messages and translate that to practice. Messages must be simple but interesting so that the beneficiaries find them appealing. A minimum amount of time needs to be allocated to have a meaningful interaction between the CNPs and the beneficiary women. From the provider side, for service provision to be the best possible, facilities must at least be ready with supplies and essential services. Based on our impact evaluation findings, we offer recommendations which we feel will be useful for policy formulation.
Table 10. Evidence from INCA endline and recommendations, endline 2019
Evidence Recommendation For some knowledge and practice indicators, INCA-registered participants did better than their non-registered counterparts, but that improvement among the registered group did not lead to an impact on all outcomes. This indicates possible weakness in the process of message provision or inadequacies in the messages themselves.
Future community-based nutrition intervention projects should consider evaluating their messages to see how much of the message content is understood and internalized by the recipients to affect nutrition-related behaviors and outcomes. Also, the understandability and acceptance of the messages should be pre- or field-tested locally in the project areas prior to the full-fledged dissemination of the messages.
The poor coverage of the target population is likely associated with CNPs’ lack of skills in identifying mothers with children under two years of age and pregnant women.
Whenever there is a special target demographic group, emphasis should be given to their identification. Necessary training should be given to health workers, including providing appropriate trainers.
The workload of CNPs was high; on an average, visitation of 10 women and conduction of two courtyard meetings and a food demonstration per day per CNP did not allow effective communication with clients.
The project should make a better assessment of the human resources needed in the field (that is, CNPs) to obtain complete coverage of the target population under the actual conditions of the target communities.
There is a low level of exposure of the target population to intervention activities, such as CNPs’ and other providers’ interactions with participants at home visits, courtyard meetings, and nutrition demonstrations.
Future projects should attempt to enhance the intensity of intervention exposure to impart effective messages.
Inadequacies in the facilities to provide appropriate growth monitoring services (in INCA areas at the endline, only 42% facilities had height-for-age tables, an essential tool for child growth monitoring; only 36% and 62% of facilities had child and baby weighing machines, respectively; and only 12% of facilities had infant length meters). The facilities did not receive any new equipment during the INCA period, and supplies were delayed most of the time.
The national nutrition services operational plan of the 4th HPNSP should improve its supply chain system to maintain adequate stock of equipment and essentials to facilitate uninterrupted growth monitoring services.
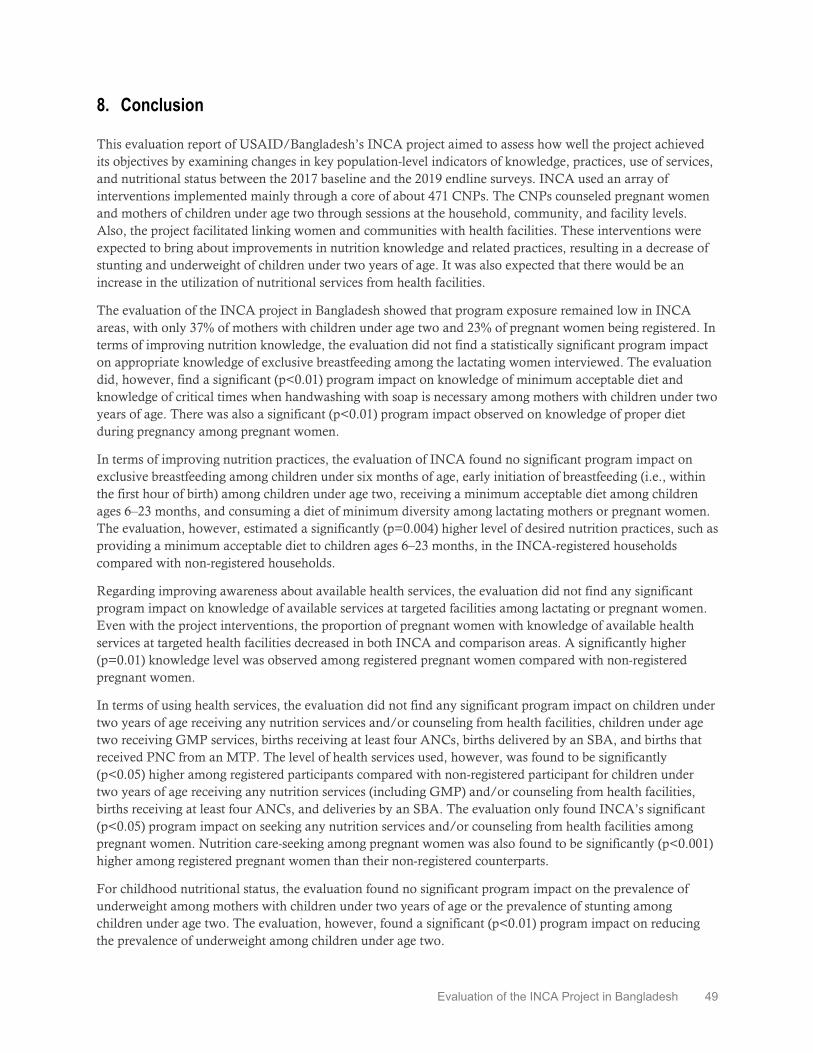
Evaluation of the INCA Project in Bangladesh 49
8. Conclusion
This evaluation report of USAID/Bangladesh’s INCA project aimed to assess how well the project achieved its objectives by examining changes in key population-level indicators of knowledge, practices, use of services, and nutritional status between the 2017 baseline and the 2019 endline surveys. INCA used an array of interventions implemented mainly through a core of about 471 CNPs. The CNPs counseled pregnant women and mothers of children under age two through sessions at the household, community, and facility levels. Also, the project facilitated linking women and communities with health facilities. These interventions were expected to bring about improvements in nutrition knowledge and related practices, resulting in a decrease of stunting and underweight of children under two years of age. It was also expected that there would be an increase in the utilization of nutritional services from health facilities.
The evaluation of the INCA project in Bangladesh showed that program exposure remained low in INCA areas, with only 37% of mothers with children under age two and 23% of pregnant women being registered. In terms of improving nutrition knowledge, the evaluation did not find a statistically significant program impact on appropriate knowledge of exclusive breastfeeding among the lactating women interviewed. The evaluation did, however, find a significant (p<0.01) program impact on knowledge of minimum acceptable diet and knowledge of critical times when handwashing with soap is necessary among mothers with children under two years of age. There was also a significant (p<0.01) program impact observed on knowledge of proper diet during pregnancy among pregnant women.
In terms of improving nutrition practices, the evaluation of INCA found no significant program impact on exclusive breastfeeding among children under six months of age, early initiation of breastfeeding (i.e., within the first hour of birth) among children under age two, receiving a minimum acceptable diet among children ages 6–23 months, and consuming a diet of minimum diversity among lactating mothers or pregnant women. The evaluation, however, estimated a significantly (p=0.004) higher level of desired nutrition practices, such as providing a minimum acceptable diet to children ages 6–23 months, in the INCA-registered households compared with non-registered households.
Regarding improving awareness about available health services, the evaluation did not find any significant program impact on knowledge of available services at targeted facilities among lactating or pregnant women. Even with the project interventions, the proportion of pregnant women with knowledge of available health services at targeted health facilities decreased in both INCA and comparison areas. A significantly higher (p=0.01) knowledge level was observed among registered pregnant women compared with non-registered pregnant women.
In terms of using health services, the evaluation did not find any significant program impact on children under two years of age receiving any nutrition services and/or counseling from health facilities, children under age two receiving GMP services, births receiving at least four ANCs, births delivered by an SBA, and births that received PNC from an MTP. The level of health services used, however, was found to be significantly (p<0.05) higher among registered participants compared with non-registered participant for children under two years of age receiving any nutrition services (including GMP) and/or counseling from health facilities, births receiving at least four ANCs, and deliveries by an SBA. The evaluation only found INCA’s significant (p<0.05) program impact on seeking any nutrition services and/or counseling from health facilities among pregnant women. Nutrition care-seeking among pregnant women was also found to be significantly (p<0.001) higher among registered pregnant women than their non-registered counterparts.
For childhood nutritional status, the evaluation found no significant program impact on the prevalence of underweight among mothers with children under two years of age or the prevalence of stunting among children under age two. The evaluation, however, found a significant (p<0.01) program impact on reducing the prevalence of underweight among children under age two.

50 Evaluation of the INCA Project in Bangladesh
Whilst the null effect of INCA for the majority of indicators can be explained by low levels of exposure of the target population to intervention activities, the poor coverage of the target population is likely to be associated with CNPs’ capacity in identifying mothers with children under two years of age and pregnant women. The field implementation of INCA was for 26 months—translating nutritional knowledge into practices by transforming community norms may also take a longer period of time and observing changes in indicators in chronic undernutrition (e.g., low BMI among mothers, stunting among children) may not be possible during a short-term project like this. However, INCA’s impact on reducing underweight among children is encouraging for areas with exceptionally high child undernutrition status. The evaluation results indicate the need to focus on specific programmatic components to achieve the desired program impact in the future.

Evaluation of the INCA Project in Bangladesh 51
9. References
Angeles, G., Khan, S.K., Rahman, M., Chakraborty, N., Bartaki, S., & Escudero, G. (2019). Improving Nutrition through Community-Based Approaches in Bangladesh: 2017 Baseline Survey. Chapel Hill, NC, USA: MEASURE Evaluation, University of North Carolina.
Bangladesh Bureau of Statistics (BBS). (1994). Report on Sample Vital Registration in Bangladesh 1988-1992. Dhaka, Bangladesh: BBS.
Bangladesh Bureau of Statistics (BBS) and UNICEF Bangladesh. (2014). Progotir Pathey: Bangladesh Multiple Indicator Cluster Survey 2012-2013, Key District Level Findings. Dhaka, Bangladesh: BBS.
Bangladesh Bureau of Statistics (BBS). (2018). Report on Bangladesh Sample Vital Statistics 2017. Dhaka, Bangladesh: BBS.
Feed the Future: Bangladesh Country Program. Available at: https://www.feedthefuture.gov/country/bangladesh/ (Accessed on 20 May 2020).
Government of Bangladesh (GOB), Planning Commission. (2018). Bangladesh Economic Review 2018. Dhaka, Bangladesh: GOB Planning Commission.
Haddad, L. (2002). Nutrition and Poverty. In: Nutrition: A Foundation for Development. Geneva, Switzerland: United Nations Administrative Committee on Coordination/Sub-Committee on Nutrition.
Mosites, E.M., Hackleman, R., Weum, K.L., Pintye, J.I., Manhart, L.E., Hawes, S.E. (2012). Bangladesh ORS case study. Seattle, Washington: University of Washington Global Health Start Program.
National Institute of Population Research and Training (NIPORT) & ICF. (2019). Bangladesh Demographic and Health Survey 2017-18: Key Indicators Report. Dhaka, Bangladesh, and Rockville, Maryland, USA: NIPORT and ICF.

52 Evaluation of the INCA Project in Bangladesh
Appendix A. Summary Tables by INCA Project and Comparison Areas
Table A.1. Indicators by project and comparison area, by baseline and endline, by difference between endline and baseline in project and comparison area, simple DID, and impact
INCA intervention area
INCA comparison area
DID Impact
(SE) B E Diff
(E-B) B E Diff
(E-B) Nutrition-related knowledge
Percentage of lactating women with appropriate knowledge of exclusive breastfeeding
55.1 72.8 17.7*** 54.1 69.1 15.0*** 2.6 3.4 (4.6)
Number a 1,048 1,036 - 959 1,048 - 4,091 4,003 Percentage of mothers with 6-23 months children with knowledge of minimum acceptable diet
68.1 82.2 14.1*** 64.3 71.3 7.0*** 7.2*** 6.6*** (2.4)
Number a 4,114 3,902 - 3,721 3,796 - 15,533 15,527 Percentage of mothers of 0-23 months children with knowledge of critical times when hand washing with soap is necessary
26.8 30.0 3.2** 34.2 33.5 -0.7 3.9* 4.0* (2.1)
Number a 4,114 3,902 - 3,721 3,796 - 15,533 15,527 Percentage of pregnant women with knowledge of proper diet during pregnancy 62.5 60.8 -1.6 70.4 53.2 -17.1*** 15.5*** 15.9***
(4.0) Number a 1,058 1,469 - 770 1,047 - 4,344 4,344
Nutritional practices Percentage of lactating mothers of children age 0-23 months consuming a diet of minimum diversity
48.3 56.8 8.5*** 51.5 59.9 8.4*** 0.03 0.3 (2.1)
Number a 4,048 3,846 - 3,604 3,705 - 15,202 15,194 Percentage of children age 0-23 months who initiated breastfeeding within 1 hour of birth 68.7 69.4 0.7 60.8 59.5 -1.2 1.9 2.2
(2.4) Number a 4,103 3,895 - 3,707 3,795 - 15,500 15,495 Percentage of children age 0-5 months exclusively breastfed 83.7 87.3 3.5* 79.2 84.3 5.2** -1.6 -1.5
(2.4) Number a 1,051 1,036 - 963 1,051 - 4,101 4,012 Percentage of children 6-23 months receiving a minimum acceptable diet 30.3 33.5 3.2** 30.5 32.8 2.3 0.9 1.4
(2.2) Number a 3,053 2,859 - 2,745 2,743 - 11,400 11,483 Percentage of pregnant women consuming a diet of minimum diversity 52.3 62.1 9.7*** 59.2 66.7 7.5*** 2.2 2.8
(3.8) Number a 1,058 1,469 - 770 1,047 - 4,344 4,344
Awareness about availability of health services
Percentage of lactating women with knowledge of at least two health services at targeted community clinics
40.4 50.2 9.7*** 30.7 38.6 7.9*** 1.8 1.6 (3.1)
Number a 4,114 3,902 - 3,721 3,796 - 15,533 15,527 Percentage of pregnant women with knowledge of at least two health services at targeted community clinics
40.9 32.2 -8.7*** 32.1 19.6 -12.5*** 3.8 2.0 (3.6)
Number a 1,058 1,469 - 770 1,047 - 4,344 4,344 Access to and use of health facilities/services
Percentage of children age 0-23 months who received nutrition services or counseling from health facilities in the last 3 months
3.7 15.0 11.3*** 4.8 15.7 10.9*** 0.4 0.4 (1.5)
Number a 4,103 3,895 - 3,707 3,795 - 15,500 15,495

Evaluation of the INCA Project in Bangladesh 53
INCA intervention area
INCA comparison area
DID Impact
(SE) B E Diff
(E-B) B E Diff
(E-B) Percentage of children age 0-23 months who received growth monitoring services from a health facility in the last 3 months
3.0 11.0 8.0*** 4.6 13.6 9.0*** -1.1 -1.1 (1.3)
Number a 4,103 3,895 - 3,707 3,795 - 15,500 15,495 Percentage of births who received ANC4+ with at least one from a MTP 15.1 17.7 2.7** 23.5 24.2 0.7 2.0 2.7*
(1.4) Number a 4,114 3,902 - 3,721 3,796 - 15,533 15,527
Percentage of deliveries by a SBA 19.5 25.2 5.7*** 32.3 39.6 7.3*** -1.6 -0.7 (1.5)
Number a 4,114 3,902 - 3,721 3,796 - 15,533 15,527 Percentage of births who received PNC from a MTP 18.5 25.1 6.6*** 30.9 39.3 8.3*** -1.7 -0.8
(1.5) Number a 4,114 3,902 - 3,721 3,796 - 15,533 15,527 Percentage of pregnant women seeking any nutrition services/counseling from health facilities in the last 3 months
6.5 24.9 18.4*** 12.1 23.8 11.7*** 6.7** 5.8 (2.9)
Number a 1,058 1,469 - 770 1,047 - 4,344 4,344 Nutritional status
Percentage of mothers of children 6-23 months who are under-weight (BMI<18.5) 24.1 18.0 -6.0*** 19.9 15.8 -4.2*** -1.8 -1.2
(1.5) Number a 3,053 2,859 - 2,745 2,743 - 11,400 11,483 Percentage of children age 0-23 months who are stunted 28.6 30.7 2.1 22.6 24.7 2.1* 0.0 -0.15
(1.8) Number a 4,130 4,069 - 3,620 3,753 - 15,573 15,624 Percentage of children 0-23 months who are under-weight 24.4 17.8 -6.6*** 18.8 15.1 -3.7*** -2.8** -2.9**
(1.3) Number a 4,130 4,069 - 3,620 3,753 - 15,573 15,624
Note: Significance tests were conducted with the significance levels as: * p<0.10, ** p<0.05, and *** p<0.01. Note: “B” – 2017 baseline survey; “E’”– 2019 endline survey; “Diff(E-B)” – difference between the endline and baseline values of the indicator; “DID” – difference-in-difference, i.e., “Diff(E-B)” in intervention area minus “Diff(E-B)” in comparison area; and “Impact” – program impact on the indicator obtained as an interaction coefficient of time (baseline and endline) and program area (intervention and comparison) based on linear probability model controlling for necessary background characteristics. The indicators are disaggregated by background characteristics and may be found in Appendix C. a Weighted numbers are reported for all columns except for the last column presenting impact. For the last column, the numbers are observations used in the linear probability model. Lactating mothers with knowledge of health services at community clinics (CCs): Lactating mother is counted if she can remember any two of the following health services: ANC, nutrition counseling, micronutrient supplementation, growth monitoring and promotion (GMP), delivery services, family planning, and immunization. Pregnant woman is counted if she can remember any two of the following health services: ANC, nutrition counseling, micronutrient supplementation, GMP, delivery services, family planning, and immunization. Minimum acceptable diet (MAD) for 6–23 months children: Is defined as receiving minimum food groups with a minimum frequency. Food groups: (a) infant formula, milk other than breast milk, cheese or yogurt, or other milk products; (b) foods made from grains, roots, and tubers, including porridge and fortified baby food from grains, pastry; (c) vitamin A-rich fruits and vegetables (and oil, butter); (d) other fruits and vegetables; (e) eggs; (f) meat, poultry, fish, and shellfish (and organ meats); (g) legumes and nuts. Minimum meal frequency among breastfed children: At least twice a day for breastfed infants ages six to eight months and at least three time a day for breastfed children ages nine to twenty-three months. Milk or milk product for non-breastfed children: Includes two or more feedings of commercial infant formula, fresh, tinned, and powdered animal milk, and yogurt. Minimum meal frequency among non-breastfed children: Minimum meal frequency is receiving solid or semisolid food or milk feeds at least four times a day. MAD among non-breastfed children: Fed with other milk or milk products at least twice a day; receive solid or semisolid foods from at least four food groups not including the milk or milk products food group; and receive the minimum meal frequency. Diet of minimum diversity for lactating mother: Refers to consuming foods from at least four of eight groups. Food groups: grains/white roots; pulses/nuts and seeds; dairy; meat; poultry, and fish; eggs; dark green leafy vegetables; vit-A rich fruits and vegetables; and other fruits and vegetables Underweight mother (BMI<18.5): The body mass index (BMI) is expressed as the ratio of weight in kilograms to the square of height in meters (kg/m2). Pregnant women and women with a birth in the preceding six months are excluded. Stunting and underweight among children: The two indicators are based on children who stayed in the household on the night before the interview. Each indicator is expressed in standard deviation (SD) units from the median of the WHO Child Growth Standards adopted in 2006. The indicators are measured for children with valid dates of birth (month and year) and valid measurements of both height and weight. Children whose mothers were not interviewed are excluded. Children with SD of height-for-age <-2.0 are defined as stunted and children with SD of weight-for-age < -2.0 are defined as underweight.

54 Evaluation of the INCA Project in Bangladesh
Appendix B. Summary Tables by INCA-Registered and Non-Registered Participants Table B.1. Indicator summary table by INCA registration status, project area, 2019 endline
Registered by INCA
Percentage Number Yes No Diff(Y-N) Yes No
Nutrition-related knowledge Percentage of lactating women with appropriate knowledge of exclusive breastfeeding 73.6 72.4 1.2 388 648
Percentage of mothers with 6-23 months children with knowledge of minimum acceptable diet 83.6 81.4 2.1 1,451 2,452
Percentage of mothers of 0-23 months children with knowledge of critical times when hand washing with soap is necessary 31.8 28.9 3.0 1,451 2,452
Percentage of pregnant women with knowledge of proper diet during pregnancy 62.7 60.3 2.4 344 1,125
Nutritional practices Percentage of lactating mothers of children ages 0-23 months consuming a diet of minimum diversity 59.8 55.0 4.8** 1,428 2,418
Percentage of children ages 0-23 months who initiated breastfeeding within 1 hour of birth 70.2 68.9 1.3 1,448 2,447
Percentage of children ages 0-5 months exclusively breastfed 87.6 87.1 0.6 387 649 Percentage of children ages 6-23 months receiving a minimum acceptable diet 37.4 31.2 6.2*** 1,061 1,798
Percentage of pregnant women consuming a diet of minimum diversity 65.9 60.9 5.0 344 1,125
Awareness about availability of health services Percentage of lactating women with knowledge of at least two health services at targeted community clinics 59.2 44.8 14.4*** 1,451 2,452
Percentage of pregnant women with knowledge of at least two health services at targeted community clinics 46.2 28.0 18.2*** 344 1,125
Access to and use of health facilities/services Percentage of children ages 0-23 months who received nutrition services or counseling from health facilities in the last 3 months 21.9 10.9 11.0*** 1,448 2,447
Percentage of children ages 0-23 months who received growth monitoring services from a health facility in the last 3 months 15.9 8.2 7.7*** 1,448 2,447
Percentage of births who received ANC4+ with at least one from MTP 21.6 15.4 6.2*** 1,451 2,452 Percentage of deliveries by SBA 28.7 23.2 5.5*** 1,451 2,452 Percentage of births who received PNC from MTP 28.1 23.3 4.8** 1,451 2,452 Percentage of pregnant women seeking any nutrition services/counseling from health facilities in the last 3 months 42.2 19.6 22.5*** 344 1,125
Nutritional status Percentage of mothers of children ages 6-23 months who are under-weight (BMI<18.5) 15.6 19.5 -3.9** 1,061 1,798
Percentage of children ages 0-23 months who are stunted 30.8 30.4 0.5 1,506 2,528 Percentage of children ages 0-23 months who are under-weight 17.3 18.1 -0.9 1,506 2,528
Note: Significance tests of “Diff(Y-N)” were conducted with the significance levels as: * p<0.10, ** p<0.05, and *** p<0.01. Lactating mothers with knowledge of health services at community clinics (CCs): Lactating mother is counted if she can remember any two of the following health services: ANC, nutrition counseling, micronutrient supplementation, growth monitoring and promotion (GMP), delivery services, family planning, and immunization. Pregnant woman is counted if she can remember any two of the following health services: ANC, nutrition counseling, micronutrient supplementation, GMP, delivery services, family planning, and immunization. Minimum acceptable diet (MAD) for 6-23 months children: Is defined as receiving minimum food groups with a minimum frequency. Food groups: (a) infant formula, milk other than breast milk, cheese or yogurt or other milk products; (b) foods made from grains, roots, and tubers, including porridge and fortified baby food from grains, pastry ; (c) vitamin A-rich fruits and vegetables (and oil, butter); (d) other fruits and vegetables; (e) eggs; (f) meat, poultry, fish, and shellfish (and organ meats); (g) legumes and nuts. Minimum meal frequency among breastfed children: At least twice a day for breastfed infants ages six to eight months and at least three times a day for breastfed children ages nine to twenty-three months. Milk or milk product for non-breastfed children: Includes two or more feedings of commercial infant formula, fresh, tinned, and powdered animal milk, and yogurt. Minimum meal frequency among non-breastfed children: Minimum meal frequency is receiving solid or semisolid food or milk feeds at least four times a day. MAD among non-breastfed children: Fed with other milk or milk products at least twice a day; receive solid or semisolid foods from at least four food groups not including the milk or milk products food group; and receive the minimum meal frequency. Diet of minimum diversity for lactating mother: Refers to consuming foods from at least four of eight groups. Food groups: grains/white roots; pulses/nuts and seeds; dairy; meat; poultry, and fish; eggs; dark green leafy vegetables; vitamin-A rich fruits and vegetables; and other fruits and vegetables. Underweight mother (BMI<18.5): The body mass index (BMI) is expressed as the ratio of weight in kilograms to the square of height in meters (kg/m2). Pregnant women and women with a birth in the preceding six months are excluded. Stunting and underweight among children: The two indicators are based on children who stayed in the household on the night before the interview. Each indicator is expressed in standard deviation (SD) units from the median of the WHO Child Growth Standards adopted in 2006. The indicators are measured for children with valid dates of birth (month and year) and valid measurements of both height and weight. Children whose mothers were not interviewed are excluded. Children with SD of height-for-age <-2.0 are defined as stunted and children with SD of weight-for-age < -2.0 are defined as underweight.

Evaluation of the INCA Project in Bangladesh 55
Appendix C. INCA Endline Survey Detailed Tables Table C.1. Percentage of lactating women with appropriate knowledge of exclusive breastfeeding, by background characteristics, INCA 2017 baseline and 2019 endline
Percentage Number INCA
intervention INCA
comparison INCA
intervention INCA
comparison B E E-B B E E-B B E B E
Mother's age <20 56.1 67.7 11.6 49.3 68.8 19.5 344 251 298 238 20-24 58.0 73.8 15.8 55.8 70.7 14.9 325 316 339 311 25-29 54.8 74.9 20.1 57.0 66.9 9.9 232 204 200 231 30+ 47.3 74.9 27.6 55.9 69.2 13.3 147 266 121 268
Parity 1 57.8 67.8 10.0 54.0 72.5 18.5 326 287 350 370 2 57.0 76.7 19.7 52.5 68.5 16.0 289 313 310 341 3+ 51.9 73.4 21.5 55.7 65.9 10.2 432 436 299 337
Education No education 45.3 64.6 19.3 42.6 63.0 20.4 93 107 50 41 Primary incomplete 47.6 67.0 19.4 44.4 61.4 17.0 319 290 168 168 Primary complete 55.5 75.0 19.5 58.2 59.0 0.8 175 161 142 123 Secondary incomplete 58.9 75.6 16.7 55.1 71.5 16.4 328 335 410 468 Secondary complete and higher 70.8 81.8 11.0 60.3 75.8 15.5 131 143 190 247
Media exposure No 54.0 73.4 19.4 54.2 67.0 12.8 814 812 670 707 Yes 59.0 70.9 11.9 53.7 73.5 19.8 234 225 289 341
Wealth quintile Lowest 43.2 65.4 22.2 45.5 68.5 23.0 251 258 156 153 Second 51.7 69.7 18.0 53.3 64.4 11.1 243 259 150 222 Middle 58.6 79.6 21.0 59.3 70.6 11.3 202 171 196 169 Fourth 62.7 77.9 15.2 55.9 68.4 12.5 183 194 218 228 Highest 65.5 76.7 11.2 54.2 72.8 18.6 169 154 239 276
Total 55.1 72.8 17.7 54.1 69.1 15.0 1,048 1,036 959 1,048
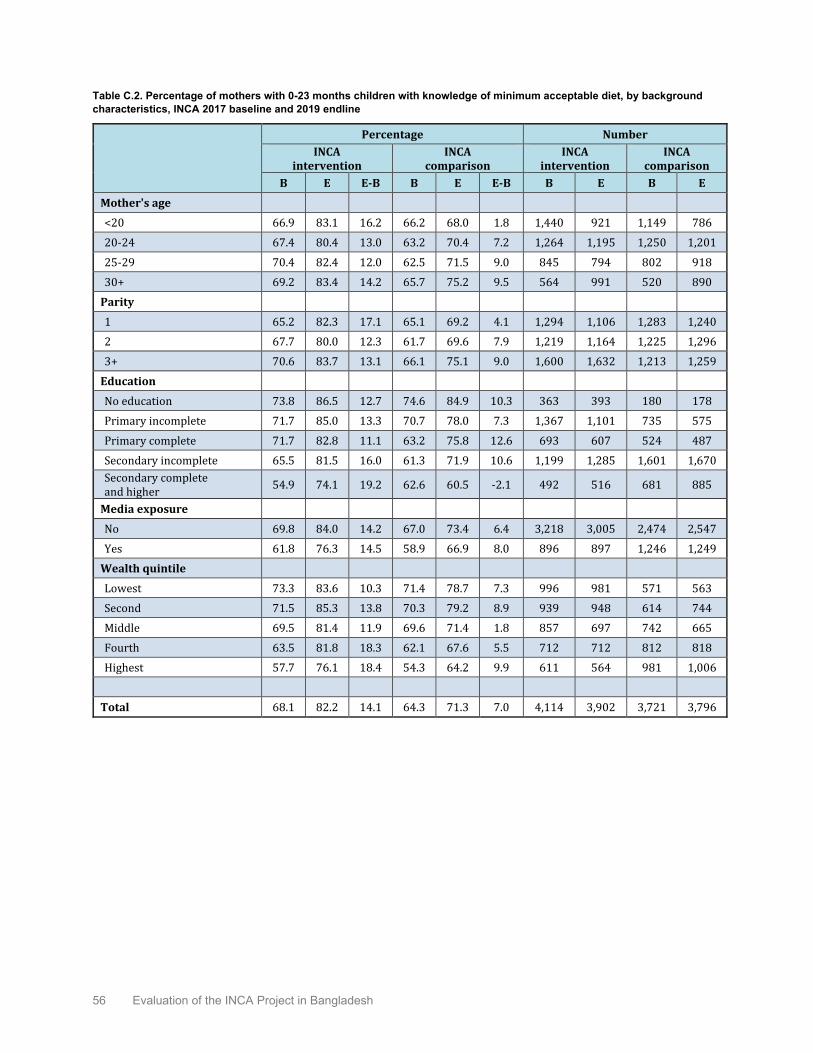
56 Evaluation of the INCA Project in Bangladesh
Table C.2. Percentage of mothers with 0-23 months children with knowledge of minimum acceptable diet, by background characteristics, INCA 2017 baseline and 2019 endline
Percentage Number INCA
intervention INCA
comparison INCA
intervention INCA
comparison B E E-B B E E-B B E B E
Mother's age <20 66.9 83.1 16.2 66.2 68.0 1.8 1,440 921 1,149 786 20-24 67.4 80.4 13.0 63.2 70.4 7.2 1,264 1,195 1,250 1,201 25-29 70.4 82.4 12.0 62.5 71.5 9.0 845 794 802 918 30+ 69.2 83.4 14.2 65.7 75.2 9.5 564 991 520 890
Parity 1 65.2 82.3 17.1 65.1 69.2 4.1 1,294 1,106 1,283 1,240 2 67.7 80.0 12.3 61.7 69.6 7.9 1,219 1,164 1,225 1,296 3+ 70.6 83.7 13.1 66.1 75.1 9.0 1,600 1,632 1,213 1,259
Education No education 73.8 86.5 12.7 74.6 84.9 10.3 363 393 180 178 Primary incomplete 71.7 85.0 13.3 70.7 78.0 7.3 1,367 1,101 735 575 Primary complete 71.7 82.8 11.1 63.2 75.8 12.6 693 607 524 487 Secondary incomplete 65.5 81.5 16.0 61.3 71.9 10.6 1,199 1,285 1,601 1,670 Secondary complete and higher 54.9 74.1 19.2 62.6 60.5 -2.1 492 516 681 885
Media exposure No 69.8 84.0 14.2 67.0 73.4 6.4 3,218 3,005 2,474 2,547 Yes 61.8 76.3 14.5 58.9 66.9 8.0 896 897 1,246 1,249
Wealth quintile Lowest 73.3 83.6 10.3 71.4 78.7 7.3 996 981 571 563 Second 71.5 85.3 13.8 70.3 79.2 8.9 939 948 614 744 Middle 69.5 81.4 11.9 69.6 71.4 1.8 857 697 742 665 Fourth 63.5 81.8 18.3 62.1 67.6 5.5 712 712 812 818 Highest 57.7 76.1 18.4 54.3 64.2 9.9 611 564 981 1,006
Total 68.1 82.2 14.1 64.3 71.3 7.0 4,114 3,902 3,721 3,796

Evaluation of the INCA Project in Bangladesh 57
Table C.3. Percentage of mothers of 0-23 months children with knowledge of critical times when hand washing with soap is necessary, by background characteristics, INCA 2017 baseline and 2019 endline
Percentage Number INCA
intervention INCA
comparison INCA
intervention INCA
comparison B E E-B B E E-B B E B E
Mother's age <20 28.9 30.8 1.9 35.7 36.3 0.6 1,440 921 1,149 786 20-24 29.4 33.2 3.8 35.3 34.7 -0.6 1,264 1,195 1,250 1,201 25-29 22.7 29.9 7.2 34.4 32.0 -2.4 845 794 802 918 30+ 21.6 25.4 3.8 28.2 31.0 2.8 564 991 520 890
Parity 1 32.2 34.0 1.8 39.5 37.9 -1.6 1,294 1,106 1,283 1,240 2 26.7 33.0 6.3 33.4 32.9 -0.5 1,219 1,164 1,225 1,296 3+ 22.5 25.1 2.6 29.4 29.9 0.5 1,600 1,632 1,213 1,259
Education No education 15.9 18.3 2.4 29.0 28.3 -0.7 363 393 180 178 Primary incomplete 19.0 23.0 4.0 25.1 22.5 -2.6 1,367 1,101 735 575 Primary complete 25.1 26.7 1.6 30.4 29.5 -0.9 693 607 524 487 Secondary incomplete 32.2 34.1 1.9 36.0 35.2 -0.8 1,199 1,285 1,601 1,670 Secondary complete and higher 45.8 47.3 1.5 44.2 40.8 -3.4 492 516 681 885
Media exposure No 24.4 26.7 2.3 31.7 32.4 0.7 3,218 3,005 2,474 2,547 Yes 35.4 40.9 5.5 39.3 35.8 -3.5 896 897 1,246 1,249
Wealth quintile Lowest 17.5 20.3 2.8 25.8 26.0 0.2 996 981 571 563 Second 21.8 24.9 3.1 28.2 30.0 1.8 939 948 614 744 Middle 27.7 31.4 3.7 29.2 33.6 4.4 857 697 742 665 Fourth 32.9 38.2 5.3 37.5 32.6 -4.9 712 712 812 818 Highest 41.4 43.2 1.8 44.0 41.0 -3.0 611 564 981 1006
Total 26.8 30.0 3.2 34.2 33.5 -0.7 4,114 3,902 3,721 3,796

58 Evaluation of the INCA Project in Bangladesh
Table C.4. Percentage of pregnant women with knowledge of proper diet during pregnancy, by background characteristics, INCA 2017 baseline and 2019 endline
Percentage Number INCA
intervention INCA
comparison INCA
intervention INCA
comparison B E E-B B E E-B B E B E
Mother's age <20 60.9 61.8 0.9 64.6 51.6 -13.0 387 393 258 259 20-24 62.7 60.8 -1.9 75.1 50.5 -24.6 345 453 277 339 25-29 65.4 61.7 -3.7 71.6 57.6 -14.0 199 306 149 213 30+ 62.1 59.0 -3.1 70.2 55.1 -15.1 127 317 86 236
Education No education 61.0 51.7 -9.3 69.0 46.0 -23.0 70 121 32 36 Primary incomplete 57.9 54.4 -3.5 65.3 51.5 -13.8 366 417 142 138 Primary complete 64.6 62.4 -2.2 67.7 58.4 -9.3 178 208 100 124 Secondary incomplete 65.0 66.6 1.6 72.2 52.8 -19.4 335 523 347 455 Secondary complete and higher 67.5 63.0 -4.5 73.1 53.5 -19.6 108 200 150 293
Media exposure No 60.5 61.3 0.8 72.0 56.6 -15.4 860 1,128 520 706 Yes 71.1 59.2 -11.9 66.9 46.4 -20.5 198 341 250 341
Wealth quintile Lowest 55.3 58.1 2.8 72.0 58.4 -13.6 258 360 116 118 Second 66.4 64.3 -2.1 72.9 52.9 -20.0 231 355 143 214 Middle 60.1 60.1 0.0 65.8 51.4 -14.4 213 293 144 204 Fourth 64.8 64.7 -0.1 68.8 54.5 -14.3 207 269 174 239 Highest 69.2 55.3 -13.9 72.3 51.5 -20.8 149 193 194 272
Total 62.5 60.8 -1.7 70.4 53.2 -17.2 1,058 1,469 770 1,047

Evaluation of the INCA Project in Bangladesh 59
Table C.5. Percentage of lactating mothers of children ages 0-23 months consuming a diet of minimum diversity, by background characteristics, INCA 2017 baseline and 2019 endline
Percentage Number INCA
intervention INCA
comparison INCA
intervention INCA
comparison B E E-B B E E-B B E B E
Mother's age <20 50.9 55.7 4.8 48.4 61.5 13.1 1,419 910 1,114 770 20-24 47.6 59.2 11.6 52.8 61.2 8.4 1,244 1,178 1,201 1,163 25-29 46.9 55.7 8.8 51.8 57.4 5.6 828 785 779 901 30+ 45.4 55.7 10.3 54.9 59.4 4.5 557 973 510 870
Parity 1 54.4 57.7 3.3 54.0 62.9 8.9 1,267 1,092 1,230 1,211 2 48.1 58.1 10.0 50.4 59.8 9.4 1,207 1,147 1,189 1,273 3+ 43.6 55.3 11.7 50.1 57.2 7.1 1,573 1,607 1,185 1,221
Education No education 33.4 45.6 12.2 33.5 46.1 12.6 360 387 175 174 Primary incomplete 40.8 51.2 10.4 41.9 50.4 8.5 1,348 1,088 718 564 Primary complete 47.5 52.7 5.2 40.6 50.7 10.1 681 599 506 476 Secondary incomplete 54.2 61.8 7.6 54.4 60.9 6.5 1,179 1,265 1,551 1,624 Secondary complete and higher 67.4 69.5 2.1 68.5 72.3 3.8 480 507 653 868
Media exposure No 44.8 54.2 9.4 47.0 57.2 10.2 3,172 2,966 2,417 2,492 Yes 61.1 65.4 4.3 60.8 65.5 4.7 875 880 1,187 1,213
Wealth quintile Lowest 36.3 48.1 11.8 35.9 49.5 13.6 982 971 558 548 Second 41.9 53.4 11.5 42.5 48.9 6.4 928 937 604 730 Middle 48.6 54.9 6.3 48.4 56.7 8.3 845 684 721 650 Fourth 56.4 63.2 6.8 54.0 63.9 9.9 696 701 778 809 Highest 68.3 72.1 3.8 66.8 73.0 6.2 596 552 943 968
Total 48.3 56.8 8.5 51.5 59.9 8.4 4,048 3,846 3,604 3,705

60 Evaluation of the INCA Project in Bangladesh
Table C.6. Percentage of children ages 0-23 months who initiated breastfeeding within one hour of birth, by background characteristics, INCA 2017 baseline and 2019 endline
Percentage Number INCA
intervention INCA
comparison INCA
intervention INCA
comparison B E E-B B E E-B B E B E
Mother's age <20 69.2 67.8 -1.4 63.5 60.0 -3.5 1,437 921 1,145 786 20-24 68.9 70.6 1.7 60.6 58.7 -1.9 1,259 1,192 1,245 1,200 25-29 68.8 70.4 1.6 60.2 61.1 0.9 845 794 798 918 30+ 67.0 68.6 1.6 56.1 58.6 2.5 563 988 519 890
Parity 1 66.5 66.8 0.3 58.3 56.1 -2.2 1,293 1,106 1,278 1,239 2 71.2 70.9 -0.3 62.5 60.0 -2.5 1,213 1,163 1,219 1,296 3+ 68.6 70.1 1.5 61.6 62.5 0.9 1,597 1,626 1,210 1,259
Education No education 65.4 67.2 1.8 61.8 59.7 -2.1 362 393 179 178 Primary incomplete 68.2 67.9 -0.3 63.2 60.2 -3.0 1,365 1,097 733 575 Primary complete 70.0 70.3 0.3 64.5 62.6 -1.9 692 607 522 487 Secondary incomplete 70.5 72.6 2.1 60.4 62.2 1.8 1,194 1,282 1,596 1,670 Secondary complete and higher 66.2 65.4 -0.8 55.9 52.4 -3.5 490 516 677 884
Media exposure No 68.4 68.9 0.5 62.4 59.5 -2.9 3,212 3,000 2,467 2,546 Yes 69.8 71.0 1.2 57.5 59.7 2.2 891 895 1,240 1,248
Wealth quintile Lowest 66.1 66.5 0.4 59.4 61.4 2.0 995 979 570 563 Second 70.8 70.9 0.1 65.3 59.7 -5.6 936 947 610 744 Middle 69.2 69.6 0.4 62.3 59.5 -2.8 855 695 740 665 Fourth 72.6 72.3 -0.3 60.7 59.0 -1.7 709 710 809 817 Highest 64.5 68.1 3.6 57.7 58.9 1.2 609 564 978 1,006
Total 68.7 69.4 0.7 60.8 59.5 -1.3 4,103 3,895 3,707 3,795
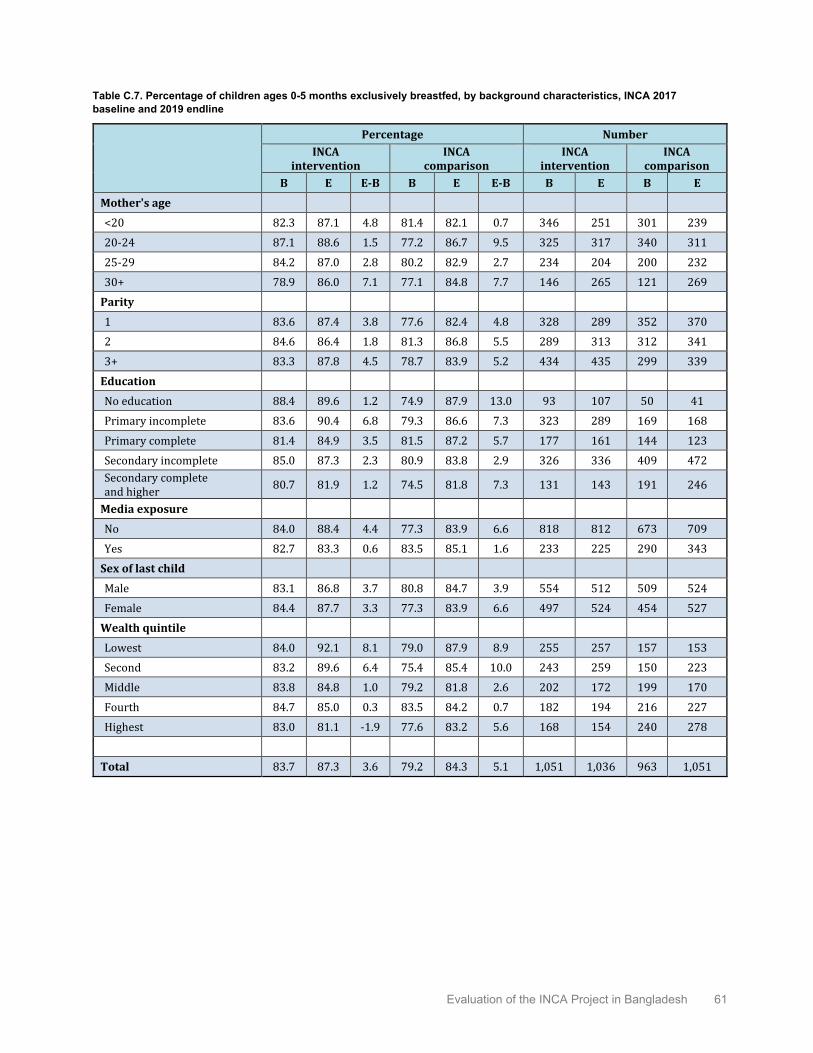
Evaluation of the INCA Project in Bangladesh 61
Table C.7. Percentage of children ages 0-5 months exclusively breastfed, by background characteristics, INCA 2017 baseline and 2019 endline
Percentage Number INCA
intervention INCA
comparison INCA
intervention INCA
comparison B E E-B B E E-B B E B E
Mother's age <20 82.3 87.1 4.8 81.4 82.1 0.7 346 251 301 239 20-24 87.1 88.6 1.5 77.2 86.7 9.5 325 317 340 311 25-29 84.2 87.0 2.8 80.2 82.9 2.7 234 204 200 232 30+ 78.9 86.0 7.1 77.1 84.8 7.7 146 265 121 269
Parity 1 83.6 87.4 3.8 77.6 82.4 4.8 328 289 352 370 2 84.6 86.4 1.8 81.3 86.8 5.5 289 313 312 341 3+ 83.3 87.8 4.5 78.7 83.9 5.2 434 435 299 339
Education No education 88.4 89.6 1.2 74.9 87.9 13.0 93 107 50 41 Primary incomplete 83.6 90.4 6.8 79.3 86.6 7.3 323 289 169 168 Primary complete 81.4 84.9 3.5 81.5 87.2 5.7 177 161 144 123 Secondary incomplete 85.0 87.3 2.3 80.9 83.8 2.9 326 336 409 472 Secondary complete and higher 80.7 81.9 1.2 74.5 81.8 7.3 131 143 191 246
Media exposure No 84.0 88.4 4.4 77.3 83.9 6.6 818 812 673 709 Yes 82.7 83.3 0.6 83.5 85.1 1.6 233 225 290 343
Sex of last child Male 83.1 86.8 3.7 80.8 84.7 3.9 554 512 509 524 Female 84.4 87.7 3.3 77.3 83.9 6.6 497 524 454 527
Wealth quintile Lowest 84.0 92.1 8.1 79.0 87.9 8.9 255 257 157 153 Second 83.2 89.6 6.4 75.4 85.4 10.0 243 259 150 223 Middle 83.8 84.8 1.0 79.2 81.8 2.6 202 172 199 170 Fourth 84.7 85.0 0.3 83.5 84.2 0.7 182 194 216 227 Highest 83.0 81.1 -1.9 77.6 83.2 5.6 168 154 240 278
Total 83.7 87.3 3.6 79.2 84.3 5.1 1,051 1,036 963 1,051
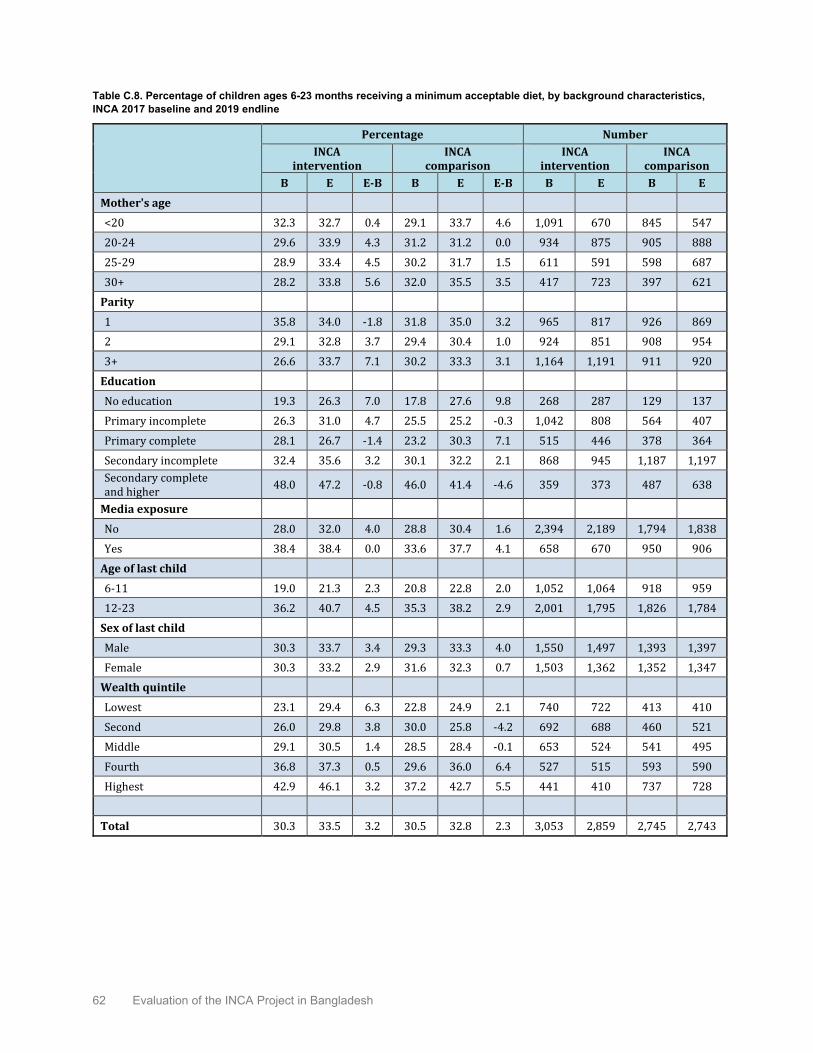
62 Evaluation of the INCA Project in Bangladesh
Table C.8. Percentage of children ages 6-23 months receiving a minimum acceptable diet, by background characteristics, INCA 2017 baseline and 2019 endline
Percentage Number INCA
intervention INCA
comparison INCA
intervention INCA
comparison B E E-B B E E-B B E B E
Mother's age <20 32.3 32.7 0.4 29.1 33.7 4.6 1,091 670 845 547 20-24 29.6 33.9 4.3 31.2 31.2 0.0 934 875 905 888 25-29 28.9 33.4 4.5 30.2 31.7 1.5 611 591 598 687 30+ 28.2 33.8 5.6 32.0 35.5 3.5 417 723 397 621
Parity 1 35.8 34.0 -1.8 31.8 35.0 3.2 965 817 926 869 2 29.1 32.8 3.7 29.4 30.4 1.0 924 851 908 954 3+ 26.6 33.7 7.1 30.2 33.3 3.1 1,164 1,191 911 920
Education No education 19.3 26.3 7.0 17.8 27.6 9.8 268 287 129 137 Primary incomplete 26.3 31.0 4.7 25.5 25.2 -0.3 1,042 808 564 407 Primary complete 28.1 26.7 -1.4 23.2 30.3 7.1 515 446 378 364 Secondary incomplete 32.4 35.6 3.2 30.1 32.2 2.1 868 945 1,187 1,197 Secondary complete and higher 48.0 47.2 -0.8 46.0 41.4 -4.6 359 373 487 638
Media exposure No 28.0 32.0 4.0 28.8 30.4 1.6 2,394 2,189 1,794 1,838 Yes 38.4 38.4 0.0 33.6 37.7 4.1 658 670 950 906
Age of last child 6-11 19.0 21.3 2.3 20.8 22.8 2.0 1,052 1,064 918 959 12-23 36.2 40.7 4.5 35.3 38.2 2.9 2,001 1,795 1,826 1,784
Sex of last child Male 30.3 33.7 3.4 29.3 33.3 4.0 1,550 1,497 1,393 1,397 Female 30.3 33.2 2.9 31.6 32.3 0.7 1,503 1,362 1,352 1,347
Wealth quintile Lowest 23.1 29.4 6.3 22.8 24.9 2.1 740 722 413 410 Second 26.0 29.8 3.8 30.0 25.8 -4.2 692 688 460 521 Middle 29.1 30.5 1.4 28.5 28.4 -0.1 653 524 541 495 Fourth 36.8 37.3 0.5 29.6 36.0 6.4 527 515 593 590 Highest 42.9 46.1 3.2 37.2 42.7 5.5 441 410 737 728
Total 30.3 33.5 3.2 30.5 32.8 2.3 3,053 2,859 2,745 2,743

Evaluation of the INCA Project in Bangladesh 63
Table C.9. Percentage of pregnant women consuming a diet of minimum diversity, by background characteristics, INCA 2017 baseline and 2019 endline
Percentage Number INCA
intervention INCA
comparison INCA
intervention INCA
comparison B E E-B B E E-B B E B E
Mother's age <20 56.7 66.1 9.4 58.9 68.5 9.6 387 393 258 259 20-24 48.6 60.9 12.3 62.9 69.7 6.8 345 453 277 339 25-29 56.7 59.8 3.1 53.0 67.7 14.7 199 306 149 213 30+ 42.4 60.9 18.5 58.6 59.3 0.7 127 317 86 236
Education No education 30.5 42.0 11.5 42.5 46.0 3.5 70 121 32 36 Primary incomplete 40.7 53.8 13.1 44.0 59.0 15.0 366 417 142 138 Primary complete 51.8 53.9 2.1 56.7 61.7 5.0 178 208 100 124 Secondary incomplete 61.6 68.9 7.3 61.0 64.7 3.7 335 523 347 455 Secondary complete and higher 77.9 81.9 4.0 74.3 78.0 3.7 108 200 150 293
Media exposure No 48.3 58.9 10.6 55.6 64.4 8.8 860 1,128 520 706 Yes 70.0 72.4 2.4 66.6 71.3 4.7 198 341 250 341
Wealth quintile Lowest 38.9 50.0 11.1 33.5 54.6 21.1 258 360 116 118 Second 42.9 54.0 11.1 53.4 60.2 6.8 231 355 143 214 Middle 48.8 62.4 13.6 56.8 66.5 9.7 213 293 144 204 Fourth 64.4 73.0 8.6 64.1 66.0 1.9 207 269 174 239 Highest 78.5 83.6 5.1 76.0 77.6 1.6 149 193 194 272
Total 52.3 62.1 9.8 59.2 66.7 7.5 1,058 1,469 770 1,047

64 Evaluation of the INCA Project in Bangladesh
Table C.10. Percentages of lactating women with knowledge of at least two health services at targeted community clinics, by background characteristics, INCA 2017 baseline and 2019 endline
Percentage Number INCA
intervention INCA
comparison INCA
intervention INCA
comparison B E E-B B E E-B B E B E
Mother's age <20 40.0 46.1 6.1 28.6 36.3 7.7 1,440 921 1,149 786 20-24 40.9 52.7 11.8 30.3 36.8 6.5 1,264 1,195 1,250 1,201 25-29 41.7 50.5 8.8 32.7 40.0 7.3 845 794 802 918 30+ 38.6 50.6 12.0 33.3 41.6 8.3 564 991 520 890
Parity 1 39.4 48.8 9.4 30.1 37.1 7.0 1,294 1,106 1,283 1,240 2 42.3 52.7 10.4 30.5 39.3 8.8 1,219 1,164 1,225 1,296 3+ 39.9 49.3 9.4 31.5 39.3 7.8 1,600 1,632 1,213 1,259
Education No education 27.6 34.3 6.7 24.6 38.0 13.4 363 393 180 178 Primary incomplete 35.5 44.7 9.2 28.7 32.4 3.7 1,367 1,101 735 575 Primary complete 39.2 53.0 13.8 28.3 39.4 11.1 693 607 524 487 Secondary incomplete 45.7 54.5 8.8 32.3 37.8 5.5 1,199 1,285 1,601 1,670 Secondary complete and higher 52.3 60.0 7.7 32.6 43.9 11.3 492 516 681 885
Media exposure No 38.2 48.3 10.1 29.8 39.7 9.9 3,218 3,005 2,474 2,547 Yes 48.5 56.5 8.0 32.5 36.3 3.8 896 897 1,246 1,249
Wealth quintile Lowest 30.9 42.0 11.1 30.8 36.4 5.6 996 981 571 563 Second 35.0 46.9 11.9 30.0 38.0 8.0 939 948 614 744 Middle 45.4 50.7 5.3 28.5 39.1 10.6 857 697 742 665 Fourth 46.4 55.8 9.4 30.7 40.9 10.2 712 712 812 818 Highest 50.4 62.1 11.7 32.7 38.1 5.4 611 564 981 1,006
Total 40.4 50.2 9.8 30.7 38.6 7.9 4,114 3,902 3,721 3,796

Evaluation of the INCA Project in Bangladesh 65
Table C.11. Percentages of pregnant women with knowledge of at least two health services at targeted community clinics, by background characteristics, INCA 2017 baseline and 2019 endline
Percentage Number INCA
intervention INCA
comparison INCA
intervention INCA
comparison B E E-B B E E-B B E B E
Mother's age <20 33.5 30.2 -3.3 22.1 16.6 -5.5 387 393 258 259 20-24 42.3 33.4 -8.9 38.7 17.4 -21.3 345 453 277 339 25-29 49.0 32.3 -16.7 34.4 22.5 -11.9 199 306 149 213 30+ 46.9 32.9 -14.0 37.0 23.5 -13.5 127 317 86 236
Education No education 34.8 17.4 -17.4 18.1 16.9 -1.2 70 121 32 36 Primary incomplete 36.4 28.5 -7.9 30.1 22.4 -7.7 366 417 142 138 Primary complete 39.4 30.8 -8.6 30.0 14.3 -15.7 178 208 100 124 Secondary incomplete 45.1 36.4 -8.7 34.1 20.4 -13.7 335 523 347 455 Secondary complete and higher 49.4 39.4 -10.0 33.8 19.5 -14.3 108 200 150 293
Media exposure No 39.8 30.1 -9.7 31.3 18.2 -13.1 860 1,128 520 706 Yes 45.6 39.4 -6.2 33.8 22.4 -11.4 198 341 250 341
Wealth quintile Lowest 36.2 23.5 -12.7 25.9 12.4 -13.5 258 360 116 118 Second 34.8 33.4 -1.4 31.4 18.3 -13.1 231 355 143 214 Middle 45.5 35.9 -9.6 37.6 24.4 -13.2 213 293 144 204 Fourth 43.9 34.4 -9.5 33.2 20.4 -12.8 207 269 174 239 Highest 47.8 37.8 -10.0 31.3 19.4 -11.9 149 193 194 272
Total 40.9 32.2 -8.7 32.1 19.6 -12.5 1,058 1,469 770 1,047

66 Evaluation of the INCA Project in Bangladesh
Table C.12. Percentage of children ages 0–23 months who received nutrition services or counseling from health facilities in the last three months, by background characteristics, INCA 2017 baseline and 2019 endline
Percentage Number INCA
intervention INCA
comparison INCA
intervention INCA
comparison B E E-B B E E-B B E B E
Mother's age <20 3.3 14.4 11.1 5.4 18.6 13.2 1,437 921 1,145 786 20-24 4.5 17.2 12.7 4.8 15.1 10.3 1,259 1,192 1,245 1,200 25-29 3.3 14.7 11.4 4.5 15.5 11.0 845 794 798 918 30+ 3.9 13.2 9.3 4.1 14.3 10.2 563 988 519 890
Parity 1 4.2 17.3 13.1 6.1 19.1 13.0 1,293 1,106 1,278 1,239 2 4.0 15.3 11.3 5.3 15.9 10.6 1,213 1,163 1,219 1,296 3+ 3.2 13.2 10.0 3.0 12.2 9.2 1,597 1,626 1,210 1,259
Education No education 1.1 7.5 6.4 0.6 3.4 2.8 362 393 179 178 Primary incomplete 2.2 9.3 7.1 1.7 12.1 10.4 1,365 1,097 733 575 Primary complete 3.1 15.4 12.3 3.2 12.5 9.3 692 607 522 487 Secondary incomplete 4.6 16.0 11.4 5.8 14.9 9.1 1,194 1,282 1,596 1,670 Secondary complete and higher 8.9 29.7 20.8 8.2 23.9 15.7 490 516 677 884
Media exposure No 2.6 12.6 10.0 3.4 12.8 9.4 3,212 3,000 2,467 2,546 Yes 7.7 22.9 15.2 7.6 21.6 14.0 891 895 1,240 1,248
Age of last child <6 3.8 17.6 13.8 6.5 20.4 13.9 1,051 1,036 963 1,051 6-11 4.4 15.6 11.2 5.6 16.0 10.4 1,052 1,064 918 959 12-23 3.4 13.1 9.7 3.6 12.8 9.2 2,001 1,795 1,826 1,784
Sex of last child Male 4.6 15.7 11.1 5.1 16.8 11.7 2,104 2,009 1,901 1,921 Female 2.9 14.3 11.4 4.5 14.7 10.2 1,999 1,887 1,806 1,874
Wealth quintile Lowest 1.6 7.0 5.4 1.8 10.6 8.8 995 979 570 563 Second 1.9 13.0 11.1 2.8 10.0 7.2 936 947 610 744 Middle 3.5 14.4 10.9 3.4 13.1 9.7 855 695 740 665 Fourth 5.5 18.7 13.2 4.3 15.6 11.3 709 710 809 817 Highest 8.3 28.2 19.9 9.4 24.7 15.3 609 564 978 1,006
Total 3.7 15.0 11.3 4.8 15.7 10.9 4,103 3,895 3,707 3,795

Evaluation of the INCA Project in Bangladesh 67
Table C.13. Percentage of children ages 0–23 months who received growth monitoring services from a health facility in the last three months, by background characteristics, INCA 2017 baseline and 2019 endline
Percentage Number INCA
intervention INCA
comparison INCA
intervention INCA
comparison B E E-B B E E-B B E B E
Mother's age <20 2.6 10.0 7.4 5.3 16.0 10.7 1,437 921 1,145 786 20-24 3.8 12.7 8.9 4.5 13.3 8.8 1,259 1,192 1,245 1,200 25-29 2.7 11.5 8.8 4.1 12.4 8.3 845 794 798 918 30+ 3.0 9.6 6.6 3.9 13.1 9.2 563 988 519 890
Parity 1 3.6 12.9 9.3 6.0 16.7 10.7 1,293 1,106 1,278 1,239 2 3.3 11.5 8.2 4.8 13.8 9.0 1,213 1,163 1,219 1,296 3+ 2.4 9.4 7.0 2.9 10.4 7.5 1,597 1,626 1,210 1,259
Education No education 0.8 5.6 4.8 0.6 1.9 1.3 362 393 179 178 Primary incomplete 1.8 6.2 4.4 1.7 10.2 8.5 1,365 1,097 733 575 Primary complete 2.5 10.7 8.2 2.7 11.0 8.3 692 607 522 487 Secondary incomplete 4.0 11.3 7.3 5.5 12.4 6.9 1,194 1,282 1,596 1,670 Secondary complete and higher 6.9 25.0 18.1 7.8 21.9 14.1 490 516 677 884
Media exposure No 2.1 9.1 7.0 3.3 10.7 7.4 3,212 3,000 2,467 2,546 Yes 6.4 17.5 11.1 7.0 19.5 12.5 891 895 1,240 1,248
Age of last child <6 3.2 13.6 10.4 6.1 17.9 11.8 1,051 1,036 963 1,051 6-11 3.7 11.2 7.5 5.4 14.4 9.0 1,052 1,064 918 959 12-23 2.6 9.4 6.8 3.4 10.6 7.2 2,001 1,795 1,826 1,784
Sex of last child Male 3.7 11.8 8.1 4.8 14.7 9.9 2,104 2,009 1,901 1,921 Female 2.3 10.2 7.9 4.3 12.5 8.2 1,999 1,887 1,806 1,874
Wealth quintile Lowest 1.1 4.6 3.5 1.8 8.7 6.9 995 979 570 563 Second 1.7 8.9 7.2 2.7 7.9 5.2 936 947 610 744 Middle 2.6 10.4 7.8 3.4 11.1 7.7 855 695 740 665 Fourth 4.9 14.2 9.3 3.8 13.7 9.9 709 710 809 817 Highest 6.7 22.5 15.8 8.9 22.2 13.3 609 564 978 1,006
Total 3.0 11.0 8.0 4.6 13.6 9.0 4,103 3,895 3,707 3,795

68 Evaluation of the INCA Project in Bangladesh
Table C.14. Percentage of births who received ANC4+ with at least one from MTP, by background characteristics, INCA 2017 baseline and 2019 endline
Percentage Number INCA
intervention INCA
comparison INCA
intervention INCA
comparison B E E-B B E E-B B E B E
Mother's age <20 14.4 16.2 1.8 21.5 23.1 1.6 1,440 921 1,149 786 20-24 15.2 17.8 2.6 24.1 24.6 0.5 1,264 1,195 1,250 1,201 25-29 15.1 19.1 4.0 27.2 25.9 -1.3 845 794 802 918 30+ 16.3 18.0 1.7 20.9 22.8 1.9 564 991 520 890
Parity 1 17.2 18.6 1.4 27.0 27.5 0.5 1,294 1,106 1,283 1,240 2 14.7 20.7 6.0 23.6 24.3 0.7 1,219 1,164 1,225 1,296 3+ 13.6 15.0 1.4 19.6 20.7 1.1 1,600 1,632 1,213 1,259
Education No education 5.4 7.9 2.5 9.4 9.5 0.1 363 393 180 178 Primary incomplete 7.7 9.8 2.1 13.1 13.6 0.5 1,367 1,101 735 575 Primary complete 12.2 13.9 1.7 12.5 15.8 3.3 693 607 524 487 Secondary incomplete 19.8 20.8 1.0 26.5 23.3 -3.2 1,199 1,285 1,601 1,670 Secondary complete and higher 35.0 38.9 3.9 39.9 40.2 0.3 492 516 681 885
Media exposure No 11.4 14.3 2.9 18.2 20.9 2.7 3,218 3,005 2,474 2,547 Yes 28.1 29.3 1.2 34.0 30.8 -3.2 896 897 1,246 1,249
Wealth quintile Lowest 6.6 5.8 -0.8 9.0 13.5 4.5 996 981 571 563 Second 8.3 13.4 5.1 13.4 16.7 3.3 939 948 614 744 Middle 13.9 18.8 4.9 20.1 17.7 -2.4 857 697 742 665 Fourth 18.9 21.5 2.6 27.3 24.5 -2.8 712 712 812 818 Highest 36.3 39.7 3.4 37.7 39.6 1.9 611 564 981 1,006
Total 15.1 17.7 2.6 23.5 24.2 0.7 4,114 3,902 3,721 3,796

Evaluation of the INCA Project in Bangladesh 69
Table C.15. Percentage of deliveries by SBA, by background characteristics, INCA 2017 baseline and 2019 endline
Percentage Number INCA
intervention INCA
comparison INCA
intervention INCA
comparison B E E-B B E E-B B E B E
Mother's age <20 19.8 29.9 10.1 28.1 41.9 13.8 1,440 921 1,149 786 20-24 21.3 26.1 4.8 34.4 43.0 8.6 1,264 1,195 1,250 1,201 25-29 16.5 21.0 4.5 33.4 37.7 4.3 845 794 802 918 30+ 19.1 23.1 4.0 34.4 34.7 0.3 564 991 520 890
Parity 1 27.3 36.7 9.4 39.9 49.7 9.8 1,294 1,106 1,283 1,240 2 18.7 23.9 5.2 30.9 38.8 7.9 1,219 1,164 1,225 1,296 3+ 13.7 18.4 4.7 25.6 30.4 4.8 1,600 1,632 1,213 1,259
Education No education 7.0 9.6 2.6 13.0 17.7 4.7 363 393 180 178 Primary incomplete 10.0 12.4 2.4 15.9 22.4 6.5 1,367 1,101 735 575 Primary complete 14.9 20.9 6.0 19.9 26.5 6.6 693 607 524 487 Secondary incomplete 24.2 29.4 5.2 35.1 37.2 2.1 1,199 1,285 1,601 1,670 Secondary complete and higher 50.2 59.1 8.9 57.7 66.6 8.9 492 516 681 885
Media exposure No 14.7 19.6 4.9 24.9 33.5 8.6 3,218 3,005 2,474 2,547 Yes 36.7 44.1 7.4 46.8 51.9 5.1 896 897 1,246 1,249
Wealth quintile Lowest 9.6 9.0 -0.6 13.4 21.1 7.7 996 981 571 563 Second 12.2 18.4 6.2 16.8 26.6 9.8 939 948 614 744 Middle 16.6 26.1 9.5 24.2 35.2 11.0 857 697 742 665 Fourth 23.3 32.5 9.2 36.6 40.0 3.4 712 712 812 818 Highest 46.5 54.6 8.1 55.4 61.9 6.5 611 564 981 1,006
Total 19.5 25.2 5.7 32.3 39.6 7.3 4,114 3,902 3,721 3,796
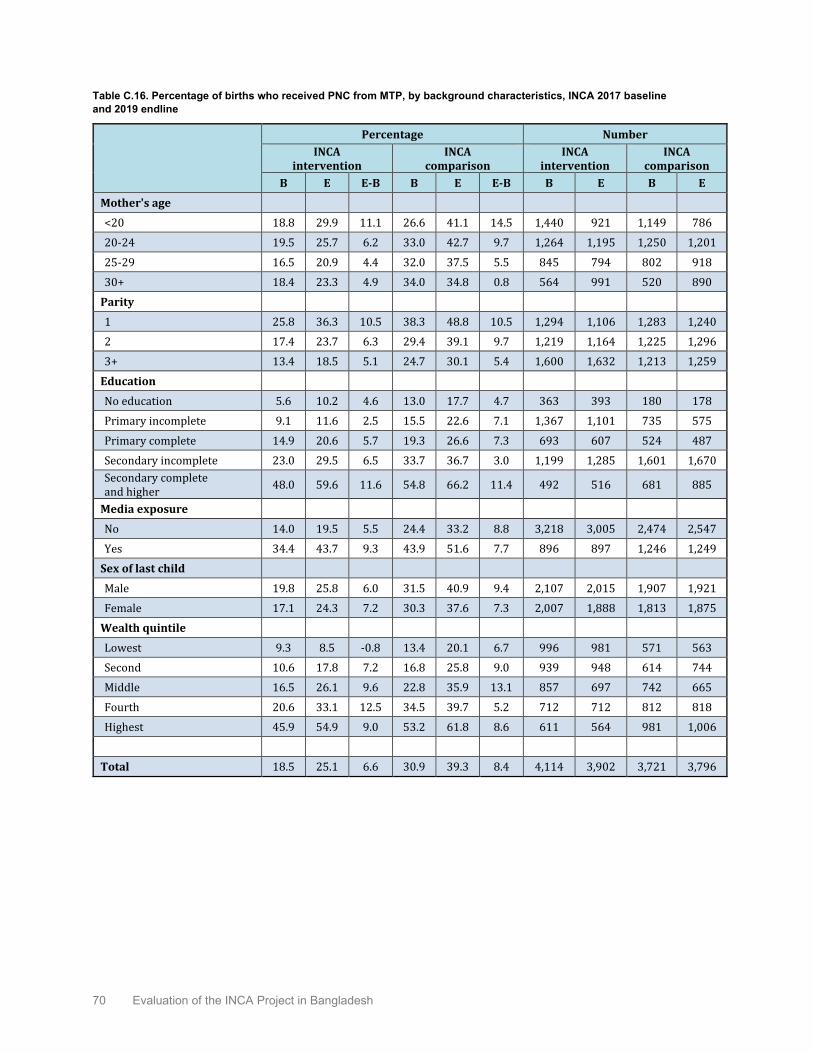
70 Evaluation of the INCA Project in Bangladesh
Table C.16. Percentage of births who received PNC from MTP, by background characteristics, INCA 2017 baseline and 2019 endline
Percentage Number INCA
intervention INCA
comparison INCA
intervention INCA
comparison B E E-B B E E-B B E B E
Mother's age <20 18.8 29.9 11.1 26.6 41.1 14.5 1,440 921 1,149 786 20-24 19.5 25.7 6.2 33.0 42.7 9.7 1,264 1,195 1,250 1,201 25-29 16.5 20.9 4.4 32.0 37.5 5.5 845 794 802 918 30+ 18.4 23.3 4.9 34.0 34.8 0.8 564 991 520 890
Parity 1 25.8 36.3 10.5 38.3 48.8 10.5 1,294 1,106 1,283 1,240 2 17.4 23.7 6.3 29.4 39.1 9.7 1,219 1,164 1,225 1,296 3+ 13.4 18.5 5.1 24.7 30.1 5.4 1,600 1,632 1,213 1,259
Education No education 5.6 10.2 4.6 13.0 17.7 4.7 363 393 180 178 Primary incomplete 9.1 11.6 2.5 15.5 22.6 7.1 1,367 1,101 735 575 Primary complete 14.9 20.6 5.7 19.3 26.6 7.3 693 607 524 487 Secondary incomplete 23.0 29.5 6.5 33.7 36.7 3.0 1,199 1,285 1,601 1,670 Secondary complete and higher 48.0 59.6 11.6 54.8 66.2 11.4 492 516 681 885
Media exposure No 14.0 19.5 5.5 24.4 33.2 8.8 3,218 3,005 2,474 2,547 Yes 34.4 43.7 9.3 43.9 51.6 7.7 896 897 1,246 1,249
Sex of last child Male 19.8 25.8 6.0 31.5 40.9 9.4 2,107 2,015 1,907 1,921 Female 17.1 24.3 7.2 30.3 37.6 7.3 2,007 1,888 1,813 1,875
Wealth quintile Lowest 9.3 8.5 -0.8 13.4 20.1 6.7 996 981 571 563 Second 10.6 17.8 7.2 16.8 25.8 9.0 939 948 614 744 Middle 16.5 26.1 9.6 22.8 35.9 13.1 857 697 742 665 Fourth 20.6 33.1 12.5 34.5 39.7 5.2 712 712 812 818 Highest 45.9 54.9 9.0 53.2 61.8 8.6 611 564 981 1,006
Total 18.5 25.1 6.6 30.9 39.3 8.4 4,114 3,902 3,721 3,796

Evaluation of the INCA Project in Bangladesh 71
Table C.17. Percentage of pregnant women seeking any nutrition services/counseling from health facilities in the last three months, by background characteristics, INCA 2017 baseline and 2019 endline
Percentage Number INCA
intervention INCA
comparison INCA
intervention INCA
comparison B E E-B B E E-B B E B E
Mother's age <20 8.5 25.9 17.4 9.6 22.6 13.0 387 393 258 259 20-24 5.1 24.3 19.2 13.3 23.6 10.3 345 453 277 339 25-29 6.0 24.9 18.9 12.7 20.7 8.0 199 306 149 213 30+ 5.1 24.5 19.4 14.6 28.3 13.7 127 317 86 236
Education No education 0.8 17.5 16.7 11.9 13.1 1.2 70 121 32 36 Primary incomplete 4.4 21.1 16.7 5.2 16.2 11.0 366 417 142 138 Primary complete 3.5 20.7 17.2 4.6 21.0 16.4 178 208 100 124 Secondary incomplete 10.9 27.4 16.5 14.6 24.1 9.5 335 523 347 455 Secondary complete and higher 8.5 35.1 26.6 17.8 29.5 11.7 108 200 150 293
Media exposure No 5.6 23.6 18.0 7.6 19.8 12.2 860 1,128 520 706 Yes 10.2 29.1 18.9 21.4 32.2 10.8 198 341 250 341
Wealth quintile Lowest 3.7 17.0 13.3 6.3 20.5 14.2 258 360 116 118 Second 5.4 20.2 14.8 5.6 13.2 7.6 231 355 143 214 Middle 6.8 28.6 21.8 9.5 22.4 12.9 213 293 144 204 Fourth 10.7 28.9 18.2 16.6 25.8 9.2 207 269 174 239 Highest 6.7 37.1 30.4 18.2 32.9 14.7 149 193 194 272
Total 6.5 24.9 18.4 12.1 23.8 11.7 1,058 1,469 770 1,047

72 Evaluation of the INCA Project in Bangladesh
Table C.18. Percentage of mothers of children ages 6–23 months who are under-weight (BMI<18.5), by background characteristics, INCA 2017 baseline and 2019 endline
Percentage Number INCA
intervention INCA
comparison INCA
intervention INCA
comparison B E E-B B E E-B B E B E
Mother’s age <20 31.7 26.2 -5.5 26.9 26.8 -0.1 1,091 670 845 547 20-24 23.4 19.3 -4.1 20.0 16.5 -3.5 934 875 905 888 25-29 17.4 15.2 -2.2 13.6 10.9 -2.7 611 591 598 687 30+ 15.4 11.4 -4.0 14.4 10.5 -3.9 417 723 397 621
Parity 1 31.7 26.8 -4.9 25.7 23.6 -2.1 965 817 926 869 2 21.8 16.5 -5.3 18.0 12.9 -5.1 924 851 908 954 3+ 19.5 13.2 -6.3 16.0 11.4 -4.6 1,164 1,191 911 920
Education No education 23.2 24.0 0.8 26.6 22.1 -4.5 268 287 129 137 Primary incomplete 28.5 19.0 -9.5 25.4 19.0 -6.4 1,042 808 564 407 Primary complete 25.4 18.5 -6.9 24.0 18.3 -5.7 515 446 378 364 Secondary incomplete 21.5 16.6 -4.9 17.9 14.8 -3.1 868 945 1,187 1,197 Secondary complete and higher 16.1 14.4 -1.7 13.7 12.6 -1.1 359 373 487 638
Media exposure No 25.9 18.8 -7.1 22.5 17.1 -5.4 2,394 2,189 1,794 1,838 Yes 17.3 15.7 -1.6 15.2 13.1 -2.1 658 670 950 906
Wealth quintile Lowest 29.7 21.6 -8.1 26.2 22.2 -4.0 740 722 413 410 Second 28.2 19.8 -8.4 28.4 17.3 -11.1 692 688 460 521 Middle 24.5 21.9 -2.6 22.1 19.8 -2.3 653 524 541 495 Fourth 19.2 15.2 -4.0 16.5 13.3 -3.2 527 515 593 590 Highest 13.2 7.4 -5.8 12.4 10.4 -2.0 441 410 737 728
Total 24.1 18.0 -6.1 19.9 15.8 -4.1 3,053 2,859 2,745 2,743

Evaluation of the INCA Project in Bangladesh 73
Table C.19. Percentage of children ages 0–23 months who are stunted, by background characteristics, INCA 2017 baseline and 2019 endline
Percentage Number INCA
intervention INCA
comparison INCA
intervention INCA
comparison B E E-B B E E-B B E B E
Mother's age <20 30.0 31.8 1.8 21.6 23.3 1.7 1,434 945 1,114 770 20-24 27.1 29.3 2.2 22.8 24.6 1.8 1,282 1,240 1,199 1,178 25-29 28.3 28.7 0.4 22.9 23.1 0.2 833 818 783 910 30+ 28.2 32.5 4.3 22.6 27.2 4.6 563 1,033 507 878 Missing 38.8 43.3 4.5 59.5 41.9 -17.6 18 34 17 18
Parity 1 27.5 30.1 2.6 21.3 24.7 3.4 1,275 1,129 1,240 1,218 2 29.3 29.4 0.1 21.6 22.4 0.8 1,236 1,208 1,191 1,280 3+ 28.7 31.7 3.0 24.4 26.8 2.4 1,601 1,697 1,173 1,238 Missing 38.8 43.3 4.5 59.5 41.9 -17.6 18 34 17 18
Education No education 36.5 37.7 1.2 25.4 31.1 5.7 367 412 176 181 Primary incomplete 34.1 33.7 -0.4 27.5 31.0 3.5 1,366 1,141 715 570 Primary complete 28.0 31.2 3.2 25.3 24.8 -0.5 692 625 512 476 Secondary incomplete 23.9 29.5 5.6 21.1 25.3 4.2 1,197 1,317 1,544 1,639 Secondary complete and higher 18.6 20.4 1.8 16.7 17.7 1.0 490 541 658 869
Missing 38.8 43.3 4.5 59.5 41.9 -17.6 18 34 17 18 Media exposure No 29.7 31.8 2.1 22.8 27.2 4.4 3,220 3,109 2,403 2,522 Yes 24.3 26.5 2.2 21.6 19.3 -2.3 893 925 1,200 1,214 Missing 38.8 43.3 4.5 59.5 41.9 -17.6 18 34 17 18
Age of last child 0-5 18.0 19.4 1.4 12.9 14.1 1.2 979 1,027 887 993 6-8 15.9 23.6 7.7 14.3 18.6 4.3 499 529 430 443 9-11 25.3 26.1 0.8 22.2 19.1 -3.1 559 563 472 502 12-23 37.4 39.8 2.4 29.3 33.5 4.2 2,093 1,950 1,832 1,814
Sex of last child Male 32.2 34.2 2.0 25.6 27.9 2.3 2,105 2,090 1,855 1,898 Female 24.8 26.9 2.1 19.4 21.4 2.0 2,026 1,979 1,765 1,855
Wealth quintile Lowest 36.4 36.5 0.1 25.6 31.6 6.0 1,018 1,003 551 546 Second 30.3 35.2 4.9 25.3 27.3 2.0 937 983 600 747 Middle 26.6 29.0 2.4 22.5 26.0 3.5 842 725 718 654 Fourth 26.3 26.3 0.0 23.6 27.2 3.6 709 744 792 806 Highest 17.8 19.7 1.9 17.6 15.6 -2.0 605 580 942 983 Missing 38.8 43.3 4.5 59.5 41.9 -17.6 18 34 17 18
Total 28.6 30.7 2.1 22.6 24.7 2.1 4,130 4,069 3,620 3,753

74 Evaluation of the INCA Project in Bangladesh
Table C.20. Percentage of children ages 0–23 months who are stunted, by background characteristics, INCA 2017 baseline and 2019 endline
Percentage Number INCA
intervention INCA
comparison INCA
intervention INCA
comparison B E E-B B E E-B B E B E
Mother's age <20 25.1 18.4 -6.7 19.1 12.9 -6.2 1,434 945 1,114 770 20-24 23.2 16.7 -6.5 18.5 14.7 -3.8 1,282 1,240 1,199 1,178 25-29 23.4 17.8 -5.6 18.7 14.9 -3.8 833 818 783 910 30+ 26.0 18.7 -7.3 19.3 17.9 -1.4 563 1,033 507 878 Missing 47.1 14.5 -32.6 23.3 14.8 -8.5 18 34 17 18
Parity 1 22.6 17.1 -5.5 18.5 14.0 -4.5 1,275 1,129 1,240 1,218 2 24.8 17.4 -7.4 16.7 13.3 -3.4 1,236 1,208 1,191 1,280 3+ 25.3 18.6 -6.7 21.4 18.2 -3.2 1,601 1,697 1,173 1238 Missing 47.1 14.5 -32.6 23.3 14.8 -8.5 18 34 17 18
Education No education 32.6 25.3 -7.3 25.8 21.5 -4.3 367 412 176 181 Primary incomplete 31.7 20.9 -10.8 24.8 20.8 -4.0 1,366 1,141 715 570 Primary complete 23.3 19.7 -3.6 21.9 18.3 -3.6 692 625 512 476 Secondary incomplete 18.5 16.0 -2.5 17.0 13.9 -3.1 1,197 1,317 1,544 1,639 Secondary complete and higher 13.0 7.9 -5.1 12.4 10.6 -1.8 490 541 658 869
Missing 47.1 14.5 -32.6 23.3 14.8 -8.5 18 34 17 18 Media exposure No 26.0 18.8 -7.2 20.1 15.8 -4.3 3,220 3,109 2,403 2,522 Yes 18.2 14.6 -3.6 16.3 13.7 -2.6 893 925 1,200 1,214 Missing 47.1 14.5 -32.6 23.3 14.8 -8.5 18 34 17 18
Age of last child 0-5 17.7 12.7 -5.0 14.9 11.2 -3.7 979 1,027 887 993 6-8 16.3 12.9 -3.4 14.0 11.7 -2.3 499 529 430 443 9-11 22.2 16.6 -5.6 16.5 11.8 -4.7 559 563 472 502 12-23 30.1 22.1 -8.0 22.5 19.0 -3.5 2,093 1,950 1,832 1,814
Sex of last child Male 26.2 19.6 -6.6 20.9 16.2 -4.7 2,105 2,090 1,855 1,898 Female 22.5 15.9 -6.6 16.7 14.0 -2.7 2,026 1,979 1,765 1,855
Wealth quintile 0.0 0.0 Lowest 34.0 23.8 -10.2 23.6 18.8 -4.8 1,018 1,003 551 546 Second 26.2 20.0 -6.2 22.6 18.3 -4.3 937 983 600 747 Middle 23.0 17.6 -5.4 18.1 17.5 -0.6 842 725 718 654 Fourth 18.9 12.5 -6.4 19.3 13.3 -6.0 709 744 792 806 Highest 13.2 11.1 -2.1 13.8 10.6 -3.2 605 580 942 983 Missing 47.1 14.5 -32.6 23.3 14.8 -8.5 18 34 17 18
Total 24.4 17.8 -6.6 18.8 15.1 -3.7 4,130 4,069 3,620 3,753

Evaluation of the INCA Project in Bangladesh 75
Table C.21. Background characteristics of mothers of children under two years of age, INCA 2017 baseline and 2019 endline
Percentage distribution
INCA intervention INCA comparison
B E B E
Mother's age
<20 35.0 23.6 30.9 20.7
20-24 30.7 30.6 33.6 31.6
25-29 20.5 20.4 21.5 24.2
30+ 13.7 25.4 14.0 23.5
Parity
1 31.5 28.3 34.5 32.7
2 29.6 29.8 32.9 34.1
3+ 38.9 41.8 32.6 33.2
Education
No education 8.8 10.1 4.8 4.7
Primary incomplete 33.2 28.2 19.7 15.1
Primary complete 16.8 15.6 14.1 12.8
Secondary incomplete 29.2 32.9 43.0 44.0
Secondary complete and higher 12.0 13.2 18.3 23.3
Media exposure
No 78.2 77.0 66.5 67.1
Yes 21.8 23.0 33.5 32.9
Wealth quintile
Lowest 24.2 25.1 15.3 14.8
Second 22.8 24.3 16.5 19.6
Middle 20.8 17.9 20.0 17.5
Fourth 17.3 18.2 21.8 21.6
Highest 14.8 14.5 26.4 26.5
Religion
Non-Muslim 4.1 3.2 3.9 3.6
Muslim 95.9 96.8 96.1 96.4
Total 100.0 100.0 100.0 100.0
Total Number 4,114 3,902 3,721 3,796

76 Evaluation of the INCA Project in Bangladesh
Table C.22. Background characteristics of pregnant women, INCA 2017 baseline and 2019 endline
Percentage distribution
INCA intervention INCA comparison
B E B E
Mother's age
<20 36.6 26.7 33.5 24.8
20-24 32.6 30.9 36.0 32.3
25-29 18.8 20.8 19.3 20.3
30+ 12.0 21.6 11.2 22.6
Education
No education 6.6 8.2 4.1 3.5
Primary incomplete 34.6 28.4 18.4 13.2
Primary complete 16.8 14.1 13.0 11.9
Secondary incomplete 31.7 35.6 45.0 43.5
Secondary complete and higher 10.2 13.6 19.4 28.0
Media exposure
No 81.3 76.8 67.5 67.5
Yes 18.7 23.2 32.5 32.5
Wealth quintile
Lowest 24.4 24.5 15.0 11.3
Second 21.9 24.2 18.6 20.5
Middle 20.1 19.9 18.7 19.5
Fourth 19.6 18.3 22.5 22.8
Highest 14.1 13.1 25.2 26.0
Religion
Non-Muslim 3.0 3.3 3.8 3.4
Muslim 97.0 96.7 96.2 96.6
Total 100.0 100.0 100.0 100.0
Total Number 1,058 1,469 770 1,047

Evaluation of the INCA Project in Bangladesh 77
Table C.23. Background of children ages 0–23 months, by background characteristics, INCA 2017 baseline and 2019 endline
Number
INCA intervention INCA comparison B E B E
Mother's age <20 34.7 23.2 30.8 20.5 20-24 31.0 30.5 33.1 31.4 25-29 20.2 20.1 21.6 24.2 30+ 13.6 25.4 14.0 23.4 Missing 0.4 0.8 0.5 0.5
Parity 1 30.9 27.7 34.3 32.5 2 29.9 29.7 32.9 34.1 3+ 38.8 41.7 32.4 33.0 Missing 0.4 0.8 0.5 0.5
Education No education 8.9 10.1 4.9 4.8 Primary incomplete 33.1 28.0 19.8 15.2 Primary complete 16.8 15.4 14.1 12.7 Secondary incomplete 29.0 32.4 42.7 43.7 Secondary complete and higher 11.9 13.3 18.2 23.2 Missing 0.4 0.8 0.5 0.5
Media exposure No 78.0 76.4 66.4 67.2 Yes 21.6 22.7 33.1 32.3 Missing 0.4 0.8 0.5 0.5
Age of last child 0-5 23.7 25.2 24.5 26.5 6-8 12.1 13.0 11.9 11.8 9-11 13.5 13.8 13.0 13.4 12-23 50.7 47.9 50.6 48.3
Sex of last child Male 51.0 51.4 51.2 50.6 Female 49.1 48.6 48.8 49.4
Wealth quintile Lowest 24.6 24.6 15.2 14.5 Second 22.7 24.2 16.6 19.9 Middle 20.4 17.8 19.8 17.4 Fourth 17.2 18.3 21.9 21.5 Highest 14.6 14.3 26.0 26.2 Missing 0.4 0.8 0.5 0.5
Religion Non-Muslim 4.0 3.1 3.9 3.5 Muslim 95.5 96.1 95.7 96.0 Missing 0.4 0.8 0.5 0.5
Total 100.0 100.0 100.0 100.0 Number 4,130 4,069 3,620 3,753

78 Evaluation of the INCA Project in Bangladesh
Appendix D. INCA Monitoring and Management Observations
Questions for INCA Project
1. We understand that CNPs were supposed to identify all household with under 2 children and pregnant women, then they were expected to register them into the project, and then they were to visit the households once a month. For the months of September 2019, Oct. 2019, Nov. 2019, Dec. 2019 and January 2020, please provide, for each month:
Household and beneficiary’s registration
Sl. No Issue Months
Sep 2019 Oct 2019 Nov 2019 Dec 2019 Jan 2020 Remarks
a. Number of identified under 2 children 152,263 155,908 159,092 161,996 N/A Not done in
January 20
b. Number of identified pregnant women 100,302 104,996 109,344 113,649 N/A Not done in
January 20
c. Number of registered under 2 children 6,225 3,570 3,103 2,833 N/A Not done in
January 20
d. Number of registered pregnant women 6,014 4,694 4,348 4,305 N/A Not done in
January 20 e. Number of CNP 470 466 462 463 463
f. Number of HH with under 2 children visited by a CNP
95,707 62,644 58,665 61,463 48,000
g. Number of pregnant women visited by a CNP
32,889 30,559 28,991 31,092 38,808
h.
Number of courtyard meetings conducted including CNP and WIC
10,697 10,329 10,380 10,296 31,005
i.
Number of food preparation demonstrations conducted
18,264 20,512 19,566 20,499 16,010
j.
Number of nutrition-related group events conducted (specify the type of event, such as nutrition days)
CND 488 GHD 290 CND 390 CND 91 N/A
CND- Community Nutrition Day; GHD- Global
Handwashing Day
2. Did the project have the expected number of children under 2 and pregnant women living in the project target areas in those five months? These numbers could have been from some population projections of the target populations.
Children under 2: Target- 11,395 (Oct–Dec) Achievement- 15,958
Pregnant women: Target- 16,800, Achievement- 19,361
3. On average, how many households one CNP was supposed to cover in a month, for under 2 children and pregnant women?
CNP was supposed to visit average 250 household in a month. Actually they visited 200 households per month.
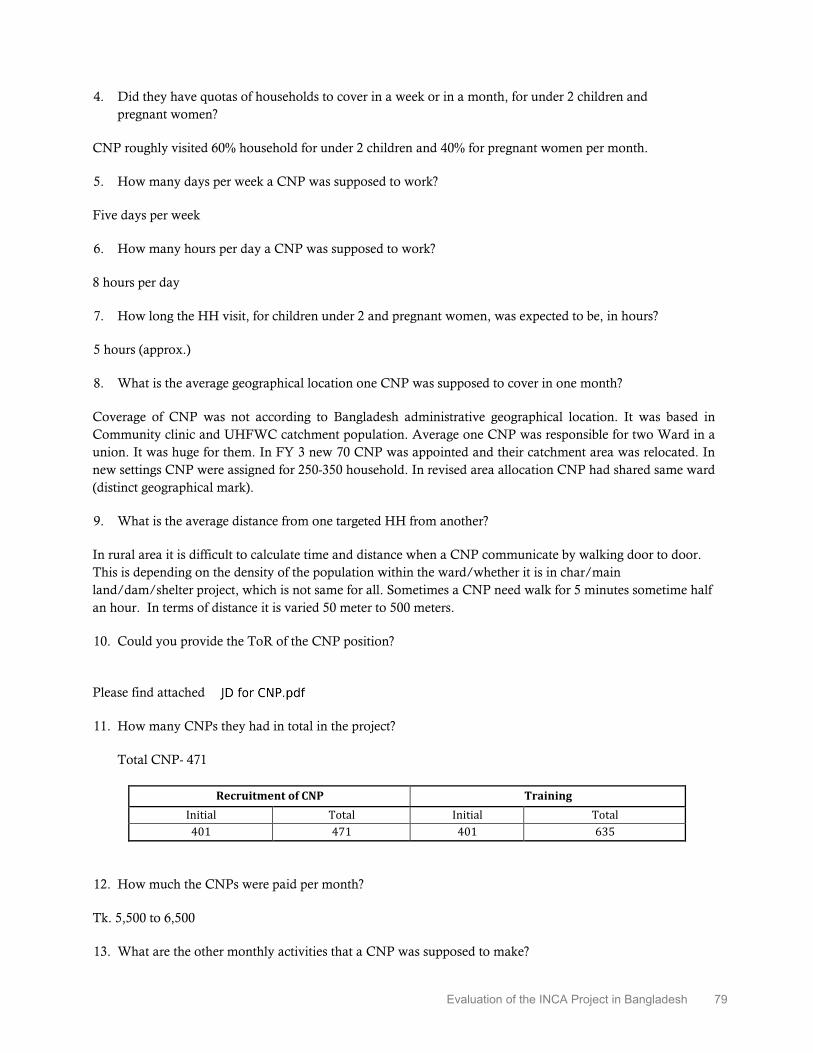
Evaluation of the INCA Project in Bangladesh 79
4. Did they have quotas of households to cover in a week or in a month, for under 2 children and pregnant women?
CNP roughly visited 60% household for under 2 children and 40% for pregnant women per month.
5. How many days per week a CNP was supposed to work?
Five days per week
6. How many hours per day a CNP was supposed to work?
8 hours per day
7. How long the HH visit, for children under 2 and pregnant women, was expected to be, in hours?
5 hours (approx.)
8. What is the average geographical location one CNP was supposed to cover in one month?
Coverage of CNP was not according to Bangladesh administrative geographical location. It was based in Community clinic and UHFWC catchment population. Average one CNP was responsible for two Ward in a union. It was huge for them. In FY 3 new 70 CNP was appointed and their catchment area was relocated. In new settings CNP were assigned for 250-350 household. In revised area allocation CNP had shared same ward (distinct geographical mark).
9. What is the average distance from one targeted HH from another?
In rural area it is difficult to calculate time and distance when a CNP communicate by walking door to door. This is depending on the density of the population within the ward/whether it is in char/main land/dam/shelter project, which is not same for all. Sometimes a CNP need walk for 5 minutes sometime half an hour. In terms of distance it is varied 50 meter to 500 meters.
10. Could you provide the ToR of the CNP position?
Please find attached
11. How many CNPs they had in total in the project?
Total CNP- 471
Recruitment of CNP Training Initial Total Initial Total 401 471 401 635
12. How much the CNPs were paid per month?
Tk. 5,500 to 6,500
13. What are the other monthly activities that a CNP was supposed to make?

80 Evaluation of the INCA Project in Bangladesh
● CNP conducted courtyard session with beneficiary groups (Average 22 per months)
● One CNP worked at health facility once in a week to support heath providers in nutrition service delivery
● Refer beneficiaries to health facilities
● Accompany pregnant women to health facilities when needed
● They participated facility based monthly meeting once in a month
● They participated monthly meeting at Cluster office once in a month.
● Visited CNSG members once in week.
● Participated CNSG quarterly meeting.
● Organized Nutrition day quarterly basis
● Performed additional responsibility in absence/leave or against vacant position
● Organized other day/week observation activities; e.g., Nutrition Week, Breastfeeding Week, World Health day, International Women’s Day, handwashing day etc.
14. Format of their MIS form
Attached
15. Did INCA provide any equipment’s to the health facilities? If YES then:
a. What type of health facility: Community Clinic and Union Health and Family Welfare Center
b. Number of health facility: 151 Community clinic and 23 Union Health and Family Welfare Center
c. What type of equipment’s and/or materials: weight scale, wooden height scale, spring type salter scale, Height measurement tape.
d. On what frequency the equipment and/or material was given: single time
Equipment’s frequency of distribution Health facility Total
CC UHFWC Weight scale 1 151 23 174 Wooden height scale 1 150 23 173 Spring type salter scale 1 127 23 150 Height measurement tape 1 127 23 150
16. Did INCA facilitated providing of any equipment’s to the health facilities? If YES then:
a. What type of health facility
b. Number of health facility
c. What type of equipment’s and/or materials
d. On what frequency the equipment and/or material was given
INCA facilitated UH&FPO and CS office to send requisition to IPHN for anthropometric measurement equipment. However, Health facility did not receive any new equipment during INCA period.

Evaluation of the INCA Project in Bangladesh 81
INCA communicated with IPHN regarding supply of equipment. Unfortunately, government procurement was delay.
17. What is their supervision system?
Field Supervisor (FS) used to supervise the 100% of the CNPs of his/her assigned area each month under the direction of respective Cluster Manager. The FS visit the field at least 14 days each month with a prescribed checklist provided from the central level and s/he visited two nos. of CNP in a day accordingly. Cluster Manager (CM) also had a target to visit the field at least 10 days each month to supervise respective FS and CNP and provide instant feedback maintain a register in Cluster Office. Field Coordinator at field office level and project central team also had a monthly target of field visit to oversee the quality of field activities. Moreover, Project Office-M&E played a vital role to provide technical support to the CNP and FS in regular basis.
18. When were INCA supposed to provide machines? Were they able to provide those on time?
No
19. How many health facilities did INCA cover?
a. What type and number
302 Community Clinic (CC)
70 Union Health and family welfare Center (UHFWC)
20. Did INCA supervisory staff or consultants make any efforts to observe CNPs’ activities, e.g., information giving or demonstration of food preparation, targeted to mothers with under-2 child and pregnant women? If so, what did they learn?
Field Supervisor was responsible to super CNPs. They observed regularly and visit CNPs and observed their activities and give feedback instant and during monthly meeting.
Attached are checklists used by FS.
Cluster Manager (CM) visits CNP as monthly basis. They also use the same format mentioned in Q-20.
Field Coordinator and PO-M&E visits monthly basis and according to project need. They also observed CNP activities randomly using the same check list.
All supervisory staff provided technical support during their visits.
The central team visited CNP’s activities in random sample basis as per visit plan. During visit of CNP’s activities, they also use the same check list and provided feedback instantly. They also provided on the job support, demonstrated model counseling, orientation on food plate and nutrition calendars, MUCA measurement, breast feeding position and attachment and food preparation for child under 2 years for those who had less understanding or skills.

82 Evaluation of the INCA Project in Bangladesh
21. Did INCA supervisory staff or consultants make any efforts to understand to what extent the target participants (mothers with under-2 child and pregnant women) absorb the messages or information provided by the project staff (CNPs or others), at least, qualitatively or by observation?
Some beneficiaries did not give time enough for counseling. Some CNPs also finished her counseling not following process due to short time, having time constraints of beneficiaries. In this way created some gaps about adsorbing messages. We noticed this issues and in meeting and follow up emphasized for increasing motivation to beneficiaries. Some mother in laws were resistant to receive new information and concepts. Some did not want to talk in courtyard sessions, some were not convinced to adapt new messages.
During field visit we talked with participants in courtyard session and during household visit. We asked them what the messages they were told by CNP in the last session or visit. In courtyard session, the observation was roughly 50% could recall the key messages of last session.
Estimated that, 20% CNPs were very week in terms of conducting session and delivering messages.
22. Did INCA supervisory staff make any efforts to observe nutrition services provided to under-2 children and pregnant mothers in INCA-supported facilities?
Field Supervisor regularly visited health facility once a week and when needed. Cluster Manager, Field Coordinator, PO-M&E visited health facility during field visit as monthly basis. They all observed the services provided to beneficiaries and gave feedback and suggestions accordingly.
Central staff visited health facilities as random basis during field visit to observe the nutrition services provided under-2 children and pregnant mother. INCA staffs regularly observed following issues during their visits and assisted to health facility staff for make necessary correction if required.
- Whether service provider counsel’s pregnant women and caregiver of under 2 children or not. - Quality and time spent in counseling. Does service provider provide essential IYCF information or not? - Does service provider conduct GMP to child and measure weight for pregnant women? - Quality of measurement equipment and capacity of health service provider to measure height, weight
and MUAC accurately. - Does service provider follow guideline for distributing IFA and Calcium? - Stock status of drugs especially IFA and calcium. - How service provider keeps record in maternal health and child health register. Do they enter info of
counseling/measurement or not? - Trend in number of service recipients in health facility. - Hygiene and sanitation facilities in the health facility.
Data for Impact (D4I) University of North Carolina at Chapel Hill123 West Franklin Street, Suite 330Chapel Hill, North Carolina 27516 USAPhone: 919-445-9350 | Fax: [email protected]
This publication was produced with the support of the United States Agency for International Development (USAID) under the terms of the Data for Impact (D4I) associate award 7200AA18LA00008, which is implemented by the Carolina Population Center at the University of North Carolina at Chapel Hill, in partnership with Palladium International, LLC; ICF Macro, Inc.; John Snow, Inc.; and Tulane University. The views expressed in this publication do not necessarily reflect the views of USAID or the United States government. TRE-20-30 D4I ISBN: 978-1-64232-263-7