evaluation of the class c driver license written knowledge
TRANSCRIPT

STATE OF CALIFORNIA
DEPARTMENT OF MOTOR VEHICLES
EVALUATION OF THE CLASS C DRIVER LICENSE WRITTEN KNOWLEDGE TESTS
By Scott V. Masten
January 1998
Research and Development Branch Licensing Operations Division
California Department of Motor Vehicles RSS-98-173

EVALUATION OF THE CLASS C DRIVER LICENSE WRITTEN KNOWLEDGE TESTS – MASTEN (1998)
SUMMARY Introduction • The purpose of this study was to evaluate the English DL 5 (Rev. 3/96), Spanish
DL 5 (Rev. 7/95), and English DL 5T (Rev. 3/96) driver written license tests. Specifically, the study assessed the fail rate, mean number of items missed, and internal-consistency reliability for each test form, as well as the pass rate, percentage of applicants selecting each answer choice, and item-total correlation for each item on each test form.
• The results are based on 11,006 completed test forms that were collected
statewide on August 27th and 28th, 1997. Results • The fail rates of the tests are much higher than those reported in previous
written test evaluations. The overall fail rate is 63.9% for English first attempt original applicants, 54.9% for English first attempt renewal applicants, 70.3% for Spanish first attempt original applicants, 74.8% for Spanish first attempt renewal applicants, and 45.6% for English first attempt provisional applicants.
• The test fail rates remained high on the second and third attempts.
• Some forms of the same test are more difficult than others. • The first attempt test fail rates for individual field offices ranged from 40% to
82% for original applicants and from 36% to 73% for renewal applicants.
• The internal-consistency reliabilities of test forms ranged from adequate to excellent.
• A large number of items on each test form are potentially deficient due to a low item-total correlation, a pass rate that is too high or too low, or a distractor selection rate that is too high or too low.
• Many of the low pass rate (highly difficult) items are poorly worded. Rewriting or replacing these items would help lower the test fail rates.
• Some field offices administered the back of the DL 5 to renewal applicants, which is inconsistent with department policy in the Driver License Manual.
i

EVALUATION OF THE CLASS C DRIVER LICENSE WRITTEN KNOWLEDGE TESTS – MASTEN (1998)
• Examiners often did not count missed items when calculating the total test score for original, renewal, and provisional applicants, which resulted in the operational fail rates being slightly lower than the fail rates reported in this evaluation. This practice is inconsistent with department policy, which disallows awarding points to original and provisional applicants based on their verbal responses.
• Field offices are still using older revisions of the Class C license tests, particularly the non-English translations. Recommendations
• The tests should be reviewed to determine the reasons for their high difficulty levels. In particular, items should be checked to ensure that the knowledge covered by the items is contained in the driver handbook and has relevancy to safety, mobility, or other knowledge domains deemed important to the department.
• Items with pass rates that are too high or too low, or with distractor selection
rates that are too high or too low, should be reviewed for possible problems and modified as necessary.
• Items with item-total correlations that are below .10 need to be modified or
replaced.
• Spanish DL 5 items with fail rates that are highly disparate from those for the same items on the English test should be reviewed for possible translation problems.
• Steps should be taken to ensure that field office personnel are administering only current versions of the tests in accordance with the department procedures stated in the Driver License Manual.
• After the tests are revised, they should again be evaluated to determine whether the changes have produced the desired results.
ii

EVALUATION OF THE CLASS C DRIVER LICENSE WRITTEN KNOWLEDGE TESTS – MASTEN (1998)
TABLE OF CONTENTS
PAGE SUMMARY.............................................................................................................. i Introduction......................................................................................................... i Results................................................................................................................. i Recommendations ............................................................................................... ii
INTRODUCTION ................................................................................................... 1
METHODS.............................................................................................................. 1 Data Collection.................................................................................................... 1 Data Analysis...................................................................................................... 2
RESULTS................................................................................................................ 3 Data Collection and Screening ........................................................................... 3 Examiner Scoring Bias ....................................................................................... 4 Test Difficulty and Reliability............................................................................ 4 English DL5 original applicants .................................................................... 6 English DL5 renewal applicants.................................................................... 6 Spanish DL5 original applicants.................................................................... 7 Spanish DL5 renewal applicants ................................................................... 7 English DL5T provisional applicants ............................................................ 7 Test Difficulty by Attempt.................................................................................. 7 Test Fail Rates by Field Office ........................................................................... 8 Item Statistics..................................................................................................... 9 Item pass rate and answer choice selection rates ......................................... 9 Item-total correlation ..................................................................................... 10 Cumulative percentage of applicants by number of items missed ............... 10
DISCUSSION ......................................................................................................... 11
RECOMMENDATIONS ......................................................................................... 15
LIST OF APPENDICES NUMBER PAGE A1 Percentage of Applicants Selecting Each Answer Choice for Each Item on Each Form of the English DL 5 (Rev. 3/96) Test for First Attempt Original Applicants ............................................... 16 A2 Item-Total Correlation for Each Item on Each Form of the English DL 5 (Rev. 3/96) Test for First Attempt Original Applicants..................................................................................... 20
iii

EVALUATION OF THE CLASS C DRIVER LICENSE WRITTEN KNOWLEDGE TESTS – MASTEN (1998)
TABLE OF CONTENTS (Continued)
LIST OF APPENDICES (Continued)
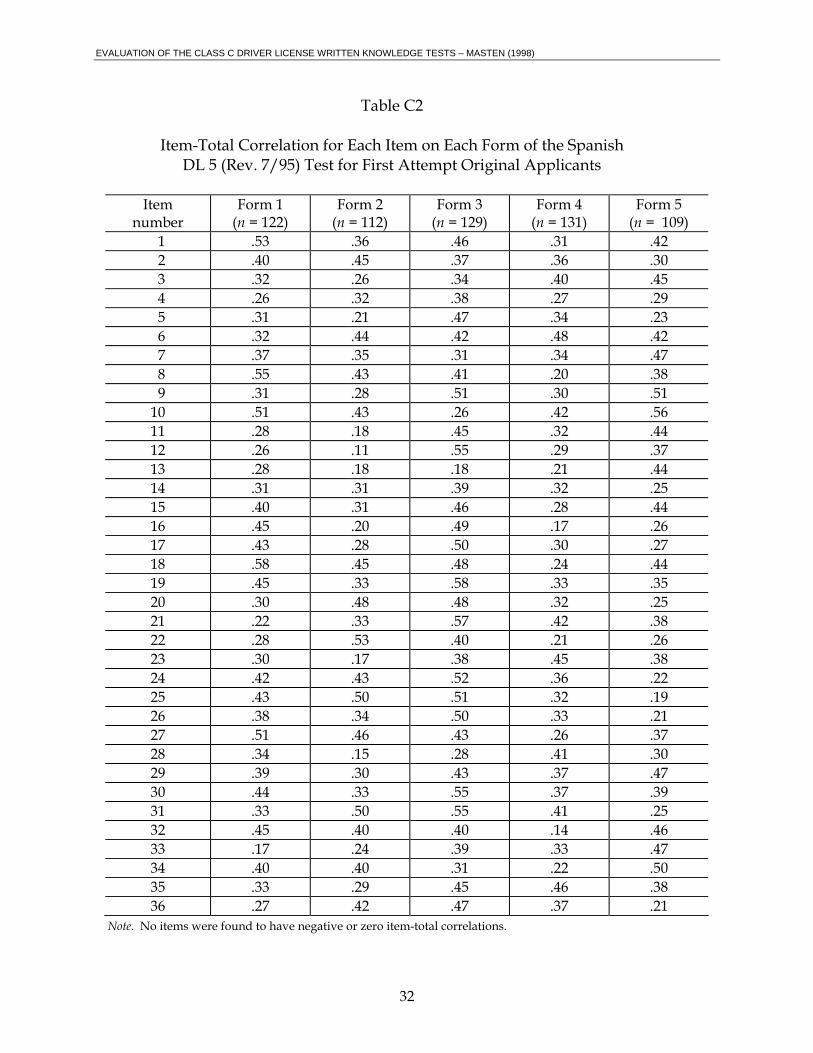
NUMBER ............................................................................................................. PAGE A3 Cumulative Percentage of Applicants by Number of Items Missed for Each Form of the English DL 5 (Rev. 3/96) Test for First Attempt Original Applicants ....................................................... 21 A4 Summary of Problem Items on Each Form of the English DL 5 (Rev. 3/96) Test for First Attempt Original Applicants ................... 22 B1 Percentage of Applicants Selecting Each Answer Choice for Each Item on Each Form of the English DL 5 (Rev. 3/96) Test for First Attempt Renewal Applicants............................................... 23 B2 Item-Total Correlation for Each Item on Each Form of the English DL 5 (Rev. 3/96) Test for First Attempt Renewal Applicants .................................................................................... 25 B3 Cumulative Percentage of Applicants by Number of Items Missed for Each Form of the English DL 5 (Rev. 3/96) Test for First Attempt Renewal Applicants....................................................... 26 B4 Summary of Problem Items on Each Form of the English DL 5 (Rev. 3/96) Test for First Attempt Renewal Applicants................... 27 C1 Percentage of Applicants Selecting Each Answer Choice for Each Item on Each Form of the Spanish DL 5 (Rev. 7/95) Test for First Attempt Original Applicants ............................................... 28 C2 Item-Total Correlation for Each Item on Each Form of the Spanish DL 5 (Rev. 7/95) Test for First Attempt Original Applicants..................................................................................... 30 C3 Cumulative Percentage of Applicants by Number of Items Missed for Each Form of the Spanish DL 5 (Rev. 7/95) Test for First Attempt Original Applicants ....................................................... 33 C4 Summary of Problem Items on Each Form of the Spanish DL 5 (Rev. 7/95) Test for First Attempt Original Applicants ................... 34
iv

EVALUATION OF THE CLASS C DRIVER LICENSE WRITTEN KNOWLEDGE TESTS – MASTEN (1998)
TABLE OF CONTENTS (Continued)
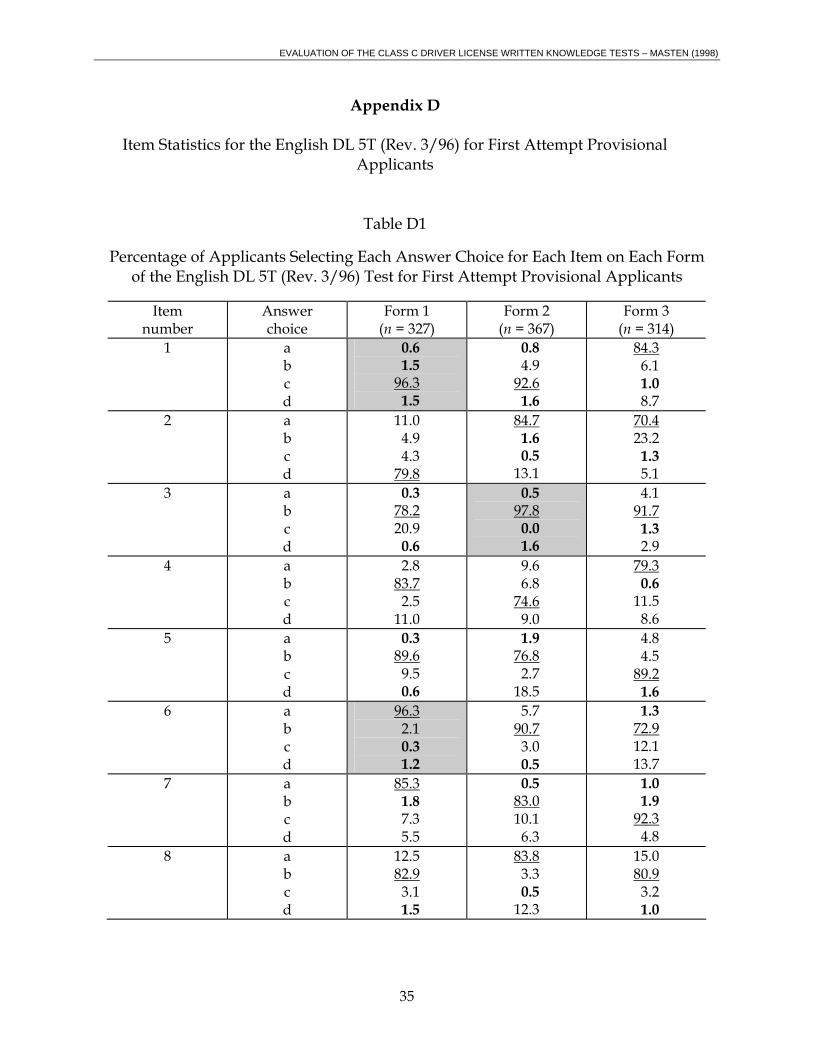
LIST OF APPENDICES (Continued) NUMBER PAGE D1 Percentage of Applicants Selecting Each Answer Choice for Each Item on Each Form of the English DL 5T (Rev. 3/96) Test for First Attempt Provisional Applicants .......................................... 35 D2 Item-Total Correlation for Each Item on Each Form of the English DL 5T (Rev. 3/96) Test for First Attempt Provisional Applicants................................................................................ 40 D3 Cumulative Percentage of Applicants by Number of Items Missed for Each Form of the English DL 5T (Rev.3/96) Test for First Attempt Provisional Applicants .................................................. 41 D4 Summary of Problem Items on Each Form of the English DL 5T (Rev. 3/96) Test for First Attempt Provisional Applicants ............ 42 E Description of Test Forms Received by Research and Development........ 43 F Frequency and Fail Rates for English DL 5 (Rev. 3/96) Original and Renewal Applicants as a Function of Field Office ............................. 46
LIST OF TABLES 1 Frequency (n), Fail Rate, Mean Number of Items Missed, and Internal-Consistency Reliability Coefficient of Each Form of the English DL 5 (Rev. 3/96), Spanish DL 5 (Rev. 7/95), and English DL 5T (Rev. 3/96) for First Attempt Applicants................... 5 2 Frequency (n), Fail Rate, Mean Number of Items Missed for the English DL 5 (Rev. 3/96), Spanish DL 5 (Rev. 7/95), and English DL 5T (Rev. 3/96) for First, Second, and Third Attempt Applicants .......................................................................... 6 3 Summary of Low Pass Rate Items on the English DL 5 (Rev. 3/96) for Original and Renewal Applicants ...................................... 12
v

EVALUATION OF THE CLASS C DRIVER LICENSE WRITTEN KNOWLEDGE TESTS – MASTEN (1998)
INTRODUCTION This report presents the results of an evaluation of the English DL 5 (Rev. 3/96), Spanish DL 5 (Rev. 7/95), and English DL 5T (Rev. 3/96) Class C license written knowledge examinations. The Spanish DL 5 test is based on a translation of the English DL 5 (Rev. 4/95). There are five different versions or forms of the English and Spanish DL 5 examinations, each consisting of 36 questions. These tests are administered to Class C license applicants who are 18 years of age or older. License renewal applicants complete only the first 18 items, while applicants for an original license complete all 36 items. There are three different forms of the English DL 5T examination, each consisting of 46 questions. This test is administered to original Class C license applicants who are younger than 18 years of age (provisional licensees). This paper presents the fail rate, average number of items missed, and internal-consistency reliability for each form of each test, as well as the pass rate, percentage of applicants choosing each answer choice, and item-total correlation for each item on each test form. All item statistics are based on first attempt applicants (those taking the test for the first time on the current application). Results for the English and Spanish DL 5 tests are presented separately for original and renewal applicants, and all test fail rates are presented separately for first, second, and third attempt applicants. Item statistics for the Spanish DL 5 examination are not presented for renewal applicants because too few test sheets were collected for accurate computation. Based on the results of this evaluation, several test items have been identified as candidates for review and possible revision or replacement. The findings are intended to assist the DMV in creating future revisions of the examinations.
METHODS Data Collection The completed tests used in this evaluation were collected from all field offices on August 27th and 28th, 1997. Offices were asked to collect all first, second, and third attempts of all English and non-English versions of the DL 5 and DL 5T examinations administered during this 2-day period. The field office personnel were instructed to write “1st,” “2nd,” or “3rd” in the upper-left hand corner of each administered test to indicate whether the test was an applicant’s first, second, or third attempt on the current license application. If the test being administered was an English or non-English DL 5 examination, the field office personnel were instructed to write “ORIG” at the top of the test if the applicant was applying for an original license, or “REN” if the applicant was applying for a renewal license. Field office personnel were further instructed to only
1

EVALUATION OF THE CLASS C DRIVER LICENSE WRITTEN KNOWLEDGE TESTS – MASTEN (1998)
administer and collect the most current revisions of the examinations, score tests in the usual manner, circle the correct answers to missed questions, write the total number of items missed on the front of the tests, and not return original copies of the tests to applicants. The offices were told to package all the completed tests at the end of the day on August 28, 1997, identify the field office on the envelope, and forward the packages to DMV headquarters. The tests were screened by the Research and Development Branch (R&D) and electronically keyed by the Data Entry unit within the Registration Services Branch. Data Analysis A statistical technique known as analysis of variance (ANOVA) was used to determine the level of statistical significance of any differences in the fail rates and in the test score averages between the test forms of each examination. For this evaluation, the ANOVA homogeneity of variance assumption holds that the spread of scores (error variance) within each form of each test is about the same across all the forms of the test. Violations of this assumption increase the likelihood that significant differences between test forms will be found on the criterion measure when a difference between the forms does not truly exist. The Brown-Forsythe test was used to determine whether the homogeneity assumption was violated for the criterion measures used in test form comparisons. If the assumption was not violated, an alpha level of .05 was used to evaluate the statistical significance of differences between test forms; the differences were deemed significant if the probability of their occurrence was less than 5 times in 100. However, if the Brown-Forsythe test evidenced significant heterogeneity of variance in a dependent measure, a more stringent alpha level of .01 was used to minimize any potential distorting effects on the ANOVA results of nonnormality, heterogeneity of variance, and unequal sample sizes, combined. Using this more conservative alpha level, differences between test forms were considered significant if the probability of their occurring due to chance was less than one time in 100. Furthermore, Games and Howell multiple comparison tests were used for post hoc analyses when a significant omnibus ANOVA was found and the dependent measure evidenced heterogeneity of variance. Tukey-Kramer multiple comparison tests were used for post hoc analyses when a significant omnibus ANOVA was found for any of the other dependent measures. A family-wise alpha level of .05 was maintained in the post hoc comparisons for all dependent measures. The internal-consistency reliability of each test form was computed using the Kuder-Richardson (K-R 20) formula. In general, this type of reliability indicates the degree of uniformity among test items and the extent to which the test items measure a common domain of knowledge. It also serves as a gauge of the overall precision of the test as a measurement instrument. A test that is highly reliable is likely to result in very similar
2

EVALUATION OF THE CLASS C DRIVER LICENSE WRITTEN KNOWLEDGE TESTS – MASTEN (1998)
scores across repeated testings of the same people (assuming a fixed knowledge level between test administrations). The item-total correlation indicates the degree to which performance on the item coincides with performance on the test, such as whether people answering the question correctly also tended to score higher on the test than did people answering the question incorrectly. The item-total correlation coefficient can theoretically range from -1.00 to +1.00, with the zero midpoint representing no relationship at all between performance on the item and performance on the test. In other words, performance on items with correlations approaching zero (between -.10 and .10) has very little or no relationship to whether applicants scored high or low on the examination. Items with positive item-total correlations are more likely to be answered correctly by applicants who scored higher on the test, while items with negative item-total correlations are more likely to be answered correctly by applicants who scored lower on the test.
RESULTS Data Collection and Screening A total of 40,572 test forms of various types were received by Research and Development. The number of each type of form received is presented in Appendix E. It is readily apparent from examining Appendix F that outdated revisions of the licensing exams, particularly those for non-English applicants, are still being used in many field offices. In some cases, the older revisions of a test were administered more often than the current version. Fifteen field offices did not submit any test forms. To determine the degree to which the findings of this evaluation might have been biased by the exclusion of these non-reporting field offices, their percentage contribution to total California driver license activity for the month of August was computed. Because the missing offices were found to account for less than 4% of all driver license activity, it was deemed unlikely that the exclusion of these offices would have significantly biased the results of this evaluation. It is also possible that other offices underreported data, but the extent to which this occurred is unknown. A review of the test forms submitted by each field office revealed that there were no offices that submitted a highly disproportionate number of passes or failures (which, if present, would have biased the fail rate estimates). It is ordinarily desirable that at least 100 first attempt test forms of a given test type be analyzed to produce good estimates of item statistics. This standard was met for only the English DL 5 (Rev. 3/96) for original and renewal applicants, the Spanish DL 5 (Rev. 7/95) for original applicants, and the English DL 5T (Rev. 3/96) for provisional
3
EVALUATION OF THE CLASS C DRIVER LICENSE WRITTEN KNOWLEDGE TESTS – MASTEN (1998)
applicants. Therefore, item statistics were computed for only these test forms and applicant groups. Because far more of these tests were received than were needed for the evaluation, only every third test form was used in the evaluation. This random sampling yielded 12,833 test forms (1/3 of the total volume). These tests were then screened to identify and remove any that were older versions of the tests, were not coded as a first, second, or third attempt, had one or more answers torn off the test, or were missing information on the revision date, form number, language translation, or applicant status. Tests were also discarded if they had more than five double-marked test questions for original applicants or more than four double-marked questions for renewal applicants, or had an extremely high number of answers marked as incorrect (indicating that the tests were likely to have been incorrectly coded or keyed). Finally, renewal tests were removed if the applicant was administered the back of a DL 5 test instead of the front (which violates departmental policy stated in the Driver License Manual). The screening process resulted in 11,006 usable test forms for the evaluation. Examiner Scoring Bias Computer grading of the tests revealed that the actual number of errors made by the applicant often differed from the error score written by the examiner on the front of the test form. This occurred on 24% (n = 2,310) of the 9,745 test forms (across all tests, applicant groups, and test attempts) for which an examiner score was available. The scoring bias for these forms was almost always in the applicant’s favor, and often affected the test result. In 2,203 cases, or 23% of the test forms for which an examiner score was available, the examiner score showed fewer errors than the computer score. Only 16 cases had the examiner score showing more errors than the computer score. The test fail rate for all 9,745 test forms was 56.6% based on the computer score, and 51.4% based on the examiner score. The difference between examiner and computer scores is primarily due to examiners’ having sometimes discussed missed items with examinees and having awarded points based on their verbal responses. Department policy allows this practice only for renewal applicants. However, of the 521 applicants who passed the test as a result of the examiner scoring bias, 185 (36%) were original applicants and 48 (9%) were provisional applicants. The examiner scoring bias has caused the test fail rates presented in this report (which are based on computer-graded scoring) to be slightly higher than the true operational fail rates occurring in the field. Test Difficulty and Reliability The frequency, fail rate, mean number of items missed, and internal-consistency reliability coefficient for each test are presented in Table 1. Items were counted as incorrect if the wrong answer choice was marked, the item was left blank, or more than one answer choice was marked. The fail rates are based on the current passing score of five errors or fewer for DL 5 original applicants, three or fewer for DL 5 renewal
4

EVALUATION OF THE CLASS C DRIVER LICENSE WRITTEN KNOWLEDGE TESTS – MASTEN (1998)
applicants, and seven or fewer for DL 5T provisional applicants. The test statistics shown in the table are discussed in the following five subsections.
Table 1
Frequency (n), Fail Rate, Mean Number of Items Missed, and Internal-Consistency Reliability Coefficient for Each Form of the English DL 5 (Rev. 3/96), Spanish DL 5
(Rev. 7/95), and English DL 5T (Rev. 3/96) for First Attempt Applicants
Test form n Fail rate (%) Mean wrong Reliability Original DL 5 Englisha
1 384 61.5 7.0 .75 2 390 64.1 7.3 .71 3 392 64.5 7.9 .79 4 422 65.9 7.8 .79 5 392 63.5 7.6 .79
Total 1,980 63.9 7.5 .77 Renewal DL 5 Englishb
1 520 56.5 4.0 .49 2 600 44.0 3.3 .49 3 515 47.6 3.6 .52 4 575 56.0 4.0 .57 5 580 70.3 5.0 .59
Total 2,790 54.9 4.0 .53 Original DL 5 Spanishc
1 122 67.2 9.7 .87 2 112 72.3 9.8 .85 3 129 62.0 9.9 .90 4 131 75.6 10.6 .84 5 109 75.2 11.2 .87
Total 603 70.3 10.2 .87 Renewal DL 5 Spanishd
1 58 75.9 5.7 .75 2 42 78.6 5.5 .52 3 54 75.9 5.6 .66 4 63 63.5 5.0 .71 5 49 83.7 6.9 .62
Total 266 74.8 5.7 .65 Provisional DL 5T Englishe
1 327 42.8 7.0 .80 2 367 51.5 9.1 .89 3 314 41.7 7.3 .86
Total 1,008 45.6 7.9 .85 Grand total 6,647 58.4 6.3 .69
Note. The figures presented for total and grand total fail rate, mean wrong, and reliability are weighted averages. All ANOVAs were two-tailed. aForms did not differ significantly on fail rates (F = .45, p = .77), or mean number of items missed (F = 2.41, p = .05). b Forms differed significantly on fail rates (F = 25.00, p < .01) and mean number of items missed (F = 43.12, p < .01). cForms did not differ significantly on fail rates (F = 2.02, p = .09), or mean number of items missed (F = 1.13, p = .34). dForms differed significantly on mean number of items missed (F = 2.76, p < .05), but not on fail rates (F = 1.69, p = .15). eForms differed significantly on mean number of items missed (F = 11.89, p < .05), but not on fail rates (F = 4.06, p = 02.).
5

EVALUATION OF THE CLASS C DRIVER LICENSE WRITTEN KNOWLEDGE TESTS – MASTEN (1998)
Results of Brown-Forsythe tests of the ANOVA homogeneity of variance assumption indicated significant heterogeneity of variance between test forms for the average number of items missed for English DL 5 original applicants (FBF = 2.41, p < .05); for both fail rate (FBF = 507.55, p < .05) and average number of items missed (FBF = 7.77, p < .05) for English DL 5 renewal applicants; and for fail rate (FBF = 389.61, p < .05) for English DL 5T provisional applicants. As discussed in the Methods section of this report, a more stringent omnibus alpha level (.01) and Games and Howell post hoc multiple comparison tests were used to analyze these dependent measures. English DL 5 original applicants. The fail rate ranged from 61.5% to 65.9% for original applicants taking the English DL 5. The differences between the fail rates are not statistically significant (p = .77). The average number of incorrect item responses ranges from 7.0 to 7.9. The score differences are also not significant (p = .05). The K-R 20 reliabilities range from .71 to .79. These reliabilities all exceed the .70 lower limit of acceptable reliability for tests of this length, and the values for Forms 3, 4, and 5 approach the .80 (or higher) level considered “good” for 36-item tests. English DL 5 renewal applicants. The fail rates of the five test forms range from 44.0% to 70.3% for English DL 5 renewal applicants. The differences between the form fail rates are statistically significant (p < .01). Results of Games and Howell multiple comparison tests indicate that the fail rate for Form 5 is significantly higher than the fail rates of all the other forms (p < .05), and that the fail rates for Forms 1 and 4 are both higher than those for Forms 2 and 3 (p < .05). The differences between the fail rates of Forms 1 and 4 and of Forms 2 and 3 are not statistically significant (p > .05). The average number of incorrect responses for English DL 5 renewal applicants ranges from 3.3 to 5.0, and the score differences are significantly different (p < .01). Results of Games and Howell post hoc multiple comparison tests indicate that the average number of errors made by applicants who completed Form 5 is significantly higher than that made by applicants who completed Forms 1, 2, 3, and 4 (p < .05). Applicants who completed Forms 1 or 4 also missed significantly more items than applicants who completed Forms 2 and 3 (p < .05). The other score differences are not significant (p > .05). The K-R 20 reliabilities range from .49 to .59. These reliabilities exceed the .35 to .49 cut-off of acceptability for tests with 18 items. The values for Forms 3, 4, and 5 are also within the .50 to .66 range of “good” reliability for tests of this length. The fact that these reliability coefficients are much lower than those for the 36-item test is primarily due to the differences in test length, rather than any defect in the content of the items (because reliability generally increases as the number of items increases).
6

EVALUATION OF THE CLASS C DRIVER LICENSE WRITTEN KNOWLEDGE TESTS – MASTEN (1998)
Spanish DL 5 original applicants. The fail rates range from 62.0% to 75.6% for Spanish DL 5 original applicants. The differences between the five form fail rates are not significant (p = .09). The average number of incorrect item responses range from 9.7 to 11.2. The differences between the average scores are also not significant (p = .34). The K-R 20 reliabilities range from .84 to .90. These reliabilities all exceed the .80 value considered “good” for tests of this length, and the value for Form 3 exceeds the .89+ value considered “excellent.” Spanish DL 5 renewal applicants. The fail rates range from 63.5% to 83.7% for Spanish DL 5 renewal applicants. The differences between the fail rates are not statistically significant (p = .15). The average number of incorrect item responses ranges from 5.0 to 6.9. The score differences are statistically significant (p < .05). Results of Tukey-Kramer post hoc multiple comparison tests indicate that applicants taking Form 5 missed significantly more questions than did applicants taking Form 4 (p < .05). No other significant differences between the test forms exist (p > .05). The K-R 20 reliabilities range from .52 to .75. These reliabilities all exceed the .50 value considered “good” for tests of this length, and the values for Forms 1 and 4 exceed the .67+ value considered “excellent.” English DL 5T provisional applicants. The fail rate for English DL 5T provisional applicants is 42.8% for Form 1, 51.5% for Form 2, and 41.7% for Form 3, and the differences between these fail rates is not statistically significant (p = .02). However, the differences between the three forms on mean number of items missed are statistically significant (p < .05). Results of Tukey-Kramer post hoc multiple comparison tests indicate that applicants taking Form 2 missed more items (9.1) than did applicants taking Form 1 (7.0) or Form 3 (7.3, p < .05). The mean scores for Forms 1 and 3 are not significantly different (p > .05). The K-R 20 is .80 for Form 1, .89 for Form 2, and .86 for Form 3. The reliability of Form 1 is within the .75 to .85 “good” range for tests with 46 items, and the reliabilities of Forms 2 and 3 exceed the .86+ cut-off considered “excellent.” Test Difficulty by Attempt The frequency, fail rate, and mean number of items missed for first, second, and third attempt applicants are presented in Table 2. The test fail rate averaged over successive attempts is 59.4% for English DL 5 original applicants and 52.6% for renewal applicants, 70.2% for Spanish DL 5 original applicants and 71.8% for renewal applicants, and 48.1% for English DL 5T provisional applicants. On all of the tests, the fail rates remain high on the second and third attempts.
7

EVALUATION OF THE CLASS C DRIVER LICENSE WRITTEN KNOWLEDGE TESTS – MASTEN (1998)
Table 2
Frequency (n), Fail Rate, and Mean Number of Items Missed for the English DL 5 (Rev. 3/96), Spanish DL 5 (Rev. 7/95), and English DL 5T (Rev. 3/96)
for First, Second, and Third Attempt Applicants
Attempt n Fail rate (%) Mean wrong Original DL 5 English First 1,980 63.9 7.5 Second 1,075 54.7 6.5 Third 375 49.1 6.0
Total 3,430 59.4 7.0
Renewal DL 5 English First 2,790 54.9 4.0 Second 1,171 47.7 3.7 Third 299 50.2 3.9
Total 4,260 52.6 3.9
Original DL 5 Spanish First 603 70.3 10.2 Second 346 71.1 8.9 Third 200 68.5 8.7
Total 1,149 70.2 9.6
Renewal DL 5 Spanish First 266 74.8 5.7 Second 170 66.5 5.0 Third 106 72.6 4.9
Total 542 71.8 5.3
Provisional DL 5T English First 1,008 45.6 7.9 Second 464 53.9 8.4 Third 140 47.1 7.5
Total 1,612 48.1 8.0
Grand total 10,993 56.8 6.1 Note. All figures presented for fail rate and mean wrong are weighted averages. Only cases with a 1st, 2nd, or 3rd attempt coded on the test form by the field office examiner are included in the table. A bias check of the fail rates for test forms for which the attempt number was unknown indicated only negligible differences from the total attempt fail rates reported above for each test form. Test Fail Rates by Field Office The test fail rates for English DL 5 (Rev 3/96) original and renewal first-attempt applicants by field office are presented in Appendix F. The fail rates in Appendix F that are computed from fewer than 20 test forms are highly unstable, and therefore may not be very accurate. The fail rates for offices with 20 or more forms range from 40% to 82% for original applicants, and 36% to 73% for renewal applicants.
8

EVALUATION OF THE CLASS C DRIVER LICENSE WRITTEN KNOWLEDGE TESTS – MASTEN (1998)
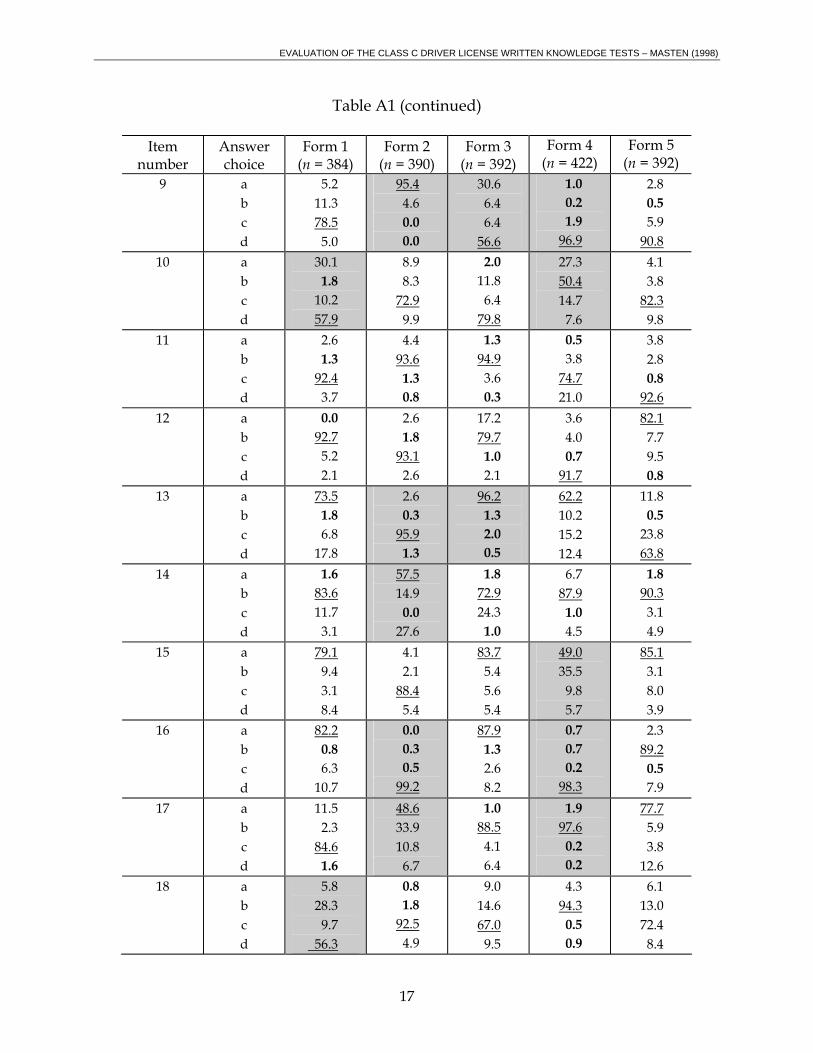
Item Statistics All item statistics are based on first attempt applicants to eliminate potential learning effects of previous exposure to the test items. The results of the test item analyses are presented in Appendices A, B, C, and D. Appendix A contains the results for the English DL 5 original applicants; Appendix B contains the results for the English DL renewal applicants; Appendix C contains the results for the Spanish DL 5 original applicants; and Appendix D contains the results for the English DL 5T provisional applicants. Each of these appendices contains four tables that are always in the same order. The tables contain the following information, respectively: item pass rates and answer choice selection rates; item-total correlations; cumulative percentage of applicants by number of items missed; and summary of problem items on each test form. The results reflected in the first three tables in each appendix are discussed in the next three subsections of this report. Item pass rate and answer choice selection rates. The percentage of applicants that selected each item answer choice on each test form appears in the first table of Appendices A, B, C, and D (Tables A1, B1, C1, and D1). The percentages for the correct answer choices are underlined in the tables. The percentages for each item are based on people who selected a valid item choice; applicants who did not choose an answer or chose more than one answer per item were excluded from the computations. There were less than 2% of applicants excluded per test item for these reasons. The item pass rate refers to the percentage of applicants who correctly answered the item. A very low item pass rate may indicate that the item is poorly worded, has ambiguous or misleading answer choices, is not related to the general knowledge domain that is being tested, or is problematic for some other reason. Items which 60% or fewer of the applicants answered correctly are generally considered suspect, and should therefore be reviewed for clarity and accuracy. Items with extremely high pass rates (95% or higher) are also questionable and should be reviewed as well, since they may not discriminate between people with different levels of knowledge. These “freebie” items often occur when the distractor choices are so illogical that the correct answer is obvious, or when the knowledge required for a question has become common knowledge. It is also desirable that the alternative choices be tenable enough to actually attract the responses of a small but nontrivial percentage of the applicants (generally those who try to guess the answer). Therefore, items with individual distractors that were selected by a very small percentage of applicants, say 2% or less, may also need to be revised. Items with pass rates that are either too high (or higher 95%) or too low (or lower 60%) are shaded in the tables. Distractors that were selected by less than 2% of applicants, or which were selected too often (i.e., more or almost as often as the correct answer choice), are in boldface in the tables.
9
EVALUATION OF THE CLASS C DRIVER LICENSE WRITTEN KNOWLEDGE TESTS – MASTEN (1998)
The 60% and 95% pass rate criteria for items, and the 2% minimum selection rate criterion for distractors, are provided only as guideline indicators of potential item deficiency. Although these statistical standards are useful for pinpointing items that may be inadequate, it is not recommended that items be revised or replaced on the basis of these criteria alone. The relative importance of knowledge covered by an item, possible wording problems, and other relevant factors should always be weighed when deciding to revise or replace an item. Item-total correlation. The item-total correlations for the tests are presented in Tables A2, B2, C2, and D2. Items that tended to be answered correctly by applicants who scored low on the test overall (i.e., items with negative item-total correlations), or that had very little or no relationship to the other items on the test (i.e., those with item-total correlations between -.10 and .10), are highly undesirable and should be modified or replaced. All items with either of these problems are shaded in the tables. A weak item-total correlation indicates that the knowledge measured by the item is very disparate from the knowledge measured by the other items on the test. Items with this characteristic are usually poorly worded and confusing, and definitely need to be revised or replaced. Although items with high positive item-total correlations are the most desirable, any with a correlation equal to or above .10 shows at least some relationship with the other items on the test, and therefore may be acceptable. Cumulative percentage of applicants by number of items missed. The cumulative percentage of applicants by number of items missed on the tests is presented in Tables A3, B3, C3, and D3. The cumulative percentage is the percentage of applicants who missed the number of items indicated in the leftmost column of each table or fewer. For instance, Table A3 indicates that 14.1% of original applicants who took Form 1 of the English DL 5 (Rev. 3/96) missed two or fewer items, while 22.1% of original applicants taking the same test missed three or fewer items. The cumulative percentage represents what the pass rate for each form of each test would be, if the passing cut-off score had been set at the number specified in the leftmost column of each table. The shaded row in each table shows the pass rate of each form of each test at the current cut-off score of allowable misses, which is five for DL 5 original applicants, three for DL 5 renewal applicants, and seven for DL 5T provisional applicants. The information in these tables is also useful for determining what the pass rate of each test would be if another cut-off score had been used. For instance, Table A3 indicates that if six misses had been allowed for original applicants on the English DL 5, 46.9% of applicants would have passed Form 1, 44.4% would have passed Form 2, and so forth.
10

EVALUATION OF THE CLASS C DRIVER LICENSE WRITTEN KNOWLEDGE TESTS – MASTEN (1998)
DISCUSSION The fail rates reported in this evaluation are very high compared to the fail rates reported in past written test evaluations. One of the contributing factors to these high fail rates is the large number of low pass rate (or difficult) items on each form of each test. (Recall that an item is considered suspect and subject to review if fewer than 60% of applicants correctly answer the item). For instance, each form of the English DL 5 36-item test has 5 to 7 highly difficult items, and each 18-item renewal test form has 3 or 4 such items. The low pass rate items for original and renewal applicants on the English DL 5 are summarized in Table 3. The last column in the table contains possible explanations for the high difficulty level of each item. There are enough of these difficult items on each test form to cause original and renewal applicants who miss only these difficult items to fail the test. Most of these difficult items appear to test knowledge that is related to traffic safety, defensive driving, or laws in the California Vehicle Code. However, many are numerical and have correct answers that must be learned by rote memorization. In addition, almost all of the items that were very difficult for renewal applicants in the study were also highly difficult for original applicants. Whether the low item pass rates are the result of poor item characteristics and wording, a lack of coverage of the knowledge area in the driver manual, or a lack of knowledge competency among the applicants is unknown. However, it is highly likely that revising the low pass rate items to eradicate confusing wording, and replacing ones that have little relevance to safety or that are conceptually difficult to grasp, would lower the test fail rates to more historical levels. Although it might be tempting to raise the passing cut-point to decrease the test fail rates, this option would have the unintended effect of lowering the level of competency expected of applicants. Also, it would not make that much of a difference for some applicant types. For instance, raising the cut-score for English DL 5 original applicants from five to six allowable misses would decrease the fail rate from 63.9% to only 55.3%, and even raising the cut-score to seven allowable misses would reduce the fail rate to only 46.7%. Reviewing and revising the low pass rate items to eliminate confusing wording and confusing item choices is preferable to changing the passing cut-score, because it has the added benefits of producing more valid and reliable tests, and maintaining the current competency standards.
11

EVALUATION OF THE CLASS C DRIVER LICENSE WRITTEN KNOWLEDGE TESTS – MASTEN (1998)
Table 3
Summary of Low Pass Rate Items on the English DL 5 (Rev. 3/96) for Original and Renewal Applicants
Forms on which the item appears Possible reasons
Item (stem only) Originals Renewals for low pass rate How many days do you have to report to DMV the sale or transfer of your vehicle?
1,2,3,4,5 1,2,3,4,5 Numerical. Applicants confuse Choices A and B.
Braking studies have shown that a tractor-trailer traveling at 55 mph needs ___ (the) distance to stop as an automobile?
1,5 1,5 Numerical. Applicants may just not know the answer.
When coming to a corner where there is a stop sign, you must first stop:
1 Applicants confuse the small difference between Choices A and D, which is probably not important for traffic safety.
To avoid sudden “last minute moves,” how far ahead should you look when scanning the road for hazards?
1,5 1,5 Numerical. Applicants confuse Choices B and D. Answer choices overlap. The item stem is poorly worded. Best not to represent distance in units of time.
When a mechanical signal or flashing light is operating at a railroad crossing, you must:
1,4 Applicants chose Choice A over correct Choice B. Difference between the two probably not important for traffic safety.
When there are no signs showing other limits, the speed limit for driving in a business district is:
1 Numerical. Applicants may just not know the correct answer.
You must not cross a solid double line in the center of the roadway to:
2 2 Applicants confuse Choices A and D. The item stem is poorly worded.
You are driving alongside a bicycle lane and want to turn right at a corner. You should signal, look carefully for bike riders, then:
2,3 2 Numerical. Applicants confuse Choices A and D.
When coming to a corner where there is a stop sign, you must first stop:
2 Applicants confuse Choice A and correct Choice D. Choice A appears safer, and the distinction is probably not relevant for traffic safety.
Which of the following could best contribute to improved traffic flow?
2 Applicants confuse Choice D with correct Choice B. Tricky. Irrelevant for traffic safety.
Defensive driving is: 2 Poor question; every answer choice is correct.
12

EVALUATION OF THE CLASS C DRIVER LICENSE WRITTEN KNOWLEDGE TESTS – MASTEN (1998)
Table 3 (continued)
Forms on which the item appears Possible reasons Item (stem only) Originals Renewals for low pass rate
Drinking drivers are involved in about ___ of California’s fatal traffic crashes.
2 Numerical. Applicants confuse Choices B and C. Too “researchy.” Seems more important to point out their over-involvement than to quiz the exact percentage.
A blind intersection is an intersection where you cannot:
3,4 3 Numerical. Applicants confuse Choices A and B. The definition is arbitrary.
A white painted curb means that stopping or parking is permitted:
3 3 Applicants confuse Choices A and D. Choice A and C may also be correct.
You are driving a slow moving vehicle on a winding two-lane highway. You must pull over when it is safe and let other drivers pass when you are followed by:
3 Numerical. Applicants may just not know the answer. Knowledge may be useless because of the difficulty of counting vehicles while driving.
Should you often check traffic behind you?
4 Poor question. The correct answer is “Yes,” with no qualifications.
There are three lanes of traffic moving in your direction. The lane that generally would have the smoothest flow is:
4 4 Numerical. Applicants confuse Choice A with correct Choice B because Choice A is probably correct on a freeway or highway. Too “researchy.”
Which of the following is not considered a lane change?
4 Applicants appear to just not know the answer. Safety relevance is questionable.
You may make a right turn at a red light:
4 Confusing wording using “OK” in the answer choices.
It is against the law to enter an intersection when:
5 5 Applicants confuse Choice D with correct Choice C. Choice D is also correct.
What is the purpose of a turn-out lane?
5 Applicants confuse Choice B with correct Choice A, due to a misunderstanding of the difference between a turn-out lane and right turn lane. Choice D is also correct.
Another problem with the tests, in addition to the high fail rates, is that some forms of the same test are more difficult than others. This result is largely due to the fact that some forms have more low pass rate items and fewer high pass rate items (“freebies”)
13
EVALUATION OF THE CLASS C DRIVER LICENSE WRITTEN KNOWLEDGE TESTS – MASTEN (1998)
than other forms. Correcting problem items should help equalize the fail rates between the forms of each test. The fail rates for 2nd and 3rd test attempts are also higher than those found in past written test evaluations. Also, the fail rates do not decrease substantially over consecutive attempts on the same test, which may indicate that applicants often do not review the driver manual following a test failure. Original and renewal applicants taking the Spanish DL 5 tended to make more errors and fail more often than did applicants taking the English DL 5. This may be due to imprecise translations of some test items, or to differences between the current version of the English test and the revision of the English test from which the Spanish test was translated. Differences between the language groups in the availability of driver license manuals and instruction opportunities might also contribute to the performance difference. The internal-consistency test reliabilities are all adequate, and some are even “good” or “excellent.” The reliabilities can be increased and made more homogenous across different forms of the same tests by correcting or replacing problem items. Most of the items on each test form have an item-total correlation that is too low, a pass rate that is too high or too low, or a distractor that was selected either too often or too infrequently. Tables A4, B4, C4, and D4 summarize these items on the forms of each test. These statistical characteristics indicate that there may be a problem with the items, and they should therefore be reviewed and modified as necessary. In particular, items with weak item-total correlations show the strongest evidence of item deficiency and warrant immediate attention. Special care should be taken to review and correct items having two or more problem characteristics, because they are also likely to be deficient. One item that alerted the attention of the reviewer was, “How many days do you have to report to DMV the sale or transfer of your vehicle?”, which is present as a mandatory question on the front of every DL 5 test form. When screening the test forms, it became apparent that examiners in some field offices are accepting any answer choice as the correct answer, and writing “ASAP” over the item responses. This is a low pass rate item on every form for both renewal and original applicants. Apparently some field office personnel already recognized the relationship between this difficult item and test failures, and attempted to ameliorate the problem on their own. While screening the test forms, it became apparent that some field office personnel were administering the back side of the DL 5 to renewal applicants. This deviance from department policy results in applicants not being exposed to the mandatory items pertaining to blood alcohol level and time to report the sale of a vehicle, which appear
14

EVALUATION OF THE CLASS C DRIVER LICENSE WRITTEN KNOWLEDGE TESTS – MASTEN (1998)
on the front of each test form. Because the small amount of tests with this problem were removed from the pool of usable test forms during the screening process, they were unable to bias the results of the evaluation. Some field offices also deviated from department procedure by awarding points to original and provisional license applicants who were borderline test failures, and/or by using older revisions of the Class C license test, particularly the non-English translations.
RECOMMENDATIONS The tests should be reviewed to determine the reasons for their high difficulty levels. In particular, items should be checked to ensure that the knowledge covered by the items is contained in the driver handbook and has relevancy to safety, mobility, or other knowledge domains deemed important to the department. Items with pass rates that are too high or too low, or with distractor selection rates that are too high or too low, should be reviewed for possible problems and modified as necessary. Items with item-total correlations that are below .10 need to be modified or replaced. Spanish DL 5 items with fail rates that are highly disparate from those for the same items on the English test should be reviewed for possible translation problems. Steps should be taken to ensure that field office personnel are administering only current versions of the tests in accordance with the department procedures stated in the Driver License Manual. After the tests are revised, they should again be evaluated to determine whether the changes have produced the desired results.
15

EVALUATION OF THE CLASS C DRIVER LICENSE WRITTEN KNOWLEDGE TESTS – MASTEN (1998)
Appendix A
Item Statistics for the English DL 5 (Rev. 3/96) for First Attempt Original Applicants
Table A1
Percentage of Applicants Selecting Each Answer Choice for Each Item on Each Form of the English DL 5 (Rev. 3/96) Test for First Attempt Original Applicants
Item
number Answer choice
Form 1 (n = 384)
Form 2 (n = 390)
Form 3 (n = 392)
Form 4 (n = 422)
Form 5 (n = 392)
1 a b c d
8.1 13.4 66.4 12.1
0.0 99.0 1.0 0.0
49.4 35.0 6.2 9.5
1.0 80.8 18.3 0.0
81.6 0.5 9.2 8.7
2 a b c d
3.4 50.7 20.5 25.5
13.9 2.6 83.5 0.0
3.1 82.9 0.0 14.1
1.9 67.3 24.6 6.2
49.4 35.8 7.2 7.7
3 a b c d
5.2 1.6 3.1 90.1
10.5 3.8 84.6 1.0
17.9 67.3 11.5 3.3
8.6 15.8 65.3 10.3
2.1 49.9 23.9 24.2
4 a b c d
79.9 9.7 8.9 1.6
12.6 5.4 79.5 2.6
99.5 0.0 0.5 0.0
1.4 97.4 0.0 1.2
9.5 11.0 59.7 19.7
5 a b c d
0.8 0.0 98.2 1.0
11.6 87.6 0.3 0.5
26.2 58.2 3.1 12.6
83.3 1.7 12.1 2.9
12.8 76.2 1.8 9.2
6 a b c d
50.1 33.1 8.4 8.4
1.8 0.0 0.5 97.7
88.0 2.3 2.8 6.9
16.9 66.7 11.6 4.8
82.7 2.6 3.1 11.7
7 a b c d
3.4 89.6 6.0 1.0
34.4 3.6 2.3 59.6
2.6 7.4 88.7 1.3
82.5 2.6 1.4 13.4
7.4 27.4 11.5 53.6
8 a b c d
89.0 1.6 0.5 8.9
3.6 14.0 78.8 3.6
0.0 85.6 10.8 3.6
3.8 93.1 0.9 2.1
14.8 68.3 11.3 5.6
16
EVALUATION OF THE CLASS C DRIVER LICENSE WRITTEN KNOWLEDGE TESTS – MASTEN (1998)
Table A1 (continued)
Item number
Answer choice
Form 1 (n = 384)
Form 2 (n = 390)
Form 3 (n = 392)
Form 4 (n = 422)
Form 5 (n = 392)
9 a b c d
5.2 11.3 78.5 5.0
95.4 4.6 0.0 0.0
30.6 6.4 6.4 56.6
1.0 0.2 1.9 96.9
2.8 0.5 5.9 90.8
10 a b c d
30.1 1.8 10.2 57.9
8.9 8.3 72.9 9.9
2.0 11.8 6.4 79.8
27.3 50.4 14.7 7.6
4.1 3.8 82.3 9.8
11 a b c d
2.6 1.3 92.4 3.7
4.4 93.6 1.3 0.8
1.3 94.9 3.6 0.3
0.5 3.8 74.7 21.0
3.8 2.8 0.8 92.6
12 a b c d
0.0 92.7 5.2 2.1
2.6 1.8 93.1 2.6
17.2 79.7 1.0 2.1
3.6 4.0 0.7 91.7
82.1 7.7 9.5 0.8
13 a b c d
73.5 1.8 6.8 17.8
2.6 0.3 95.9 1.3
96.2 1.3 2.0 0.5
62.2 10.2 15.2 12.4
11.8 0.5 23.8 63.8
14 a b c d
1.6 83.6 11.7 3.1
57.5 14.9 0.0 27.6
1.8 72.9 24.3 1.0
6.7 87.9 1.0 4.5
1.8 90.3 3.1 4.9
15 a b c d
79.1 9.4 3.1 8.4
4.1 2.1 88.4 5.4
83.7 5.4 5.6 5.4
49.0 35.5 9.8 5.7
85.1 3.1 8.0 3.9
16 a b c d
82.2 0.8 6.3 10.7
0.0 0.3 0.5 99.2
87.9 1.3 2.6 8.2
0.7 0.7 0.2 98.3
2.3 89.2 0.5 7.9
17 a b c d
11.5 2.3 84.6 1.6
48.6 33.9 10.8 6.7
1.0 88.5 4.1 6.4
1.9 97.6 0.2 0.2
77.7 5.9 3.8 12.6
18 a b c d
5.8 28.3
9.7 56.3
0.8 1.8 92.5
4.9
9.0 14.6 67.0 9.5
4.3 94.3 0.5 0.9
6.1 13.0
72.4 8.4
17

EVALUATION OF THE CLASS C DRIVER LICENSE WRITTEN KNOWLEDGE TESTS – MASTEN (1998)
Table A1 (continued)
Item number
Answer choice
Form 1 (n = 384)
Form 2 (n = 390)
Form 3 (n = 392)
Form 4 (n = 422)
Form 5 (n = 392)
19 a b c d
22.1 4.7 73.2 0.0
65.8 3.1 12.4 18.7
13.3 3.8
80.8 2.0
45.2 51.0 2.9 1.0
19.4 70.7 9.2 0.8
20 a b c d
1.3 98.4 0.0 0.3
12.7 81.6 2.8 2.8
6.1 4.9 88.7 0.3
73.7 18.5 7.1 0.7
52.8 31.5 1.0 14.6
21 a b c d
0.0 1.0 99.0 0.0
91.0 1.5 4.9 2.6
54.5 19.7 0.3 25.6
1.2 1.4 96.4 0.9
0.0 0.3 98.2 1.5
22 a b c d
52.9 44.8 1.6 0.8
30.1 0.8 11.1 58.1
3.8 75.6 19.7 0.8
0.9 97.6 0.5 0.9
9.7 89.7 0.5 0.0
23 a b c d
0.0 96.1 3.6 0.3
2.1 1.0 1.8 95.1
3.3 91.6
1.5 3.6
2.1 92.4 1.4 4.0
60.5 19.7 3.1 16.7
24 a b c d
1.6 55.9 12.3 30.2
83.8 13.1 2.3 0.8
20.8 4.9 54.1 20.3
4.5 5.0 89.8 0.7
0.3 0.0 0.5 99.2
25 a b c d
0.8 92.9 3.9 2.4
1.0 19.3 12.6 67.0
1.0 18.3 9.3 71.5
1.9 1.2 6.4 90.5
89.0 7.4 3.3 0.3
26 a b c d
91.7 4.4 0.8 3.1
2.3 57.9 0.8 39.0
17.9 71.3 0.5 10.3
79.0 7.9 7.9 5.2
93.9 1.3 0.3 4.6
27 a b c d
5.2 3.9 79.8 11.0
25.4 56.7 16.3 1.6
6.7 0.8 91.0 1.5
26.1 49.8 0.9 23.2
1.0 95.1 2.6 1.3
28 a b c d
91.9 2.9 2.1 3.1
0.5 92.6 6.2 0.8
7.9 1.5 87.5 3.1
13.0 13.2 60.6 13.2
12.6 70.1 3.6 13.7
18

EVALUATION OF THE CLASS C DRIVER LICENSE WRITTEN KNOWLEDGE TESTS – MASTEN (1998)
Table A1 (continued)
Item number
Answer choice
Form 1 (n = 384)
Form 2 (n = 390)
Form 3 (n = 392)
Form 4 (n = 422)
Form 5 (n = 392)
29 a b c d
0.0 0.3 99.5 0.3
2.6 80.7 16.0 0.8
84.1 1.0 1.0 13.8
83.8 2.1 2.4 11.6
1.8 76.7 3.1 18.5
30 a b c d
3.4 92.2 2.6 1.8
19.8 66.3 4.1 9.8
80.1 6.4 2.6 11.0
20.0 67.2 10.7 2.1
2.3 1.0 5.4
91.3 31 a
b c d
89.6 7.6 2.6 0.3
23.1 7.9 68.7 0.3
1.0 7.7 89.8 1.5
14.8 6.0 2.1 77.1
0.8 6.2 2.8 90.2
32 a b c d
78.3 7.1 3.7 11.0
99.5 0.0 0.5 0.0
23.0 6.1 69.9 1.0
1.2 98.8 0.0 0.0
74.9 17.9 6.6 0.5
33 a b c d
1.6 91.9 1.8 4.7
88.9 8.2 2.6 0.3
3.1 13.6 81.1 2.3
78.9 7.3 5.2 8.5
1.3 93.1 3.8 1.8
34 a b c d
2.1 81.5 0.5 15.9
1.3 93.1 4.9 0.8
3.8 65.6 24.9 5.6
12.6 0.2 11.1 76.1
0.5 84.4 15.1 0.0
35 a b c d
10.3 72.6 2.4 14.8
3.9 41.2 34.0 20.9
13.0 62.1 6.6 18.2
26.7 54.5 3.3 15.5
2.0 89.3 5.4 3.3
36 a b c d
9.4 3.7 86.1 0.8
0.3 84.9 12.6 2.3
1.5 96.9 0.3 1.3
17.8 73.2 8.3 0.7
12.8 2.3 84.1 0.8
Note. Underlining of a percentage indicates that the answer choice was the correct response according to the official answer key. Shading indicates that the item needs to be reviewed and possibly revised due to the item pass rate being too low or too high. A boldface percentage indicates that the distractor selection rate is too low or too high.
19

EVALUATION OF THE CLASS C DRIVER LICENSE WRITTEN KNOWLEDGE TESTS – MASTEN (1998)
Table A2
Item-Total Correlation for Each Item on Each Form of the English DL 5 (Rev. 3/96) Test for First Attempt Original Applicants
Item
number Form 1
(n = 384) Form 2
(n = 390) Form 3
(n = 392) Form 4
(n = 422) Form 5
(n = 392) 1 .32 .15 .15 .31 .28 2 .18 .24 .30 .18 .15 3 .23 .33 .30 .32 .22 4 .35 .17 .10 .25 .37 5 .21 .20 .24 .26 .17 6 .21 .30 .37 .33 .35 7 .26 .37 .40 .28 .22 8 .25 .31 .14 .29 .46 9 .27 .09 .30 .29 .22 10 .36 .26 .19 .38 .36 11 .14 .16 .21 .31 .25 12 .18 .10 .38 .37 .42 13 .27 .21 .29 .28 .23 14 .29 .32 .20 .28 .30 15 .30 .28 .28 .12 .32 16 .34 .17 .19 .07 .21 17 .26 .12 .30 .21 .29 18 .37 .14 .32 .33 .29 19 .22 .22 .38 .20 .28 20 .07 .06 .23 .40 .27 21 .08 .26 .39 .28 .17 22 .21 .24 .25 .27 .31 23 .13 .19 .26 .24 .26 24 .25 .22 .35 .28 .13 25 .18 .36 .39 .32 .21 26 .23 .15 .33 .32 .23 27 .31 .34 .28 .38 .20 28 .34 .07 .26 .36 .34 29 .09 .25 .17 .16 .39 30 .35 .17 .28 .44 .26 31 .16 .32 .27 .34 .25 32 .27 .05 .29 .21 .40 33 .17 .14 .33 .27 .29 34 .22 .19 .24 .25 .27 35 .27 .27 .46 .26 .28 36 .15 .15 .28 .20 .28
Note. Shading indicates that an item needs to be reviewed and revised or replaced because the item-total correlation is negative or less than .10.
20

EVALUATION OF THE CLASS C DRIVER LICENSE WRITTEN KNOWLEDGE TESTS – MASTEN (1998)
Table A3
Cumulative Percentage of Applicants by Number of Items Missed for Each Form of the English DL 5 (Rev. 3/96) Test for First
Attempt Original Applicants
Number missed
Form 1 (n = 384)
Form 2 (n = 390)
Form 3 (n = 392)
Form 4 (n = 422)
Form 5 (n = 392)
0 4.4 2.6 4.6 2.6 3.3
1 7.8 5.9 8.2 6.2 6.9
2 14.1 12.1 13.0 11.1 12.8
3 22.1 18.7 19.6 15.9 20.7
4 30.2 25.1 26.8 24.9 29.1
5 38.5 35.9 35.5 34.1 36.5
6 46.9 44.4 42.9 44.1 45.2
7 57.6 51.5 51.3 52.4 53.8
8 68.2 63.8 58.2 62.1 63.3
9 74.7 72.3 67.1 69.0 70.9
10 81.5 79.5 74.5 75.6 76.3
11 87.2 83.6 79.3 81.8 82.7
12 90.1 90.3 83.7 86.3 87.2
13 93.2 93.6 87.0 90.0 88.3
14 95.1 96.4 90.1 92.9 89.5
15 96.1 98.7 92.6 94.3 91.8
16+ 100.0 100.0 100.0 100.0 100.0 Note. The shaded line represents the pass rate at the current passing standard, which allows up to five errors.
21

EVALUATION OF THE CLASS C DRIVER LICENSE WRITTEN KNOWLEDGE TESTS – MASTEN (1998)
Table A4
Summary of Problem Items on Each Form of the English DL 5 (Rev. 3/96) Test for First Attempt Original Applicants
Problem indicator
Form 1 items
Form 2 items
Form 3 items
Form 4 items
Form 5 items
Item-total correlation too low or negativea
20, 21, 29 9, 20, 28, 32
none 16 none
Pass rate too highb 5, 20, 21, 23, 29
1, 6, 9, 13, 16, 23, 32
4, 13, 36 4, 9, 16, 17, 21, 22, 32
21, 24, 27
Pass rate too lowc 2, 6, 10, 18, 22, 24,
7, 14, 17, 22, 26, 27, 35,
1, 5, 9, 21, 24
10, 15, 19, 27, 35
2, 3, 4, 7, 20
Distractor selected too oftend
22 35 none 19 none
Distractor selected too infrequentlye
3, 4, 5, 7, 8, 10, 11, 12, 13, 14, 16, 17, 19, 20, 21, 22, 23, 24, 25, 26, 29, 30, 31, 33, 34, 36
1, 2, 3, 5, 6, 9, 11, 12, 13, 14, 16, 18, 21, 22, 23, 24, 25, 26, 27, 28, 29, 31, 32, 33, 34, 36
2, 4, 7, 8, 10, 11, 12, 13, 14, 16, 17, 19, 20, 21, 22, 23, 25, 26, 27, 28, 29, 31, 32, 36
1, 2, 4, 5, 7, 8, 9, 11, 12, 14, 16, 17, 18, 19, 20, 21, 22, 23, 24, 25, 27, 32, 34, 36
1, 5, 9, 11, 12, 13, 14, 16, 19, 20, 21, 22, 24, 25, 26, 27, 29, 30, 31,32, 33, 34, 35, 36
aThe item-total correlation was negative or less than .10. bMore than 95% of applicants answered the item correctly. cLess than 60% of applicants answered the item correctly. dA distractor was chosen more, or almost, as often as the correct answer to the item. eA distractor was selected by 2% or fewer applicants.
22

EVALUATION OF THE CLASS C DRIVER LICENSE WRITTEN KNOWLEDGE TESTS – MASTEN (1998)
Appendix B
Item Statistics for the English DL 5 (Rev. 3/96) for First Attempt Renewal Applicants
Table B1
Percentage of Applicants Selecting Each Answer Choice for Each Item on Each
Form of the English DL 5 (Rev. 3/96) Test for First Attempt Renewal Applicants 0
Item number
Answer choice
Form 1 (n = 520)
Form 2 (n = 600)
Form 3 (n = 515)
Form 4 (n = 575)
Form 5 (n = 580 )
1 a b c
17.5 11.3 61.6 9.6
0.7 99.0 0.3 0.0
43.6 46.0 6.7 3.7
1.2 84.7 14.1 0.0
79.0 0.2
d 10.4 10.4
2 a b c d
3.3 31.7 27.4 37.7
11.2 2.2 86.4 0.2
1.2 93.5 0.2 5.1
1.1 60.0 34.3 4.6
44.1 43.9 8.7 3.3
3 a b c d
4.4 0.2 0.8 94.6
14.3 6.7 78.8 0.2
14.3 75.3 7.8 2.5
13.9 10.9 66.7 8.5
3.8 34.6 24.9 36.7
4 a b c d
82.3 14.2 3.3 0.2
12.7 4.2 80.8 2.3
98.1 0.0 1.4 0.6
2.1 96.7 0.5 0.7
19.7 11.9 54.8 13.6
5 a b c d
0.0 0.2 98.5 1.4
19.4 80.2 0.0 0.3
37.6 45.1 4.1 13.2
78.3 1.6 15.3 4.8
9.6 72.2 1.8 16.5
6 a b c d
45.3 45.9 5.6 3.1
0.3 0.2 1.3 98.2
92.8 0.8 0.4 6.0
18.5 56.8 19.0 5.8
86.0 3.3 3.1 7.5
7 a b c d
0.8 96.0 2.9 0.4
45.5 5.4 6.0 43.1
0.4 10.2 86.9 2.5
85.1 1.9 1.6 11.4
6.1 31.1 16.3 46.5
8 a b c d
86.2 1.2 1.0 11.7
3.0 9.3 84.8 2.8
0.6 92.0 2.9 4.5
2.4 89.0 1.2 7.3
19.7 61.6 14.5 4.2
23

EVALUATION OF THE CLASS C DRIVER LICENSE WRITTEN KNOWLEDGE TESTS – MASTEN (1998)
Table B1 (continued)
Item number
Answer choice
Form 1 (n = 520)
Form 2 (n = 600)
Form 3 (n = 515)
Form 4 (n = 575)
Form 5 (n = 580 )
9 a b c d
3.5 16.1 76.7 3.7
98.7 1.2 0.0 0.2
35.0 6.7 6.5 51.8
0.9 0.3 0.9 97.9
5.4 0.2 4.8 89.6
10 a b c d
20.2 0.4 13.7 65.7
12.0 10.0 68.4 9.6
3.9 11.7 3.9 80.5
38.9 43.0 10.0 8.1
5.6 3.8 80.7 9.9
11 a b c d
1.0 1.4 94.2 3.5
6.2 93.5 0.0 0.3
3.7 93.2 2.7 0.4
0.5 5.2 78.8 15.4
6.8 4.5 0.3 88.3
12 a b c d
0.0 97.7 1.9 0.4
1.2 0.7 98.0 0.2
16.1 80.9 1.4 1.6
7.7 3.9 1.8 86.6
82.9 11.5 4.4 1.2
13 a b c d
77.7 1.7 2.3 18.3
3.2 1.8 93.8 1.2
96.1 1.0 2.5 0.4
53.9 11.2 13.9 21.1
8.0 0.2 17.9 74.0
14 a b c d
1.0 84.1 12.2 2.7
46.7 20.6 0.2 32.6
5.3 80.4 13.6 0.8
3.5 91.8 1.2 3.5
1.0 92.9 2.8 3.3
15 a b c d
86.3 7.1 1.7 4.8
10.7 4.4 81.6 3.4
82.7 5.3 4.7 7.3
44.1 43.3 9.1 3.5
91.3 1.6 4.7 2.4
16 a b c d
83.6 0.2 7.5 8.7
0.0 0.2 0.3 99.5
93.0 1.2 0.6 5.3
0.3 0.2 0.0 99.5
2.4 89.3 0.9 7.4
17 a b c d
6.6 2.3 90.5 0.6
44.4 46.7 6.2 2.7
0.8 93.2 1.4 4.7
0.7 99.0 0.3 0.0
78.6 5.2 4.0 12.2
18 a b c d
9.5 27.5 13.5 49.5
0.8 1.0 95.3 2.8
13.3 12.7 67.3 6.7
4.9 94.1 0.7 0.3
14.3 11.1 66.0 8.6
Note. Underlining of a percentage indicates that the answer choice was the correct response according to the official answer key. Shading indicates that the item needs to be reviewed and possibly revised due to the item pass rate being too low or too high. A boldface percentage indicates that the distractor selection rate is too low or too high.
24

EVALUATION OF THE CLASS C DRIVER LICENSE WRITTEN KNOWLEDGE TESTS – MASTEN (1998)
Table B2
Item-Total Correlation for Each Item on Each Form of the English DL 5 (Rev. 3/96) Test for First Attempt Renewal Applicants
Item
number Form 1
(n = 520) Form 2
(n = 600) Form 3
(n = 515) Form 4
(n = 575) Form 5
(n = 580 )
1 .16 .13 .04 .22 .31
2 .12 .17 .18 .25 .14
3 .04 .23 .24 .22 .24
4 .25 .10 .23 .15 .26
5 .08 .26 .13 .24 .14
6 .06 .21 .11 .29 .26
7 .22 .21 .36 .23 .14
8 .14 .22 .08 .24 .32
9 .23 .12 .11 .18 .23
10 .17 .26 .15 .25 .26
11 .08 .16 .14 .26 .17
12 .15 .01 .37 .20 .22
13 .14 .20 .29 .22 .07
14 .21 .24 .14 .28 .15
15 .23 .11 .17 .01 .25
16 .24 .16 .23 .14 .13
17 .23 .05 .14 .18 .17
18 .14 .13 .21 .12 .32 Note. Shading indicates that an item needs to be reviewed and revised or replaced because the item-total correlation is negative or less than .10.
25

EVALUATION OF THE CLASS C DRIVER LICENSE WRITTEN KNOWLEDGE TESTS – MASTEN (1998)
Table B3
Cumulative Percentage of Applicants by Number of Items Missed for Each Form of the English DL 5 (Rev. 3/96) Test for First Attempt Renewal Applicants
Number missed
Form 1 (n = 520)
Form 2 (n = 600)
Form 3 (n = 515)
Form 4 (n = 575)
Form 5 (n = 580 )
0 2.9 4.8 4.3 4.0 4.5
1 10.6 19.0 14.2 14.4 9.8
2 23.5 34.2 32.2 26.6 15.9
3 43.5 56.0 52.4 44.0 29.7
4 61.2 75.0 71.7 61.0 44.8
5 76.7 88.3 83.3 76.2 59.5
6 88.7 93.8 89.9 85.4 73.3
7 93.5 97.3 96.1 92.2 83.3
8 96.3 98.2 97.7 96.0 90.5
9 98.3 99.0 98.3 97.6 95.0
10+ 100.0 100.0 100.0 100.0 100.0 Note. The shaded line represents the pass rate at the current passing standard, which allows up to three errors.
26

EVALUATION OF THE CLASS C DRIVER LICENSE WRITTEN KNOWLEDGE TESTS – MASTEN (1998)
Table B4
Summary of Problem Items on each Form of the English DL 5 (Rev. 3/96) Test for First Attempt Renewal Applicants
Problem indicator
Form 1 items
Form 2 items
Form 3 items
Form 4 items
Form 5 items
Item-total correlation too low or negativea
3, 5, 6, 11 12, 17 1, 8 15 13
Pass rate too highb 5, 7, 12 1, 6, 9, 12, 16, 18
4, 13 4, 9, 16, 17 none
Pass rate too lowc 2, 6, 18 7, 14, 17 1, 5, 9 6, 10, 13, 15
2, 3, 4, 7
Distractor selected too oftend
2, 6 7, 17 1, 5 10, 15 2, 3
Distractor selected too infrequentlye
3, 4, 5, 7, 8, 10, 11, 12, 13, 14, 15, 16, 17
1, 2, 3, 5, 6, 9, 11, 12, 13, 14, 16, 18
2, 4, 6, 7, 8, 11, 12, 13, 14, 16, 17
1, 2, 4, 5, 7, 8, 9, 11, 12, 14, 16, 17, 18
1, 5, 9, 11, 12, 13, 14, 15, 16
aThe item-total correlation was negative or less than .10. bMore than 95% of applicants answered the item correctly. cLess than 60% of applicants answered the item. dA distractor was chosen more, or almost, as often as the correct answer to the item. eA distractor was selected by 2% or fewer applicants.
27

EVALUATION OF THE CLASS C DRIVER LICENSE WRITTEN KNOWLEDGE TESTS – MASTEN (1998)
Appendix C
Item Statistics for the Spanish DL 5 (Rev. 7/95) for First Attempt Original Applicants
Table C1
Percentage of Applicants Selecting Each Answer Choice for Each Item on Each Form of the Spanish DL 5 (Rev. 7/95) Test for First Attempt Original Applicants
Item
number Answer choice
Form 1 (n = 122)
Form 2 (n = 112)
Form 3 (n = 129)
Form 4 (n = 131)
Form 5 (n = 109)
1 a b c d
11.7 5.0 70.8 12.5
6.3 20.7 45.9 27.0
75.8 15.6 6.3 2.3
4.6 79.2 15.4 0.8
72.5 0.9 17.4 9.2
2 a b c d
9.0 67.2 15.6 8.2
30.6 6.5 63.0 0.0
3.1 84.4 2.3 10.2
6.3 57.5 26.0 10.2
86.1 8.3 0.9 4.6
3 a b c d
0.8 2.5 5.7 91.0
12.5 9.8 75.9 1.8
19.4 72.6 6.5 1.6
9.9 5.3 73.3 11.5
10.2 65.7 13.9 10.2
4 a b c d
71.2 16.1 12.7 0.0
10.7 5.4 80.4 3.6
86.8 1.6 10.1 1.6
3.8 90.0 3.1 3.1
10.4 29.2 39.6 20.8
5 a b c d
4.2 0.8 90.8 4.2
22.3 73.4 1.8 1.8
22.6 65.3 3.2 8.9
71.5 6.2 11.5 10.8
11.2 81.3 1.9 5.6
6 a b c d
80.7 15.1 3.4 0.8
3.8 7.5 5.7 83.0
80.6 3.9 6.2 9.3
15.3 73.3 5.3 6.1
74.3 3.7 10.1 11.9
7 a b c d
6.6 75.2 15.7 2.5
45.9 14.4 6.3 33.3
3.9 12.4 75.2 8.5
76.2 0.8 5.4
17.7
29.9 15.9 7.5 46.7
8 a b c d
63.3 5.8 5.8 25.0
1.8 10.8 80.2 7.2
1.6 93.0 5.4 0.0
5.3 86.3 3.1 5.3
14.0 73.8 3.7 8.4
9 a b c d
17.5 7.5 56.7 18.3
90.2 3.6 0.0 6.3
26.2 7.1 11.1 55.6
3.1 3.8 3.1 90.0
11.1 3.7 9.3 75.9
28

EVALUATION OF THE CLASS C DRIVER LICENSE WRITTEN KNOWLEDGE TESTS – MASTEN (1998)
Table C1 (continued)
Item number
Answer choice
Form 1 (n = 122)
Form 2 (n = 112)
Form 3 (n = 129)
Form 4 (n = 131)
Form 5 (n = 109)
10 a b c d
46.3 2.5 15.7 35.5
12.7 7.3 75.5 4.5
6.3 11.0 3.1 79.5
25.2 47.3 17.6 9.9
7.4 23.1 64.8 4.6
11 a b c d
2.5 1.6 89.3 6.6
1.8 93.7 2.7 1.8
2.3 79.7 10.2 7.8
1.5 7.7 61.5 29.2
10.5 10.5 5.7 73.3
12 a b c d
2.5 91.7 5.0 0.8
8.0 1.8 87.5 2.7
23.8 57.1 9.5 9.5
10.8 10.8 1.5 76.9
70.8 19.8 7.5 1.9
13 a b c d
53.3 1.6 1.6 43.4
4.5 2.7 90.2 2.7
83.6 10.2 2.3 3.9
39.8 12.5 10.9 36.7
22.0 7.3 11.0 59.6
14 a b c d
0.8 91.8 1.6 5.7
51.8 22.3 0.0 25.9
5.4 52.7 40.3 1.6
20.0 65.4 6.2 8.5
0.9 90.7 4.6 3.7
15 a b c d
66.9 5.8 5.0 22.3
2.7 12.5 79.5 5.4
64.1 20.3 3.9 11.7
77.9 13.0 4.6 4.6
78.5 7.5 7.5 6.5
16 a b c d
77.9 1.6 6.6 13.9
0.0 0.9 2.7 96.4
72.9 10.9 4.7 11.6
0.8 3.1 0.8 95.4
12.0 76.9 1.9 9.3
17 a b c d
12.3 4.9 80.3 2.5
75.5 18.2 2.7 3.6
3.1 77.5 7.8
11.6
8.4 90.8 0.0 0.8
64.5 10.3 12.1 13.1
18 a b c d
15.7 24.0 6.6 53.7
1.8 2.7 75.0 20.5
10.1 3.9 75.2 10.9
6.1 88.5 2.3 3.1
13.9 9.3 68.5 8.3
19 a b c d
19.0 5.0 76.0 0.0
43.6 3.6 32.7 20.0
15.6 10.2 71.9 2.3
17.7 73.1 6.2 3.1
13.8 56.0 24.8 5.5
20 a b c d
13.3 72.5 6.7 7.5
12.5 70.5 7.1 9.8
15.5 9.3 74.4 0.8
63.8 26.9 7.7 1.5
57.5 19.8 6.6 16.0
29

EVALUATION OF THE CLASS C DRIVER LICENSE WRITTEN KNOWLEDGE TESTS – MASTEN (1998)
Table C1 (continued)
Item number
Answer choice
Form 1 (n = 122)
Form 2 (n = 112)
Form 3 (n = 129)
Form 4 (n = 131)
Form 5 (n = 109)
21 a b c d
0.8 3.3 95.9 0.0
75.5 5.5 8.2 10.9
56.6 21.7 2.3 19.4
13.7 2.3 82.4 1.5
7.4 2.8 70.4 19.4
22 a b c d
20.7 69.4 8.3 1.7
38.7 4.5 25.2 31.5
17.1 61.8 14.6 6.5
7.8 87.6 1.6 3.1
33.0 64.2 0.0 2.8
23 a b c d
3.3 88.4 6.6 1.7
5.5 5.5 10.1 78.9
6.2 86.0 0.8 7.0
7.0 83.7 7.8 1.6
51.4 9.3 3.7 35.5
24 a b c d
11.6 69.4 5.8 13.2
68.8 18.8 6.3 6.3
15.6 4.7 57.8 21.9
14.7 10.9 73.6 0.8
0.0 0.9 0.9 98.2
25 a b c d
10.7 64.8 16.4 8.2
4.5 15.3 15.3 64.9
2.3 18.8 15.6 63.3
11.7 3.1 14.8 70.3
91.4 5.7 0.0 2.9
26 a b c d
70.8 18.3 6.7 4.2
3.6 60.7 3.6 32.1
14.8 60.2 3.1 21.9
57.7 6.9 18.5 16.9
97.2 0.0 1.9 0.9
27 a b c d
9.9 19.0 66.9 4.1
20.5 48.2 29.5 1.8
18.8 7.0 71.1 3.1
34.6 29.2 0.0 36.2
9.2 78.9 10.1 1.8
28 a b c d
58.7 24.0 9.1 8.3
0.9 83.0 8.9 7.1
4.0 3.2 92.8 0.0
26.6 14.8 35.2 23.4
20.8 64.2 6.6 8.5
29 a b c d
6.6 4.1 78.5 10.7
6.3 81.3 8.0 4.5
79.5 6.3 1.6 12.6
69.0 0.8 10.1 20.2
5.6 37.4 4.7 52.3
30 a b c d
9.2 81.5 3.4 5.9
16.1 59.8 7.1 17.0
75.6 10.2 5.5 8.7
21.5 68.5 7.7 2.3
13.0 1.9 13.0 72.2
31 a b c d
90.2 7.4 1.6 0.8
18.8 2.7 77.7 0.9
4.7 11.6 79.8 3.9
10.0 11.5 3.8 74.6
1.9 11.3 12.3 74.5
30

EVALUATION OF THE CLASS C DRIVER LICENSE WRITTEN KNOWLEDGE TESTS – MASTEN (1998)
Table C1 (continued)
Item number
Answer choice
Form 1 (n = 122)
Form 2 (n = 112)
Form 3 (n = 129)
Form 4 (n = 131)
Form 5 (n = 109)
32 a b c d
71.9 6.6 9.1 12.4
90.1 0.0 8.1 1.8
16.4 3.1 78.9 1.6
0.8 96.9 0.8 1.5
56.5 37.0 6.5 0.0
33 a b c d
8.2 82.0 1.6 8.2
91.9 7.2 0.9 0.0
3.9 13.3 76.6 6.3
60.0 9.2 12.3 18.5
11.1 75.9 12.0 0.9
34 a b c d
9.0 77.9 1.6 11.5
8.0 77.7 12.5 1.8
10.1 67.4 16.3 6.2
10.8 3.1 10.8 75.4
1.9 78.7 19.4 0.0
35 a b c d
23.1 62.8 5.0 9.1
1.8 95.5 1.8 0.9
11.6 55.8 14.0 18.6
31.3 50.4 5.3 13.0
12.8 73.4 10.1 3.7
36 a b c d
25.6 3.3 66.9 4.1
4.5 92.0 1.8 1.8
0.8 90.7 2.3 6.2
16.8 61.1 21.4 0.8
35.8 13.8 48.6 1.8
Note. Underlining of a percentage indicates that the answer choice was the correct response according to the official answer key. Shading indicates that the item needs to be reviewed and possibly revised due to the item pass rate being too low or too high. A boldface percentage indicates that the distractor selection rate is too low or too high.
31
EVALUATION OF THE CLASS C DRIVER LICENSE WRITTEN KNOWLEDGE TESTS – MASTEN (1998)
Table C2
Item-Total Correlation for Each Item on Each Form of the Spanish DL 5 (Rev. 7/95) Test for First Attempt Original Applicants
Item
number Form 1
(n = 122) Form 2
(n = 112) Form 3
(n = 129) Form 4
(n = 131) Form 5
(n = 109) 1 .53 .36 .46 .31 .42 2 .40 .45 .37 .36 .30 3 .32 .26 .34 .40 .45 4 .26 .32 .38 .27 .29 5 .31 .21 .47 .34 .23 6 .32 .44 .42 .48 .42 7 .37 .35 .31 .34 .47 8 .55 .43 .41 .20 .38 9 .31 .28 .51 .30 .51 10 .51 .43 .26 .42 .56 11 .28 .18 .45 .32 .44 12 .26 .11 .55 .29 .37 13 .28 .18 .18 .21 .44 14 .31 .31 .39 .32 .25 15 .40 .31 .46 .28 .44 16 .45 .20 .49 .17 .26 17 .43 .28 .50 .30 .27 18 .58 .45 .48 .24 .44 19 .45 .33 .58 .33 .35 20 .30 .48 .48 .32 .25 21 .22 .33 .57 .42 .38 22 .28 .53 .40 .21 .26 23 .30 .17 .38 .45 .38 24 .42 .43 .52 .36 .22 25 .43 .50 .51 .32 .19 26 .38 .34 .50 .33 .21 27 .51 .46 .43 .26 .37 28 .34 .15 .28 .41 .30 29 .39 .30 .43 .37 .47 30 .44 .33 .55 .37 .39 31 .33 .50 .55 .41 .25 32 .45 .40 .40 .14 .46 33 .17 .24 .39 .33 .47 34 .40 .40 .31 .22 .50 35 .33 .29 .45 .46 .38 36 .27 .42 .47 .37 .21
Note. No items were found to have negative or zero item-total correlations.
32

EVALUATION OF THE CLASS C DRIVER LICENSE WRITTEN KNOWLEDGE TESTS – MASTEN (1998)
Table C3
Cumulative Percentage of Applicants by Number of Items Missed for Each Form of the Spanish DL 5 (Rev. 7/95) Test for First Attempt Original Applicants
Number missed
Form 1 (n = 122)
Form 2 (n = 112)
Form 3 (n = 129)
Form 4 (n = 131)
Form 5 (n = 109)
0 4.9 2.7 6.2 3.8 1.8
1 9.0 7.1 16.3 4.6 7.3
2 15.6 11.6 24.0 10.7 12.8
3 22.1 16.1 30.2 15.3 17.4
4 28.7 25.0 33.3 18.3 19.3
5 32.8 27.7 38.0 24.4 24.8
6 36.9 31.3 41.1 26.0 26.6
7 43.4 35.7 44.2 30.5 30.3
8 45.9 42.9 47.3 35.9 35.8
9 50.0 50.9 49.6 45.0 44.0
10 52.5 58.9 54.3 50.4 47.7
11 59.0 60.7 58.9 54.2 50.5
12 65.6 69.6 62.0 60.3 56.0
13 71.3 74.1 63.6 64.1 62.4
14 78.7 78.6 68.2 71.0 67.9
15 80.3 82.1 72.9 80.2 74.3
16+ 100.0 100.0 100.0 100.0 100.0 Note. The shaded line represents the pass rate at the current passing standard, which allows up to five errors.
33

EVALUATION OF THE CLASS C DRIVER LICENSE WRITTEN KNOWLEDGE TESTS – MASTEN (1998)
Table C4
Summary of Problem Items on Each Form of the Spanish DL 5 (Rev. 7/95) Test for First Attempt Original Applicants
Problem indicator
Form 1 items
Form 2 items
Form 3 items
Form 4 items
Form 5 items
Item-total correlation too low or negativea
none none none none none
Pass rate too highb 21 16, 35 none 16, 32 24, 26
Pass rate too lowc 9, 10, 13, 18, 28,
1, 7, 14, 19, 22, 27, 30,
9, 12, 14, 21, 24, 35
2, 10, 13, 26, 28, 35
4, 7, 13, 19, 20, 23, 29, 32, 36
Distractor selected too oftend
10, 13 1, 7, 22 none 13, 28 4, 29
Distractor selected too infrequentlye
3, 4, 5, 6, 11, 12, 13, 14, 16, 19, 21, 22, 23, 31, 33, 34
2, 3, 5, 8, 9, 11, 12, 14, 16, 18, 27, 28, 31, 32, 33, 34, 35, 36
3, 4, 8, 14, 20, 23, 28, 29, 32, 36
1, 7, 11, 12, 16, 17, 20, 22, 23, 24, 27, 29, 32, 36
1, 2, 5, 12, 14, 16, 22, 24, 25, 26, 27, 30, 31, 32, 33, 34, 36
aThe item-total correlation was negative or less than .10. bMore than 95% of applicants answered the item correctly. cLess than 60% of applicants answered the item correctly. dA distractor was chosen more, or almost, as often as the correct answer to the item. eA distractor was selected by 2% or fewer applicants.
34
EVALUATION OF THE CLASS C DRIVER LICENSE WRITTEN KNOWLEDGE TESTS – MASTEN (1998)
Appendix D
Item Statistics for the English DL 5T (Rev. 3/96) for First Attempt Provisional Applicants
Table D1
Percentage of Applicants Selecting Each Answer Choice for Each Item on Each Form of the English DL 5T (Rev. 3/96) Test for First Attempt Provisional Applicants
Item
number Answer choice
Form 1 (n = 327)
Form 2 (n = 367)
Form 3 (n = 314)
1 a b c d
0.6 1.5 96.3 1.5
0.8 4.9 92.6 1.6
84.3 6.1 1.0 8.7
2 a b c d
11.0 4.9 4.3 79.8
84.7 1.6 0.5 13.1
70.4 23.2 1.3 5.1
3 a b c d
0.3 78.2 20.9 0.6
0.5 97.8 0.0 1.6
4.1 91.7 1.3 2.9
4 a b c d
2.8 83.7 2.5 11.0
9.6 6.8 74.6 9.0
79.3 0.6 11.5 8.6
5 a b c d
0.3 89.6 9.5 0.6
1.9 76.8 2.7 18.5
4.8 4.5 89.2 1.6
6 a b c d
96.3 2.1 0.3 1.2
5.7 90.7 3.0 0.5
1.3 72.9 12.1 13.7
7 a b c d
85.3 1.8 7.3 5.5
0.5 83.0 10.1 6.3
1.0 1.9 92.3 4.8
8 a b c d
12.5 82.9 3.1 1.5
83.8 3.3 0.5 12.3
15.0 80.9 3.2 1.0
35

EVALUATION OF THE CLASS C DRIVER LICENSE WRITTEN KNOWLEDGE TESTS – MASTEN (1998)
Table D1 (continued)
Item number
Answer choice
Form 1 (n = 327)
Form 2 (n = 367)
Form 3 (n = 314)
9 a b c d
7.0 88.7 0.9 3.4
0.8 98.6 0.0 0.5
18.2 3.2 3.8 74.8
10 a b c d
4.6 4.3 77.7 13.5
7.1 6.0 84.2 2.7
0.3 86.9 9.2 3.5
11 a b c d
10.4 1.5 86.5 1.5
2.5 94.3 0.3 3.0
82.8 1.0 4.8
11.5 12 a
b c d
88.4 2.8 2.4 6.4
13.4 77.4 7.1 2.2
18.2 79.3 0.6 1.9
13 a b c d
73.7 11.6 12.2 2.4
4.6 0.3 0.5 94.6
1.9 0.0 96.5 1.6
14 a b c d
4.0 1.8 87.4 6.8
2.5 49.3 26.2 22.1
6.4 7.3 85.9 0.3
15 a b c d
0.6 70.6 25.2 3.7
12.3 84.1 1.9 1.6
3.5 86.9 2.2 7.3
16 a b c d
9.5 88.7 0.9 0.9
13.9 79.5 3.0 3.6
92.4 2.9 4.8 0.0
17 a b c d
1.5 86.9 9.8 1.8
95.1 3.5 0.0 1.4
0.0 5.4 94.6 0.0
18 a b c d
0.6 86.8 11.0 1.5
18.5 9.0 71.1 1.4
2.2 95.5 1.9 0.3
36

EVALUATION OF THE CLASS C DRIVER LICENSE WRITTEN KNOWLEDGE TESTS – MASTEN (1998)
Table D1 (continued)
Item number
Answer choice
Form 1 (n = 327)
Form 2 (n = 367)
Form 3 (n = 314)
19 a b c d
87.1 1.5 3.4 8.0
0.0 6.3 86.9 6.8
3.5 93.9 1.3 1.3
20 a b c d
30.6 4.9 63.9 0.6
69.9 2.5 6.0 21.6
13.1 82.2 4.5 0.3
21 a b c d
2.2 84.9 10.5 2.5
8.4 74.4 16.1 1.1
85.4 3.5 1.0 10.2
22 a b c d
88.3 2.1 0.6 8.9
23.3 64.7 11.0 1.1
0.0 4.1 0.3 95.5
23 a b c d
0.0 0.9 77.1 22.0
40.7 18.9 7.4 33.1
86.9 7.0 1.0 5.1
24 a b c d
91.7 2.5 5.2 0.6
87.2 1.1 8.5 3.3
15.3 84.4 0.3 0.0
25 a b c d
73.6 1.5 0.0 24.8
94.0 3.0 1.6 1.4
8.6 89.2 0.6 1.6
26 a b c d
0.6 1.2 95.1 3.1
82.0 11.2 6.8 0.0
81.5 3.5 5.4 9.6
27 a b c d
0.3 89.2 8.6 1.8
18.0 76.0 3.3 2.7
2.2 18.2 77.0 2.6
28 a b c d
2.1 4.6 88.1 5.2
1.1 6.8 90.7 1.4
3.8 2.2 88.9 5.1
37

EVALUATION OF THE CLASS C DRIVER LICENSE WRITTEN KNOWLEDGE TESTS – MASTEN (1998)
Table D1 (continued)
Item number
Answer choice
Form 1 (n = 327)
Form 2 (n = 367)
Form 3 (n = 314)
29 a b c d
96.3 1.8 0.9 0.9
14.7 14.2 67.8 3.3
3.8 8.9 1.0 86.3
30 a b c d
0.0 8.0 83.3 8.6
4.4 67.8 18.8 9.0
5.4 91.4 1.3 1.9
31 a b c d
10.7 4.3 83.8 1.2
1.1 5.5 85.8 7.7
9.2 1.9 0.3 88.5
32 a b c d
97.2 0.0 1.5 1.2
2.7 0.3 3.8 93.2
93.3 1.6 3.8 1.3
33 a b c d
83.4 6.7 4.3 5.5
1.1 82.8 15.8 0.3
92.0 2.6 1.9 3.5
34 a b c d
0.0 8.0 91.1 0.9
85.3 14.4 0.3 0.0
7.3 41.4 13.4 37.9
35 a b c d
83.5 4.0 6.7 5.8
19.9 4.9 3.5 71.7
68.2 29.0 0.3 2.5
36 a b c d
20.8 78.9 0.0 0.3
1.6 86.4 9.0 3.0
1.3 0.3 1.6 96.8
37 a b c d
0.3 6.7 92.7 0.3
84.2 1.1 3.3 11.4
5.1 1.9 92.0 1.0
38 a b c d
95.7 3.7 0.3 0.3
0.8 2.7 48.6 47.8
63.6 13.1 0.0 23.3
38

EVALUATION OF THE CLASS C DRIVER LICENSE WRITTEN KNOWLEDGE TESTS – MASTEN (1998)
Table D1 (continued)
Item number
Answer choice
Form 1 (n = 327)
Form 2 (n = 367)
Form 3 (n = 314)
39 a b c d
15.6 80.7 0.6 3.1
79.0 0.0 0.5 20.4
6.7 1.6 89.5 2.2
40 a b c d
63.3 3.1 1.5 32.1
83.0 1.4 5.2 10.4
91.7 0.6 3.5 4.1
41 a b c d
89.0 7.6 3.1 0.3
83.6 7.9 0.3 8.2
4.2 14.1 61.7 20.1
42 a b c d
8.6 5.2 81.3 4.9
7.4 11.2 80.1 1.4
64.2 19.8 13.1 2.9
43 a b c d
2.5 65.3 17.5 14.7
14.5 72.6 9.0 3.8
91.1 0.3 8.6 0.0
44 a b c d
86.8 1.2 5.8 6.1
2.7 0.3 95.6 1.4
3.8 78.7 15.6 1.9
45 a b c d
2.4 7.6 87.8 2.1
82.3 11.7 0.8 5.2
2.9 1.6 88.9 6.7
46 a b c d
0.3 97.2 0.9 1.5
10.9 67.8 16.4 4.9
96.5 1.6 1.3 0.6
Note. Underlining of a percentage indicates that the answer choice was the correct response according to the official answer key. Shading indicates that the item needs to be reviewed and possibly revised due to the item pass rate being too low or too high. A boldface percentage indicates that the distractor selection rate is too low or too high.
39

EVALUATION OF THE CLASS C DRIVER LICENSE WRITTEN KNOWLEDGE TESTS – MASTEN (1998)
Table D2
Item-Total Correlation for Each Item on Each Form of the English DL 5T (Rev. 3/96) Test for First Attempt Provisional Applicants
Item number Form 1 (n = 327) Form 2 (n = 367) Form 3 (n = 314) 1 .30 .22 .45 2 .40 .44 .35 3 .32 .07 .19 4 .41 .53 .32 5 .27 .38 .39 6 .32 .36 .35 7 .34 .42 .32 8 .31 .38 .32 9 .28 .09 .33 10 .34 .38 .33 11 .23 .28 .38 12 .21 .25 .18 13 .23 .31 .19 14 .29 .58 .40 15 .28 .37 .37 16 .14 .35 .20 17 .06 -.03 .13 18 .17 .45 .32 19 .29 .34 .34 20 .40 .43 .49 21 .25 .27 .37 22 .38 .47 .09 23 .25 .54 .20 24 .11 .35 .35 25 .35 .31 .31 26 .31 .48 .37 27 .19 .45 .40 28 .27 .41 .28 29 .16 .44 .33 30 .19 .37 .30 31 -.07 .26 .15 32 .25 .18 .08 33 .24 .37 .32 34 .26 .24 .49 35 .30 .37 .50 36 .26 .35 .26 37 .14 .37 .28 38 .20 .48 .43 39 .18 .39 .19 40 .34 .44 .23 41 .34 .32 .44 42 .31 .42 .55 43 .31 .47 .26 44 .30 .19 .33 45 .13 .35 .31 46 .24 .33 .17
Note. Shading indicates that an item needs to be reviewed and revised or replaced because the item-total correlation is negative or less than .10.
40
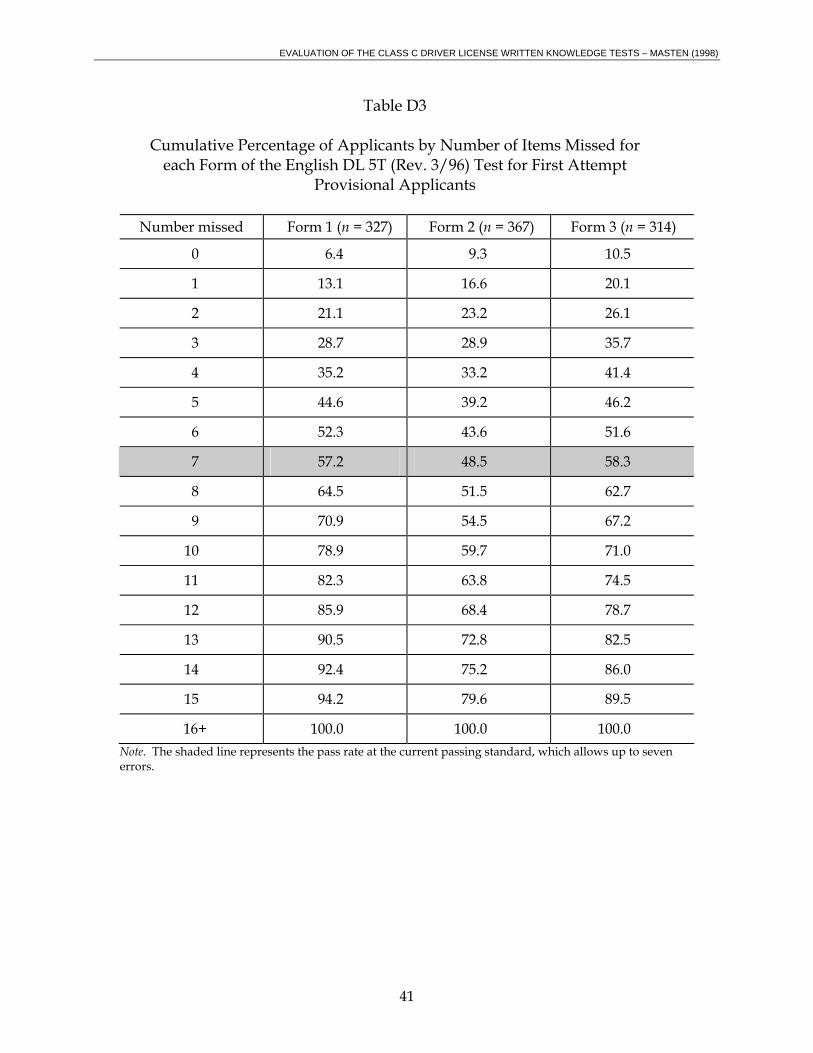
EVALUATION OF THE CLASS C DRIVER LICENSE WRITTEN KNOWLEDGE TESTS – MASTEN (1998)
Table D3
Cumulative Percentage of Applicants by Number of Items Missed for each Form of the English DL 5T (Rev. 3/96) Test for First Attempt
Provisional Applicants
Number missed Form 1 (n = 327) Form 2 (n = 367) Form 3 (n = 314)
0 6.4 9.3 10.5
1 13.1 16.6 20.1
2 21.1 23.2 26.1
3 28.7 28.9 35.7
4 35.2 33.2 41.4
5 44.6 39.2 46.2
6 52.3 43.6 51.6
7 57.2 48.5 58.3
8 64.5 51.5 62.7
9 70.9 54.5 67.2
10 78.9 59.7 71.0
11 82.3 63.8 74.5
12 85.9 68.4 78.7
13 90.5 72.8 82.5
14 92.4 75.2 86.0
15 94.2 79.6 89.5
16+ 100.0 100.0 100.0 Note. The shaded line represents the pass rate at the current passing standard, which allows up to seven errors.
41
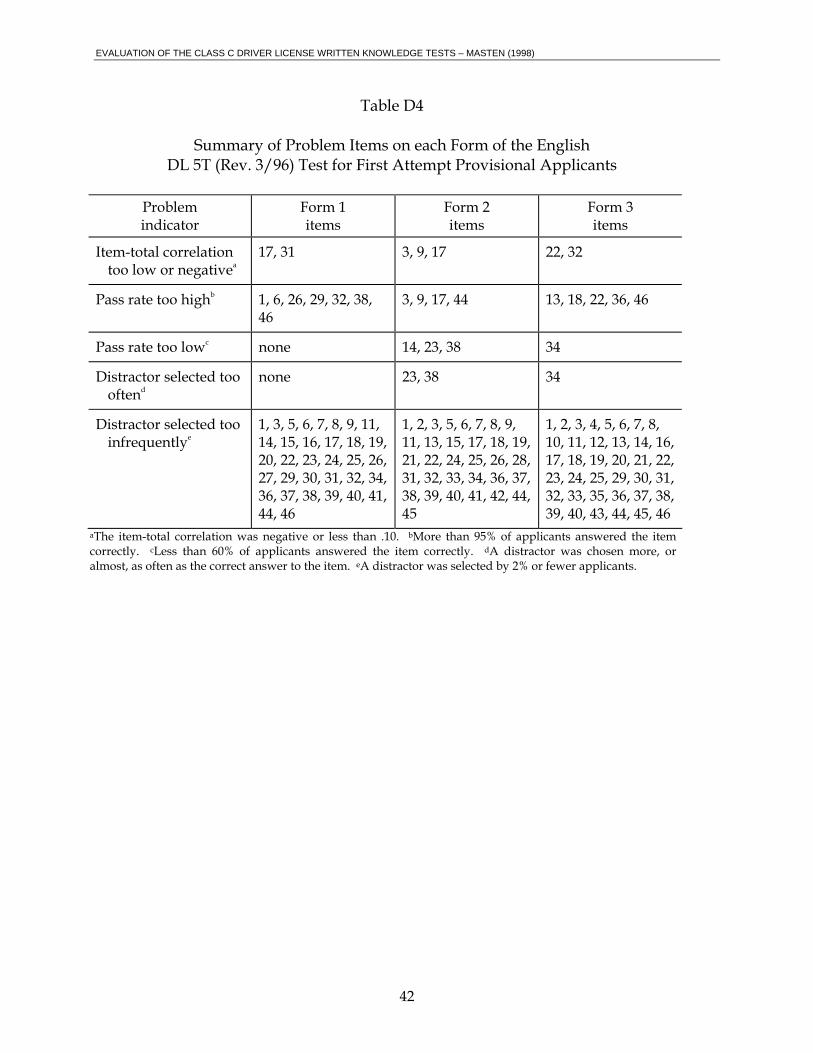
EVALUATION OF THE CLASS C DRIVER LICENSE WRITTEN KNOWLEDGE TESTS – MASTEN (1998)
Table D4
Summary of Problem Items on each Form of the English DL 5T (Rev. 3/96) Test for First Attempt Provisional Applicants
Problem indicator
Form 1 items
Form 2 items
Form 3 items
Item-total correlation too low or negativea
17, 31 3, 9, 17 22, 32
Pass rate too highb 1, 6, 26, 29, 32, 38, 46
3, 9, 17, 44 13, 18, 22, 36, 46
Pass rate too lowc none 14, 23, 38 34
Distractor selected too oftend
none 23, 38 34
Distractor selected too infrequentlye
1, 3, 5, 6, 7, 8, 9, 11, 14, 15, 16, 17, 18, 19, 20, 22, 23, 24, 25, 26, 27, 29, 30, 31, 32, 34, 36, 37, 38, 39, 40, 41, 44, 46
1, 2, 3, 5, 6, 7, 8, 9, 11, 13, 15, 17, 18, 19, 21, 22, 24, 25, 26, 28, 31, 32, 33, 34, 36, 37, 38, 39, 40, 41, 42, 44, 45
1, 2, 3, 4, 5, 6, 7, 8, 10, 11, 12, 13, 14, 16, 17, 18, 19, 20, 21, 22, 23, 24, 25, 29, 30, 31, 32, 33, 35, 36, 37, 38, 39, 40, 43, 44, 45, 46
aThe item-total correlation was negative or less than .10. bMore than 95% of applicants answered the item correctly. cLess than 60% of applicants answered the item correctly. dA distractor was chosen more, or almost, as often as the correct answer to the item. eA distractor was selected by 2% or fewer applicants.
42
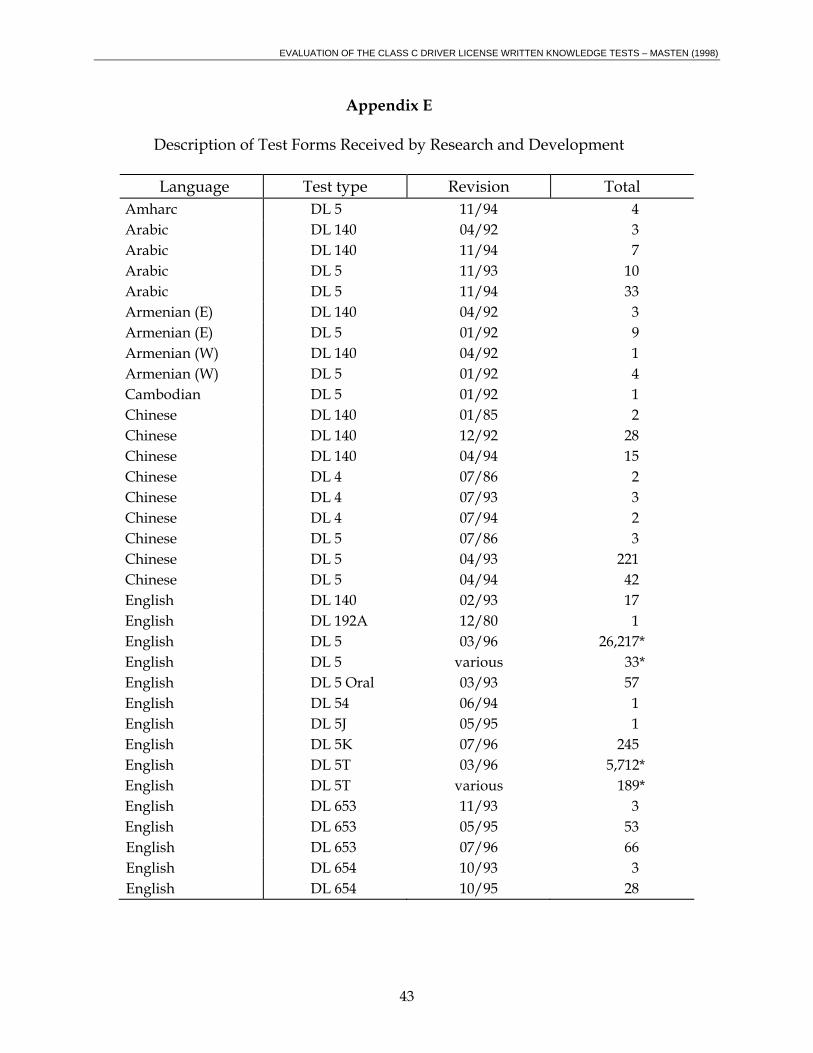
EVALUATION OF THE CLASS C DRIVER LICENSE WRITTEN KNOWLEDGE TESTS – MASTEN (1998)
Appendix E
Description of Test Forms Received by Research and Development
Language Test type Revision Total Amharc DL 5 11/94 4 Arabic DL 140 04/92 3 Arabic DL 140 11/94 7 Arabic DL 5 11/93 10 Arabic DL 5 11/94 33 Armenian (E) DL 140 04/92 3 Armenian (E) DL 5 01/92 9 Armenian (W) DL 140 04/92 1 Armenian (W) DL 5 01/92 4 Cambodian DL 5 01/92 1 Chinese DL 140 01/85 2 Chinese DL 140 12/92 28 Chinese DL 140 04/94 15 Chinese DL 4 07/86 2 Chinese DL 4 07/93 3 Chinese DL 4 07/94 2 Chinese DL 5 07/86 3 Chinese DL 5 04/93 221 Chinese DL 5 04/94 42 English DL 140 02/93 17 English DL 192A 12/80 1 English DL 5 03/96 26,217* English DL 5 various 33* English DL 5 Oral 03/93 57 English DL 54 06/94 1 English DL 5J 05/95 1 English DL 5K 07/96 245 English DL 5T 03/96 5,712* English DL 5T various 189* English DL 653 11/93 3 English DL 653 05/95 53 English DL 653 07/96 66 English DL 654 10/93 3 English DL 654 10/95 28
43

EVALUATION OF THE CLASS C DRIVER LICENSE WRITTEN KNOWLEDGE TESTS – MASTEN (1998)
Appendix E (continued)
Language Test type Revision Total English DL 654 07/96 34 English DL 655 10/93 6 English DL 655 05/95 66 English DL 657 01/94 6 English DL 657 06/96 2 Farsi DL 140 04/92 8 Farsi DL 5 01/92 11 Farsi DL 5 02/93 20 French DL 140 03/93 7 French DL 5 03/93 27 German DL 140 02/93 6 German DL 5 02/93 18 Greek DL 5 10/94 1 Hebrew DL 140 05/93 6 Hebrew DL 5 07/93 14 Hindi DL 5 10/94 4 Hmong DL 5 01/92 1 Indonesian DL 5 02/93 3 Italian DL 140 07/93 1 Italian DL 5 07/93 7 Japanese DL 140 04/92 5 Japanese DL 140 07/94 9 Japanese DL 140 11/94 12 Japanese DL 5 11/93 11 Japanese DL 5 09/94 23 Japanese DL 5 11/94 68 Korean DL 140 08/85 2 Korean DL 140 10/92 11 Korean DL 140 07/93 21 Korean DL 4 07/93 5 Korean DL 5 04/93 116 Korean DL 5 04/94 47 Lao DL 5 01/92 4 Polish DL 5 03/93 2 Portuguese DL 140 07/93 3 Portuguese DL 5 07/93 20 Punjabi DL 140 04/92 1 Punjabi DL 140 02/94 6
44

EVALUATION OF THE CLASS C DRIVER LICENSE WRITTEN KNOWLEDGE TESTS – MASTEN (1998)
Appendix E (continued)
Language Test type Revision Total Punjabi DL 5 01/92 2 Punjabi DL 5 11/93 10 Punjabi DL 5 11/94 4 Romanian DL 140 04/92 1 Romanian DL 5 01/92 4 Russian DL 140 04/92 4 Russian DL 140 07/94 10 Russian DL 5 11/93 23 Russian DL 5 07/94 50 Samoan DL 5 01/92 3 Serbo-Croatian DL 140 04/92 4 Serbo-Croatian DL 5 11/94 10 Spanish DL 140 03/85 4 Spanish DL 140 11/91 510 Spanish DL 5 07/95 5,958* Spanish DL 5 Oral 07/93 1 Spanish DL 5K 02/92 2 Spanish DL 5K 09/95 6 Spanish DL 5T various 63* Spanish DL 653 07/95 10 Spanish DL 653 08/96 6 Spanish DL 654 09/91 1 Spanish DL 654 10/95 6 Spanish DL 654 07/96 5 Tagalog DL 140 04/92 4 Tagalog DL 5 01/92 12 Thai DL 140 04/92 5 Thai DL 5 01/92 14 Tongan DL 5 07/93 2 Vietnamese DL 140 12/92 20 Vietnamese DL 140 04/94 2 Vietnamese DL 4 07/93 5 Vietnamese DL 5 05/93 109 Vietnamese DL 5 04/94 10 Unknown 59 Total 40,572
*Estimated from the sample of every third English and Spanish DL 5 and English DL 5T test form.
45

EVALUATION OF THE CLASS C DRIVER LICENSE WRITTEN KNOWLEDGE TESTS – MASTEN (1998)
Appendix F
Frequency and Fail Rates for English DL 5 (Rev 3/96) Original and Renewal Applicants as a Function of Field Office
Originals Renewals Field office n Fail rate (%) n Fail rate (%) Arleta 9 44 18 78 Auburn 2 100 7 43 Bakersfield 13 77 32 56 Bakersfield SW 4 100 7 86 Banning 5 40 15 67 Barstow 13 85 10 40 Bell Gardens 24 67 7 71 Bellflower 29 55 61 52 Bishop 2 100 5 60 Brawley 13 62 7 86 Capitola 12 58 16 63 Carmichael 14 50 50 52 Chico 8 50 22 41 Chula Vista 24 63 17 59 Clovis 9 44 18 44 Colusa 0 - 9 67 Compton 22 77 12 58 Concord 10 60 23 57 Corte Madera 8 63 13 54 Costa Mesa 27 63 50 54 Culver City 37 54 59 49 Daly City 1 100 9 78 Davis 31 74 18 44 El Cajon 22 82 26 38 El Cerito 42 62 42 55 Fairfield 12 83 12 50 Folsom 1 00 0 --- Fontana 2 100 4 50 Fremont 24 58 18 44 Fresno 10 50 12 67 Fresno-North 9 56 31 58 Fullerton 23 70 34 56 Gilroy 6 67 13 23
46
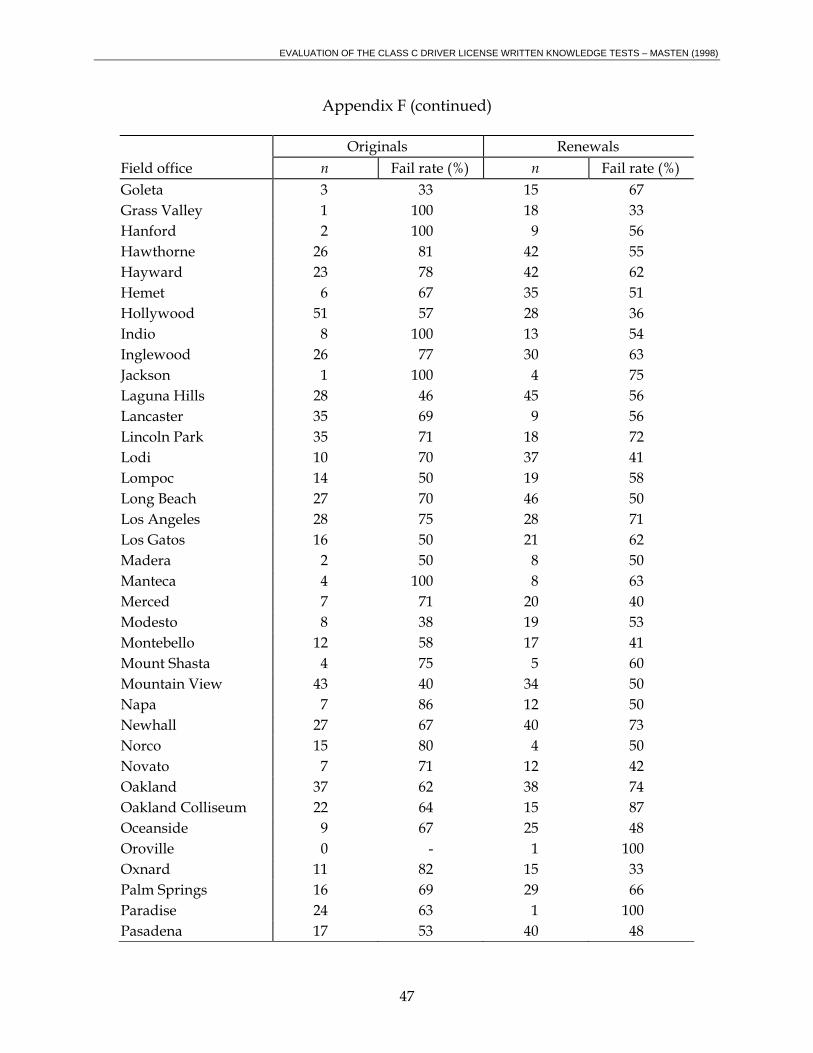
EVALUATION OF THE CLASS C DRIVER LICENSE WRITTEN KNOWLEDGE TESTS – MASTEN (1998)
Appendix F (continued)
Originals Renewals Field office n Fail rate (%) n Fail rate (%) Goleta 3 33 15 67 Grass Valley 1 100 18 33 Hanford 2 100 9 56 Hawthorne 26 81 42 55 Hayward 23 78 42 62 Hemet 6 67 35 51 Hollywood 51 57 28 36 Indio 8 100 13 54 Inglewood 26 77 30 63 Jackson 1 100 4 75 Laguna Hills 28 46 45 56 Lancaster 35 69 9 56 Lincoln Park 35 71 18 72 Lodi 10 70 37 41 Lompoc 14 50 19 58 Long Beach 27 70 46 50 Los Angeles 28 75 28 71 Los Gatos 16 50 21 62 Madera 2 50 8 50 Manteca 4 100 8 63 Merced 7 71 20 40 Modesto 8 38 19 53 Montebello 12 58 17 41 Mount Shasta 4 75 5 60 Mountain View 43 40 34 50 Napa 7 86 12 50 Newhall 27 67 40 73 Norco 15 80 4 50 Novato 7 71 12 42 Oakland 37 62 38 74 Oakland Colliseum 22 64 15 87 Oceanside 9 67 25 48 Oroville 0 - 1 100 Oxnard 11 82 15 33 Palm Springs 16 69 29 66 Paradise 24 63 1 100 Pasadena 17 53 40 48
47
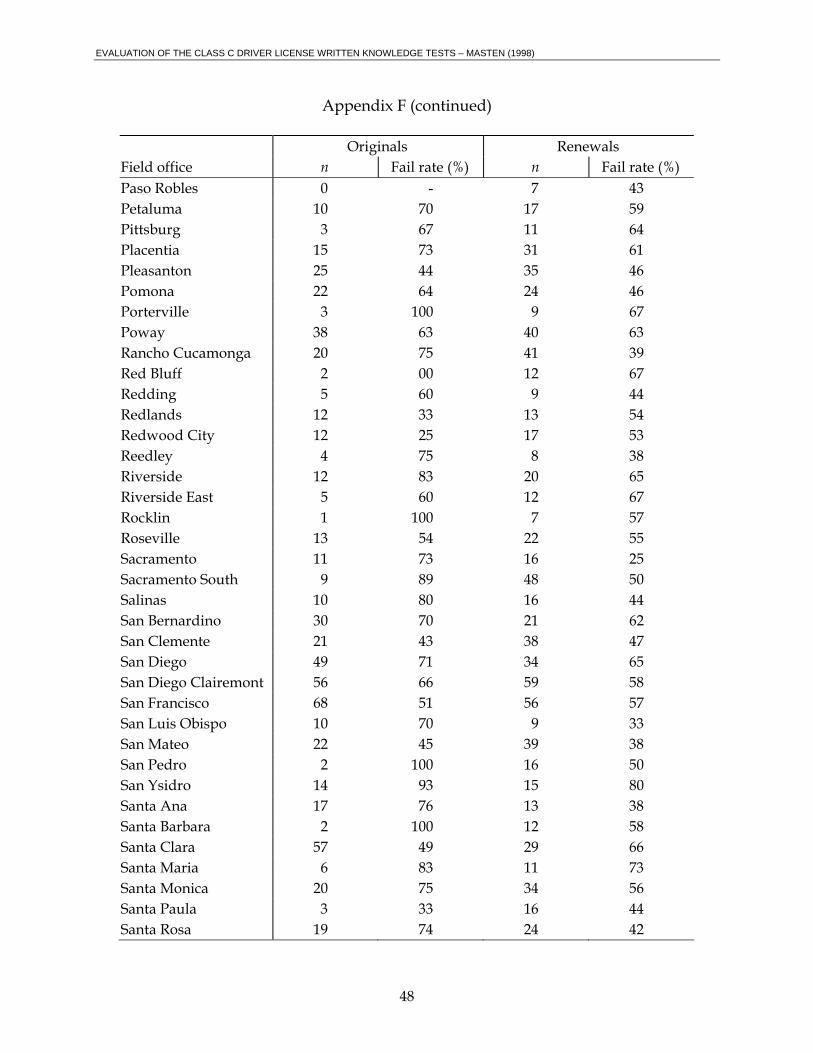
EVALUATION OF THE CLASS C DRIVER LICENSE WRITTEN KNOWLEDGE TESTS – MASTEN (1998)
Appendix F (continued)
Originals Renewals Field office n Fail rate (%) n Fail rate (%) Paso Robles 0 - 7 43 Petaluma 10 70 17 59 Pittsburg 3 67 11 64 Placentia 15 73 31 61 Pleasanton 25 44 35 46 Pomona 22 64 24 46 Porterville 3 100 9 67 Poway 38 63 40 63 Rancho Cucamonga 20 75 41 39 Red Bluff 2 00 12 67 Redding 5 60 9 44 Redlands 12 33 13 54 Redwood City 12 25 17 53 Reedley 4 75 8 38 Riverside 12 83 20 65 Riverside East 5 60 12 67 Rocklin 1 100 7 57 Roseville 13 54 22 55 Sacramento 11 73 16 25 Sacramento South 9 89 48 50 Salinas 10 80 16 44 San Bernardino 30 70 21 62 San Clemente 21 43 38 47 San Diego 49 71 34 65 San Diego Clairemont 56 66 59 58 San Francisco 68 51 56 57 San Luis Obispo 10 70 9 33 San Mateo 22 45 39 38 San Pedro 2 100 16 50 San Ysidro 14 93 15 80 Santa Ana 17 76 13 38 Santa Barbara 2 100 12 58 Santa Clara 57 49 29 66 Santa Maria 6 83 11 73 Santa Monica 20 75 34 56 Santa Paula 3 33 16 44 Santa Rosa 19 74 24 42
48
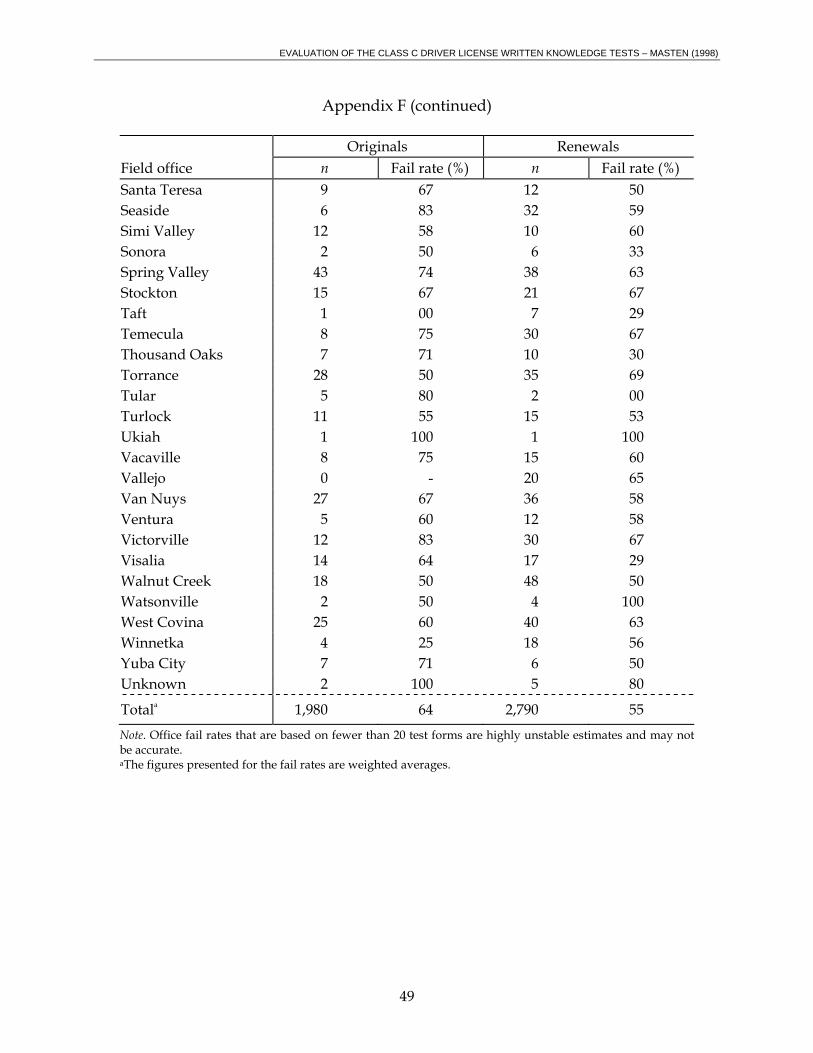
EVALUATION OF THE CLASS C DRIVER LICENSE WRITTEN KNOWLEDGE TESTS – MASTEN (1998)
Appendix F (continued)
Originals Renewals Field office n Fail rate (%) n Fail rate (%) Santa Teresa 9 67 12 50 Seaside 6 83 32 59 Simi Valley 12 58 10 60 Sonora 2 50 6 33 Spring Valley 43 74 38 63 Stockton 15 67 21 67 Taft 1 00 7 29 Temecula 8 75 30 67 Thousand Oaks 7 71 10 30 Torrance 28 50 35 69 Tular 5 80 2 00 Turlock 11 55 15 53 Ukiah 1 100 1 100 Vacaville 8 75 15 60 Vallejo 0 - 20 65 Van Nuys 27 67 36 58 Ventura 5 60 12 58 Victorville 12 83 30 67 Visalia 14 64 17 29 Walnut Creek 18 50 48 50 Watsonville 2 50 4 100 West Covina 25 60 40 63 Winnetka 4 25 18 56 Yuba City 7 71 6 50 Unknown 2 100 5 80
Totala 1,980 64 2,790 55 Note. Office fail rates that are based on fewer than 20 test forms are highly unstable estimates and may not be accurate. aThe figures presented for the fail rates are weighted averages.
49