evaluation of the atp test for nitrification monitoring at the … 1... · determined that we see...
TRANSCRIPT
Evaluation of the ATP Test for Nitrification Monitoring at the Portland Water Bureau
Kimberly GuptaMay 9, 2014

Presentation Outline
Background
PWB System
Nitrification Monitoring at the PWB
ATP Evaluation
Case Study - Bertha
Next Steps

Portland System - Overview
Serves approximately 938,000 people Retail and wholesale service area is approximately 225
square miles 20 wholesalers which comprise approximately 42% of our
demand

Portland’s Distribution System ~ 180 pressure zones ~70 storage tanks 39 pump stations > 2200 miles of distribution
pipeline More than 200 miles of which are 16”
in diameter or larger
3 large uncovered finished water reservoirs that are routinely in service Res 1 = 12 MG Res 3 = 16 MG Res 5 = 49 MG
Over 220 water quality sample stations

Nitrification Review
Nitrification is the bacteriological oxidation of ammonia to nitrate via nitrite 1st Step: ammonia to nitrite
+ NH3 + O2 → NO2- + 3H+ +2e-
2nd Step: nitrite to nitrate (complete nitrification)
+ NO2- + H2O → NO3
-+ 2H+ +2e-

Historic Nitrification Monitoring at PWB
1999-2000 Study Determined that we see nitrification and the season can extend
into the late fall
2011 Tank Monitoring Study Monitored chlorine, free ammonia, temperature, nitrite
and nitrate at a subset of tanks
2012 Study TCR sites
If pH or chlorine residual fell below chronic limits in two consecutive samples or acute limits in one sample, the site qualified for nitrification monitoring

2013 Nitrification Program Goal –More Holistic Approach

2013 Study - Sampling locationsPowell Butte = hub of the systemSelect TCR sites (23)Storage tanks (20)Open reservoirs Dead-ends/problematic areas in the
system (2)Other areas not represented by other
sampling events (4)Wholesaler connections (4)

Parameters Monitored Lab (results available 24 hours –
7 days) Nitrite
Nitrate
Free ammonia
R2A-HPC
Field (results available same day) Chlorine residual
pH
Temp
ATP

ATP Basics ATP = Adenosine
Triphosphate Discovered in 1929 Universal energy
carrier in all living organisms
It is present in every cell; energy from the breakdown of ATP drives many important reactions in the cell.
Believed that there is a good correlation between cellular ATP and the number of viable bacteria present

ATP Analysis ATP analysis is not new
Has been used for decades in other fields such as medical research, food hygiene, wastewater etc.
Had not been used as widely in drinking water because it was a difficult test and we had little information regarding the average ATP concentrations in natural bacteria
ATP analysis works by measuring bioluminescence Bioluminescence is light
produced within a living organism; often enzyme catalyzed
ATP + luciferase = light
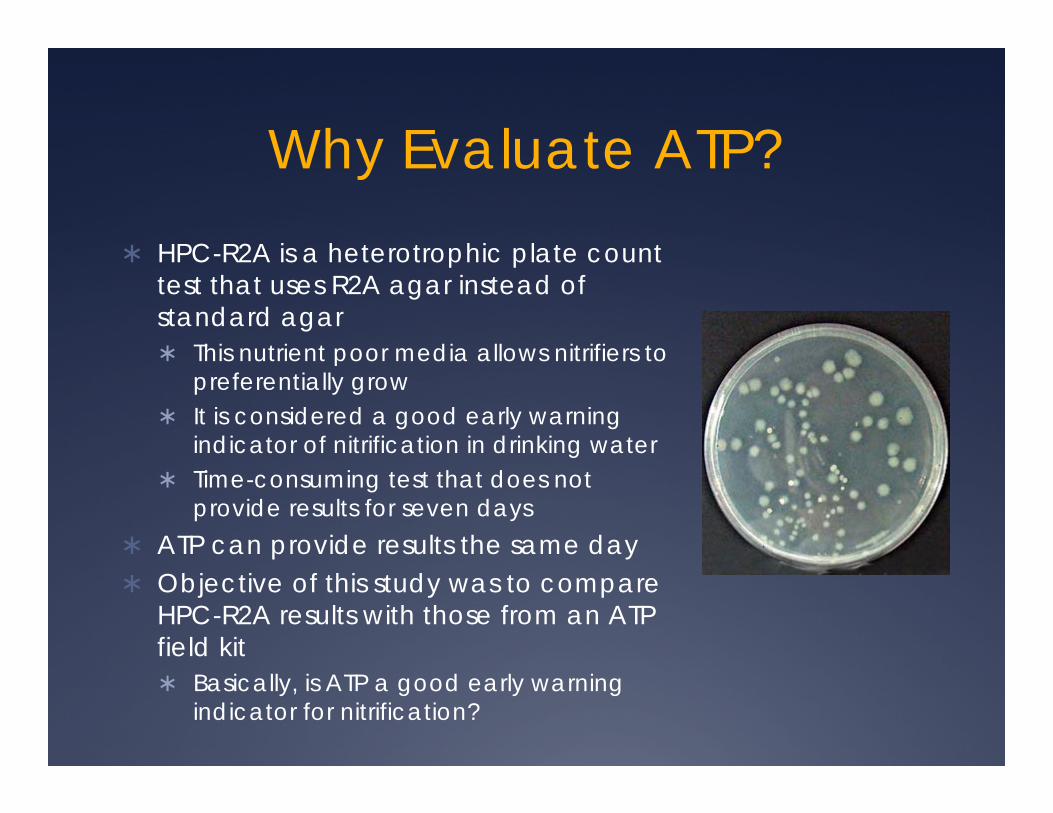
Why Evaluate ATP? HPC-R2A is a heterotrophic plate count
test that uses R2A agar instead of standard agar This nutrient poor media allows nitrifiers to
preferentially grow It is considered a good early warning
indicator of nitrification in drinking water Time-consuming test that does not
provide results for seven days ATP can provide results the same day Objective of this study was to compare
HPC-R2A results with those from an ATP field kit Basically, is ATP a good early warning
indicator for nitrification?
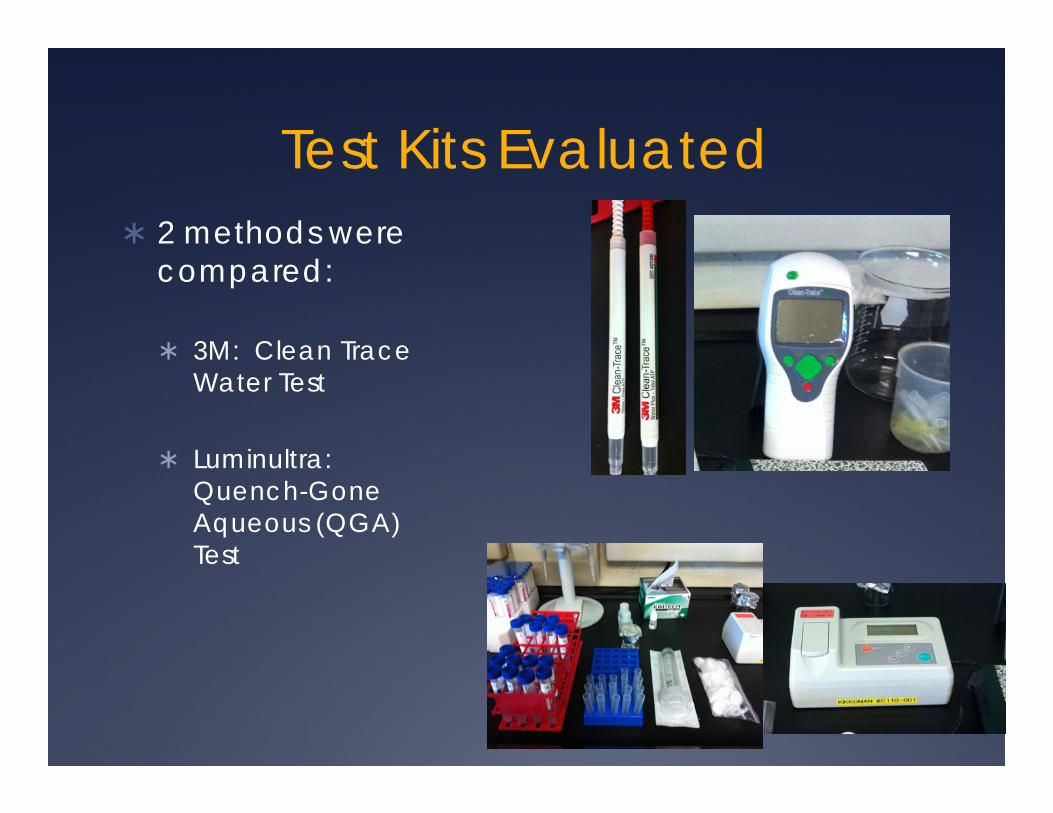
Test Kits Evaluated 2 methods were
compared:
3M: Clean Trace Water Test
Luminultra: Quench-Gone Aqueous (QGA) Test
Reagents and Equipment Luminultra
Reagents ATP source (water sample) ATP standard (Ultracheck) Lysing agent (UltraLyse) Dilution reagent (UltraLute) Luciferase enzyme (Luminase)
Equipment Sterile bottle for the sample Syringe and filter Test tubes Pipettes (1mL and 100 uL) and
pipette tips Luminometer
3M Reagents
ATP source (water sample) Swabs contain all reagents
Total ATP swab Free ATP swab
Equipment Sterile bottle for the sample Luminometer
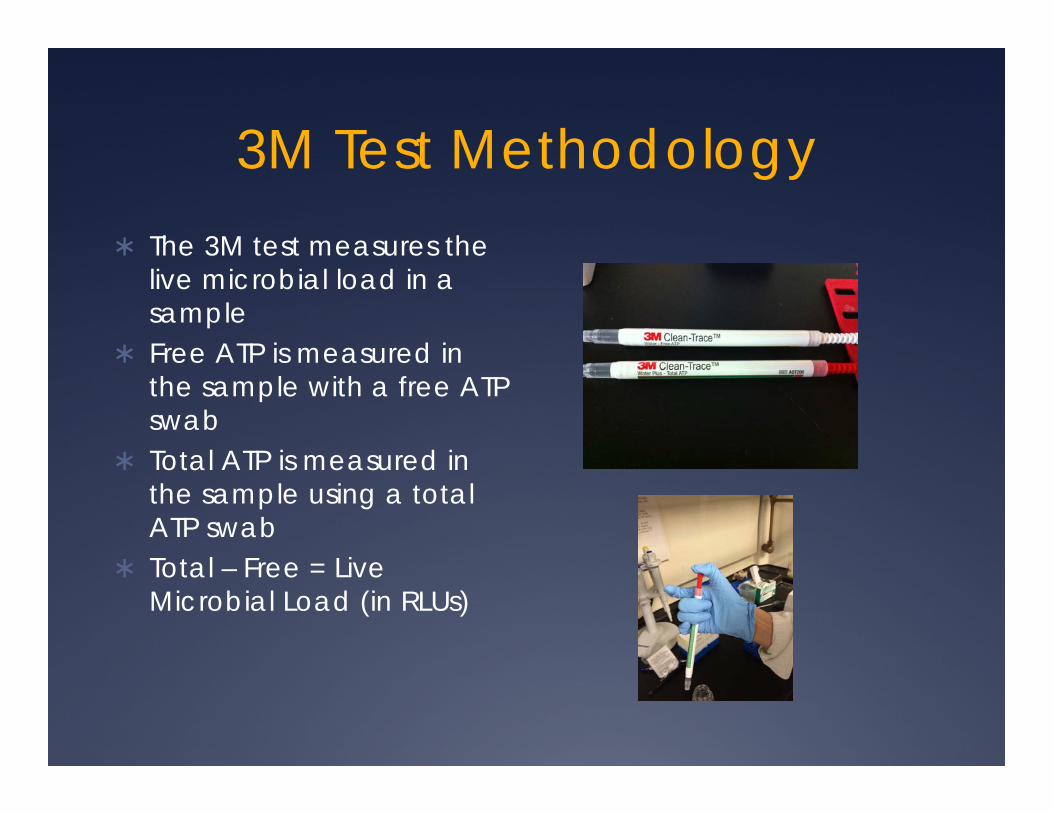
3M Test Methodology The 3M test measures the
live microbial load in a sample
Free ATP is measured in the sample with a free ATP swab
Total ATP is measured in the sample using a total ATP swab
Total – Free = Live Microbial Load (in RLUs)

3M Procedure Step 1: Test free ATP
Immerse the swab into the sample up to the top of the sampling rings– DO NOT swirl
Tap the handle of the sample stick to dislodge any bubbles
Remove any excess drops that may have formed on the bottom of the swab
Immediately insert the swab back into the pen and push the plunger completely down to insert the swab into the reagent
Shake vigorously from side to side Insert into luminometer
Step 2: Test total ATP Repeat above steps

3M Results Did not relate to
nitrification parameters in our water
Compared ATP results to R2A, nitrite, nitrate, chlorine R2 values ranged from
0.0006 - 0.0063 No relationship between
these parameters
3M vs R2A
R2 = 0.0063
0
4000
8000
12000
16000
-400 -200 0 200 400 600 800 1000
3M (RLU)
R2A
(cfu
/ml)
3M vs nitrite
R2 = 0.0035
0
0.05
0.1
0.15
0.2
0.25
-400 -200 0 200 400 600 800 1000
3M (RLU)
Nitr
ite (m
g/L)
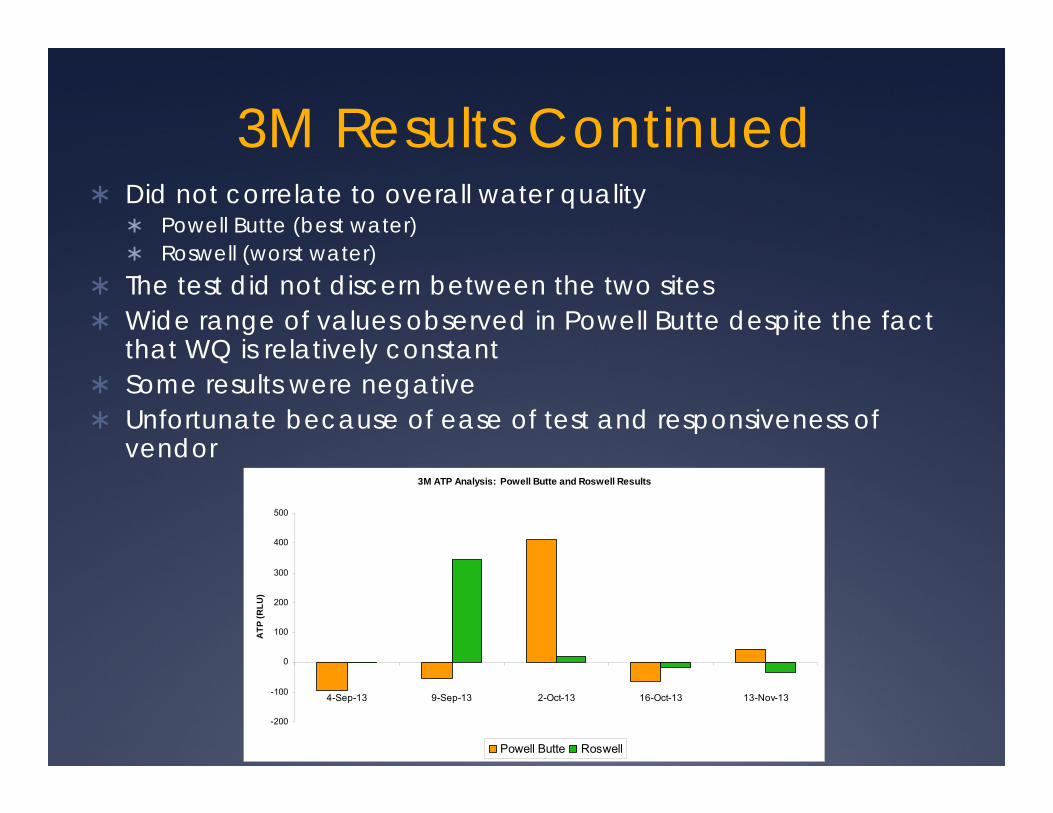
3M Results Continued Did not correlate to overall water quality
Powell Butte (best water) Roswell (worst water)
The test did not discern between the two sites Wide range of values observed in Powell Butte despite the fact
that WQ is relatively constant Some results were negative Unfortunate because of ease of test and responsiveness of
vendor3M ATP Analysis: Powell Butte and Roswell Results
-200
-100
0
100
200
300
400
500
4-Sep-13 9-Sep-13 2-Oct-13 16-Oct-13 13-Nov-13
ATP
(RLU
)
Powell Butte Roswell

Luminultra Quench Gone Aqueous Test Methodology
The QGA test measures ATP from living cells only The raw results from the analysis are in units of Relative
Light Units (RLUs), which are then converted to cellular ATP (cATP) according to the following equation:
cATP represents ATP from living microorganisms and is a direct indication of total living biomass quantity.

Luminultra QGA Test Procedure
Step 1: Standard calibration – perform one calibration per day Add 2 drops of standard to 100 uL luminase and read in
luminometer
*Adapted from Luminultra http://www.luminultra.com/files/QGA_Quick_Reference_Guide_EN.pdf

Luminultra QGA Test Procedure
Step 2: Sample analysis Filter sample – use a syringe with a
0.7 um filter (sample size of 100 mL is best for drinking water)
Run 1 mL of lysing solution through the filter to extract ATP
Collect this filtrate in a dilution tube This is stable at room temp for 4 hours
Pipette 100 uL of dilution tube solution into a test tube
To this, add 100 uL of the enzyme, luminase
Swirl five times and read in a luminometer
*Adapted from Luminultra http://www.luminultra.com/files/QGA_Quick_Reference_Guide_EN.pdf
Luminultra – Results Interpretation
The Luminultra test provides guidelines for interpretation of results. For potable water these include:
< 0.5 cATP (pg/mL) indicates good water quality
0.5 to 10 cATP (pg/mL) indicates a potential problem may exist
> 10 cATP (pg/mL) indicates the need for corrective action

Luminultra Results The Luminultra test
tracked water quality in the system
R2=0.55 for ATP vs R2A indicated a good relationship between the two tests
WQSS 182: SW Alta Dena and Santa Monica
0
1500
3000
4500
6000
7500
16-Aug 30-Aug 13-Sep 27-Sep 11-Oct 25-Oct 8-Nov 22-Nov
R2A
0
5
10
15
20
25
30
cATP
(pg
ATP
/ml)
R2A ATP
HPC-R2A vs ATP
R2 = 0.5491n=86
0
4000
8000
12000
16000
0 5 10 15 20 25 30 35
cATP (pg/mL)
HPC
-R2A
(cfu
/ml)

Luminultra Results Continued At a few sites, there appeared to
be some interference in the ATP test ATP results were low But all other water quality
parameters indicated high levels of microbial action (very high levels of R2A, low levels of chlorine, and varying levels of nitrite and nitrate)
There were other sites with elevated nitrification rates where this phenomenon was not observed
Removed these outliers from the analysis R2 of 0.83 for ATP and R2A
Unclear at this point what caused this interference
WQSS 108: Roswell
0
3000
6000
9000
16-Aug 30-Aug 13-Sep 27-Sep 11-Oct 25-Oct 8-Nov 22-Nov
R2A
0
2
4
6
8
10
12
cATP
(pg
ATP
/ml)
R2A ATP
ATP vs HPC-R2A - Outliers Excluded
R2 = 0.8344n=68
0
4000
8000
12000
16000
0 5 10 15 20 25 30 35
cATP (pg/mL)
R2A
(cfu
/ml)

Duplicates and Control Both tests gave very low results for the control
(Nanopure water) To evaluate whether results from the tests were
repeatable, we also collected 5 duplicates for each test – performed paired t-tests to evaluate the results for each assay 3M: P = 0.78 for total, P=0.96 for free Luminultra: P=0.97
Conclusion = there was no significant difference between the duplicates for each analysis

Considerations for the QGA Assay
Luminase enzyme is very temperature sensitive Test is light sensitive As with most tests, proper technique is essential
Pippetting Dropper bottle (contains the standard) can
provide different sized drops which can throw off the standardization
Inhibitors – real or just us?

BONUS! Case Study Using ATP During the Total Coliform Incident in SW Portland - September 2013
On September 18th, a routine TCR sample came back positive for TC, negative for EC
Three resamples were collected at the site within 24 hours
Repeat samples came back positive
Ended up in a Tier 2 Violation

Coliform Results in the Bertha Area
Clearly we had a problem
Positive coliform samples in red

Increased Monitoring
Increased water quality monitoring to determine the extent of the issue Coliform surveillance
sampling throughout entire system
Collected an additional 60+ coliform samples in our system in addition to our routine TCR samples
These results led us to conclude that the contamination was isolated to the Bertha area

0.00
5.00
10.00
15.00
20.00
25.00
cATP
(pg/
ml)
24-Sep-13 30-Sep-13 3-Oct-13 22-Oct-13 30-Oct-13 5-Nov-13
cATP data - WQSS 200 and PZ Source
Bertha Tank WQSS 200
ATP Analysis Essential to figure out
what was going on and where the problem was starting in the Bertha PZ
Monitored chlorine and temperature but decided to throw ATP in the mix Coliform testing could
have thrown us back into the resampling loop
Did not want to wait 7 days for the R2A results
cATP data - Bertha Regulators
0
2
4
6
8
10
Berth
a Ta
nk
Berth
a 10
48(S
eym
our)
Berth
a 10
48(M
itche
ll)
Berth
a 96
2
Berth
a 93
7(1
8th)
Berth
a 93
7(R
icha
rdso
n)
Berth
a 87
4(M
arth
a N
)
Berth
a 87
4(M
arth
a S)
Berth
a 87
4(2
5th)
Berth
a 84
5(C
helte
nham
)
Berth
a 84
5(M
enef
ee)
Berth
a 80
5(R
icha
rdso
n)
Berth
a 80
5(2
6th)
pg A
TP/m
l 24-Sep 30-Sep 3-Oct 18-Oct

Mitigations Tried our routine
mitigations (took storage out of service, adjusted pumping ops, lowered reservoir levels, spot flushed)
When these did not solve the problem, took more aggressive steps
UDF Raised the chloramine
target level from 1.8 mg/L to 3 mg/L

ATP data WQSS 200 and Bertha Tank
0
5
10
15
20
25
24-Sep-13 30-Sep-13 3-Oct-13 16-Oct-13 18-Oct-13 21-Oct-13 22-Oct-13 30-Oct-13
cATP
(pg
ATP/
ml)
Bertha Tank A1 WQSS 200 A3 A4 A5 A6 A7
Bertha Monitoring Continued
Once monitoring results indicated that the corrective actions had been effective, five bacteriological samples were collected in Bertha 750 PZ (including WQSS 200) on Oct 21
All samples were negative for TC/EC
We felt that in this situation, in conjunction with other parameters monitored, ATP gave us extra confidence

Conclusions and Next Steps for ATP at PWB
ATP (by the QGA) was a good indicator of nitrification Useful tool, especially when results are needed immediately
However, not a silver bullet and still needed to be interpreted along with other parameters to provide a full understanding of the water quality puzzle Not currently planning to replace any of our standard
monitoring parameters First need to investigate further the interferences that were
observed Analysis error? Inhibitors present in those samples? High levels of metals, etc?
Evaluate ATP for other uses Tank cleaning Source water evaluation
