evaluation of the arthakranti proposal - nipfp.org.in · tripathi, mr anil gupta, mr sunil saran...
TRANSCRIPT

Evaluation of the Arthakranti Proposal
Tax Research Team
June 2017
National Institute of Public Finance and Policy

ii
Table of contents
1. Chapter 1: Introduction 1-18
2. Chapter 2: Elimination of High Denomination Notes 19-44
3. Chapter 3:Banking Transaction Tax: An Assessment 45-100
4. Chapter 4:Summary and Conclusions 101-107
Bibliography 108-112
iii

iv

v
Acknowledgements
This study has been undertaken for the Government of Haryana and Government of
Madhya Pradesh. During the course of the study, we had the opportunity to interact
extensively with the Arthakranti team which contributed considerably to our
understanding of the proposed reforms and enabled us to articulate the results of our
analysis in a more effective manner. Dr Ajit Ranade was kind enough to review the first
draft of our comments and provide some useful inputs. The revised version of the
comments were discussed in a seminar organised at the NIPFP on May 25, 2017. The
participants at the seminar included faculty members from NIPFP along with invited
experts from other organisations. The participants from other organisations included
Dr Ajit Ranade, Mr Hardayal Singh, Mr Sushil Solanki, Mr Sanjay Kumar, Mr Anish
Tripathi, Mr Anil Gupta, Mr Sunil Saran and Mr Raj Kumar. From the NIPFP, the seminar
was attended by a number of senior faculty members including Mr Sumit Bose, Dr
Rathin Roy, Dr Pinaki Chakraborty, Dr Ila Patnaik, Dr Sudipto Mundle, Dr Pratap Jena,
Dr H. K. Amarnath, Dr Mita Chaudhury, Dr Sukanya Bose, Dr B. B. Dash. The discussions
at the seminar were very useful in finalising the report. The team gratefully
acknowledges all these inputs received during different stages of the preparation of
the report.
The team gratefully acknowledges all these inputs received during different stages of
the preparation of the report. The team consisted of R. Kavita Rao, D. P. Sengupta,
Sacchidananda Mukherjee, Sudhanshu Kumar, Sri Hari Nayudu and Suranjali Tandon.
Tax Team NIPFP
1
Chapter 1: Introduction
The financial crisis of 2008 followed by the slowdown in the world economy has brought an
increase in focus on the taxes paid by different segments of the society. Particularly, it highlighted
the fact that a number of large corporations as well as some high net worth individuals were found
to pay relatively little by way of taxes. In India, there has been a lot of discussion on the amounts
of “black money” various agents of the economy might have salted away either within the country
or outside. The importance of this issue is reflected by the fact that the UPA government found it
necessary to commission three studies on measuring the size of unaccounted incomes and for
documenting the factors that contributed to the generation of unaccounted incomes. The issue has
also been brought up repeatedly in election campaigns. The Indian tax system, is complex1 and
generates differential tax liabilities across sectors and agents. At the same time there are efforts
within the government to find ways to simplify the tax regime and to encourage voluntary
compliance. The proposed introduction of GST, efforts to reduce litigation in direct taxes and
streamline administration are examples of measures working in this direction. Conceptually, for a
simplified tax regime it is argued that there should be few or no exemptions and the system should
be easy to comply with. However, there is another point of view emerging that incremental changes
within the existing paradigm of tax policy may not be enough to correct the underlying problems
of a globalised economy which is financially integrated to the world financial system. This is the
context in which Feige (2000) and Cintra (2009) proposed an alternative system. The need for a
similar reform is presented in the Arthakranti report2 which combines a proposal for tax reform
along with a proposal of expanding the scope of non-cash transactions in the economy.3
1 For example Rao & Rao (2006) argue in favour of simplification of the Indian tax system as is also recommended
by the report for TARC. Similarly the World Bank shows that India‘s position has worsened on account of taxes. 2 As updated on 19th January 2014. 3 Arthakranti team has informed that a booklet on ArthaKranti proposal, then named as “Transaction Tax Proposal”,
was published on 15th October 2002 in “Think Line” publication by Guna Gaurav Nyas, Nasik, Maharashtra and that
this proposal was put forth by Mr. Anil Bokil. It was then studied and propagated by ArthaKranti Group.

2
The main elements of the Arthakranti proposal as spelt out in the Arthakranti report are reproduced
below:
“• Withdrawal of Existing Tax System Completely (except Customs/Import Duties - Customs
duties perform an important role of ensuring a genuine level playing field in a globalized world.
Hence they will continue, may be, with the many improvements already suggested by the
FRBM Act Implementation Task Force and other committees.)
• Every Transaction routed through a bank will attract a certain deduction in appropriate
percentage as Bank Transaction Tax (say 2%)
• This deduction is to be effected on receiving/credit account only
• This deducted amount will be credited to different Government Levels like Central, State and
Local (as say 0.7%, 0.6 % and 0.35% respectively)
• Transacting Bank will also have its share in this deducted amount (say 0.35%) as the Bank has
a key role to perform
• Withdrawal of High Denomination Currency (say above Rs. 50)
• Cash Transactions will not attract any tax
• There will be no legal protection for cash transactions having a value of more than Rs. 2000.”4
The elements of the proposal can be segregated into two components:
1. Demonetisation – elimination of high value currency
2. Replacement of most existing taxes with a banking transaction tax (except for customs).
The present study is an attempt to assess the likely impact of these proposed policy measures on
the economy as well as on tax collections of the government. Towards this end, while the proposal
presents these two measures as a combined policy proposal, it is important to understand the
impact of these individually. The document is organised as follows: the following chapter will
explore the effects of demonetisation on the economy. This chapter would explore the possible
effects on consumer behaviour as well as on macro variables. The chapter highlights the possibility
of a costly transition to an economy less reliant on cash for a range of basic transactions. In chapter
3, the proposal to replace all existing taxes apart from customs duties by a banking transaction tax
44 Page 106. The Arthakranti proposal could have evolved with discussions over time. The assessment made in this
document is of the proposal as made in the January 2014 version.
3
is examined in some detail. The analysis provides an assessment of the proposal on principles of
taxation as well as a summary of the literature on the international experience in implementing
such a tax. In the process, this chapter highlights the likely lacunae in such a tax regime and some
dimensions of the likely impact on the economy. For instance, it explores the differences in tax
liability across sectors and the likely change in the relative contributions to the exchequer and its
implications for policy making. Since these two policies are presented as an integrated policy
package, in the final chapter, an attempt is made to explore the feasibility of structuring this as an
integrated policy and the likely steps that might be needed to facilitate the implementation.
Before taking up these aspects of the proposal for analysis, it is would be useful to understand the
basis on which the proposal advocates the reduction of currency in circulation. In the Arthakranti
report a case is made for removal of high denomination of currency from circulation. The report
provides the rationale for such removal through a cross-country comparison of currency in
circulation to GDP, the ratio of per capita income to highest denomination notes and the ratio of
currency in circulation to narrow money5. The report finds that India ranked fourth and first on
currency to GDP ratio and currency to narrow money ratios respectively. The report uses the ratio
of GDP per capita to highest denomination currency as a measure of ease with which high value
transactions can be carried out with the use of cash. India ranks among the lowest, as per the report,
therefore indicating greater ease in undertaking large transactions through cash.
Before embarking on a detailed analysis of the proposal, it is therefore important to ask whether
India is an outlier in the quantum of currency in circulation or even in the value of the highest
currency denomination in circulation when compared to other countries. Clearly there are two
questions being asked – one, is there too much cash in India and second, is the value of the highest
denomination note too high. The evaluation of India‘s position as an outlier can be based on
alternative metrics. Some alternative ways of posing this question and answering it are presented
below to get some additional understanding on these two questions.
First, for answering whether India has too much currency in circulation, we attempt to identify the
factors that could be influencing the demand for currency in an economy. Some of these variables
could be importance of exports and imports in the economy, the rate of inflation and the interest
5 Narrow money is the currency in circulation plus demand deposits (M1).

4
rates and the “extent of specialization” in the economy. Since the goods and services once produced
are exported out of the economy, countries with a higher dependence on exports would require less
currency. On the other hand, in countries with higher share of imports, the demand for currency
would be higher since the imported goods require currency for transactions but would not add to
the value added in the economy. In situations of high inflation and high interest rate, it is argued
that people would prefer not to hold currency and hence the need for currency would be lower.
Finally, in countries where there is more specialization within the production and distribution chain
of a commodity or service, the demand for currency would be higher. Given this argument, it is
therefore not appropriate to compare the ratio of currency to GDP across countries.
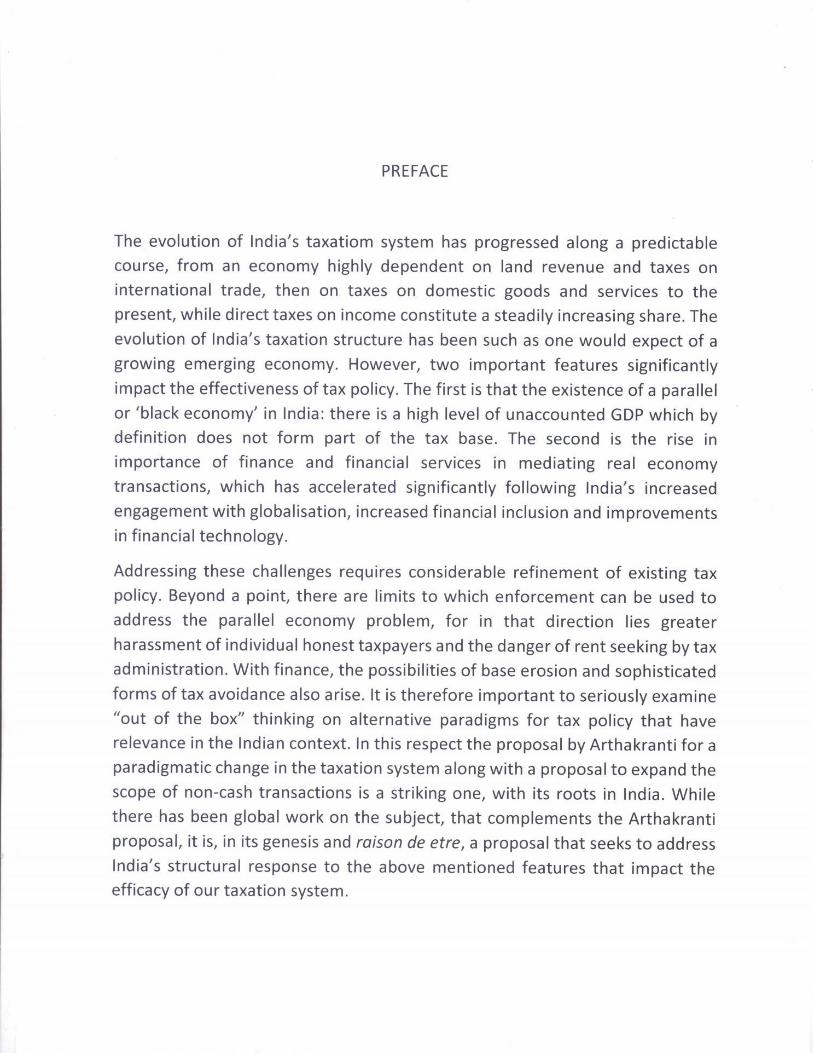
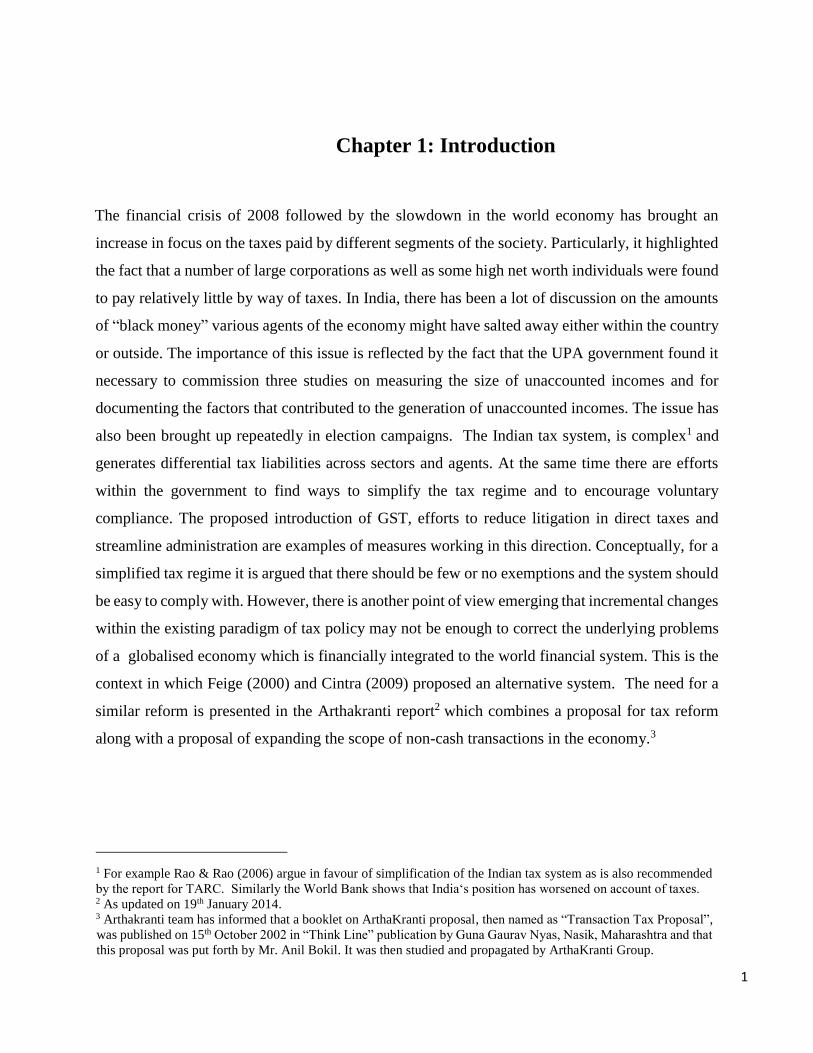
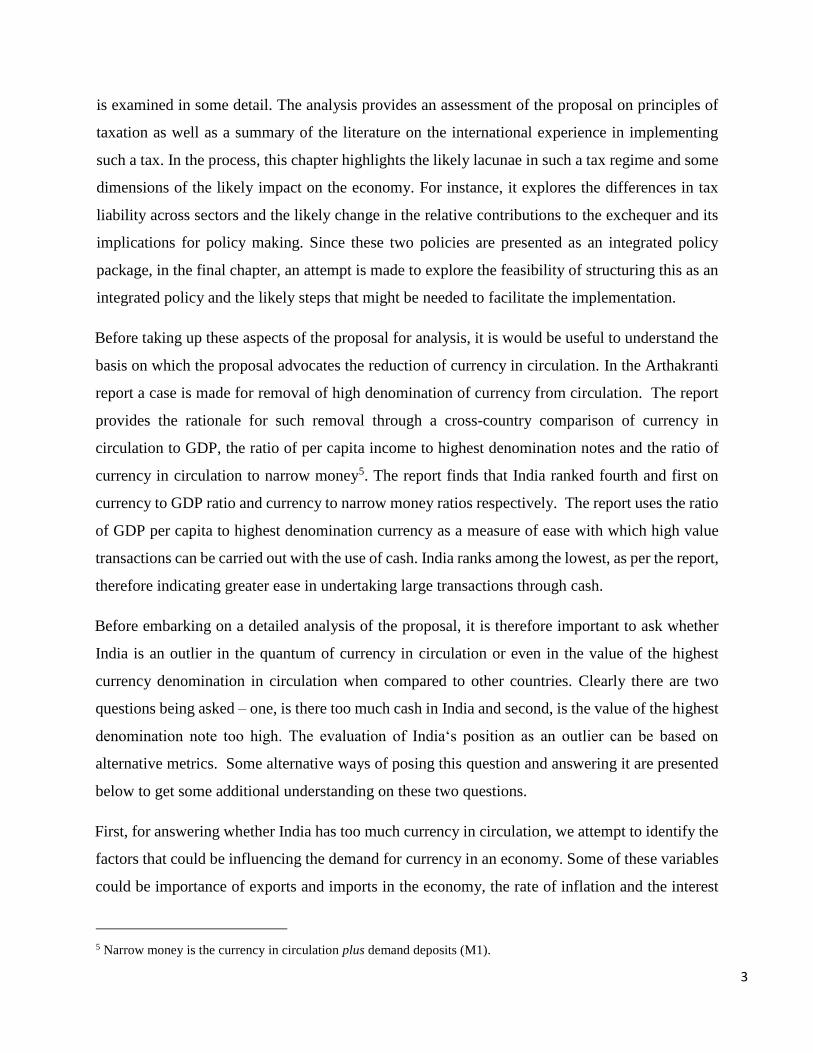
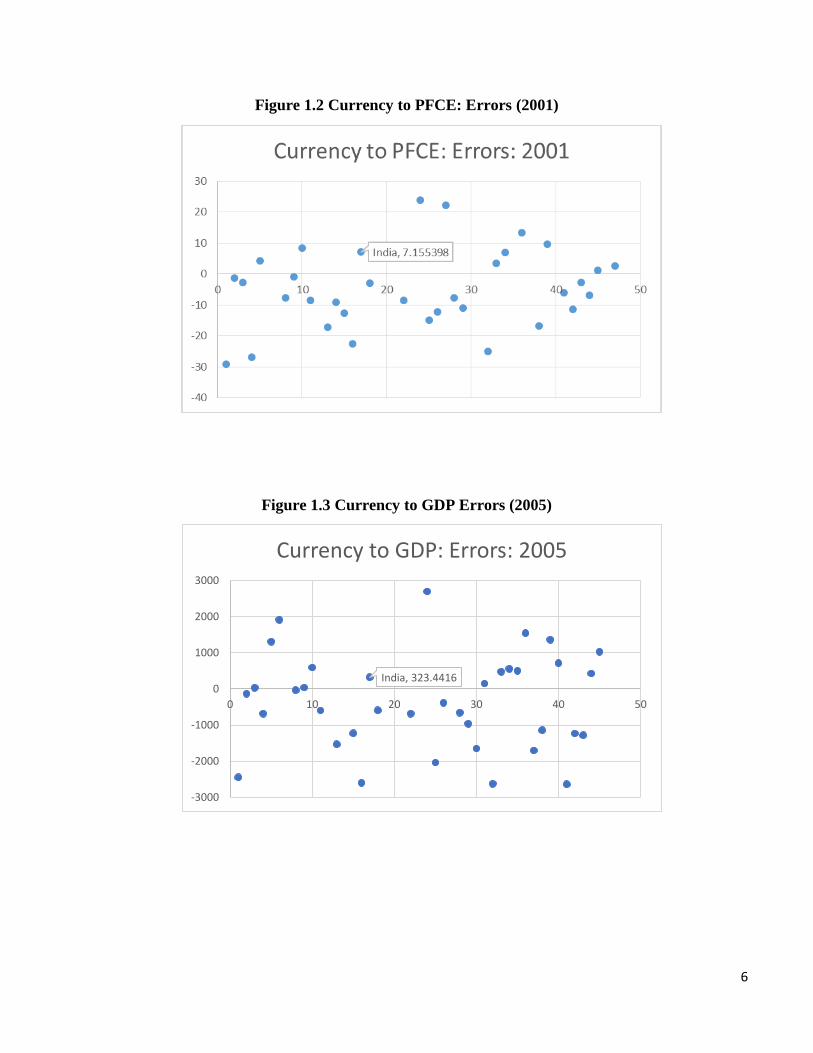
One method would be to estimate6 the relation between currency to GDP and these explanatory
variables and then estimate whether India is an outlier by examining the errors (the difference
between the actual and estimated values of the ratio.) This exercise is undertaken both for currency
to GDP and currency to private final consumption expenditure since currency might be used more
often to transact for consumption purposes rather than for investment or government expenditure.
For interest rate, the deposit rate has been used while for inflation the inflation in consumer prices
has been used. For specialization, the proxy variable used is the share of industry in GDP since
there is greater specialization within this sector when compared to other sectors in the economy.
All the data is taken from World Development Indictors (WDI) database of World Bank and
International Financial Statistics (IFS) database of International Monetary Fund (IMF).
The results are summarized in Table 1.1 below and the error plots for different years are presented
in figures 1-6. The analysis is based on the data for 44 countries over the period 2001-2014.7
6 The relationship can be estimated using fixed effects and random effects model for the panel. In order to make this
choice, we use the results of hausman test. For CC/GDP model, Prob>chi2 = 0.1392 and for CC/PFCE, Prob>chi2 =
0.1403 and these suggest that we fail to reject the null, that is the random effects model must be used. 7 In this exercise, countries such as US and Japan have been excluded since their currency serves as international
currency. Similarly for China. Further, all EU member countries have been excluded since they work in a currency
Union and hence do not have distinct currencies and cannot plan separately for the amount of currency to put into
circulation. Further, since countries in Africa are structurally quite different from other countries in the sample, these
too have been kept out of the analysis. Of the remaining countries, 44 countries were selected for analysis depending
on the availability of data and on them not having extreme values in the variables considered.

5
Table 1.1: Estimated Relations for Trends in Currency
(1) (2)
VARIABLES Currency by PFCE Currency by GDP
Exports to GDP -1.019*** -107.5***
(0.119) (10.47)
Imports to GDP 1.338*** 134.8***
(0.107) (9.403)
Share of Industry in GDP 0.601*** 62.35***
(0.181) (15.72)
Inflation -0.255** -23.47**
(0.107) (9.438)
Interest rate -0.373** -26.33**
(0.146) (12.90)
Constant -14.02** -1,920***
(6.972) (603.3)
Observations 536 536
Number of id 44 44
Random Effects
Wald chi2(5)
Prob > chi2
R-sq:
within
between
overall
YES
178.20
0.0000
0.2644
0.1676
0.2026
YES
226.70
0.0000
0.3102
0.2592
0.2786
Note: Standard errors in parentheses, *** p<0.01, ** p<0.05, * p<0.1
Figure 1.1 Currency to GDP: Errors (2001)
6
Figure 1.2 Currency to PFCE: Errors (2001)
Figure 1.3 Currency to GDP Errors (2005)
India, 323.4416
-3000
-2000
-1000
0
1000
2000
3000
0 10 20 30 40 50
Currency to GDP: Errors: 2005

7
Figure 1.4: Currency to PFCE Errors (2005)
Figure 1.5: Currency to GDP Errors (2013)
India, 4.436357
-40
-30
-20
-10
0
10
20
30
40
0 10 20 30 40 50
Currency to PFCE: Errors:2005

8
Figure 1.6 Currency to PFCE Errors (2013)
The figures above suggest that India is not an outlier in the level of currency to GDP or in the level
of currency to private final consumption expenditure. A similar analysis was undertaken for
explaining the levels of narrow money to GDP. Once again the results are similar. In other words,
this analysis suggests that given the structure of the Indian economy, the level of currency in
circulation is not sharply higher than that dictated by its needs.
Turning to the second question, there can be two broad ways of judging whether the currency
denominations are too high or not. The first approach is to compare the value of the highest
denomination currency note with some macro-economic aggregates. Since the purpose of currency
is to facilitate or mediate in transactions, the second approach is to ask whether, to buy certain
essential commodities, the highest denomination is too high when compared to other comparable
countries. Using a range of macroeconomic aggregates as discussed above, the Arthakranti report
concludes that India has too high a value for the highest denomination currency note. This
conclusion depends on the countries chosen for the comparison –changing the countries could well
alter the conclusion. Japan, Russia and Thailand are examples of countries with higher ratios8.
Turning to the second approach, taking some of the basic goods and services used for daily
consumption as the benchmark, we can make a comparison across countries, of the purchasing
power of the highest denomination currency notes. As an example, three commodities and two
8 https://www.rbi.org.in/SCRIPTs/PublicationsView.aspx?id=14932#2

9
basic services- milk, eggs, bread9, bottle of water (1.5 litres), and local transport costs- are taken
for comparison. The purpose of selecting these commodities/services was that these are fairly
standardised and may not embody different processes of production and costs that make such a
comparison irrelevant. 10 A set of 15 countries comprising developing as well as developed
countries were selected for comparison. For every country, the ratio of the highest denomination
currency in circulation in that country to the price of each of these essential commodities gives the
quantity of the good/goods that can be purchased with that currency note. A high currency to price
ratio implies that the denominations presently in circulation are in excess of what is necessary to
undertake daily/essential purchases. As can be seen from (Figure 1.7) the comparison with other
countries, the notion that India is an outlier, i.e., that is it circulates a denomination that is too high
in value, in relation to prices of specific commodities, may be incorrect.
Figure 1.7 Currency to Price Ratio in 2014
Source: Estimated using information available, for May 2016 on cost of living, at www.numbeo.com.
Data reproduced in Appendix 1.1
9 It is possible to argue that in countries like India, bread may not be an item for daily consumption for the general
public. But incorporating food preferences might make comparisons more difficult. Hence bread is used as a common
benchmark. 10 The choice of commodities here is also based on the assumption that these commodities would be used in all
economies. These commodities have been taken for the purpose of illustration. It should be possible to consider a
different set of commodities and services – but these should be “standardised products” without significant
differences in either production or in use in the countries considered. For instance, if one considers “rice”, there are
different varieties of rice with widely differing prices and further, the consumption of rice in daily diets could vary
widely across countries.

10
The second issue that might be of interest would be the composition of currency notes by
denomination. It is also important to examine if the structure of denominations in circulation is
skewed in favour of the large value. For this we take various denominations in circulation in USA,
UK, South Korea, Australia and India.11 Presented below are the proportions in terms of volume
and value of currencies in each of these countries.
Table 1.2: Share of Denominations in Volume12 in 2015 (%)
Denominations in circulation in USA
$1 $2 $5 $10 $20 $50 $100
$500 to
$10,000
36.4 2.9 8.7 8.1 24.3 5.2 13.9 0.0029
Denominations in circulation in India
1 10 20 50 100 500 1000
13.9 36.3 5.2 4.2 18 15.7 6.7
Denominations in circulation in UK
£5 £10 £20 £50
9.6 22.7 60 7.7
Denominations in circulation in Australia
$5 $10 $20 $50 $100
1.3 1.97 0.05 47.8 43.2
Denominations in circulation in Korea
1000 5000 10000 50000
4.5 0.07 87 7.4 Source: Bank of England, Federal Reserve, RBI.
Rogoff (2016) calculates for a range of countries the proportion of large currency notes in
circulation. Presented below is the comparison of large currency denomination in circulation,
where large denomination is defined by Rogoff as those of value greater than $50.
11 There is nothing specific in choice of these countries – except for ease of availability of information. 12 Note that the coins in circulation have not been considered.

11
Table 1.3: Large Currency Notes in Circulation and Threshold used to Define Large Notes
Country Year
Proportion of large currency
notes to total currency in
circulation (%)
Local currency
threshold used to
define large note
Switzerland 2015 96.6 50
Israel 2015 94.8 100
Norway 2015 94.1 200
Russia 2014 93.5 1,000
Australia 2015 92.2 50
Japan 2015 91.1 5,000
Eurozone 2015 90.7 50
Singapore 2014 90.6 50
Taiwan 2014 89.6 1,000
Argentina 2015 88.3 100
China 2014 86.8 100
Brazil 2015 85.5 50
South Africa 2014 85.1 100
Mexico 2015 84.7 500
United States 2015 84.2 50
Hong Kong 2014 83.4 500
Thailand 2015 82.4 1,000
Sweden 2015 79.2 500
Denmark 2015 75.4 500
Canada 2015 71.3 50
New Zealand 2015 70.7 50
United Kingdom 2015 68.6 20
Turkey 2015 58.4 50
Colombia 2014 35.7 50,000
Chile 2014 31.9 20,000
India 2015 39.3 1000 Source: Rogoff (2016), RBI, Bank of Bangladesh.

12
Taking Rogoff‘s definition of high value currency, the share of the largest note in circulation in total
value of currency in India is below the proportion observed for a number of other countries.
The table 1.2 shows that for none of the countries the volume of currency in circulation is
concentrated in the highest denominations. Even in terms of the volume of currency notes in
circulation India does not appear to be an outlier. In fact, the maximum number of notes in
circulation is the Rs. 10 note.
The volume of currency notes might be misleading since a few high value notes could embody
more value that a large number of smaller denomination notes. Therefore it would be useful to
look at the composition in terms of value as well.
Table 1.4: Share of Denominations in Value (%)
Denominations in circulation in USA
$1 $2 $5 $10 $20 $50
$100
$500
to$10,000
1.6 0.2 1.9 3.5 21.0 11.6
60.1
0.1
Denominations in circulation in India
1 10 20 50 100 500
1000
0.3 2.1 0.6 1.2 10.5 46
39.3
Denominations in circulation in UK
£5 £10 £20
£50
2.4 11.5 60.5
19.4
Denominations in circulation in Australia
$5 $10 $20
$50
$100
12.8 9.2 12.9
44.7
20.1
Denominations in circulation in Korea
1000 5000 10000
50000
3.4 2.9 65.7
28
Source: Bank of England, RBI, Federal Reserve, RBA and Bank of Korea
Note: The notes in circulation for USA were for end of 2015, for UK it was February 2016, Korea was
2009 and Australia 2016.
13
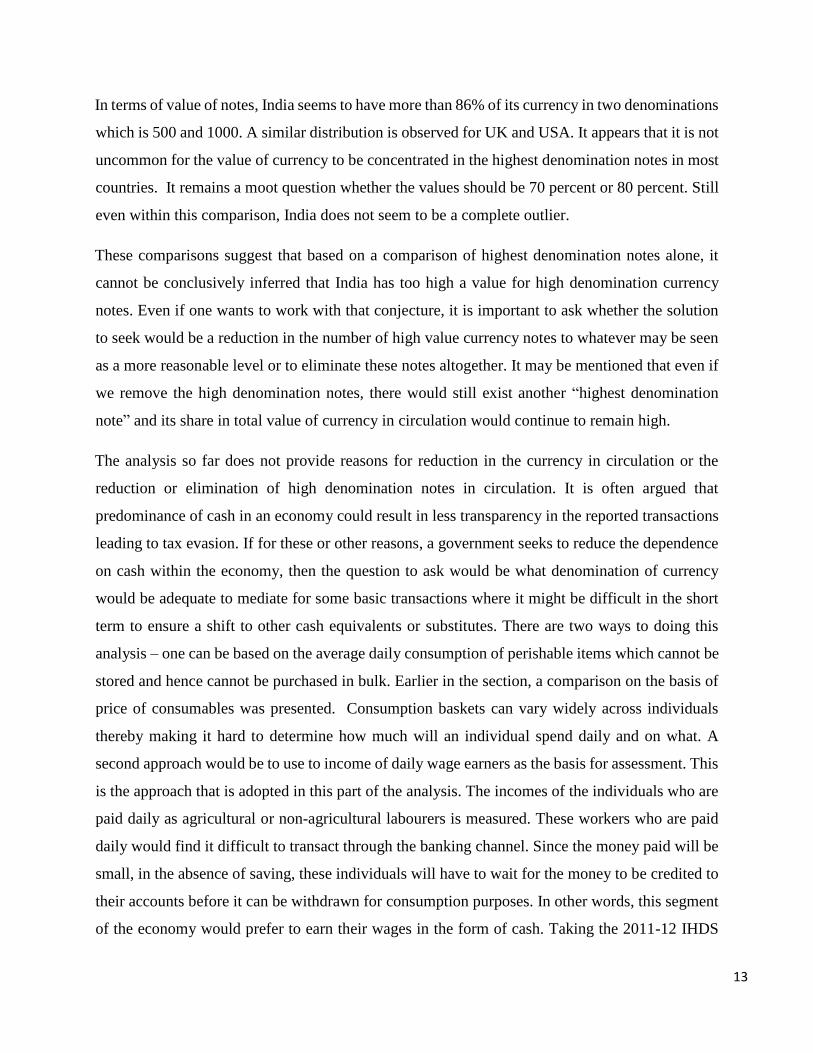
In terms of value of notes, India seems to have more than 86% of its currency in two denominations
which is 500 and 1000. A similar distribution is observed for UK and USA. It appears that it is not
uncommon for the value of currency to be concentrated in the highest denomination notes in most
countries. It remains a moot question whether the values should be 70 percent or 80 percent. Still
even within this comparison, India does not seem to be a complete outlier.
These comparisons suggest that based on a comparison of highest denomination notes alone, it
cannot be conclusively inferred that India has too high a value for high denomination currency
notes. Even if one wants to work with that conjecture, it is important to ask whether the solution
to seek would be a reduction in the number of high value currency notes to whatever may be seen
as a more reasonable level or to eliminate these notes altogether. It may be mentioned that even if
we remove the high denomination notes, there would still exist another “highest denomination
note” and its share in total value of currency in circulation would continue to remain high.
The analysis so far does not provide reasons for reduction in the currency in circulation or the
reduction or elimination of high denomination notes in circulation. It is often argued that
predominance of cash in an economy could result in less transparency in the reported transactions
leading to tax evasion. If for these or other reasons, a government seeks to reduce the dependence
on cash within the economy, then the question to ask would be what denomination of currency
would be adequate to mediate for some basic transactions where it might be difficult in the short
term to ensure a shift to other cash equivalents or substitutes. There are two ways to doing this
analysis – one can be based on the average daily consumption of perishable items which cannot be
stored and hence cannot be purchased in bulk. Earlier in the section, a comparison on the basis of
price of consumables was presented. Consumption baskets can vary widely across individuals
thereby making it hard to determine how much will an individual spend daily and on what. A
second approach would be to use to income of daily wage earners as the basis for assessment. This
is the approach that is adopted in this part of the analysis. The incomes of the individuals who are
paid daily as agricultural or non-agricultural labourers is measured. These workers who are paid
daily would find it difficult to transact through the banking channel. Since the money paid will be
small, in the absence of saving, these individuals will have to wait for the money to be credited to
their accounts before it can be withdrawn for consumption purposes. In other words, this segment
of the economy would prefer to earn their wages in the form of cash. Taking the 2011-12 IHDS

14
database, the average wage was computed for those who reported wages from agricultural work as
well as for those who reported wages from non-agricultural work and were paid on a daily basis.13
These figures for 2011-12 are reported in Table 1.5. In order to bring this number up to date CPI
is used, for 2015-16, to adjust the wage rates. These are presented in Table 1.6.
Table 1.5: Average Daily Wage Reported in IHDS for 2011-12
Average Daily Wage
Sector Paid daily
agricultural wage
Paid daily non-
agricultural wage
Rural 117 148.92
Urban 144 207
Total 118 167.6
Source: IHDSII.
Table 1.6: Average Daily Wage Reported in IHDS Adjusted for Inflation
Average Daily Wage Adjusted for CPI
Sector Agricultural wage Non-agricultural wage
Rural 158.98 202.35
Urban 188.82 271.44
Total 157.71 224
Note: Rural wages are adjusted using New CPI rural; Urban wages on the basis of New
CPI urban and total using New CPI Combined (Rural+Urban) for 2015-16.
Alternatively, the wage rates reported by labour bureau can be taken to estimate the highest
denomination necessary for such payments. The result is the same as that from IHDS. The highest
wage is 397 thereby making 100 rupee notes sufficient for making such payments.
13 Of the 39,927 individuals who reported their employment status as casual daily and casual piecework 35,733 were
paid daily in the case of those working in the non-agricultural sector with 153 days of employment in a year. In the
case of 17,772 individuals reporting agricultural wage 17,749 were paid daily with 125 days of employment in a year.

15
Table 1.7: Rural Wages Reported by Activity and Gender
Activity Category Average wage (Rs)
Ploughing/tilling workers
Men 263.98
Women 182.81
Children
Sowing (including planting/transplanting/weeding
workers)
Men 218.45
Women 175.45
Children 126.11
Harvesting/winnowing/ threshing workers
Men 212.11
Women 178.11
Children 153.69
Picking workers (including tea, cotton, tobacco &
other commercial crops
Men 208.19
Women 174.52
Children 145.83
Horticulture workers (including nursery growers)
Men 227.94
Women 155.96
Children
Fishermen inland
Men 262.81
Women
Children
Fishermen costal/deep sea
Men 348
Women
Children
Loggers and wood cutters
Men 310.57
Women 151.54
Children
Animal husbandry workers: including poultry
workers, dairy workers & herdsman
Men 183.26
Women 138.33
Children 67.74
Packaging labourers
Men 238.8
Women 151.18
Children
General agricultural labourers including watering &
irrigation workers etc.
Men 224.66
Women 165.67
Children 111.76
Plant protection workers (applying pesticides,
treating seeds, etc.)
Men 288.77
Women 169.51
Children
Carpenter
Men 315.83
Women
Children
Blacksmith Men 253.54
Women
16
Activity Category Average wage (Rs)
Children
Mason
Men 350.91
Women
Children
Weavers
Men 236.2
Women 186.45
Children
Beedi makers
Men 164.2
Women 116.41
Children 72
Bamboo, cane basket weavers
Men 208.31
Women 142.67
Children
Handicraft workers
Men 271.56
Women 133.3
Children
Plumbers
Men 397.69
Women
Children
Electrician
Men 365.34
Women
Children
Construction workers (for roads, dams, industrial &
project construction work & well diggers
Men 247.41
Women 182.76
Children 146.67
LMV & tractors drivers
Men 291.47
Women
Children
Non-agricultural labourers (Including porters,
loaders)
Men 237.98
Women 173.8
Children 86.76
Sweeping/cleaning workers
Men 182.82
Women 188.87
Children Source: Wage Rates in Rural India, December 2016, Labour Bureau, available at
http://labourbureaunew.gov.in/UserContent/WRRI_DEC_2016.pdf
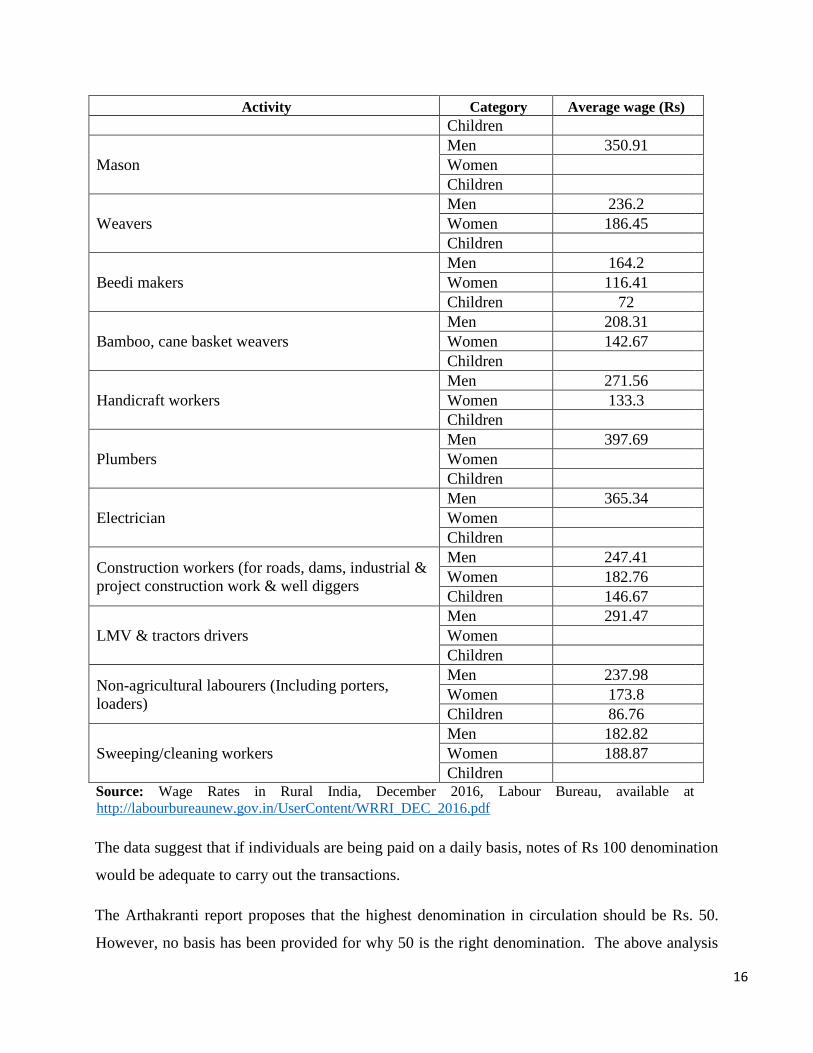
The data suggest that if individuals are being paid on a daily basis, notes of Rs 100 denomination
would be adequate to carry out the transactions.
The Arthakranti report proposes that the highest denomination in circulation should be Rs. 50.
However, no basis has been provided for why 50 is the right denomination. The above analysis

17
suggests, however, that while the rationale for eliminating high denomination notes is not clear
from inter-country comparisons, it is reasonably clear that if the central bank or the government
decides that this is the policy direction, then currency notes beyond Rs 100 might not be required
with the present configuration of prices. Whether it would be preferable or desirable to have even
lower denominations is not suggested or supported by our analysis.
In what follows, we now turn to the two important proposals of the Arthakranti report.

18
Appendix 1.1: Prices and Highest denomination notes: Different Countries
Commodity
price
Milk
(regular)
(1 litre) Eggs (12)
Loaf of
Fresh
White
Bread
(500g)
One-way
Ticket
(Local
Transport)
Water
(1.5 litre
bottle)
Basic
(Electricity,
Heating,
Water,
Garbage)
for 85m2
Apartment
Pack of
Cigarettes
(Marlboro)
1 min. of
Prepaid
Mobile
Tariff
Local (No
Discounts
or Plans)
Highest
Denomination
Russia 55 72.9 31 28.1 38.5 6082.76 98.55 1.6 5000
Denmark 6.3 22.9 14.5 24 9.1 1206.18 44 0.83 1000
Japan 181.1 223.3 169.2 210 142.8 19706 450 39.55 10000
India 42.2 55.3 25.6 15 27.1 2150 150 0.95 1000
USA 0.9 2.8 2.6 2.3 1.8 147.23 6.5 0.11 100
Australia 1.5 4.7 2.7 3.9 2.5 188.15 24 0.4 100
Canada 2.1 3.4 2.8 3 2.2 143.33 12 0.3 100
Malaysia 6.5 5.1 3.2 2 2.3 178.21 13.8 0.25 100
Thailand 47.8 53.5 38.6 20 16.1 2115.72 92 1.78 1000
Bangladesh 65.7 99.9 44.4 20 29.4 2902 200 1.17 1000
Korea 2450.3 2931.7 2373 1250 1204.2 157465 4500 161.47 50000
Brazil 2.8 5 4.8 3.5 2.8 247.06 7.16 1.34 100
China 13 12.3 10.7 2 3.6 341.61 18 0.27 100
UK 0.9 2 0.95 2.3 0.91 144.07 8.5 0.14 50

19
Chapter 2: Elimination of High Denomination Notes
One of the key elements of the policy package proposed in the Arthakranti Report is the elimination
of high denomination notes from the economy. 14 In particular it is proposed that notes of
denomination Rs 500 and Rs 1000 should be eliminated. This, it is argued, would have two effects
– one, transactions which are mediated through these notes would necessarily have to move to
other cashless forms of money and thereby become a part of the formal economy, and second, this
could potentially lead to availability of more credit or credit at lower rates of interest. To explore
the effects of such a change it is important to first ask what form this change would be introduced
in. The form in which HDD is implemented can influence not only the speed of transition to the
new regime but also can impose certain costs of transition on the economy. Therefore, to begin
with an attempt is made to identify the ways in which HDD can be implemented and the kinds of
transition issues that might arise. These are presented in section 2.2. This is followed by a
discussion on the effects of HDD on the economy. The effects briefly can be classified into two
categories: effects on the macro variables (discussed in section 2.3) and effects on the individual
agents in the economy (discussed in section 2.4). In the final section an attempt is made to identify
measures which might ease the pains of transition to the new regime15. Before embarking on this
exercise, section 2.1 provides a brief overview of the some of the prominent cases of
demonetisation in the world.
2.1 International Experience
There are two ways in which a currency in circulation might be removed from circulation: one,
where the monetary authority seeks to withdraw a currency from circulation without affecting its
legal status and the second, where the currency is stripped of its legal status. The former act is
described as withdrawal of currency while the latter is termed as demonetisation.
14 Demonetisation of High Denomination Notes will henceforth be referred to as HDD 15 The discussion in this chapter is about the proposal of demonetisation as described in Arthakranti report. It however
does not discuss the impact of the demonetisation that has recently been implemented in India. For a discussion on
the latter please see NIPFP working paper
http://www.nipfp.org.in/media/medialibrary/2016/11/WP_2016_182.pdf

20
Monetary systems have drastically changed over time from commodity money to metallic money
and then to paper currency backed by gold and finally, to the pure fiat money. Moreover, in the
recent times, we can see a shift from fiat paper currency to card based or technology based payment
systems. Some of these changes were accompanied by demonetisation. For instance, a move from
metallic money to fiat money backed by gold would have required a demonetisation. Even within
the same regime too, there have been cases of demonetisation for various reasons. During the era
of metallic currencies, demonetization was done with the motive of profit from debasement. But
with the move to fiat currency, debasement is no more a criterion. One of the reasons for
demonetisation in fiat currency is to deal with counterfeiting by improving the currency notes
through advances in the security features incorporated. For example, according to the 2008 edition
of Guinness World Records the current series of Swiss Franc notes is the most secure in the world
with up to 18 security features16. The second reason often discussed is in order to deal with
situations of hyperinflation. The third reason could be political regime changes or disruptions in
the economy (breakup of USSR, new regime in Iraq). A fourth reason is when a currency is being
replaced by another currency either as a part of the process of economic integration (EURO) or
where there is a felt need to stabilise the economy with respect to international economy
(Zimbabwe).
Broadly, all the episodes witnessed in the world can be categorised into two categories:
1. Complete demonetization (No country went for it in the recent times).
2. Partial Demonetization
a. Currency replacement with US dollars. e.g. Zimbabwe
b. Currency replacement with new currency. e.g. Switzerland
c. Abandoning higher denomination currency e.g. India and many other countries
d. Political regime changes and turmoil e.g. Iraq, Uganda.
16 The Swiss case is altogether a different one. The Swiss central bank will come up with new series periodically, and
replaces the old currencies. First notes were issued in 1907. Since then, eight series of Swiss franc notes have been
printed, six of which have been released for use by the general public, and a new series is expected in 2016.

21
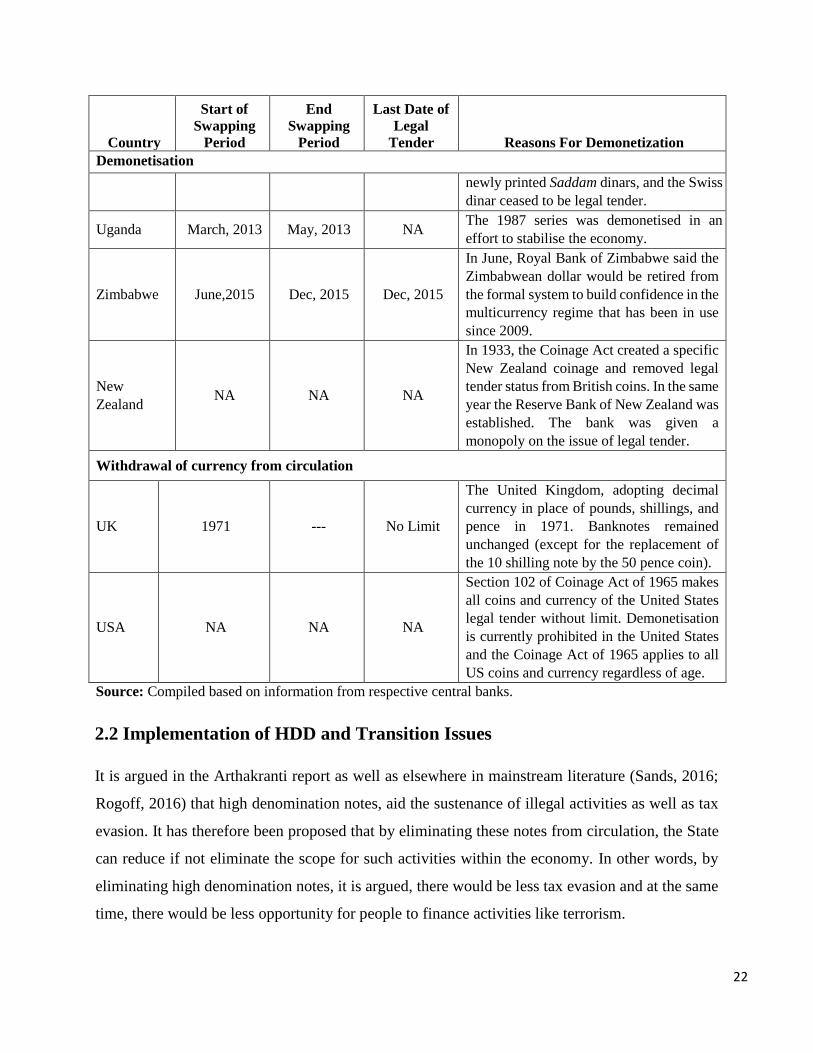
Withdrawal from circulation, as discussed above, is different from demonetization. In other words,
banknotes and coins may be withdrawn from circulation, but remain legal tender. For example, in
United States, Section 102 of the Coinage Act of 1965 makes all coins and currency of the United
States legal tender without any time limit. So, in USA, banknotes issued at any date remain legal
tender even after they are withdrawn from circulation. This is also true in New Zealand, where all
paper and polymer currency issued by New Zealand from 1967 onwards are still legal tender, even
though, many of these notes are withdrawn from circulation.
Table 2.1: Examples of Demonetisation
Country
Start of
Swapping
Period
End
Swapping
Period
Last Date of
Legal
Tender Reasons For Demonetization
Demonetisation
India
31-03-2014 31-03-2015 31-09-2015
It withdraw all currency notes issued before
2005 from April 1, 2014. Aim is to weed
out fake currencies to a large extent from
the system.
1978 1978 1978
The RBI had gone in for demonetisation of
notes of value Rs 1,000, Rs 5,000 and Rs
10,000 to tackle generation of black money.
Philippines 31-12-2015 31-12-2016 01-01-2017
The old series, NDS were issued in 1985
and had monetary value only until
December 31, 2015. This measure was
taken to upgrade the security features.
Pakistan 30-11-2016 01-12-2016 31-12-2021
Old currency notes were replaced by new
currency notes to improve the security,
durability and aesthetic quality of
banknotes.
CIS
countries 1989 1989 1989
The successor countries of the Soviet Union
replaced the Rouble in the 1990s. The
exchange rate from the Rouble to the new
currency was different in different
countries.
Europe 2001 varying varying
With the formation of the Eurozone, the
erstwhile currencies of the countries
concerned were replaced by Euro. Different
countries gave different time periods after
which the currency would cease to be legal
tender.
Iraq 1991 1991 NA After the Gulf War, the Iraqi government
disendorsed the old currency, favoring
22
Country
Start of
Swapping
Period
End
Swapping
Period
Last Date of
Legal
Tender Reasons For Demonetization
Demonetisation
newly printed Saddam dinars, and the Swiss
dinar ceased to be legal tender.
Uganda March, 2013 May, 2013 NA The 1987 series was demonetised in an
effort to stabilise the economy.
Zimbabwe June,2015 Dec, 2015 Dec, 2015
In June, Royal Bank of Zimbabwe said the
Zimbabwean dollar would be retired from
the formal system to build confidence in the
multicurrency regime that has been in use
since 2009.
New
Zealand NA NA NA
In 1933, the Coinage Act created a specific
New Zealand coinage and removed legal
tender status from British coins. In the same
year the Reserve Bank of New Zealand was
established. The bank was given a
monopoly on the issue of legal tender.
Withdrawal of currency from circulation
UK 1971 --- No Limit
The United Kingdom, adopting decimal
currency in place of pounds, shillings, and
pence in 1971. Banknotes remained
unchanged (except for the replacement of
the 10 shilling note by the 50 pence coin).
USA NA NA NA
Section 102 of Coinage Act of 1965 makes
all coins and currency of the United States
legal tender without limit. Demonetisation
is currently prohibited in the United States
and the Coinage Act of 1965 applies to all
US coins and currency regardless of age.
Source: Compiled based on information from respective central banks.
2.2 Implementation of HDD and Transition Issues
It is argued in the Arthakranti report as well as elsewhere in mainstream literature (Sands, 2016;
Rogoff, 2016) that high denomination notes, aid the sustenance of illegal activities as well as tax
evasion. It has therefore been proposed that by eliminating these notes from circulation, the State
can reduce if not eliminate the scope for such activities within the economy. In other words, by
eliminating high denomination notes, it is argued, there would be less tax evasion and at the same
time, there would be less opportunity for people to finance activities like terrorism.

23
Demonetisation can be undertaken in broadly two ways: one, by replacing the high value currency
notes by low value currency notes. This would not change the total currency in circulation but
would alter the composition of the currency. It can be argued that such a change would allow
transactions to be carried on as before but increase the transaction cost for agents since there would
be a cost of carrying larger packets of currency notes which have the same value. This change
would gradually encourage people to shift from transactions based on cash to using various cash
substitutes like plastic money. An alternative way could be one where an amount equivalent to the
high value currency note could be credited into the bank account of the agent surrendering the
note. This approach would drastically reduce the value of currency in circulation and force a
change in the behaviour of economic agents. It is possible to imagine a combination of these
alternative ways too, like gradual elimination of the high value currency notes by not replacing
worn out notes or by withdrawing a fraction of total high value notes in circulation17. These
approaches can broadly be thought of as either forcing an immediate transition to a regime with
low use of currency or one where the movement to a low currency economy is induced in a gradual
way.
For each of these alternative models for demonetisation to succeed, there are a number of issues of
transition that need to be managed. These are briefly discussed below:
1. Infrastructure issues: Studies suggest that over 68 percent of the value of transactions is
completed through cash18. As per the Report released by the Reserve Bank of India in
March, 2016, Concept Paper on Card Acceptance Infrastructure, even though there are a
large number of ATM cards and debit cards that have been issued to account holders, a
bulk of debit cards are used for withdrawing money from ATMs – such transactions
account for 88% of the total volume and around 94% of the total value of debit card
transactions. Since demonetisation would involve moving most of the transactions to non-
cash instruments, it would require a substantial expansion in the capacities of the system
to tackle a large number of transactions. There is need for a significant upgrade of the
banking system as well as in the telecom infrastructure that would provide the backbone
for digital transactions. For people to be able to transact at any time and place as well as
for them to consider it a reliable medium of exchange, it is important that not only the
banking system is upgraded to ensure that transactions can be completed without a hitch,
but the supporting infrastructure too is up to the mark. For instance, in many parts of the
17 Another decision needs to be taken is whether the transition from one system to another should be compressed into
a short duration of time or whether people should be given sufficient time to convert at convenience. 18 “68% of transactions in India are cash based”, November 14th 2016, Business Standard

24
economy, there is limited and intermittent supply of electricity as well as mobile
connectivity. In these areas, it would be difficult to expect people to shift to electronic
medium of exchange.
2. Access to the new network: A large part of the economy will have to incur costs in order
to gain access to digital networks. This could involve purchase of smart phones/gadgets as
well as buying data package in order to function in the digital space. These costs could well
reduce over time as larger numbers of transactions and values of transactions move to the
digital space and innovations in this space reduce the costs. However at the time of
transition, these costs need to be factored in.
3. Security and confidence in the new medium: It would be incorrect to argue that digital
instruments or non-cash instruments would be safer than cash. For a financially and
digitally literate user, it may be argued that the latter are safer, but in the absence of
financial or digital literacy, both the actual security of transactions as well as the confidence
of individuals in undertaking these transactions would need to be improved. For instance,
a number of instruments that are evolving in this space are using the smart phone or even
the regular phone for undertaking transactions. Theft of a phone or access to a phone can
potentially allow non-authorised persons 19 to utilise these services thereby removing
money from the accounts of the bonafide user. Educating people about the mechanisms for
maintaining security in their phones and in their digital accounts would be an essential
prerequisite before one can build confidence in the new medium. In addition some forms
of insurance too could be provide to protect the new users from unauthorized access and
resultant losses.
4. Consumer behaviour issues: Apart from the technological issues, there is a behavioural
change that is being expected in people from using cash as a medium of exchange to using
other cash substitutes both for making payments and receiving payments. This transition
requires individuals to make two changes in their behaviour: one, agents need to move from
tangible means which can be seen and felt, to forms which are less tangible or not tangible,
and second, they have to learn to rely on technologically advanced tools to undertake
regular day to day operations. The latter requires agents to be educated to the extent of
comprehending the content of transactions. If this transition is not suitably managed, agents
might be tempted to move to non-official cash substitutes.
5. Accessibility in language: In addition to all of the above, most of the banks and the mobile
instruments for transaction are currently adapted to a single to two languages. If the bulk
of the population of this country needs to come on board, it might be important to make
19 There has been in the recent period hacking of ATM cards details
http://www.huffingtonpost.in/2016/10/20/massive-debit-card-hack-hits-indian-banks-3-2-million-cards-aff/
25
these facilities available in a number of Indian languages to ensure that the user can
comprehend the transaction that they are entering into.
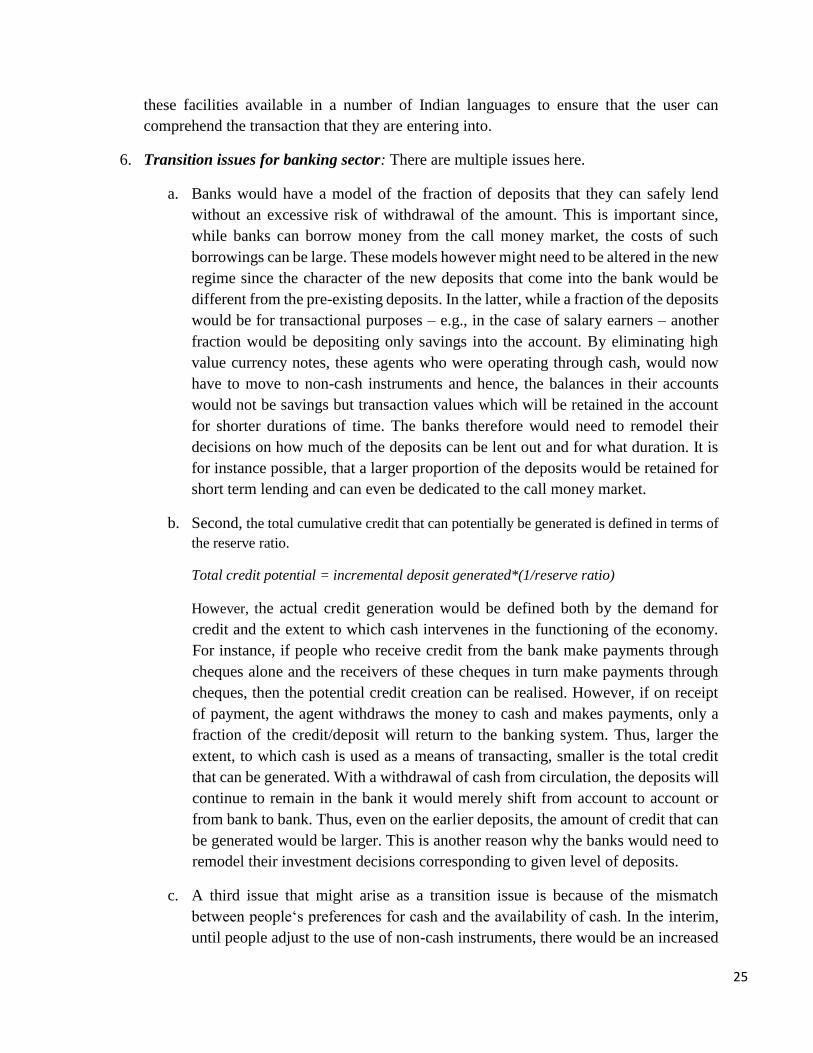
6. Transition issues for banking sector: There are multiple issues here.
a. Banks would have a model of the fraction of deposits that they can safely lend
without an excessive risk of withdrawal of the amount. This is important since,
while banks can borrow money from the call money market, the costs of such
borrowings can be large. These models however might need to be altered in the new
regime since the character of the new deposits that come into the bank would be
different from the pre-existing deposits. In the latter, while a fraction of the deposits
would be for transactional purposes – e.g., in the case of salary earners – another
fraction would be depositing only savings into the account. By eliminating high
value currency notes, these agents who were operating through cash, would now
have to move to non-cash instruments and hence, the balances in their accounts
would not be savings but transaction values which will be retained in the account
for shorter durations of time. The banks therefore would need to remodel their
decisions on how much of the deposits can be lent out and for what duration. It is
for instance possible, that a larger proportion of the deposits would be retained for
short term lending and can even be dedicated to the call money market.
b. Second, the total cumulative credit that can potentially be generated is defined in terms of
the reserve ratio.
Total credit potential = incremental deposit generated*(1/reserve ratio)
However, the actual credit generation would be defined both by the demand for
credit and the extent to which cash intervenes in the functioning of the economy.
For instance, if people who receive credit from the bank make payments through
cheques alone and the receivers of these cheques in turn make payments through
cheques, then the potential credit creation can be realised. However, if on receipt
of payment, the agent withdraws the money to cash and makes payments, only a
fraction of the credit/deposit will return to the banking system. Thus, larger the
extent, to which cash is used as a means of transacting, smaller is the total credit
that can be generated. With a withdrawal of cash from circulation, the deposits will
continue to remain in the bank it would merely shift from account to account or
from bank to bank. Thus, even on the earlier deposits, the amount of credit that can
be generated would be larger. This is another reason why the banks would need to
remodel their investment decisions corresponding to given level of deposits.
c. A third issue that might arise as a transition issue is because of the mismatch
between people‘s preferences for cash and the availability of cash. In the interim,
until people adjust to the use of non-cash instruments, there would be an increased

26
demand for the cash that is available and that might generate a situation where the
agents have to pay a premium to access legal tender. In periods of scarcity of coins
for instance, it is commonly known that people pay a premium to get the change.
While this can be considered a transition issue, there are two different implications
of such a development:
i. If the premium on cash is high, it would encourage both the shift to noncash
instruments on the one hand, and to informal substitutes of cash on the other.
ii. This might undermine the confidence that people have in the currency and hence
encourage move to other currencies.
2.3 Impact on Macro Variables
To understand the impact of the proposed demonetisation on the economy, we need to differentiate
between a case where demonetisation is undertaken by replacing high value notes with low value
notes and the second case where high value notes are replaced by an equivalent deposit in the bank
account. The former, it is expected, will bring people gradually into the banking system, while the
latter will force this change instantaneously. The effects of former would therefore be spread out
over time while the latter would need an immediate adjustment from the economy. This in turn has
two implications. In the former, there might not be any major short term consequences while the
latter will have significant short term consequences. Therefore, in the following discussion, we
first consider the more aggressive form of demonetisation, i.e., replacement of high denomination
notes with an equivalent increment to bank balances. The likely impact of the gradual transition
process will be discussed subsequently.
2.3.1 Demonetisation by Moving Currency to Bank Accounts
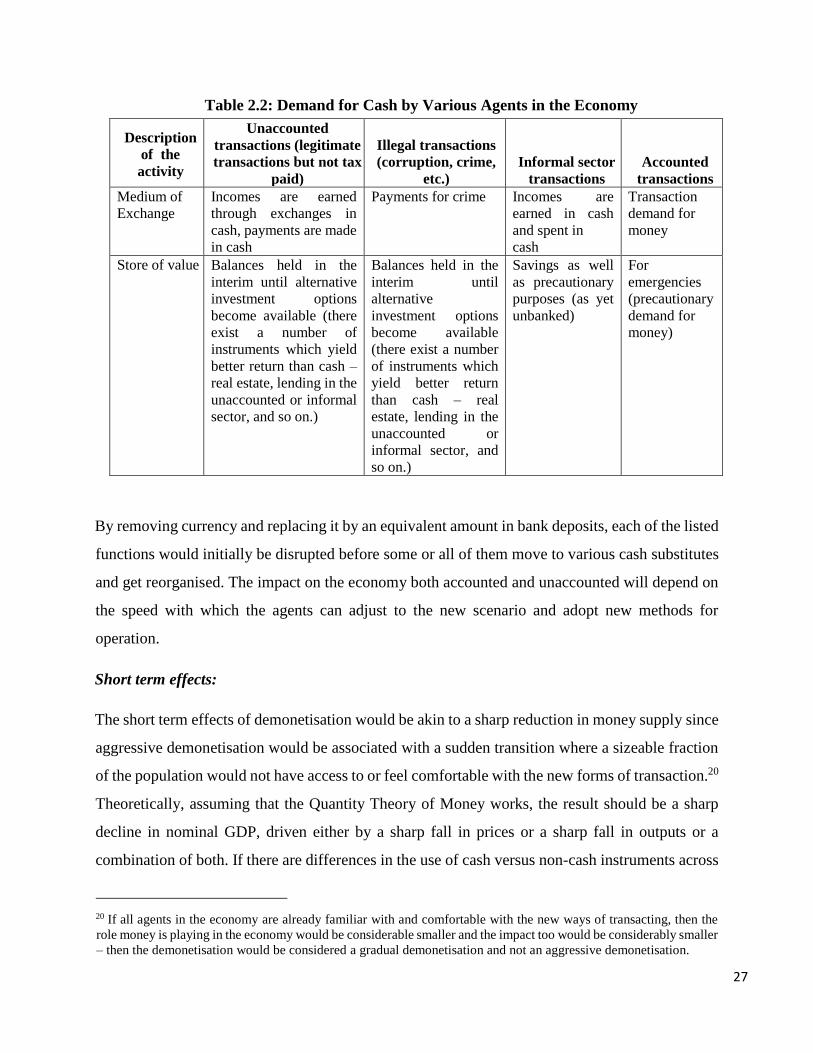
To explore the impact of this move, it is important to ask what role the currency was playing in the
hands of the people who held it. There are two roles money could have played – a medium of
exchange and store of value. Here it is important to note that currency could have been playing
both these roles for unaccounted incomes as well as for accounted incomes. Table 2.2 provides
some examples of the kinds of incomes and the role that currency could have played in each of
these cases.
27
Table 2.2: Demand for Cash by Various Agents in the Economy
Description
of the
activity
Unaccounted
transactions (legitimate
transactions but not tax
paid)
Illegal transactions
(corruption, crime,
etc.)
Informal sector
transactions
Accounted
transactions
Medium of
Exchange
Incomes are earned
through exchanges in
cash, payments are made
in cash
Payments for crime Incomes are
earned in cash
and spent in
cash
Transaction
demand for
money
Store of value Balances held in the
interim until alternative
investment options
become available (there
exist a number of
instruments which yield
better return than cash –
real estate, lending in the
unaccounted or informal
sector, and so on.)
Balances held in the
interim until
alternative
investment options
become available
(there exist a number
of instruments which
yield better return
than cash – real
estate, lending in the
unaccounted or
informal sector, and
so on.)
Savings as well
as precautionary
purposes (as yet
unbanked)
For
emergencies
(precautionary
demand for
money)
By removing currency and replacing it by an equivalent amount in bank deposits, each of the listed
functions would initially be disrupted before some or all of them move to various cash substitutes
and get reorganised. The impact on the economy both accounted and unaccounted will depend on
the speed with which the agents can adjust to the new scenario and adopt new methods for
operation.
Short term effects:
The short term effects of demonetisation would be akin to a sharp reduction in money supply since
aggressive demonetisation would be associated with a sudden transition where a sizeable fraction
of the population would not have access to or feel comfortable with the new forms of transaction.20
Theoretically, assuming that the Quantity Theory of Money works, the result should be a sharp
decline in nominal GDP, driven either by a sharp fall in prices or a sharp fall in outputs or a
combination of both. If there are differences in the use of cash versus non-cash instruments across
20 If all agents in the economy are already familiar with and comfortable with the new ways of transacting, then the
role money is playing in the economy would be considerable smaller and the impact too would be considerably smaller
– then the demonetisation would be considered a gradual demonetisation and not an aggressive demonetisation.

28
different segments of the economy, the effects would be felt differentially across sectors. For
instance in sectors, which operate purely in cash, transactions might not happen at all, implying a
reduction or elimination of output/sales rather than a reduction in prices, e.g. handloom and SME
in textiles. In other sectors such as FMCG and perhaps automobile, where there is a combination
of cash and non-cash transactions, there could be a reduction in demand from the former
component and the dealer could consider a change in price to stimulate demand. In other words,
in these sectors, there could be a reduction in price as well as a reduction in output/sales. In sectors
like construction and tea gardens where there is a large labour component and wages are paid in
cash, it is expected that economic activity will decline substantially. For perishables, there could
be a sharp fall in prices at the farms and a rise in price in retail markets – transport services might
be compressed resulting in shortages in urban retail outlets. This could even induce an increase in
price.
What the above suggests is that until agents in the economy have moved to some alternative
medium/media of exchange, transactions would not have a medium and this can have adverse
effects on all segments of the economy.
For income earning dependent on economic activities based on cash, both as wages, and as profits,
incomes would be compressed or even wiped out. In some sectors, this could translate into a greater
dependence on informal sector credit markets at usurious interest rates if economic activity is
sought to be sustained in the absence of cash – some examples are agriculture, SME.
If this demonetisation is preceded by major initiative to encourage digital or non-cash instruments,
then the transition away from cash would involve a shorter period. Otherwise, this could be a
protracted period where people adjust to working with new instruments. In the interim, the
economic costs could mount.
Medium term effects:
Demonetisation would change the composition of money from cash to bank deposits. It is often
argued that the increase in deposits would expand the capacity of the banks to create credit. The
total cumulative credit that can potentially be generated is defined in terms of the reserve ratio.
Total credit potential = incremental deposit generated*(1/reserve ratio)

29
In India, the cash reserve ratio is 4 percent while there is a statutory liquidity ratio of 22 percent21.
In determining the credit creation, it is important to take into account only the CRR and the
additional credit creation can be 25 times the amount of money deposited in the banks as a result
of the proposed demonetisation.22
Table 2.3: Potential Credit Creation Based on Reserve Ratios - 2015
Percentage
remaining in
account
Value in account
(in Rs. crore)
Potential credit
creation
(in Rs. crore)
Potential credit as
multiple of stock of
debt today
70 992600 24815000 3.08
60 850800 21270000 2.64
50 709000 17725000 2.2
40 567200 14180000 1.76
30 425400 10635000 1.32
Source: RBI.
Table 2.4: Potential Credit Creation based on Historical Trends
Percentage
remaining in
bank account
Value in bank
account (in Rs.
Crore)
credit potential
(in Rs. Crore)
% of total
credit
% of total
incremental
credit
100 1,418,000 1,684,119 20.9 198.4
90 1276200 1,515,707 18.8 178.6
80 1134400 1,347,295 16.7 158.8
70 992600 1,178,883 14.6 138.9
21 The official SLR is 22 percent but some transactions and deposits with the banks have been excluded from the
requirement of SLR. These include current account balances and foreign currency accounts. Therefore the effective
rate of SLR is lower. (https://www.rbi.org.in/scripts/BS_ViewMasCirculardetails.aspx?id=7340#13). 22 SLR is not treated as a reserve for the bank since, it restricts only the instruments into which the bank can invest but
does not limit credit creation. Further, amount invested in government bonds as a part of the SLR requirement would
accrue to the government and be spent. All expenditure by the government, as long as it is expenditure within the
domestic economy, will return the borrowed funds to the economy thereby allowing for further deposits and credit
creation akin to lending to private sector. Only to the extent the borrowing is used for purchases from the international
market, either by the government or by the private agents, will the borrowing not create further credit in the economy.

30
Percentage
remaining in
bank account
Value in bank
account (in Rs.
Crore)
credit potential
(in Rs. Crore)
% of total
credit
% of total
incremental
credit
60 850800 1,010,471 12.6 119.1
50 709000 842,059 10.5 99.2
40 567200 673,648 8.4 79.4
30 425400 505,236 6.3 59.5
Note: these figures are based on the ratio of deposit to credit for the year 2011-12.23
As discussed in the section on transitional issues, the actual credit that can be created will be limited
by the extent to which the deposits are used only for transaction purposes and the extent to which
there is unfulfilled demand for credit in the economy. Here it is important to recognise that if there
is a compression in economic activity as a result of the abrupt transition from cash to bank deposits,
then there would be compression in the demand for credit as well. This in turn could result in a
reduction in the interest rates. If the demand for credit is responsive to changes in interest rates,
there could be some corrective expansion in demand for credit. The net impact of these factors
would determine the impact on the overall economy. If the net impact is an expansion in overall
credit, especially credit for investment purposes or for working capital, it would result in an
expansion in GDP. On the other hand, if the net impact on credit is negative, this feature of
demonetisation might not be enough for turning the economy around.
MSME is one segment of the economy which is argued to be credit constrained and perhaps cash
driven as well. Expansion in the potential credit in the economy, as the Arthakranti report argues
would expand the credit available to this segment of the economy. If the access to credit for this
segment can be improved, it can generate many positive spin-offs like expansion in employment
since this is considered an employment intensive sector. While this is an interesting possibility, it
is important to ask what factors could be limiting the access to credit for MSMEs. There are two
possible factors – one, the entrepreneur might not have assets to provide as collateral and second,
the entrepreneur may not have recorded transactions which support her claim of the size of her
23 The projections are done using the ratio for 2011-12 since in subsequent years the ratio declined due to low offtake
of credit in the economy.
31
enterprise. The latter may be because these units chose not to pay taxes, or because they operated
principally with cash. It is also possible to argue that if firms access credit from the informal
sector24, the incentive to remain unaccounted is higher since the payments for servicing the credit
would need to be obtained out of the books of accounts. While bringing the transactions from cash
to non-cash instruments would encourage or induce a shift to formal sector transactions in the
medium term, and hence make these units better equipped to access formal credit, it should be
mentioned that the short term consequences of demonetisation in the form of compression of
demand could affect the MSME more than the rest of the economy. In other words, while there
could be expansion in access to credit for MSME sector, only those units which survive the short
term effect of the demonetisation will be able to benefit from this change.
If the demand for credit falls short of the supply of credit even with decline in interest rate, banks
would need to explore alternative ways of placing the additional deposits available with them. This
could mean that banks take in more risky assets potentially opening up the economy to more
volatility and risks. The housing loan bubble of the US economy might be one such example of
lending to more risky projects thereby bringing in more volatility into the system.
In the recent past, attempts to use this approach to stimulate demand for credit has resulted negative
interest rate regimes as well (e.g. Japan, EU). It is argued in some strands of the literature (Rogoff,
2016) that elimination of cash from the economy would actually facilitate the use of negative
interest rates as a policy instrument. But within the Indian context, this might not be an immediate
concern since the rate of inflation has been above 5 percent thereby helping keep nominal interest
rate too in the positive territory.
There are two channels through which the exchange rate will be affected. One is the interest rate
channel and the other is GDP.
1. If there is an expansion in credit in the economy accompanied by an increase in demand for
goods, the higher GDP will result in higher demand for imports leading to an exchange rate
depreciation. However, if this increase is not realised due to the slowdown in activity then
imports will decline leading to appreciation of the exchange rate.
24 http://www.business-standard.com/article/economy-policy/why-chits-and-informal-channels-are-still-
popular116121900740_1.html

32
2. Capital flows respond to interest rates and perceived decline in GDP. Suppose interest rate
declines exchange rate may further depreciate owing to lower inflows in the category of debt.
Further, the slowdown in economic activity may also decline in flows into the equity
instruments.
Therefore, depending on the impact of demonetisation on the growth in GDP, the impact of imports
on the exchange rate may be countered by that of capital flows.
Effects on Government Finances:
The effects of demonetisation on government finances can be divided into three categories: the
impact through RBI‘s finances, the impact through taxes and the impact through credit available
to finance deficits.
1. Through RBI’s finances: The RBI earns seigniorage through its currency operations.25
Currency seigniorage is measured as the interest earnings to the central bank from keeping
currency in circulation. For currency in circulation, the central bank does not have to pay
interest on these values while it earns interest on the corresponding assets. This therefore
represents earning to the central bank.26 With a reduction in currency in circulation, this
source of income to the central bank would be compressed.
2. Impact through taxes: there are multiple channels through which taxes will be affected
▪ The impact on indirect taxes would be negative during the period of adjustment to the
new regime because of the compression in demand. To the extent that in the medium
term, there is a larger component of formal sector in the total economy, the indirect tax
collections should recover. This could have an adverse impact on state finances since
states are more dependent on indirect taxes.
▪ On income tax there can be two potential effects: first, with compression in the
economy, there could be a reduction in the tax collection. In the event that
demonetisation brings in a larger share of the economic activity into the formal sector,
there would be an expansion in income tax collections. The net impact would depend
on the relative magnitudes of these two effects.
3. Through financing of fiscal deficit: The generation of additional deposits and credit, as a
result of the SLR requirements can make more credit available to governments. Given the
FRBM limitations, the amount of borrowing that governments can take on may be limited and
25 There are multiple ways of defining and measuring income from seigniorage. RBI’s Annual Report suggests the
use of a concept called opportunity cost concept or fiscal seigniorage concept which has been adopted here. 26 It is measured as (notes in circulation - cost of printing and distributing them)*market interest rate.

33
the additional supply can mean a decline in the interest rate that governments pay on their debt.
Governments could attempt to restructure their debt to take advantage of the low interest rate
in this regime.
2.3.2. Demonetisation by Replacing High Value Notes with Low Value Notes:
The impact of this approach would be considerably milder when compared to the first scenario. In
the short run, one expects to see no effect, since the transactions can continue as before the change.
There could however be transition issues related to the speed with which the demonetisation takes
place. In the medium term, with perception of inconvenience in operating with cash and with an
expansion in capacities in non-cash forms, gradually, it is expected that people would opt for non-
cash forms of transactions. This would bring in more people into the formal economy and also
bring money into bank accounts. This in turn could expand credit creation in the economy and
generate a virtuous cycle.
2.3.3. Demonetisation and Unaccounted Incomes:
There may be differences in how these two alternative approaches affect the generation and
utilisation of unaccounted incomes in the country. To begin with, it is important to recognise that
generation of unaccounted incomes is not solely related to the existence of a cash based economy.
Unaccounted incomes can be generated through a number of methods, one of which is through
cash transactions which are kept out of the account books. Gold plating of expenses for instance is
one such mechanism where the transactions remain within the banks but the tax liability can be
reduced. Thus, it would be incorrect to assume that demonetisation would close all avenues for
generation of unaccounted incomes.
Within the method of suppressing sales and associated incomes, it should be noted that the first
and more aggressive form of demonetisation might be more effective to place some limits on the
generation since the change over from the cash to non-cash economy would be instantaneous. In
the demonetisation where the high value notes are replaced by low denomination notes, cash can
continue to be used for generation of unaccounted incomes. It should also be mentioned that there
are a number of alternative currencies that are evolving in the world, some of them to encourage
local transactions and others to bypass official currencies. A more detailed discussion is presented
in chapter 3. The emergence of these alternatives might open up the scope for generation of

34
unaccounted incomes through the suppression of sales. Thus demonetisation can place some limits
but cannot be adequate for reining in generation of unaccounted incomes in the economy.
It should however be pointed out that if the demonetisation is aggressive, for agents who are left
holding cash balances associated with unaccounted incomes, they might seek illegal ways of
converting the cash balances to acceptable bank deposits. This process itself could contribute to
unaccounted incomes in the economy.
The move away from cash based transactions are expected to thwart activities such as money
laundering since the digital transfer leaves a footprint and makes it easier to trace the source of
transaction . However, the FATF in its reports of 2010 and 2013 has flagged some risk factors that
are associated with even with new payment mechanisms (NPMs)27. The most obvious is the lack
of customer due diligence in some cases. Two cases are provided here from the FATF 2010 report
to illustrate the misuse of these instruments for money laundering.
27 These include prepaid cards, internet payment system and digital currency.

35
Box 1: Case Studies for Money laundering using New Payment Mechanisms
Case 1: Fraud scheme and money laundering conducted through Internet payment services
An individual devised a scheme to defraud users seeking to purchase textbooks on a commercial
website. The individual created approximately 384 phony bank accounts which were opened at a bank
in Jurisdiction Z, for nonexistent employees who he indicated to the bank, would sell college textbooks.
The individual then used the bank account information to open approximately 568 seller accounts with
the commercial website using P2P online payment services (i.e., an IPS provider).
The defrauder advertised the college textbooks for sale on all of the phony commercial website seller
accounts he had created. Buyers, believing they were purchasing books from the commercial website sent over USD 5.3 million in payment to the seller accounts, using the IPS provider.
The defrauder subsequently transmitted the illicit proceeds from the IPS provider seller accounts to
several Singapore based bank accounts.
The law enforcement agency from Jurisdiction Z contacted Singapore’s law enforcement agency, who
then responded quickly to seize the tainted funds. With the close cooperation between the law
enforcement agencies, the seized funds were successfully repatriated to the victims. The defrauder was also charged for wire fraud in Jurisdiction Z.
Source: Singapore.
Case 2: Funds stolen from bank accounts laundered through IPS accounts
A computer criminal stole the victim´s personal data for online banking (including customer and
account data) then opened a fraudulent account with an IPS provider under the name of the victim. The
personal data provided in the opening of the account (phone number, home address, date of birth etc.)
were fake. The email addresses given were issued by so-called “free providers” that do not conduct any
identification or verification of their customers themselves.
The criminal named a reference bank account for funding the fraudulent IPS account. This reference
account was the victim’s. Then the criminal effected a fraudulent transaction from the victim´s reference
bank account to the fraudulent IPS provider account. As the funds came from the referenced bank
account, the transaction appeared legitimate to the IPS monitoring system. The received funds were
transferred to other accounts held with the IPS. The law enforcement authorities were neither able to
trace the money flows nor find out the criminals’ identity. The criminal repeated this scheme with several
victims, but always using the same IPS account. Thus, he changed the reference bank account for this
IPS account four times in two months; the four named reference bank accounts were held with different banks in different cities.
Source: Germany.
Source: FATF, 2010

36
2.4 Mode of Payment and Spending Behaviour
Any proposal to demonetise the economy entails dispensation of transactions through cashless
means, these could be cheques, debit cards, prepaid cards, credit cards and mobile money. The use
of cards for payment can potentially have an impact on spending habits. There exists literature that
compares spending pattern of individuals when they use cash vis a vis when other mediums of
transaction are used. To pre-empt the conclusions, the resulting change in expenditure can be of
two types: i) the individuals in the economy spend more on luxury goods and ii) individuals spend
more in total. These two outcomes have been studied in detail in the context of cash vs. credit card
and to a lesser extent on cash vs debit card.
In what follows, an attempt is made to summarise the literature which compares spending in cash
versus non-cash instruments. The first part looks at the various psychological differences attributed
to different means of payment and how these play a role in determining spending behaviour. In the
second part, the impact of debit cards and mobile money on spending is evaluated. The third part
discusses the impact of credit cards on spending behaviour. Taking into consideration the evidence
that is available the last part provides a discussion on possible scenarios that may result from the
potential behavioural shift in the economy.
2.4.1. Perceptions about Money:
There is a growing body of literature that explores the impact modes of payment have on
consumption/ spending behaviour. These differences are subtle and are result of the individual‘s
perceptions of the instruments. The most perceivable difference between payment forms, as is
always flagged in the discussions on credit card, is the time lag between purchase and payment of
bills (Prelec and Loewenstein, 1998; Tokunaga, 1993). Raghubir and Srivastava (2008) call this
feature payment coupling. The degree of coupling creates a sense of parting with money. Credit
cards rank the lowest in payment coupling whereas cash and debit cards/mobile money may be
thought to be at par.
The second important feature of perceptions about different payment forms is the salience.
Individuals perceive the pain of paying (Prelec and Loewenstein, 1998) depending on the
tangibility/salience of the outflow. The salience may also depend on the form of payment (Soman,
2003). For cash the pain associated with the payment is the highest owing to the immediacy. The

37
individual has to part with tangible cash that creates a sense of outflow. Credit cards rank the
lowest in terms of transparency or vividness with which individuals feel the outflow. Debit cards
and gift cards are intermediate forms and the pain associated with payment may be less as
compared to cash.
Prelec and Lowenstein (1998) suggest that the cost associated with spending is outweighed by the
pleasure from consumption. Therefore in the case where a credit card is used for purchase, if the
cost is lower, it can be said that the consumption of non-essentials may increase. To this Srivastava
and Raghubir (2002) add that individuals recall cash payments better than credit card expenses.
They note that the degree of difference in spending behaviour is expected to vanish if the salience
is increased at point of purchase (Raghubir and Srivastava, 2008, page 214). Therefore, reduction
in salience can increase the propensity to spend. Similarly, Soman (2001) proposes that the
payment mechanism should have an impact on spending decisions since the use of such
mechanisms influence decisions through two factors-immediacy and rehearsal. That is, payments
made by credit cards lead to accumulation of debt that is a commitment to pay as opposed to cash
that is immediate and influences the individual‘s perception of a budget. In case of cheques an
individual has to write down the value of item purchased which helps in mental accounting or
recall. However, use of cards may lead to lower recall. Therefore the lack of these two
characteristics in credit card payments may allow individuals to over-stretch their budgets.
Payment modes can also be differentiated on the extent to which they serve as a constraint on
expenditures. When an individual carries only cash, she is limited by the money contained in the
wallet. The individual takes into account all the expenses she may want to incur with the limited
resources. In the case of debit cards, the individual may be spending from a pool of funds that are
capped but from the point of view of a single shopping trip, the constraint is relatively relaxed
since the pool of funds that an individual can tap into is all of her account balance. In the case of
credit cards, this constraint is further relaxed since the individual is no longer limited by his account
balance and she can incur debt to be repaid from future earnings (Soman, 2001). In this regard,
Morewedge et al (2007) have shown that consumers perceive the purchase or consumption to be
cheaper when he/she has more financial resources that are cognitively accessible. This implies that
the individual is more likely to spend if she has, for example money in savings account as opposed

38
to cash in wallet. On the other hand, it is possible that the unnecessary spending may be reduced
with use of debit cards since only present funds are accessed for spending (Lee et al, 2007).
The characteristics of various forms of payments are summarised.
Table 2.5: Features of Payment Systems28
Payment
mechanism
Salience
form of Salience of
amount Transparency
Temporal
separation Temporal orientation
Cash
Very
high
High High
No, Do not
exist
Perception of present-
present
Cheque Medium
High High Low
Perception of present-
present/ future
Credit Card Medium
Medium Medium High
Perception of present-
future
Debit Card Medium
Medium Medium
No, Do not
Exist
Perception of present-
present
Store Value Card Low
Low Low Medium
Perception of present-
present
Auto Pay (direct
debit from bank
account)
Very
Low
Very Low Very Low Low
Perception of present-
present
Digital Wallet Medium
Medium Medium High
Perception of Present-
present/ future
Source: Braga et al (2013).
2.4.2. Debit Cards and Consumption:
The first study to specifically look at whether debit cards encourage higher spending was Soetevant
(2011). The study sought to elicit differences in spending on the basis of charitable giving. The
field experiment conducted by Soetevant (2011) lent support to the hypothesis that individuals tend
to donate more when in possession of debit cards as opposed to cash. However, one of the
28 Salience is the perceived pain of payment associated with a form of money; this could manifest through the form of
payment as well the amount. Since cash is counted and then paid out immediately the salience is high for this form of
money. On the other hand, since cards are swiped to transact, the loss of money on account of the transaction is
relatively low as is the price paid. Temporal separation is similar to the concept of coupling mentioned earlier which
refers to the time gap between purchase and payment. Temporal orientation is the perceived timing of the incurring
the expenditure. Lastly, transparency is the similarity between cash and other means of payment.

39
limitations cited of this study was that the results may have been driven by cash-on-hands
constraint.
In another study, Mercantanti and Li (2014) find that in Italy there was a significant positive
association between debit card usage and household consumption. This study used information
provided by Italy‘s Survey on Household Income and Wealth (SHIW). Though this was a
household survey, the authors infer about spending by taking only those households with one debit
card on the assumption that the possible effect on spending would be on account of one individual
possessing the card. Therefore, the study measures causal effect by taking the difference between
spending of household that holds one card with the household that possesses none.
Runnemark et al (2015) find that the form of payment used by the consumer influences the
valuation of the product and that cash helps control spending since payments tend to be more
transparent. They find that the consumer is willing to pay more when paying through credit
instruments. To establish the differences in perceptions of consumers when using debit card as
opposed to cash they conducted an experiment where students were divided into three groups. The
first group received payment in cash, second received payment in cash but were asked to use their
debit cards and the last group received payments via PayPal and were asked to pay by card. Then
the participants were asked to bid for three products -10 beer clips, 6 coffee clip card and 10 coffee
clip card. After bidding, three participants were selected randomly based on the criterion that their
bids matched with the drawn sale price. The participant would then buy the product. In addition,
students have to rank themselves on spendthrift –tightwad scale to control for individual‘s ability
to control spending. The second treatment was introduced to understand if showing cash depresses
bids for card payers. This study differs from Raghubir and Srivastava (2008): the former studies
the impact of debit cards whereas the latter introduces complications related to gift or prepaid
cards. It also addresses the limitations of previous studies by controlling for cash on hands
constraint. They find that the second group tend to bid higher.
Similarly, Trutsch (2014) find that contactless payment, both in the case of debit and credit card,
leads to higher spending.

40
Though, there is literature that provides evidence in support of budget control as the main reason
for the widespread use of debit cards, there is enough work based on experiments that shows that
individuals’ consumption may increase with use of debit cards.
Therefore, to the extent the salience of the transaction is reduced, debit cards will tend to increase
consumption expenditure. Although, the instant notification that follows any debit card purchase
can increase the salience (Runnemark et al, 2015), to the extent the pain of paying is reduced the
use of debit cards may encourage higher spending.
2.4.3. Credit Cards and Spending Behaviour:
The impact of credit cards on spending is relatively clear. The near absence of salience that
assuages the pain of payment along with the low degree of payment coupling tends to encourage
spending. Therefore, in the literature, a firm consensus exists with regard to the resulting impact
of credit card usage on consumer behaviour. Some of the studies have been summarised in this
section.
Hirschman (1979) used information from survey of customers shopping in several branches of a
departmental store in 1977 in the USA. The study finds that individuals in possession of bank card
and store issued credit cards tend to have higher levels of in-store spending. Similarly other studies
such as White (1980) find that credit cards reduce the perceived costs and leads to higher use.
Feinberg (1986) observed the payment preferences of 135 customers at a local restaurant over a
week. The hypothesis tested by this study was whether the possession of a credit card elicits
stimulus response of higher spending. The spending does not solely relate to the lower degree of
payment coupling, it in addition has to do with the salience of payments made through of the credit
card. That is, since credit cards are associated with and taken for the purpose of specific kinds of
expenditure, possession of the card leads to higher spending. The study finds that individuals in
possession of credit cards tend to tip higher.
Soman (1999) flags the issue of recall wherein individuals with credit cards tend to forget or
underestimate their recent expenses.
Prelec and Seimester (2000) extended previous work by Soman (1999) and Feinberg (1986). The
authors used real-money transactions and selected desirable goods of potentially high value.

41
Experiment was used to elicit the reservation price of the respondents for purchase of tickets to a
sold –out sporting events and the prizes were given on the basis of second price sealed bid , in
order to avoid problems of over or under estimating. The study finds evidence that people tend to
pay more when in possession of credit cards as opposed to cash29.
In fact, there are studies that propose that individuals aiming to curtail their spending tend to prefer
the use of debit cards rather than credit cards (Ameriks et al., 2004; Jonker, 2007; Von Kalckreuth
et al. 2011; Arango et al., 2011). Fusaro (2008) provides evidence that debit card use could be
associated with consumers’ desire to control their spending. Using data from a sample of more
than 2,000 consumer bank accounts, he found that debit card users, when making credit card
payments, are more likely to be paying off a large balance. Debit users also make more frequent
ATM visits than non- debit users, suggesting that debit users withdraw small amounts of cash more
frequently to avoid overspending. Although self- control is associated with the behavioural
approach, Fusaro‘s paper provides a framework for understanding self- control from a cost- based
perspective: people who are credit- constrained and have revolving balances, respond to price
incentives.
The review of literature reveals that the use of card for payment leads to behavioural responses
that are in favour of higher spending. Thus a proposal that seeks to promote cashless means of
payment must consider the two important consequences of such a change. The first change is the
compositional shift in consumption that is the use of cards might lead to higher levels of
conspicuous consumption (Thomas et al., 2011). Since cards reduce the pain of payment as well
as encourage individuals to purchase items that are otherwise considered non-essential. On the
other hand, the increase in the overall expenditure by the households more so due to the availability
of credit options can lead to accumulation of household debt. Such an increase in the credit can
potentially heighten the risk of crisis that may result from defaults.
One possible fall out of an increase in overall debt of consumers is a reduction in the level of
savings in the economy. This could adversely affect the level of investment in the economy.
29 For more recent work see Loewenstein and O‘Donoghue (2006) and Thomas et. al (2011).

42
It is however not clear from any of these studies whether the observed difference would be a short
term phenomenon related to the transition from cash based systems to other systems or whether it
would be persist even after people have got used to the new regime.
2.5. Summary of Impact of Demonetisation
The Arthakranti report proposes demonetisation of high denomination currency notes. In
particular, it proposes that the highest denomination in circulation should be Rs.50. The objective
of this measure is to convert the economy from a predominantly cash based economy to an
economy using more of non-cash instruments. The report however does not provide a roadmap or
a methodology for this proposal to be operationalized.
In chapter 1, we have argued that if high denomination currency notes are to be demonetised, a
reasonable level to stop would be at Rs 100. Earlier in this chapter it was argued that there are
broadly two ways in which such a policy to demonetise can be operationalized – the high value
notes can be completely replaced by low denomination notes or the high value notes can be
replaced by an equivalent addition to bank deposits. The former has been termed as a mild version
of demonetisation while the latter has been referred to as the aggressive version. It may be
mentioned that the actual demonetisation may be a combination of these two extremes where
partial demonetization is undertaken.
The impact of demonetisation depends on the method adopted. If the demonetisation is aggressive,
i.e., transition is not gradual, there would be considerable costs on the economy, since economic
activity would be suddenly compressed until the transition is completed or at least until a
significant part of the economic activity shifts to non-cash instruments. In contrast, if the transition
is gradual, then there are fewer costs to the economy but the transition could stretch over a long
time.
From the earlier discussion it follows that demonetisation is expected to impact the economy as
well as impose certain costs of transition. In response to the withdrawal of currency in circulation,
the money is expected to be deposited in bank accounts thereby increasing the capacity of banks
to extend loans. However, if the deposits are for short duration of time (since much of the increased
deposits would be used to finance transactions in the economy) it is not clear what kind of credit
expansion can be supported by such short term increase in credit.
43
To the extent, there is expansion in potential for credit creation, there could be a decline in interest
rates as well. This increase in credit supply would auger well for the economy provided there exists
enough demand for this the credit. However, if there is insufficient demand, the economy may not
reap any benefits. Under such circumstances, where demand falls short of available credit, the
banking sector may be tempted to make its definition of risky lending more flexible so as to be
able to lend to units that were earlier ineligible. Further, the literature on consumer behaviour
provides some evidence that the move to card based payment instruments could encourage higher
spending and, in case of credit cards, could lead to higher debt. The prevalence of cards for
payments could also lead to higher consumption of non-essentials accompanied by higher debt30.
Many of these studies are undertaken with students and in more developed countries. It would be
worthwhile to explore whether these conclusions would be relevant for Indian consumers as well.
This aspect could be studied separately in more detail to provide inputs on how a transition plan
as well as financial education programme could be designed, so that it is in sync with the desired
results.
The Arthakranti report mentions that the removal of higher value currencies from the economy
would lead to a reduction in the black economy. If one works on the hypothesis that black economy
is related to cash alone and, cannot and does not work through other mediums of exchange, then
only it would be possible to arrive at the same conclusion. One more aspect to be noted, Arthakranti
report does not differentiate between tax evasion and tax avoidance when referring to black
economy. Tax avoidance is not necessarily based on cash transactions. For example, the discussion
globally on base erosion and profit shifting provides a lot of evidence on tax avoidance. The
experience of the Latin American countries shows that there was some financial disintermediation
and shift to alternative currencies in the wake of introduction of BTTs. Besides, even in countries
with higher cashless transactions, black economy exists.
It is also argued that demonetisation can eliminate counterfeit currency and thereby place a cap on
terrorism. Terrorism may use counterfeit as one of the mechanisms of financing its activities. But
30 In India there has been evidence in the past of an increase in accumulation and default on credit card debt.
http://www.cnbc.com/2015/03/17/credit-card-defaults-up-for-first-time-in-5-years.html
http://www.livemint.com/Home-Page/hr8D3SYDG51aKgksYkcmXO/Banks-cut-down-on-credit-card-business-over-
rising-defaults.html

44
it can use some alternatives as well. In the literature on money laundering there is extensive
discussion on use of the financial system for terror financing (Solin and Zerzan, 2010; Cassara,
2016; FATF, 2010, 2013). The FATF report of 2013 provides a description of money laundering
using various digital payments referred to as new payment mechanisms (NPMs). In terms of the
impact on terrorist financing, therefore, demonetisation does temporarily slow down operations
until alternative mechanisms again emerge.
45
Chapter 3: Banking Transaction Tax: An Assessment
The major proposal of the Arthakranti report is the replacement of the all the existing taxes
(excluding customs duties) by a tax on banking transactions. The report makes a case for BTT by
suggesting that if it has been possible to “tax all consumption,” then using the same logic a tax be
levied on all banking transactions as a sort of a fee31 for providing public goods. The logic of taxing
banking transactions is that the in a “monetized economy” the banking transactions provide the
broadest base for a “simple and small” tax.
The Arthakranti -BTT specifies the design of the tax that entails withdrawal of all taxes except for
customs/ import duties, levy of BTT on all credits/receipts at an appropriate rate which Arthakranti
suggests could be 2 percent. The 2 percent is estimated using four separate methods taking into
account the transactions turnover32. The tax deducted will be credited to Central, State and local
government in varying proportions; in this regard Arthakranti gives an example of 0.7 percent, 0.6
percent and 0.35 percent of value of transactions being credited to Centre, State and local bodies
respectively. The share of the Centre will be based on the revenues that it earns from existing taxes.
The transacting bank will also have its share in this deducted amount (suggested 0.35 percent of
the value of the transaction, thereby the total tax would be 2 percent of the value of transaction).
Cash transactions in the proposal will not attract any tax, which means that the demonetisation
may not be complete. The cash transaction is left out because it is assumed that the large value
transactions will now move to banks and the currency in circulation will be used by the poor. This
tax is to be levied on financial transactions as well since any credit to the bank account will attract
tax.33 By any transaction they specify that all transactions including payments made through credit
cards as well as repayment of this debt will attract tax34.The Arthakranti report suggests that a part
of the revenue from the BTT is to be shared with the banks which would lead to “widening and
31 Page 105 of the Arthakranti Report 32 Pages150-53, ibid 33 Page 142, ibid 34 Page 170, ibid
46
deepening banking system”35. The authors have built in exceptions that are to be refunded via
direct payment route, these exceptions include transfer of money between different bank accounts
of the same person /legal entity and BTT collection accounts of the government (all levels)36. To
ensure that this exception is not misused a single unique identifier for a legal entity is being
suggested, Arthakranti proposes Aadhaar and PAN card for this purpose. Further, exports will be
taxed but the subsidies could continue through credits etc. The audits in this system would entail
audit of banking transactions by the revenue authorities at different levels of the government37.
In this chapter, an attempt is made to assess the proposed BTT in terms of the principles of taxation
(section 3.2).
3.1. History of Banking Transaction Tax:
There have been some experiments with implementing a tax on banking transactions. One of the
first attempts was in the United States of America as a method to finance war expenditure during
the 18th century. In more recent times, six of the countries in South America have experimented
with the introduction of a banking transaction tax as a way to raise some additional revenue. In
other words, the BTT in these countries has been introduced as one more tax in addition to all other
taxes existing in these countries. While it can be argued that such an experience would not be
directly comparable to the Arthakranti BTT proposal, the information captured in such an
experience would be useful to understand the direction of impact of such a change even if the
dimensions might not match.
India too has a brief experience of the Banking Cash Transaction Tax (BCTT) during 2005-2009.
It levied 0.1 percent on cash withdrawals of more than Rs 50,000 (individuals) and Rs 1,00,000
for others in a single day from non-savings bank account maintained with any scheduled bank.
This tax was withdrawn with effect from 1 April 2009. The design and the purpose of the BCTT
in India were different from any form of the BTT levied in other countries-it was meant to track
black money. Although the objective of the BCTT was not of revenue collection, it collected Rs
600 crore during 2008-09 and Rs 550 crore for 2007-08. In his Budget speech for 2008-09, the
35 Page165, ibid 36 Page 149, ibid 37 Page 137, ibid
47
then finance minister of India, P. Chidambaram had said, "The BCTT has served a very useful
purpose in enlarging the information system of the Income Tax Department. Since the information
is also being gathered through other instruments introduced in the last few years, I propose to
withdraw this tax with effect from April 1, 2009."
Six Latin American countries that have levied bank transaction taxes since the late 1980s are:
Argentina, Brazil, Colombia, Ecuador, Peru and Venezuela. Although introduced as an additional
source of the revenue, there is considerable variation across countries in the design of taxes on
bank transactions. In the past, the BTTs have generally been introduced as an emergency means
of raising revenue in times of, and in response to, economic crises. In each case the tax was
introduced on a temporary basis, although in some cases it was subsequently extended. Tax rates
have ranged between 0.2 and 2.0 percent, varying widely both across countries and over time.
Moreover, BTTs have not been levied continuously in most countries. The list of taxable financial
transactions also differs across countries. In most cases, only bank debit transactions, including
cheque clearance, withdrawals from ATM outlets and loan repayments are liable for taxation. In
addition, in Argentina 2001-04 and Ecuador 1999-2000, bank credits were also taxed. In Colombia,
only bank credit transactions were taxed during 19992004. In most countries, certain institutions
(e.g., government agencies and charitable organizations) and specific transactions (e.g.,
transactions with the central bank and among different government agencies) are exempted from
taxation. In Argentina (through 1992 and April-December 2001) and Ecuador, a portion of the
BTT liability was creditable against the income or value added taxes.
The taxes in Brazil and Colombia have produced revenues in the range of 0.6 to 1.33 percent of
GDP for ad valorem tax rates in the range of 0.2 to 0.34 percent. This confirms that these taxes do
serve, at least in the short term, their intended function. The performance of the tax in Ecuador in
its first year was exceptionally strong. However, it must be noted that the tax had a broader base,
applying to debits and credits, and that part of the gross revenues were creditable against other
taxes. The taxes imposed in Argentina in 1988 and especially in Peru were significantly less
productive as gauged by the ratio of revenues as a percent of GDP to the average statutory rate.
There is also considerable diversity in what these taxes are called, including bank debit taxes, bank
account debit taxes and financial transaction taxes. However use of the term bank transaction taxes

48
(BTTs) reflects accurately the fact that in several countries both debit and credit operations are
liable to taxation. The table 3.1 gives the experience of the different countries with the BTT.
Baca-Campodónico et. al. (2006) find that in these countries, for a given tax rate on the banking
transactions, revenue declines over time. Therefore, in order to meet a fixed revenue target in real
terms, the tax rate needs to be raised repeatedly. However, they also find that successive increases
in the tax rate erode the tax base by more than they raise revenue and that the higher the increase
in the tax rate, the more and faster the tax base is eroded. They conclude that bank transaction taxes
do not provide a reliable source of revenue, especially over the medium term. Thus, if these taxes
do not provide a reliable source of revenue—their revenue yield declines while distortions
increase—they should be used as a means of raising revenue only in extraordinary situations and
over a short period of time. However this was based on the experience from the countries that have
levied the banking transaction taxes in addition to the existing taxes.
Table 3.1: Tax Rate and Revenue (as %age of GDP) from BTT in Different Countries
Country and
year Tax rate Gross revenue /GDP
Revenue
productivity
Argentina 1989 0.7 0.66 0.94
1990 0.3 0.3 1.00
1991 1.05 0.91 0.87
1992 0.6 0.29 0.48
2001 0.6 1.46 2.43
Brazil
1994 0.25 0.06 0.24
1997 0.2 0.8 4.00
1998 0.2 0.9 4.50
1999 0.22 0.83 3.77
2000 0.34 1.33 3.91
2001 0.36 1.45 4.03
Colombia
1999 0.2 0.73 3.65
2000 0.2 0.6 3.00
2001 0.3
Ecuador
1999 1 3.5 3.50

49
Country and
year Tax rate Gross revenue /GDP
Revenue
productivity
2000 0.8 2.33 2.91
Peru
1990 1.41 0.59 0.42
1991 0.81 0.46 0.57
Venezuela
1994 0.75 1.3 1.73
1999-2000 0.5 1.12 2.24 Source: Coelho, Ebril, and Summers (2001).
Note: Revenue productivity is defined as the revenue to GDP normalized to a tax rate of 1 percent.
While looking at the financial disintermediation38 caused by the BTT, Kirilenko and Perry (2004)
show that on average the introduction of a BTT results in disintermediation of between 4 and 44
cents for every dollar in revenue. According to their estimation, financial disintermediation
reached maximum values of 46 cents in Argentina, 58 cents in Brazil, 64 cents in Colombia, 48
cents in Ecuador, 66 cents in Peru, and 49 cents in Venezuela. These numbers are equivalent to a
loss of over 0.5 percent of GDP to disintermediation. The authors also find that disintermediation
effects tend to cumulate as the taxes remain in place. Arbeláez, Burman and Zuluaga (2002) find
that the BTT increased the cost of credit and led to significant disintermediation. As a result, profits
of financial institutions declined in the short-term by more than the amount of revenue raised by
the government. The authors recommend abolishing the tax. Albuquerque (2003) argues that a
BTT has led to an increase in the cost of government borrowing in Brazil.
Lastrapes and Selgin (1997) investigate the impact of a two-cent cheque tax on the U.S. economy
during the 1930s. They estimate the impact of the tax on the currency-deposit ratio and the money
stock using a vector autoregressive model and monthly data from August 1921 to December 1936.
They show that the tax led to significant disintermediation. As a result, the monetary contraction
in the U.S. during the 1930s is estimated to have been 15 percent higher than it would have been
without the tax. The authors also argue that policymakers were aware of the likely adverse effect
of the tax, and yet deliberately chose to overlook it in order to raise revenue. They present the two-
38 Disintermediation refers to the withdrawal of funds from financial institutions such as banks and savings and loans
associations.

50
cent cheque tax as a typical example of the depression era policies that disregarded the impact of
fiscal measures on monetary and financial outcomes.
The revenue performance of BTTs has been quite diverse. However, BTT productivity- as
measured by the ratio of revenues as a percent of GDP to the average statutory rate- has been on a
declining trend for most countries. In particular, there appears to be a strong negative nonlinear
relationship between revenue productivity and the tax rate. Brazil however appears to be an
exception where revenue productivity remained stable and was not sensitive to rates of tax. An
assessment of the Brazilian experience by Cintra suggests that this could be attributed to higher
financial penetration and a very well developed banking infrastructure.39
Outside Latin America, Australia also had a Bank Account Debits Tax (BADT or BAD) between
1982 and 2005. The BADT was levied on customer withdrawals from bank accounts with a cheque
facility. It started as the federal government tax but later, the power to levy the tax was transferred
to the states in 1990. Norfolk Island did not charge the BADT. The tax was abolished by the states
on dates between 1 July 2002 and 1 July 2005 as part of the reforms for the introduction of the
goods and services tax (GST). The BADT in Australia was levied according to the state where the
bank account was domiciled, not where the account holder lived. Since the tax applied only to
cheque accounts, bank customers could choose not to have a cheque facility to avoid the tax, or
could keep a separate cheque account used only when needing to write a cheque. It also encouraged
alternatives such as paying cash, and processing transactions through offshore financial institutions
or locating most of the accounts in Norfolk Island in Australia, where there was no BADT. Also,
there were reports of errors in the manner in which banks collected BADT- the error was to the
extent of $10 million from 140,000 bank accounts and could not be completely reimbursed40.
39 Brazil has a banking system which is among one of the most developed in the world. It is particularly advanced in
the area of online banking and digital transactions that evolved as a result of addressing challenges of the past and
adoption of innovative policies of social inclusion by the government that depended heavily on the banking system.
Brazil designed its banking structure through the "Banking Reform Law" of 1994 that had adopted the international
best practices in the area of financial institutions. Also, the direct benefit transfer schemes like the Bolsa Familia
encouraged people to be part of the banking infrastructure. With the help of new distribution channels, such as ATM
cards for poor families who never previously had a bank account, the Bolsa Família program could target and reach
out to more people. At the same time increasing level of education and social developments has brought more people
into the banking network. 40 https://en.wikipedia.org/wiki/Bank_account_debits_tax
51
As discussed here the experiences with BTT so far have been in countries where it was
implemented as a revenue raising measure in addition to existing taxes. The proposal for a BTT
however intends for it to be a tax which replaces most other taxes. In the following section an
attempt is made to evaluate the proposal on widely accepted principles of taxation.
3.2. Assessment of the Proposal for Banking Transaction Tax (Feige, Cintra,
and Arthakranti)
Taxes are one of the means by which governments finance their expenditure by imposing charges
on citizens and corporate entities. Taxes have been in existence for ages; however, tax laws have
been changing with time. In recent years, some people including researchers have suggested
improvements in the tax system namely, simplification of the tax code, adoption of banking
transaction tax or taxing consumption instead of earnings. But there is no consensus as to whether
such a shift to an alternative tax regime will stand the scrutiny of taxation principles and score
better.
In case of conflicts or confusion in choosing methods and forms of taxation, the suitability of a tax
system needs to be evaluated on the basis of the broader and acceptable principles of taxation.
These principles are the set of formal guidelines that has evolved over time through discussion and
the experiences, and are widely accepted as guiding principles. Now days, whenever specific tax
laws or amendments are proposed, discussed and implemented they are tested for their suitability
on the basis of these broader guidelines. Among many, the two central principles of taxation relate
to the impact of taxes on efficiency and equity. The first is related to the allocation of resources
whereas the second concerns distribution of income. Other principles of taxation relate to the cost
of operation of the tax system, its flexibility and certainty.
The four Maxims of Taxation by Adam Smith
There is a very long history of the tax system and the set of principles on which those taxes are
justified. We start our discussion on the principles of taxation as mentioned by Adam Smith. Smith
develops four principles of fair taxation (Smith (1776), Chapter 2, Book V). He argued that taxes
should be proportional to how much a person benefits from living in society. He says that there
should be proportionality across levels of income and sources of income such as rent, profit, and
wages. At one point, Smith mentions how having some taxes that fall disproportionately on the

52
wealthy, such as taxes on luxuries, is not so bad. The four maxims of taxation as listed by Smith
is discussed in the following section. It may be noted that even the modern set of principles of
taxation has developed keeping these four maxims at their core. Thus, while discussing the
principles of taxation, it makes sense to start with a discussion of these principles. While Smith
advocates proportionality in the levy of taxes, he also recognises the need to tax the wealthy
through higher taxes on luxury.
“The subjects of every state ought to contribute towards the support of the government, as nearly
as possible, in proportion to their respective abilities; that is, in proportion to the revenue which
they respectively enjoy under the protection of the state.” Smith uses the analogy of a joint venture
to compare taxation to the “expense of management to the joint tenants of a great estate, who are
all obliged to contribute in proportion to their respective interests in the estate.” The discussion on
this maxim is similar to evaluating the tax systems on the principles of vertical or horizontal equity.
Smith‘s second maxim is that the “tax which each individual is bound to pay ought to be certain,
and not arbitrary. The time of payment, the manner of payment, the quantity to be paid, ought all
to be clear and plain to the contributor, and to every other person.” Having known and predictable
taxes allows people to calculate and make better plans. The argument implies that clear rules of
the game encourage more investment, productivity, and innovation. Most of the existing tax
systems announce in advance the taxes to be levied thereby making it easy for the agents in the
economy to plan their business affairs.
Smith‘s third maxim is that taxes ought to be easy and convenient for the taxpayer. That means,
“every tax ought to be levied at the time, or in the manner in which it is most likely convenient for
the contributor to pay it.” The existing tax systems have evolved over time to be easy and
convenient for the people. Technology has helped in designing the tax return forms which are
simple to fill in. Also, with the development of the banking systems it has become more convenient
for the people to pay their taxes.
Smith‘s fourth maxim of good tax policy is limiting deadweight loss: “Every tax ought to be so
contrived as both to take out and to keep out of the pockets of the people as little as possible, over
and above what it brings into the public treasury of the state.” He uses “take out” to refer to money

53
taken from people and “keep out” to refer to unrealized income due to tax burdens, distortions, and
disincentives. This maxim says that the taxes should be least distortionary.
Thus if we look at the four maxims, these prescribe a tax system which takes care of the concerns
of both the taxpayers and the government at the same time while collecting taxes. However these
maxims do not shed light on the alternative role of taxation as a policy tool. Neither do they
consider the issues related to the tax evasion and tax avoidance. Possibly, the issues of evasion and
avoidance are left to the matter of governance in the set of principles of taxation prescribed by the
Adam Smith. However, the evolution of the taxation principles afterwards has looked into all these
aspects.
List of Modern Principles of Taxation
In the literature relating to modern public finance, we find certain broader principles and these are
discussed in the following sections. It should be mentioned here that tax regimes might not satisfy
all of these principles at the same time. Making progress on one principle sometimes might result
in compromising the performance on some other principle. These are the tradeoffs that the policy
makers are expected to consciously make.
Adequacy: taxes should be just-enough to generate revenue required for provision of
essential public services. However, the concept of adequacy is limited by the desire of a
government to finance the services including the public good. The revenue requirement
from the taxes is dependent on the size of the government. Fiscal deficit always puts
pressure on the government to come out with alternative sources of financing. No tax will
ever be adequate to fulfil the unlimited desire to spend by the government. The current tax
system in India has evolved over time as per the revenue requirement and hence cannot be
summarily discarded. A new tax system should also be just-adequate for the limited
government finances. BTT has been implemented by a few economies as a source of
additional revenue in the past for a limited period, but its implementation as a complete
replacement of the existing tax system remains a theoretical idea. As a supplementary tax,
it did not introduce much distortion as it was levied at a very small rate. However, once it
becomes the only tax to be levied then this rate will have to go up to collect adequate
revenue.

54
Feige (2000) argues that the BTT can transfer same amount of revenue to the government
as does the present system and that too at a substantially lower cost without imposing
greater efficiency losses. Arthakranti proposal under the canon of productivity mentions
that the tax should be of such a nature as to yield sufficient income to the government
(5.1.3.5) and claims that BTT can achieve this with a small rate of tax. Under the BTT,
adequacy is proposed to be achieved by levying a small tax on a broader base. The
underlying assumption is that if we consider all the banking transactions as the tax base
then it constitutes a very large base. But the idea of taxing all the banking transactions had
a cautionary note in the literature and even by Cintra. He argues that financial transactions
in the developing economies should be kept outside the base of the BTT. However, if we
keep the financial transactions outside the tax base, it remains to be established that with a
small rate of tax adequate amount of revenue can be generated41. This issue is addressed in
detail in section 3.3.2. Considering the fact that not all transactions in the economy will
be done via banks only, alternatives to the banking transactions will easily emerge to
bypass the BTT. This may take the form of transaction in cash or the vertical integration
in the production units.
Thus, in developing economies, adequacy of revenue with a small rate of BTT remains to be
established. Further, if rates are increased or the base is expanded, the negatives of the system
outweigh the benefits.
Efficiency: Myles (1995), while presenting the arguments about efficiency vs. equity,
states “the use of policy will cause a loss due to resources used in the implementation
process and from the economic distortions that the policy will cause. Minimising these
losses is the efficiency aspect of policy design.” In other words, in the context of tax policy,
efficiency has two components: minimising distortions to market processes which is also
referred to as neutrality, and minimising the cost of compliance and administration.
Taxes are considered neutral when they do not favour any one group or sector over another,
and are not designed to interfere-with or influence individual decision-making. Thus the
term neutrality is used to describe a tax system where differences in incidence of tax do
41 Cintra suggests keeping the financial transactions outside the BTT in the developing economies.
55
not distort consumption decisions or investment decisions of agents namely consumers and
producers.
The other component of efficiency relates to minimising the cost on the agents participating
in the tax system namely the taxpayer and the tax administrator. The cost of compliance
for the taxpayer includes not just the cost associated with filing a return and paying taxes
but also the cost of understanding the tax regime, maintaining requisite documentation and
the like. The cost of collection on the other hand is the cost of running the tax
administration.
BTT is proposed to be a uniform flat tax with low rate and large base without any
concessions and exemptions. However, it is a tax on transaction values. When taxes are
levied on the value of transactions, the effective tax rate as a proportion to value added will
vary considerably across activities. Also, the cascading that results from the existence of
multiple stages of production and distribution would contribute to raising the total tax
liability built into the price of a commodity even in presence of a uniform flat rate of tax.
If the value added in a segment is low, it would result in high tax incidence and agents in
these segments might choose to vertically integrate backward or forward to increase the
value added and thereby reduce the incidence of tax. It could also be argued that if the rates
of tax are perceived to be different across sectors, people might perceive this as a signal to
move to sectors which face a lower incidence of tax. In other words, the proposed
uniformity in tax rates across the economy under the BTT does not translate into uniform
effective tax rates and hence neutrality is difficult to achieve. The extent of distortion would
depend on the rate of tax of BTT as well. In section 3.3.2 we discuss the likely incidence
of BTT under alternative tax rates42. With higher tax rates the incentive to vertically
integrate or to leave the banking system altogether could be higher. The Arthakranti’s
argument that vertical integration is not a serious concern would then be undermined.
In comparison, the existing tax system too is struggling to achieve neutrality. There are
continuous efforts by the policymakers to reduce the deadweight loss caused by the tax
structure. Tax reforms from first point sales tax to VAT and further on to the proposed
42 The analysis in the next section shows that BTT would be revenue neutral only at rates higher than 4%.

56
comprehensive GST are efforts in this direction. Also, technology has led to simplification
of the way people pay their taxes leading to improvement in overall efficiency of the tax
system.
Equity: Tax theory suggests that taxation should be governed by people's ability to pay,
that is, wealthier individuals or firms with greater incomes should pay more in tax while
those with lower incomes should pay comparatively less: vertical equity. Also the taxes
should equally burden all individuals or entities in similar economic circumstances:
horizontal equity. However, at the same time there will be discussion in line with the benefit
principle i.e., taxes paid should be proportionate to the benefits received from publicly
provided services. The existing inequality in the society makes it difficult for the
policymakers to choose a single tax for entire economy which is either in line with the
ability to pay principle or the benefit derived principle.
The equity and fairness of a tax system depends on both the tax base and the tax rate. In
case of the BTT it depends on the tax base which is a transaction. Feige (2000) argues that
transactions are more skewed than the conventional income or the consumption
expenditure. However, the assumption is that all the transactions are part of the tax base
and hence people with higher income will do much larger number of transactions than
those with the lower income. Cintra quotes from a study on Brazil to conclude that BTT is
a proportional tax if not mildly progressive. Other studies on Brazil such as Paes-Bugarin
(2006) and Coelho (2009), however are not unequivocal on this aspect.
While discussing the equity aspect of the BTT under the section Canon of Equity, the
Arthakranti report says that the “Bank Transaction Tax is perfectly in accordance with this
principle - higher the income, higher the total amount transacted, and hence higher the
contribution to the tax collection but with the same rate of taxation”43. However, a closer
scrutiny reveals that it is difficult to achieve the said equity through the proposed BTT.
43 section 5.1.3.1, Arthakranti report

57
In the design of BTT by Cintra (2009), financial transactions were not proposed to be a
part of the tax base especially for developing countries. Even in the Arthakranti report there
is recognition of the fact that transfers between accounts with the same name should be
exempt suggesting thereby that some financial transactions may not be subject to tax. To
understand the equity implications of this proposal let us consider the case of any agent in
the economy. If the tax is imposed on credits into bank accounts alone, then the tax would
proportional to the incomes earned by the individual, if we assume that taxes on credits
from sale of goods and services are passed forward as higher prices to the buyer. Further,
there would be tax on all goods and services consumed by the agent since it has been
assumed that all these taxes are passed forward. The equity implications of this component
of the tax would depend on the differential incidence of cascading across different
commodities and services and the profile of consumption of the individual agent. Here it
should also be kept in mind that the consumption tends to be inversely related to incomes,
i.e., with increase in income, a smaller proportion of income is consumed. On savings, if
the asset purchased is either gold or real estate, the tax would apply instantaneously. On
the other hand if the savings is invested in financial assets, the tax would accrue only when
the asset is disposed of. In other words, the tax liability would depend on the consumption
patterns, the extent of embedded taxes in the commodities and the nature of assets acquired
through savings. If for instance, higher income households invest relatively more in
financial assets, then the incidence of tax in the current period would be lower for these
households/individuals when compared to those who invest in other assets such as gold
and real estate.44 45
In comparison, the present tax regime provides a certain degree of progressivity, since the
goods consumed by the poor are taxed a little less than the rest of the goods and services
44 If the investment in financial assets is taxed on the principle amount but only on the incomes earned from this
investment- such a model is proposed to encourage investment in the economy which is considered especially
important for developing countries – then the liability of tax on agents investing in financial assets would be lower not
just in the present but inter-temporally as well. 45 In order to undertake a more detailed analysis of tax incidence, one needs to work with income consumption survey
data which provides information not just on all income categories in the country but also on the investment assets
chosen by each of the surveyed households. Such data is not available in the Indian context.
58
and income tax is progressive. Thus the equity characteristic of the BTT is difficult to
establish.
Broad Basing: Taxes should be spread over as wide a base as possible. It should expand
to include all sections of the population, or sectors of the economy, so that individual tax
burden is minimised. For a new tax system to be acceptable it needs to create a significantly
larger tax base. This, it is argued, will improve compliance in the economy. The BTT
proposes to expand the tax base since it is supposed to have no exemption. However, in
developing countries Cintra (2009) advocates limiting taxes on financial transactions to
incomes earned through the transactions and not on the transaction value per se. A similar
view is presented by in the Arthakranti proposal as well.
Simplicity/Convenience: There is consensus that the tax system should not be
incomprehensible to the lay person, nor should it appear unjust or unnecessarily complex.
This is to minimize discontent, evasion, avoidance and costs. Tax assessment and
determination should be easy to understand by an average taxpayer. Also, the taxes should
be enforced in a manner that facilitates voluntary compliance to the maximum extent
possible. The proposed tax system under the BTT, however, is argued to be more appealing
for its simplicity compared to the existing tax system.
On the aspect of convenience, the proposed BTT does appear more convenient since the
cost of compliance decreases– the only action required for the tax payer is to undertake all
transactions through the banking system.
Earmarking: In the existing tax system, the tax revenue from a specific source can be
dedicated to a specific purpose only. Earmarking is used as a tool to achieve certain
objectives by the government in the developing economies like India which otherwise
would have been difficult due to limited revenue. The proposed BTT in its original form
does not have scope for such dedicated sources of the revenue.
Restricted exemptions: Exemptions should be avoided in the comprehensive tax system as
more the exemptions, higher will be the tax rate. Also, selective exemptions have cost in
terms of the efficiency loss due to the distortions. Tax exemptions must only be for specific
purpose and for a limited period. However, as soon as exemptions are included in the BTT,
it loses its advantage of a low rate due to reduction in the tax base. The first such exemption,
59
as discussed above, which would have far reaching impact on the tax base, would be the
exemption for transaction values in some of the financial transactions. When such regime
is implemented there will be demand for many more exemptions from different segments
of the economy. For instance, it could be argued that funds donated to charity should not
suffer a tax or that transfers from one family member to another or transfers between friends
on non-commercial terms should not be subject to tax. Incorporating such demands could
make the regime more complex.
• Predictability/Uncertainty: Collection of taxes should reinforce their inevitability and
regularity. While discussing the Canon of Certainty (Section 5.1.3.2, Arthakranti), the
Arthakranti report mentions that with the tax rates fixed and the transactions to which it
applies known, the Bank Transaction Tax provides certainty. There are two elements of
certainty discussed under this principle: one where the taxpayer knows what her tax
liability is and the second, is the certainty of revenue that the government gets. The former
is related to having consistency in tax policy. To the extent there is discretion in the
interpretation of tax policy there arises the possibility that people do not perceive the tax
liability to be certain. In the case of BTT it would appear that there is more certainty. What
however needs to be pointed out is that if there exist or emerge alternative payment
mechanisms that are not covered by the BTT, then individuals or organisations might
choose to move transactions to these modes. To counter this government might then choose
to notify such new payment forms as banking transactions thereby resulting in certain
amount of uncertainty for taxpayers. The second aspect is consistency in revenue to the
government. When the tax is presented as a broad based tax at a very low rate like 2 percent,
it would appear that people would be quite willing to pay the tax and comply with the tax
department. But as shown in later sections, the effective tax rate from a BTT would be
substantially more. So it would be incorrect to assume that there would be no incentive to
evade or avoid the tax. Some of the measures that can be taken to reduce the tax liability
would be to adopt some new forms for financing transactions or to vertically integrate.
Both these measures can reduce the amount of revenue that accrues to the government. It
is a difficult comparison to make between the present regime and the proposed BTT, on
this count.

60
The Arthakranti report has sought to establish the desirability of the BTT regime by discussing two
other canons: canon of elasticity and canon of variety.
Under the canon of elasticity the Arthakranti report says: “every tax imposed by the Government
should be elastic in nature. In other words, the income from the tax should be capable of increase
or decrease according to the requirements of the country.”46 It further adds that since the Bank
Transaction Tax is collected automatically and instantaneously from a wide tax base i.e. bank
transactions, when higher government expenditure is required at the time of emergency or crisis,
it is possible to meet this expenditure with a slight increase in BTT rate.
Elasticity is thus an inherent characteristic of such a not-easily evadable tax. However, this is a
problematic assertion since once again in some of the countries where the tax has been levied, the
productivity has declined over the years and an increase in tax rate tends to induce a larger change
in the behaviour of individuals.
Under the canon of variety the Arthakranti report says: “the tax system should contain a large
variety of taxes on persons as well as commodities. The reason is that if government levies a single
tax, it will become easier for the tax payers to evade it. In a monetized and well-banked economy,
payments for the variety of economic transactions happen through banks. Thus taxing a credit side
of every bank transaction ensures requisite variety. Additionally the Bank Transaction Tax is
collected automatically and instantaneously; it is non-evadable and hence meets the requirement of
this canon.”47However, the concept of a variety of taxes is related not only to all sectors in the
economy being subject to tax but also to the notion that taxes should have different kinds of bases
so that there can be cross verification across taxes and an exemption or preference in one tax does
not necessarily leave any sector or activity completely out of the tax net. In the latter sense, the
BTT actually concentrates the revenues in one instrument and therefore raises the risk to revenue
in case there are any changes in the economic environment and/or in the behaviour of individuals.
It is therefore incorrect to argue that BTT contains a lot of variety.
46 Section 5.1.3.8 of Arthakranti report . 47 Section 5.1.3.9, Arthakranti report.

61
Summary
We have examined the proposed BTT vis a vis the existing system on widely accepted principles
of taxation. Thus, conceptually, the proposed BTT does not emerge as a singularly superior tax on
all parameters. It fails to achieve the extent of equity that we have in the current system. It promises
a broader base for taxes in its design but ends up advocating some exemptions which ultimately
shrink the tax base and takes the shine of BTT away. The BTT scores better in terms of easy
implementation and monitoring through the banks. However, multiple objectives that policy
makers seek to achieve through taxation would not be possible through the original and appealing
version of the BTT.
We also argue that even if the banking system matures enough and then a tax is levied on every
transaction there are chances that some of the transactions would try to bypass the system. In that
event, the proposed system may not be evasion proof. In conclusion, therefore, it would appear
that BTT performs well on some principles but there is no clear superiority in others when
compared to the present regime. It might even appear that in some principles, the present regime
performs better than the proposed regime, suggesting there by that any consideration of the
implementation of such a regime would be based on some tradeoff in the principles.
3.3. Implications of Introducing a BTT
3.3.1 Design of BTT:
The proposed design of the BTT involves a uniform tax on all banking transactions. Two key words
in this concept are “bank” and “transaction”. For the tax to be levied, these terms need to be defined
and at the same time with changes in the economy, these definitions need to be revised. For this
purpose, it is necessary that there be a designated authority who examines the evolution of
institutions and instruments which might serve the purpose of “Bank” and “transaction” so as to
expand the scope of the tax and thus ensure that the effectiveness of the regime remains undiluted.
i. What is a bank: Within the set of financial institutions, there is a subset of institutions
which are formally designated as banks. These institutions have the right to collect deposits
from agents in the economy, which are returnable on call. In India for instance, we have
scheduled commercial banks, cooperative banks, regional rural banks and of late, payment
banks. All of these are allowed to accept deposits which can be retrieved on request and to

62
different degrees, these institutions are allowed to create credit. There is another set of
institutions which accept deposits for long term purposes, like mutual funds and company
deposits. The latter do not offer the facility of withdrawing money at will but with
development in technology, it would be increasingly difficult to differentiate between these
instruments. For instance, in mobile payment apps, the subscriber can deposit money at
will but the withdrawal would take a few days. Would these therefore be called accounts
where money is retrieved on request or not? If these are also to be treated as taxable
transactions, then the definition of transaction as well as the definition of “bank” needs to
be broad enough to include them. If these potential anomalies are not taken into account
there would emerge a number of institutions and a number of instruments which can
perform the functions of a bank, without actually being called a bank. In other words, there
would be possible leakages from the system if this issue of definition is not dealt with and
revisited on a regular basis. For comprehensive coverage, all institutions which accept
deposits of any form should be part of the system.
ii. What is the transaction that should be subject to tax: The Arthakranti proposal suggests
that the credit into bank accounts should be taxed. However, no clear rationale for this
choice is presented. In similar other proposals, other options have been proposed – for
instance, Cintra proposes a tax on both credit and debit while Feige was ambiguous on
which side of the transaction should be taxed. Colabella and Coppinger (1999) on the other
hand proposed a tax on bank debits. Given these differences and in the absence of an
argument on why the tax should be on the credits into bank accounts, in what follows, we
explore both these possibilities to understand whether a case can be built on which side of
the transaction should be taxed.
Broadly, we can think of two transactions an individual agent might engage in, with a bank
– making deposit with the bank and withdrawal of money from the bank. These can also
be called credit and debit. For the levy of the tax, it is essential to determine which kind of
transaction would be subject to the proposed tax. In the literature there is no clear view
articulated on which kind of transaction should be subject to tax. In some of the countries

63
which implemented the BTT, the tax was on withdrawals from bank while in others the tax
was levied on both the transactions.48
One cannot however, rule out differing behavioural responses of the economic agents
depending upon the decision to tax debits or tax credits in a bank account.
The debit side of a normal bank account may broadly consist of the following:
• Payment for personal expenses (Consumption expenditure)
• Payment for investment (Plant, machinery, and others)
• Payment to mutual funds, insurance companies etc. for savings
• Payment for business expenses like purchase of raw material and transport
• Payment of salaries and wages (in case of business)
• Loans and advances
• Payment of interest on loan
• Payment of rent
• Repayment of loan
• Transfer payments (loans/ gifts)
• Distribution of dividends in case of companies
• Payment of taxes/cess/charges
Depending on the incidence of the final tax, if every debit is subjected to tax, it is possible
that people would try to reduce the debits. The easiest way to avoid the tax legally would
be to reduce or postpone the non-essential consumption expenditure. In that event, this may
affect the consumption led growth.
Since repayment of loans will also be subject to the tax, it is obvious that, other things
remaining the same, the cost of borrowing will also go up. This, in turn, is likely to affect
growth in those industries that are dependent on outside finance rather than internal
accruals. Start-ups and tech companies are particularly dependent on external borrowing
for a long period and the introduction of the tax may affect their growth.
48 The Arthakranti Report proposes that the tax should be on the credit to the account.

64
That apart, since there will be no law banning transactions in cash (even if in low
denominations), it is possible that the incidence of payment by cash may actually increase
if the parties to a transaction connive or even if one party is in a dominant position to
impose its will. This may lead to lead to financial disintermediation, a result that has been
observed in the experiments with BTT in Latin American countries (except in the case of
Brazil). This will be the exact opposite of the desired objective to reduce the use of cash in
the economy.
The economic agents will obviously do a cost benefit analysis and in case the cost turns
out to be more under the proposed system, various measures can be undertaken to beat the
system. It is possible that people will shift to quasi currencies to avoid the tax unless the
definition of banks is expanded to plug the use of all such routes (Paytm, Mobikwik and
the like). People may also devise their own quasi currencies (IOU) to stay out of the system.
Considering the prevalence of hawala in India, it will be quite easy to take money out and
settle transactions outside. The use of international debit/credit cards has been observed in
India and the settlement of the transactions can be made outside from funds generated or
kept outside.
What if credits are taxed?
The credit side of a bank account will generally consist of the following:
• Salary/wages/ fees received
• Interest on loans/ advances/ deposits
• Repayment by debtors of the loans/ advances
• Rent from properties
• Dividends from companies
• Proceeds from sale of properties/ investments
• Loans and advances received
• Gifts/ transfer payments received
• DBT from government
• Investments into the business including foreign investment
65
Here also, depending on the final incidence of the tax, there may be attempts to resort to
cash transactions and consequent disintermediation and use of alternate channels as in the
case of debit discussed above.
Since investments will also be taxed and the impact of the proposed tax on the financial
sector is likely to be higher, investment activities including foreign investment is likely to
be adversely affected on account of repeated taxation of such flows. If the proposed tax
increases the cost of borrowing and investments, that is likely to have a dampening effect
on the economy as a whole.
However, since a large chunk of the receipts will be from the government in case of
salaries/ wages and even in case of other credit items, there will be somewhat greater
control of the authorities in ensuring that the payments are effected through the bank
accounts and consequently there may be somewhat lesser probability of financial
disintermediation and resulting leakage of the proposed tax.
Thus both the debit and credit taxation are likely to have some adverse impacts on the
economy. In fact, experience of the tax in Latin American countries apparently show that
there are quite some dead weight losses from the tax ranging from 40 percent in Colombia
to almost 90 percent in Ecuador. It is therefore likely that there will be deadweight losses
here also. Available literature does not suggest which side of taxation will have more of
the same.
One option could therefore be to have the tax on both the credit and debit side and perhaps
at a somewhat lower rate. This is what was done in the securities transactions tax. But in
that case, the problems mentioned earlier may be even compounded.
On balance, therefore, if it is decided to have the tax as proposed as the only tax in lieu of
income tax and other indirect taxes, considering the likely behaviour of the agents, it will,
perhaps be better to tax the credit side since the government will have more control on such
credits.
iii. Would there be any exemptions from the tax: Another important question is would
there be and should there be any exemptions from tax? For instance, it can be argued that

66
transfer of balances from a savings account to an investment account or a fixed deposit
would mean that whichever transaction is taxed, the tax would be levied two times, one
when the investment is made and second when the investment is withdrawn for
consumption. This in turn would mean that to get the same rate of return on investment, the
nominal rate of interest needs to be higher. In other words, the cost of investment might be
higher thereby adversely affecting the potential for growth in the economy. In the context
of financial transactions, since margins tend to be small and there doesn’t exist any
possibility of passing the taxes forward, the number and value of financial transactions
could be significantly impact by the presence of a tax on the transaction values. In the case
of commodity transactions tax in India, it has been documented that even a small tax of
0.01 percent has resulted in a decline in value of transactions by about 50 percent in the
case of gold futures, by 60 percent in copper and crude and about 70 percent in the case of
silver.49 These numbers suggest two things: one, that financial market trades could be very
sensitive to such taxes even at low rates and second, the revenue potential from such a tax
could be very volatile and unreliable source for governments. Another similar tax is in
operation in India: the Securities Transactions Tax (STT). This tax has been criticised on
the ground that it places a high liability of tax in cases where there are frequent or repeated
transactions thereby hindering the process of price discovery which is not useful for healthy
functioning of the market. In literature, Cintra argued that in the interest of encouraging
investment in the economy, especially in developing countries, it would be important to
keep transactions that relate to saving and investment beyond the scope of this tax.
However, in countries where there are such exemptions it is argued that introducing
exemptions will willy-nilly open the gates for an expanded coverage of exemptions thereby
reducing the base that would be available for taxation. It is therefore, important to recognise
that the strength of any proposal on these lines would lie in its ability to have as broad a
base as possible. At the same time, the acceptability of the tax might be impeded by
allowing for the broadest possible coverage.
49 https://thewire.in/103427/time-reconsider-commodities-transaction-tax/
67
3.3.2 What is the Revenue Potential of the Tax:
The Arthakranti report uses three methodologies for determining the revenue neutral rate. The first
method uses information about value of banking transactions from the RBI publication “Payment
System Indicators – Annual Turnover” as an estimate of the taxable base. In the second method,
the report starts with the level of “narrow money”, i.e., the sum of currency with the public and
demand deposits and makes an assumption that 20 percent of this value is used for daily
transactions. Using 300 days in a year, the corresponding annual value of transactions was
computed. The third method uses ASI information on the relation between value added and value
of output to derive the value of output corresponding to the total value added in the economy. To
this is added a correction of 60 percent on account of hitherto unaccounted transactions entering
the formal economy.
Taking the first methodology, there could be two problems: first, there could be double counting
of transactions. For example, when a financial instrument like demand draft is purchased by a
customer, the money will be credited to the issuing bank‘s account. When the demand draft is
presented by the receiver, her account will be credited. In other words, for a single transaction
there are two accounts which receive a credit and can potentially be taxed. This issue is important
even for the design of the tax in as much as it raises the larger question as to whether and which
credits into a bank‘s account are to be taxed. The second issue relates to whether transactions on
government securities too should be subject to tax. If investments in government securities are
subject to tax, the effective rate of return on these securities would be affected. This once again is
a policy issue that needs to be resolved.50
The second methodology arbitrarily assumes that the daily requirement of money in the economy
is 20 percent of the narrow money. This gives us a velocity of money in the economy at 60
(300*0.2). In other words, it is being assumed that money travels over 60 times in a given year.
While estimate by this method produces a rate of BTT very close to that produced by the first
method there is no explanation given on how this 20% was arrived at.
50 It is important to have better comprehension on both the nature and dimensions of different kinds of banking
transactions as well as the scope of transactions to be brought into the BTT regime for assessing the base of the tax
using this methodology.

68
The third methodology uses information from the ASI to determine the ratio of value of output to
value added. As discussed earlier, the National Accounts Statistics provides information on value
of output and value added for all sectors in the economy other than financial services. Adding
across these sectors, for 2014-15, the ratio of value of output to value added is 2.16 as against the
estimate of 6 incorporated in the Arthakranti estimate. Reducing the ratio to 2.16, the estimate of
the base reduces. Similarly, the Arthakranti report uses an assumption of addition to the tax base
of 60 percent of GDP since unaccounted incomes are expected to come within the formal sector.
Changes in these assumptions too would lower the tax base.
In other words, there are strong assumptions within each of the methods used. In addition, the
revenue neutral rate too varies across these methods, raising questions about the conclusions drawn
on revenue neutrality with a very low rate of tax.
Our calculation of the revenue neutral rate does not accord with the Arthakranti analysis. To assess
the revenue performance of the tax, the sum of value of transactions through ECS, NEFT, RTGS
and mobile based transactions is taken. While this constitutes a part of the total base for the
proposed tax, this is an approximation on which data is readily available. Using information for
the year 2015, along with the revenue projections for 2015-1651, table 3.2 shows that the average
tax rate needs to be about 2.8 percent if inter-bank transactions are not subject to tax and about 2.4
percent if inter-bank transactions too are subject to tax. In other words, the proposed regime would
need a tax rate of over 2 percent. The tax rate suggested by the Arthakranti report is 2 percent. If
the proposed regime brings in more transactions into the banking system then the rate of tax of 2
percent might be revenue neutral.
51 For our calculations we consider tax revenue collected by central government and state governments. The
Arthakranti report does its analysis using information of tax revenue for Centre, state as well as total revenue for local
bodies. Since information on local bodies is not available on a year to year basis and local bodies collect relatively
small fraction for the total revenues collected in India therefore this component has not been incorporated into the
analysis.

69
Table 3.2: Rate of Tax for BTT (2015 Data)
Transaction
Value of
transactions Tax rate
(BTT) (Rs billion)
ECS Credit (A) 1303.66
Debit (B) 1849.3
NEFT (C) 75992.04
RTGS
Inter-bank (D) 117201.1
Customer(E) 676959.6
Total (D+E) 794160.6
Mobile based transactions (F) 2862.57
Cheque Clearances(G) 85560
Consumer transactions are
taxed
Credit based (A+C+E+F+G) 842677.8 2.53
Debit based (B+C+E+F+G) 843223.5 2.52
Total (all Transactions are
taxed)
Credit based (A+C+D+E+F+G) 959878.9 2.22
Debit based (B+C+D+E+F+G) 960424.5 2.22
Revenue (2015-16(B.E.)) 21280.73 Source: RBI.
It should be mentioned here that these estimates could be over-estimates to the extent payments by
governments or payments to governments pass through the payment system. Similarly, payments
between two accounts of the same individual or legal entity too would pass through this system
but are not to be taxed in the proposed regime. Further if foreign exchange transactions are carried
out through these channels, further clarity is needed to understand whether such transactions are
intended to be taxed or not. On the other hand, to the extent payments between two accounts in the
same branch are not reflected in this system, there could be some under-estimation as well.
The next question to ask would be which sectors would be paying the tax and how much. To answer
this question, we used information on value of output available in the National Income Accounts.
For all sectors other than the financial sector, National Accounts Statistics provides information
on the total value of output in addition to the value added in the sectors.52
52 For a few sectors, the National Accounts Statistics do not provide information on the value of output. In these cases,
the ratio of value added to value of output from the Input-Output Table for 2006-07 has been used to compute the value
of output corresponding to the reported value added.
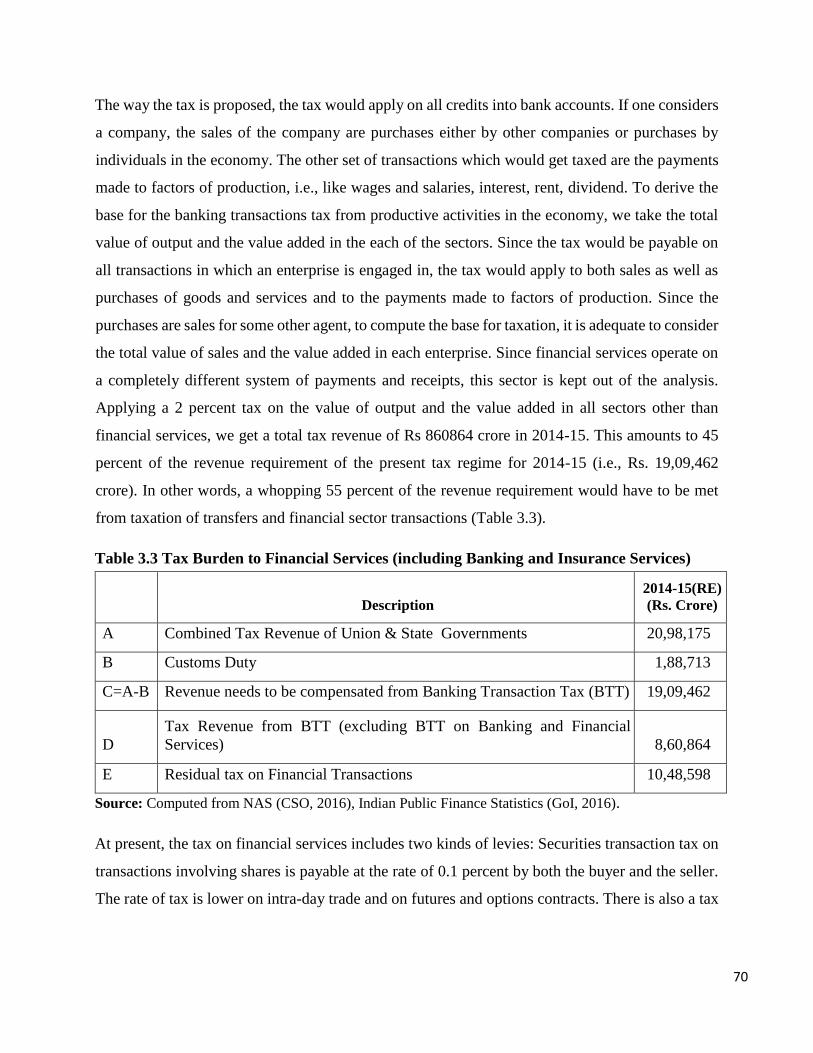
70
The way the tax is proposed, the tax would apply on all credits into bank accounts. If one considers
a company, the sales of the company are purchases either by other companies or purchases by
individuals in the economy. The other set of transactions which would get taxed are the payments
made to factors of production, i.e., like wages and salaries, interest, rent, dividend. To derive the
base for the banking transactions tax from productive activities in the economy, we take the total
value of output and the value added in the each of the sectors. Since the tax would be payable on
all transactions in which an enterprise is engaged in, the tax would apply to both sales as well as
purchases of goods and services and to the payments made to factors of production. Since the
purchases are sales for some other agent, to compute the base for taxation, it is adequate to consider
the total value of sales and the value added in each enterprise. Since financial services operate on
a completely different system of payments and receipts, this sector is kept out of the analysis.
Applying a 2 percent tax on the value of output and the value added in all sectors other than
financial services, we get a total tax revenue of Rs 860864 crore in 2014-15. This amounts to 45
percent of the revenue requirement of the present tax regime for 2014-15 (i.e., Rs. 19,09,462
crore). In other words, a whopping 55 percent of the revenue requirement would have to be met
from taxation of transfers and financial sector transactions (Table 3.3).
Table 3.3 Tax Burden to Financial Services (including Banking and Insurance Services)
Description
2014-15(RE)
(Rs. Crore)
A Combined Tax Revenue of Union & State Governments 20,98,175
B Customs Duty 1,88,713
C=A-B Revenue needs to be compensated from Banking Transaction Tax (BTT) 19,09,462
D
Tax Revenue from BTT (excluding BTT on Banking and Financial
Services) 8,60,864
E Residual tax on Financial Transactions 10,48,598
Source: Computed from NAS (CSO, 2016), Indian Public Finance Statistics (GoI, 2016).
At present, the tax on financial services includes two kinds of levies: Securities transaction tax on
transactions involving shares is payable at the rate of 0.1 percent by both the buyer and the seller.
The rate of tax is lower on intra-day trade and on futures and options contracts. There is also a tax

71
of 15 percent on dividends distributed to shareholders, payable by the company53. On transactions
in the form of bank deposits, a tax is payable only on the interest payment at the applicable rate of
income tax. The tax collected through STT in 2014-15 was Rs 7398 crore. While there is no data
available on the revenue collected from Dividend Distribution Tax, the PwC report on corporate
India for 2008 suggests that dividend distribution tax returns about 10 percent of corporate tax
collections. Using similar ratios for 2014-15, the dividend distribution tax would amount to Rs
4289.24 crore. The interest paid by scheduled commercial banks in 2014-15 was Rs 570135 crore.
If the average rate of tax is 15 percent, the revenue that would be collected from interest income
would be Rs 85520 crore. In other words, the revenue that is collected from the financial sector
would be about Rs 1 lakh crore. In addition the government collects another Rs 1 lakh crore from
stamp duties which are taxes on transfer of property across individuals. The tax rate on transfer of
property is levied at rates of 5-7 percent in most of the states. With a BTT of 2 percent, the revenue
from interest, dividend and property transactions would be lower than at present while the revenue
from sale and purchase of shares can be substantially higher at about 10 times the present
collection. Even with this level, the revenue collection from these sectors would be substantially
lower than the expected revenue from financial services at over Rs 10 lakh crore from a BTT
regime. Further, in the case of financial transactions, it is argued that the value addition is a very
small fraction of the total value of the transaction and hence any tax on the total value of the
transaction could cripple the sector. As per the design suggested by Cintra (2009) in their
respective proposals for a Banking Transaction Tax, capital transactions were to be kept out of the
base. If such a large liability on financial sector is not feasible, then rate of tax on the productive
sectors would have to be higher than the proposed 2 percent. For deriving a similar amount of
revenue, the rate of tax would need to be at least twice the proposed 2 percent, even if one assumes
that the BTT regime can increase the tax liability of financial sector to double its present level.
This would mean a tax of 4 percent on all transactions.
In addition, if there are costs of transferring money from one account to another or from one agent
to another – consider merchant discount rates on debit cards and credit cards or the fees levied to
revert balances from mobile wallets to bank accounts – then the actual cost of the banking
transaction tax to the taxpayer would be at least 1 percent higher than the 4 percent tax derived
53 Effective tax rate comes to 17.647% because if grossing up.

72
above. Some examples of the kinds of charges payable by the users of digital services are
summarised in the Tables 3.4A-C.
Table 3.4A: Transaction Costs with Banking Services for Customers
Service Rate
SMS Sent to Customers
Rs. 15/ per quarter for saving account
Rs. 25/- for current account. (applicable if the
number of SMSs go beyond 5 in a quarter)
Online NEFT Outward Transactions upto Rs.
10,000/
Rs. 2.50/ - per transaction + ST @ applicable
rate
Online NEFT Outward Transactions upto Rs.
10,0000/ Rs. 5/ - per transaction + ST @ applicable rate
Online RTGS Outward Transactions Amounts
above Rs 2 lakh and upto Rs 5 lakh Rs. 5/ - per transaction + ST @ applicable rate
Online RTGS Outward Transactions Amounts
above Rs 5 lakh and above Rs 50-55 + Service Tax + ST@ applicable rate
NEFT & RTGS inward transactions FREE
IMPS upto Rs. 1 lakh Rs. 5/ - per transaction + ST @ applicable rate
IMPS between Rs. 1 to 2 lakh
Rs. 15/ - per transaction + ST @ applicable
rate
USSD (Unstructured Supplementary Service
Data) Max limit Rs. 5000/- Rs. 1.5 /- per transaction
NUUP (National Unified USSD Platform) Max
limit Rs. 5000/- Rs. 1.5 /- per transaction
Debit Cards (Annual Fees)
Rs. 100 to 150 /- per annum (Basic Card)
Rs. 200 to 500/- per annum (Platinum/
Business Card)
Credit Cards (Annual Fees) Rs. 0 to 10000/- Depending the product and
addons. Source: Reserve Bank of India, National Payments Corporation of India and different banks and card
operators.
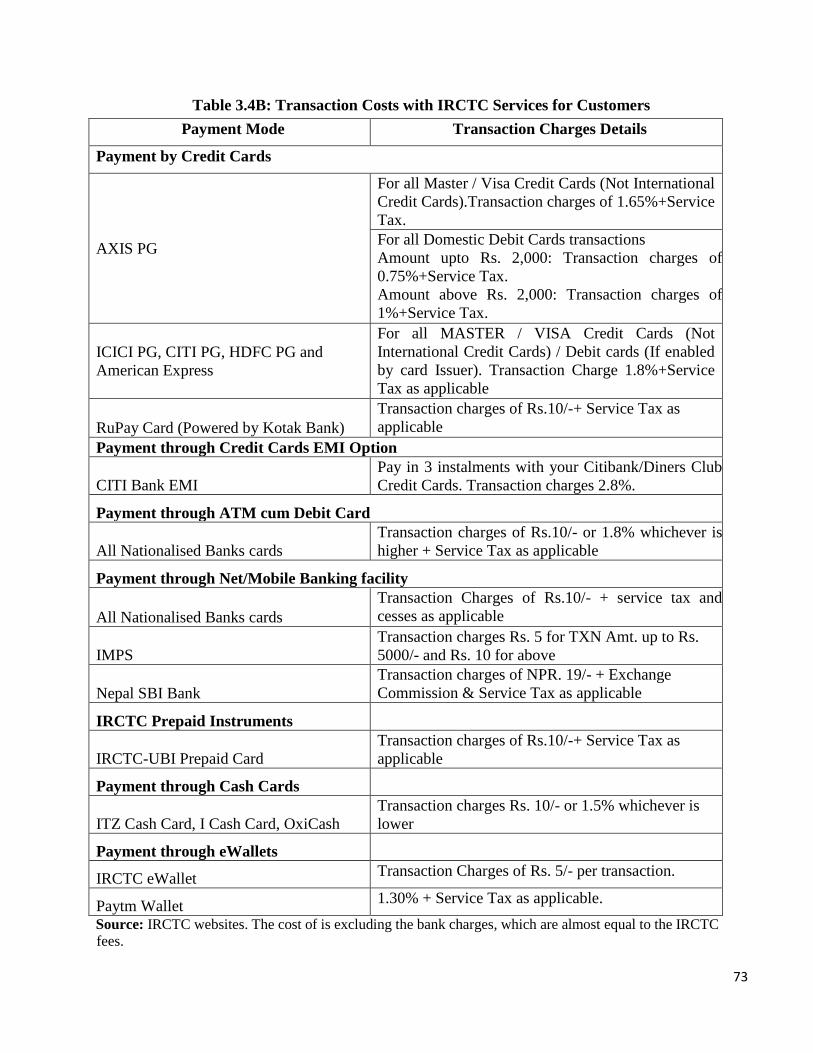
73
Table 3.4B: Transaction Costs with IRCTC Services for Customers
Payment Mode Transaction Charges Details
Payment by Credit Cards
AXIS PG
For all Master / Visa Credit Cards (Not International
Credit Cards).Transaction charges of 1.65%+Service
Tax.
For all Domestic Debit Cards transactions
Amount upto Rs. 2,000: Transaction charges of
0.75%+Service Tax.
Amount above Rs. 2,000: Transaction charges of
1%+Service Tax.
ICICI PG, CITI PG, HDFC PG and
American Express
For all MASTER / VISA Credit Cards (Not
International Credit Cards) / Debit cards (If enabled
by card Issuer). Transaction Charge 1.8%+Service
Tax as applicable
RuPay Card (Powered by Kotak Bank)
Transaction charges of Rs.10/-+ Service Tax as
applicable
Payment through Credit Cards EMI Option
CITI Bank EMI
Pay in 3 instalments with your Citibank/Diners Club
Credit Cards. Transaction charges 2.8%.
Payment through ATM cum Debit Card
All Nationalised Banks cards
Transaction charges of Rs.10/- or 1.8% whichever is
higher + Service Tax as applicable
Payment through Net/Mobile Banking facility
All Nationalised Banks cards
Transaction Charges of Rs.10/- + service tax and
cesses as applicable
IMPS
Transaction charges Rs. 5 for TXN Amt. up to Rs.
5000/- and Rs. 10 for above
Nepal SBI Bank
Transaction charges of NPR. 19/- + Exchange
Commission & Service Tax as applicable
IRCTC Prepaid Instruments
IRCTC-UBI Prepaid Card
Transaction charges of Rs.10/-+ Service Tax as
applicable
Payment through Cash Cards
ITZ Cash Card, I Cash Card, OxiCash
Transaction charges Rs. 10/- or 1.5% whichever is
lower
Payment through eWallets
IRCTC eWallet Transaction Charges of Rs. 5/- per transaction.
Paytm Wallet 1.30% + Service Tax as applicable.
Source: IRCTC websites. The cost of is excluding the bank charges, which are almost equal to the IRCTC
fees.

74
Table 3.4C: Transaction Costs with Banking Services for Businessmen
Different cost Components Transaction Charges Details
Merchant discount rates (MDRs)
0.75 to 1% for debit cards
1.5 to 2 % for other cards
Monthly Service Charge Rs. 150 – 200/- Per Terminal
Annual Maintenance charge Rs. 500 to 750/- Per Terminal
Internet/ Power Charges Depending on the usage and local rates
Source: RBI and Various Bank websites. The values indicate the range.
3.3.3 What is the Incidence of Tax Across Sectors:
The second issue that one can explore is the difference in tax liability across sectors, if one moves
from the present regime to a BTT. For exploring this, two different data sources are used: one,
Annual Survey of Industries which provides information on organised manufacturing and second,
the survey of unincorporated enterprises which provides information on the unorganised sector. In
organised manufacturing, industries face a CenVAT at 12 percent, a state VAT in the range of 5
percent to 15 percent and in addition there would be a tax on profits as well as on wage incomes
generated. There are a number of exemptions and concessions, and in addition, there is the
possibility that companies are not completely compliant. while it is not possible to take into
account all these factors, the chart below presents a comparison of the effective tax rate for the
present regime assuming the effective tax rate is 20 percent for all sectors and a 30 percent tax on
profits and the effective tax rate for BTT regime, with rate of 2 percent and a rate of 4 percent.

75
Figure 3.1 Effective Tax Rate for Organised Manufacturing (as % of GVA)
Source: CSO (2016).
The chart above shows that as compared to the present regime represented by a 20 percent tax on
value added and a 30 percent tax on profits, the BTT regime with 2 percent rate of tax would have
few industry categories which face a higher liability. This number increases somewhat if the rate
of tax is 4 percent. Under a BTT regime with tax rate of 2 percent, 2.56 percent of the value added
in organised manufacturing would be taxed at a rate higher than that in the present regime. In
contrast, if the rate for BTT is 4 percent, the number climbs to 19.
Table 3.5 Share of Industries which would Face Higher Liability under BTT
Tentative tax rate
Share of Value Added which would face
higher liability in BTT
2 % BTT on GVO 2.56
2% BTT on GVO & GVA 2.56
4% BTT on GVO 14.90
4% BTT on GVO & GVA 19.42
Note: If the tax on factor payments is not passed back to the employer of factor inputs,
the scenario would be 2 percent BTT on Gross value of output (GVO). If on the other
hand, the taxes are passed on, then the scenario would be 2 percent BTT on GVO +Gross
value added (GVA).
A similar analysis can be done for the unorganised sector. For this exercise, the unit level data from
survey of unincorporated enterprises of the 67th round survey of National Sample Survey Office
0
5
10
15
20
25
30
35
40
45
500
16
3
10
20
10
61
10
73
10
80
11
04
13
13
13
94
14
30
16
10
16
29
18
11
19
20
20
21
20
30
22
20
23
93
23
99
24
32
25
20
25
99
26
40
26
70
27
31
27
50
28
13
28
17
28
22
28
26
29
30
30
30
30
99
32
20
32
90
33
14
38
11
38
30
58
19
2% BTT on GVO & GVA 4% BTT on GVO & GVA 20% Tax on GVA & 30% Tax on Profit (% of GVA)

76
(NSSO) (NSSO 2012) has been used. 54 The survey captures the unincorporated enterprises
engaged in manufacturing, trading and services. Unlike ASI database, this database is unique as
sample enterprises are mostly unregistered for taxes and operate in the informal system 55 .
Repeating the same exercise as above, table 3.6 reports the effective tax rate for different categories
of economic activities.
For the liability under the BTT, a 2 percent tax is applied on total turnover as well as on value
added. For determining the liability under the present regime, all firms that should have a liability
of state VAT (with turnover above Rs 10 lakh) and all firms which should have a liability of
CenVAT (those with turnover over Rs 1.5 crore) are identified and the standard rate for these taxes
is applied to these firms. For each sector, the sum of liabilities under VAT and CenVAT are taken
together to determine the total liability under the old regime. From the data, it is clear that there
are hardly any firms which would have incomes above the exemption threshold and hence the
income tax liability is taken to be zero. The effective tax rates with BTT of 2 percent, BTT of 4
percent and the present regime are presented in the table 3.5. The results are similar to that obtained
from an analysis of organised manufacturing.
Table 3.6: Effective Tax for Unorganised Manufacturing (as % of value added)
Activity
Code Activity description
2% BTT
on GVO
2% BTT
on GVO
& GVA
Present
regime
M1 Cotton ginning, cleaning and bailing 29.7 31.7 21.6
M2 Manufacture of food products 10.0 12.0 12.1
M3 Manufacture of beverages 4.3 6.3 9.5
M4 Manufacture of tobacco products 8.0 10.0 7.7
M5 Manufacture of textiles 5.6 7.6 8.7
M6 Manufacture of wearing apparel 3.3 5.3 3.3
M7 Manufacture of leather and related products 4.7 6.7 7.9
M8
Manufacture of wood and products of wood
and cork, except furniture; manufacture of
articles of straw and plaiting materials
5.7 7.7 7.6
M9 Manufacture of paper and paper products 7.7 9.7 21.0
54 According to NSSO (2012), unincorporated enterprises imply not registered under the Companies Act, 1956. Further
the domain of ‗unincorporated enterprises‘ excluded (a) enterprises registered under Sections 2m(i) and 2m(ii)
of the Factories Act, 1948 or bidi and cigar manufacturing enterprises registered under bidi and cigar workers
(condition of employment) Act, 1966, (b) government/public sector enterprises and (c) cooperatives. Thus the
coverage was restricted primarily to all household proprietary and partnership enterprises. In addition, Self Help groups
(SHGs), Private Non-Profit institutions (NPIs) including Non-Profit Institutions Serving Households (NPISH) and
Trusts. 55 For detailed analysis of indirect tax compliance in these units see Mukherjee and Rao (2015).

77
Activity
Code Activity description
2% BTT
on GVO
2% BTT
on GVO
& GVA
Present
regime
M10 Printing and reproduction of recorded media 5.6 7.6 12.3
M11 Manufacture of coke and refined petroleum
products 11.0 13.0 11.2
M12 Manufacture of chemicals and chemical
products 14.6 16.6 15.8
M13 Manufacture of pharmaceuticals, medicinal
chemical and botanical products 9.6 11.6 24.5
M14 Manufacture of rubber and plastics products 9.3 11.3 20.7
M15 Manufacture of other non-metallic mineral
products 5.2 7.2 17.9
M16 Manufacture of basic metals 9.0 11.0 19.6
M17 Manufacture of fabricated metal products,
except machinery and equipment 5.9 7.9 10.6
M18 Manufacture of computer, electronic and
optical products 11.7 13.7 19.3
M19 Manufacture of electrical equipment 7.9 9.9 17.5
M20 Manufacture of machinery & equipment n.e.c. 7.6 9.6 18.6
M21 Manufacture of motor vehicles, trailers and
semi-trailers 8.3 10.3 18.6
M22 Manufacture of other transport equipment 9.4 11.4 18.4
M23 Manufacture of furniture 5.9 7.9 8.0
M24 Other manufacturing 6.5 8.5 11.0
M25 Repair and installation of machinery and
equipment 3.8 5.8 4.6
T1 Trade & repair of motor vehicles & motor
cycles 13.4 15.4 14.5
T3 Other wholesale trade 27.6 29.6 24.9
T4 Other retail trade 18.1 20.1 15.1
S2 Food service activities 212.1 214.1 150.0
S3 Land transport 1,049.3 1,051.3 924.5
S5 Warehousing and storage 257.5 259.5 566.0
S7 Information and Communication 142.2 144.2 255.0
S8 Financial service activities except insurance
and pension funding 5.8 7.8 16.4
S9 Other financial activities 306.5 308.5 1,215.5
S10 Real estate activities 576.4 578.4 1,837.7
S11 Professional, Scientific & Technical activities 674.4 676.4 6,862.1
S12 Administrative and support service activities 183.1 185.1 219.2
S13 Education 1,225.5 1,227.5 4,132.1
S14 Human Health and Social work 226.8 228.8 717.2
S15 Other community, social and personal service
activities 53.9 55.9 30.8
ALL ACTIVITIES 16.4 18.4 22.7
Note: There are a number of sectors with very high tax rates – this happens because the value addition
is very small as compared to the turnover of these activities.
78
In other words, the analysis above indicates that the effective liability of tax under BTT is not
consistently below that in the present regime. While this is intuitive since the reform should be
revenue neutral and if a few sectors are expected to pay less some other sectors should be paying
more, the fact that some sectors might have to pay more would mean that there could be some
resistance to the change.
Here it is useful to examine the claim presented in Cintra (2009) that suggests that BTT would
result in lower tax incidence on all sectors of the economy and at the same time generate more
revenue. Cintra undertakes an extensive analysis of tax incidence both under the proposed BTT
regime and the existing regime of indirect taxes for Brazil. He uses the Input Output table to derive
the tax incidence across 110 sectors of Brazil. The analysis is used to conclude that
• at a low rate of 2.81 percent tax, the incidence of tax under the BTT regime is considerably
lower than that in the present regime for all the sectors in the economy
• even at this low rate of tax of 2.81 percent, the system generates 27 percent of GDP as tax
revenue in comparison to a little over 10 percent generated by the present tax regime.
There are two difficulties with the analysis: first, the author derives the rate of 5.62 percent by
determining the tax base from the revenues collected from the CPMF, (the BTT implemented in
Brazil) and computing the rate of tax required to generate the same revenue as all the taxes to be
subsumed in the proposed BTT produce, i.e., 27 percent of GDP. Since he proposes that the tax
would be on both debit and credit, the rate of tax would be halved to give 2.81 percent. In the
discussion on the methodology adopted, the analysis does not reflect the fact that the rate of tax is
applied on both sides of the transaction. It is therefore reasonable to assume that the rate applied
in the analysis is the stated rate of 2.81 percent and not the revenue neutral rate of 5.62 percent.
To derive the incidence of tax on a sector, one can either assume that the tax is passed on to the
next link in the chain of transactions or that it is borne by the agent paying the tax. In the former
case, the tax would be applicable at 5.62 percent on each transaction and not at the rate of 2.81
percent. On the other hand, if the tax is not passed forward, the incomes of all segments of the
economy would be compressed by that extent. While the compression might happen for a few
sectors, it would not be correct to assume that all sectors will suffer the incidence of tax and not
be able to pass it forward. Working therefore on the assumption that the taxes are passed forward,
the rate of tax on transactions should be 5.62 percent. In other words, the incidence of tax would

79
be double that reported in Table 12 of Cintra (2009) and in a comparison with the incidence of tax
under the present indirect tax regime, the BTT regime shows up a lower incidence in 55 sectors
and a higher incidence in 54 sectors.
The second difficulty relates to ensuring that the revenue estimates from the CPMF revenues and
those from the Input Output table are consistent with each other. For instance, the banking
transaction tax should apply not just on GDP producing activities but also on a range of transfers.
This would suggest a lower average incidence of tax on GDP producing activities which is not
reflected in the table 3.7.
Table 3.7 Cintra’s Computation of Tax Incidence: Corrected Table
S.No. Sector Single tax
Traditional
tax
Single tax
corrected double
incidence for
1 Rice 16.26 31.2 32.52
2 Corn 15.21 32.46 30.42
3 Wheat and other cereals 16.59 33.89 33.18
4 Sugar cane 16.97 34.51 33.94
5 Soybean 16.49 34.04 32.98
6 Other agricultural products 14.57 32.07 29.14
7 Manioc 15.07 32.66 30.14
8 Tobacco 16.86 52.01 33.72
9 Cotton 16.1 33.65 32.2
10 Citric fruits 16.65 34.2 33.3
11 Coffee 16.74 31.66 33.48
12 Forest products 14.87 32.01 29.74
13 Cattle and other live animals 17.68 34.04 35.36
14 Cow milk 17.76 28.69 35.52
15 Live pig 17.98 34.33 35.96
16 Live Poultry 17.86 34.12 35.72
17 Chicken eggs 15.05 29.22 30.1
18 Fish 17.63 28.53 35.26
19 Oil and natural gas 15.11 30.22 30.22
20 Iron ore 18.23 35.98 36.46
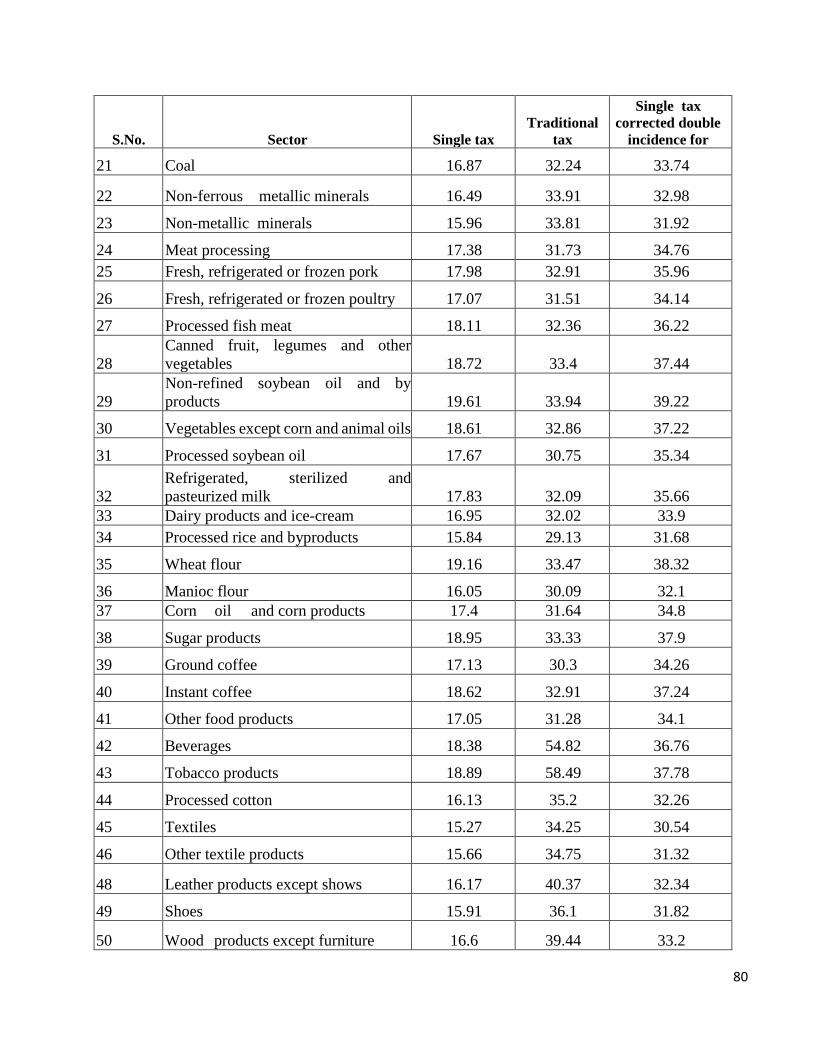
80
S.No. Sector Single tax
Traditional
tax
Single tax
corrected double
incidence for
21 Coal 16.87 32.24 33.74
22 Non-ferrous metallic minerals 16.49 33.91 32.98
23 Non-metallic minerals 15.96 33.81 31.92
24 Meat processing 17.38 31.73 34.76
25 Fresh, refrigerated or frozen pork 17.98 32.91 35.96
26 Fresh, refrigerated or frozen poultry 17.07 31.51 34.14
27 Processed fish meat 18.11 32.36 36.22
28
Canned fruit, legumes and other
vegetables 18.72 33.4 37.44
29
Non-refined soybean oil and by
products 19.61 33.94 39.22
30 Vegetables except corn and animal oils 18.61 32.86 37.22
31 Processed soybean oil 17.67 30.75 35.34
32
Refrigerated, sterilized and
pasteurized milk 17.83 32.09 35.66
33 Dairy products and ice-cream 16.95 32.02 33.9
34 Processed rice and byproducts 15.84 29.13 31.68
35 Wheat flour 19.16 33.47 38.32
36 Manioc flour 16.05 30.09 32.1
37 Corn oil and corn products 17.4 31.64 34.8
38 Sugar products 18.95 33.33 37.9
39 Ground coffee 17.13 30.3 34.26
40 Instant coffee 18.62 32.91 37.24
41 Other food products 17.05 31.28 34.1
42 Beverages 18.38 54.82 36.76
43 Tobacco products 18.89 58.49 37.78
44 Processed cotton 16.13 35.2 32.26
45 Textiles 15.27 34.25 30.54
46 Other textile products 15.66 34.75 31.32
48 Leather products except shows 16.17 40.37 32.34
49 Shoes 15.91 36.1 31.82
50 Wood products except furniture 16.6 39.44 33.2

81
S.No. Sector Single tax
Traditional
tax
Single tax
corrected double
incidence for
51 Cellulose and other paper inputs 16.97 34.39 33.94
52 Paper cardboard and packaging 15.58 37.93 31.16
53
Newspapers, magazines and sound
recordings 13.84 26.25 27.68
54 Liquefied oil gas 17.28 30.31 34.56
55 Gasoline 20.35 35.12 40.7
56 Gas alcohol 16.87 30.99 33.74
57 Heating oil 18.83 31.92 37.66
58 Diesel oil 17.49 29.23 34.98
59 Other oil products 17.1 29.71 34.2
60 Alcohol 18.07 33.27 36.14
61 Inorganic chemical products 14.95 30.36 29.9
62 Organic chemical products 14.13 27.75 28.26
63 Resin and elastomer 14.25 29.67 28.5
64 Pharmaceutical products 12.29 31.35 24.58
65 Pesticides 15.78 32.81 31.56
66
Perfumery, soaps and cleaning
products 15.76 47.95 31.52
67 Paints, varnish, enamels and lacquers 15.71 34.35 31.42
68 Other chemical products 14.83 38.5 29.66
69 Rubber products 15.79 37.21 31.58
70 Plastic products 15.39 34.11 30.78
71 Cement 16.86 34.33 33.72
72 Other non-metallic mineral products 16.37 34.82 32.74
73 Pig iron 17.8 38.77 35.6
74
Semi-finished rolled steel and steel
tubes 16.53 36.49 33.06
75 Non-ferrous metallic products 16.65 32.28 33.3
76 Cast steel 18.32 35.85 36.64
77
Metal products-except machinery and
equipment 15.83 37.38 31.66
78 Machinery and equipment 15.59 31.96 31.18
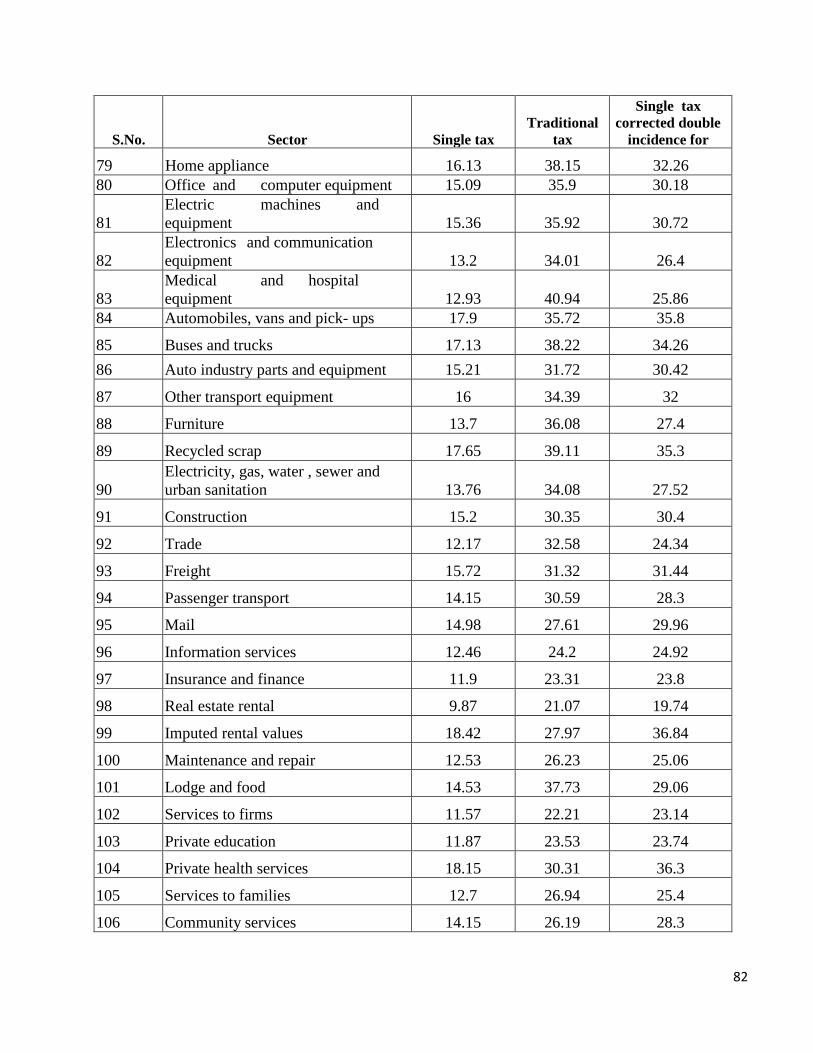
82
S.No. Sector Single tax
Traditional
tax
Single tax
corrected double
incidence for
79 Home appliance 16.13 38.15 32.26
80 Office and computer equipment 15.09 35.9 30.18
81
Electric machines and
equipment 15.36 35.92 30.72
82
Electronics and communication
equipment 13.2 34.01 26.4
83
Medical and hospital
equipment 12.93 40.94 25.86
84 Automobiles, vans and pick- ups 17.9 35.72 35.8
85 Buses and trucks 17.13 38.22 34.26
86 Auto industry parts and equipment 15.21 31.72 30.42
87 Other transport equipment 16 34.39 32
88 Furniture 13.7 36.08 27.4
89 Recycled scrap 17.65 39.11 35.3
90
Electricity, gas, water , sewer and
urban sanitation 13.76 34.08 27.52
91 Construction 15.2 30.35 30.4
92 Trade 12.17 32.58 24.34
93 Freight 15.72 31.32 31.44
94 Passenger transport 14.15 30.59 28.3
95 Mail 14.98 27.61 29.96
96 Information services 12.46 24.2 24.92
97 Insurance and finance 11.9 23.31 23.8
98 Real estate rental 9.87 21.07 19.74
99 Imputed rental values 18.42 27.97 36.84
100 Maintenance and repair 12.53 26.23 25.06
101 Lodge and food 14.53 37.73 29.06
102 Services to firms 11.57 22.21 23.14
103 Private education 11.87 23.53 23.74
104 Private health services 18.15 30.31 36.3
105 Services to families 12.7 26.94 25.4
106 Community services 14.15 26.19 28.3

83
S.No. Sector Single tax
Traditional
tax
Single tax
corrected double
incidence for
107 Domestic services 18.62 30.89 37.24
108 Public education 18.42 29.48 36.84
109 Public health care 17.49 28.01 34.98
110
Government and social
security 17.53 26.24 35.06 Source: Cintra (2009).
3.3.4 What are the Likely Implications on the Economy of Introducing the Tax?:
The proposed change in the tax regime would alter the structure of taxes in the country. It is
therefore important to explore what the likely impacts on the economy might be. The major change
would be to conceptually move from the taxation of value added in the economy56 – to a tax on
transaction values. Clearly, transaction values would be considerably higher than value added
corresponding to any transaction and this would allow for the levy of the tax at a lower rate as
compared to a tax on value added. These are akin to turnover taxes that used to be levied in many
countries before VAT regimes were introduced. However, there are reasons why countries across
the world choose to move from taxes on value of output to taxes on value added – the underlying
reason is cascading of taxes. This, it is argued would lead to distortions in economic decision
making by for instance encouraging vertical integration. This could affect our global
competitiveness as well. The first issue to explore therefore is whether there would be cascading
in the new regime. The second issue to explore is how this tax stands on the principle of neutrality,
when compared to the present system of taxation. The third issue to assess is the likely impact on
saving and investment decisions. The next issue would be to explore whether with the introduction
of the tax, there would added incentives within the economy to utilise alternatives to the official
currency. These issues are explored in some detail in this section.
1. Cascading taxes: As argued above, introduction of BTT would mean a tax on all
transactions. To get a sense of the extent to which this tax would cascade, we use the input-
56 Even income tax is a tax on value added in the economy although it is levied and collected after the value added is
distributed as factor incomes.
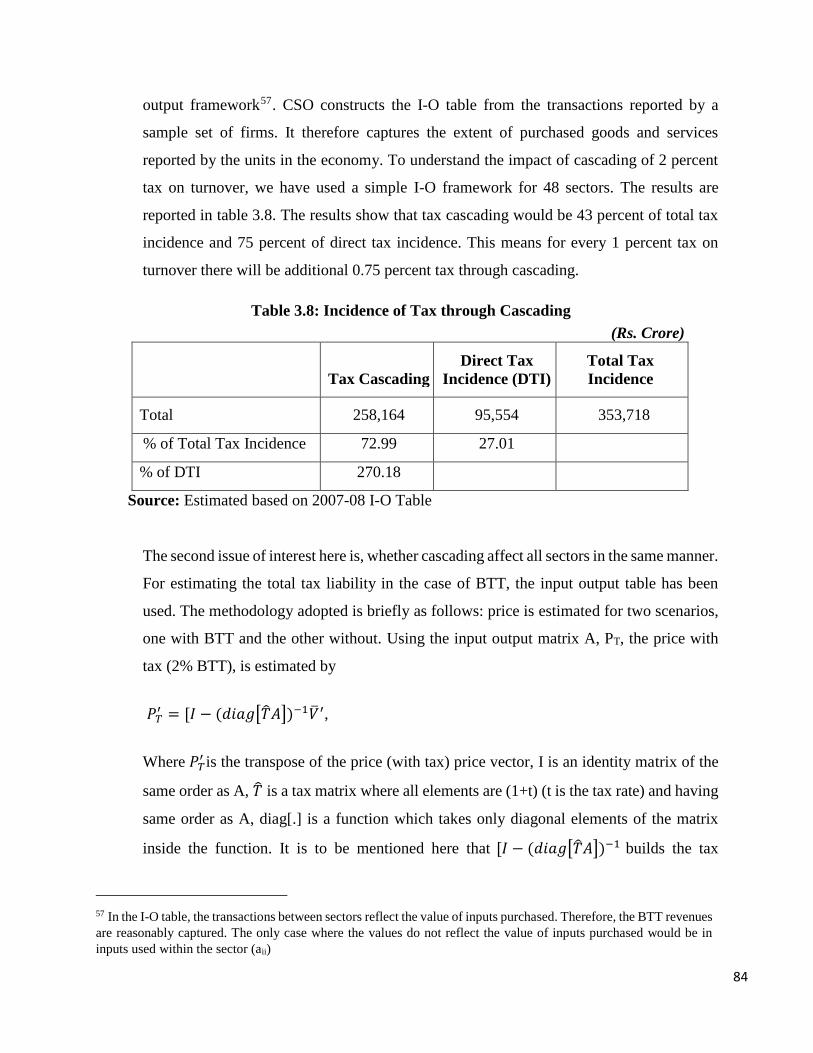
84
output framework57. CSO constructs the I-O table from the transactions reported by a
sample set of firms. It therefore captures the extent of purchased goods and services
reported by the units in the economy. To understand the impact of cascading of 2 percent
tax on turnover, we have used a simple I-O framework for 48 sectors. The results are
reported in table 3.8. The results show that tax cascading would be 43 percent of total tax
incidence and 75 percent of direct tax incidence. This means for every 1 percent tax on
turnover there will be additional 0.75 percent tax through cascading.
Table 3.8: Incidence of Tax through Cascading
(Rs. Crore)
Tax Cascading
Direct Tax
Incidence (DTI)
Total Tax
Incidence
Total 258,164 95,554 353,718
% of Total Tax Incidence 72.99 27.01
% of DTI 270.18
Source: Estimated based on 2007-08 I-O Table
The second issue of interest here is, whether cascading affect all sectors in the same manner.
For estimating the total tax liability in the case of BTT, the input output table has been
used. The methodology adopted is briefly as follows: price is estimated for two scenarios,
one with BTT and the other without. Using the input output matrix A, PT, the price with
tax (2% BTT), is estimated by
𝑃𝑇′ = [𝐼 − (𝑑𝑖𝑎𝑔[�̂�𝐴])−1�̅�′,
Where 𝑃𝑇′ is the transpose of the price (with tax) price vector, I is an identity matrix of the
same order as A, �̂� is a tax matrix where all elements are (1+t) (t is the tax rate) and having
same order as A, diag[.] is a function which takes only diagonal elements of the matrix
inside the function. It is to be mentioned here that [𝐼 − (𝑑𝑖𝑎𝑔[�̂�𝐴])−1 builds the tax
57 In the I-O table, the transactions between sectors reflect the value of inputs purchased. Therefore, the BTT revenues
are reasonably captured. The only case where the values do not reflect the value of inputs purchased would be in
inputs used within the sector (aii)

85
corresponding to inputs. �̅�′ is transpose of value added vector where all elements are
multiplied by (1+t). It builds the tax corresponding to value added.
P0 is the price without tax, and it is estimated by setting t=0 in the above equation. Tax
Cascading is estimated across sectors by [((1+𝑡)𝑃𝑇
′
𝑃0− 1) ∗ 100], where all prices are
multiplied by (1+t) to get (1 + 𝑡)𝑃𝑇′ which is the tax corresponding to sales.
Table 3.9 shows the percentage change in price using this methodology. The number
reported in each row shows the total tax liability from the regime on that sector. Since the
final tax would be 2 percentage points on all transactions – the rest of the tax incidence is
attributable to cascading of taxes from other stages in the production process. The numbers
in the table highlight the fact that there is considerable variation in the total tax incidence
across sectors with the rates going as high 13.8 percent. These rates would lower than those
in the present regime, for a number of sectors and the new regime might appear to be more
attractive for all agents who face a lower tax liability. For agents who were not paying taxes
in the existing regime, it is an open question whether the lower rates of tax would be
adequate to bring them into the system or not.58
Table 3.9: Sector-wise Incidence of BTT and Cascading
Sector Sl
No. Sector Description
Tax
Cascading
(%)
1 Crops and livestock products (including fishing) 5.24
2 Forestry and logging 4.40
3 Coal and lignite (including coal tar products) 5.25
4 Natural gas 4.48
5 Crude petroleum 4.87
6 Metallic minerals 4.43
7 Non-metallic minerals 4.41
8 Food products & beverages (including edible vegetable oils) 21.29
9 Tobacco products 5.95
10 Textiles (including apparels) 10.72
11 Furniture and fixtures-wooden 7.29
58 This way of estimating the effects of a tax does not measure the overall impact of the change on the economy. To
explore this aspect further, a general equilibrium approach would be more useful. However, such a model to analyse
sectoral and overall impacts is not readily available in the Indian context.

86
Sector Sl
No. Sector Description
Tax
Cascading
(%)
12 Wood and wood products (excluding furniture) 7.51
13 Paper, paper prods. & newsprint 10.17
14 Printing and publishing 9.27
15 Leather products (including footwear) 9.81
16 Rubber and plastic products 10.05
17 Petroleum products 14.38
18 Chemicals 10.84
19 Non-metallic mineral products (including cement) 8.05
20 Ferrous and non-ferrous basic metals 10.30
21 Metal products (excluding machinery) 10.13
22 Machinery and machine tools (including tractors & agri.
implements) 10.56
23 Electrical machinery & appliances 11.18
24 Electronic and communication equipments 11.83
25 All transport equipments (excluding motor vehicles other than 2
wheelers) 11.54
26 Motor vehicles 13.81
27 Medical, precision & optical instruments including watches &
clocks) 8.02
28 Jems & Jewelry, misc. manufacturing 10.56
29 Construction 7.51
30 Electricity 7.12
31 Water supply 5.58
32 Railway transport services 5.40
33 Land transport (including via pipeline) 6.85
34 Water transport 5.45
35 Air transport 6.35
36 Supporting and aux. transport activities (including storage &
warehousing) 5.80
37 Communication 4.69
38 Trade 4.54
39 Hotels and restaurants 8.41
40 Banking and insurance 4.48
41 Ownership of dwellings 4.14
42 Education & research, medical & health, public administration 4.31
43 Business services 5.91
44 Computer & related activities 4.76
45 Legal services 4.51
46 Real estate activities 4.78
47 Renting of machinery & equipment 4.73
48 Other commercial, social and personal services, other services 4.73 Source: Estimated based on 2007-08 I-O table.

87
The other aspect that needs to be taken into account is the impact on exports and the
competitiveness of domestic products with respect to imports. As per the agreements within
the WTO, while any taxes that are built into the price of a good being exported out of the
economy is not considered an incentive, any payments which are made on any basis other
than an estimate of taxes embedded are considered incentives which can be neutralised by
the importing country by way of counter-veiling duties. In a VAT regime, it is possible to
identify the taxes paid towards the manufacturing and supply of the good being exported.
A refund of these taxes would therefore be enough to neutralise the impact and these
refunds are not considered incentives. However, if one shifts to a BTT, there would arise
difficulties in defining or estimating the amount of taxes that should be refunded. Cintra
(2009) suggests that the way around this problem is to construct elaborate I-O tables which
can then be used for estimating the taxes embedded. However, the process of constructing
I-O tables means that these tables usually come with a significant lag – in India, the latest
available table relates to 2007-08 which makes it over 7 years old. Further, there is
difficulty in identifying the coefficients of the I-O matrix when one has a cascading regime,
since only the taxes at the penultimate stage and the ultimate stage are perceived by the
units which are surveyed to construct the tables. These can constitute a reasonable basis for
academic studies but may not be reliable enough to base the computation of tax refunds on.
In the absence of a suitable and acceptable mechanism for correcting for inbuilt taxes, the
exports might be adversely affected. Similarly, there could exist adverse impact on
domestic production since to ensure a level playing field, the government would have to
levy import duties in line with the taxes faced by the domestic industry.
2. Neutrality of BTT: One of the principles of taxation, as mentioned earlier, is neutrality.
The term neutrality is used to describe a tax system where differences in incidence of tax
do not distort consumption decisions or investment decisions of agents. Given that we are
taking about both consumers and investors, there are two possible ways of looking at tax
incidence: one way is to look at the tax incidence for any given stage of production or
supply and the other way is to look at the total incidence of tax built into the price of a
commodity. The former would focus on the investor while the latter would focus on the
consumer. Using the first approach, the incidence of tax would be related to the extent of

88
value addition at that stage. For instance, if one compares two industries one with a high
share of value added in value of output and the other with a low share of value added in
value of output. The same tax of 2 percent on value of output would translate into different
levels of tax on value added, suggesting thereby that one activity might be perceived to be
more highly taxed than the other. Table and chart in the preceding section shows a
comparison of the effective tax rates for different segments of the economy. Table 3.10
presents a summary of the results for ASI units. These tables highlight the fact that although
the announced tax rate is a uniform 2 percent for the entire economy, its impact can be
significantly different across sectors. The incidence as measured by the second approach is
affected by the number of steps in the process of production and distribution of a
commodity – the cascading that results from the existence of multiple stages of production
and distribution would contribute to raising the total tax liability built into the price of a
commodity. This aspect was explored in the subsection on cascading. The analysis once
again demonstrates that while there is a uniform rate of tax at 2 percent, the effective rate
of tax varies across sectors. In other words, the proposed uniformity in tax rates across the
economy does not translate into uniform effective tax rates and hence the claim to neutrality
is not upheld.
Table 3.10 Transaction tax as Percentage of GVA – Annual Survey of Industries: 2013-14
2% BTT on GVO Share in ASI Total GVA Average GVA/TO
< 7 % 12.52 40.49
7-12 % 53.25 21.34
12-17 % 16.14 14.39
17-22 % 14.68 10.33
22-27 % 1.67 8.40
27-32 % 1.06 6.60
32% and Above 0.67 3.00
All 100.00 22.03
Source: computed using CSO (2016).
The analysis above suggests that the effective rate of tax on different segments of the
economy would be different. It is an open question whether this would distort people‘s
decisions in the economy. For instance, if the value added in a segment is low, it would
89
perceive a high tax incidence and might choose to vertically integrate backward or forward
to increase the value added and hence reduce the incidence of tax. It could also be argued
that if the rates of tax are perceived to be different across sectors, people might move to
sectors which face a lower incidence of tax. The magnitude of this response however cannot
be measured easily.
3. Distortions in saving and investment decisions: Arthakranti‘s Banking Transaction Tax
does not propose any exemptions from the tax. In other words, all transactions including
inter-personal transfers for non-economic reasons too are to be subject to a tax. This means
that all savings which are routed into any instrument whether it is a physical instrument or
a financial instrument would be subject to tax. Consider an agent who saves Rs 1000 and
invests in a bond. At the time of investment, the value of the investment would be Rs 980
because of the BTT. In subsequent years, the effective rate of return on the investment
would be lower than the stated rate since there would be a tax on the interest income earned
from the bond. In other words, the return to investment would be lower and to get the same
amount of return, the asset would need to be held for a much longer period. In the literature
on proposing the efficacy of the Banking Transaction Tax, Cintra (2009) discuss these
difficulties and therefore suggest that investment should not be subject to tax. In countries
like Brazil, ring-fenced accounts were created where movement from one asset to another
did not attract a tax – the tax was only payable if it left the set of investment instruments.
If this modification is not undertaken, there could be distortions in the saving investment
decision and if these modifications are undertaken, it would open the possibility of
constructing a variety of instruments which mimic the properties of an investment asset but
serve the purpose of financing consumption expenditure.
4. Could currency substitutes emerge: The tax system proposed depends on the bulk of the
transactions passing through the banking channel. As established above, the actual liability
of tax is not a small 2 percent of the value added in any given activity. Therefore, there
would remain some incentive to attempt to evade or avoid the tax. One such mechanism
would be through the use of cash as a basis for transactions through financial
disintermediation or through the evolution of new alternative payment methods that might
not be covered by the definition of bank or banking transactions. Within the global financial

90
system, there are a number of innovations in instruments to be used as money. At one
extreme, one has a variety of crypto-currencies such as bitcoins, litecoins and so on. These
don‘t have a tangible form. They are can be used for purchase of goods and services.
Transactions mediated by crypto currencies will remain out of the purview of banking
system and hence of the BTT. The scope and spread of these currencies however is rather
limited at present. There is a limit on the amount of currency that can be issued in these
forms.
Turning to another alternative mechanism to bypass the banking system would be to
develop a system of substitute currencies. These could be hyper local currencies which are
emerging in a number of developed countries to encourage a closer relation between the
local people and the local businesses. Some examples are Ithaca hours, Brixton Pounds,
Berkshares and Equal Dollars. These are sometimes exchanged for the official currency at
a fixed exchange rate and used only for local transactions within the community. The
advantage of these currency substitutes is that there is an increased demand for the local
products. In terms of the present discussion, these forms of currency once again will keep
transactions out of the banking system. If these systems are sustained, they will keep not
one transaction but a series of transactions out of the banking system.
A third alternative is a currency which is issued in return for some goods being sold on a
portal or a service being provided. This currency once again entitles the owner to avail of
services or goods available on that portal only. These are like more sophisticated barter
exchanges. These transactions too will remain outside the purview of the banking system
and hence will also remain outside the taxation system.
A further alternative is the Sodexo type of coupons that are issued by a single agency and
can be redeemed at a large number of merchant outlets. Within the Indian experience, there
was at least one such coupon issued to facilitate transactions in the Rythu Bazaar in
Hyderabad by IDFC on the request of Government of Telangana. While these are meant to
serve only one specified purpose, they hold the possibility of mediating in a series of other
transactions as well, provided the commitment by IDFC to redeem the coupons remains
unaltered. Clearly, transactions that pass through this channel would have bypassed the
BTT since at least one transaction is not mediated through banks.

91
In recent times, a variety of mobile wallets too have emerged. While some of them are
backed by a payment bank, others are not. The money in the wallet could potentially move
from one wallet to another without being withdrawn into a bank or bank like institutions.
Once again unless these transactions are designated as banking transactions, they too would
slip out of the BTT network.
What all these alternatives indicate is that the possibility that people will look for
alternatives is a real possibility led on by the fact that the effective rate of tax under the
BTT regime even with a 2 percent tax would be a reasonably high tax rate.
5. BTT and international tax: Most countries operate a residence based tax system where the
country of residence taxes the global profit of its residents. When the country where the
investment is deployed also taxes a part or the whole of income of the taxpayer, double
taxation occurs. Currently, an elaborate system of bilateral tax treaties has been put in place
to avoid such double taxation. Under the current rules, the source countries get lesser right
of taxation and where these countries exercise such rights, there is a system of giving credit
by the country of residence for the taxes paid abroad.
The current system of these double taxation avoidance agreements is not fair and efforts
are on at international level through initiatives like the Base Erosion and Profit Shifting to
correct some of the loopholes by which multinationals exploit the system and often end up
paying very little tax overall.
However, despite obvious problems associated with the present dispensation, the system is
based on taxation of income. There may be myriad ways of defining income by various
countries but what is important is that the tax is generally on income.
India has entered into almost 100 tax treaties. In all these treaties, of course with some
variations, the term tax is defined as follows:
―Article 2: TAXES COVERED (UN Model 2011)

92
1. This Convention shall apply to taxes on income and on capital imposed on behalf of a
Contracting State or of its political subdivisions or local authorities, irrespective of the manner
in which they are levied.
2. There shall be regarded as taxes on income and on capital all taxes imposed on total income,
on total capital, or on elements of income or of capital, including taxes on gains from the
alienation of movable or immovable property, taxes on the total amounts of wages or salaries
paid by enterprises, as well as taxes on capital appreciation.
3. The existing taxes to which the Convention shall apply are in particular:
(a) (in State A): ............................................
(b) (in State B): ............................................
4. The Convention shall apply also to any identical or substantially similar taxes which are
imposed after the date of signature of the Convention in addition to, or in place of, the existing
taxes. The competent authorities of the Contracting States shall notify each other of significant
changes made to their tax law.”
The short point about the current DTAAs is that it is about taxes on income. Article 23 then lays
down how double taxation is to be avoided by the countries concerned.
A sample article 23 is along the following lines: (India- Thailand, December, 2015)
“1. The laws in force in either of the Contracting States shall continue to govern the taxation of
income in the respective Contracting States except where provisions to the contrary are made in
this Agreement.
2. Double taxation shall be eliminated as follows:
(i) In India,
(a) Where a resident of India derives income which, in accordance with the provisions of
this Agreement, may be taxed in Thailand, India shall allow as a deduction from the tax on the
income of that resident, an amount equal to the tax paid in Thailand. Such deduction shall not,

93
however, exceed that portion of the tax as computed before the deduction is given, which is
attributable, as the case may be, to the income which may be taxed in Thailand.
(b) Where in accordance with any provision of the Agreement income derived by a resident
of India is exempt from tax in India, India may nevertheless, in calculating the amount of tax on
the remaining income of such resident, take into account the exempted income.
(ii) In Thailand,
(a) Where a resident of Thailand derives income which, in accordance with the provisions
of this Agreement, may be taxed in India, Thailand shall allow as a deduction from the tax on the
income of that resident, an amount equal to the tax paid in India.
Such deduction shall not, however, exceed that portion of the tax as computed before the
deduction is given, which is attributable, as the case may be, to the income which may be taxed
in India.
(b) Where in accordance with any provision of the Agreement income derived by a resident
of Thailand is exempt from tax in Thailand, Thailand may nevertheless, in calculating the amount
of tax on the remaining income of such resident, take into account the exempted income.”
Under the present arrangement, the moot point is that tax to be credited should be a tax on
income. Existing jurisprudence lays down a general proposition that any tax the subject of
which is income can be regarded as a tax on income. However, where the tax is in respect
of a different subject but is merely calculated with reference to profits or income, then the
same will not be considered as a tax on income.
By way of an example, a property tax computed with reference to income still remains a
property tax and does not become an income tax. That is certainly as per Indian
jurisprudence and it is quite possible, that the other State does not accept the same point of
view and in fact considers such a property tax as income tax.
Now, what is the practical implication of such a difference of view? The non-resident
taxpayer concerned paying the tax in India will claim a credit of the same in her country of
residence on the ground that it is an income tax. If the state of residence agrees with that

94
view, that state is free to give credit from the taxes paid even if India does not agree with
the same. However, if the state of residence does not consider it as income tax, which is
the more logical view, it would not give credit and then there will be double taxation.
If India were to tax income only at the rate of 2, that would not be a problem, since the tax
will be on income and there are rules to specify which country can tax what income and
under what circumstances. A BTT is not an income tax. In fact, the proposal is to abolish
income tax altogether. Therefore, the argument that the new levy will be in addition to or
in substitution of income tax will also not be possible.
In such an event, it will be necessary to either rescind all our DTAAs or try to renegotiate
our tax treaties in a way that the new tax is taken into consideration. It is also necessary to
appreciate that even if India abolishes income and corporation tax, it is unlikely that other
countries will adopt the same method of taxation, at least in the near future. Indian
companies investing abroad will then not get credit for the taxes paid there. It is possible
to argue that the Indian companies will pay income tax only in the other country and there
will be no double taxation. But that view may not be correct since all such incomes when
repatriated would be taxed under the BTT regime.
If on the other hand, the BTT is considered by the other State as income tax, then the
consequences will be that the tax cannot be levied unless there is a permanent establishment
of the enterprise in India.
In other words, the system of international taxation which has some agreed conventions
would be disturbed by the introduction of a BTT replacing all other direct taxes. There are
two possible consequences of this change:
a. If the effective tax rate from BTT is perceived to be high, one could witness an outflow
of investment, unless the Double Taxation Avoidance Agreements are renegotiated so
that the investor can claim credit for any taxes paid in India.
b. If the effective tax rate from BTT turns out to be lower than the tax rate faced by
corporations in the residence country, then India might attract investment which seeks
to locate here to benefit from the lower effective tax rate. Assuming that we transit to

95
the BTT and its effective rate is less than 10%, in that case, India risks being categorized
as a tax haven and put on various black lists prepared by countries for various purposes
including for transfer pricing and CFC legislations. The European Union is preparing
such a list that will include such low tax jurisdictions. It may be noted that Brazil has
recently put Ireland on its blacklist. The criteria adopted by Brazil are: countries that
have no tax, hide banking or trade information or have a corporate income tax rate of
less than 20%.
The short point is that market economies normally have corporate income tax with some
reasonable rate and in this age of tax competition, might look askance at India trying to
lower the bar.
That apart, in case there is no income tax and no tax administration, it is very likely that
money launderers and terrorist financiers will feel emboldened to use India as a haven for
their activities. At present, even if anti-money laundering operations are administered by
the enforcement directorate, the existence of income tax together with the monitoring for
tax purposes by the tax administration prevent blatant use of the financial system by such
operators.
6. Tax administration: The proposal for introduction of BTT is also presented as a change in
the entire culture of tax compliance and administration, since it constitutes a move from
declaratory taxes to non-declaratory tax regime. One of the virtues of the proposed single
BTT is supposed to be the virtual elimination of tax evasion and fiscal corruption, and a
reduction of the underground economy since the tax collection would take place
automatically upon each debit or credit transaction within the banking system. According
to Cintra, to make tax evasion practically disappear it would suffice to monitor the bank
clearing system.59
Every tax faces problems of evasion and avoidance. In BTT, avoidance would relate to the
use of instruments which are not included in the list of instruments subject to tax. For
59 Cintra (2009), Page 54
96
reducing the scope for avoidance, some agency would have to be assigned the task of
tracking the emergence of such methods.
Besides, there is no reason to assume that there may not be attempts at tax evasion even of
the proposed BTT. Cintra, for example, mentions the Brazilian example of implementing
the CPMF where the Brazilian Central Bank uncovered the existence of mechanisms,
which banks offered to their largest clients that avoided collection of the CPMF. 60
Therefore, BTT like every other tax will also need an administration who will monitor the
clearing system.
In any tax, the essential elements are the registration, filing and verification and collection.
While there may not be any need for any registration in the proposed BTT, there will still
be need of filing of some kind of periodic returns and verification of the correctness of the
same and collection of the shortfall from the delinquent banks.
There is another aspect of the monitoring of the accounts. Presently, any amount that is
credited in the bank account is subject to potential scrutiny by the tax department. In the
absence of any scrutiny of the accounts, any kind of money can come in the bank accounts
including drug money, terrorist money. If there is no tax on any other kinds of transactions
apart from the BTT, in the absence of tax departments, it would be difficult to validate the
source of income. It is possible to imagine that the financial intelligence unit that currently
monitors the transactions in the financial sector is given the responsibility. But, if each and
every banking transaction needs to be checked and monitored, it is unlikely that there will
be much reduction in the bureaucracy.
In other words, without substantial work on the nature of administration required in a BTT
regime, it would be difficult to establish that BTT regime could result in redundancy of
workforce in the tax departments. The Arthakranti report suggests that the BTT regime will
need only a small tax department and the extra staff would be redeployed61.
60 Ibid, FN 79, page 55 61 Page 157 of the Arthakranti Report.
97
The proposal by Arthakranti suggests that the banks should be paid a part of the revenue
they collect. In particular, it is suggested that the banks could be paid 0.35 percent of the
transaction value. The report argues that this process would allow banks to expand their
activities. It may be noted that there are two consequences of the above allocation of
revenue to the banks. First, the cost of collection of tax would be significantly higher than
the cost of collection of taxes in the present regime – the cost of collection would increase
from about 2 percent of the revenue collected to 17.5 percent if the tax is collected at 2
percent of the value of transactions. Second, the banks would treat this receipt as incomes
and not as loanable funds. In other words, the profits of the banks would increase
substantially without any tangible benefits to the economy. It would be incorrect to assume
that because of this incentive, the banks could perform the function of policing the
taxpayers to ensure that they use only the formal sector cash substitutes since they would
not have the sanction of law for the same. If the sanction of law is accorded, then the
benefits from the lack of interface with a tax department would not fructify.
Restriction on Cash Transactions
The Arthakranti report suggests that in order to encourage transactions to remain within the fold
of formal non-cash instruments, the government should place a cap on the value of transactions
that can be undertaken with cash. The report proposes a cap at Rs 2000. There are however, two
issues with this approach. First, the legal sanction for transactions has meaning only in an economy
where customers generally approach the courts for enforcement of their rights with respect to
transactions undertaken. If however, people still rely more on informal mechanisms for
enforcement than the formal institutions, the cap on transactions might have very little impact in
influencing behavior of individuals. Second, in attempting to induce a change in behavior of agents
from using cash as a medium of exchange to using other instruments, there are again two possible
mechanisms: one using incentives where the agents are persuaded to shift to non-cash instruments
and the other by compulsion -rules may be framed to make certain kinds of transactions illegal.
The former would come with fewer costs of administration while the latter would require more
administrative effort, thereby placing discretion into the hands of the administrator encouraging
rent seeking behaviour.

98
Appendix 3A: Estimating revenue from BTT at 2 percent
Value of Output
(Rs. Crore)
Gross Value
Added (Rs.
Crore)
Revenue from
2% Tax on GVA
& Value of
Output (Rs.
Crore)
AGRICULTURE & ALLIED ACTIVITIES (Cropping) 15,36,092 12,11,252 54,947
AGRICULTURE & ALLIED ACTIVITIES (Irrigation) 48,900 41,159 1,801
AGRICULTURE & ALLIED ACTIVITIES (Livestock) 7,33,054 5,00,405 24,669
FORESTRY & LOGGING 1,64,976 1,38,137 6,062
FISHING & Aquaculture 1,22,775 1,04,297 4,541
MINING AND QUARRYING 5,50,800 3,04,300 17,102
Manufacturing - Corporate Sector 76,10,263 16,72,915
Manufacture of food products, beverages & tobacco 9,98,198 1,53,892 23,042
Production, processing and preservation of meat, fish,
fruit, vegetables, oils and fats 2,46,592 23,209 5,396
Manufacture of dairy products 1,23,141 13,937 2,742
Manufacture of grain mill products, etc. and animal feeds 2,60,555 28,540 5,782
Manufacture of other food products 2,60,902 46,335 6,145
Manufacture of beverages 68,071 23,685 1,835
Manufacture of tobacco products 38,938 18,185 1,142
Manufacture of textiles, apparel & leather products 7,69,299 1,78,372 18,953
Manufacture of textiles + cotton ginning 5,64,042 1,25,503 13,791
Manufacture of wearing apparel, except custom tailoring 1,46,617 38,454 3,701
Manufacture of leather and related products 58,640 14,415 1,461
Manufacture of metal & metal products 12,25,060 3,24,650 30,994
Manufacture of basic iron and steel + casting of iron and
steel 8,17,681 2,20,988 20,773
Manufacture of basic precious and non-ferrous metals +
casting of non-ferrous metals 1,99,333 45,122 4,889
Manufacture of fabricated metal products, except
machinery and equipment 2,08,045 58,540 5,332
Manufacture of machinery & equipment 13,40,275 3,58,094 33,967
Manufacture of computer, electronic & optical products 1,47,201 41,883 3,782
Manufacture of electronic component, consumer
electronics, magnetic and optical media 73,483 19,276 1,855
Manufacture of computer and peripheral equipment 28,531 7,762 726
Manufacture of communication equipment 24,953 6,643 632
Manufacture of optical and electronics products n.e.c 20,233 8,202 569
Manufacture of electrical equipment 2,49,601 58,884 6,170
Manufacture of machinery and equipment n.e.c 3,27,025 1,05,187 8,644
Manufacture of transport equipment 6,16,449 1,52,141 15,372
Manufacture of coke, petroleum, rubber, chemical and
related products 28,54,112 5,77,092 68,624

99
Manufacture of coke & refined petroleum products 15,32,815 1,70,412 34,065
Manufacture of chemical and chemical products except
pharmaceuticals, medicinal and botanical products 5,77,087 1,36,287 14,267
Manufacture of pharmaceutical; medicinal chemicals and
botanical products 2,47,544 1,13,600 7,223
Manufacture of rubber & plastic products 2,42,639 65,510 6,163
Manufacture of other non-metallic mineral products 2,54,026 91,284 6,906
Others 4,23,318 80,814 10,083
Manufacture of wood and of products of wood and cork,
except furniture; manufacture of articles of straw and
plaiting material 30,858 7,315 763
Manufacture of paper and paper products 98,368 24,672 2,461
Printing and reproduction of recorded media except
publishing 48,710 15,681 1,288
Manufacture of furniture 27,052 5,852 658
Other manufacturing 2,09,435 23,349 4,656
Repair and installation of machinery and equipment 8,894 3,944 257
Manufacturing - Household Sector 7,23,673 2,66,476
Manufacture of food products, beverages & tobacco 1,70,052 48,660 4,374
Production, processing and preservation of meat, fish,
fruit, vegetables, oils and fats 12,400 2,058 289
Manufacture of dairy products 6,554 1,271 157
Manufacture of grain mill products, etc. and animal feeds 49,519 12,299 1,236
Manufacture of other food products 77,324 19,835 1,943
Manufacture of beverages 2,814 1,377 84
Manufacture of tobacco products 21,441 11,820 665
Manufacture of textiles, apparel & leather products 2,19,126 97,213 6,327
Manufacture of textiles + cotton ginning 1,69,272 73,801 4,861
Manufacture of wearing apparel, except custom tailoring 22,902 11,632 691
Manufacture of leather and related products 26,952 11,781 775
Manufacture of metal & metal products 95,544 30,627 2,523
Manufacture of basic iron and steel + casting of iron and
steel 29,675 4,026 674
Manufacture of basic precious and non-ferrous metals +
casting of non-ferrous metals 1,537 373 38
Manufacture of fabricated metal products, except
machinery and equipment 64,332 26,228 1,811
Manufacture of machinery & equipment 53,451 21,102 1,491
Manufacture of computer, electronic & optical products 14,391 6,111 410
Manufacture of electronic component, consumer
electronics, magnetic and optical media 8,393 3,582 240
Manufacture of computer and peripheral equipment 5,455 2,328 156
Manufacture of communication equipment 256 109 7
Manufacture of optical and electronics products n.e.c 287 92 8
Manufacture of electrical equipment 14,406 6,147 411
Manufacture of machinery and equipment n.e.c 12,744 5,438 364

100
Manufacture of transport equipment 11,909 3,405 306
Manufacture of coke, petroleum, rubber, chemical and
related products 68,694 22,841 1,831
Manufacture of coke & refined petroleum products 520 146 13
Manufacture of chemical and chemical products except
pharmaceuticals, medicinal and botanical products 4,854 972 117
Manufacture of pharmaceutical; medicinal chemicals and
botanical products 3,561 713 85
Manufacture of rubber & plastic products 10,801 3,032 277
Manufacture of other non-metallic mineral products 48,958 17,977 1,339
Others 1,16,805 46,033 3,257
Manufacture of wood and of products of wood and cork,
except furniture; manufacture of articles of straw and
plaiting material 40,944 17,535 1,170
Manufacture of paper and paper products 4,640 1,640 126
Printing and reproduction of recorded media except
publishing 4,369 1,544 118
Manufacture of furniture 60,890 22,770 1,673
Other manufacturing 5,064 2,161 145
Repair and installation of machinery and equipment 899 383 26
ELECTRICITY GAS & WATER SUPPLY 7,93,338 2,88,935 21,645
CONSTRUCTION 27,80,208 10,03,903 75,682
TRADE, Repair Services, HOTELS & RESTAURANTS 20,05,195 13,52,240 67,149
TRANSPORT SERVICES 12,67,684 5,72,760 36,809
STORAGE, COMMUNICATION & SERVICES
RELATED TO BROADCASTING 5,13,110 2,15,368 14,570
REAL ESTATE, OWNERSHIP OF DWELLINGS AND
PROFESSIONAL SERVICES 23,19,952 17,08,919 80,577
OUTPUT & VALUE ADDED FROM OTHER
SERVICES 11,82,922 8,26,296 40,184
Financial Services 6,50,360
Potential Revenue from BTT (2014-15) 8,60,864
Source: National Account Statistics

101
Chapter 4: Summary and Conclusions
4.1 Demonetisation
As discussed in the chapter on demonetisation, there are potentially two different methods for
doing demonetisation: one, where the demonetised high value currency would be replaced by low
value currency to the extent the same is demanded by the people, which we call the milder form
of demonetisation and second, where the demonetised high value currency is replaced by an
equivalent addition to bank deposits. The latter we refer to as aggressive demonetisation since it
imposes the need for sharp behavioural change in the economic agents. The transition to a “cash
less” economy would be faster in the latter case than the former. In both cases the effect of
demonetisation would depend on the speed with which the new regime replaces the old regime. If
the transition is stretched over a period of time where the old currency ceases to be legal tender
but is not replaced instantaneously by new currency there could be considerable costs of transition.
In the following analysis we assume the transition to be instantaneous. The former model of
demonetisation would have few consequences for the economy since economic activities are not
disrupted. With time, as and when people perceive that there is a cost or inconvenience associated
with transacting in low denomination currency, they would gradually shift to non-cash forms. This
gradual transition would bring more people into the banking channels as well as allow the service
providers the time to upgrade their facilities to accommodate the changing levels of transactions.
However the latter form of demonetisation can have completely different effects which are
summarised below.
1. Compression in economic activity because of the absence of money for mediating in
transactions until the agents in the economy learn to use cash substitutes
a. To bring more people into the banking system and to encourage the use of noncash
instruments, government might choose various mechanisms to incentivise such a
move. For instance, the government could choose to populate bank accounts with
some basic amount to provide an incentive for people to utilise these accounts at
least to withdraw the said the amount. This could be in the form of a minimum basic
102
income or as a discrete one time transfer or by transforming some services provided
into cash equivalent.
b. Transactions in the digital environment also have security implications that need to
be addressed before people can find these media reliable. There have been instances
of data theft, phishing, vishing, identity theft, as well as broader concerns of
security of data in transactions through internet. In the event of a loss due to any
such activities, the customers’ interests are not adequately protected.
c. At the same time, it could bring in incentives for people to move to non-cash forms
of transactions. Here, it should be noted that prizes given through lotteries may not
be adequate since there is only a remote chance that any given individual will get
the lottery. Similarly, merely trying to reduce the transaction cost might not be
enough. For instance, if people were not paying taxes by transacting in cash, the
reduced transaction cost might not be enough to compensate for the higher tax
liability. The government might want to position the incentive as a lower rate of tax
on non-cash transactions as compared to cash transactions if the demonetisation
were happening within the present tax regime. While there is potential risk to
revenue in this case, it might bring in a larger behavioural response.62
2. With lower GDP, the demand for imports might decline resulting in a reduction in the
current account deficit. By itself, this could lead to an appreciation of the domestic
currency, this could in turn lead to a compression of exports.
3. The compression in demand may take time to reverse due to “persistence” in economic
variables. Besides, if the process of transition to non-cash instruments is slow, investment
in the economy too could slow down, resulting in further compression.
a. This situation can be corrected if the government seeks to stimulate economic
activity through public expenditure either on transfers to bank accounts to stimulate
62 See for example -
http://www.nipfp.org.in/media/medialibrary/2015/10/Development_of_an_Analytical_Model_for_Widening_of_Ta
xpayers_Base.pdf (Pp. 102-103).

103
demand or through expenditure on infrastructure through the PPP mode where the
private sector gets involved and the credit available can be utilised.
4. There would be multi-dimensional effect on the banking sector
a. The banking sector and all other services providers for digital transactions need to
augment the investments in capacity creation for dealing with a significantly larger
volume of transactions flowing through these media. They also need to augment
the security levels of these media well in advance to provide comfort and credibility
to the people who are expected to move to these forms of transactions.
b. The compression in demand in the economy could mean that banks would be facing
higher level of NPAs. This, along with the additional deposits with the banking
system would put pressure on the bottom lines of the banking institutions.
c. It may be argued that with additional balances being placed at the disposal of the
banks, there would be an expansion in the supply of credit. It could also be
accompanied by a lowering of interest rates. However, for expansion in demand for
credit to be realised, economy should be performing well and near close to full
capacity. If not the demand for credit might not be realised.
d. The need to generate more credit might push the banking system to extend credit to
more risky investments which can have long term consequences for the banking
sector as well as the economy.
5. Potential evolution of cash substitutes which might remain outside the realm of formal
sector: it is difficult to predict how many or how significant these would be with respect to
the size of the Indian economy. But any encouragement to these, and there would be a
larger policing role that the monetary authorities would need to undertake to regulate the
financial part of the economy.
6. For the consumers, there can be some consequences in the shift from tangible currency to
intangible non-cash instruments. Studies have shown that these shifts could result in more

104
expenditure and potentially more debt.63 While it is not yet clear whether these are long
term effects, even if they are short term effects, there might be more people landing up in
debt. In a country where there is no social security system and bankruptcy laws are weak,
this could place considerable burden of this transition on the citizens of the economy.
4.2. Banking Transaction Tax
Conceptually, the BTT appears to be a simple tax which can be implemented at a low rate. This
makes it sound like an attractive replacement for the present regime of taxes which are complex,
impose considerable compliance cost on the taxpayer and are besieged with problems of evasion
and avoidance. However, by examining the proposed BTT regime in detail in Chapter 3, a few
salient facts emerge:
1. It was found that the effective tax liability of the tax would be considerably higher than the
proposed headline rate of 2 percent. The effective rate of tax for organised manufacturing
comes to 14.3 percent with a 2 percent BTT, where a range of activities would have
effective tax rates higher than 20 percent.
2. Further, it was also established that if the regime does not bring into the tax net, a range of
financial transactions, it would not be revenue neutral at a low rate of 2 percent. It would
have to be implemented at a rate of at least 4 percent. Even if one assumes that the
unaccounted incomes are 30 percent of the economy and all of these get reflected in
banking transactions, it would still not be enough for the tax to be revenue neutral at 2
percent.
3. In addition to the higher rate of 4 percent, it needs to be kept in mind that there are costs
associated with non-cash transactions since these transactions are mediated by private
corporations which need to earn incomes so as to make these services viable. Thus, the cost
to the taxpayer is not 4 percent but perhaps 5 percent assuming that the costs are only about
1 percent of the transaction value.
63 See Chapter 2 for detailed discussion.
105
4. Contrary to what is argued in the Arthakranti Report, the BTT is not neutral – the effective
tax rate varies across sectors; it cannot be positioned as an efficient tax regime – it is a
cascading tax where the tax rate can build up from 2 percent to over 6 percent, or if the tax
rate is higher at 4 percent, to over 12 percent.
5. It does not allow Government to pursue any other objectives other than revenue raising
since this will be the only tax apart from customs duty. Also, it needs to be implemented
without exemption if one wants to maintain a low rate of tax. This could be viewed both as
a good feature and a constraint, depending on one‘s point of view.
6. In the version presented by Cintra, he proposed that taxes levied for non-revenue
considerations might be retained alongside BTT. This is not the view taken in Arthakranti.
If the former view is taken, it might open up the possibility of having BTT as well as other
taxes, which might considerably undermine the attraction of BTT.
4.3. Simultaneous Implementation of both these Policies
To understand the effect of simultaneous implementation of both these policies, we consider two
scenarios: one with milder version of demonetisation with BTT and the other with the aggressive
version of demonetisation.
Scenario 1: Milder Demonetisation with BTT
In the milder demonetisation, as discussed earlier, there is no major shock to the economy. People
can continue to transact in whichever medium of transaction they were using. This would mean
that in the short run, the base for BTT would remain the same as at present. From the analysis of
the revenue productivity of BTT, it was established that the revenue from the present set of bank
transactions would not be able to generate enough revenue at 2 percent rate of tax, if financial
transactions are not taxed at the same rate. Given that this is difficult and not recommended for
developing countries, it was established that the tax would have to be levied at 4 percent. This can
have two possible consequences. One set of agents can perceive that this is a low rate of tax and
choose to come within the fold of banking transactions, while another set of agents might want to
step out of the banking system because the effective rate of tax would remain high: with the
prevalence of or easy availability of cash, this might remain feasible. In other words, the “black
106
money” as in incomes on which taxes have not been paid, can still persist in this economy. In
addition, there would remain mechanisms to finance corruption as well.
Scenario 2: Aggressive Demonetisation with BTT
In principle, for the BTT regime to be more productive than the present regime, it is essential for
all transactions in the economy to be mediated by formal financial institutions. By expanding the
level of transactions, it would be possible to implement BTT not at 4 percent but at a lower rate.
In this form of demonetisation, the bulk of the cash which served as a medium of exchange would
be eliminated from the system. For transactions to remain at the same level, a majority of
transactions would have to migrate to non-cash forms. If this transition takes time, since it involves
behavioural adaptation by agents as well as changes in the underlying infrastructure, in the
transition there may be substantial costs imposed on the economy, which in turn can have
consequences for the revenues from the BTT regime as well.
The aggressive demonetisation as discussed earlier, would result in a compression of demand,
which in turn would result in a reduction in production as well as employment and income
generation. In turn, investment by corporate sector would be reduced since they would find that
they are operating at less than full capacity. Alongside there would be a compression in imports as
well, since the latter depend on the level of economic activity. In other words, there would be a
compression of the base to be taxed under BTT because of these reasons. On the other hand, by
bringing a lot of cash into the banks, the move might induce some agents to move from cash to
non-cash instruments. Thus apart from customs, BTT being the only tax revenue for the
government in the new regime, the net impact on total government revenues would depend on the
relative sizes of the compression in demand and the expansion in banking transactions by hitherto
cash transactions. In the short run, it is reasonable to expect the former to be larger than the latter
– a scenario which can change over time.
If the government chooses to adhere to its FRBM commitments, the total government expenditure
`too can be compressed further compounding the problems of the economy. In this scenario, the
incentives to evade taxes and therefore to currency substitutes that remain beyond the coverage of
the BTT might rise. Given that the banks are flush with funds with few takers, the government

107
might have access to low cost credit and could choose to relax its FRBM restrictions to provide a
fiscal stimulus.
This shock in the short run can have consequences for the exchange rate and for FDI/FII flows into
the country as well. For instance, the reduction in the interest rates in the domestic economy might
induce an outflow of FIIs, which might be further compounded by the fact that there is a demand
compression with low investments. Such a move can adversely affect exchange rate with the Rupee
depreciating against major international currencies. If the need to stimulate the economy through
government spending has to be sustained beyond a year or so, the credit rating of the country too
could take a beating, which in turn can affect FII/FDI flows.
A lot might depend on the kind of expenditure government undertakes and the likely expansionary
effect it would have. It is generally recognised that expansion in consumption expenditure would
have a more immediate effect on the GDP, while capital expenditure tends to have a gestation lag
and hence might not work as fast. In the proposed context, the government could also use part of
the available resources for encouraging a shift to non-cash forms of transaction. Each of these
measures will work through different channels to correct the economic situation.

108
List of References
1. 68% of transactions in India are cash based, November 14th 2016,Business Standard
http://www.business-standard.com/article/economy-policy/infographic-68-of-
transactions-inindia-are-cash-based-116111400495_1.html
2. Albuquerque, Pedro H. "How bad is BAD taxation? Disintermediation and illiquidity in a
bank account debits tax model." North American Meeting of the Econometric Society, Los
Angeles. Processed. (2002).
3. Albuquerque, Pedro H., 2003, “BAD Taxation,” mimeo, Texas A&M International
University, Laredo, TX.
4. Ameriks, John, Andrew Caplin, and John Leahy. The absent-minded consumer. No.
w10216. National Bureau of Economic Research. (2004).
5. Arango, Carlos A., Kim P. Huynh, and Leonard Sabetti. "How do you pay? The role of
incentives at the point-of-sale." (2011).
6. Arbeláez, Maria A., Burman, Leonard E., and Sandra Zuluaga, 2002, “The Bank Debit Tax
in
Colombia,” mimeo, Urban Institute, Washington, DC.
7. Arbeláez, María, Leonard Burman, and Sandra Zuluaga. "The bank debit tax in Colombia."
Fiscal Reform in Colombia (2005): 29-92.
8. Baca Campodonico, Jorge Francisco, Luiz R. De Mello, and Andrei A. Kirilenko. "The
rates and revenue of bank transaction taxes." (2006).
9. Baca-Campodónico, Jorge, De Mello, Luiz and Kirilenko, Andrei, "The Rates and Revenue
of Bank Transaction Taxes", OECD Economics Department Working Papers, No. 494,
OECD. Publishing, Paris (2006).
10. Braga, F.D., Isabella G and Mazzon J.A., (2013). Digital wallets as a payment method
influence consumer in their buying behaviour, Available at
http://www.anpad.org.br/admin/pdf/2013_EnANPAD_MKT1209.pdf
11. Cassara, John A. "Trade-based money laundering: the next frontier in international money
laundering enforcement." Wiley & SAS Business Series (2016).
12. Central Statistical Office (2016), “Annual Survey of Industries 2013-14”, Ministry of
Statistics and Programme Implementation, Government of India.
13. Central Statistical office (2016), “National Accounts Statistics 2016”, Ministry of Statistics
and Programme Implementation, Government of India.
14. Central Statistics Office (2012), “Input-Output Transaction Table 2007-08”, CSO, Ministry
of Statistics and Programme Implementation, Government of India.

109
15. Cintra, Marcos. "A new tax technology: The Brazilian experience with a general bank
transactions tax." Journal of Accounting and Taxation 2.1 (2010): 15.
16. Cintra, Marcos. Tax paradigms, globalization, and the electronic revolution. No. 238.
2009.
17. Coelho, I. Taxing bank transactions: The experience in Latin America and elsewhere,
presented at III ITD Conference Beijing (Washington, DC, Inter-American Development
Bank). 2009
18. Coelho, Isaias, Liam P. Ebrill, and Victoria P. Summers. Bank Debit Taxes in Latin
America-An Analysis of Recent Trends. No. 2001-2067. International Monetary Fund.
(2001)
19. Colabella, P. R., & Coppinger, R. J. (1999). The Withdrawals Tax, St. John's University
Global Institute for Taxation Papers. Jamaica, NY: St. John's University.
20. Facing Cash Crunch, Border Villages In Assam Fall Back On Bhutanese Currency,
November 18th 2016, http://www.ndtv.com/india-news/facing-cash-crunch-border-
villages-in-assam-fallback-on-bhutanese-currency-1626887
21. Feige, Edgar L. "Taxation for the 21st century: the automated payment transaction (APT)
tax." Economic Policy 15.31 (2000): 474-511.
22. Feinberg, Richard A. "Credit cards as spending facilitating stimuli: A conditioning
interpretation." Journal of consumer research 13.3 (1986): 348-356.
23. Fusaro, M., Debit vs credit: A model of self-control with evidence from checking accounts.
(2008) available at http://personal.ecu.edu/fusarom/fusarodebitvcredit.pdf.
23. Government of India, 2015 Tax administration reform in India: Spirit, purpose and
empowerment, Fourth report,
http://finmin.nic.in/the_ministry/dept_revenue/TARC4thReport.pdf
24. Hirschman, Elizabeth C. "Differences in consumer purchase behavior by credit card
payment system." Journal of Consumer Research 6.1 (1979): 58-66.
25. India ranks 130 is ease of doing business, Indian express, October 26 2016,
http://indianexpress.com/article/business/economy/india-ranks-130-in-ease-of-doing-
businessjumps-12-places-world-bank-report/
26. Jonker, Nicole. "Payment instruments as perceived by consumers–results from a
household survey." De Economist 155.3 (2007): 271-303.
27. Kirilenko, Andrei, and Victoria Perry. "On the financial disintermediation of bank
transaction taxes." International Monetary Fund, Fiscal Affairs Department (2004).
28. Lastrapes, William D., and George Selgin. "The check tax: Fiscal folly and the great
monetary contraction." The Journal of Economic History 57.04 (1997): 859-878.

110
29. Lee, Jinkook, Fahzy Abdul-Rahman, and Hyungsoo Kim. "Debit card usage: an
examination of its impact on household debt." Financial Services Review. 16.1 (2007): 73.
30. Loewenstein, George, and Ted O'Donoghue. "" we can do this the easy way or the hard
way": Negative emotions, self-regulation, and the law." The University of Chicago Law
Review 73.1 (2006): 183-206.
31. Massive ATM Card Hack Hits Indian Banks, 3.2 Million Debit Cards Affected,
Huffington post, 20th October 2016, http://www.huffingtonpost.in/2016/10/20/massive-
debit-card-hack-hitsindian-banks-3-2-million-cards-aff/
32. Mercatanti, Andrea, and Fan Li. "Do debit cards increase household spending? Evidence
from a semi-parametric causal analysis of a survey." The Annals of Applied Statistics.
(2014). 8.4: 24852508
33. Ministry of Finance (2016), “Indian Public Finance Statistics 2015-2016”, Department of
Economic Affairs, Ministry of Finance, Government of India.
34. Money laundering using new payment mechanisms, October 2010, FATF-GAFI
35. Morewedge, C. K., Holtzman, L., & Epley, N. (2007). Unfixed resources: perceived costs,
consumption, and the accessible account effect. Journal of Consumer Research. (2007).
34(4), 459–467
36. Mukherjee, S. and R. Kavita Rao (2015a), "Factors Influencing Unincorporated
Enterprises to Register under Value Added Tax (VAT): An Analysis with Enterprises
Survey Data", Working Paper No. 145, National Institute of Public Finance and Policy
(NIPFP), New Delhi.
37. Mukherjee, S. and R. Kavita Rao (2015b), “Policy options for including petroleum, natural
gas and electricity in the Goods and Services Tax”, Economic and Political Weekly, Vol.
50, No. 9, pp. 98-107.
38. Myles, Gareth D. Public economics. Cambridge university press, 1995.
39. Nachane D.M, Chakraborty A.B., Mitra A.K and Bordoloi S. (2013), Modelling
Currency Demand in India: An Empirical Study, RBI Study no.39,
https://www.rbi.org.in/SCRIPTs/PublicationsView.aspx?id=14932#2
40. National Sample Survey Office (NSSO) (2012), "Unit Level data of Unincorporated
Nonagricultural Enterprises (Excluding Construction) in India", NSS 67th Round (June
2010 - July 2011), Report No. 549 (67/2.34/2), NSSO, Ministry of Statistics and
Programme Implementation, Government of India, New Delhi.
41. Paes, N.L.; Bugarin, M.N.S. Parâmetros Tributários da Economia Brasileira. Estudos
Econômicos. SP, v. 36, n.4, p. 716, out-dez 2006.
42. Prelec, D., and G. Lowenstein. “The Red and the Black: Mental Accounting of Savings
and Debt.” Marketing Science. (1998): 17:4–28.

111
43. Prelec, Drazen, and Duncan Simester. "Always leave home without it: A further
investigation of the credit card effect on willingness to pay." Marketing letters. 12.1
(2001): 5-12.
44. Prepaid cards, mobile payments and internet based payment services, guidance for risk
based approach, 2013, FATF
45. Raghubir, P., Srivastava, J. Monopoly money: The effect of payment coupling and form
on spending behavior. Journal of Experimental Psychology-Applied. (2008): 14(3), 213-
225.
46. Rao, M. Govinda, and R. Kavita Rao. "Trends and issues in tax policy and reform in India."
India Policy Forum. Vol. 2. No. 1. National Council of Applied Economic Research, 2006.
47. Rogoff, Kenneth S. The Curse of Cash. Princeton University Press, 2016.
48. Runnemark, Emma, Jonas Hedman, and Xiao. "Do consumers pay more using debit cards
than cash?" Electronic Commerce Research and Applications 14.5 (2015): 285-291.
49. Sands, Peter. "Making it Harder for the Bad Guys: The Case for Eliminating High
Denomination Notes." Harvard Kennedy School, M-RCBG Associate Working Paper
Series 52 (2016).
50. Smith, A. (1776), "An Inquiry into the Nature and Causes of the Wealth of Nations". Book.
51. Smith, Adam, and Joseph Shield Nicholson. An Inquiry into the Nature and Causes of the
Wealth of Nations. T. Nelson and Sons, 1887.
52. Soetevent, A.R., Payment choice, image motivation and contributions to charity: evidence
from a field experiment. American Economic Journal: Economic Policy. (2011): 3, 180–
205.
53. Solin, Marina, and Andrew Zerzan. "Mobile Money: Methodology for Assessing Money
Laundering and Terrorist Financing Risks." The GSM Association, last modified January
(2010).
54. Soman, Dilip. "Effects of payment mechanism on spending behavior: the illusion of
liquidity." Journal of Consumer Research 27.4 (1999): 460-74.
55. Srivastava, Joydeep, and Priya Raghubir. "Debiasing using decomposition: The case of
memory based credit card expense estimates." Journal of Consumer Psychology 12.3
(2002): 253-264.
56. Tax Research Team. Demonetisation: Impact on the Economy. No. 16/182. 2016.,
available at http://www.nipfp.org.in/media/medialibrary/2016/11/WP_2016_182.pdf
57. Thomas, M., Desai, K. K, & Seenivasan, S. “How credit card payments increase unhealthy
food purchases: Visceral regulation of vices”. Journal of Consumer Research. (2011): 38,
505-524.

112
58. Tokunaga, Howard. “The use and abuse of consumer credit: application of psychological
theory and research”. Journal of Economic Psychology, (1993): 14, 285-316.
59. Trütsch, Tobias. "The Impact of Contactless Payment on Spending." International Journal
of Economic Sciences 3.4 (2014): 70-98.
60. Von Kalckreuth, Ulf, Tobias Schmidt, and Helmut Stix. "Using cash to monitor liquidity:
Implications for payments, currency demand and withdrawal behavior." (2011): 22.
61. Why chits and informal channels are still popular, Business Standard, 19th December
2016,http://www.business-standard.com/article/economy-policy/why-chits-and-
informalchannels-are-still-popular-116121900740_1.html