evaluation of the anticancer potential of plants used as ...evaluation of the anticancer potential...
TRANSCRIPT

Evaluation of the Anticancer Potential of
Plants Used as Traditional Medicines by
Aboriginal People
by
Donna Savigni BSc (Hons)
This thesis is presented for the degree of
Doctor of Philosophy of The University of Western Australia,
School of Biological, Biomolecular and Chemical Sciences,
Discipline of Physiology
Submitted 2010

.

STATEMENT OF ORIGINALITY
I certify that, unless explicitly stated otherwise, the research work described in this thesis
was my own. The ideas for experiments were mostly mine and I planned the experiments
and carried them out by myself. My supervisors, Associate Professor Baker and Dr Phillip
Oates also contributed their ideas, offered advice and guidance and helped me to refine the
manuscript. The collection of plant material, extractions and chemical analyses were
carried out by others, as acknowledged elsewhere. Any published work I cited has been
referenced according to the APA system.
Donna Savigni
Candidate
Associate Professor Erica Baker
Coordinating Supervisor
Dr Phillip Oates
Operational Supervisor


iii
ABSTRACT
Chapter 1.
Aboriginal Australians maintain the oldest continuous culture on earth, and their wealth of
phytochemical knowledge is largely unknown to the Western world. This study sought to
tap into that knowledge, not only in the hope of finding a compound that may be of
therapeutic use to cancer patients outside the indigenous communities, but also to empower
the communities themselves.
This introductory chapter encompasses why it is important to find new compounds to
combat cancer and the various strategies employed to do so. The importance of natural
products in current chemotherapies is emphasised. Advantages of the ethnopharmacological
approach to screening plants for bioactive compounds are highlighted, leading into a
rationale for the current project.
Chapter 2.
This chapter described the various materials and methods employed in the investigations.
Chapter 3.
The study began by justifying the choice of cell lines and optimising their culture
conditions. Next, the validity of the MTT assay as a measure of cytotoxicity was
demonstrated and its refinement was described. Finally, relevant controls for these
bioassays were determined.
Chapter 4.
This chapter examined the ethnopharmacological approach to drug discovery, whereby
plants potentially containing suitable drug candidates were selected based on traditional

iv
medical knowledge of two Aboriginal desert communities. These plants were screened for
bioactivity against a panel of cell lines representative of the five most common types of
cancer. Bioactivity was determined by demonstrating a reduction in cancer cell
proliferation via the MTT assay. Using this assay, it was shown that more than half of the
methanolic extracts of plants identified as having medicinal properties displayed cytotoxic
or cytostatic effects against human cancer cell lines. Some of these plant extracts were
more potent than others and showed selectivity for different cancer cell types.
Chapter 5.
From these initial screening studies, four different species were chosen for further
evaluation. These were Euphorbia drummondii, Eremophila sturtii, Eremophila duttonii
and Acacia tetragonophylla. Fresh specimens of these were collected and fractionated into
methanolic, ethyl acetate and aqueous extracts, which also demonstrated a range of
cytotoxic and cytostatic effects on cancer cells. The cytotoxicity of several of these extracts
appeared to be via a specific mechanism, as opposed to non-specific general toxicity, as
brine shrimp were not sensitive to the same treatment. Additionally, the chemical profiles
of the various extracts were compared via HPLC and GC-MS analyses.
Chapter 6.
Based on the results of Chapter 5, the most promising extract, the ethyl acetate extract of E.
duttonii (EA3), was chosen for characterisation. The effects of this extract on cancer cells
were shown to be cytotoxic rather than cytostatic. Additionally, the cytotoxic effects of
EA3 were shown to be associated with controlled Ca2+
entry into the cytosol and not a rapid
influx of Ca2+
indicative of necrosis. Overall, the experiments suggested that EA3-induced
cytotoxicity may be due to apoptosis.

v
The major constituents of EA3 were identified by LC-MS to be the flavonoids rutin,
quercetin, luteolin, apigenin and naringenin. Several of these flavonoids are known to have
cytotoxic activity in vitro and antitumour effects in vivo. However, while quercetin and
luteolin alone displayed cytotoxic or cytostatic effects against the panel of cancer cell lines
used in this study, they did not display bioactivity at the concentrations present in EA3.
Nevertheless, due to various unknown synergistic and antagonistic interactions, it is still
possible that, in combination, these known compounds were responsible for the observed
cytotoxicity/cytostaticity. While there were many other compounds present in EA3 that
could have explained its inhibitory effects, time constraints precluded their evaluation as
the active constituent/s. Future studies will ascertain whether the observed cytotoxic effects
of EA3 are due to a known or a novel compound.
Chapter 7.
A plant sample (Haemodorum spicatum), chosen for its purported antitumour activity, and
an unexamined marine sponge, selected randomly, were screened for bioactivity. Using
these examples, the ethnopharmacological approach was shown to be a relevant, but not
necessarily better, strategy to selecting plants for initial screening studies.
Chapter 8.
This chapter is an overview of the various sections, commenting on some issues that were
raised and discussing possible future directions. It was concluded that, even though a novel
cytotoxic compound was not identified from this research, the bioactivity of plants used by
Aboriginal communities as phytomedicines was verified. This may help these communities
and perhaps even lead to marketable herbal products. Additionally, the results of these
experiments may inspire future collaborative studies using traditional knowledge in the
ongoing search for drugs to combat cancer and other diseases.

iv

vii
TABLE OF CONTENTS
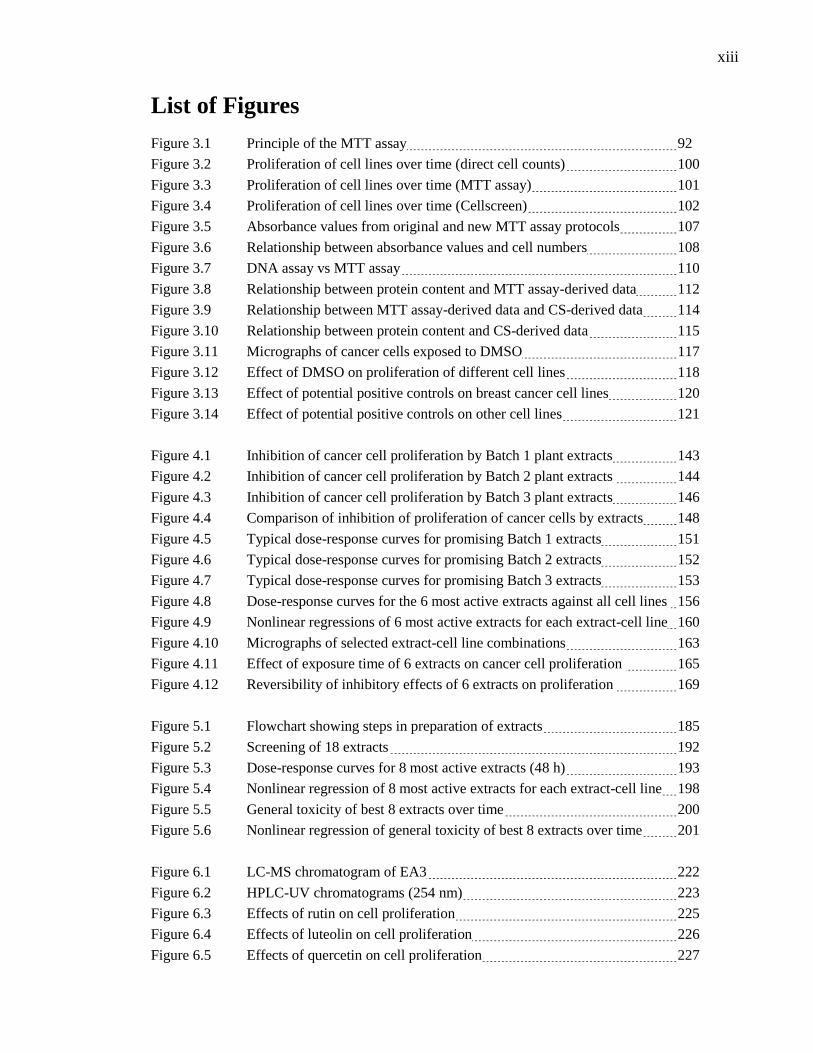
List of Figures ............................................................................................ xiii
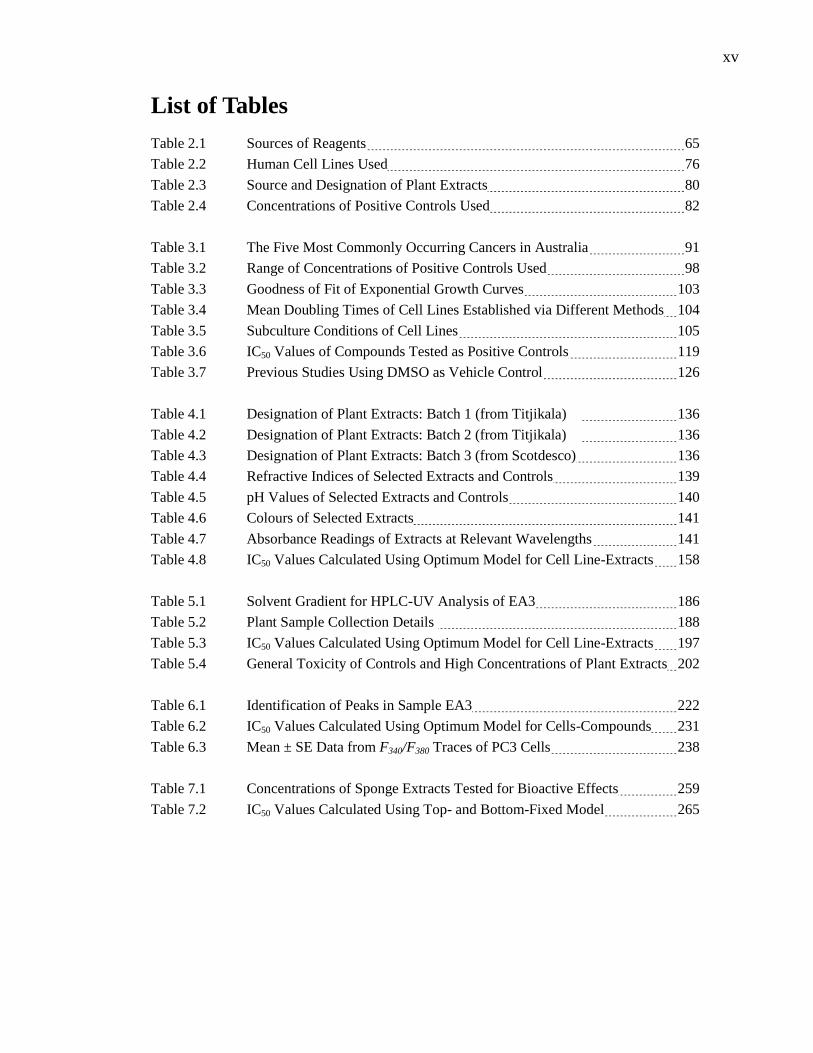
List of Tables ............................................................................................. xv
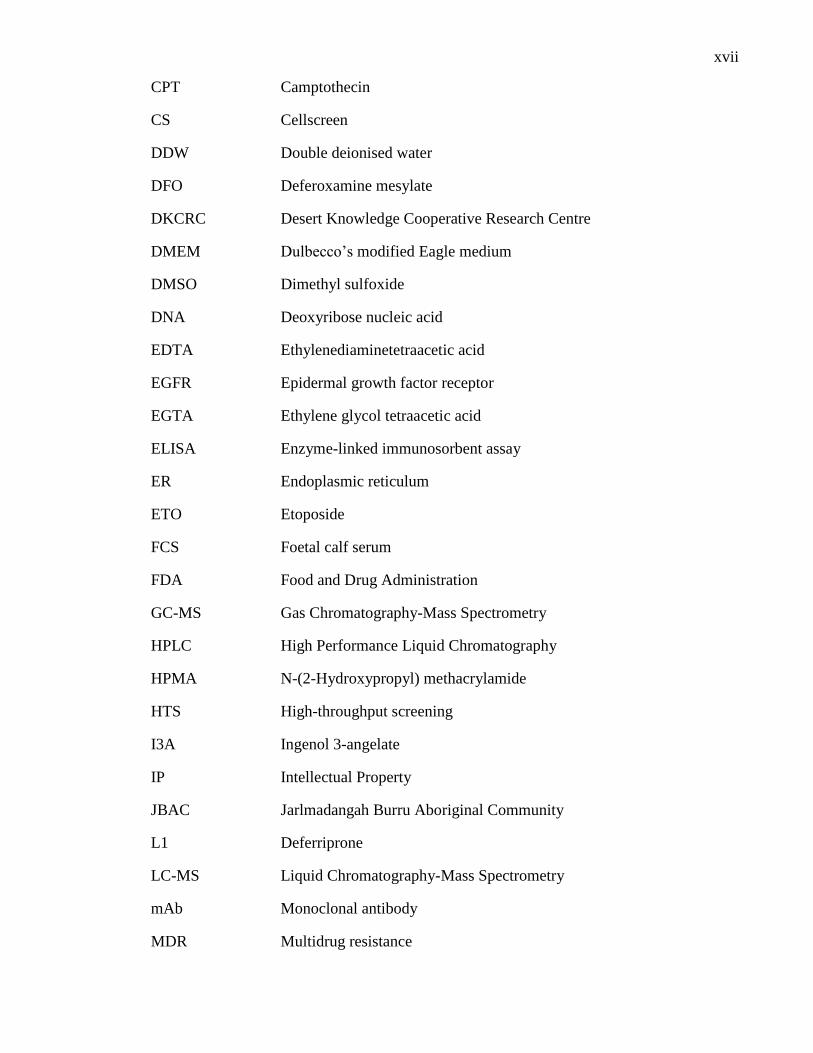
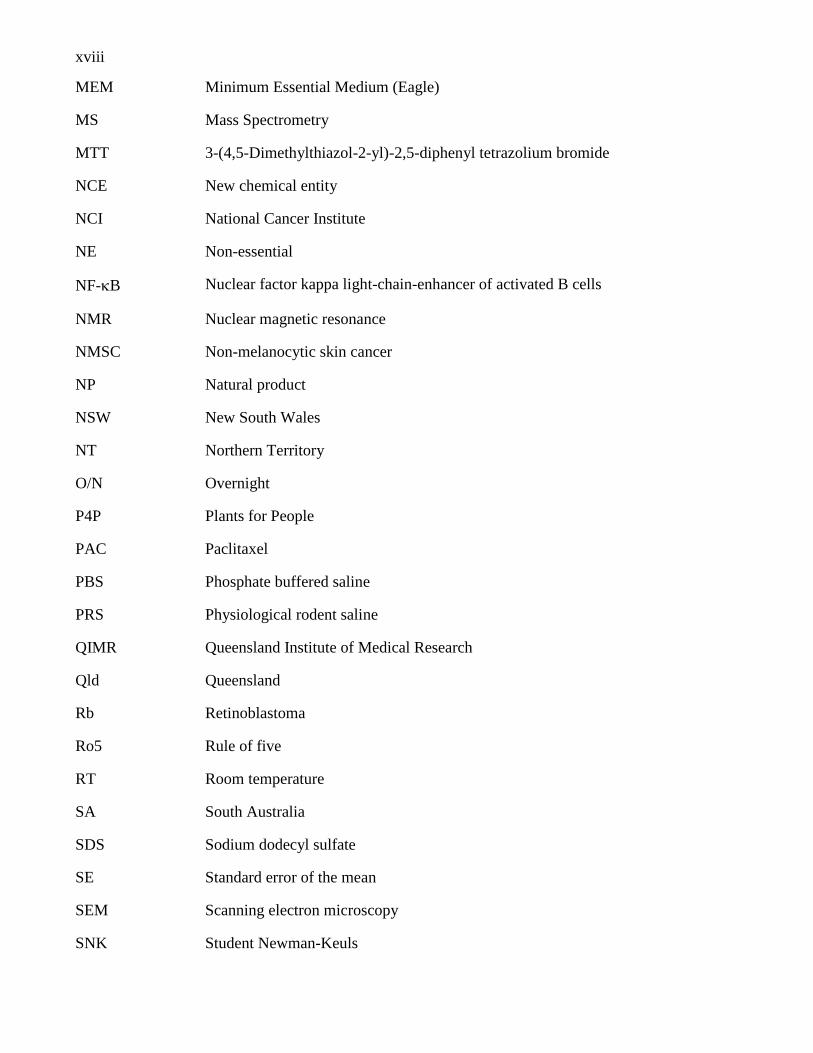
List of Abbreviations and Acronyms .......................................................... xvi
List of Symbols ............................................................................................. xx
List of Units ............................................................................................ xxi
Acknowledgements ...................................................................................... xxiii
Chapter 1: General Introduction.................................................................... 1
1.1 INTRODUCTION ................................................................................................ 1
1.2 CANCER ............................................................................................................... 1
1.2.1 Significance ........................................................................................................ 1
1.2.2 Cancer biology ................................................................................................... 2
1.2.3 Chemotherapeutic strategies to combat cancers ................................................ 6
1.2.4 Traditional, complementary and alternative medicines ................................... 10
1.2.5 The need for new anticancer agents ................................................................. 12
1.3 DRUG DISCOVERY ......................................................................................... 14
1.3.1 Structure-based (rational) drug design ............................................................. 15
1.3.2 Targeted libraries and fragments ...................................................................... 17
1.3.3 High-throughput screening (HTS) ................................................................... 17
1.3.4 Combinatorial chemistry (CC) ......................................................................... 20
1.3.5 Bioprospecting for natural products (NPs) ...................................................... 23
1.4 DRUGS FROM PLANT SOURCES ................................................................ 28
1.4.1 Random approach............................................................................................. 31
1.4.2 Chemotaxonomic relationships ........................................................................ 32
1.4.3 Field observations ............................................................................................ 33
1.4.4 Ethnopharmacology ......................................................................................... 33
1.5 SCOPE OF THE CURRENT PROJECT ........................................................ 60
1.5.1 Approach .......................................................................................................... 60
1.5.2 Overview of experiments ................................................................................. 62
1.5.3 Specific aims .................................................................................................... 63
Chapter 2: Materials and Methods .............................................................. 65
2.1 MATERIALS ..................................................................................................... 65
2.2 EQUIPMENT ..................................................................................................... 67
2.2.1 Cell culture ....................................................................................................... 67
2.2.2 General procedures........................................................................................... 67
2.2.3 Solutions ........................................................................................................... 70

viii
2.3 CELL CULTURE ...............................................................................................73
2.3.1 Cell lines ...........................................................................................................73
2.3.2 Subculture .........................................................................................................76
2.3.3 Experimental set-up ..........................................................................................77
2.3.4 Cell line storage ................................................................................................77
2.3.5 Cell line thawing ...............................................................................................77
2.4 PLANT EXTRACTS ..........................................................................................78
2.4.1 Collection and handling of plant material .........................................................78
2.4.2 Methanol extraction ..........................................................................................79
2.5 CONTROLS ........................................................................................................81
2.5.1 Positive controls ................................................................................................81
2.5.2 Negative controls ..............................................................................................82
2.6 ASSAYS ...............................................................................................................82
2.6.1 MTT assay.........................................................................................................82
2.6.2 DNA assay ........................................................................................................84
2.6.3 Brine shrimp lethality assay (BSLA) ................................................................84
2.6.4 Intracellular Ca2+
measurement.........................................................................86
2.6.5 Protein assay .....................................................................................................86
2.7 STATISTICS .......................................................................................................87
2.7.1 Means and standard errors ................................................................................87
2.7.2 Analysis of variance ..........................................................................................87
2.8 CURVE FITTING...............................................................................................87
2.8.1 Linear regression ...............................................................................................87
2.8.2 Nonlinear regression .........................................................................................87
Chapter 3: Optimisation of Experimental Techniques............................... 89
INTRODUCTION ...........................................................................................................89
3.1.1 Cell lines ...........................................................................................................89
3.1.2 MTT assay.........................................................................................................91
3.1.3 Vehicle ..............................................................................................................93
3.1.4 Controls .............................................................................................................94
3.2 METHODOLOGY..............................................................................................94
3.2.1 Cell lines ...........................................................................................................94
3.2.2 MTT assay.........................................................................................................95
Vehicle ..........................................................................................................................97
3.2.4 Controls .............................................................................................................97
3.3 RESULTS ............................................................................................................99
3.3.1 Cell lines ...........................................................................................................99
3.3.2 MTT assay.......................................................................................................106

ix
3.3.3 Vehicle ........................................................................................................... 116
3.3.4 Controls .......................................................................................................... 119
3.4 DISCUSSION ................................................................................................... 122
3.4.1 Cell lines ........................................................................................................ 122
3.4.2 MTT assay ...................................................................................................... 123
3.4.3 Vehicle ........................................................................................................... 125
3.4.4 Controls .......................................................................................................... 127
3.5 SUMMARY ...................................................................................................... 128
Chapter 4: Preliminary Screening of Plant Extracts ............................... 129
4.1 INTRODUCTION ............................................................................................ 129
4.1.1 Physical properties ......................................................................................... 130
4.1.2 Initial screening .............................................................................................. 131
4.1.3 Dose-response ................................................................................................ 131
4.1.4 Morphological changes .................................................................................. 132
4.1.5 Exposure and recovery ................................................................................... 132
4.2 METHODOLOGY ........................................................................................... 133
4.2.1 Physical properties ......................................................................................... 133
4.2.2 Initial screening .............................................................................................. 134
4.2.3 Dose-response ................................................................................................ 137
4.2.4 Morphological changes .................................................................................. 137
4.2.5 Exposure and recovery ................................................................................... 137
4.3 RESULTS ......................................................................................................... 138
4.3.1 Physical properties ......................................................................................... 138
4.3.2 Initial screening .............................................................................................. 142
4.3.3 Dose-response ................................................................................................ 150
4.3.4 Morphological changes .................................................................................. 162
4.3.5 Exposure and recovery ................................................................................... 164
4.4 DISCUSSION ................................................................................................... 170
4.4.1 Physical properties ......................................................................................... 170
4.4.2 Initial screening .............................................................................................. 172
4.4.3 Dose-response ................................................................................................ 173
4.4.4 Morphological changes .................................................................................. 177
4.4.5 Exposure and recovery ................................................................................... 179
4.5 SUMMARY ...................................................................................................... 182
Chapter 5: Evaluation of Most Promising Plant Extracts ....................... 183
5.1 INTRODUCTION ............................................................................................ 183
5.1.1 Sample collection and extract preparation ..................................................... 183
5.1.2 Chemical analysis of extracts ......................................................................... 183
5.1.3 Extract bioactivity .......................................................................................... 183

x
5.2 METHODOLOGY............................................................................................184
5.2.1 Sample collection and extract preparation ......................................................184
5.2.2 Chemical analysis of extracts ..........................................................................186
5.2.3 Extract bioactivity ...........................................................................................187
5.3 RESULTS ..........................................................................................................188
5.3.1 Sample collection and extract preparation ......................................................188
5.3.2 Chemical analysis of extracts ..........................................................................188
5.3.3 Extract bioactivity ...........................................................................................191
5.4 DISCUSSION ....................................................................................................202
5.4.1 Sample collection and extract preparation ......................................................202
5.4.2 Chemical analysis of extracts ..........................................................................204
5.4.3 Extract bioactivity ...........................................................................................206
5.5 SUMMARY .......................................................................................................212
Chapter 6: Further Evaluation of Plant Extract, EA3 ............................. 213
6.1 INTRODUCTION .............................................................................................213
6.1.1 Chemical composition.....................................................................................213
6.1.2 Identification of active constituents ................................................................214
6.1.3 Exposure and recovery ....................................................................................214
6.1.4 Intracellular Ca2+
measurement.......................................................................215
6.2 METHODOLOGY............................................................................................216
6.2.1 Chemical composition.....................................................................................216
6.2.2 Identification of active constituents ................................................................217
6.2.3 Exposure and recovery ....................................................................................217
6.2.4 Intracellular Ca2+
measurement.......................................................................218
6.3 RESULTS ..........................................................................................................221
6.3.1 Chemical composition.....................................................................................221
6.3.2 Identification of active constituents ................................................................224
6.3.3 Exposure and recovery ....................................................................................232
6.3.4 Intracellular Ca2+
measurement.......................................................................236
6.4 DISCUSSION ....................................................................................................242
6.4.1 Chemical composition.....................................................................................242
6.4.2 Identification of active constituents ................................................................244
6.4.3 Exposure and recovery ....................................................................................248
6.4.4 Intracellular Ca2+
measurement.......................................................................249
6.5 SUMMARY .......................................................................................................254
Chapter 7: Two Different Biodiscovery Strategies ................................... 255
7.1 INTRODUCTION .............................................................................................255
7.1.1 Random approach ...........................................................................................256
7.1.2 Guided approach .............................................................................................257

xi
7.2 METHODOLOGY ........................................................................................... 258
7.2.1 Random approach........................................................................................... 258
7.2.2 Guided approach ............................................................................................ 259
7.3 RESULTS ......................................................................................................... 260
7.3.1 Random approach........................................................................................... 260
7.3.2 Guided approach ............................................................................................ 266
7.4 DISCUSSION ................................................................................................... 271
7.4.1 Random approach........................................................................................... 271
7.4.2 Guided approach ............................................................................................ 272
7.4 SUMMARY ...................................................................................................... 275
Chapter 8: General Discussion ................................................................... 277
8.1 SUMMARIES ................................................................................................... 277
8.1.1 Chapter 1: General Introduction..................................................................... 277
8.1.2 Chapter 2: Materials and Methods ................................................................. 277
8.1.3 Chapter 3: Optimisation of Experimental Techniques ................................... 277
8.1.4 Chapter 4: Preliminary Screening of Plant Extracts ...................................... 278
8.1.5 Chapter 5: Evaluation of Most Promising Plant Extracts .............................. 278
8.1.6 Chapter 6: Further Evaluation of Plant Extract, EA3 .................................... 279
8.1.7 Chapter 7: Two Different Biodiscovery Strategies ........................................ 279
8.2 DISCUSSION ................................................................................................... 280
8.2.1 Significance .................................................................................................... 280
8.2.2 Limitations ..................................................................................................... 285
8.2.3 Chapter 3: Optimisation of Experimental Techniques ................................... 286
8.2.4 Chapter 4: Preliminary Screening of Plant Extracts ...................................... 293
8.2.5 Chapter 5: Evaluation of Most Promising Plant Extracts .............................. 303
8.2.6 Chapter 6: Further Evaluation of Plant Extract, EA3 .................................... 308
8.2.7 Chapter 7: Two Different Biodiscovery Strategies ........................................ 318
8.3 OTHER CONSIDERATIONS ........................................................................ 322
8.3.1 Traditional usage ............................................................................................ 322
8.3.2 Holistic medicine ........................................................................................... 322
8.3.3 Endophytes ..................................................................................................... 324
8.3.4 Drug development .......................................................................................... 325
8.4 FINAL WORD ................................................................................................. 327
Bibliography ........................................................................................... 330
ACRONYMS ................................................................................................................ 330
REFERENCES ............................................................................................................. 330

xii
APPENDICES ......................................................................................... Ai
List of Figures (Appendices) .......................................................................... Ai
List of Tables (Appendices) ........................................................................... Ai
List of Abbreviations (Appendices) ........................................................... Aiii
Appendix A. Basic Cell Biology ............................................................. A1
A1 The cell cycle ................................................................................................... A1
A2 Cell cycle control ............................................................................................. A5
A3 Apoptosis ....................................................................................................... A12
A4 Ubiquitin-mediated protein ............................................................................ A15
A5 Replicative senescence ................................................................................... A16
A6 What goes wrong in cancer? .......................................................................... A17
Appendix B. Chemotherapeutic Strategies to Combat Cancers ...... A21
B1 Cytotoxic drugs .............................................................................................. A21
B2 Targeted therapies .......................................................................................... A28
Appendix C. MTT-formazan Solubilisation ....................................... A45
Appendix D. Spectra of Selected Plant Extract Solutions ................. A48
Appendix E. Data for Typical Dose-Response Curves ...................... A53
Appendix F. Nonlinear Regressions of Figure 4.8. ............................ A57
Appendix G. HPLC-UV Data ............................................................... A62
Appendix H. GC-MS Report ................................................................ A74
Appendix I. Nonlinear regression of Figure 5.3 ................................ A79
Appendix J. Ca2+
Signalling................................................................. A84
Appendix K. Flavonoids ........................................................................ A87
Appendix L. Extraction of Sponges ..................................................... A89
Appendix M. Isolation of Paclitaxel ..................................................... A92
Appendix N. Hormesis .......................................................................... A94
Appendix O. Other General Cytotoxicity Assays ............................. A102
Appendix P. Determination of Compound Interactions ................. A105
xiii
List of Figures
Figure 3.1 Principle of the MTT assay 92
Figure 3.2 Proliferation of cell lines over time (direct cell counts) 100
Figure 3.3 Proliferation of cell lines over time (MTT assay) 101
Figure 3.4 Proliferation of cell lines over time (Cellscreen) 102
Figure 3.5 Absorbance values from original and new MTT assay protocols 107
Figure 3.6 Relationship between absorbance values and cell numbers 108
Figure 3.7 DNA assay vs MTT assay 110
Figure 3.8 Relationship between protein content and MTT assay-derived data 112
Figure 3.9 Relationship between MTT assay-derived data and CS-derived data 114
Figure 3.10 Relationship between protein content and CS-derived data 115
Figure 3.11 Micrographs of cancer cells exposed to DMSO 117
Figure 3.12 Effect of DMSO on proliferation of different cell lines 118
Figure 3.13 Effect of potential positive controls on breast cancer cell lines 120
Figure 3.14 Effect of potential positive controls on other cell lines 121
Figure 4.1 Inhibition of cancer cell proliferation by Batch 1 plant extracts 143
Figure 4.2 Inhibition of cancer cell proliferation by Batch 2 plant extracts 144
Figure 4.3 Inhibition of cancer cell proliferation by Batch 3 plant extracts 146
Figure 4.4 Comparison of inhibition of proliferation of cancer cells by extracts 148
Figure 4.5 Typical dose-response curves for promising Batch 1 extracts 151
Figure 4.6 Typical dose-response curves for promising Batch 2 extracts 152
Figure 4.7 Typical dose-response curves for promising Batch 3 extracts 153
Figure 4.8 Dose-response curves for the 6 most active extracts against all cell lines 156
Figure 4.9 Nonlinear regressions of 6 most active extracts for each extract-cell line 160
Figure 4.10 Micrographs of selected extract-cell line combinations 163
Figure 4.11 Effect of exposure time of 6 extracts on cancer cell proliferation 165
Figure 4.12 Reversibility of inhibitory effects of 6 extracts on proliferation 169
Figure 5.1 Flowchart showing steps in preparation of extracts 185
Figure 5.2 Screening of 18 extracts 192
Figure 5.3 Dose-response curves for 8 most active extracts (48 h) 193
Figure 5.4 Nonlinear regression of 8 most active extracts for each extract-cell line 198
Figure 5.5 General toxicity of best 8 extracts over time 200
Figure 5.6 Nonlinear regression of general toxicity of best 8 extracts over time 201
Figure 6.1 LC-MS chromatogram of EA3 222
Figure 6.2 HPLC-UV chromatograms (254 nm) 223
Figure 6.3 Effects of rutin on cell proliferation 225
Figure 6.4 Effects of luteolin on cell proliferation 226
Figure 6.5 Effects of quercetin on cell proliferation 227

xiv
Figure 6.6 Effects of EA3 on cell proliferation 228
Figure 6.7 Nonlinear regression of effects of pure compounds and EA3 on cell lines 230
Figure 6.8 Effect of exposure time of EA3 on cell proliferation (CS system) 233
Figure 6.9 Effect of EA3 on cell doubling times 234
Figure 6.10 Reversibility of inhibitory effects of EA3 on cancer cell proliferation 235
Figure 6.11 Representative traces showing effects of EA3 and histamine on [ Ca2+
]i. 239
Figure 6.12 Representative traces showing effects of DMSO and ionomycin on [ Ca2+
]i. 241
Figure 6.13 Basic structure and numbering system of flavonoids 242
Figure 6.14 Chemical structures of luteolin, quercetin and rutin 243
Figure 7.1 Marine sponge sample 080211NB09 260
Figure 7.2 Effects of extracts of marine sponge on proliferation of cancer cell lines 262
Figure 7.3 Nonlinear regressions of sponge extracts 264
Figure 7.4 Haemodorum spicatum bulbs from different regions 266
Figure 7.5 Effects of H. spicatum extracts on proliferation of two breast cancer cell lines 267
Figure 7.6 Effect of H. spicatum extracts on different cancer cell lines 269
Figure 7.7 Effect of H. spicatum extracts on different cancer cell lines 270
xv
List of Tables
Table 2.1 Sources of Reagents 65
Table 2.2 Human Cell Lines Used 76
Table 2.3 Source and Designation of Plant Extracts 80
Table 2.4 Concentrations of Positive Controls Used 82
Table 3.1 The Five Most Commonly Occurring Cancers in Australia 91
Table 3.2 Range of Concentrations of Positive Controls Used 98
Table 3.3 Goodness of Fit of Exponential Growth Curves 103
Table 3.4 Mean Doubling Times of Cell Lines Established via Different Methods 104
Table 3.5 Subculture Conditions of Cell Lines 105
Table 3.6 IC50 Values of Compounds Tested as Positive Controls 119
Table 3.7 Previous Studies Using DMSO as Vehicle Control 126
Table 4.1 Designation of Plant Extracts: Batch 1 (from Titjikala) 136
Table 4.2 Designation of Plant Extracts: Batch 2 (from Titjikala) 136
Table 4.3 Designation of Plant Extracts: Batch 3 (from Scotdesco) 136
Table 4.4 Refractive Indices of Selected Extracts and Controls 139
Table 4.5 pH Values of Selected Extracts and Controls 140
Table 4.6 Colours of Selected Extracts 141
Table 4.7 Absorbance Readings of Extracts at Relevant Wavelengths 141
Table 4.8 IC50 Values Calculated Using Optimum Model for Cell Line-Extracts 158
Table 5.1 Solvent Gradient for HPLC-UV Analysis of EA3 186
Table 5.2 Plant Sample Collection Details 188
Table 5.3 IC50 Values Calculated Using Optimum Model for Cell Line-Extracts 197
Table 5.4 General Toxicity of Controls and High Concentrations of Plant Extracts 202
Table 6.1 Identification of Peaks in Sample EA3 222
Table 6.2 IC50 Values Calculated Using Optimum Model for Cells-Compounds 231
Table 6.3 Mean ± SE Data from F340/F380 Traces of PC3 Cells 238
Table 7.1 Concentrations of Sponge Extracts Tested for Bioactive Effects 259
Table 7.2 IC50 Values Calculated Using Top- and Bottom-Fixed Model 265

xvi
List of Abbreviations and Acronyms
4P 4-Parameter
5FU 5-Fluorouracil
AACR Australasian Association of Cancer Registries
ABA Access and Benefit Sharing Agreement
ABC ATP-binding cassette
ABS Australian Bureau of Statistics
ACNTA Aboriginal Communities of the Northern Territory of Australia
ADMET Absorption, Distribution, Metabolism, Excretion and Toxicity
AIDS Acquired immune deficiency syndrome
AIHW Australian Institute of Health and Welfare
ANOVA One-way analyses of variance
ASW Artificial sea water
ATCC American Type Culture Collection
ATP Adenosine tri-phosphate
B Bottom-fixed
BCA Bicinchoninic acid
BSLA Brine shrimp lethality assay
BSS Balanced salts solution
CAM Complementary and alternative medicine
CBD Convention on Biological Diversity
CC Combinatorial chemistry
CCWA Chemistry Centre of Western Australia
CI Confidence interval
CMFS Calcium and magnesium free salts
COX Cyclooxygenase
xvii
CPT Camptothecin
CS Cellscreen
DDW Double deionised water
DFO Deferoxamine mesylate
DKCRC Desert Knowledge Cooperative Research Centre
DMEM Dulbecco‘s modified Eagle medium
DMSO Dimethyl sulfoxide
DNA Deoxyribose nucleic acid
EDTA Ethylenediaminetetraacetic acid
EGFR Epidermal growth factor receptor
EGTA Ethylene glycol tetraacetic acid
ELISA Enzyme-linked immunosorbent assay
ER Endoplasmic reticulum
ETO Etoposide
FCS Foetal calf serum
FDA Food and Drug Administration
GC-MS Gas Chromatography-Mass Spectrometry
HPLC High Performance Liquid Chromatography
HPMA N-(2-Hydroxypropyl) methacrylamide
HTS High-throughput screening
I3A Ingenol 3-angelate
IP Intellectual Property
JBAC Jarlmadangah Burru Aboriginal Community
L1 Deferriprone
LC-MS Liquid Chromatography-Mass Spectrometry
mAb Monoclonal antibody
MDR Multidrug resistance
xviii
MEM Minimum Essential Medium (Eagle)
MS Mass Spectrometry
MTT 3-(4,5-Dimethylthiazol-2-yl)-2,5-diphenyl tetrazolium bromide
NCE New chemical entity
NCI National Cancer Institute
NE Non-essential
NF-B Nuclear factor kappa light-chain-enhancer of activated B cells
NMR Nuclear magnetic resonance
NMSC Non-melanocytic skin cancer
NP Natural product
NSW New South Wales
NT Northern Territory
O/N Overnight
P4P Plants for People
PAC Paclitaxel
PBS Phosphate buffered saline
PRS Physiological rodent saline
QIMR Queensland Institute of Medical Research
Qld Queensland
Rb Retinoblastoma
Ro5 Rule of five
RT Room temperature
SA South Australia
SDS Sodium dodecyl sulfate
SE Standard error of the mean
SEM Scanning electron microscopy
SNK Student Newman-Keuls

xix
T Top-fixed
TB Top- and bottom-fixed
T/CAM Traditional, complementary and alternative medicine
TAM Tamoxifen citrate
TEM Transmission electron microscopy
TK Traditional knowledge
TNE Tris, NaCl and EDTA (buffer)
TNF Tumour necrosis factor
TRIPS Trade-related aspects of intellectual property rights
TTP Time to peak
TUNEL Terminal deoxynucleotidyl transferase-dUTP nick end labelling
TX-100 Triton X-100, t-octylphenoxypolyethoxyethanol
UK United Kingdom
UN United Nations
USA United States of America
UV Ultraviolet
UWA University of Western Australia
Vic Victoria
VIN Vinblastine sulfate
VIS Visible
WA Western Australia
WIPO World Intellectual Property Organization
WTO World Trade Organization

xx
List of Symbols
[Ca2+
]i Concentration of intracellular calcium ions
[Ca2+
]o Concentration of extracellular calcium ions
EC50 50% maximal effective concentration
F340 Fluorescence intensity at 340 nm
F380 Fluorescence intensity at 380 nm
IC50 50% maximal inhibitory concentration
Kd Dissociation constant for Ca2+
LD50 50% maximal lethal dose
OD Optical density
R Measured F340/F380 ratio at a particular point
Rmax F340/F380 ratio in the presence of 1 mM Ca2+
Rmin F340/F380 ratio in the absence of Ca2+
r2 Squared correlation coefficient
SG Specific gravity
v/v Volume per volume
w/v Weight per volume
w/w Weight per weight
Ratio at 380 nm excitation for zero Ca2+
and saturating Ca2+
Interaction index
Wavelength

xxi
List of Units
bp Base pair
˚C Degree Celsius
cm Centimetre
Da Dalton
g Gram
h Hour
km Kilometre
kPa Kilopascal
L Litre
g Microgram
L Microlitre
m Micrometre
Micromolar
mg Milligram
mL Millilitre
mm Millimetre
mM Millimolar
mosm/kg Milliosmole per kilogram
min Minute
mg Milligram
mL Millilitre
M Molar
nm Nanometre
nM Nanomolar
pg Picogram
rpm Revolutions per minute
s Second

xxii
I would like to dedicate this thesis to my wonderful family.
I don‘t say it enough, but you all mean the world to me.
Losing Greg suddenly last year has driven home just how important
it is to appreciate how vital we all are to each others lives
and to make the most of the time we have together.....

xxiii
Acknowledgements
I would like to thank the following people and groups for their assistance during the life of
this PhD project.
My supervisor, Erica Baker, without whom there would have been no project. I have
always admired her cheerful spirit, even in the face of adversity, and have derived great
inspiration from her strength of character. Moreover, her faith in me has been a motivating
force and her kind words of support during some tough times were greatly appreciated. I
also need to acknowledge her proof-reading of this thesis and the helpful input she has
provided.
My cosupervisor, Phil Oates, for taking me on as his student after I had already completed
many of the experiments described in this thesis. As Erica is retired, I found it was
necessary to have someone close at hand to run my ideas past, ask advice of and to answer
all my questions. Phil stepped up and fulfilled that important go-to role. He kept me on
track, ensuring I was writing up as I went along and making suggestions as to how best to
format the chapters. I especially want to thank him for assisting me to get this thesis into
shape by providing significant critical feedback and helping me to flesh out some central
cell biology concepts, particularly as he was so busy with all his teaching commitments.
Louis Evans, for initiating the whole Plants for People (P4P) project by liaising with the
Aboriginal communities and the Desert Knowledge Cooperative Research Centre
(DKCRC) and for giving me the opportunity to be part of the project. Also, for returning to
Titjikala to collect and transport back to Perth the plant samples tested in Chapter 5.

xxiv
The Aboriginal communities at Titjikala (NT) and Scotdesco (SA) for entrusting me with
their traditional knowledge of medicinal plants.
The DKCRC for managing the project and for awarding me a top-up scholarship which
included crucial maintenance money. In particular, the DKCRC‘s Education Coordinator,
Alicia Boyle, and others who gave helpful advice at the two student fora conducted by the
DKCRC.
The Australian Government for supporting me financially through an Australian
Postgraduate Award.
Connie Locher for preparing the original plant extracts as part of the DKCRC P4P project.
Shao Fang Wang for extracting the various fractions of the plants collected in Chapter 5
and for the chemical analyses of these fractions. Also, for generously spending her valuable
time to help me to understand the HPLC, LC-MS and GC-MS data she generated.
Geoff Woodall for providing the Haemodorum spicatum samples tested in Chapter 7 and
for happily sharing his knowledge of the plant.
Danielle Meyrick for allowing me to use her laboratory and equipment to hatch brine
shrimp and examine the effects of my plant extracts on them. Also, her student, Jessie
Moniodis for showing me how to do the brine shrimp lethality assay and for providing the
extracts of a marine sponge I tested for bioactivity in Chapter 7.

xxv
George Yeoh for allowing me to use the Cellscreen system in his laboratory and Ros
London and Alex Percival for teaching me how to use it.
Emilio Ghisalberti, for a useful discussion about what is involved in extracting compounds
from plants and for lending me his copy of a book he co-authored.
Tony Bakker, for letting me use his Ca2+
measuring apparatus and showing me what to do
with it. Also, for helping me to analyse the data and offering critical advice on my
presentation of these data and related writing.
Erica‘s wonderful husband, Lawrie, who has helped tremendously by printing out various
drafts on their home computer to save me travelling back and forth to their house.
My many friends at Physiology, past and present, for their support and for making it a place
I was happy to spend my weekdays. In particular, I want to thank Linh, Julie, Rochelle,
Indu, Caroline, Denise, Kat, Tina, Pete, Anita, Sharyn, Carla, Alan, Matt, Gavin and Tony.
I would especially like to thank Linh for all her energy and willingness to help me out by
picking up my teaching duties when they encroached on the time I could dedicate to writing
this thesis. Through her Murdoch University library privileges, she also downloaded some
references not accessible through the UWA portal for me.
My friends outside of Uni for moral support and encouragement. You know who you are.
But I particularly want to mention, Sharon, who has proven herself to be a true friend in
just a few short years. Without her help babysitting my boys so often, I could not have done
it.

xxvi
My mother-in-law, Lynda, for helping out for years with cooking and childcare and for
offering to help whenever she could.
Mum and Dad for always being there for me and helping me to achieve my goals in any
way they can. I couldn‘t ask for more dedicated parents.
Mark, my rock. For everything.
Lastly, but most importantly, my two sons, Evan and Galen, who everyday teach me
something new. I hope that by me completing my PhD I will have taught them that with
enough effort you can achieve anything you set your mind to. What‘s more, not only is it so
much easier if you surround yourself with people on your side, but that‘s what makes it all
worthwhile.

~ Chapter 1 ~ 1
Chapter 1: General Introduction
1.1 INTRODUCTION
The goal of this project was to use traditional Aboriginal knowledge of plant medicines as a
guide to identifying compounds that may be of use in the treatment of cancer. The first
section of this introductory chapter is a brief review of the literature, focusing on what we
know about cancers in general and providing some illustration of what drugs have been
developed to combat this notorious disease. An overview of the various approaches to drug
discovery follows. Advantages of the ethnopharmacological strategy to biodiscovery are
then discussed, setting the scene for the rationale of this PhD project. Finally, the scope of
this thesis is addressed, in which the specific aims and main outcomes of the study are
summarised.
1.2 CANCER
1.2.1 Significance
Cancer is one of the world‘s greatest killers and figures show its incidence is increasing. In
the year 2000, 10 million new cases of cancer were diagnosed worldwide and 6 million
people died from an illness related to cancer, representing a 22% increase in both incidence
and mortality in ten years (Sikora et al., 1999; Schwartsmann et al., 2002). Moreover, it is
estimated that by 2020, these figures will rise to 20 million and 10 million per year,
respectively. In Australia alone, at current rates, one in three men and one in four women
will be directly affected by cancer before the age of 75. Each year more than 100,000 new
cancer cases are diagnosed and over 40,000 people die from cancer related illnesses (AIHW
& AACR, 2008). In Australia, cancer is now the leading cause of all deaths, ahead of
cardiovascular disease (ABS, 2007). However, if diagnosed early, many cancer patients can

2 ~ Chapter 1 ~
live a normal life span when treated appropriately with surgery, radiotherapy, cytotoxic
drugs and endocrine therapies (Sikora et al., 1999).
To find a cure for cancer is not only a major objective of drug companies but, arguably, like
finding the holy grail of science itself (Valleley, 2006). One major problem is that cancer is
not a single disease, but a variety of diseases caused by numerous factors and affecting
various target organs (Fearon, 1997; Dewick, 2002). In fact, there are over 200 types of
cancer, with variable responses to current chemotherapeutic drugs (Sikora et al., 1999).
Furthermore, conventional chemotherapy can be very toxic to patients, and multi-drug
resistance can also be a major obstacle (Altınoğlu & Adair, 2009; Zhu et al., 2010). Hence,
more targeted strategies are being developed, but this can result in the treatment being very
specific for only a certain type of cancer (Segota & Bukowski, 2004). Since a complete
cure for cancer is unlikely to come from any specific therapeutic agents, combined
treatment with conventional chemotherapy might have to be the compromise (Sandal, 2002;
Eichhorn et al., 2007). This PhD project was concerned with finding new knowledge to add
to the arsenal of existing anticancer treatments.
1.2.2 Cancer biology
Cell specialisation is the great advantage of multicellularity, but it necessitates that
proliferation of the various specialised cell types is separately controlled. Terminal
differentiation into the mature phenotype shuts down cell cycling, whereas arrest of progress in
differentiation causes uncontrolled cell proliferation (von Wangenheim & Peterson, 1998).
Normal cells only proliferate when compelled to do so by developmental or other mitogenic
signals in response to tissue growth requirements (Deshpande et al., 2005). In adult tissues, the
rate of cell death must equal the rate of cell division, otherwise tissues would grow or shrink.

~ Chapter 1 ~ 3
Excess cells undergo programmed cell death, or apoptosis, the selective removal of aging,
damaged or otherwise unwanted cells (see Appendix A3). In contrast to cells that die as a result
of acute injury via necrosis, cells that undergo apoptosis die neatly, without bursting and
leaking their potentially inflammatory-inducing cell contents over neighbouring cells (Kerr et
al., 1972; Al-Lamki et al., 1998). Cell death by apoptosis also occurs during embryogenesis
and normal development, altering the structures the cells form (e.g. a tadpole‘s tail) and during
the regulation of the immune response (Maddika et al., 2007). Both the processes of
proliferation and deletion are tightly regulated by complex signalling pathways (see Appendix
A2 and A3). However, if the normal cell cycle controls are altered in any way, for example
through mutation to key regulatory genes, the cell becomes vulnerable to deranged
proliferation, the main hallmark of cancer (Sandal, 2002). In the interests of brevity, it was not
possible to provide a discussion of what goes wrong in a cancer cell as part of this chapter. The
reader is directed to Appendix A for an overview of what mechanisms are in place to prevent
uncontrolled cell division.
Cancer is basically a disease caused by abnormal and uncontrolled cell cycling and division
resulting in tumours which may spread throughout the body (Alberts et al., 2004). Cancer cells
have two main heritable characteristics: they (and their progeny) all reproduce in defiance of
the normal cell cycle restraints on cell division and they invade and colonise other tissues. If an
isolated abnormal cell proliferates no more than its usual neighbours, it does no significant
damage, regardless of what other undesirable features it may have. However, if it proliferates
uncontrolled, a tumour, or neoplasm, will arise. Neoplastic cells that remain packed together in
a single mass are known as benign tumours and can usually be removed by surgery, resulting in
a complete cure. On the other hand, if the neoplastic cells acquire the ability to invade
surrounding tissue, the tumour is said to be malignant and is then truly considered a cancer.

4 ~ Chapter 1 ~
Invasiveness usually means neoplastic cells detach from the parent tumour and enter the
bloodstream or lymphatic system, forming secondary tumours known as metastases. The more
widely a cancer metastasises, the more difficult it is to eradicate surgically or by localised
irradiation, and the more deadly it is (Fidler, 1978).
Carcinogenesis (the generation of cancer) can be spontaneous or due to external agents, or
carcinogens. Chemical carcinogens (e.g. asbestos and tobacco) typically cause simple local
changes in the nucleotide sequence, ionising radiation (e.g. X-rays) causes chromosome
breakages and translocations and viruses introduce foreign DNA into the cell. Spontaneous
carcinogenesis is linked to age, as discussed Appendix A5.
As described further in Appendix A6, as well as additional DNA damage caused by exposure
to radiation (e.g. UV rays) or carcinogens (e.g. tobacco), a low level of DNA damage occurs in
the life of any cell. However, damaged DNA is only passed on to a cell‘s progeny if the DNA
damage checkpoints are not functioning properly. The long-term accumulation of damaged
genes in cells without checkpoints leads to an increase in the frequency of mutations and,
hence, the likelihood of cancer (Sandal, 2002).
In general, there are some key properties that enable cells to grow as cancers. Six aberrant
behaviours of cancerous cells include:
1. the disregard for external and internal signals regulating cell proliferation;
2. the avoidance of suicide via apoptosis;
3. genetic instability;
4. the circumvention of programmed restrictions to proliferation, such as the evasion
of replicative senescence and the avoidance of differentiation;

~ Chapter 1 ~ 5
5. angiogenic propensity; and
6. the ability to metastasise (Nebert, 2002; Hanahan & Weinberg, 2000).
Consequently, current and prospective anticancer therapies are directed at these intrinsic
properties of cancer cells. While surgery and radiotherapy may be sufficient to treat a primary
or localised tumour, metastases generally require chemotherapy. According to Kelland (2005),
ideal cancer targets are (a) specifically expressed in tumour cells and are not present in any
normal cells or tissues and (b) critically involved in maintaining the malignant phenotype.
As explained by Dewick (2002), the term anticancer drug is emotive, and can build up
false hopes for cancer sufferers. Researchers in the National Cancer Institute (NCI)
programme have used the terms cytotoxic, antitumour and anticancer to differentiate
between the activities of compounds according to the following definitions. A cytotoxic
agent is toxic to tumour cells in vitro. If this toxicity transfers to tumour cells in vivo, the
agent is considered to have antitumour activity. The term anticancer is reserved for
compounds which are toxic to tumour cells in clinical trials (Dewick, 2002). The same
definitions have been adopted to describe the activities of compounds throughout this
thesis.
What follows is a brief overview of some of the more important different classes of anticancer
drugs, including examples. A more comprehensive description of these drugs in relation to the
specific behaviours of cancer cells they target is available in Appendix B.
6 ~ Chapter 1 ~
1.2.3 Chemotherapeutic strategies to combat cancers
1.2.3.1 Cytotoxic drugs
Most current chemotherapeutic agents work by impairing cell division or interfering with
DNA synthesis, which means that fast-dividing cells are preferentially targeted (Valeriote
& van Putten, 1975). By definition, cancer cells proliferate more rapidly than their
neighbours and so drugs that inhibit mitosis effectively kill neoplastic cells more than they
kill normal cells. However, some normal cells of the body, including bone marrow cells
and those responsible for hair growth and for replacing the intestinal epithelium, also
rapidly divide and are affected by these cytotoxic drugs, leading to the well known side
effects of popular chemotherapy, such as anaemia, hair loss, nausea, immunosuppression
and vomiting as well as the long-term cardiac, renal, neurological and reproductive
consequences (Kerbel & Kamen, 2004; Luqmani, 2005). This also means that some fast
growing tumours (e.g. Hodgkin‘s lymphoma) are more sensitive to chemotherapy than
other, more slow-growing tumours (e.g. prostate cancer), as a larger percentage are
undergoing cell division at any given time (Furuya et al., 1994; Hellawell & Brewster,
2002). Cytotoxic drugs include drugs that impair DNA synthesis like antimetabolites (e.g.
5-flurouracil), camptothecins (e.g. toptecan), anthracyclines (e.g. doxorubicin), drugs that
impair DNA integrity like the platinum compounds (e.g. cisplatin) and alkylating agents
(e.g. melphalan) and drugs that impair mitosis, such as tubulin destabilising agents (e.g.
vinblastine) and microtubule stabilising agents (e.g. paclitaxel).
1.2.3.2 Drugs that target molecular abnormalities
Because cancer arises as a result of a series of genetic changes in a cell, drugs targeting these
molecular abnormalities (oncogenes and tumour repressors) have recently been developed.

~ Chapter 1 ~ 7
Molecular antibodies (e.g. trastuzumab) and small molecule inhibitors (e.g. gefitinib) belong to
this class of drugs.
1.2.3.3 Drugs that target cell cycle control
The frequent disruption of cell cycle regulation in cancer has flagged many molecules as
potential therapeutic targets. Inhibitors of cyclin dependent kinases (see Appendix A2.1,
e.g. flavopiridol) and activators of the retinoblastoma pathway (see Appendix A6.2.2, no
clinically used drugs as yet) target cell cycle control.
1.2.3.4 Drugs that target resistance to apoptosis
Defective apoptosis is one of the characteristics of cancer cells and has been implicated in
various stages of cancer development and progression. Furthermore, it is the ability to evade
apoptosis that appears to provide tumour cells with their capacity to resist conventional
chemotherapy and radiotherapy (Khosravi-Far & Esposti, 2004). However, while cancer cells
inactivate elements of the apoptotic pathway, they never disable the complete signaling
cascade. This implies that at least some molecules share function between cell proliferation and
cell death (Maddika et al., 2007). These authors go on to suggest that since cell survival, cell
death and cell cycle progression pathways are interconnected, it should be possible to develop
pharmacological agents that can selectively harness cell proliferation pathways and redirect
them into the apoptotic process. They mention several viral molecules that can selectively kill
cancer cells, but as yet, no drugs have been developed based on this theory. Other strategies
exploiting cancer cells‘ resistance to apoptosis, however, have yielded promising new
chemotherapeutics.
8 ~ Chapter 1 ~
These include activators of the p53 pathway (see Appendix A6.2.1, e.g. Actinomycin D) and
inhibitors of the ubiquitin-proteasome pathway (see Appendix A4, e.g. bortezomib) and other
signalling pathways (no clinically used drugs as yet).
1.2.3.5 Drugs that target tumour cell immortality
A key property of cancer cells is their immortality. In tumours, cell replication is associated
with the maintenance of telomere length and integrity, usually through the reactivation of a
reverse transcriptase mechanism, whereby telomerase adds TTAGGG units to telomeres (see
Appendix A5). Telomerase is constitutively overexpressed in the vast majority of human
cancers and telomeres are critically shorter in most tumours compared to normal tissues. This
makes targeting telomeres, or the telomerase machinery, an attractive, potentially broad-
spectrum, approach to cancer therapy (Kelland, 2005) (no clinically used drugs as yet).
1.2.3.6 Drugs that target angiogenesis
The generation of a lethal tumour requires more than excessive tumour cell proliferation. A
solid tumour must also have an adequate network of blood vessels (vasculature) from normal
tissue to supply nutrients and oxygen and to remove waste products (Nishida et al., 2006; Yano
et al., 2006). However, when a tumour becomes too large (~1-2 mm3) for its own blood supply
to support further expansion, a stressful, hypoxic and acidic microenvironment develops within
the tumour. The cells in these hypoxic regions are resistant to both chemotherapy and
radiotherapy (Brown & Wilson, 2004). The harsh microenvironment provides a strong
selection pressure for more aggressive cancer cells and the generation of signals necessary for
the growth of new blood vessels (angiogenesis) (Thornton et al., 2006; Boehm-Viswanathan,
2000; Adams, 2005). In fact, neovasculature is critical to the growth and spread of malignant
tumours (Ferrara, 2004a), the generation of tumour mass having been shown to be impossible
without endothelial cell proliferation (Folkman, 2006a). Hence, both tumour cell proliferation

~ Chapter 1 ~ 9
and angiogenesis together are vital to turn a small solid tumour into a life-threatening neoplasm
(Folkman, 2006a; Rahman & Toi, 2003; Zhong & Bowen, 2006).
In 1971 Folkman proposed his then provocative hypothesis that arresting the growth of a
tumour may be achieved by attacking its blood supply (Folkman, 1971; Verhoef et al., 2006).
However, it was not until recently with the identification of molecular targets and cellular
pathways of angiogenesis that antiangiogenic chemotherapy came of age as a viable approach
to combating the growth of solid tumours (Thornton et al., 2006). However, the consequences
of antiangiogenic therapy seem to be short-lived, as withdrawal from the treatment induces
rapid regrowth of tumour vessels and a subsequent relapse of tumour growth (Loges et al.,
2010). Nevertheless, angiogenesis inhibitors have now been approved for clinical use by the
FDA in the USA and elsewhere in the world (Rosen, 2001; Rahman & Toi, 2003; Folkman,
2006a). These include vascular targeting agents, antiangiogenic factors (e.g. endostatin, in
China) and inhibitors of proangiogenic factors (e.g. sorafenib).
1.2.3.7 Drugs that target DNA repair mechanisms
A major problem with cytotoxic drugs that target DNA synthesis (see Appendix B1.1) or
integrity (see Appendix B1.2) (as well as ionising radiotherapy) is that they have been shown
to induce secondary cancers several years after initial exposure. This is directly related to their
potential to induce DNA damage in normal cells (Madhusudan & Hickson, 2005). Research
into the possibility of using inhibitors of DNA repair mechanisms in combination with
chemotherapy to selectively target tumours and enhance the efficacy of current therapies is
consequently undermined by the enhanced risk of inducing secondary cancers. While
convincing evidence exists supporting the validity of DNA repair proteins as viable drug

10 ~ Chapter 1 ~
targets, as yet no anticancer drugs have been developed using this idea (Madhusudan &
Hickson, 2005; Sánchez-Pérez, 2006).
1.2.3.8 Drugs that target hormones
Strictly speaking, this is not chemotherapy, but hormonal therapy. Cancers arising from certain
tissues of the body (e.g. mammary or prostate glands) may be inhibited by alterations in
hormonal balance. Tamoxifen is probably the best known example of a drug that inhibits
cancer cell proliferation by inactivating a hormone that promotes cell growth. It inhibits the
action of estrogen and so is particularly effective against breast cancer cells that express the
estrogen and/or progesterone receptor, but has no effect on cancer cells that are estrogen
receptor negative (Arpino et al., 2005; Ravdin et al., 2007).
1.2.4 Traditional, complementary and alternative medicines
Of course, there is another popular source of therapeutics used to treat cancer that is often
overlooked by orthodox medicine. This might be considered understandable given the area
of alternative medicine is obviously a controversial one. An online search of the keywords
traditional medicine and cancer yields a host of alternative remedies claiming to be the
long-searched for cure for all cancers. Quackwatch.com is an interesting website detailing
cancer therapies ranging from miracle diets, like macrobiotics and the grape diet to
consuming shark cartilage to injecting hydrogen peroxide. The medical world is quite
justifiably concerned that these so-called cancer cures not only give false hope to patients at
their most vulnerable, but might also prevent them seeking proven, conventional medical
treatment or interfere with medicines and therapies they are taking (Dufault et al., 2001).
However, amongst these bizarre treatments, there are legitimate medicines that have been
used by thousands of people worldwide with some convincing results. For example, green

~ Chapter 1 ~ 11
tea, mistletoe, ginseng and turmeric have all been used by various peoples over the
centuries for a range of ailments, including cancer. Their bioactive constituents have since
been shown to inhibit cancer cell proliferation and survival in laboratory studies (Melnick,
2006b).
Traditional medicine is a broad term used to define any non-Western medical practice.
Complementary and alternative medicine (CAM) has been defined as ―those healthcare and
medical practices that are not currently an integral part of conventional medicine‖
(Silenzio, 2002). CAM can include such treatments as acupuncture, massage, aromatherapy
and prayer (Fennell et al., 2009).Traditional, complementary and alternative medicine
(T/CAM) is a major industry in Australia and other western nations, and there is an
escalating push from the community and health-care professionals for more education and
research into traditional medicines (Patwardhan & Patwardhan, 2006; Fennell et al., 2009).
Melnick (2006a) points out the irony of labelling these therapies ―alternative‖ given their
rich historical traditions that have formed the basis of many of modern therapies. It should
be remembered that botany and medicine were closely allied until the 18th
century when
they were separated by advances in science (Dufault et al., 2001). Nevertheless, orthodox
medicine requires scientific validation of efficacy and until research endeavours provide
this, individual T/CAMs will bear the tag and remain, in the eyes of some at least, second
rate treatments.
There is a growing demand for herbals with therapeutic value that are available without
prescription (McClatchey & Stevens, 2001). Already, nearly half the population in many
industrialised nations regularly use T/CAM, and the proportion is as high as 80% in
developing countries (Bodeker & Kronenberg, 2002; Melnick, 2006a). Various studies

12 ~ Chapter 1 ~
have indicated that rates of T/CAM usage are generally higher among cancer patients than
among the population as a whole (Lee et al., 2002). Although some people are undoubtedly
becoming dissatisfied with the limitations of orthodox medicine, this increasing demand for
T/CAMs largely reflects the changing beliefs, needs and values of today‘s society (Parris &
Smith, 2003). Indeed, Astin (1998) found that the majority of T/CAM users feel these
alternatives more closely align with their own values, beliefs and philosophical orientations
towards health and life. Many people have deep concerns about the toxicity of potent
conventional medicines and have developed a respect for knowledge based on centuries of
herbal use. However, critics say there is not enough science to justify the use of herbs and
regulations guaranteeing that herbs can fulfil their claims are not strict enough (Dufault et
al., 2001).
So, while T/CAMs are often the only choice for patients in developing countries,
conventional chemotherapy and radiotherapy remain the mainstays of oncological practice
in the Western world. Therefore, it seems T/CAM has only a supporting role, perhaps as
adjuvant therapy, to play in the treatment of wealthier cancer patients. Nevertheless, the
placebo effect can be very strong in some people and herbs will continue to be sold based
on the promise that they will work.
1.2.5 The need for new anticancer agents
Cancer is the most common cause of death in both men and women (Russo et al., 2005) and,
while great advances have been made in the treatment of various cancers, there remains an
urgent need for more effective drugs with fewer side effects (McClatchey & Stevens, 2001;
Tan et al., 2006).
~ Chapter 1 ~ 13
As already stated, most effective cancer chemotherapies have significant side effects,
including emesis, anaemia, immunosuppression, bruising, bleeding and hair loss, the result
of cytotoxic drugs preferentially targeting proliferating cells like cancer cells, but which
also affect rapidly-growing normal cells of the intestine, bone marrow, skin and hair
(Sikora et al., 1999). Moreover, because cancer is a disease based on random genomic
mutations in various cell types, chemotherapeutic agents necessarily have different
mechanisms of action and not all existing anticancer drugs will work the same way for
every patient (Kunick, 2004; Senzer et al., 2005). In addition, resistance to drugs that may
work initially can develop due to dose-limiting toxicities of chemotherapeutic agents on
some normal cells (Keyomarsi & Pardee, 2003). Even worse, multidrug resistance (MDR),
whereby exposure to a single cytotoxic agent results in cross-resistance to other,
structurally unrelated classes of anticancer agents, is a common phenomenon in cancer.
This is due to several membrane proteins, belonging to the ATP-binding cassette (ABC)
family of proteins (e.g. P-gp and MRP1), which use the energy liberated from ATP
hydrolysis to bind and efflux the drugs out of the cell (Boumendjel et al., 2005).
Additionally, it is usually impossible to remove every single cancer cell through surgery
and first-line chemotherapy or radiotherapy and these stray cells can be the cause of clinical
relapse. When dormant cancer cells at the centre of a tumour are revived by vascularisation
following destruction of the tumour periphery via chemotherapy or radiotherapy, they can
have greater metastatic potential (Dubowchik & Walker, 1999). Perhaps even more
alarming is that alkylating agents and topoisomerase II inhibitors, like ionising radiation,
can induce secondary cancers several years after initial exposure. This is directly related to
their modes of action whereby they can potentially cause mutagenic DNA damage in
14 ~ Chapter 1 ~
normal tissues (Madhusudan & Hickson, 2005). Hence, it is the combination of these drugs
which will most likely yield the greatest therapeutic benefit (Dent et al., 2009).
Of the 92 anticancer drugs approved by the FDA to 1999, only 17 were seen by oncologists as
having a high priority for widespread use, and 12 others as having some advantage in certain
clinical settings (Sikora et al., 1999). Furthermore, these drugs act on only a small number of
molecular targets and most are cytotoxic in nature (Aherne et al., 2002). Clearly then, more
anticancer agents are desperately required.
Of course, developing new chemotherapeutics is an enormous undertaking. Following much
time, money and effort invested in initial studies, many more years of clinical trials are
required to ascertain a potential drug‘s effectiveness and safety in human patients. Discussing
the issues involved in the latter processes of drug development is beyond the scope of this
thesis. However, understanding that there are many strategies available to researchers for
discovering new molecules that may be viable drug candidates is very relevant to this study.
Thus, several of these will now be reviewed.
1.3 DRUG DISCOVERY
Firstly, it is necessary to define the terminology involved in drug discovery and
development. Every drug discovery programme needs a starting point, known in the
business as a lead (Lipinski et al., 1997). A lead series is a set of compounds that has
enough potential (based on various factors such as potency, selectivity and novelty) to be
considered as a suitable chemical starting point for optimisation (Leach & Hann, 2000).
Optimisation of a lead compound is simply the chemical modification of the molecule in
order to enhance secondary properties such as absorption, metabolism and elimination and
reduce toxicity so that the eventual drug has optimal function in a patient (Lee & Dordick,

~ Chapter 1 ~ 15
2006; Hefti, 2008). A hit has been defined as ―a compound of known structure that shows
a dose-response in a primary screening assay‖ (Leach & Hann, 2000). In other words, a hit
is what becomes a lead (Aherne et al., 2002). A new chemical entity (NCE) is a compound
not previously described in the literature (Wermuth et al., 1998).
It should be noted here that drug development entails much more than drug discovery. In
order to convert a hit into a commercial drug, many aspects must be considered. These
include whether the potential drug will be clinically useful and safe to use, whether the
chemical can be economically extracted, synthesised or produced on an industrial scale and
whether the drug and its derivatives will be adequately protected by patents. Ultimately,
drug companies must believe that the market is big enough to repay the typical US$800
million development and marketing costs for the new drug (Firn, 2003; Verpoorte, 2005).
However, these considerations are beyond the scope of this thesis which will focus on the
first step in the drug discovery process, obtaining samples to screen for useful biological
effects.
1.3.1 Structure-based (rational) drug design
Rational drug design, first popular in the 1970s, is the ability to make drugs to order based
on structural information about the target (Petsko, 1996). Traditionally, new drugs were
discovered by the trial and error testing of leads from a variety of sources in both in vitro
and primary in vivo screening assays. Most of these lead sources had already undergone
significant scientific investigation before being identified as a drug lead. Usually, the
starting leads had physical properties consistent with previous knowledge of orally active
compounds (Lipinski et al., 1997). In contrast, rational drug design starts with knowledge

16 ~ Chapter 1 ~
of specific biochemical mechanisms and targets these to fit a treatment profile (Mandal et
al., 2009).
In recent years, a better understanding of cancer cell biology has led to the rational design
of several anticancer drugs. Imatinib (Gleevec
) was identified in the late 1990s by
Novartis pharmaceuticals in high-throughput screens for tyrosine kinase inhibitors
(Capdeville et al., 2002). Mabs such as trastuzumab (Herceptin
) were similarly designed
by scientists at Genentech using information about cancer cell biology (Goldenberg, 1999).
Not only were these molecules designed from scratch, but these drugs are more selective
than conventional anticancer chemotherapeutics that are generally non-specifically
cytotoxic (Segota & Bukowski, 2004)
Another example of a rationally designed drug is caplostatin. Fumagillin, derived from the
fungus Aspergillus fumigatus fresnius, exhibits broad-spectrum antiangiogenesis activity but,
because it causes neurotoxicity, is not suitable for clinical use. Caplostatin, a nontoxic synthetic
analogue of fumagillin conjugated to a water-soluble N-(2-hydroxypropyl methacrylamide
(HPMA) copolymer, is a more suitable broad-spectrum angiogenesis inhibitor (Satchi-Fainaro
et al., 2005).
There are many other examples of novel anticancer drugs designed to specifically target
biochemical abnormalities found in tumour cells. Not only have advances in molecular biology
facilitated the identification of tumour markers to predict prognosis and therapeutic response,
but various potential targets for anticancer therapies have been identified (Nahta & Esteva,
2003). Dubowchik and Walker (1999) extensively reviewed receptor-mediated and enzyme-
~ Chapter 1 ~ 17
dependent targeting of anticancer agents, and since then many more targets for cancer therapy
have emerged.
The sequencing of the human genome in 2001 (Venter et al., 2001) means that new genes
critical for cancer are regularly being identified. These oncogenes and tumour repressor
genes represent potential targets for new anticancer drugs. In addition, there exists a wealth
of structural data about biomolecules specifically expressed by cancer cells. The challenge
now is for molecular and cell biologists, structural and medicinal chemists to work together
to harness the wealth of information available to rationally design new anticancer therapies
(Druker & Lydon, 2000; Huang & Oliff, 2001b).
1.3.2 Targeted libraries and fragments
Two other approaches that are used to meet the ever-increasing challenges of
pharmaceutical objectives are targeted libraries and fragments. With targeted libraries,
small banks of compounds representing scaffolds (molecules > 250 Da) known to inhibit a
given class of target are tested, as these have a very high probability of delivering potent
inhibitors of that target. Fragonomics uses the opposite approach in that it uses small (100 –
250 Da), simple molecules screened at high concentrations (typically > 1 mM) to generate
leads. Fragments are also useful in that simpler molecules give more available chemical
space for optimisation, particularly in view of the properties required for optimal oral
bioavailability (Zartler & Shapiro, 2005, Carr et al., 2005, Vieth et al., 2004; Lipinski et
al., 1997).
1.3.3 High-throughput screening (HTS)
It has been estimated that, using current compound screening protocols, the chances of
discovering one marketable drug is one in a million. This results in pressure to screen larger

18 ~ Chapter 1 ~
and larger libraries, necessitating high-throughput screening (HTS), which is simply
specific developments in laboratory automation designed to collect a large amount of
experimental data as quickly as possible (Carnero, 2006).
In general, HTS does not actually identify a drug, but detects lead compounds and provides
directions for their optimisation (Broach & Thorner, 1996). This is because many of the
properties essential to the development of a successful drug, including bioavailability,
toxicity, pharmokinetics and absolute specificity, cannot be evaluated by HTS. Medicinal
chemistry and pharmacological research are required to convert a lead from HTS into a
useful drug; the eventual compound that becomes the drug is unlikely to have been the
molecule initially screened (Broach & Thorner, 1996).
In the early 1990s HTS was still largely a manual process, but today HTS can test hundreds
of thousands of compounds each day, due mainly to advances in robotics and
miniaturization ("Robotic screening," 1996). Besides increasing the rate of screening,
miniaturization reduces the cost, as running costs of assays depends considerably on sample
volumes (Aherne et al., 2002). However, as Archer (1999) states, to be truly effective, HTS
should be based on more than merely improved automation. The entire system must be
capable of operating at maximal capacity with no bottlenecks. Sufficient compounds to test
are required, and these must be prepared in the correct layout, at the prescribed
concentrations, with multiple targets in varying assay formats ready to go. In addition, all
reagents must be readily available and instruments need to be capable of operating 24/7 for
weeks at a time with minimal down-time for maintenance and repairs. Furthermore,
flexibility and responsiveness should be built in to the HTS system to ensure it is quickly

~ Chapter 1 ~ 19
adaptable to performing in vitro or functional, cell-based assays, and to allow for novel
assay formats and new technologies (Archer, 1999).
HTS was developed in the late 1980s and combinatorial chemistry (CC) soon after to feed
the process (Hogan, 1997; Aherne et al., 2002). Other collections containing large numbers
of compounds derived from various sources, including nature, exist in the pharmaceutical
industry and academic institutions and these are also fodder for HTS (Aherne et al., 2002).
However, if fewer compounds could be tested without compromising the probability of
success, the cost and time would be greatly reduced.
The advent of HTS meant the traditional method of solubilizing compounds in aqueous
media under equilibrating conditions was no longer appropriate for the large numbers of
compounds being screened. From then on it became normal practice for compounds to be
dissolved in dimethyl sulfoxide (DMSO) and serially diluted in 96-well assay plates. This
procedure results in a high discovery rate of bioactive compounds, but with poor solubility
properties. In addition, while the efficiency of lead generation is high with HTS, the in vitro
nature of the screening means that the leads generally have higher molecular weights and
are more lipophilic than those obtained via rational drug design programmes. These are
significant problems because most drugs are intended for oral therapy, for which high
molecular weights and high lipophilicity (low water solubility) are undesirable, according
to Lipinski‘s Rule of Five (Ro5) (Lipinski et al., 1997). The Ro5 is a rule of thumb to
evaluate a compound‘s ―drug-likeness‖ in order to predict if it is likely to be orally active in
humans. The Ro5 predicts that, in general, poor absorption or permeation is more likely
when there is more than one violation of the following criteria:

20 ~ Chapter 1 ~
1. Not more than 5 hydrogen bond donors (nitrogen or oxygen atoms with one or more
hydrogen atoms);
2. Not more than 10 hydrogen bond acceptors (nitrogen or oxygen atoms);
3. A molecular weight under 500 Da; and
4. An octanol-water partition coefficient log P of less than 5.
It is so named because each cut-off value is a multiple of five (Lipinski et al., 1997).
Medicinal chemists can quite easily increase the potency of a drug candidate in vitro, but
introducing oral activity is not so simple. In fact, it is unpredictable, time and labour
expensive and can easily become the rate-limiting step in drug development (Lipinski et al.,
1997).
1.3.4 Combinatorial chemistry (CC)
Combinatorial Chemistry (CC) was developed in the wake of HTS, but advances in CC
have also driven improvements in HTS (Petsko, 1996; Newman & Cragg, 2007). CC was
initially based on the simple idea that the probability of finding a molecule by random
screening is proportional to the number of places one looks for it. It follows, then, that
simultaneously generating numerous molecules provides numerous places to look for
activity in a drug candidate (Hogan, 1996). However, CC has evolved from its early focus
on generating large numbers of molecules to a potent tool for the production and
optimisation of leads to drug candidates (Hogan, 1997).
The past decade or so has seen HTS of corporate compound libraries generated by CC
become the main model used by major pharmaceutical companies to discover new drugs
~ Chapter 1 ~ 21
(Keseru & Makara, 2006; Feher & Schmidt, 2003). However, Lahana (1999) questioned
the reasoning behind the paradigm of CC/HTS, claiming that ―After all….when trying to
find a needle in a haystack, the best strategy might not be to increase the size of the
haystack.‖
CC is an umbrella term that covers a wide range of foci, such as the parallel synthesis of
individual organic compounds or complex mixtures of organic compounds, vast phage
display and nucleic acid libraries, and all the technologies associated with handling these
libraries to obtain useful molecules from them (Szostak, 1997). The same author described
CC as ―a brute force alternative‖ to rational drug design.
According to Hogan (1996), the basic chemical requirements for producing combinatorial
libraries are:
1. reactive complementarity of the building blocks;
2. the capacity to carry a wide variety of functional groups; and
3. non-equivocal reaction pathways.
CC has provided medicinal chemists with an unprecedented ability to synthesise very large
numbers of molecules at a lower cost per unit than traditional synthetic methods (Leach &
Hann, 2000). However, at least in the early days of CC, before sample quality and
supporting computational techniques were more highly developed, the hit-rate was
disappointingly low. Indeed, hopes for useful leads from unfocused combinatorial
chemistry libraries of mixtures evaporated years ago (Li & Vederas, 2009).

22 ~ Chapter 1 ~
The problem is that large numbers of molecules do not necessarily provide a drug candidate
as the ability to generate molecules has inherent upper limits. This means that preselection
of molecules for drug candidature is necessary (Hogan, 1996).
Large numbers of molecules also present a major challenge for managing the structural
information obtained from biological screening assays. As the variety of molecules that
must be produced is inversely proportional to the information the chemist starts with, when
there are no data about a target, as many different molecular shapes and sizes as possible
are required, and this is what drove the initial increase in CC (Hogan, 1996).
However, while CC allows for the synthesising of more and more compounds faster and
cheaper than methods based on extracting molecules from natural products (NPs), there
seems little point if those compounds do not show any biological activity. Moreover, most
of our current drugs are derived from NPs (Newman & Cragg, 2007). Despite these
statistics, during the 1980s and 90s, drug companies began to show an increasing reliance
on the systematic testing of synthetic molecules, as opposed to NPs, as their favoured
source of bioactive compounds. One reason is that CC gives researchers complete
knowledge and control of what they are working with (Macilwain, 1998). Furthermore, as
Hogan (1996) points out, screening a diverse array of compounds against a single target
gives a huge amount of information on structure and activity, and even knowledge of what
does not work can be very useful in later medicinal chemistry efforts. Another reason why
some pharmaceutical companies continue to favour CC is that the methodology of CC has
evolved such that libraries are now smaller and focused more towards specific biological
targets or groups of related targets, or towards collections that contain much of the
structural aspects of NPs, instead of towards ever-increasing diversity (Leach & Hann,

~ Chapter 1 ~ 23
2000; Newman & Cragg, 2007). This is not to say that the power of CC should not be
utilised to explore chemical space, but rather that the main aim should be to strike a balance
between diversity and focus (Leach & Hann, 2000; Li & Vederas, 2009).
1.3.5 Bioprospecting for natural products (NPs)
The Australian Concise Oxford Dictionary (2009, p135) defines bioprospecting as ―the
search for animal and plant species from which medicinal drugs and other commercially
valuable compounds can be obtained‖. In the past, NPs were the prime source of new
chemical entities (NCEs). NPs are typically secondary metabolites produced by living
organisms in response to the specific requirements of their local environments (Verdine,
1996; Strohl, 2000).
Secondary metabolites are organic compounds not directly involved in the normal
functioning of an organism. In fact, their biological function is not always obvious.
However, they are not formed without reason. In plants, they are important factors in
survival and propagation and are produced in response to the specific conditions of their
local environment (Verdine, 1996; Strohl, 2000). For example, secondary metabolites may
be involved in chemical defence by deterring herbivores from browsing or insect pathogens
from attacking (Lord, 1987; Wink, 1999). In other cases, the compound may be important
for the everyday existence of the organism, but have serendipitous activity in an unrelated
biological system (e.g. egg-derived proteins) (Colegate & Molyneux, 2008).
Historically, NPs have been a principal source of new chemotherapeutic agents, and many
successful drugs were initially synthesised to mimic the action of molecules found in nature
(Feher & Schmidt, 2003). In fact, more than half of all drugs in current clinical use have a

24 ~ Chapter 1 ~
NP origin (Cragg et al., 1997). Furthermore, in the past century, drugs that trace their
heritage to NPs have more than doubled the average lifespan of humans and ameliorated
non-fatal, but still debilitating, conditions such as chronic pain and depression (Verdine,
1996). Of the over 1,000 NCEs approved as drugs between 1981 and 2002 by the FDA, 5%
were secondary metabolites and a further 23% were derived from NPs (Clardy & Walsh,
2004). The proportion was even higher if compounds ―inspired by‖ NPs are included
(Newman & Cragg, 2007; Li & Vederas, 2009). While the expansion of synthetic medicinal
chemistry during the 1990s caused the proportion of new drugs based on NPs
to drop from
80% in 1990 to only about 50% by the end of the decade, 13 drugs derived from NPs were
still approved by the FDA between 2005 and 2007, with five of those being the first
members of new classes (Li & Vederas, 2009).
Just in the area of cancer over the past 65 years, 155 small molecules were discovered, 73%
being from sources other than synthetic sources, with 47% actually being NPs or directly
derived from them (Newman & Cragg, 2007). In contrast, only a single de novo NCE
arising from CC, sorafenib mesylate (Nexavar
, for renal cell cancer), has been approved
as an anticancer drug in the past 25 years (Newman & Cragg, 2007).
The important properties of compound libraries, whether derived from CC or archiving, are
quality and diversity (Aherne et al., 2002). Obviously, nature has been performing CC for
millennia and the amount of chemical diversity found in natural compounds is unrivalled
(Petsko, 1996; Verdine, 1996). Natural compounds (and existing drugs) are substantially
more diverse than combinatorial compounds, much of the chemical space covered by NPs
and drugs containing no representative combinatorial compounds (Feher & Schmidt, 2003).
Moreover, the diversity of combinatorial compounds is confined to an area where NPs

~ Chapter 1 ~ 25
show little diversity, indicating perhaps the restricted region of chemical space explored by
CC. This relative lack of diversity of synthetics could be why combinatorial libraries have
failed to generate leads at the rates forecast and why the pharmaceutical industry is again
turning to NPs instead of focussing on the production of synthetic drugs (Feher & Schmidt,
2003; Guevara-Aguirre & Chiriboga, 2005).
Another reason could be their lack of quality. The world of drug-like compounds is quite
limited, with most compounds possessing drug-like properties existing in small tight
clusters of chemical space (Lipinski, 2000). Desirable drug-like features (―drug-likeness‖)
include favourable absorption, distribution, metabolism, excretion and toxicity (ADMET)
properties and their higher prevalence in NPs compared to synthetic compounds is partly
explainable by evolutionary pressures (Lipinski, 2000).
Additionally, the chemical properties of NPs mean they are generally more suitable drug
candidates than synthetic compounds. They often, but not always, adhere to Lipinski‘s Rule
of Five (Ro5) (Ganesan, 2008). Overall, the advantages of NPs include:
1. On average, natural compounds are more lipophilic than combinatorial compounds.
This partly explains the low success rate of converting initial hits from HTS/CC to leads
that can be further developed into drugs, in accordance with the Ro5 (Feher & Schmidt,
2003);
2. NPs usually have high binding affinities for specific receptor systems and their
biological action is often highly selective (Feher & Schmidt, 2003). Synthetically
modifying a molecule by introducing additional flexibility, decreasing its size or removing

26 ~ Chapter 1 ~
chiral centres as often happens when synthetic analogues of NPs are made, generally leads
to a loss in specificity and weaker activity (Feher & Schmidt, 2003);
3. NPs are less likely to interact in a detrimental way with common cellular
components, such as membranes or DNA, because they have already been through the
―evolutionary mill‖. In contrast, the new types of organic compounds being examined as
potential drugs might show high potency in vitro, but within the complex
microenvironment of a cell, they may interact undesirably with other cellular components
besides the target (Dobson, 2004); and
4. Many natural molecules are derived from a small group of core structures, including
peptides, nucleosides, carbohydrates, steroids and alkaloids, each of which is generally
associated with biological activity. The systematic structural variation of their substituents
has been invaluable in guiding the development of new therapeutic agents (Hogan, 1996).
Thus, while the generation of combinatorial libraries has been restricted by the availability
of reagents and suitable reactions, NP diversity has occurred within the constraints of
available biosynthetic reactions and precursors and also in the context of biological utility.
In other words, most NPs have a function, and the synthetic routes generating these
compounds have coevolved with the requirements of ligand functionality. This means that
for CC to be more effective, it must evolve beyond synthetic practicability to specifically
address the construction of compounds with relevant physiological function (Feher &
Schmidt, 2003). In other words, it must provide compounds that are more like NPs.
Of course, obtaining leads from NPs can also be problematic. The complexity of many NPs
can restrict their optimisation for therapeutic use via chemical modifications. In addition,
there are challenges involved in identifying the active components from NP extracts as they

~ Chapter 1 ~ 27
typically contain several compounds. Furthermore, obtaining a renewable supply of active
compounds from biological sources can be difficult (Clardy & Walsh, 2004). These
limitations, coupled with the fact that each approach provides very different types of lead
compounds, means that the production of unique bioactive libraries from NPs is
complementary to the generation of synthetic libraries through CC and HTS (Feher &
Schmidt, 2003). In fact, the total synthesis of the potent anticancer NP, discodermolide, in
gram quantities (Smith et al., 2000) highlights the increasing efficiency of synthetic organic
chemistry in reducing the barrier posed by limited natural supply, even for molecules with
very complex structures (Altmann, 2001), and suggests there will always be a place for
skilled synthetic organic chemists (Petsko, 1996).
However, Nature is undoubtedly mankind‘s greatest combinatorial chemist, and many
compounds that are still to be discovered in NPs are probably beyond the imaginations of
even our best scientists (Lewis & Elvin-Lewis, 1977; Dufault et al., 2001; Tulp & Bohlin,
2004). It makes sense that a multidisciplinary approach to drug discovery, involving the
generation of novel molecules from NPs combined with CC may provide the best answer to
the current drug productivity crisis (Newman & Cragg, 2007). This approach is best left to
teams of medicinal chemists and large pharmaceutical companies. However, there is still an
important role for the individual laboratory interested in particular NPs and their effects on
specific diseases.
NPs can have a plant, animal or bacterial origin and be found anywhere in the world. As
chemical diversity is a function of biodiversity, it is often assumed that tropical regions,
where about two-thirds of biodiversity exists (Pimm & Raven, 2000), will provide us with a
plethora of medicines (Tulp & Bohlin, 2002). However, it is important to note that the

28 ~ Chapter 1 ~
world‘s oceans, which cover over 70% of the earth‘s surface, are also teeming with
untapped biological diversity, each millilitre containing over 1,000 microbes (Cragg &
Newman, 2002). In addition, soil contains over 1,000 species of microbial flora per cubic
centimetre and should not be overlooked as a source of NPs. Moreover, it has been
estimated that less than 1% of all microbes and less than 10% of fungi have been identified,
so there exist further opportunities for drug discovery (Cragg & Newman, 2002;
Ghisalberti, 2008).
Notwithstanding the future opportunities and, indeed, past leads and approved drugs
obtained from animals (e.g. ES285 from a marine mollusc, Faircloth & Cuevas, 2006) and
microbes (e.g. antibiotics), plants remain the principal focus of biologically driven drug
discovery programmes. Indeed, the aim of the current project was to try to identify
compounds in plants that may be of use in cancer therapy. Therefore, the next section of
this review will focus on approaches used to discover drugs from plants. Particular
emphasis is placed on anticancer agents derived from ethnomedical knowledge and issues
related to using this approach.
1.4 DRUGS FROM PLANT SOURCES
Prominent pharmacognoscists and ethnobotanists, such as Norman Farnsworth and James
Duke, believe that ―somewhere in the plant kingdom there is a remedy for everything‖
(Duke, 1990, p492). More than 7,000 compounds used in Western medicine are derived
from plants (Clapp & Crook, 2002). It is well established that plants have been a prime
source of highly effective conventional drugs, including many clinically relevant anticancer
compounds (Cordell et al., 1991; Ansah & Gooderham, 2002; Newman & Cragg, 2005).
Many other currently used anticancer agents were derived and synthesised from lead
compounds discovered in plants (Grever et al., 1992; Newman & Cragg, 2005). In fact,

~ Chapter 1 ~ 29
more than half of all pharmaceuticals, including cancer therapies, are derived wholly or
partly from plants (Melnick, 2006a). Furthermore, the National Cancer Institute (NCI) in
the USA screened samples from an estimated 12,000 species of plants between 1960 and
1982 for just one disease category, which yielded three major anticancer drugs. This
represents a hit rate of 1 in 4,000 (Cragg et al., 1998), much more economical than the one
drug from a million molecules screened quoted for CC/HTS (Carnero, 2006).
Consequently, there are over 60 plant-derived compounds currently in clinical trials for
cancer therapy alone (Saklani & Kutty, 2008). It is clear that, despite various challenges
encountered in plant-based drug discovery, NPs isolated from plants will remain an
essential component in the search for new medicines (Jachak & Saklani, 2007).
There are distinct advantages to using plants as the starting point in any drug development
programme. In most cases plants are a renewable source of starting material. Plants provide
a virtually unlimited source of novel and complex chemical structures that most likely
would never be the subject of a beginning synthetic programme (Fabricant and Farnsworth,
2001).
Bioprospecting can result in whole new classes of materials that even our best chemists
could probably never even imagine. And while the ability to synthesise new proteins is
growing exponentially, our current understanding of structural biology is still too shallow
to allow us to produce the kinds of molecules available in nature. While we cannot even
dream of making all possible combinations, Nature has been experimenting for two billion
years (Macilwain, 1998). In addition, any bioactive compounds obtained from plants that
have been used long-term by people might be expected to have low human toxicity
(Fabricant & Farnsworth, 2001).
30 ~ Chapter 1 ~
Plants represent the second largest source of global biodiversity (15%) after insects ("New
drug," 2002; Tan et al., 2006). Estimates of the number of higher plant species on Earth
range from 200,000 to 1,000,000 (Pimm, 1995) and only a small fraction have been
thoroughly examined for medicinal value. It therefore seems logical that an abundance of
drugs from plant sources are as yet undiscovered. Approaches to selecting plants to be
tested for new bioactive compounds range from random selection to more guided selection
strategies such as the chemotaxonomic approach and the ethnopharmacological approach
(Cordell et al., 1991; Soejarto, 1996; Shoemaker et al., 2005) which are discussed in turn
below. Usually a research group would choose just one of these strategies. However, they
do not have to be mutually exclusive and several large databases have been set up that
facilitate such a multi-pronged tactic. For example, to 2001 the NAPRALERT database
(http://www.napralert.org) contained information covering the pharmacological/biological
activity, taxonomic distribution and ethnomedical uses of nearly 44,000 species of higher
plants, making it possible for researchers to correlate ethnomedical use with experimental
biochemical or pharmacological activities to identify plants having both types of activity
for a given effect (Fabricant & Farnsworth, 2001).
However, the search for anticancer agents from terrestrial plants is a complex process that
demands the involvement of not only scientific expertise, but also expertise in a broad
spectrum of human endeavours including diplomacy, international laws and legal
understandings, social sciences, politics, anthropology, and basic common sense. Equally
important is the fact that such endeavours must be governed by international bureaucratic
and regulatory procedures (Tan et al., 2006). Some of these issues will be discussed further
in section 1.4.4.2.
~ Chapter 1 ~ 31
1.4.1 Random approach
A widely adopted plant drug discovery approach is the screening of a large range of diverse
plant samples for one or more phytochemicals or biological activities. The reasoning
behind this approach is that, since each plant species produces a set of unique chemicals, a
large array of taxonomic diversity reflects a great diversity of chemical compounds. This
biodiversity-based screening method is often referred to as a ―random‖ collection and
screening approach. However, such a term can be misleading as botanists do not simply
walk into the forest blindfolded. For example, certain plants, widely cultivated species and
those that have been previously collected and tested for the same therapeutic category, are
avoided in the collection process (Soejarto, 1996).
Following random selection, plants can be screened for phytochemicals. Screening for
phytochemicals is simple to perform, but the proportion of false-positives and false-
negatives is high, making results difficult to interpret. More significantly, it is usually
impossible to relate one class of phytochemicals to specific biological targets. For example,
the flavonoids produce a vast array of biological effects that are usually not predictable in
advance (Fabricant & Farnsworth, 2001). Another option is to screen for biological activity.
The most extensive programme that involved random selection of plants followed by one or
more biological assays was sponsored by the NCI. Between 1960 and 1981, the NCI
systematically screened 114,000 extracts of 40,000 plants for anticancer activity. As only
three clinically active anticancer drugs came out of the programme, the NCI has since
modified its strategy to prioritise known medicinal plants when relevant information is
available (Cragg et al., 1994; Dewick, 2002). Overall, in view of the large number of plants
to be screened, and the host of therapeutic targets against which tests must be conducted,
the biodiversity-based drug discovery approach is considered a very expensive process,

32 ~ Chapter 1 ~
with little chance of delivering a hit (Soejarto, 1996). Dewick (2002) contended it is
probably only justified in certain areas, where the current range of drugs is critically
inadequate or inefficient. He explained that the NCI‘s initial adoption of the random mass-
screening strategy was because cancer was considered to be in that category.
1.4.2 Chemotaxonomic relationships
Besides random selection, plants are often chosen based on their taxonomy. The rationale
here is that, since related plants tend to produce similar chemical compounds, the closer the
taxonomic relationship, the better are the chances that similar or related compounds may
occur in these taxa (Verpoorte, 1998). Thus, when a compound is of medical or
pharmaceutical importance, attempts are made to search for similar or related compounds
in related taxa. These might be other varieties within the same species, other species within
the same genus, or even other genera within the same family (Soejarto, 1996). The
chemotaxonomic approach can also be used as a negative indicator. For example, if a
cytotoxic compound has been found in several related species but experiments have shown
it has no value as a lead, screening further related species could be stopped. Additionally
knowledge of chemotaxonomy can be helpful in identifying active compounds (Verpoorte,
1998).
An example of the use of chemotaxonomic relationships to search for medically important
compounds is provided by the field search of other Taxus species with higher paclitaxel
content than Taxus brevifolia (see 1.4.4.1.3). In general, when searching for species that
may contain similar or related compounds with the same biological activity, but in higher
yields than the original species, chemotaxonomically-based field searching promises a
productive return. However, when looking for compounds with different biological
~ Chapter 1 ~ 33
activities, the chances of finding novel structures via this approach are too low to make it
worthwhile (Soejarto, 1996).
1.4.3 Field observations
Alternatively, ecological information can be used to help select suitable plants for further
screening. Given secondary metabolites are frequently produced by plants as a chemical
defense against potential predators and pathogens (Wittstock & Gershenzon, 2002; Becerra
et al., 2009), field observations that point to such interactions between organisms might
indicate the presence of useful NPs (Soejarto, 1996). Young leaves and seedlings might be
expected to have more secondary metabolites than older parts of a plant so as to be more
strongly protected from predators (Verpoorte, 2000).
Similar to the famous story of how Fleming discovered the Penicillium mould, careful
observations of biological interactions could theoretically lead to the discovery of new
drugs. For example, a novel antifungal flavonoid, kaempferol rhamnoside, was isolated
following a bioassay-guided study of Myrica gale L. after field observations of this shrub,
indicated an absence of predation by herbivorous insects and a lack of pathogenic fungal
infestation (Soejarto, 1996). However, to date, no data could be found on actual NCEs
discovered based on field observations of interactions between plants and other organisms.
1.4.4 Ethnopharmacology
Another undeniably valid approach to drug discovery is ethnopharmacology.
Ethnomedicine has been broadly defined as the use of plants by humans as medicines, but
this use could be more accurately called ethnobotanic medicine (Fabricant and Farnsworth,
2001). Northridge (2002) defines ethnomedicine as the folk medicines of particular ethnic
groups and asserts it is dependent on location. All over the world, indigenous cultures

34 ~ Chapter 1 ~
traditionally used the plants available to them in their local environments to treat diseases
and promote health and these folk remedies were generally passed down orally (Northridge,
2002). Fossil records indicate that people have used plants as medicines for at least 60,000
years (Kong et al., 2003) and almost 65% of the world‘s population continues to use plants
as their primary mode of healthcare (Fabricant & Farnsworth, 2001; Dufault, 2001).
1.4.4.1 Advantages of ethnopharmcological approach
Ethnopharmacology is a highly diversified approach to drug discovery involving the
observation, description, and experimental investigation of indigenous drugs and their
biological activities (Fabricant and Farnsworth, 2001). Intuitively, the rate of drug
discovery through the use of ethnopharmacological data would be expected to be much
greater than with random collection. Indeed, Chapuis et al. (1988) pre-selected plant
species based on traditional medicinal use and demonstrated a relatively high proportion
showed promising activity. Spjut and Perdue (1976) revealed in a retrospective (to that
time) analysis of the early NCI programme in which many species of plants were tested for
antitumour properties, that the percentage of active leads based on ethnomedical use was
substantially above that based on either random screening or taxonomy.
Fabricant and Farnsworth (2001) point out that any of the 250,000 higher plant species on
earth could conceivably produce a new drug. However, given the virtually limitless
introduction of novel mechanism-based bioassays, there is a very low probability of
collecting all 250,000 species and screening them for more than one biological activity.
Thus, researchers should judiciously choose species most likely to produce useful activity
and the biological targets must represent the activities best correlated with the rationale for
plant selection. Hence, selection of plants based on long-term human use in conjunction

~ Chapter 1 ~ 35
with appropriate biologic assays that correlate with the ethnomedical uses seems to be most
appropriate (Fabricant & Farnsworth, 2001).
There are hundreds of examples of plants used by indigenous peoples to treat cancers and
other ailments that have led Western medicine to anticancer agents (Graham et al., 2000).
While not necessarily discovered as a direct result of researchers utilizing
ethnopharmacological knowledge as a guide, some of the most powerful anticancer drugs
in current use, vinblastine, vincristine, etoposide and paclitaxel (Taxol®), were all originally
developed from plant sources that have reported ethnomedical uses (Kong et al., 2003;
Cragg & Newman, 2005; Heinrich & Bremner, 2006).
There are over 120 distinct compounds currently used as major chemotherapeutic drugs,
including several used in conventional cancer treatment, that were developed from
botanical sources and 80% of these have had an ethnomedical use identical to or related to
their current use (Fabricant & Farnsworth, 2001). That statistic should speak for itself.
This thesis is primarily concerned with finding compounds from plants traditionally used
by Aboriginal people that may be of use in the treatment of cancer. However, it is important
to understand that within local communities conditions referred to as ―cancer‖ may not be
what is clinically recognised as cancer. This is because cancer, as a specific disease entity,
is likely to be poorly defined in terms of folklore and traditional medicine (Newman &
Cragg, 2005). Furthermore, generally speaking, indigenous cultures most commonly use
plants to treat infectious diseases such as gastrointestinal problems, skin infections and
respiratory illnesses rather than in the treatment of cancer. It is, therefore, frequently
difficult to establish a direct link between traditional plant remedies and true neoplasms

36 ~ Chapter 1 ~
(Heinrich and Bremner, 2006). The following examples are just a selection of the hundreds
of plants used by indigenous people to treat ―cancers‖ or other ailments that have led
Western medicine to anticancer agents.
1.4.4.1.1 Podophyllum peltatum
One of the best known examples is etoposide, derived from the mayapple plant
(Podophyllum peltatum). Native American Indian tribes used mayapple to treat various
ailments, but scientific investigations led to the discovery of the bioactive constituent
podophyllotoxin and ultimately to the semisynthetic compounds etoposide and teniposide
(Cragg & Newman, 2005). Etoposide was approved by the FDA in 1983 for use in patients
with various cancers (Hande, 1998).
1.4.4.1.2 Catharantus roseus
Long before modern researchers learned of the plant's valuable and varied properties, folk
healers all over the world were using the Madagascar or rosy periwinkle (Catharantus
roseus) for a host of medicinal purposes (Crellin & Philpott, 1989). Research teams from
the University of Western Ontario, Canada, and the pharmaceutical company, Eli Lilly,
independently became interested in this plant, on hearing of a "periwinkle tea" that was
drunk in Jamaica as an antidiabetic. Subsequent testing found it to have no hypoglycaemic
activity, but treated test animals became susceptible to bacterial infection and this
observation resulted in extensive studies to determine if immunosuppressive principles
caused these effects. Eventually, this research led to the development of two potent
anticancer alkaloids, vinblastine and vincristine (Duffin, 2000; Dewick, 2002). In the
1960s, a diagnosis of Hodgkin‘s lymphoma was a virtual death sentence. Now, vinblastine
achieves an 80% remission rate for sufferers of this disease (Mukherjee et al., 2001; Kong
et al., 2003). Before the discovery of vincristine, only one in five childhood leukemia

~ Chapter 1 ~ 37
victims lived. Today, 99% of them survive, thanks to the rosy periwinkle (Mukherjee et al.,
2001).
1.4.4.1.3 Taxus brevifolia
Paclitaxel, sold under the tradename Taxol®, is one of the most powerful and widely used
anticancer drugs available today. Indeed, it is now the world‘s biggest selling anticancer
drug (Walsh & Goodman, 2002). The natural source, the Pacific yew tree (Taxus
brevifolia), is an environmentally protected species and one of the slowest growing trees in
the world (Rowinsky & Donehower, 1995). Isolation of the active compound, which is
contained in the bark, involves killing the tree, and the quantities available by this method
are pitifully small (Blume, 1991). It would take three to six 100-year-old trees to provide
enough paclitaxel to treat just one patient (Blume, 1991; Dewick, 2002). Luckily, a closely
related analogue of paclitaxel, baccatin III, was discovered in the leaves of a related
European species of ornamental shrub, Taxus baccata (Denis et al., 1988). Although the
extraction and subsequent chemical elaboration of baccatin III to paclitaxel was very
laborious, the source was renewable, and sufficient quantities were obtained to carry out
clinical trials. McGuire et al. (1989) showed that paclitaxel exhibited very promising
activity against advanced ovarian cancer, and in 1992 the FDA approved paclitaxel for the
treatment of this condition (Cragg et al., 1993). Subsequently, paclitaxel was FDA-
approved for advanced breast cancer in 1994 and for early stage breast cancer in 1999
(Feng & Huang, 2001). Since then, paclitaxel has also been approved for use in other
countries too and for treating other types of cancers, including non-small cell lung cancer
and Kaposi‘s sarcoma (Panchagnula, 1998; Singla et al., 2002; Oberlies & Kroll, 2004).
Despite numerous references in folk lore to the cancer healing properties of the yew tree,
the ―discovery‖ of paclitaxel came out of a random screen by the NCI, not from an
ethnobiomedical lead (Lewis, 2000; Heinrich and Bremner, 2004). However, its bioactivity

38 ~ Chapter 1 ~
has been known since ancient times. Native Americans have long used T. brevifolia for
medicinal purposes and other Taxus species were important to medieval Europeans, Druids,
Celts, ancient Greeks and Romans (Walsh & Goodman, 2002). Even Julius Caesar himself
mentioned in his "Gallic Wars" that Catilvolcus committed suicide by consuming extracts
from the yew tree (Caesar, 50-40 B.C.). Furthermore, the Himalayan yew (T. baccata ssp.
wallichiana or T. wallichiana) was used in Ayurvedic and Tibetan traditional medicine
specifically as a cancer treatment (Chattopadhyay et al., 1996; Lewis, 2000). In retrospect,
if researchers had been aware of these traditional uses of the yew, perhaps paclitaxel may
have been developed as a drug much earlier.
1.4.4.1.4 Curcuma longa
Turmeric, a spice derived from the rhizomes of Curcuma longa, has been used in India for
medicinal purposes for centuries and its use continues today. Its active constituent,
curcumin, has been shown to exhibit a wide range of beneficial properties, including
antiinflammatory, antioxidant, chemopreventive and chemotherapeutic activity (Hatcher et
al., 2008). For example, curcumin induces apoptosis in a wide variety of cell lines in
culture (Roy et al., 2002; Deeb et al., 2007). Additionally, it down-regulates the expression
of transcription factors (e.g. NF-), enzymes (e.g. COX-2), cytokines (e.g. TNF),
chemokines, cell surface adhesion molecules, cyclin D1 and growth factor receptors (e.g.
EGFR and HER2) (Aggarwal et al., 2003). These activities, combined with its low toxicity,
have led to scientific interest in curcumin‘s potential for cancer therapy as well as cancer
prevention and clinical trials are ongoing. Phase I clinical trials have been completed with
patients affected by various types of cancer generating promising results and Phase III
clinical trials are currently underway in patients with advanced pancreatic cancer
(Karunagaran et al., 2005; Hatcher et al., 2008).

~ Chapter 1 ~ 39
1.4.4.1.5 Scutellaria baicalensis
Scutellaria baicalensis (also known as Chinese skullcap or Huang Qin), a member of the
mint family, is an important Chinese herbal medicine that has been used historically to treat
many diseases, including cancer (Ye et al., 2002). Several studies have verified this plant‘s
effectiveness against various types of cancers. Baicalin, after conversion to baicalein in the
gut, has been implicated as the active ingredient, possibly working by inducing cell cycle
arrest and apoptosis and/or inhibiting cyclooxygenase (COX)-2 or lipooxygenase activity
(Chan et al., 2000; Ye et al., 2002; Nelson & Montgomery, 2003; Zhang et al., 2003). A
more recent investigation suggested that another active constituent, wogonin, may also be
responsible for its antitumour properties via induction of apoptosis and reduction of
telomerase activity (Huang et al., 2010). No clinical reports could be found in the published
literature, but toxicological studies in rats and mice have established safe intravenous doses
for wogonin (Qi et al., 2009). Additionally, baicalin, as a major component of the
commercially available herbal mixture, PC-SPES, has been safely used to treat prostate
cancer patients (Ikezoe et al., 2001; Nelson & Montgomery, 2003).
1.4.4.1.6 Euphorbia peplus
Closer to home is the case of Euphorbia peplus, known variously as radium weed,
milkweed and petty spurge (Ogbourne et al., 2007). Originally native to Europe and North
Africa, the distribution of this prolific small annual herb is now almost cosmopolitan in
disturbed locations (Jakupovic et al., 1998). Historically, the milky sap of E. peplus has
been widely used as a home remedy against many conditions, including carcinomas
(Weedon & Chick, 1976). For example, Australian Aboriginal people and colonial
physicians removed skin cancers by dabbing them with the sap of this weed (Low, 1990).
Additionally, it was used in the Ukraine in the 1900s as a treatment for cancer of the
stomach, liver and uterus while in Mauritius a decoction of the leaves was drunk to treat

40 ~ Chapter 1 ~
dysentery and diarrhoea and in Saudi Arabia an infusion of the leaves was used to lower
blood pressure (Schmelzer & Gurib-Fakim, 2008). However, herbalists have known of the
medicinal properties of the corrosive latex since ancient times. In fact, Juba II, the king of
Numidia (now Algeria/ Tunisia) and Mauretania (now Algeria/ Morocco) during the first
century BC, named the genus after his personal physician, Euphorbus, who reportedly used
the sap as an ingredient in his medicines (Scott & Karp, 1996; Jassbi, 2006). Galen,
working in the second century, also used sap from Euphorbia species as part of his
remedies (Toledo-Pereyra, 1973; Scarborough, 1978). Guided by such
ethnopharmacological knowledge imparted by his mother, Dr Jim Aylward and a team led
by Professor Peter Parsons from the Queensland Institute of Medical Research (QIMR)
successfully identified a potent anticancer agent from the sap of E. peplus (Ogbourne et al.,
2004; Hurst, 2009). The active principle, ingenol 3-angelate (I3A), formerly known as
PEP005 but now called ingenol mebutate, is being developed as a safe topical treatment of
non-melanoma skin cancers and precancerous actinic keratoses (Siller et al., 2009).
Subsequently, ingenol mebutate has shown potential in the treatment of bladder cancer and
leukemia (Hampson et al., 2005; Ogbourne et al., 2007).
1.4.4.1.7 Scaevola spinescens
Scaevola spinescens, otherwise known as Maroon bush, Currant bush or Prickly fanflower,
is another example of a plant used by Aboriginal people to treat ailments, including cancer
(Ghisalberti, 2004). Anecdotal evidence led to the 1957 instigation of a programme
whereby the Chemistry Centre of Western Australia (CCWA) prepared and supplied water
extracts of S. spinescens free of charge to terminally ill cancer patients (Ghisalberti, 2004).
No new patients were added after 1991, but eight patients diagnosed with terminal cancer
prior to this, having received approval from their doctors, were still being treated up until at
least 2000 (Kerr, 1999; CCWA, 2001). In 1989, a sample of a methanol extract of S.
~ Chapter 1 ~ 41
spinescens was sent to the NCI, and shown to be active in all 60 cell lines tested. However,
although the results indicated significant activity in this material, its lack of selective
toxicity for different cell types precluded it from having great interest. Kerr et al. (1996)
identified the presence of several taraxerenes in various extracts of S. spinescens and
isolated the most abundant, myricadiol. These authors suggested that these compounds may
be of potential use as lead compounds for synthetic anticancer agents. However, subsequent
studies showed that some taraxerenes themselves have antitumour properties (Takasaki et
al., 1999). For example, while myricadiol failed to show any antiproliferative effects
against the leukemic and lung cancer cell lines tested, the same study revealed its moderate
inhibitory activity against COX-1 and COX-2 (Lee et al., 2006). Given that specific COX-1
and COX-2 inhibitors have demonstrated antiproliferative effects against bladder, prostate
and breast cancer in vitro (Mohseni et al., 2004; Farivar-Mohseni et al., 2004; McFadden et
al., 2006), myricadiol may be useful against these types of cancer. Alternatively, it may
have a potential role in antiangiogenesis therapy (Rahman & Toi, 2003; Zhong & Bowen,
2006).
1.4.4.2 Challenges of the ethnopharmacological approach to bioprospecting
It seems plenty of evidence exists to support the ethnopharmacological approach to
bioprospecting. Indeed, in the early 1990s this appeared to be the way pharmaceutical
companies were heading. Developing nations of the tropics, where the bulk of terrestrial
biodiversity exists, began to prepare for a veritable gold rush of Western scientists seeking
new drugs (Mendelsohn & Balick, 1995; Macilwain, 1998). Treaties endorsing the concept
of nations holding property rights to their indigenous species were signed and impoverished
governments rubbed their hands together as environmental ministers of Third World

42 ~ Chapter 1 ~
countries publicly declared their readiness to strike hard bargains. However, the anticipated
rush did not materialise (Macilwain, 1998).
As already stressed, since plant-derived drug discovery efforts began, the
ethnopharmacological approach to screening has been the most successful (Chapuis et al.,
1988; Fabricant & Farnsworth, 2001). However, the random collection of plants provides
the highest biodiversity and is surging ahead as the method preferred by Big Pharma. This
approach, followed by automated, robotised, in vitro screening requires significantly more
financial resources than the ethnopharmacological approach, which is more suited to
academic institutions who have less capital, but (arguably) more time to invest (Fabricant &
Farnsworth, 2001) and are inherently more liable to spend resources on altruistic pursuit.
So, if the ethnopharmacological approach to drug discovery is so successful, why aren‘t all
the big drug companies climbing over themselves to be the first to engage indigenous
cultures and tap into their traditional knowledge (TK) of medicinal plants? Several reasons
are postulated below.
1.4.4.2.1 Loss of habitat
One reason might be that terrestrial (and marine) ecosystems are diminishing rapidly. It is
no secret that Man‘s activities have had, and continue to have, a devastating effect on the
natural environment. Continued deforestation due to clearing for farming and housing to
support the world‘s population of over 6 billion people is an obvious factor. Other
agricultural practices as simple as slash-and-burn methods to more modern techniques
involving fertilising and pesticides are primarily responsible. However, besides farming,
industry and urban living also produce air and soil pollution with far-reaching
consequences. For example, energy consumption, waste disposal and poisonous products of

~ Chapter 1 ~ 43
modern lifestyles all combine to destroy natural habitats on a global scale. Exacerbating the
problem is the impact of Man‘s activities on water pollution and the level of the water
table. Then, of course, there is global warming. While there is still heated debate on
whether climate change has been induced by man‘s activities or not, there is much
scientific evidence in support of global warming itself and this undeniable phenomenon is
having a very real impact on natural ecosystems (Dessler & Parson, 2010). Add to all this
the destructive effects of invasive exotic species with no natural predators introduced into
local habitats by Man and it is no wonder that the Earth is a very different place to what it
was even a century ago (Wilson, 2002). A typical estimate of the number of recent plant
and animal extinctions is 27,000 species per year. Even more conservative estimate put the
figure at about 13,500 species lost, or at least committed to extinction, each year. This is in
stark contrast to 785 species, the total number of documented extinctions worldwide in the
past 500 years. However, the total number of extinctions is unknown as many species have
likely become extinct before they were even known to exist (Sax & Gaines, 2008).
Habitat destruction is the leading cause of species extinction (Pimm & Raven, 2000). In the
biodiversity-rich tropical rain forests alone, clearing now eliminates about 1 million sq. km
every 5-10 years, and burning and selective logging severely damages several times the
area that is cleared (Pimm & Raven, 2000). Looking ahead, it is calculated that by 2050,
human land-use practices will have reduced the habitat available to Amazonian plant
species by approximately 12–24%, resulting in 5–9% of species becoming committed to
extinction (Feeley & Silman, 2009). While this is significantly fewer than previous
estimates (Hubbell et al., 2008), it still represents over 2,000 vascular plant species, and is
obviously of real concern to conservationists. Big Pharma are undoubtedly aware of the
statistics too. Perhaps their preference for the random approach to selecting plants for their

44 ~ Chapter 1 ~
drug discovery programmes is simply a reflection of their anxiety to screen as many as they
can before it is too late and they disappear forever. Intuitively, it would seem likely that
plants with a known ethnomedical history would have a higher chance of being conserved
than those with no known use and so the urgency is focused on testing random samples.
1.4.4.2.2 Environmental laws
Quite apart from the alarming rate of species extinction through habitat destruction, new
regulations in environmental protection protocols have compounded the difficulty of
finding and identifying new biological materials (Gollin, 1999). While environmental legal
milestones such as the well-known Rio de Janeiro Biodiversity Treaty and the Kyoto
Protocol were designed to protect the world‘s ecological health while still allowing
economic development, their regulations may be seen as somewhat of an inconvenience or
even a barrier to generating profit by the more short-sighted drug companies. However, as
Gollin (1999) points out, if the new rules for bioprospecting succeed in reducing
biodiversity loss (the greatest risk to NP research), while still allowing research to continue,
any inconvenience they create will be justified.
The Convention on Biological Diversity (CBD), a groundbreaking initiative adopted by
most of the world‘s governments, is dedicated to promoting sustainable development. The
CBD was established at the Rio De Janeiro Earth Summit in 1992 and has three main goals:
(i) the conservation of biological diversity, (ii) the sustainable use of its components, and
(iii) the fair and equitable sharing of the benefits from the use of genetic resources. It is
recognised as a landmark document, reminding decision makers that natural resources are
not infinite. While past conservation efforts aspired to protect particular species and
habitats, the CBD recognises that whole ecosystems, as well as individual species and even

~ Chapter 1 ~ 45
genes must be sustainably used for the benefit of all mankind. However, this must be done
so as not to cause the long-term decline of biological diversity (CBD, 2000).
Guevera-Aguiree and Chiriboga (2005) also stressed the importance of bioprospectors
placing the interests of the collective ahead of their own and protecting (as their own) the
very source that generates any potential earnings: a healthy and rationally used
environment. They believe that environmental law enforcement, locally and internationally,
is the cornerstone to guarantee the proper use, and not abuse, of natural resources. Indeed,
this principle makes excellent economic sense because, after all, as Wilson (1992, p282)
asserted, ―useful products cannot be harvested from extinct species‖.
This new approach to biodiscovery, which has been effective in identifying new bioactive
leads, is an important step towards understanding the medicinal value of biodiversity and is
also a practical way to link drug discovery with conservation (Coley et al., 2003).
1.4.4.2.3 Access and benefit sharing
Another reason inhibiting the wide-spread adoption of the ethnopharmacological approach
to drug discovery might be the regulations set in place to protect indigenous cultures from
exploitation (Gollin, 1999). There are two issues surrounding the ethics of biodiscovery
processes, access to genetic resources and traditional ecological knowledge and the
equitable sharing of any benefits that may arise from them. As described below, neither has
a simple solution. Consequently, perhaps some drug companies have found that conforming
to all the new regulations and ethical requirements might just be all too much trouble for
them to deal with.
In the past, there have been many instances of companies becoming very rich by using
ethnomedical knowledge at the expense of the indigenous people who provided it. For

46 ~ Chapter 1 ~
example, in defiance of local legislation, cinchona (Peruvian bark) seeds were smuggled
out of South America in the 1850s and plantations set up in Asia for the purpose of
supplying the world with the precious antimalarial compound, quinine (Gollin, 1999;
Philip, 2001). This effectively pushed South American countries out of the world market
(Bravo, 1998). Additional pharmaceutical uses of quinine, quinidine and their derivatives
were discovered which expanded their worth, but not one cent of profit reverted to the
countries where cinchona originally grew, or to the indigenous people who provided the
ethnomedical knowledge (Wallace, 1996; Alter, 2000). Such plunder of natural resources is
now commonly referred to as biopiracy (Krishnamurthy, 2003).
Traditionally, genetic resources were seen to be ―the common heritage of mankind‖
(Krishnamurthy, 2003; Roa-Rodr´ıguez & van Dooren, 2008). In practice, that meant that
industrialised nations took freely of those resources and sold them back to developing
countries as commercial products (Mukerjee, 1994). However, new rules have been
introduced that have shifted the imbalance. As a result, some researchers may be
discouraged from NP research by expensive or extremely time-consuming bureaucratic
requirements put in place out of fears of commercial exploitation (Blaustein, 2006).
The new regulations for bioprospecting and NP research derive from three sources:
international treaties, national laws and professional self-regulation (Gollin, 1999). The
most important international, bilateral treaty protecting nations and indigenous cultures
from biopiracy is the CBD, endorsed by the United Nations (UN) as the authority to set the
standards for the cross-boundary access of genetic resources (Heinrich & Bremner, 2006;
Blaustein, 2006). The CBD established sovereign national rights over biological resources
and committed member countries to conserve them, develop them sustainably, and share

~ Chapter 1 ~ 47
the benefits resulting from their use (Gollin, 1999). This protection of rights is legally
binding, but countries voluntarily agree to commit to the ideals of the Convention and must
make their own laws to enforce them (Blaustein, 2006; Roa-Rodr´ıguez & van Dooren,
2008). Furthermore, a historically prominent hotbed of biopirates, the USA, has still not
voted to ratify the CBD, despite President Clinton signing in 1993. With Andorra recently
announcing it will soon endorse the treaty, the USA will become the sole non-signatory of
the CBD (Holding, 2010). The powerful pharmaceutical industry lobbying Congress is a
major reason why the US has not yet ratified the accord. This has prompted nations such as
Brazil and India to exercise their sovereign rights, implementing stricter controls on
medicinal plants. Unfortunately, as a consequence, much genuine scientific collaboration
has been thwarted, tied up in bureaucratic red tape (Verma, 2002; Blaustein, 2006).
On the other hand, many scientists point out that researchers were already developing more
equitable relationships and implementing specific mechanisms for accessing genetic
resources before the advent of the CBD (Cox & Balick, 1994). They argue that all the CBD
did was enhance awareness and expectations on the part of the host country (Blaustein,
2006).
As well as seeking direct access to plant resources, bioprospectors often want access to the
TK1 of the indigenous peoples who have been the guardians and repositories of those
resources. In many cases they also seek intellectual property (IP) rights, and the exclusive
legal entitlement to exploit the resources and TK for commercial purposes. There is no
doubt that researchers add immense scientific value during product development. Creating
1 see Dutfield (2001) for discussion of what exactly constitutes TK.

48 ~ Chapter 1 ~
this scientific value requires enormous amounts of money, time and human resources, and
the failure rate in drug development is very high. Obviously, the results deserve to be
legally protected (Chacko & Sambuc, 2003). However, it has been recognised for some
time that the TK practitioners who provided the original leads have also contributed
to develop that TK into innovation, thus they must rely on more industrialised countries
(Stone, 2008). Consequently, disputed claims are common and can hamper fantastic
potential for medical breakthroughs as well as the development of sustainable industries for
the indigenous people, in which case everybody loses (Chacko & Sambuc, 2003).
It is no longer a question of whether indigenous peoples should benefit from products that
have been developed from their TK. The CBD, the World Intellectual Property
Organization (WIPO), individual ethnobiologists and organizations, such as the Society of
Economic Botany, the International Society of Ethnobiology and the American
Anthropological Association, have emphasised the importance of ethical reciprocal conduct
by all parties who perform research with indigenous peoples. The challenge is to ascertain
what the indigenous peoples themselves see as being benefits and how these can be
provided by the organizations collaborating with them (Bierer et al., 1997). For example, it
might seem logical to compensate indigenous cultures for their TK by simply according
them a percentage of the profits from a drug once it is commercialised, but this may require
a five to ten year waiting period, if it ever occurs at all, in which case the local people
would not see any benefits (King et al., 1996).
In 2002, member states of the CBD adopted the voluntary Bonn Guidelines on Access to
Genetic Resources and Fair and Equitable Sharing of the Benefits Arising out of their
Utilization, which offer guidance in the roles and responsibilities of the various parties

~ Chapter 1 ~ 49
involved in access and benefit sharing. Similarly, the Aboriginal Knowledge and
Intellectual Property Protocol, developed after extensive dialogue with Aboriginal
organisations and researchers, has been recognised by the UN as breaking new ground in
respectful relations between researchers and Indigenous people in world terms (DKCRC,
2008; Ferguson, J., personal communication, 31st May, 2010). Ultimately, however, the
value of voluntary initiatives depends on public pressure and they are most effective when
corporations fear consumer reaction. This means that, when it is time to commercialise an
innovation arising from the use of TK, it will be completely up to corporate goodwill
whether a company decides to recognise or compensate an indigenous community (Roehrs,
2007).
A base requirement of the CBD is that permission must be obtained before biological
samples can be collected. To conform to the CBD, an Access and Benefit Sharing
Agreement (ABA) must be agreed upon by the researcher and the source country providing
the NP. A complicating factor for drug screening programmes is that the ABA must
stipulate what the NP will be used for. In this way source countries know up-front how the
genetic resources will be exploited and the benefits that will be shared. Benefits may
include support for research and conservation, contributions of equipment and materials,
assistance to indigenous and local communities, up-front fees, milestone payments and
royalties. If a collector does not agree in advance to provide an equitable share of benefits
to the source country, they will likely be denied access to the samples. Additionally, if a
biological sample is obtained without informed prior consent its value is substantially
reduced and the collector will not be able to pass it on to collaborators, partners or third
partners, the usual procedure for researchers (Gollin, 1999).

50 ~ Chapter 1 ~
There are strict penalties for failing to comply with an ABA. If the CBD is not observed,
the NP can be treated as being poached, resulting in extremely serious consequences for the
company that failed to uphold the deal. For example, unless all public knowledge about the
genetic resource and its use are fully disclosed, any patent on that NP can be revoked.
Additionally, if a researcher illegally obtains a biological sample and then profits from the
material, they may be sued. The risk is that the conditions a court may impose for a
successful product may be far greater than what would have been negotiated as part of an
ABA at the outset, when success is still a highly unlikely outcome. Thirdly, any company
accused of biopiracy will suffer commercially from a bad reputation. Given the existence of
an alternative, ―greener‖ competitor, consumers will likely boycott the products of branded
―biopirates‖. Lastly, criminal charges, including jail terms, may apply to biodiversity
thieves in the same way that hunters are often jailed for poaching or trespassing (Gollin,
1999).
Given the potential risks, many organizations have seen the wisdom in entering into ABAs
for every collection. Other companies have taken the initiative to adhere to voluntary
requirements such as the Bonn Guidelines. For example, Novozymes, a Danish
biotechnology company voluntarily follows disclosure requirements in many developing
countries. Generally, though, the pharmaceutical industry favours contracts and
dogmatically contends that disclosure of origin should not have to be included in patent
applications (Roehrs, 2007).
In 2004, Mt Romance, a West Australian company producing products from the
sandalwood tree, provided the world‘s first case of indigenous intellectual accreditation
through their formal partnership with Aveda (a US-based multinational cosmetics

~ Chapter 1 ~ 51
corporation) and the Kutkabubba community (Marinova & Raven, 2006). Since then, other
companies have also signed agreements with indigenous groups. Notably, in a partnership
initiated by the Jarlmadangah Burru Aboriginal Community (JBAC) of the Kimberley
region of Western Australia, Griffith University and JBAC were joint applicants on several
patents, the most recent filed in October 2008, for exclusive rights in relation to the bark of
the marjarla tree, traditionally used by Aboriginal people for healing and pain relief. They
have since been joined by a third party, a start-up biotechnological company, Avexis, who
have signed a formal ABA, agreeing to share income from sales and to provide the
opportunity to cultivate and supply the plant in sufficient quantities to make the product
marketable in return for the entitlement to commercialise the product (Janke et al., 2009).
Additionally, this PhD project was partly funded by the Desert Knowledge Cooperative
Research Centre (DKCRC), who, in conjunction with the University of Western Australia
(UWA) and the Aboriginal communities represented by the company Ninti One Ltd are all
stakeholders in the event that any commercialised product arises from these studies.
However, some less ethical pharmaceutical companies who are more interested in their
bottom lines than in the idea of equitable sharing of profits, may be deterred altogether
from engaging indigenous cultures to aid in their drug screening programmes.
However, while new legislation concerning benefit sharing has been introduced in many
countries, there is widespread concern that the laws are not stringent enough (Roehrs,
2007). Despite the new regulations, often only an extremely small percentage of a
company's huge profits are given to those who have nurtured the TK from which the
medicine is derived (Chacko & Sambuc, 2003).

52 ~ Chapter 1 ~
The WTO‘s trade-related aspects of intellectual property rights (TRIPS) agreement came
into force in 1995 after nearly ten years of negotiations, but it remains controversial. The
agreement recognises that IP rights are, in essence, private rights and was adopted to
protect and enforce IP rights, thus promoting technical innovation, transfer, and
dissemination of technology to the mutual advantage of both the producers and users of the
information (Goel, 2008). The TRIPS agreement recognises that most of the value of new
medicines and other high technology products lies in the amount of invention, innovation,
research, design and testing involved and aims to help protect those rights through the
patent system as well as settle disputes between members of the World Trade Organization
(WTO) ("Intellectual property," n.d.). It is often argued that the current IP system and its
underlying assumptions are inadequate regarding TK (Dutfield, 2001). There are even
suggestions that patents may not be the most appropriate tool to guarantee equitable
distribution of benefits and recognition of total value of knowledge (Marinova & Raven,
2006). There have been recent instances whereby companies have misappropriated TK by
taking advantage of loopholes in the existing legal framework. For example, in an extreme
case, under the TRIPS agreement, it suddenly became illegal for Indians living in the US to
use the ancient Ayurvedic herbal turmeric in traditional remedies, although the patent was
revoked after a long and costly legal challenge mounted by the Indian government
(Agrawal & Saibaba, 2001; Kalua et al., 2009). Many believe the TRIPS agreement is
tipped too that the new biodiversity laws have actually facilitated biopiracy by
universalizing the US legal system of IP rights (Agrawal & Saibaba, 2001; Tedlock, 2006).
However, until a better system is proposed, ABAs and TRIPS are the only devices available
that might protect indigenous knowledge from those who would exploit it for commercial
gain.

~ Chapter 1 ~ 53
1.4.4.2.4 Cost
Yet another factor alienating Big Pharma from the ethnopharmacological approach is cost.
Pharmaceutical companies generally prefer synthetic compounds for proprietary economic
reasons. This is understandable given it costs millions of dollars to develop a new drug.
When fees and royalties have to be paid to host countries, the expense is even higher.
Moreover, the company has only 10 years to recoup its investment before a patent expires
and generic manufacturers can copy the design (Dufault et al., 2001).
Thus, companies that do have NP drug discovery programmes are generally seeking
bioactive compounds from plants that will serve as lead compounds for synthetic or
semisynthetic development, thus assuring patent protection. This reduces the need to isolate
novel bioactive structures from plants, since the ultimate goal is to use the active
constituents to produce synthetic derivatives with higher efficacy and lower toxicity
(Fabricant & Farnsworth, 2001). However, there is no incentive for pharmaceutical
companies to determine which alternative phytochemical is best because plants are not
patentable. Indeed, even if a NP works better, they often prefer the semi-synthetic
compound as it guarantees higher profits (Dufault et al., 2001).
1.4.4.2.5 Variation
Another problem associated with any drug discovery programme based on plants, either
chosen on the basis of ethnomedical data or randomly selected, is that, as biological
systems, plants display inherent individual variability in their chemistry and can therefore
display varying degrees of bioactivity (Fabricant and Farnsworth, 2001). In these authors‘
experience, possibly 25% of all plants showing promising biological activity in preliminary
assays, failed to have the bioactivity confirmed on subsequent recollections. They
suggested that this was possibly because of variability in the chemistry of plants, although

54 ~ Chapter 1 ~
they acknowledged it could also be due to variable bioassay systems, incorrect taxonomic
identifications or simply mix-ups in labelling of samples. Assuming that discrepancies are
due to the inherent variability between plant samples, then factors such as environmental
conditions, season of harvesting and age of the plants must all be taken into account when
sampling plants for assay.
However, in some cases variable activities between plant collections are very likely due to
incorrect species identification. This can be especially significant when the
ethnopharmacological strategy is employed as locals often only know plants by their
vernacular names and these can change from region to region (Guarrera & Lucia, 2007). In
Australia, Aboriginal there can be many names for the same species between different
Aboriginal languages and even within one language. For example, Euphorbia drummondii
has 8 different names within a radius of about 200 km of Alice Springs. Within an area less
than 600,000 sq. km, the same plant is known variously by 17 different Aboriginal names.
To complicate matters further, different species may have the same Aboriginal name. For
example, the Alyawarr plant name, ―amikwel‖ can refer to either Euphorbia tannensis or
Sarcostemma australe. In the Pitjantjatjara language ―ipi-ipi‖ refers to E. drummondii, E.
tannensis, E. eremophila and any plant with milky sap in general (Latz, 1995). Therefore,
to ensure plants are correctly identified each time they are collected, it is vital that
collections are always documented with representative voucher specimens and that these
are preserved for independent verification (Farnsworth & Bingel, 1977; Soejarto, 1996;
Hildreth et al., 2007).
1.4.4.2.6 Time constraints
While collecting plant samples randomly in a specific geographic area can be done simply
and quickly, collecting plants on the basis of ethnomedical knowledge is a much more time

~ Chapter 1 ~ 55
consuming process. Not only does it require considerable preliminary planning to
determine where each plant grows and how plentiful it is, particular arrangements must also
be made to collect the plants, such as acquiring permits and finding local botanists familiar
with the flora of the region (Fabricant and Farnsworth, 2001). Moreover, many indigenous
cultures, including Australian Aboriginal communities, operate on a slower timeline
compared to the faster pace of modern society. Indeed, researchers are often taken aback by
the almost complete lack of awareness of time as a concept by Aboriginal people (Zur,
2007). This type of seemingly timeless culture actually operates on what has been coined
polychronic time (Hall & Reed Hall, 2001). In extreme polychronic cultures, events take
place as solitary entities, separate from each other, and in no way connected by an ongoing
timeline as many Westerners understand it. In such cultures, even when it appears that
everything is at a standstill, a great deal is probably going on behind the scenes. Scheduling
cannot happen until meetings have taken place to permit essential discussions. Hence, the
amount of time, especially the amount of lead time, required in forging collaborative
relationships is high. Therefore, it is vital that researchers are always aware of the local
time system so they can make the necessary allowances (Hall & Reed Hall, 2001).
The fact that traditional Aboriginal society is classified as polychronic is of particular
relevance to this project. In fact, traditional and contemporary are only words that
nonindigenous people have used to describe indigenous periods in time, and have no
traditional meaning to Indigenous Australians. Indeed, Aboriginals do not even have a word
for time as an abstract concept. This is largely due to the way time is perceived according to
the Dreaming, which is the concept of time as an ―Everywhen,‖ containing both future and
past (Zur, 2007). To further highlight this significant difference in time perception, a local

56 ~ Chapter 1 ~
Aboriginal woman explained to Zur (2007) that NT also stands for ―Not Today; Not
Tomorrow…‖.
Compounding the research obstacles associated with the polychronicity of Aboriginal
society is their notion of equality in knowledge sharing. Relationships must be established
before knowledge is shared. The key word is shared, so there is an expectation of a two-
way exchange of information. This is facilitated by face-to-face communication, which is
also desirable for cultural reasons of trust and respect. The amount of time necessary to
build this trust and respect is naturally not up to the researcher. Therefore, multiple trips to
remote communities are required and this obviously consumes yet more time (Zur, 2007).
All this means that Aboriginal related research takes much longer than a Western person
might expect. The obligatory abandonment of usual scheduling procedures can be
extremely frustrating, especially for drug companies which are generally driven by profit
and therefore pathologically attached to rigid timetables.
1.4.4.2.7 Cultural differences
Other cross-cultural differences can also be a barrier to collaborative ethnopharmacological
research efforts. When people unwittingly apply their own rules to another culture, critical
steps can be omitted and effective research rendered unachievable. If two people from
different cultures meet, they can have difficulty relating because they are not ―in-sync‖.
This is significant because synchrony, the subtle ability to move together, is imperative for
all collaborations. Therefore, respecting cross-cultural differences by paying attention to
aspects of ―the silent language‖ is paramount (Hall & Reed Hall, 2001). For example, the
processes of observation, recording, and other typical Western means of generating data are
often in direct opposition to the way knowledge is traditionally shared in Aboriginal
society. Whereas physical possessions have been traditionally valueless to Indigenous

~ Chapter 1 ~ 57
Australians, knowledge has always been treated as a significant possession. This means
researchers cannot simply sit down and begin asking questions or they risk exhibiting
rudeness severe enough to ruin their chances of ever getting close enough to learn. The
concept of equality in knowledge sharing means that, in return for TK, researchers must be
able to offer something back to the community that is seen as valuable. However, it is
important to avoid neocolonialism, which could occur if the researcher attempts to impose
West-centric structures and ideas in a completely inappropriate context which in no way
meets the needs of the people sharing their knowledge. Therefore, an essential first step is
to communicate effectively and respectfully how the results of one‘s research may help the
people involved (Zur, 2007).
1.4.4.2.8 Communication difficulties
Besides disparities in time perception and the concept of sharing, other cross-cultural
differences may hinder information exchange. For example, where there is a language
barrier, a skilful interpreter might be required. However, it is vital that the interpreter
chosen must have an appropriate awareness of cultural nuances and obey the unwritten
laws of custom so as not to offend the local people (Hall & Reed Hall, 2001).
While we have gleaned some of what our ancestors knew from current and ancient texts,
valuable data have not always been recorded (Lewis & Elvin-Lewis, 1977). This is
especially true of traditional indigenous cultures, including Australian Aboriginals, who did
not have a written language. Additionally, some of the knowledge is highly sacred and is
often kept secret, even from members of the particular culture (Low, 1990; Turton, 1997;
Fabricant & Farnsworth, 2001). It therefore makes sense to study the practices of
indigenous peoples in case they are lost forever, either through neglect or because the
vegetation has been irrevocably changed. Today‘s researchers, with a broader insight and
58 ~ Chapter 1 ~
scientific expertise, have much greater scope to utilise this information than any previous
generation (Lewis & Elvin-Lewis, 1977). Some might consider it tantamount to gross
negligence if we did not seize the opportunity before it is too late.
1.4.4.2.9 Previous failure
Despite the complications of ethnopharmacological approach to drug discovery, one high-
profile company did appreciate the potential benefits. Shaman Pharmaceuticals, based in
San Francisco, aspired to become a model of ethnobotanical bioprospecting, discovering
new medicines while maintaining a commitment of reciprocity to the indigenous cultures.
However, while Shaman Pharmaceuticals did develop several medicinal products by
integrating traditional plant chemistry, ethnobotany, medicine and medicinal chemistry, the
money-losing firm could not afford to comply with FDA requirements that it do more tests
on a proposed drug to treat diarrhoea in AIDS patients. It reinvented itself as Shaman
Botanicals in a bid to operate in the more loosely regulated field of herbal remedies (Abate,
1999), but this company, too, eventually declared bankruptcy in 2001. This company‘s
failure led Economist ("Shaman loses its magic," 1999) to decry ethnobotanical
bioprospecting as a concept, branding it out of date and advocating its abandonment.
However, Clapp and Crook (2002) contend that Shaman‘s experience was simply one of
bad luck and bad timing. The company‘s demise was due more to mismanagement and its
inability to maintain the triple bottom line than to the failure of its vision.
1.4.4.2.10 Misconceptions
Despite the fact that TK has been tried, practised and preserved over many generations in
many parts of the world, the value of this research has been largely dismissed by Western
science. While the quality of data and format of data collection may be very different from
modern evidence-based research, TK is still very valuable. Furthermore, while clinical
studies for modern medicines typically take just 5-10years, ethnomedical data have been

~ Chapter 1 ~ 59
accumulated over centuries (Chacko & Sambuc, 2003). However, the prevailing
misconception seems to be that something old is worth less than something new. Someone
once said that there are but two types of fools: one professes ―this is old and therefore is
good,‖ and the other says, ―this is new and therefore better.‖ However, when judging the
medicinal value of ethnobotanical data, neither view is scientifically valid (Lewis & Elvin-
Lewis, 1977).
The virtually exclusive use of the research-oriented approach to biodiscovery with little
regard for data acquired through the empirical method, has meant that many potential
benefits have been delayed (or even missed altogether). For instance, it is unfortunate that
Western medicine‘s first tranquilizer, reserpine, derived from the roots of Indian snakeroot
(Rauvolfia serpentina), was not used generally until 1952, despite its long history of use in
Ayurvedic medicine (Monachino, 1954; Lewis & Elvin-Lewis, 1977). Similarly, cromolyn
sodium (Intal®), the preventative drug for asthma, was only ―discovered‖ in 1965, although
it was used in the form of seeds from bishop‘s weed (Ammi visnaga) for centuries as part of
Bedouin folk medicine (Lewis & Elvin-Lewis, 1977; Edwards, 2005). Similarly, there are
numerous examples in the area of anticancer therapy, including the few already discussed
(1.4.4.1). It is worth re-emphasising here that, at least until 2001, over half of all major
chemotherapeutic drugs were developed from plants and 80% of those had an ethnomedical
use identical to or related to their conventional use (Fabricant & Farnsworth, 2001;
Melnick, 2006a).
According to Heinrich and Bremner (2006), the contribution of ethnobotanical research to
drug discovery is often simply ignored at best, or regarded as irrelevant at worst.
Sometimes, ethnobotantical data is frequently taken at face value and the role of the

60 ~ Chapter 1 ~
ethnobotanist is perceived to be that of a simple scribe, recording information for the
bioscientists to utilise. These authors explain how ethnobotanists investigate the complex
relationship between humans and plants and how their research is generally based on a
detailed observation and study of the use a society makes of plants, including all the
traditional beliefs and cultural practices associated with this use. Using several examples of
ethnobotany-driven anticancer research, they highlight the potential and complexity of the
multidisciplinary approach to ethnopharmacology and describe what challenges today‘s
ethnobotanists face.
Heinrich and Bremner (2006) emphasise that ―ethnobotanists have a responsibility to both
the scientific community as well as to the indigenous cultures‖, a belief that is the
foundation upon which the research described in this thesis was based. I would now like to
summarise the objectives of the project, the methodology involved and reveal what was
discovered.
1.5 SCOPE OF THE CURRENT PROJECT
1.5.1 Approach
Many native plants have been traditionally used as medicines by the indigenous Aboriginal
people of Australia (ACNTA, 1988; Isaacs, 1987; Low, 1990; Palombo & Semple, 2001;
Mijajlovic et al., 2006; Locher & Currie, 2010). However, Western medicine requires
scientific evidence before pharmaceuticals can be developed, endorsed and supplied to the
public. This means rigorous basic and clinical research is absolutely necessary. The effects
of potential treatments need to be thoroughly investigated through placebo-controlled,
randomised, scientifically valid experiments, and the subsequent data published in peer-
reviewed journals (Parris & Smith, 2003; Trachtenberg, 2002). Additionally, it is important

~ Chapter 1 ~ 61
to realise that the continued knowledge of and use of these resources requires not only their
recognition as local knowledge, but also their multidisciplinary study. Obviously, this is
only possible if the traditional keepers of this knowledge have a say in its future use and
benefit somehow from such research and development (Heinrich and Bremner, 2006).
As outlined previously, recently there has been an increased appreciation of the value of
ethnomedical knowledge as a guide to identifying new therapeutic agents, and a heightened
interest in their modes of action (Kong et al., 2003; Heinrich and Bremner, 2006; Melnick,
2006a). This project aimed to evaluate the anticancer potential of plants identified by
Aboriginal people as having medicinal properties. The goal was to discover or identify a
compound or compounds that may be of use in the treatment of cancer.
As discussed further in section 1.4.4.2.6, it can be a delicate and time-consuming process to
earn the trust of Aboriginal community leaders so as to enlist their cooperation in
identifying plants with traditional medicinal value. However, as a consequence of various
Desert Knowledge Cooperative Research Centre projects, such cooperation was obtained
and therefore access to hitherto restricted knowledge and plant resources was available.
Although previous workers had used human cell lines to investigate the anticancer potential
of a range of plant species, including those used as medicines by other indigenous cultures
of the world (Chinkwo, 2005; Shoemaker et al., 2005; Lampronti et al., 2003; Lee &
Houghton, 2005; Tai et al., 2004) and Aboriginal people (Mijajlovic et al., 2006), before
now nobody had tested many of the particular Australian plants I evaluated. This was the
original contribution made through my PhD studies.

62 ~ Chapter 1 ~
1.5.2 Overview of experiments
After the harvesting and processing of appropriate plant species, the antineoplastic activity
of methanolic extracts was quantitated using the MTT assay as a measure of inhibition of
cell proliferation in vitro (Kicic et al., 2002; Budman et al., 2002). The selectivity of the
most bioactive extracts for various human cancer cell lines was then assessed. Initial studies
focused on producing concentration curves to determine IC50 values of extracts and
comparing those to published values.
It was then necessary to determine the specificity of active extracts for cancer cells
compared with nontumourigenic proliferating cells. Ideally, promising extracts display no
bioactivity against normal cells. However, even if an extract just showed relatively less
effect on normal cells it was still considered of interest, as most drugs already in clinical
use affect normal cells as well as cancer cells; they just preferentially inhibit cancer cell
growth. This is often due to the greater rate of proliferation of neoplastic cells compared to
normal cells (Lord, 1987; Blagosklonny, 2006; Senthilnathan et al., 2006).
The initial screen revealed that some methanolic extracts were more bioactive than others.
Therefore, several plant species were chosen for further evaluation. More samples were
collected and extracted to give aqueous, methanol or ethyl acetate fractions. These were
subjected to various chemical analyses and assessed for their specificity and selectivity
against cancer cells. Time course experiments were then conducted to establish whether the
effects were reversible when the extracts were removed. These kinetics experiments
suggested that the bioactivity of extracts was due to cytotoxic effects. In addition,
morphological changes that occurred to cells upon exposure to the extracts revealed more
~ Chapter 1 ~ 63
about their modes of action. General nonspecific cytotoxicity was evaluated by studying the
lethal effects of various extracts on brine shrimp.
From these data, the most promising bioactive extract was chosen for further characterization.
Active constituents were identified by LC-MS and shown to be mostly flavonoids. Therefore, the
cytotoxic activities of pure compounds of these flavonoids were compared to that of the whole
extract. It was shown that the observed cytotoxic effects of the extract tested were not due to the
flavonoids tested, but some other, undetermined compound. Finally, cells were exposed to the
selected extract and Ca2+
entry into the cells was measured to obtain more clues as to its mode of
action. These studies suggested that the inhibitory effect of the selected extract on cancer cells
was not due to a nonspecific mechanism, but rather to a physiological response such as
apoptosis. However, more experiments are required to confirm this.
1.5.3 Specific aims
So, in summary, the specific aims of this PhD project are:
1. to use ethnomedical knowledge as a guide to identifying plant compounds that may
be of use in the treatment of cancer;
2. to scientifically verify that plants used as Aboriginal medicines are bioactive, with
the ultimate goal being that Indigenous communities benefit from their traditional
knowledge.

64 ~ Chapter 1 ~

~ Chapter 2 ~ 65
Chapter 2: Materials and Methods
2.1 MATERIALS
Unless otherwise specified, reagents were all of analytical grade or better.
Table 2.1 outlines the sources of the various reagents used in this study.
Common salts not listed were from BDH (Kilsyth, Vic, Australia) or Ajax chemicals
(Auburn, NSW, Australia).
Table 2.1 Sources of Reagents
Reagent Supplier Catalogue No. Australian
distributor
Camptothecin
(CPT)
Sigma-Aldrich C9911 Sigma-Aldrich;
Castle Hill, NSW
Deferoxamine mesylate
(DFO)
Sigma-Aldrich D9533 Sigma-Aldrich;
Castle Hill, NSW
Deferriprone (L1, CP20,
1,2-dimethyl-3-
hydroxypyrid-4-one)
Professor D.R.
Richardson and
Prof. P. Ponka
Gifts
Dimethyl sulfoxide
(DMSO)
Sigma-Aldrich D5879 Sigma-Aldrich;
Castle Hill, NSW
DMEM solution
(phenol red free)
Sigma-Aldrich D1145 Sigma-Aldrich;
Castle Hill, NSW
DNA (salmon sperm) Sigma-Aldrich D1626 Sigma-Aldrich;
Castle Hill, NSW
Dulbecco‘s Modified
Eagle Medium (DMEM)
Gibco 12800-017 Invitrogen;
Mt Waverley, Vic
Etoposide
(ETO)
Alexis Chemicals ALX-270-209-M100 Sapphire Bioscience;
Redfern, NSW
F12 Nutrient Mixture
(Ham‘s F12)
Gibco 21700-075 Invitrogen;
Mt Waverley, Vic
F12 Nutrient Mixture
Kaighn's Modification
(Ham‘s F12K)
Gibco 21127-022 Invitrogen;
Mt Waverley, Vic
Fluorouracil-5
(5FU)
Sigma-Aldrich F6627 Sigma-Aldrich;
Castle Hill, NSW
Foetal Calf Serum (FCS) Gibco 10099-141 Invitrogen;
Mt Waverley, Vic
Fura-2-AM ester Biotium Inc. 50033-1 Jomar Diagnostics;
P/L , Stepney, SA
Histamine Sigma-Aldrich H7125 Sigma-Aldrich;
Castle Hill, NSW
Hoechst 33258 dye Boehringer
Mannheim
663409 Roche Diagnostics;
Castle Hill, NSW

66 ~ Chapter 2 ~
Ionomycin Sigma-Aldrich I9657 Sigma-Aldrich;
Castle Hill, NSW
Isopropanol, anhydrous
(2-methyl-1-propanol)
Sigma-Aldrich 278475 Sigma-Aldrich;
Castle Hill, NSW
L-Glutamine Gibco 21051-016 Invitrogen;
Mt Waverley, Vic
Luteolin Sigma-Aldrich L9283 Sigma-Aldrich;
Castle Hill, NSW
MEM non-essential (NE)
amino acids solution
Gibco 11140-050 Invitrogen;
Mt Waverley, Vic
Minimum Essential
Medium Eagle (MEM)
Sigma-Aldrich M2279 Sigma-Aldrich;
Castle Hill, NSW
Paclitaxel
(PAC)
Alexis Chemicals ALX-351-001-M025 Sapphire Bioscience;
Redfern, NSW
Penicillin-G Sigma-Aldrich P3032 Sigma-Aldrich;
Castle Hill, NSW
Phenol Red BDH 20090 4U Lab Supply;
Mascot, NSW
Pluronic F127 Biotium Inc. 59000-F Jomar Diagnostics;
P/L , Stepney, SA
Quercetin dihydrate Sigma-Aldrich Q0125 Sigma-Aldrich;
Castle Hill, NSW
RPMI Medium 1640 Gibco 31800-022 Invitrogen;
Mt Waverley, Vic
Rutin hydrate Sigma-Aldrich R5143 Sigma-Aldrich;
Castle Hill, NSW
Sodium dodecyl sulfate
(SDS)
Bio-Rad
Laboratories
161-0301 Bio-Rad;
Gladesville, NSW
Sodium pyruvate Gibco 11360-070 Invitrogen
Mt Waverley, Vic
Streptomycin sulfate Sigma-Aldrich S9137 Sigma-Aldrich;
Castle Hill, NSW
Synthetic Sea Salt Aquasonic Ocean
Nature
Pet City;
Perth, WA
Tamoxifen citrate
(TAM)
Alexis Chemicals ALX-550-095-G001 Sapphire Bioscience;
Redfern, NSW
Thiazoyl blue tetrazolium
bromide (MTT)
Sigma-Aldrich M2128 Sigma-Aldrich;
Castle Hill, NSW
Trypan blue solution Sigma-Aldrich T8154 Sigma-Aldrich;
Castle Hill, NSW
Trypsin-EDTA (10X) Gibco 15400-054 Invitrogen;
Mt Waverley, Vic
Vinblastine sulfate salt
(VIN)
Sigma-Aldrich V1377 Sigma-Aldrich;
Castle Hill, NSW

~ Chapter 2 ~ 67
2.2 EQUIPMENT
2.2.1 Cell culture
2.2.1.1 Sterilisation
All glass pipettes and plastic pipette tips were sterilised at 120˚C under 125kPa pressure for
20 min in a Siltex 250D autoclave (B Scientific; Perth, WA, Australia). Other glassware
was sterilised at 200˚C for 2 h in an Axyos oven (Brendale, Qld, Australia). Media made up
from powder was filter-sterilised using the Millipore system under pressure. All other
liquids, including glutamine, penicillin-streptomycin and dissolved plant extracts and
controls, were sterilised through an Acrodisc® 25 mm PF syringe filter, 0.8/0.2 μm Supor
®
membrane (Pall Corporation; Ann Arbor, MI, USA).
2.2.1.2 Aseptic conditions
Cell culture was performed aseptically in a class II biological safety cabinet (Email
Westinghouse; NSW, Australia). This cabinet also served to protect the user from
biohazards, such as chemicals and potential diseases within human cell lines.
2.2.1.3 Incubation
Cell lines were maintained at 37˚C in a humidified atmosphere (85% relative humidity)
consisting of 5% CO2/ 95% air in a Thermo Forma Steri-cult CO2 HEPA Class 100
incubator (Biolab; Scoresby, Vic, Australia). This appliance was also used for incubation
steps during the MTT assay.
2.2.2 General procedures
2.2.2.1 Centrifugation
Sedimentation of cells for subculturing was carried out in a Centurion bench top centrifuge
(Thermoline Scientific; Smithfield, NSW, Australia). Small samples in Eppendorf tubes
were spun in an Eppendorf 5415D centrifuge (Crown Scientific; Minto, NSW, Australia).

68 ~ Chapter 2 ~
Other washing procedures utilised a refrigerated IEC GP8R centrifuge with a 210 rotor
(Selby Biolab; Malaga, WA, Australia).
2.2.2.2 Weighing
Small quantities of reagents and samples were weighed out using an A&D HA 120-M
balance with an accuracy of 0.0001 g (Lab Supply; Mascot, NSW, Australia). Larger
quantities were measured on a Mettler PE 360 DeltaRange® (accuracy 0.001 g) balance
(Greifensee, Zurich, Switzerland).
2.2.2.3 pH measurement
pH was measured using an Activon model 210 pH/mV/ATC/temp meter (North Ryde,
NSW, Australia) with an Ionode IJ44 electrode (Tennyson; Qld, Australia), or an Aqua pH
cube from TPS (Brisbane, Qld, Australia).
2.2.2.4 Osmometry
Osmolality was measured via freezing point depression using a Fiske F1-10 osmometer
(Needham Heights, MA, USA).
2.2.2.5 Refractometry
A Uricon-NE hand-held refractometer (Cat No. 2722) from Atago Co. Ltd. (Tokyo, Japan)
was used to measure the refractive index of samples.
2.2.2.6 Liquid dispension
Graduated glass pipettes and a Drummond Pipet Aid XP were used for millilitre quantities.
Gilson micropipettes were used for smaller volumes that were only required one or two
times. When several aliquots of the same sample were required, an Eppendorf Combitip
multipipette system (Crown Scientific; Minto, NSW, Australia) was used. When many
aliquots of the same solution were required (e.g. DMSO in the MTT assay), a Titertek Plus
multichannel, variable volume pipette (ICN; Seven Hill, NSW, Australia) was employed.
~ Chapter 2 ~ 69
2.2.2.7 Spectrophotometry
At first, absorbance of 96-well microtitre plates was measured at a wavelength of 595 nm
on a Model 3550 microplate reader (Bio-Rad Laboratories; Gladesville, NSW, Australia).
Later, an ELx808 Ultra microplate reader (BioTek, Millennium Science; Surrey Hills, Vic,
Australia) linked to Gen5 software was used to measure absorbance at λ = 570 nm. A Cary
50 Bio UV/VIS spectrophotometer from Varian (Mulgrave, Vic, Australia) was used for
other spectrophotometric measurements, including scans, of larger sample.
2.2.2.8 Microscopy
Cultured cells were generally viewed under 400X magnification using a Nikon Diaphot
TMD1 phase contrast microscope (FSE Scientific; Burwood, NSW, Australia) to observe
cell morphology, viability and proliferation. Dead brine shrimp (see section 2.6.3) were
scored by viewing under 20X magnification with a VMT stereo microscope (Olympus;
Mount Waverley, Vic, Australia).
2.2.2.9 Fluorometry
Fluorescence intensity measurements were performed on 96-well plates using a FLUOstar
Optima Multidetection Microplate Reader from BMG Labtech (Mount Eliza, Vic,
Australia).
2.2.2.10 Cellscreen (CS) system
The Cellscreen (CS) system purchased from Innovatis AG (Bielefeld, Germany) was used
to analyse the percentage confluence of cells grown in 96-well microtitre plates (cat. No.
167008, Nunc; Scoresby, Vic, Australia). This system is comprised of an IX50 inverted
phase microscope (Olympus), a motorised X-Y stage and a KPF100 CDD camera (Hitachi)
with a resolution of 1024 x 1024 pixels. Pattern recognition software analysed captured
images of 4 areas of each well viewed under the 4X objective. Experimental settings for

70 ~ Chapter 2 ~
acquisition of images and results were stored in a database linked to a personal computer
and were accessed via the graphical user interface.
2.2.2.11 Ca2+
measurement apparatus
The apparatus required for measuring intracellular Ca2+
(described briefly in section 2.6.4
and in more detail in section 6.2.4) consisted of a high-intensity xenon arc lamp, a
photomultiplier tube and an OptoScan monochromator all from Cairn Research Ltd. (Kent,
UK) and a TE2000 inverted microscope equipped for epifluorescence (Nikon; Tokyo,
Japan).
2.2.3 Solutions
Unless stated otherwise, all solutions were prepared in double deionised water (DDW) and
adjusted to pH 7.4. DDW was purified by passing distilled water through a Milli-Q system
(Millipore; North Ryde, NSW, Australia). All were stored at 4˚C unless specified.
2.2.3.1 Isotonic saline
Isotonic (300 mOsm/kg) saline was made by dissolving 91.4 g of NaCl in 10L of DDW to
give a final concentration of 155 mM. It was stored at room temperature (RT).
2.2.3.2 Isotonic phosphate
Approximately 70 mL of 155 mM NaH2PO4 was added to 400 mL of 103 mM Na2HPO4
until the pH reached 7.4. The final concentrations were therefore approximately 23.1 mM
NaH2PO4 and 87.7 mM Na2HPO4.
2.2.3.3 Phosphate buffered saline (PBS)
Phosphate buffered saline (PBS), pH 7.4, was prepared by adding approximately 470 mL of
isotonic phosphate (2.2.3.2) to 10 L of isotonic saline (2.2.3.1).
~ Chapter 2 ~ 71
2.2.3.4 Phenol red stock solution
A 0.5% (w/v) solution of phenol red was prepared by dissolving 0.5 g of phenol red powder
in 100 mL DDW with the aid of a few drops of 10M NaOH. This solution was passed
through filter paper and stored at RT, where it was stable for many years.
2.2.3.5 Buffered salt solution (BSS)
Balanced salts solution (BSS) comprised 0.15 mM NaH2PO4, 1.3 mM Na2HPO4, 6.0 mM
NaHCO3, 5.6 mM D-glucose, 137 mM NaCl, 2.7 mM KCl, 1.0 mM CaCl2, 1.0 mM MgCl2
and 0.0005% (w/v) phenol red adjusted to pH 7.2 and 300 mosm/kg.
2.2.3.6 Calcium and magnesium free salts (CMFS)
As for BSS (2.2.3.5), but without CaCl2, MgCl2 and phenol red.
2.2.3.7 Basal media
Media used for cancer cell line maintenance was generally made up from powdered sachets
according to the manufacturer‘s directions. Appropriate amounts of NaHCO3 were added
and the pH adjusted to 7.2 before filter-sterilisation (see section 2.2.1.1) to allow for the
0.1-0.3 unit rise in pH upon filtration so that the final pH was 7.4. Ham‘s F12K was
obtained in liquid form (see Table 2.1), as was media containing no phenol red, which was
used during assays.
2.2.3.8 Complete media
Complete medium varied for individual cell lines, but in this text, refers to the appropriate
basal medium including all supplements, as indicated in section 2.3.1. Complete medium is
what the cells were actually cultured in.
2.2.3.9 Trypsin-EDTA solution
10X trypsin-EDTA stock was diluted 1 in 10 in CMFS. The concentrations of this working
solution were 0.05% trypsin (w/v) and 0.4 mM EDTA.

72 ~ Chapter 2 ~
2.2.3.10 L-Glutamine
A 100X stock solution of glutamine was made by dissolving 2.92 g of L-glutamine in
100 mL of DDW. This was filter-sterilised and stored in 10 mL aliquots at -20˚C until
required. 1 mL of this solution was added to 100 mL of basal medium to give a final
concentration of 2 mM. Glutamine was replenished fortnightly as it is unstable at 4˚C.
2.2.3.11 Penicillin-streptomycin
A 100X stock solution of penicillin-streptomycin was prepared by dissolving 0.633 g of
penicillin-G (1575 U/mg) and 1.0 g of streptomycin in 100 mL DDW. After filter-
sterilisation, this was divided into 10 mL aliquots and stored at -20˚C until required. A
1 mL aliquot of this solution was added to 100 mL of medium to give final concentrations
of 100 U/mL penicillin and 100 μg/mL streptomycin.
2.2.3.12 Freeze medium
A cryoprotective medium for freezing cells was prepared by mixing one part DMSO with 9
parts FCS. This was protected from light with aluminium foil around the tube.
2.2.3.13 MTT solution
Thiazoyl blue tetrazolium bromide (MTT, 3-[4,5-dimethylthiazol-2-yl]-2,5-diphenyl
tetrazolium bromide) was originally dissolved at 5 mg/mL in PBS on the day of use before
filter-sterilsation. However, an adjustment to the protocol halfway through the project
resulted in MTT being dissolved at 1 mg/mL in the DMEM containing no phenol red.
2.2.3.14 Extraction buffer
The original buffer used to solubilise formazan crystals consisted of 10% SDS in 50%
isobutanol in 0.1 M HCl, stored at RT for up to several months. Later in the project, 100%
DMSO was used for extraction instead (see section 3.2.2).

~ Chapter 2 ~ 73
2.2.3.15 Artificial sea water (ASW)
―Synthetic sea salt‖ was dissolved at 33.34 g per L of deionised water and the pH checked
to be between 8 and 8.5 to make artificial sea water (ASW), which was stored at RT.
2.2.3.16 Physiological rodent saline (PRS)
The base buffer used in the measurement of Ca2+
was physiological rodent saline (PRS).
This consisted of 138 mM NaCl, 2.7 mM KCl, 1.06 mM MgCl2 and 12.4 mM HEPES, pH
7.3 which was supplemented with 1.8 mM CaCl2 and 5.6 mM glucose on the day of
experimentation.
2.2.3.17 Fura-2-AM
The Ca2+
-sensitive fluorescent dye, Fura-2 bound to an acetoxymethyl ester group (Fura-2-
AM), was dissolved in DMSO to give a stock solution of 1g/L (= 1 mM) which was
stored at -20°C.
2.2.3.18 Pluronic F-127
The non-ionic detergent and dispersing agent, Pluronic F-127, was dissolved at 20% (w/v)
in DMSO and stored at -20°C.
2.2.3.19 TNE buffer
A 2X stock solution of TNE buffer consisted of 20 mM Tris base, 2 mM EDTA and 4M
NaCl, pH 7.4 and was stored at RT.
2.3 CELL CULTURE
2.3.1 Cell lines
All cell lines used were of human origin in order to more closely mimic how plant extracts
would affect human cancer cells. Cells were generally cultured in 10 mL of appropriate
medium in 75 cm2 tissue culture (T-75) flasks at 37˚C in a humidified atmosphere of 5%
CO2/ 95% air (see 2.2.1.3). Cells were passaged weekly and medium replaced fortnightly.

74 ~ Chapter 2 ~
2.3.1.1 Breast cancer
The human breast adenocarcinoma epithelial cell lines MDA-MB-468 and MCF7, are
estrogen receptor negative and estrogen receptor positive, respectively. MDA-MB-468 cells
were a generous gift from Professor Peter Leedman‘s laboratory (West Australian Institute
of Medical Research, Royal Perth Hospital, WA, Australia) and MCF7 cells were obtained
from the American Type Culture Collection (ATCC; Rockville, MD, USA). The MDA-
MB-468 cancer cell line was routinely cultured in a 1:1 mixture of DMEM and Ham‘s F12
media, supplemented with 10% FCS, 2 mM glutamine, 100 U/mL penicillin and
100 g/mL streptomycin, while MCF7 cells were maintained in DMEM with the same
composition of supplements.
2.3.1.2 Skin cancer
MM253 (skin melanoma) cells were kindly provided by Professor Peter Parsons (QIMR,
Qld, Australia) and cultured as above, except the basal medium was RPMI-1640.
2.3.1.3 Colon cancer
Caco-2 (colorectal carcinoma) cells from ATCC via Professor Trevor Redgrave‘s
laboratory (Physiology, University of Western Australia (UWA), Crawley, WA, Australia)
were maintained in DMEM, supplemented with 15% FCS, 0.1 mM non-essential amino
acids, 1 mM sodium pyruvate, 2 mM glutamine, 100 U/mL penicillin and 100g/mL
streptomycin.
2.3.1.4 Lung cancer
A549 (lung carcinoma) cells were kindly provided by Professor Geoffrey Stewart‘s
laboratory (Microbiology and Immunology, UWA). These cells were cultured in Kaighn's
~ Chapter 2 ~ 75
modification of Ham‘s F12 medium supplemented with 10% FCS, 2 mM glutamine,
100 U/mL penicillin and 100 g/mL streptomycin.
2.3.1.5 Prostate cancer
DU145 (prostate carcinoma) cells were also kindly donated by Professor Peter Parsons
(QIMR). A second prostate adenocarcinoma cell line, PC3, was another kind gift from
Professor Geoffrey Stewart (UWA). Both these cell lines were maintained in RPMI-1640
medium containing 10% FCS, 2 mM glutamine, 100 U/mL penicillin and 100 g/mL
streptomycin.
2.3.1.6 Non-tumourigenic
Normal lung fibroblasts, MRC5, were kindly provided by Professor Des Richardson‘s
laboratory (Bosch Institute, University of Sydney, Sydney, NSW, Australia). The MRC5
cell line was derived from normal lung tissue of a 14-week-old male foetus and was
originally purchased from ATCC. MRC5 cells, initially obtained at passage 6, were
maintained in RPMI 1640 medium supplemented with 10% FCS, non-essential (NE) amino
acids, 2 mM glutamine, 100 U/mL penicillin and 100 g/mL streptomycin.
A summary of the various cell lines used in this study is provided in Table 2.2.

76 ~ Chapter 2 ~
Table 2.2 Human Cell Lines Used
Name Organ Morphology Disease Derived from
primary tumour
Growth
medium*
MDA-
MB-468
Breast Epithelial Adenocarcinoma No;
(pleural effusion)
DMEM/Ham‘s
F12/FCS10
MCF7 Breast Epithelial Adenocarcinoma No;
(pleural effusion)
DMEM/FCS10
Caco-2 Colon Epithelial Adenocarcinoma Yes . DMEM/FCS15
MM253 Skin Melanomic Melanoma No; (secondary
melanoma)
RPMI/FCS10
A549 Lung Epithelial Carcinoma Yes Ham‘s F12K/
FCS10
PC3 Prostate Epithelial Adenocarcinoma No; metastatic
site (bone)
RPMI/FCS10
DU145 Prostate Epithelial Carcinoma No; metastatic
site (brain)
RPMI/FCS10
MRC5 Lung Fibroblast Non-
tumourigenic
Not applicable RPMI/FCS10/
NE amino acids
* Also contained 100 U/mL penicillin, 100 g/mL streptomycin and 2 mM glutamine
2.3.2 Subculture
Medium was removed by aspiration and adherent cells were washed with 5 mL of Calcium
and Magnesium Free solution (CMFS) to remove residual medium, which contained FCS,
an inhibitor of trypsin. In order to digest the extracellular matrix and suspend the cells,
approximately 1 mL of a 1X solution of trypsin-EDTA in CMFS (see 2.3.8) was added to
each flask. These were incubated at 37˚C for no more than 10 min, the cells being
monitored microscopically for signs of detachment over this period. Trypsin was
inactivated by the addition of 9 mL of appropriate medium, containing FCS. Subcultivation
ratios of between 1/5 and 1/50 were used, depending on the cell line and when the cells
were required.

~ Chapter 2 ~ 77
2.3.3 Experimental set-up
Usually, cells were studied in exponential growth phase after seeding 100 L at 100,000
cells /mL in a Cellstar® 96-well flat bottom microtitre plate (Greiner bio-one, Interpath;
Heidelberg West, Vic, Australia). These cells were generally from cultures of between 70
and 90% confluency.
2.3.4 Cell line storage
Cells were removed from flasks with trypsin as outlined in section 2.4.2. However, after
addition of 9 mL of appropriate medium containing FCS to inactivate trypsin, cells were
transferred to a 15 mL centrifuge tube and spun at 400 x g for 5 min. The cell pellet from a
single confluent T-75 flask was resuspended in about 1 mL of ice-cold freeze medium
(2.3.12) and transferred to a 1 mL Nunc CryoTube® vial (Biolab; Scoresby, Vic, Australia).
This was placed in an insulated rack to ensure slow cooling and stored at -80˚C overnight
(O/N). The vial was then transferred to a tank of liquid nitrogen for long term storage.
2.3.5 Cell line thawing
Every two to three months new stocks of frozen cells were thawed quickly in a 37˚C water
bath and transferred to a 15 mL centrifuge tube. About 9 mL of appropriate medium was
added and the cells centrifuged at 1200rpm for 5 min. The supernatant containing the
cryopreservative (DMSO) was aspirated and the cell pellet was resuspended in 10 mL of
appropriate medium, before transfer to a T-75 flask. The following day, cells were
microscopically assessed for viability and adherence. Usually, the medium containing dead
cells was removed and replaced with fresh medium.
78 ~ Chapter 2 ~
2.4 PLANT EXTRACTS
2.4.1 Collection and handling of plant material
Samples of plants pointed out by local Aboriginal people as having any medicinal
properties were collected on two occasions from Titjikala in the Northern Territory (NT)
(Batch 1 and Batch 2) and on one occasion from Scotdesco (Ceduna) in South Australia
(SA). Batch 1 was collected in July 2004, Batch 2 in October 2004 and Batch 3 in April
2005. The samples were freighted by air or road to the School of Pharmacy at Curtin
University of Technology in Perth (WA) in foam boxes as soon as possible after collection.
In most cases they arrived at the School of Pharmacy within two days. The first batch of
samples was stored in a quarantine-approved facility at 7C and extraction of the volatiles
was commenced as soon as possible, in most instances within one or two days. Samples
collected later (Batch 2 and Scotdesco samples) were dried at 37 ºC in a quarantine-
approved facility for subsequent Soxhlet extraction. Voucher specimens of all plant species
collected were sent to either the Western Australian Herbarium or the Alice Springs
Herbarium for confirmation of correct identification.
When completely dry, samples were broken into small pieces using a mortar and pestle or
powdered using a hammer mill. These samples were then stored in an air-tight container
and protected from light. Plant material was extracted with methanol using a Soxhlet
apparatus for several days until the extract appeared colourless. The solvent was evaporated
under reduced pressure using a roto-evaporator and dried to constant weight in a vacuum
oven. In total, 25 plant samples were collected and their methanolic extracts stored in the
dark for subsequent bioactivity screening.
~ Chapter 2 ~ 79
For convenience and confidentiality, the extracts were labelled as shown in Table 2.3. As
mentioned previously, sometimes there is more than one vernacular name for a particular
species. The common names presented were provided by the collectors.
2.4.2 Methanol extraction
Plant material was stored in paper bags in a quarantine approved area at 37C until
completely dry. It was then separated into small pieces using a mortar and pestle or
powdered using a hammer mill, before being stored in an air-tight container protected from
light. Samples were subsequently extracted with methanol (see section 4.1.2) in a suitably
sized Soxhlet apparatus for several days until the extract of the new cycle appeared
colourless. The solvent was then evaporated under reduced pressure using a roto-evaporator
and dried to constant weight in a vacuum oven. This methanol extract was then stored in a
suitable container protected from light. Approximately one quarter was posted to this
laboratory for cytotoxic screening. Material was also sent to other associated research
groups for pharmacological testing. One portion was tested for general toxicity using the
brine shrimp and daphnia acute assays at the Centre for Sustainable Mine Lakes, Curtin
University of Technology. Another quarter was screened for antibacterial and antiviral
activity at the University of South Australia. The remaining quarter of the material was
used for a range of basic chemical screening tests undertaken at the School of Pharmacy,
Curtin University of Technology.

80 ~ Chapter 2 ~
Table 2.3 Source and Designation of Plant Extracts
ID Code Scientific name Common name Plant part
Titjikala: Batch 1
1 (i) 1 Eremophila longifolia Emu Bush Leaves, stems
2 (i) 2 Eremophila latrobei Native Fuchsia Leaves, stems,
flowers
3 (i) 3 Thysanotus exiliflorus Walda-Walda (Pitjantjatjara) Roots
5 (i)* 4 Eremophila sturtii Turpentine/Kerosene Bush Leaves, stems,
flowers
5 (i) 5 Eremophila sturtii Turpentine/Kerosene Bush Leaves, stems,
flowers
8 (i) 8 Eremophila freelingii Rock Fuchsia Leaves, stems,
flowers
10 (i) 10 Sarcostemma australe Ipi Ipi (Pitjantjatjara) Stems
11A (i) 9 Acacia tetragonophylla Dead Finish Leaves, stems
11B (i) 11 Acacia tetragonophylla Dead Finish Leaves, stems,
flowers
12 (i) 12 Hakea divaricata Fork-leafed Corkwood Bark
15 (i) 6 Euphorbia drummondii Caustic/Milk Weed, Mat Spurge Leaves, stems,
flowers, fruit
Titjikala: Batch 2
T19 19 Eremophila duttonii Leaves, stems
T20 20 Euphorbia tannensis Stem (leaves)
T21 21 Eremophila duttonii Leaves, stems
T22 22 Hakea sp. Bark
T24A 23 Hakea divaricata Fork-leafed Corkwood Inner bark
T24B 24 Hakea divaricata Fork-leafed Corkwood Outer bark
T25 25 Codonocarpus
cotinifolius Stems, leaves
T26 26 Euphorbia tannensis Stem (leaves)
T27 27 Eremophila freelingii Rock Fuchsia Leaves, stems
T28 28 Acacia tetragonophylla Dead Finish Root bark
Scotdesco: Batch 3
S1.1 A Eremophila alternifolia Narrow-leaf fuchsia bush Leaves, stems
S1.2 B Eremophila alternifolia Narrow-leaf fuchsia bush Leaves, stems
S3 C Scaevola spinescens Fan flower, maroon bush Leaves, stems
S7 D Eremophila alternifolia Narrow-leaf fuchsia bush Leaves, stems
* filter paper residue

~ Chapter 2 ~ 81
2.5 CONTROLS
2.5.1 Positive controls
Two positive controls used were the Fe-chelating molecules, deferoxamine mesylate (DFO)
and deferriprone (CP20 or L1), shown previously to inhibit cell proliferation in vitro and to
be active clinically (Estrov et al., 1987; Donfrancesco et al., 1992). 10 mM solutions of
these were prepared in 10% DMSO in complete medium and sterilised through a 0.22 μm
filter. 10 µL of one of these chelators was added to cells at a final concentration of 1 mM.
Another positive control, sometimes included, was 1 mM HgCl2, which would be expected
to kill all cells (Cantoni et al., 1984; Guo et al., 1998; Schurz et al., 2000). This was
prepared by dissolving 10 mg HgCl2 per mL of complete medium containing 10% DMSO.
Other positive controls used were tamoxifen (TAM), camptothecin (CPT), fluorouracil-5
(5FU), etoposide (ETO), vinblastine (VIN) and paclitaxel (PAC). Milligram quantities of
these were dissolved in DMSO to give stock concentrations of 10 mM, which were stored
at -20C. These stock solutions were diluted 1/10 in complete medium and filter-sterilised
to give 1 mM working solutions. However, these concentrations were still above optimal
for some reagents and required further dilutions. The working solutions were serially
diluted in complete medium in 1.5 mL Eppendorf tubes under aseptic conditions and 10 μL
added to 100 μL of adherent cells in microtitre plates. The range of final concentrations for
each control is summarised in Table 2.4.

82 ~ Chapter 2 ~
Table 2.4 Concentrations of Positive Controls Used
Control Code Final Concentration
Range (μM)
Deferoxamine mesylate DFO 1,000-0.5
Deferriprone L1 1,000-0.5
Camptothecin CPT 100-0.05
5-Fluorouracil 5FU 100-0.05
Tamoxifen citrate TAM 100-0.05
Etoposide ETO 10-0.005
Paclitaxel PAC 10-0.005
Vinblastine sulfate VIN 10-0.005
2.5.2 Negative controls
The negative (vehicle) control was incubation medium containing DMSO at a
concentration corresponding to the amount in the test solution.
Spectrophotometric scans of extracts between 200 nm and 800 nm (Appendix D) showed a
considerable variation in absorption, therefore other controls, consisting of extracts added
to wells containing no cells, were also used to account for background absorbance.
2.6 ASSAYS
2.6.1 MTT assay
Cell proliferation was assessed after the addition of plant extracts using a modification of
the 3-[4,5-dimethylthiazol-2-yl]-2,5-diphenyl tetrazolium bromide (MTT) assay routinely
used in this laboratory (Kicic et al., 2002) and in many others (e.g. Amirghofran et al.,

~ Chapter 2 ~ 83
2007; Sun et al., 2007b; Zhang et al., 2007). This colourimetric assay is found to be
accurate and reproducible and is based on the measurement of mitochondrial
dehydrogenase activity of living cells.
Briefly, cells were seeded into 96-well microtitre plates at an initial concentration of 1 x 10⁴
cells/well and incubated at 37C for approximately 18-24 h before adding 10 μL of plant
extracts or controls. Cells were incubated at 37C for 48 h, and then 10 µL of MTT at a
concentration of 5 mg/mL in PBS (2.2.3.13) was added. After 2 h at 37C, 100 μL of
extraction buffer (2.3.14) was added and the mixture was incubated for another 90 min at
37C before reading the absorbance at 570 nm or 595 nm on a microplate reader (2.2.2.7).
However, an alternative method, described by Fox et al. (2005) was encountered halfway
through the project which provided potential advantages over this protocol. In this
alternative method (discussed further in section 3.2.2), culture medium was removed prior
to addition of MTT, which was added at 1 mg/mL in medium (2.2.3.13). Cells were
incubated with MTT at 37C for 1 h, instead of the 2 h incubation period required for the
original protocol of Kicic et al. (2002). The MTT solution was then removed prior to the
addition of 100 μL DMSO, which was effectively the new extraction buffer used to
solubilise the dye. This step did not require incubation and the absorbance at 570 nm was
read within about 10 min. Hence, not only was the new method ―cleaner‖ in that there was
little colour interference from interactions with various components of the medium, plant
extracts and MTT, but it was also much quicker. Therefore, this new protocol was
implemented for later experiments.
84 ~ Chapter 2 ~
2.6.2 DNA assay
DNA content of cells was measured according to the method of Rago et al. (1990). Briefly,
cells in 96-well microtitre plates were first lysed by inverting the plates to drain them of
medium and placing them in the -80˚C freezer O/N. After warming to RT, 100 µL of sterile
DDW was added to each well and the plates returned to the freezer for at least 3 h. During
this time, salmon sperm DNA was dissolved in TNE buffer at 10 mg/mL and heated at
50˚C until dissolved. This was diluted to 250 µg/mL in TNE, from which standards ranging
from 10 ng to 5,000 ng per well were prepared. Hoechst 33258 dye was dissolved at
200 µg/mL in DDW and diluted 1/10 in either 1X (for standards) or 2X (for test samples)
TNE buffer to give a working solution of 20 µg/mL. This was added to lysed cell samples
or DNA standards at 100 µL per well and mixed briefly, giving final concentrations of
10 µg/mL. Fluorescence of 6 or 8 replicate wells was measured at an excitation wavelength
of 355 nm and emission wavelength of 460 nm using the fluorometer described in section
2.2.2.9.
2.6.3 Brine shrimp lethality assay (BSLA)
The brine shrimp (Artemia salina) lethality assay (BSLA) proposed by Michael et al.
(1956) and later developed by Vanhaeke et al. (1981) and Sleet and Brendel (1983) is a
useful tool for the assessment of the general cytotoxicity of various types of compounds
(Carballo et al., 2002; Turker & Camper, 2002). A positive correlation between brine
shrimp toxicity and some cancer cell toxicity has been reported (Turker & Camper, 2002).
Pertinently, it has been widely employed to evaluate the bioactivity of plant extracts,
including those used traditionally as medicines (e.g. Desmarchelier et al., 1996;
Krishnaraju et al., 2005; Turker & Camper, 2002). This bioassay is a simple, inexpensive,
reliable and convenient method of determining general cytotoxicity. Brine shrimp eggs are

~ Chapter 2 ~ 85
readily available and the nauplii (larvae) hatch quickly (Krishnaraju et al., 2005).
Furthermore, only a very small amount of test compound is required (Amaro et al., 2009).
In this study, brine shrimp eggs (stored at 4C) were hatched into nauplii O/N in a 1 L
separating funnel. Approximately half a teaspoon of brine shrimp eggs were added to
500 mL of artificial sea water (ASW) maintained at between 28 and 32C using heat lamps
and subjected to constant aeration and illumination. After 24 h, unhatched eggs which had
settled to the base of the funnel were removed and live nauplii were collected in a small
beaker. As the brine shrimp are phototropic (Carballo et al., 2002; Turker & Camper,
2002), a torch was used to illuminate one side of the beaker in order to concentrate shrimp
in a smaller area. Using a Pasteur pipette, swimming shrimp were collected and transferred
to a petri dish which was placed on a dissecting (Olympus VMT stereo) microscope. Light
was then directed to one part of the petri dish to attract shrimp to a smaller area and, under
20X magnification, an adjustable micro pipette was used to draw up 20 L of ASW
containing as many live shrimp as possible. At least 8 shrimp were delivered to wells of a
96-well micro plate prepared with 180 L aliquots of varying concentrations of the extracts
or compounds being tested. Dead shrimp were then scored by viewing wells under 20X
magnification at intervals over a 48 h period. Nauplii were only considered dead if they
remained completely immobile, including antennae and mouth parts, for several seconds of
observation. Total shrimp in each well were counted after sacrificing surviving nauplii with
40 L of methanol per well. The percentage of dead shrimp for each time point was
calculated and compared to a control which contained DMSO only.

86 ~ Chapter 2 ~
2.6.4 Intracellular Ca2+
measurement
Changes in intracellular Ca2+
were measured in cells loaded with the fluorescent Ca2+
indicator, Fura-2, as described in more detail in Section 7.2.4.2. Briefly, Fura-2-loaded cells
were placed on the stage of an inverted epifluorescence microscope attached to the Ca2+
measurement apparatus (see Section 2.2.2.11) and illuminated at alternating excitation
wavelengths of 340 and 380 nm. Fluorescence emission at 510 nm was captured after being
filtered by a 510 bandpass filter. Acquisition and analyses of data were performed with an
Optiscan control system and software supplied by Cairn Research Ltd. (Kent, UK). The
concentration of intracellular Ca2+
([Ca2+
]i) was taken as the emission ratio of the
fluorescence intensities at the two excitation wavelengths (F340/F380) (Grynkiewicz et al.,
1985; Jackisch et al., 2000).
2.6.5 Protein assay
Protein content was assessed using the Pierce® BCA
TM Protein Assay Kit (Prod # 23227)
from Thermo Scientific (Rockford, IL, USA) according to the manufacturer‘s directions.
This assay is based on the combination of the reduction of Cu2+
to Cu+ by protein under
alkaline conditions (the Biuret reaction) with the highly sensitive and selective
colourimetric detection of Cu+ using a reagent containing bicinchoninic acid (BCA) (Smith
et al., 1985). Briefly, 25 μL samples were aliquotted in quadruplicate into wells of a 96-
well microtitre plate and 200 μL of working reagent added. After thorough shaking for
30 s, the plate was incubated at 37°C for 30 min. Upon cooling at RT, OD570 readings were
compared to those of known BSA standards prepared in parallel.
~ Chapter 2 ~ 87
2.7 STATISTICS
2.7.1 Means and standard errors
Only positive values were included when calculating means and their standard errors,
which were done using Excel. Student‘s unpaired, two-tailed t-tests were performed to
compare two means using the InStat programme (GraphPad Software, La Jolla, CA, USA).
The Welch correction was employed when the variances were unequal.
2.7.2 Analysis of variance
One-way analyses of variance (ANOVAs) were performed on mean values to compare
differences between samples, particularly the effects of individual extracts versus controls.
This was done in InStat using Dunnet‘s Multiple Comparisons Test. Student Newman-
Keuls (SNK) tests were used to compare differences between mean values of other
samples.
2.8 CURVE FITTING
2.8.1 Linear regression
Linear regression curves were fitted to standard curves using GraphPad Prism (GraphPad
Software, La Jolla, CA, USA). The squared correlation coefficient (r2 value) was reported
to indicate goodness of fit.
2.8.2 Nonlinear regression
Percent of control values were plotted against the logarithm of the concentration of samples
and these data were analysed using GraphPad Prism to fit non linear regression curves
based on a sigmoidal dose-response, allowing for a variable slope. In this way, the extract
concentration which inhibited cell proliferation by 50%, the IC50 value, was calculated for
each sample. It is important to note that for each sample, the mean data were analysed in

88 ~ Chapter 2 ~
four separate ways: (i) by the default 4-Parameter (4P) curve-fitting model in which neither
the top nor the bottom values were fixed, (ii) by fixing the top value at 100, (iii) by fixing
the bottom value at 0, (iv) or by fixing both the top and bottom values at 100 and 0,
respectively. The optimum model for each combination of extract and cell line was chosen
based on the narrowest range of 95% confidence intervals of the standard error (SE) of the
calculated IC50 value and the r2 value.

~ Chapter 3 ~ 89
Chapter 3: Optimisation of Experimental Techniques
INTRODUCTION
The validity of the ethnopharmacological approach to identifying potential anticancer
agents has already been discussed in Chapter 1, where it was argued that using this
multidisciplinary strategy is a very worthwhile pursuit. Nevertheless, few studies have used
Australian Aboriginal traditional medical knowledge as a guide to identifying plants that
may have anticancer properties. Following chapters will describe results obtained by using
this uncommon approach. However, before screening studies could commence, it was
necessary to validate the proposed methodology. Therefore, this chapter seeks to justify the
specifics of the experimental design. It will focus on why the particular cell lines, controls
and assays were chosen and how conditions were optimised in order to study the effects of
the various provided plant extracts on cancer cells.
3.1.1 Cell lines
The research described within this thesis utilised human cancer cell lines as models for
studying the effects of plant extracts on cancer cells. Well characterised cell lines are
invaluable tools for initial drug screening procedures, allowing researchers to study drug
effects in vitro before unnecessarily expending precious, and more expensive, live animals.
Continuous cell lines are usually of monoclonal origin and are in an arrested state of
differentiation characteristic of cancer cells. Thus, they provide more reproducible data as
the cell population responds as one. However, their main advantage is their virtually
unlimited proliferation, resulting in an almost limitless supply of cells that can be stored
and recovered as required. The philosophy behind using cell lines derived from cancerous
human tissue was simply to provide data appropriate for comparison to human patients
(Korting & Schafer-Korting, 1999). In other words, the effects of plant extracts on cells of

90 ~ Chapter 3 ~
human origin would be expected to more closely reflect how those extracts would affect
human cancer cells in vivo than if animal models were utilised. Indeed, it was for these very
reasons that the National Cancer Institute (NCI) switched from screening potential
anticancer drugs on leukemic mice to a battery of 60 human cancer cell lines representative
of various tumour types (Alley et al., 1988; Shoemaker, 2006). However, the NCI quickly
ascertained an unexpected, additional advantage of using several types of cancer lines in
that patterns of relative drug sensitivity and resistance generated can provide insights into
mechanisms of drug action (Shoemaker, 2006).
The cell lines used in these studies were chosen based on their availability, ease of
maintenance and clinical significance. Excluding non-melanocytic skin cancer (NMSC),
which is at least four times more common than all other cancers combined, the five most
commonly diagnosed cancers in the Australian population in order of incidence are
prostate, colorectal, breast, skin and lung. In 2005 these five cancers accounted for >60% of
all new cases (AIHW & AACR, 2008). The cell lines employed in this study represent
these five most common cancers and have been used by others, including the NCI, to study
the cytotoxic effects of potential anticancer agents in vitro (see Table 3.1).

~ Chapter 3 ~ 91
Table 3.1 The Five Most Commonly Occurring Cancers in Australia
Type of Cancer Incidence* Representative Cell Line/s References
Prostate 16,349 PC3 and DU145
Budman et al., 2002; Ogbourne et
al., 2004; Russo et al., 2005;
Alley et al., 1988
Colorectal 13,076 Caco-2 Russo et al., 2005; Chen et al.,
1998; Visanji et al., 2004
Breast 12,265 MCF7 and MDA-MB-468
Lampronti et al., 2003; Tai et al.,
2004; Lee & Houghton, 2005;
Alley et al., 1988
Skin 10,684 MM253 Parsons & Morrison, 1978;
Parsons et al., 1982
Lung 9,182 A549
Yin et al., 2004; Cheng et al.,
2005; Amirghofran et al., 2007;
Sun et al., 2007b; Alley et al.,
1988
*No. of new cases diagnosed in Australia in 2005 (AIHW & AACR, 2008).
3.1.2 MTT assay
The principal method used to determine cell proliferation in this study was the 3-(4,5-
dimethylthiazol-2-yl)-2,5-diphenyl tetrazolium bromide (MTT) assay. The principle of the
MTT assay is that mitochondrial dehydrogenases of viable cells cleave the tetrazolium ring
of MTT, yielding MTT formazan crystals (Figure 3.1). Solutions of MTT solubilised in
tissue culture media (without phenol red) are yellowish in colour; MTT formazan crystals
are purple. Crystals are dissolved in an extraction buffer and the resultant purple solution
can be measured spectrophotometrically at a wavelength of around 570 nm. Since
tetrazolium salts are cleaved only in metabolically active cells, the number of viable cells is
proportional to the amount of MTT formazan crystals and, hence, absorbance (or optical
density, OD) (Mosmann, 1983). By measuring cell numbers over time, the MTT assay can
therefore give an indication of changes in the rate of cell proliferation.
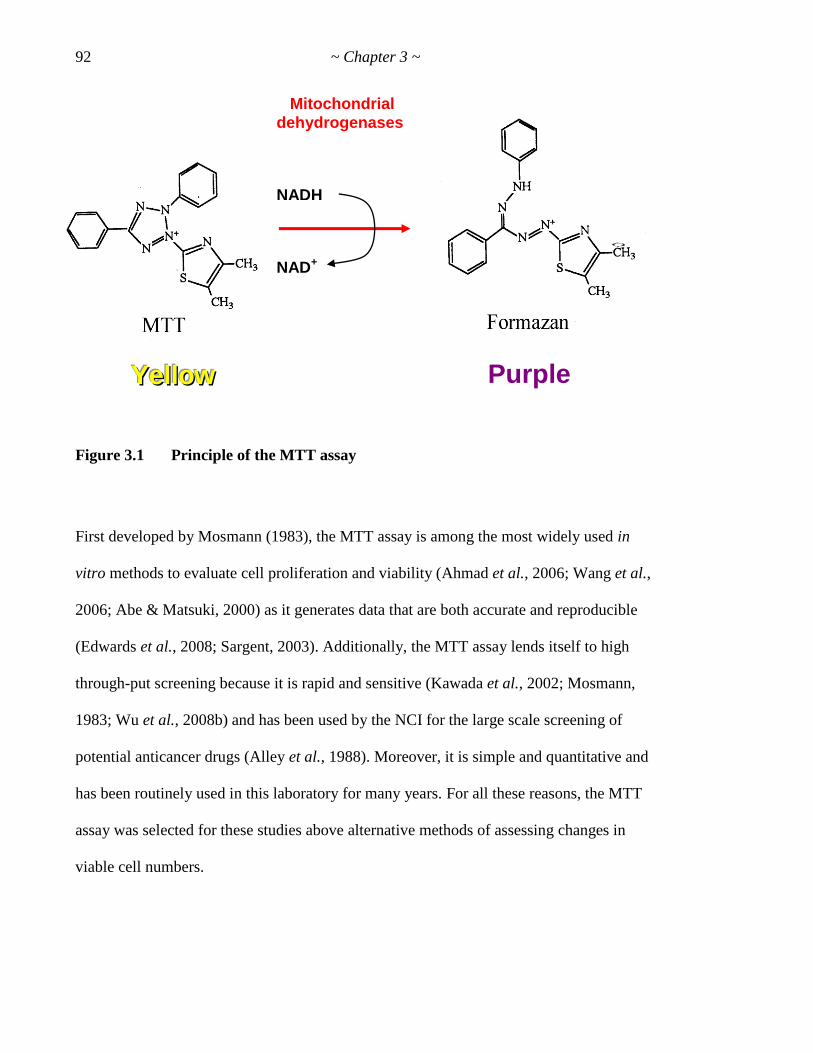
92 ~ Chapter 3 ~
YYYeeellllllooowww Purple
Figure 3.1 Principle of the MTT assay
First developed by Mosmann (1983), the MTT assay is among the most widely used in
vitro methods to evaluate cell proliferation and viability (Ahmad et al., 2006; Wang et al.,
2006; Abe & Matsuki, 2000) as it generates data that are both accurate and reproducible
(Edwards et al., 2008; Sargent, 2003). Additionally, the MTT assay lends itself to high
through-put screening because it is rapid and sensitive (Kawada et al., 2002; Mosmann,
1983; Wu et al., 2008b) and has been used by the NCI for the large scale screening of
potential anticancer drugs (Alley et al., 1988). Moreover, it is simple and quantitative and
has been routinely used in this laboratory for many years. For all these reasons, the MTT
assay was selected for these studies above alternative methods of assessing changes in
viable cell numbers.
Mitochondrial
dehydrogenases
NAD+
NADH

~ Chapter 3 ~ 93
However, although the MTT assay has been extensively used on other cell lines, it was
important to confirm its validity in determining changes in cell numbers using the particular
culture conditions of these studies. Hence, MTT assay-derived data were compared to other
measures of cell viability and proliferation. Additionally, experiments were conducted
which aimed to optimise its efficiency in assessing the cytotoxic effects of plant extracts
against the panel of cell lines employed in these studies.
Basically, the MTT assay consists of three steps:
1. Incubation of cells with MTT;
2. Solubilisation of formazan crystals; and
3. Spectrophotometric measurement of resultant solution.
Each of these steps was adjusted in order to optimise the efficacy of the overall procedure.
3.1.3 Vehicle
Ideally, plant extracts would have been dissolved in water, more closely mimicking the
bush medicine remedies of Aboriginal tradition. Unfortunately, however, complete aqueous
dissolution was not possible for most of the crude methanolic extracts, even at
concentrations below 100 mg/mL. As this was a quantitative study, this situation was
obviously not tolerable. Therefore, unless otherwise specified, the vehicle used to dissolve
all controls and plant extracts was DMSO. This solvent was chosen above others as it is
routinely used in this laboratory and, indeed, is in more common use generally than
methanol, acetone or ethanol in cell culture studies (Stanislav et al., 1999).
94 ~ Chapter 3 ~
3.1.4 Controls
Besides a control to account for effects of the vehicle (DMSO), positive controls were
required to show that the assay system was working. Potential positive controls were tested
for their ability to inhibit cell proliferation, as measured by the MTT assay. The compounds
chosen for testing have been used clinically to treat various cancers. They included the
ferric chelators, desferrioxamine mesylate (DFO) and deferiprone (L1), the selective
estrogen receptor modulator tamoxifen (TAM), the topoisomerase I inhibitor camptothecin
(CPT), the topoisomerase II inhibitor etoposide (ETO), the mitotic inhibitors vinblastine
(VIN) and paclitaxel (PAC), and the pyrimidine antimetabolite 5-fluorouracil (5FU). Table
3.2 lists some relevant references together with the IC50 values (50% maximal inhibitory
concentrations) those authors obtained using similar culture conditions and cell lines.
HgCl2 and Triton X-100 (t-octylphenoxypolyethoxyethanol) were also used to ensure 100%
cell death was obtained. Triton X-100 (TX-100) is a non-ionic surfactant which, via
permeabilisation of the cell membrane, leads to fast cell death by necrosis (Weyermann et
al., 2005), while HgCl2 rapidly induces single strand breaks in DNA (Cantoni et al., 1984).
3.2 METHODOLOGY
3.2.1 Cell lines
Cell lines were cultured in appropriate media under conditions recommended by previous
workers as outlined in section 2.4. To establish the growth characteristics of each cell line,
the commonly used trypan blue exclusion method was used to identify viable cells present
over five consecutive days. Each culture was initially seeded at 10,000 cells per well in 96-
well tissue culture plates and incubated in appropriate medium under standard conditions.
~ Chapter 3 ~ 95
Each day, cells in each well were washed with 100 L CMFS and harvested by adding
50 L trypsin-EDTA and incubating at 37˚C for 10-15 min. Cells from quadruplicate wells
were harvested and an additional 100 L CMFS used to rinse out residual cells, which were
pooled. Aliquots of 80 L of pooled cells were mixed with 20 L of trypan blue and direct
cell counts performed using a haemocytometer. Parallel experiments were also performed
in which cell proliferation was assessed via the MTT assay.
Additionally, in the last few months of this project it became possible to employ a
sophisticated instrument to directly measure the confluence of cells grown in microtitre
culture plates. The Cellscreen (CS) system (Innovatis AG, Germany), described by Viebahn
et al. (2006) summarised in section 2.2.2.10, analysed captured images of 4 views of a
single well and automatically averaged the data when given the plate layout. In this way, it
was possible to quickly and accurately monitor growth of cells without destroying them.
The great advantages afforded by the non-invasive nature of this technique meant that the
same population of cells could be easily studied over a period of time. Hence, latter
experiments were performed in 96 well microtitre plates utilising the CS system.
3.2.2 MTT assay
Initially, the MTT assay was performed as outlined in section (2.6.1). Briefly,
10 L of a 5 mg/mL solution of MTT in PBS was added directly to100 L of cells per well
and incubated at 37C for 2 h, after which time 200 L of extraction buffer (consisting of
10% SDS, 50% isobutanol, 0.1 M HCl) was added to solubilise the formazan crystals. After
a further 90 min at 37C, the absorbance was read at 595 nm.

96 ~ Chapter 3 ~
However, high background absorbance levels resulting from interactions with MTT,
ingredients of the culture medium and test agents were a frequent occurrence. This was
particularly concerning after treatment with cytotoxic plant extracts or positive controls
when few viable cells were present as the background could be very close to (or even less
than) recorded absorbances. Hence, further refinement of the technique was desirable.
Therefore, an alternative method (Fox et al., 2005) was adopted midway through the
project which provided potential advantages over the original protocol. In this alternative
procedure, culture medium was removed prior to addition of MTT. Cells were incubated
with 1 mg/mL MTT in medium at 37C for 1 h, instead of the 2 h incubation period
required for the original protocol. The MTT solution was then removed prior to the addition
of 100 μL DMSO, which was added instead of the original extraction buffer to solubilise
the dye. This step did not require incubation and the absorbance at 570 nm was read within
about 15 min. Appropriately stored spectrophotometric-grade DMSO was used as this
provides stable absorbance levels for up to 2 h, compared to non-spectrophotometric
DMSO preparations or DMSO pre-exposed to air, which both result in ever-increasing
levels of ―background‖ absorbance within 15 min of solvent addition (Alley et al., 1988).
One final modification was that, while Fox et al. (2005) removed the culture medium and
MTT solution by aspiration, no significant difference was obtained when these solutions
were removed by vigorous inversion and subsequent blotting over paper towels (data not
shown). Therefore, this inversion system was adopted as it was much more efficient.

~ Chapter 3 ~ 97
Around the same time, a new microplate reader (An ELx808 absorbance microplate reader
(BioTek) linked to Gen5 software) was purchased. This new instrument was fitted with a
more appropriate filter for the MTT assay, allowing the absorbance at the optimum
wavelength (570 nm) to be read. The closest filter the old reader had was 595 nm, which
was adequate but not optimal. This meant that after the new reader was employed,
absorbance readings were slightly higher than with the old reader, and hence more accurate
(see 3.3.2).
Vehicle
Plant extracts were dissolved at 100 mg/mL (w/v) in 100% DMSO. After appropriate
dilutions in PBS or medium, and because 10 L aliquots were added to 100 L of cells in
96 well plates, the maximum concentration of DMSO that cells were exposed to was only
1%.
3.2.4 Controls
After O/N incubation, 10,000 cells in 100 L medium were exposed to 10 L of the
relevant control for a further 48 h. To determine the optimum concentration of each
potential positive control, compounds were dissolved at various concentrations in medium
containing 10% DMSO and diluted in PBS or medium to give a range of final
concentrations spanning published IC50 values as outlined in Table 3.2.
To achieve total cytotoxicity, final concentrations of 0.1% TX-100 or 1 mg/mL HgCl2 were
added to other control wells. At between 3- and 10-fold higher than what others have used,
these concentrations were in excess of that required to adequately kill all cells (Dias et al.,
2003; Borner et al., 1994; Duncan-Achanzar et al., 1996).

98 ~ Chapter 3 ~
The negative control was simply cells incubated with the vehicle (DMSO) alone at a final
concentration corresponding to the amount in the appropriate wells (less than 1%). All
other readings were expressed as a percentage of the absorption obtained in wells
containing DMSO only.
Table 3.2 Range of Concentrations of Positive Controls Used
Compound Abbreviation
Concentration
Range (M)
Published IC50 (M)
Desferrioxamine DFO 0.5 - 1,000
110-210 (Kicic et al., 2001);
22 (Richardson et al., 1995);
20 (Le & Richardson, 2004);
11 (Bernhardt et al., 2005)
Deferriprone L1 0.5 - 1,000
180 (Le & Richardson, 2004);
70-110 (Kicic et al., 2001)
Camptothecin CPT 0.05 - 100
0.15 (Adams et al., 2006);
0.12 (Fujimori et al., 1996);
0.007-0.25 (Jones et al., 1997);
0.01-0.02 (Kouniavsky et al., 2002)
5- Fluorouracil 5FU 0.05 - 100
38-45 (Kouniavsky et al., 2002);
10 (Hernandez-Vargas et al., 2006);
2.2-15.3 (Mans et al., 1999);
3 (Evrard et al., 1999);
Tamoxifen TAM 0.05 - 100
242 (MDA-MB-435) (Guthrie et al., 1997);
0.108 (MCF7) (Guthrie et al., 1997);
17.5 (MCF7) (Panasci et al., 1996);
8 (MCF7) 5, 20 (Cai & Lee, 1996);
Paclitaxel PAC 0.001 - 10
0.0037- >32 (Georgiadis et al., 1997);
0.0027 (He et al., 2000);
0.0024-0.0038 (Perez & Buckwalter, 1998)
0.0004-0.0034 (Engblom et al., 1996)
Vinblastine VIN 0.001 - 10
0.0025-0.0072 (Budman et al., 2002);
0.0031 (Yang et al., 2005);
0.001 (Verdier-Pinard et al., 2000);
0.00068 (Sobottka & Berger, 1992)
Etoposide ETO 0.001 - 10
5.4 (Kouniavsky et al., 2002);
2.5 (Ohsaki et al., 1992);
0.59-0.77 (Perez & Buckwalter, 1998);
0.122-2.42 (Budman et al., 2002)
~ Chapter 3 ~ 99
Additionally, since a photometric assay was employed and many of the test extracts had
colour of their own, it was necessary to include controls to account for background
absorption. Absorbance readings from wells containing no cells but 100 L of incubation
medium and 10 L of test or control compounds only were subtracted from corresponding
readings before other calculations were made.
3.3 RESULTS
3.3.1 Cell lines
As discussed above, the cell lines chosen were representative of the five most common
types of cancer. Six of the cancerous cell lines had epithelial morphology, while MM253
were melanomic, and the non-cancerous cells, MRC5, were fibroblasts (Volpi et al., 2000).
All cell lines used were adherent but, while all could be removed from the tissue culture
surface with trypsin-EDTA, some lines attached more stringently than others, and required
longer incubation periods. DU145 cells were the most adherent, requiring at least 10 min at
37˚C and vigorous pipetting to be completely removed from the surface of the flask.
MM253 and MRC5 cells were the least adherent, easily detaching within minutes.
It was desirable that cells were in logarithmic phase before exposure to the plant extracts
because cancer cells are steadily dividing. This meant it was necessary to understand the
growth characteristics of the individual cell lines. For each cell line, direct cell counts were
performed using trypan blue exclusion and phase contrast microscopy over consecutive
days to generate growth curves such as those depicted in Figure 3.2.

100 ~ Chapter 3 ~
0 12 24 36 48 60 72 84 960
10000
20000
30000
40000
50000
60000
Time (h)
Cell d
en
sit
y
(cells p
er
well)
Figure 3.2 Proliferation of cell lines over time (direct cell counts)
MDA-MB-468 (■), MCF7 (▲), Caco-2 (●), MM253 (▲), A549 (●), PC3 (●) and DU145
(▲) and MRC5 (○) cells were seeded at 10,000 cells per well and incubated under
standard conditions for 4 days. Approximately every 24 h, cells from quadruplicate wells
were harvested and pooled and, after mixing well, a sample aliquot directly counted using a
haemocytometer and a phase-contrast microscope. Except for MRC5 cells, at least 200 cells
were counted per sample in up to 18 chambers in order to directly determine the number of
cells per well for each cell line. Viability was greater than 90% as assessed by trypan blue
dye exclusion. Although data points in this figure are from a single experiment, similar
results were obtained on two other occasions.
Parallel experiments were also performed in which proliferation of cells incubated under
identical conditions in the same plates was measured spectrophotometrically via the MTT
assay, a representative experiment of which is shown in Fig. 3.3.

~ Chapter 3 ~ 101
0 12 24 36 48 60 72 84 960.0
0.5
1.0
1.5
2.0
Time (h)
Ab
so
rban
ce
(at
570n
m)
Figure 3.3 Proliferation of cell lines over time (MTT assay)
MDA-MB-468 (■), MCF7 (▲), Caco-2 (●), MM253 (▲), A549 (●), PC3 (●), DU145
(▲) and MRC5 (○) cells were seeded at 10,000 cells per well and incubated under
standard conditions for 4 days. Approximately every 24 h, wells were assessed for cell
proliferation using the MTT assay. Data are the mean OD570 values ± SE of quadruplicate
wells from a single experiment, although similar results were obtained from two other
independent experiments.
From both Figures 3.2 and 3.3 it can be seen that after an initial lag phase, cells continued
to proliferate even until the last time point measured (94 h). Growth was shown to be
exponential over the duration of the experiment in all cell lines, with very high r2 values
obtained when exponential nonlinear regression lines were fit to the data (Table 3.3). This
was confirmed in experiments performed much later when the Cellscreen (CS) apparatus
became available. As this equipment made monitoring cell growth a much simpler matter,
growth curves were obtained which included more time points over a longer period (Fig.
3.4).

102 ~ Chapter 3 ~
0 24 48 72 96 120 1440
20
40
60
80
100
Time (h)
Co
nfl
uen
cy
(% c
overa
ge)
Figure 3.4 Proliferation of cell lines over time (Cellscreen)
MDA-MB-468 (■), MCF7 (▲), Caco-2 (●), MM253 (▲), A549 (●) and MRC5 (○) cells
were seeded at 10,000 cells per well, PC3 (●) and DU145 (▲) at 5,000 cells per well, and
incubated under standard conditions for up to 1 week. Twice per day, wells were assessed
for cell proliferation using the CS apparatus. Data are the mean % confluency values ± SE
of quadruplicate wells from a single experiment, although similar results were obtained
from two other independent experiments.
Clearly, when cells were seeded at densities translating to about 20% confluency,
conditions were optimal for logarithmic growth between 24 and 72 h, the period chosen for
incubation with test agents. When fewer cells or more cells than this were seeded, the
exponential growth phase was correspondingly delayed or occurred earlier.

~ Chapter 3 ~ 103
Table 3.3 Goodness of Fit of Exponential Growth Curves
Cell Line r
2
Cell counts
r2
MTT assay
r2
Cellscreen
MDA-MB-468 0.988 0.977 1.000
MCF7 1.000 0.980 0.995
Caco-2 0.993 0.938 0.980
MM253 0.984 0.996 0.985
A549 0.996 0.940 0.950
PC3 0.918 0.973 0.980
DU145 1.000 0.999 0.978
MRC5 0.964 - 0.981
Growth curves were used to determine the mean doubling times of each cell line (Table
3.4). Cell numbers, OD570 readings or confluency levels were transformed to log values and
plotted against their corresponding time points. For each cell line, the doubling time was
taken as the log of 2 divided by the slope of the regression line as fitted by GraphPad
Prism.
This analysis was based on the formula:
Td = t*log102
log10N2 - log10N1
Where Td = the population doubling time
N1 = the initial population number, OD570 or % confluency
N2 = the population number, OD570 or % confluency at final time point
t = time difference between measurements.

104 ~ Chapter 3 ~
Only the exponential phase of the growth curves was used, such that N2 corresponded to the
final time point and N1 was taken to be the number of cells (or OD570 or % confluency) at
the beginning of the log phase. The doubling times presented are mean values derived from
data from 2-4 independent experiments, including those depicted in Figures 3.2 to 3.4.
Table 3.4 Mean Doubling Times of Cell Lines Established via Different Methods
Cell Line
Cell
counts
(h)
MTT
assay
(h)
Cell-
screen
(h)
Published values*
(h)
MDA-MB-
468 25.2 29.6 42.9
60-72 (Brinkley et al., 1980);
29.9 (Watanabe et al., 2001);
24 (Busse et al., 2000)
MCF7 17.7 29.1 37.7
36.9 (Smith et al., 1999); 30.2 (Watanabe
et al., 2001); 24 (Lacroix & Lippman,
1980); 22 (Fujimori et al., 1996)
Caco-2 19.9 28.3 22.9
32 (Visanji et al., 2004);
26.5 (Basson et al., 1995);
23.5 (Scaglione-Sewell et al., 2000)
MM253 19.8 23.0 35.5
28 (Goss & Parsons, 1977);
24 (Parsons & Morrison, 1978);
23 (Parsons et al., 1982)
A549 26.7 25.9 46.7
28.4 (Jones et al., 1978);
19.8 (Uchiyama et al., 1997);
18.7 (Newman, 1990);
PC3 21.0 25.2 38.6
28 (Nucciarelli et al., 2003);
24 (Parker et al., 1998);
23.2 (Yasumoto et al., 2004)
DU145 20.2 27.3 42.0
29 (Sramkoski et al., 1999);
25 (Gao et al., 2001);
16-20 (Quinones et al., 2002)
MRC5 54.4 89.9 74.8
96 (Carballo et al., 2002);
44.0 (Uchiyama et al., 1997);
22 (Lovejoy & Richardson, 2002)
* obtained via a variety of different methods.
As can be seen, the doubling times derived from the direct cell count curves were generally
less than those calculated from the OD570 readings after incubation with MTT, which were
more in agreement with published values. Cellscreen-derived values were usually higher

~ Chapter 3 ~ 105
than those calculated from direct cell counts or the MTT assay, but still mainly within the
range of published values.
It should be noted here that, due to its nature, the non-tumourigenic cell line, MRC5, was
much slower growing than the cancerous cell lines. This made it comparatively more
difficult to grow and meant that sometimes not enough cells were available to complete all
the experiments performed on the other cell lines.
Additionally, the data, in agreement with others, indicate that the 8 different cell lines
proliferated at different rates. It was, therefore, necessary to subculture them at differing
split ratios to synchronise their readiness for experiments, i.e. when the various cell lines
were in mid log phase, when most cells were dividing. This was determined to be between
48 and 72 h after subculture. Ideally, cells were required at about 70-90% confluency once
per week. Typically, this meant splitting them at the ratios outlined in Table 3.5, dependent
upon their state of confluency from the previous passage.
Table 3.5 Subculture Conditions of Cell Lines
Cell Line Split Ratio
MDA-MB-468 1/15 - 1/20
MCF7 1/15 - 1/20
Caco-2 1/15 - 1/20
MM253 1/20 - 1/40
A549 1/20 - 1/40
PC3 1/30 - 1/50
DU145 1/20 - 1/40
MRC5 1/5 - 1/10

106 ~ Chapter 3 ~
3.3.2 MTT assay
Extensive studies were carried out to optimise the efficiency of the MTT assay routinely
performed in this laboratory (Kicic et al., 2002). This involved many experiments
consuming several months. However, only the initial screening studies were performed
utilising this method before a superior protocol was encountered. Therefore, the results of
some of these preliminary studies are presented as an appendix only (Appendix C).
Despite the original method producing good results for the earliest experiments in this
study, an alternative method based on the protocol of Fox et al., (2005) was adopted for
later experiments. Because of reduced incubation times, this new method was much quicker
than the original and, therefore, enabled more experiments to be performed. More
importantly, the new method gave ―cleaner‖ results in that background absorbance values
were very low. This was due to the inclusion of a step in which culture medium was
discarded before incubation with MTT, resulting in an absence of colour interference from
interactions with various components of the medium, plant extracts and MTT and/or
extraction buffer. Figure 3.5 depicts absorbance readings from an experiment comparing
the old method with the new one.

~ Chapter 3 ~ 107
2 19 28
DM
SO
DFO L1 2
HgC
lCPTTA
M 2 19 28
DM
SO
DFO L1 2
HgC
lCPTTA
M
0.0
0.2
0.4
0.6
0.8
1.0
1.2
Original Modified
Test agent
OD
570
Figure 3.5 Absorbance values from original and new MTT assay protocols.
100 µL of MDA-MB-468 cells were seeded at a density of 10,000 cells per well in parallel
microplates and, after O/N incubation at 37˚C, exposed to various test agents for a further
48 h. MTT assays were then performed on the cells, according to either the original
protocol (■: 10 µL of 5 mg/mL MTT in PBS for 2 h, 100 µL extraction buffer for 90 min,
both added directly to cultures) or the modified method (■: culture medium discarded,
100 µL of 1 mg/mL MTT in medium, solution discarded, 100 µL DMSO), and the
absorbance read at 570 nm. The details of the test agents are not important to the
interpretation of this experiment. Results are mean OD570 values ± SE of quadruplicate
wells. The white section of each bar represents the component of total absorbance due to
background.
One of the most vital details to establish was that data obtained from the MTT assay
directly related to the number of cells in each well. To this end, the number of cells counted
manually was plotted against the absorbance values in wells corresponding to cells
incubated under exactly the same conditions for the same period of time (Fig. 3.6).

108 ~ Chapter 3 ~
0 15000 30000 450000.0
0.2
0.4
0.6
0.8
1.0MDA-MB-468
r2 = 0.999
Cell density (cells per well)
Ab
so
rba
nc
e
(at
57
0n
m)
0 10000 20000 300000.0
0.2
0.4
0.6MCF7
r2 = 0.988
Cell density (cells per well)
Ab
so
rba
nc
e
(at
57
0n
m)
0 10000 20000 30000 400000.0
0.2
0.4
0.6
0.8
1.0Caco-2
r2 = 0.962
Cell density (cells per well)
Ab
so
rba
nc
e
(at
57
0n
m)
0 10000 20000 30000 400000.0
0.4
0.8
1.2MM253
r2 = 0.910
Cell density (cells per well)
Ab
so
rba
nc
e
(at
57
0n
m)
0 10000 20000 300000.0
0.2
0.4
0.6
0.8
1.0A549
r2 = 0.972
Cell density (cells per well)
Ab
so
rba
nc
e
(at
57
0n
m)
0 20000 40000 600000.0
0.5
1.0
1.5
2.0PC3
r2 = 0.989
Cell density (cells per well)
Ab
so
rban
ce
(at
570n
m)
0 15000 30000 45000 600000.0
0.4
0.8
1.2DU 145
r2 = 0.996
Cell density (cells per well)
Ab
so
rba
nc
e
(at
57
0n
m)
0 5000 10000 15000 200000.0
0.1
0.2
0.3MRC5
r2 = 0.469
Cell density (cells per well)
Ab
so
rba
nc
e
(at
57
0n
m)
Figure 3.6 Relationship between absorbance values and cell numbers.
For each cell line, MTT assays were performed on cells in wells every day for 4 days and
the OD570 readings obtained were plotted against direct cell counts. This experiment was
carried out on quadruplicate wells on three separate occasions and these curves are typical
of the results obtained.

~ Chapter 3 ~ 109
As can be seen from Figure 3.6, for every cancer cell line tested, the correlation between
direct cell counts and OD570 values from the MTT assay was very high. Squared correlation
coefficient (r2) values were above 0.9 in all cell lines over a 4-day period, except for the
non-tumourigenic cell line, MRC5.
Additionally, the relationship between OD570 values obtained via the MTT assay and data
obtained using an assay to measure DNA content (see section 2.7.2) was also assessed (Fig.
3.7).

110 ~ Chapter 3 ~
0 5000 10000 15000 20000 250000
5000
10000
15000
20000
25000
30000
35000
DNA Assay
Seeding Density (cells per well)
Flu
ore
scen
ce
(ex. 355n
m, em
. 460n
m)
0 5000 10000 15000 20000 250000.00
0.25
0.50
0.75
1.00
1.25
MTT Assay
Seeding Density (cells per well)
Ab
so
rban
ce
(at
570n
m)
Figure 3.7 DNA assay vs MTT assay.
MDA-MB-468 (■) and MCF7 (▲) cells were seeded at varying densities and incubated
under standard culture conditions. After 72 h, MTT and DNA assays were performed on
identical plates in parallel. Results are the mean ± SE absorbance (570 nm) or fluorescence
(ex. 355 nm, em. 460 nm) values after the blanks had been subtracted of 4 and 6 wells,
respectively.

~ Chapter 3 ~ 111
From Figure 3.7 it is evident that there are differences between the shapes of the curves
generated from data acquired from the DNA assay compared to those from the MTT assay.
The shapes of both DNA assay curves are steeper than those of the MTT assay, which start
to flatten out at a seeding density of around 15,000 cells per well. Nevertheless, when these
data were subjected to linear regression analysis, it was shown that the relationship between
the MTT and DNA assay results was very close, with r2 values of 0.936 and 0.953 for
MDA-MB-468 and MCF7 cells, respectively. This correlation was even better if only the
low range points (0-6,000 cells/well) were used (MDA-MB-468 r2=0.959, MCF7 r
2=0.979).
For MDA-MB-468 cells, an r2 value of 0.990 for the high range points (10,000 to 25,000
cells/well) was obtained, while for MCF7 cells an r2 value of 0.945 was recorded.
Based on other experiments in which absorbance values from the MTT assay were
compared to cell numbers obtained via direct cell counting, a seeding density of 10,000
cells per well corresponded to a final cell density of about16,665 MDA-MB-468 and 9,428
MCF7 cells after 72 h growth. From the DNA standard curve (r2=0.998), a seeding density
of 10,000 cells per well corresponded to 912 and 293 ng of DNA 72 h later for MDA-MB-
468 and MCF7 cells, respectively. Therefore, it might be extrapolated that the DNA content
of MDA-MB-468 cells was about 55 pg/cell and of MCF7 cells was 32 pg/cell.
MTT assay-derived OD570 values were also compared with the protein content of cells in
parallel wells which had been lysed with 1% TX-100 (Fig. 3.8). Standard curves generated
from the BCA protein assay kit employed (see section 2.7.5) had r2 values greater than
0.999.

112 ~ Chapter 3 ~
0 50 100 150 200 2500.0
0.2
0.4
0.6MDA-MB-468
r2 = 0.914
Protein (g/mL)
OD
570
0 50 100 150 200 2500.0
0.2
0.4
0.6MCF7
r2 = 0.815
Protein (g/mL)
OD
570
0 50 100 150 200 2500.0
0.2
0.4
0.6
0.8
1.0Caco-2
r2 = 0.941
Protein (g/mL)
OD
570
0 25 50 75 1000.0
0.2
0.4
0.6
0.8MM253
r2 = 0.771
Protein (g/mL)
OD
570
0 100 200 300 4000.0
0.2
0.4
0.6
0.8
1.0A549
r2 = 0.991
Protein (g/mL)
OD
570
0 100 200 300 400 500 6000.0
0.2
0.4
0.6
0.8
1.0
1.2PC3
r2 = 0.971
Protein (g/mL)
OD
570
0 100 200 3000.0
0.5
1.0
1.5DU145
r2 = 0.976
Protein (g/mL)
OD
570
Figure 3.8 Relationship between protein content and MTT assay-derived data.
For each cell line, % of control data obtained from MTT assays were plotted against protein
content of cells in parallel wells. This experiment was carried out in quadruplicate wells
and data are the means ± SE for both measurements. Similar results were obtained in
another experiment.

~ Chapter 3 ~ 113
As can be seen, OD570 values obtained from the MTT assay correlated very well with the
amount of protein in cells cultured under the same conditions.
Later, the Cellscreen (CS) system was used to reinforce the validity of the MTT assay. For
every cell line, very good correlations were found between % control values obtained via
the MTT assay and the % confluency of wells as measured by the CS (Fig. 3.9).
Additionally, results obtained via the CS system itself were compared to those obtained in
an assay for protein performed on the same cells directly after the last CS measurement was
recorded. Figure 3.10 illustrates the very good correlation between these two methods of
assessing cell numbers.

114 ~ Chapter 3 ~
0 25 50 75 1000
25
50
75
100MDA-MB-468
r2 = 0.994
MTT (% Control)
CS
(%
Co
nfl
ue
nc
y)
0 25 50 75 1000
25
50
75
100MCF7
r2 = 0.850
MTT (% Control)
CS
(%
Co
nfl
uen
cy)
0 25 50 75 1000
25
50
75
100Caco-2
r2 = 0.959
MTT (% Control)
CS
(%
Co
nfl
uen
cy
)
0 25 50 75 1000
25
50
75
100MM253
r2 = 0.929
MTT (% Control)
CS
(%
Co
nfl
uen
cy
)
0 25 50 75 1000
25
50
75
100A549
r2 = 0.888
MTT (% Control)
CS
(%
Co
nfl
uen
cy)
0 25 50 75 1000
25
50
75
100PC3
r2 = 0.938
MTT (% Control)
CS
(%
Co
nfl
ue
nc
y)
0 25 50 75 1000
25
50
75
100DU 145
r2 = 0.902
MTT (% Control)
CS
(%
Co
nfl
ue
nc
y)
0 25 50 75 1000
25
50
75
100MRC5
r2 = 0.862
MTT (% Control)
CS
(%
Co
nfl
ue
nc
y)
Figure 3.9 Relationship between MTT assay-derived data and CS-derived data.
For each cell line, the percentage of the wells covered by cells (% confluency) was plotted
against % of control data obtained from MTT assays performed directly afterwards on the
same cells. This experiment was carried out in quadruplicate wells and data are the means ±
SE for both measurements. Similar results were obtained in another experiment.

~ Chapter 3 ~ 115
0 50 100 150 200 2500
25
50
75
100MDA-MB-468
r2 = 0.968
Protein (g/mL)
% C
on
flu
en
cy
0 50 100 1500
25
50
75
100MCF7
r2 = 0.878
Protein (g/mL)
% C
on
flu
en
cy
0 50 100 150 200 2500
25
50
75
100Caco-2
r2 = 0.829
Protein (g/mL)
% C
on
flu
en
cy
0 25 50 75 1000
25
50
75
100MM253
r2 = 0.761
Protein (g/mL)%
Co
nfl
ue
nc
y
0 100 200 300 4000
25
50
75
100A549
r2 = 0.923
Protein (g/mL)
% C
on
flu
en
cy
0 100 200 300 400 500 6000
25
50
75
100PC3
r2 = 0.839
Protein (g/mL)
% C
on
flu
en
cy
0 100 200 3000
25
50
75
100DU145
r2 = 0.849
Protein (g/mL)
% C
on
flu
en
cy
Figure 3.10 Relationship between protein content and CS-derived data.
For each cell line, the percentage of the wells covered by cells (% confluency) was plotted
against protein content of cells in parallel wells. This experiment was carried out in
quadruplicate wells and data are the means ± SE for both measurements. Similar results
were obtained in another experiment.
116 ~ Chapter 3 ~
3.3.3 Vehicle
Not all plant extracts tested were water-soluble, but all were effectively dissolved in
DMSO. Cells were exposed to a maximal concentration of DMSO of 1%, a concentration
which had little effect on cell morphology (Fig. 3.11).
However, DMSO did inhibit cell proliferation in a dose dependent manner over the high
concentration range examined (Fig. 3.12). Clearly, some cell lines were more susceptible to
DMSO than others. While 1% DMSO had a minimal effect on most cell lines in the panel,
the faster growing lines, PC3, A549 and MM253 (Table 3.4, MTT-derived doubling times)
were sensitive to this concentration.
Cells exposed to DMSO only were considered the negative control and all other values
expressed as a percentage of these data to give the proportion of living cells after treatment
with positive controls or test extracts.
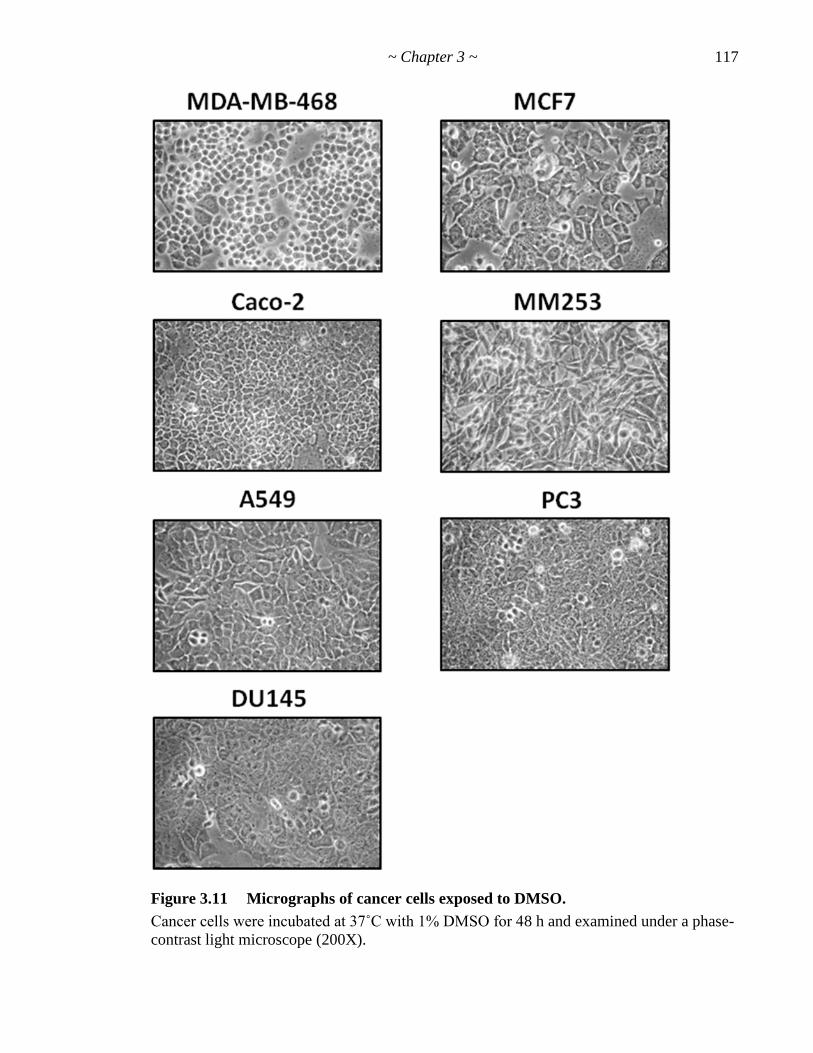
~ Chapter 3 ~ 117
Figure 3.11 Micrographs of cancer cells exposed to DMSO.
Cancer cells were incubated at 37˚C with 1% DMSO for 48 h and examined under a phase-
contrast light microscope (200X).
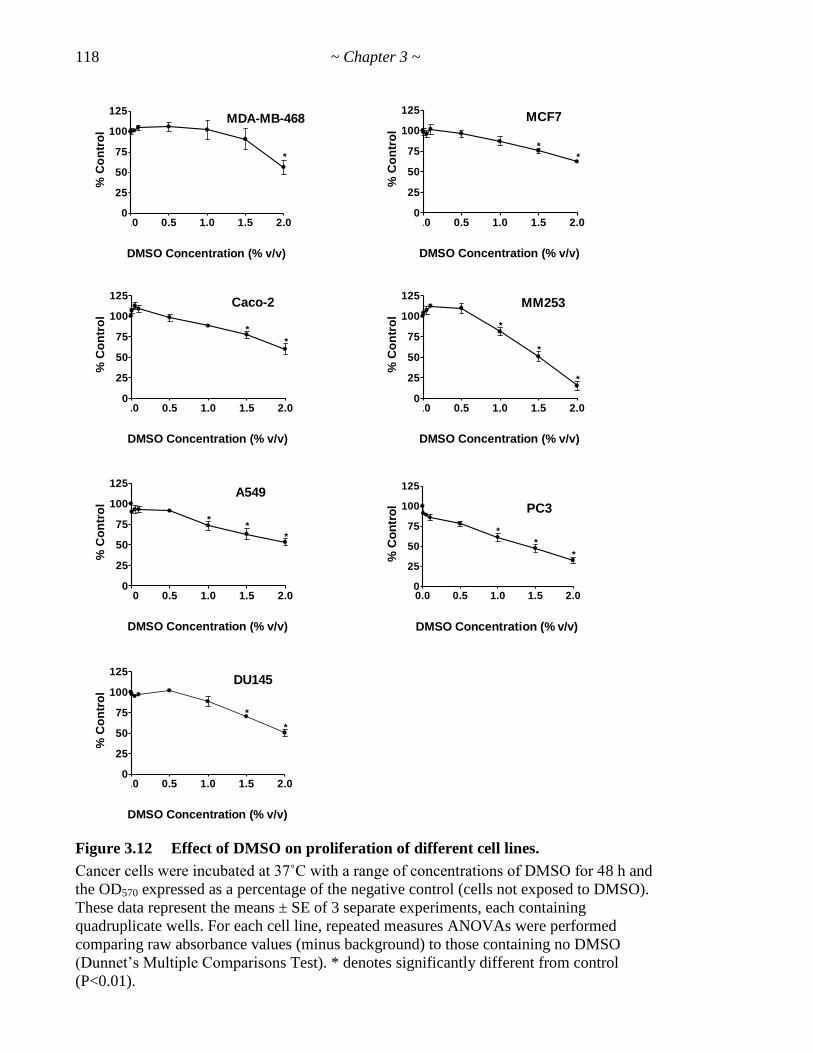
118 ~ Chapter 3 ~
0.0 0.5 1.0 1.5 2.00
25
50
75
100
125 MDA-MB-468
*
DMSO Concentration (% v/v)
% C
on
tro
l
0.0 0.5 1.0 1.5 2.00
25
50
75
100
125 MCF7
DMSO Concentration (% v/v)
% C
on
tro
l
**
0.0 0.5 1.0 1.5 2.00
25
50
75
100
125 Caco-2
DMSO Concentration (% v/v)
% C
on
tro
l
*
*
0.0 0.5 1.0 1.5 2.00
25
50
75
100
125 MM253
DMSO Concentration (% v/v)
% C
on
tro
l
*
*
*
0.0 0.5 1.0 1.5 2.00
25
50
75
100
125 A549
DMSO Concentration (% v/v)
% C
on
tro
l
**
*
0.0 0.5 1.0 1.5 2.00
25
50
75
100
125
PC3
DMSO Concentration (% v/v)
% C
on
tro
l
*
*
*
0.0 0.5 1.0 1.5 2.00
25
50
75
100
125 DU145
DMSO Concentration (% v/v)
% C
on
tro
l
*
*
Figure 3.12 Effect of DMSO on proliferation of different cell lines.
Cancer cells were incubated at 37˚C with a range of concentrations of DMSO for 48 h and
the OD570 expressed as a percentage of the negative control (cells not exposed to DMSO).
These data represent the means ± SE of 3 separate experiments, each containing
quadruplicate wells. For each cell line, repeated measures ANOVAs were performed
comparing raw absorbance values (minus background) to those containing no DMSO
(Dunnet‘s Multiple Comparisons Test). * denotes significantly different from control
(P<0.01).
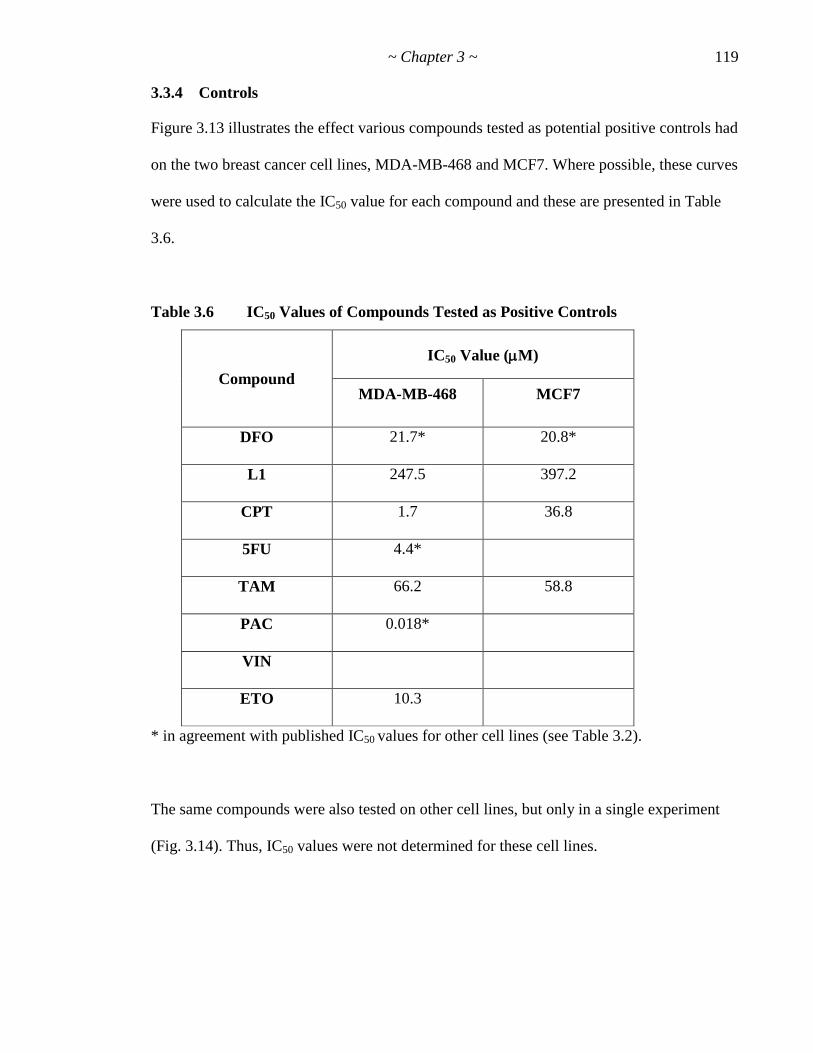
~ Chapter 3 ~ 119
3.3.4 Controls
Figure 3.13 illustrates the effect various compounds tested as potential positive controls had
on the two breast cancer cell lines, MDA-MB-468 and MCF7. Where possible, these curves
were used to calculate the IC50 value for each compound and these are presented in Table
3.6.
Table 3.6 IC50 Values of Compounds Tested as Positive Controls
Compound
IC50 Value (M)
MDA-MB-468
MCF7
DFO 21.7* 20.8*
L1 247.5 397.2
CPT 1.7 36.8
5FU 4.4*
TAM 66.2 58.8
PAC 0.018*
VIN
ETO 10.3
* in agreement with published IC50 values for other cell lines (see Table 3.2).
The same compounds were also tested on other cell lines, but only in a single experiment
(Fig. 3.14). Thus, IC50 values were not determined for these cell lines.
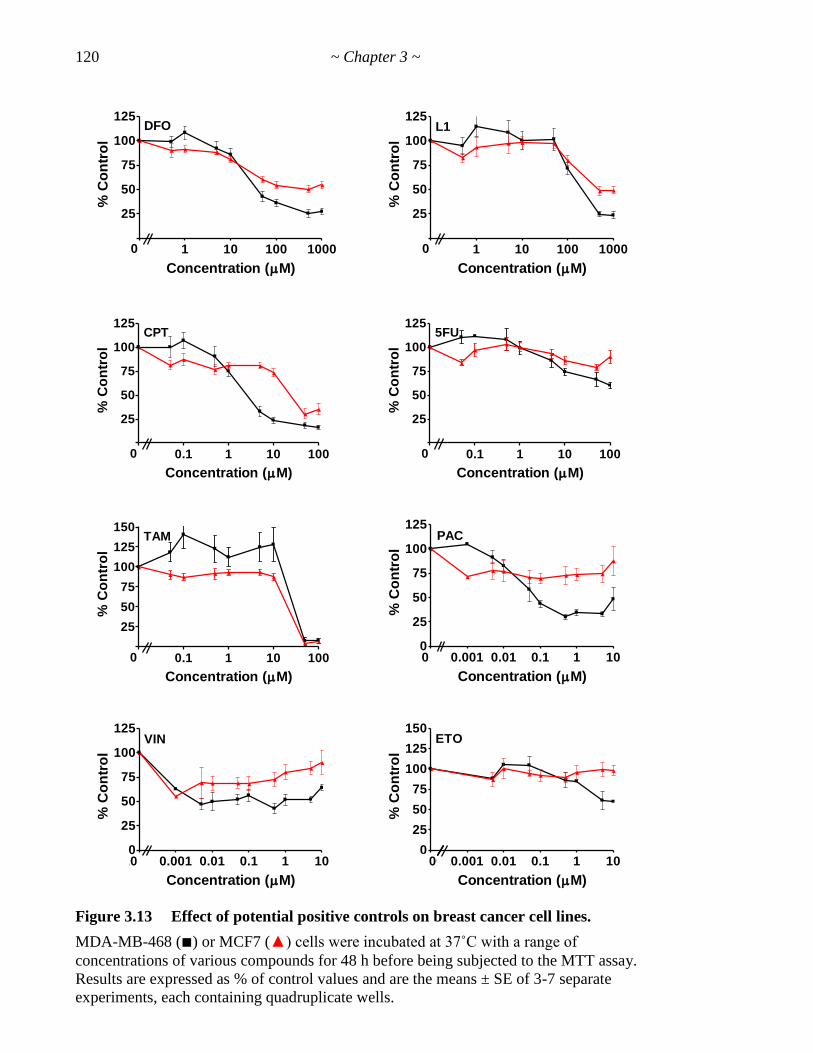
120 ~ Chapter 3 ~
0.1 1 10 100 10000
25
50
75
100
125
0
DFO
Concentration (M)
% C
on
tro
l
0.1 1 10 100 10000
25
50
75
100
125
0
L1
Concentration (M)
% C
on
tro
l
0.01 0.1 1 10 1000
25
50
75
100
125
0
CPT
Concentration (M)
% C
on
tro
l
0.01 0.1 1 10 1000
25
50
75
100
125
0
5FU
Concentration (M)
% C
on
tro
l
0.01 0.1 1 10 1000
25
50
75
100
125
150
0
TAM
Concentration (M)
% C
on
tro
l
0.00010.001 0.01 0.1 1 100
25
50
75
100
125PAC
Concentration (M)
% C
on
tro
l
0.00010.001 0.01 0.1 1 100
25
50
75
100
125VIN
Concentration (M)
% C
on
tro
l
0.00010.001 0.01 0.1 1 100
25
50
75
100
125
150ETO
Concentration (M)
% C
on
tro
l
Figure 3.13 Effect of potential positive controls on breast cancer cell lines.
MDA-MB-468 (■) or MCF7 (▲) cells were incubated at 37˚C with a range of
concentrations of various compounds for 48 h before being subjected to the MTT assay.
Results are expressed as % of control values and are the means ± SE of 3-7 separate
experiments, each containing quadruplicate wells.

~ Chapter 3 ~ 121
10 100 10000
25
50
75
100
125
0
DFO
Concentration (M)
% C
on
tro
l
10 100 10000
25
50
75
100
125
150
175
0
L1
Concentration (M)
% C
on
tro
l1 10 100
0
25
50
75
100
125
0
CPT
Concentration (M)
% C
on
tro
l
1 10 1000
25
50
75
100
125
150
0
5FU
Concentration (M)%
Co
ntr
ol
1 10 1000
50
100
150
200
0
TAM
Concentration (M)
% C
on
tro
l
0.1 1 10 1000
25
50
75
100
125
150
175
0
PAC
Concentration (M)
% C
on
tro
l
0.1 1 10 1000
25
50
75
100
125
150
0
VIN
Concentration (M)
% C
on
tro
l
0.1 1 10 1000
25
50
75
100
125
150
175
0
ETO
Concentration (M)
% C
on
tro
l
Figure 3.14 Effect of potential positive controls on other cell lines.
Caco-2 (●), MM253 (▲), A549 (●), PC3 (●) and DU145 (▲) and MRC5 (○) cells were
incubated at 37˚C with a range of concentrations of various compounds for 48 h before
being subjected to the MTT assay. Results are expressed as % of control values and are the
means ± SE of quadruplicate wells of a single experiment.
122 ~ Chapter 3 ~
As can be seen, DFO, L1 and CPT caused a dose-dependent inhibitory effect against all cell
lines tested. In contrast, ETO and 5FU had little effect on most cell lines tested over the
concentration ranges used, while PAC and VIN substantially inhibited the proliferation of
some, but not all, cell lines. TAM was only effective against MDA-MB-468 and MCF7 and
the dose-response curve was undesirably steep between 10 and 50 µM. In some cases, the
effect of a compound was stimulatory, especially at lower doses, a phenomenon known as
hormesis (Calabrese, 2005a), which will be discussed further in Sections 5.4.3, 8 2.4.3 and
Appendix N.
3.4 DISCUSSION
3.4.1 Cell lines
From Table 3.4 it can be seen that the doubling times of the cell lines varied according to
which method was used to assess cell proliferation. In general, doubling times derived from
direct cell counts were lower than those obtained via the MTT assay which were, in turn,
lower than CS-derived values. As the MTT assay values were more in keeping with the
range of published values, in the main, these were given most credence. However, it must
be remembered that the culture conditions, including the composition of the culture
medium can vary quite considerably between research groups. In addition, the inherent
genetic instability of cell lines in long-term culture and natural selection as cells are
passaged under different culture conditions can account for differences in biological
behaviour, including growth characteristics, between the same cell line grown in different
laboratories (Osborne et al., 1987). Indeed, it is for these very reasons that it was essential
to assess the growth characteristics of each cell line under the conditions employed in this
study.

~ Chapter 3 ~ 123
These experiments showed that if cells were seeded at 10,000 cells per well in microtitre
plates, they would be in logarithmic phase 48-72 h later. Therefore, it was determined that
for later experiments in which cells were exposed to plant extracts or controls, 10,000 cells
per well were allowed to adhere O/N under standard culture conditions before being
exposed to test agents for 48 h. Thus, incubation periods were a maximum of 72 h.
Significantly, this was the same incubation schedule employed by the NCI in routine
screening (Boyd & Paull, 1995).
3.4.2 MTT assay
A reliable quantitative method of assessing cytotoxicity was a prime requirement in order
to undertake screening studies. The MTT assay was chosen for its simplicity,
reproducibility and because it was already in routine use in this laboratory and many others
for this application (Kicic et al., 2002; Edwards et al., 2008). A major effort was applied to
refining this technique, which resulted in various modifications to the original method.
Overall, these changes resulted in a quicker system that was not any more expensive to run.
The main advantage, however, was that it reduced the effects of several problems
associated with the mixture of substances in the wells. The specificity and sensitivity of the
MTT assay is known to be influenced by various factors, including coloured substances and
cell volume (Wang et al., 2006). Because the modified protocol involved discarding the
contents of the wells before the MTT solution was added, the problems of chromatic
interference by ingredients in the medium such as FCS and evaporation of media over time
were eliminated. More importantly, there was no longer the issue of colour differences
between wells containing different plant extracts with varying hues, and even wells
containing the same extract, but at varying concentrations. The modified method also
overcame complications resulting from possible interactions between control drugs, and
124 ~ Chapter 3 ~
MTT, such have been shown to occur with cisplatin and paclitaxel which showed false
increases in viability (Ulukaya et al., 2004). However, because results were always
expressed as a percentage of an internal control, previous results were still comparable to
newer ones.
As expected, a strong positive relationship between absorbance and cell number was
evident in all cancer cell lines. The correlation was less convincing with the non-cancerous
line, MRC5, but this was most likely a function of the error introduced by counting fewer
cells. Better correlations were seen for the MRC5 cell line when MTT assay data were
compared to confluency values obtained using the CS. Indeed, squared correlation
coefficient values for this relationship were no less than 0.850 for every cell line examined
(Fig. 3.10). These observations confirm those of Viebahn et al., (2006), who showed that
the precision of the CS is comparable to that of the MTT assay. When calculated cell
numbers were plotted against individual values generated by the CS and the MTT assay,
these authors reported correlation coefficients of 0.969 and 0.971, respectively (Viebahn et
al., 2006). Additionally, a very good correlation between confluency values as determined
by the CS system and protein content of lysed cells was demonstrated (Fig. 3.10).
Moreover, the validity of the MTT assay was also supported by high r2 values between
fluorescence values in the DNA assay and absorbance values from the MTT assay (Fig.
3.8). Similarly, a high correlation was found between cell numbers as assessed by protein
content of lysed cells and MTT-derived OD570 values (Fig. 3.8).

~ Chapter 3 ~ 125
Overall, these results demonstrate that the MTT assay was, indeed, a very good technique
for accurately determining the number of viable cells present in a culture. Therefore, we
were confident this was a valid means of detecting any cytotoxic effects of plant extracts.
3.4.3 Vehicle
All plant extracts tested dissolved in DMSO at 100 mg/mL, but not all were soluble in
aqueous solutions. In the interest of consistency, DMSO was therefore chosen as the
vehicle for all test samples as well as the controls. However, as DMSO itself did affect the
proliferation of some of the cell lines tested at the concentrations used (Fig. 3.12), it was
necessary to include a control for DMSO. Cells incubated with DMSO alone (<1% final
volume) were therefore included and such wells were considered the negative control,
sometimes referred to as the vehicle control. All absorbance values obtained for test or
positive control wells were expressed as a percentage of the absorbance reading recorded
for such negative control wells.
Originally, for simplicity and to conserve resources, only the highest concentration of
DMSO (1%) was used as a vehicle control. Initially, it was assumed from unpublished past
studies on other cell lines in this laboratory that there was no difference in absorbance
readings obtained over the range of DMSO used. Pianetti et al. (2002) also used only a
single concentration of DMSO, equivalent to the highest dose, as a negative control in their
research. However, the present study provided clear evidence of the dose-dependent effects
of DMSO on the cell lines used (Fig. 3.12). Therefore, extra control wells consisting of
DMSO at concentrations corresponding to the amount in wells containing different
dilutions of plant extract or positive control were included in subsequent experiments.

126 ~ Chapter 3 ~
DMSO as the vehicle control has been reported for many studies on the same cell lines used
here. A list of selected references providing precedents for each cell line in this panel is
provided in Table 3.7.
Table 3.7 Previous Studies Using DMSO as Vehicle Control
Cell Line
Maximum Concentrations of DMSO (v/v) Used by Others
MDA-MB-468
0.1% (Prassas et al., 2008; Spink et al., 1998; Krueger et al., 2001)
MCF7 0.1% (Spink et al., 1998; Cover et al., 1999); 0.2% (Zhang et al., 2003;
Nguyen et al., 2004; Agarwal et al., 2002); 2% (Kuntz et al., 1999)
Caco-2 0.1% (Wolter & Stein, 2002); 0.5% (Stormer et al., 2002);
1% (Janzowski et al., 2003; Gibbs et al., 2000); 2% (Kuntz et al., 1999)
MM253
1% (Jevtovic-Todorovic & Guenthner, 1991)
A549 0.1% (Nguyen et al., 2004); 0.2% (Cheng et al., 2005);
3.4% (Palanee et al., 2001)
PC3 0.1% (Anderson et al., 1998; Oliveira et al., 2008; Hafeez et al., 2008);
1% (Xiao & Singh, 2002; Li et al., 1995)
DU145
0.1% (Agarwal et al., 2002; Li et al., 1995)
MRC5
0.5% (Hadjur et al., 1995); 0.3% (Cheng et al., 2002)
These references are by no means exhaustive; they are merely examples of relevant articles
that were featured in an online search using the name of the cell line and DMSO as
keywords. However, from this limited sample of references it is clear that DMSO has been
widely used as a solvent carrier in the in vitro evaluation of potential anticancer agents.
Furthermore, a range of concentrations of DMSO has been safely used and the final
concentrations employed in this study (<1%) were within that range. The maximal
concentration of 1% DMSO used was a compromise between the concentration required to
solubilise the extracts and that shown to have a minimal effect on cell viability. Therefore,

~ Chapter 3 ~ 127
it was concluded that DMSO was a suitable vehicle, as long as the appropriate control,
DMSO at the same concentration as the sample, was included in experiments.
3.4.4 Controls
As mentioned, the negative control for each cell line was cells incubated with DMSO alone.
However, positive controls were also required to show that the assay system was working.
Potential positive controls included DFO, L1, TAM, CPT, ETO, VIN, PAC and 5FU.
These compounds were tested for their suitability as positive controls using the particular
culture conditions and cell lines selected for use in impending screening studies. As it was
intended that plant extracts would generally be tested on every cell line in every
experiment, it was desirable that the same concentration of a positive control reduced the
proliferation of all cell lines by a substantial amount.
From Figures 3.13 and 3.14, it is clear that some compounds were more effective than
others at reducing cell numbers over the concentration ranges tested. DFO, L1 and CPT
showed the most convincing dose-dependent inhibitory effect across all cell lines. Other
compounds tested had little inhibitory effect, and sometimes even a stimulatory effect, on at
least one cell line in the panel. Nevertheless, it was possible to generate IC50 values of
several compounds for MDA-MB-468 and MCF7 cells. Based on calculated IC50 values
agreeing with published values in conjunction with unanimous inhibitory activity, DFO
was chosen as the most suitable positive control of the compounds tested. However, L1 and
CPT were sometimes also included as positive controls in supporting roles. These were
provided in 10 to 50-fold excess of their calculated IC50 values to ensure maximal
inhibitory effect.

128 ~ Chapter 3 ~
3.5 SUMMARY
In summary, this chapter described the validation and optimisation of the experimental
design. Firstly, the panel of cell lines chosen was justified and their growth characteristics
defined in order to optimise the culture conditions required for experiments involving 48 h
exposure to plant extracts. Secondly, the rationale for choosing the MTT assay to monitor
cytotoxic effects of test agents was provided and its validity was assessed. Additionally, the
refinement of the routine procedure hitherto employed in this laboratory was recounted.
Next, the suitability of DMSO as a vehicle was examined and shown to be appropriate.
Finally, a fitting positive control, DFO, was chosen from a range of potentially suitable
compounds. From these studies, a standard protocol was devised which was used in
subsequent experiments to evaluate the cytotoxic activity of extracts of plants traditionally
used as medicines by Aboriginal people. The following chapter will describe studies
involved in the initial screening of these selected plant extracts.

~ Chapter 4 ~ 129
Chapter 4: Preliminary Screening of Plant Extracts
4.1 INTRODUCTION
As already discussed extensively in Section 1.3, plants and other natural products (NPs)
have been and remain a prime source of new chemical entities (NCEs), leading to the
development of a myriad of novel drugs to combat a diverse range of diseases (Clardy &
Walsh, 2004; Newman & Cragg, 2007). Nature has been experimenting with chemical
combinations for aeons (Macilwain, 1998) and so the amount of chemical diversity within
natural compounds cannot be matched by mankind (Verdine, 1996; Tulp & Bohlin, 2004).
Hence, NPs provide a virtually limitless source of novel and complex chemical structures
that probably would never otherwise have been the subject of a beginning synthetic
programme (Fabricant and Farnsworth, 2001). Moreover, the chemical properties of NPs,
such as lipophilicity and binding affinities for specific receptors, are generally superior to
chemically synthesised compounds and less likely to cause detrimental interactions within
the complex microenvironment of a cell (Feher & Schmidt, 2003; Dobson, 2004).
In this age of modern drug discovery, bioprospecting for potential chemotherapeutics has
sometimes been dismissed as a futile exercise, bearing the negative connotations associated
with such labels as ―stamp collecting‖ and ―fishing expedition‖ (Norvell & Cassman, 2003;
Bull & Stach, 2007). It has also been criticised as an instrument responsible for exploiting
the natural environment (Shiva, 1997). Arguably worse still, ethnopharmacology has been
criticised for taking advantage of the indigenous cultures who provided the original
knowledge about plants they have traditionally used as medicines (Shiva, 1997; Verma,
2002; Hamilton, 2006; Stone, 2008). While these criticisms may have some valid historical
basis (see section 1.4.4.2.3), the fact remains that over half of all drugs, including cancer
130 ~ Chapter 4 ~
therapies, have been derived wholly or partly from plants (Melnick, 2006a; Cragg et al.,
1997; Newman & Cragg, 2007). Furthermore, 80% of these compounds have had an
ethnomedical use identical or related to the current use of the active elements of the plant
(Fabricant & Farnsworth, 2001). Despite this impressive statistic and the fact that
Australian indigenous people maintain the oldest culture on Earth, very little research has
been undertaken to evaluate the therapeutic potential of any plants in the Aboriginal
Pharmacopoeia (Locher & Currie, 2010). Studies that validate traditional Aboriginal
medical knowledge include compounds with antibacterial (Palombo & Semple, 2001;
Strobel et al., 2005; Pennacchio et al., 2005; Smith et al., 2007) and antiviral (Semple et
al., 1998) activities, as well as those useful for treating inflammatory conditions like gout
and headaches (Sweeney et al., 2001; Li et al., 2003b; Grice et al., 2010). However, few
published studies could be found that have specifically assessed the anticancer potential of
plants traditionally used by Australian Aboriginal people as medicines (Kerr et al., 1996;
Mijajlovic et al., 2006). For this reason, plants identified by local Aboriginals as having
medicinal value were screened for their antineoplastic potential as outlined below.
4.1.1 Physical properties
At the outset it was important to establish that any observed extract-induced
cytotoxicity/cytostaticity was not simply due to general physical assault such as would
occur if the extracts were hypo- or hypertonic or excessively alkaline or acidic. Therefore,
the osmolality and pH of selected extracts was measured. Additionally, as the extracts were
coloured and the main assay used to assess changes in cell proliferation upon exposure to
extracts was colourimetrically-based, spectrophotometric scans were performed to
determine the extent of potential interference.

~ Chapter 4 ~ 131
4.1.2 Initial screening
The plants chosen for assessment of their anticancer properties were those identified by
local Aboriginal experts as having some medicinal qualities. These could be either general-
purpose or specific to some condition, not necessarily cancer. Plants were collected in three
batches from areas surrounding two different townships, Titjikala in the Northern Territory
and Scotdesco in South Australia. While Aboriginal people would have traditionally
steeped the plants in boiling water, effectively producing aqueous extracts, in this project it
was the methanolic extracts that were evaluated. The rationale behind this decision was that
target compounds are usually extremely polar, so aqueous media or strongly polar solvents,
such as methanol, must be used for extraction to ensure most are recovered. However,
substantial difficulties are associated with the isolation and purification of water-soluble
compounds. For example, bacterial and fungal growth is an almost inevitable problem of
aqueous extraction procedures. These contaminants often degrade the active components or
give erroneous results in bioassays due to endotoxins produced by the microorganisms.
This is an especially real problem in anticancer activity screening because many endotoxins
(e.g. lipopolysaccharides) show distinct antitumor activities of their own. Additionally,
concentrating aqueous extracts is also problematical due to the evaporation of water. If
prolonged, the evaporation process often leads to the destruction of bioactivity and to
microbial growth (Shimizu, 1985). Therefore, methanol extracts were used instead.
4.1.3 Dose-response
The correlation between the dose (or concentration) of a compound and the biological
effects it produces is known as the dose-response relationship. The dose-response
relationship is one of the most basic tenets of pharmacology and toxicology. It purports
that, over the range of tissue sensitivity, as the dose increases, the effect increases and vice

132 ~ Chapter 4 ~
versa. There are two main types of dose-response relationships: graded and quantal. The
quantal dose-response relationship is also known as the ―all or nothing‖ response- it either
happens or it does not. The graded dose-response relationship, on the other hand, occurs on
a continuous scale and can be determined quantitatively (Schiefer et al., 1997; DiPasquale
& Hayes, 2001; Walsh et al., 2005).
4.1.4 Morphological changes
As unhealthy and dead cells are generally apparent under phase-contrast microscopy,
cultures were viewed after exposure to extracts and compared to cells in control cultures.
Moreover, one of the differences between apoptosis and necrosis is in their cell
morphology. Apoptotic cells shrink without losing plasma membrane integrity and break
into smaller pieces that macrophages recognise and engulf. In contrast, necrotic cells swell
until their plasma membrane eventually ruptures (Liles & Sailer, 2002; Lee et al., 2009).
Therefore, it was hoped that by microscopically examining cells, any such responses may
be obvious and hint at the mode of cell death.
4.1.5 Exposure and recovery
While the MTT assay is a very valid technique for measuring changes in cell proliferation
over time, it cannot distinguish between cytotoxic and cytostatic effects per se (Plumb,
1999). However, if cells are exposed to treatments for periods less than their population
doubling time and viable cell numbers are lower than for untreated cells, then it could be
assumed that the treatment had killed the cells.
Therefore, time-course experiments were performed to assess the rate of any extract-
induced inhibitory effects. It was assumed that if cell numbers were lower than control
levels within short periods (less than a doubling time, ~ 24 h, see Table 3.4), then the

~ Chapter 4 ~ 133
extracts must have been cytotoxic to that degree. If % control levels were lower in the
presence of extract only after longer exposure times, then the inhibition could have been
due to delayed cytotoxicity or overall cytostaticity (cells had either left the cell cycle or cell
death was in equilibrium with cell proliferation).
Additionally, the reversibility of the extracts‘ inhibitory effects was examined in a separate
experiment in which extracts were removed and the cells given an opportunity to recover.
Any increase in cell proliferation within this recovery period would suggest that surviving
cells were capable of growth and that any extract-induced inhibitory effects must have been
due to a reversible, cytostatic mechanism. Conversely, a lack of cell proliferation during
this period would suggest any surviving cells had either subsequently died, or had
withdrawn from the cell cycle into G0 (see Appendix A1.1).
Cells that die due to necrosis generally do so in an uncontrolled manner, releasing their
contents into the medium (Al-Lamki et al., 1998; Liles & Sailer, 2002). In contrast, cells
that undergo apoptosis die more tidily and this process generally requires less time, 1-3 h
(Kerr et al., 1972; Gavrieli et al., 1992; Al-Lamki et al., 1998). Hence, some clues as to the
mode of any extract-induced cell death may also have been revealed from these time-course
experiments.
4.2 METHODOLOGY
4.2.1 Physical properties
The following tests were conducted on selected extracts dissolved at 100 mg/mL in DMSO
and diluted to 1 mg/mL in DMEM without phenol red.

134 ~ Chapter 4 ~
4.2.1.1 Osmolality
As the osmometer on hand (a Fiske F1-10) operates by freezing point depression and the
vehicle, DMSO, has a much higher freezing point (18.5˚C) than water, it was not possible
to use this apparatus to measure the osmolality of all the extracts. Even when the extracts
were diluted to 1 mg/mL, which corresponded to 1% final concentration (v/v) vehicle,
DMSO interfered with freezing and gave erroneous values. Therefore, it was only possible
to directly measure the osmolality of extracts that readily dissolved in water using this
instrument.
However, the osmolality of extracts containing DMSO can be estimated by indirect
determination of the specific gravity (SG). This was done by measuring changes in the
refractive index of the sample using a hand-held refractometer (Atago, Japan). This
procedure is routinely performed by physicians when analysing urine samples (Chadha et
al., 2001, Eberman et al., 2009).
4.2.1.2 pH
The pH of extracts was measured using an Aqua pH cube (TPS).
4.2.1.3 Colour
As most extracts had a colour of their own, spectrophotometric scans were conducted over
wavelengths ranging from 800 nm to 200 nm using a Cary UV/VIS spectrophotometer
(Varian).
4.2.2 Initial screening
In order to identify plants having potential as anticancer therapeutics, crude methanolic
extracts were screened for their ability to inhibit cancer cell proliferation. Various plants
identified by local Aboriginal people as having medicinal properties were chosen for

~ Chapter 4 ~ 135
assessment as described in Section 2.4.1. For simplicity and confidentiality, codes were
assigned to each of the plant extracts as shown previously in Table 2.3 and reproduced here
(Tables 4.1 to 4.3). Specific details of the methodology involved in extraction are described
in Section 2.4.2.
Batch 1 samples were collected from Titjikala (NT) in July 2004. Batch 2 samples were
also from Titjikala but collected in October 2004. Batch 3 samples were collected from
Scotdesco (SA) in April 2005.
On the day of use, plant extracts were dissolved at 100 mg/mL (10% w/v) in DMSO before
dilution in incubation medium to give a final concentration of 1 mg/mL. Extracts 4 and 10
proved difficult to dissolve and, thus, the final concentration of these extracts was lower
(250 µg/mL). The diluted extracts were sterilised through 0.22 µm filters (Acrodisc) and
quadruplicate samples of 10 µL was added to 100 µL of cells in 96-well plates. In line with
other primary screening studies (Kenakin, 2003; Andreani et al., 2010), a panel of four
different human cancer cell lines were incubated with a single high concentration
(1 mg/mL) of crude extracts for 48 h before measuring any changes in cell proliferation via
the MTT assay (original method, see Sections 2.6.1 and 3.2.2).
Extracts effecting the greatest response, as measured by the relative degree of inhibition of
cell proliferation (expressed as a percentage of the negative control, % Control), were
selected for further testing in dose-response mode. In this way, the pool of extracts worthy
of subsequent analysis was reduced from 25 to 16. The inhibitory effects of the most
bioactive extracts were also compared to those of DFO and L1, compounds that have been
used clinically to treat cancer (Estrov et al., 1987; Donfrancesco et al., 1992).

136 ~ Chapter 4 ~
Table 4.1 Designation of Plant Extracts: Batch 1 (from Titjikala)
Code
Sample ID
Plant Species
1 1 (i) Eremophila longifolia
2 2 (i) Eremophila latrobei
3 3 (i) Thysanotus exiliflorus
4 *5 (i) Eremophila sturtii (filter paper residue)
5 5 (i) Eremophila sturtii
6 15 (i) Euphorbia drummondii
8 8 (i) Eremophila freelingii
9 11B (i) Acacia tetragonophylla
10 10 (i) Sarcostemma australe
11 11A (i) Acacia tetragonophylla
12 12 (i) Hakea divaricata
Table 4.2 Designation of Plant Extracts: Batch 2 (from Titjikala)
Code
Sample ID
Plant Species
19 Ti 19 Eremophila duttonii
20 Ti 20 Euphorbia tannensis
21 Ti 21 Eremophila duttonii
22 Ti 22 Hakea unknown species
23 Ti 24A Hakea divaricata
24 Ti 24B Hakea divaricata
25 Ti 25 Codonocarpus cotinifolius
26 Ti 26 Euphorbia tannensis
27 Ti 27 Eremophila freelingii
28 Ti 28 Acacia tetragonophylla
Table 4.3 Designation of Plant Extracts: Batch 3 (from Scotdesco)
Code
Sample ID
Plant Species
A S #1 Bag 01 Eremophila alternifolia
B S #1 Bag 02 Eremophila alternifolia
C S #3 Scaevola spinescens
D S #7 Eremophila alternifolia

~ Chapter 4 ~ 137
4.2.3 Dose-response
In these studies, graded dose-response relationships were assessed for a range of extract-
cell line combinations. Firstly, the effects of different concentrations of the most promising
16 extracts from the initial screen on the same four cancer cell lines were examined. From
these data, the dose-responses of the most active six extracts on more cancer cell lines and
one non-cancerous cell line were assessed. Unless specified otherwise, cells were exposed
to various concentrations of extracts for 48 h before being subjected to the MTT assay
(original method, see Sections 2.6.1 and 3.2.2).
4.2.4 Morphological changes
After exposure to extracts for the given period (generally 48 h), cells were assessed for any
changes in their morphology, indicative of viability, as well as any differences in cell
numbers compared to control cells. For this qualitative assessment, cells were usually
viewed under 400X magnification of a phase-contrast light microscope as described in
Section 2.2.2.9. Photographs of the cells were not always taken, but when they were, the
20X objective was employed instead, meaning the total magnification of micrographs was
200X. In order to make direct comparisons between cultures, the micrographs presented
herein (Fig. 4.10) were all taken on the same day.
4.2.5 Exposure and recovery
Time-course experiments were performed to determine how quickly the extracts were
exerting their effects on cells and whether or not their actions were cytotoxic or merely
cytostatic. This involved exposing cultured cells to extracts for various periods, instead of
the standard 48 h incubation. MTT assays were performed as in the original method
described in Sections 2.6.1 and 3.2.2.

138 ~ Chapter 4 ~
The first experiment was a preliminary test to ascertain how quickly the extracts were
causing their inhibitory effects in order to establish cytotoxicity or cytostaticity. In this
experiment (see Fig. 4.11), cells were simply incubated with the extracts for the given
periods and the MTT assay performed immediately upon the end of the exposure period.
That is,
Period Growth Exposure Recovery Total
(h) 24 2 - 48 0 26 - 72
The results of this preliminary experiment led to the design of the second experiment (see
Fig. 4.12), in which cells were exposed to extracts for more time points, concentrating on
the shorter periods. Additionally, at the end of the exposure period, extracts were removed
by aspiration and the medium replaced with fresh medium to allow the cells to recover for
varying periods until MTT assays were performed in synchrony at the end of the
experiment (at the end of the 72 h exposure period). That is,
Period Growth Exposure Recovery Total
(h) 24 0.5 - 72 71.5 - 0 96
In this way it was possible to assess whether the surviving cells were capable of
proliferation in the absence of extract.
4.3 RESULTS
4.3.1 Physical properties
4.3.1.1 Osmolality
The osmolality of extracts was estimated by measuring the SG, which is, in turn, estimated
by measuring the refractive index. Table 4.4 summarises the refractive indices of selected
extracts (the most extensively studied in this project) compared to various controls.

~ Chapter 4 ~ 139
Table 4.4 Refractive Indices of Selected Extracts and Controls
Extract Code
Refractive Index (=SG)
(units)
Estimated Osmolality
(mosmol/kg)*
5 1.011 440
6 1.011 440
8 1.011 440
21 1.012 480
27 1.011 440
28 1.011 440
1% DMSO 1.011 440
DMEM 1.007 280
DDW 1.000 0
* Based on 40 mosmol/kg per 0.001 unit above 1.000 (Chadha et al., 2001).
As can be seen, while water had a SG of 1.000, as expected, the SG of culture medium,
DMEM (without phenol red), was 1.007. As the measured osmolality of this DMEM was
280 mosm/kg, these measurements substantiate the published relationship (for urine
analysis) that states that, generally, SG rises by 0.001 unit for every 40 mosmol/kg increase
in osmolality (Chadha et al., 2001). However, as the refractive index is influenced by the
proportion of glucose, protein and other heavy molecules in a sample as well as the ambient
temperature (Chadha et al., 2001), it must be noted that these measurements are
fundamentally estimates of osmolality. Nevertheless, the technique was useful in discerning
any differences in osmolality between samples and controls. Indeed, it was shown that
(except for Extract 21 which had a SG of 1.012) the SG of the negative control (1% DMSO
in DMEM) was the same as that of the extracts (1.011). Hence, as the extracts themselves
did not increase the SG above that of the control, it can be inferred that there was no
difference in osmolality either.
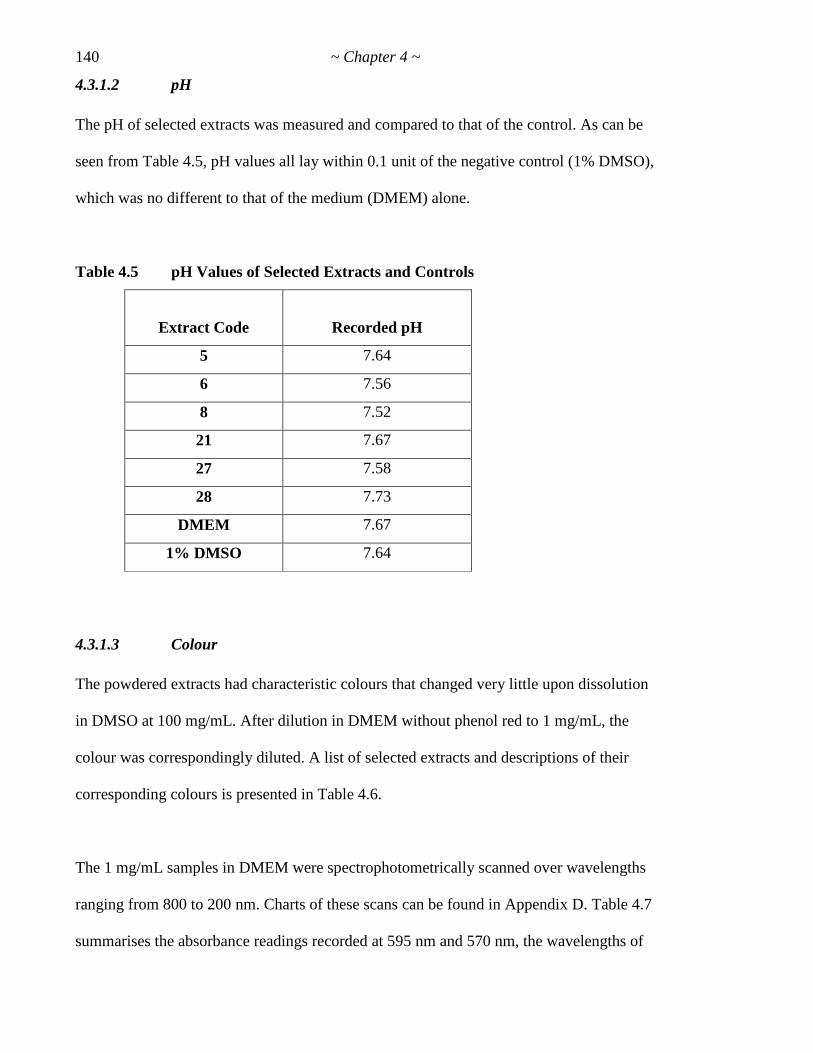
140 ~ Chapter 4 ~
4.3.1.2 pH
The pH of selected extracts was measured and compared to that of the control. As can be
seen from Table 4.5, pH values all lay within 0.1 unit of the negative control (1% DMSO),
which was no different to that of the medium (DMEM) alone.
Table 4.5 pH Values of Selected Extracts and Controls
Extract Code
Recorded pH
5 7.64
6 7.56
8 7.52
21 7.67
27 7.58
28 7.73
DMEM 7.67
1% DMSO 7.64
4.3.1.3 Colour
The powdered extracts had characteristic colours that changed very little upon dissolution
in DMSO at 100 mg/mL. After dilution in DMEM without phenol red to 1 mg/mL, the
colour was correspondingly diluted. A list of selected extracts and descriptions of their
corresponding colours is presented in Table 4.6.
The 1 mg/mL samples in DMEM were spectrophotometrically scanned over wavelengths
ranging from 800 to 200 nm. Charts of these scans can be found in Appendix D. Table 4.7
summarises the absorbance readings recorded at 595 nm and 570 nm, the wavelengths of

~ Chapter 4 ~ 141
the two different microplate readers used in this project at which solubilised MTT-
formazan is optimally absorbed. The wavelength at which the absorbance reading first
reached 2.0 is also presented.
Table 4.6 Colours of Selected Extracts
Extract
Code
Colour of
powdered extract
Colour
@100 mg/mL in DMSO
Colour
@1 mg/mL in DMEM
5 Brown Brown Yellow
6 Brown Reddish brown Murky yellowish brown
8 Brown Dark brown Tan, orangey brown
21 Dark brown Dark reddish brown Light murky yellowish brown
27 Light brown Light reddish brown Tan, orangey brown
28 Rust Reddish brown Salmon, light pinkish brown
Table 4.7 Absorbance Readings of Extracts at Relevant* Wavelengths and
Wavelength at which Absorbance >2.0
Extract
Code
Absorbance
@ 595 nm
Absorbance
@ 570 nm
at which
Absorbance > 2.0 (nm)
5 0.108 0.120 395.0
6 0.470 0.523 432.1
8 0.276 0.312 404.4
21 0.686 0.775 438.1
27 0.276 0.310 404.4
28 0.087 0.108 320.7
DMEM 0 0 234.0
1% DMSO 0 0 235.5
DDW 0 0 -
* Wavelength at which solubilised MTT-formazan crystals are absorbed optimally.
For old microplate reader (Bio-Rad) = 595 nm; new microplate reader (Biotek)
=570 nm.

142 ~ Chapter 4 ~
It is evident from the scans presented in Appendix D that extracts were, for the most part,
absorbing in the ultraviolet range of the light spectrum. However, most also absorbed
strongly in the visible spectrum around the yellow and orange regions (570-620 nm).
Extract 21 followed by Extract 6 recorded the highest absorbance readings at both 570 and
595 nm. The absorbance readings were higher at 570 nm than 595 nm.
4.3.2 Initial screening
In order to obtain a general picture of the potential effectiveness of each of the plant
extracts against cancer, cells were exposed to a single high concentration (1 mg/mL) of
extract for 48 h and evaluated using the MTT assay as described in Section 2.6.1.
Batch 1 samples (Table 4.1, Fig. 4.1) were the first to be assessed for bioactivity. For each
cell line, extract-induced effects on cell proliferation, as measured by the MTT assay, were
determined and expressed as a percentage of the negative control value (i.e. cells exposed
to DMSO alone). These data are depicted in Figure 4.1. Similarly, Batch 2 samples (Table
4.2) and Batch 3 samples (Table 4.3) were evaluated against four cell lines and these data
comprise Figures 4.2 and 4.3, respectively.
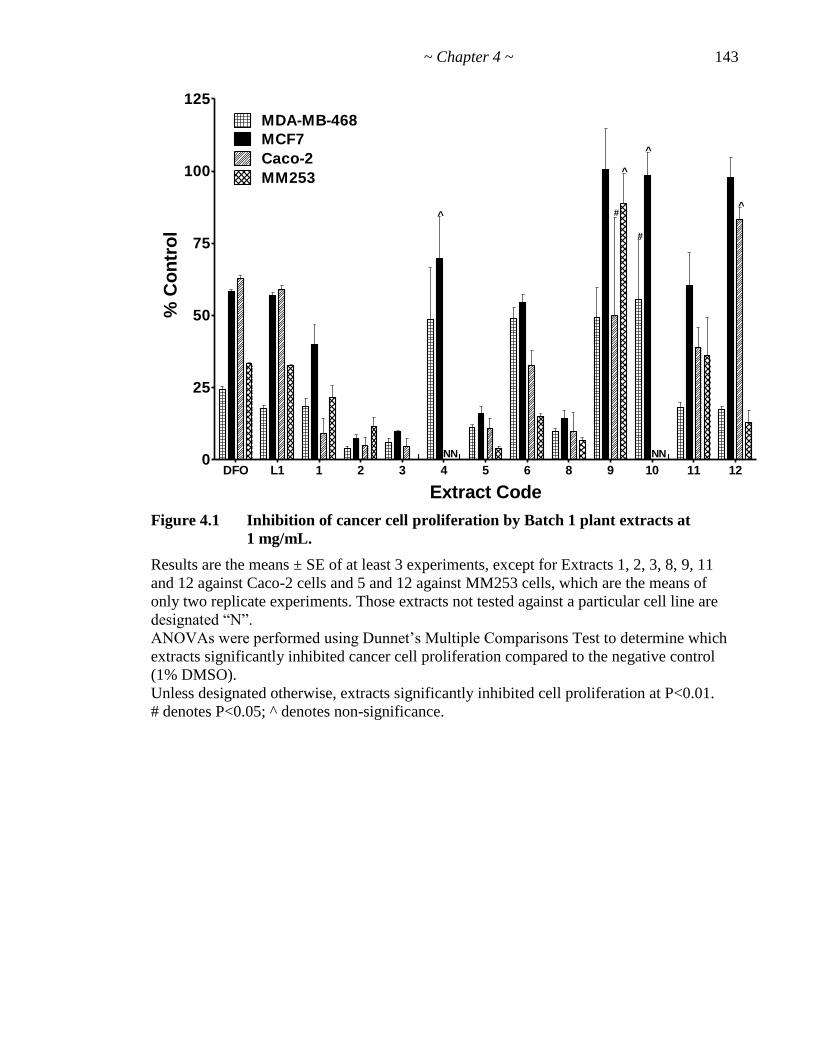
~ Chapter 4 ~ 143
DFO L1 1 2 3 4 5 6 8 9 10 11 120
25
50
75
100
125
MDA-MB-468
MCF7
MM253
Caco-2
NN NN
#
^
^
^#
^
Extract Code
% C
on
tro
l
Figure 4.1 Inhibition of cancer cell proliferation by Batch 1 plant extracts at
1 mg/mL.
Results are the means ± SE of at least 3 experiments, except for Extracts 1, 2, 3, 8, 9, 11
and 12 against Caco-2 cells and 5 and 12 against MM253 cells, which are the means of
only two replicate experiments. Those extracts not tested against a particular cell line are
designated ―N‖.
ANOVAs were performed using Dunnet‘s Multiple Comparisons Test to determine which
extracts significantly inhibited cancer cell proliferation compared to the negative control
(1% DMSO).
Unless designated otherwise, extracts significantly inhibited cell proliferation at P<0.01.
# denotes P<0.05; ^ denotes non-significance.

144 ~ Chapter 4 ~
DFO L1 19 20 21 22 23 24 25 26 27 280
25
50
75
100
125
MDA-MB-468 MCF7 Caco-2
MM253
Extract Code
% C
on
tro
l
^ ^
^
#
Figure 4.2 Inhibition of cancer cell proliferation by Batch 2 plant extracts at
1 mg/mL.
Results are the means ± SE of at least 3 experiments, except for Extract 27 against MDA-
MB-468 and MCF7 cells which are the means of only two replicate experiments and
against Caco-2 cells in which case n=1. Only one experiment was performed with Extracts
20, 22, 23, 24, 25 and 26 against MDA-MB-468, MCF7 and Caco-2 cells.
ANOVAs were performed using Dunnet‘s Multiple Comparisons Test to determine which
extracts significantly inhibited cancer cell proliferation compared to the negative control
(1% DMSO).
Unless designated otherwise, extracts significantly inhibited cell proliferation at P<0.01.
# denotes P<0.05; ^ denotes non-significance.

~ Chapter 4 ~ 145
4.3.2.1 Extracts versus negative control (DMSO)
As can be seen from Figures 4.1 to 4.3, many extracts were highly effective in inhibiting
cell proliferation when compared to the negative control (1% DMSO). All extracts from
Batch 1 (Table 4.1) significantly (P<0.01) inhibited MDA-MB-468 cell proliferation, while
only Extracts 1, 2, 3, 5, 6 and 8 significantly (P<0.01) inhibited proliferation of the other
breast cancer cell line, MCF-7. Of the Batch 1 extracts tested against Caco-2, all but
Extracts 9 and 12 significantly (P<0.01) inhibited cell proliferation, and Extract 9 was
significantly inhibitory at P<0.05. For MM253 cells, all but Extract 9 were significantly
inhibitory at P<0.01.
For Batch 2 extracts (Table 4.2, Fig. 4.2), only Extracts 19, 21 and 28 were significantly
(P<0.01) inhibitory against all cell lines tested. Extract 27 significantly (P<0.01) inhibited
proliferation of MDA-MB-468, MCF7 and MM253 cells. Extract 27 also appeared to be
effective against Caco-2 cells, but statistics could not be performed on these data as the
experiment was only performed once. This was because these experiments were simply
screening studies and Extract 27 had already qualified for further investigation based on its
inhibitory effects observed against the other cell lines tested. Similarly, the effects of
Extracts 20, 22, 23, 24, 25 and 26 against MDA-MB-468, MCF7 and Caco-2 could not be
statistically validated as n=1 in these preliminary studies. However, statistical assessment
could be made in MM253 cells, and Extracts 23 and 25 were significantly inhibitory at
P<0.01 and Extract 20 was inhibitory at P<0.05. Extracts 22, 24 and 26 were not
significantly active in the cells tested statistically.

146 ~ Chapter 4 ~
DFO L1 A B C D0
25
50
75
100
125
MDA-MB-468
MCF7
Caco-2
MM253
Extract Code
% C
on
tro
l
#
Figure 4.3 Inhibition of cancer cell proliferation by Batch 3 plant extracts at
1 mg/mL.
Results are the means ± SE of at least 3 experiments.
ANOVAs were performed using Dunnet‘s Multiple Comparisons Test to determine which
extracts significantly inhibited cancer cell proliferation compared to the negative control
(1% DMSO).
Unless designated otherwise, extracts significantly inhibited cell proliferation at P<0.01.
# denotes P<0.05; ^ denotes non-significance.
Batch 3 extracts (Table 4.3, Fig. 4.3) were all highly active against all four cell lines,
inhibiting cell proliferation compared to the negative control at the 99% significance level,
with the exception of Extract A against MCF7 cells, which was only statistically inhibitory
at P<0.05.

~ Chapter 4 ~ 147
In these experiments, bioactivity, as evidenced by inhibition of cell proliferation (% of
negative control), was assessed. Thus, the most consistently bioactive extracts against all
four cell lines were Extracts 1, 2, 3, 5, 6 and 8 from Batch 1, Extracts 19, 21, 27 and 28
from Batch 2 and all Extracts, A, B, C and D, from Batch 3. From these preliminary
screening data, the most potent appeared to be Extract 3 against MM253 cells, in particular,
but also in the other cell lines tested. The next most potent extracts were Extracts 2, 5, 19,
28, A and D, all of which, at 1 mg/mL, restricted the proliferation of at least one cell line to
less than 5% of the control. Extracts effecting an inhibition >75% of the negative control
levels (<25% control) in at least one cell line were selected for further studies.
4.3.2.2 Extracts versus positive controls (DFO and L1)
These data were also used to get a general idea of the effectiveness of the most bioactive
extracts in comparison to the positive controls, DFO and L1. For simplicity, only those
extracts effecting an inhibition of >75% compared to negative control (DMSO) levels in at
least one cell line are depicted in Figure 4.4. For inclusion in this figure, more than one
experiment (n≥2) had to be performed. Hence Extracts 22, 24 and 25 are not included in the
graph, despite registering >75% inhibition of proliferation of some cell lines. Asterisks (*)
and hash symbols (#) indicate a level of inhibition significantly better than the positive
control, DFO, at p<0.01 or p<0.05, respectively, as determined by Dunnett‘s One-way
ANOVA.

148
DFO L1 1 2 3 5 6 8 11 12 19 21 27 28 A B C D
0
25
50
75
100
MDA-MB-468
Extract
% C
on
tro
l
DFO L1 1 2 3 5 6 8 11 12 19 21 27 28 A B C D
0
25
50
75
100
MCF7
*
*
#
#
Extract
% C
on
tro
l
DFO L1 1 2 3 5 6 8 11 12 19 21 27 28 A B C D
0
25
50
75
100
Caco-2
#
* **
##
#
#
#
Extract
% C
on
tro
l
DFO L1 1 2 3 5 6 8 11 12 19 21 27 28 A B C D
0
25
50
75
100
MM253
* * *# *#
#
#
##
Extract
% C
on
tro
l
Figure 4.4 Comparison of inhibition of proliferation of cancer cell lines by selected plant extracts at 1 mg/mL.
Results are the means ± SE of at least 3 experiments, except for Extracts 1, 2, 8 and 11 against Caco-2 cells, Extracts 3 and 12 against Caco-
2 and MM253 cells and Extract 27 against MDA-MB-468, MCF7 and Caco-2 cells, which are the means of only two replicate experiments.
ANOVAs were performed using Dunnet‘s Multiple Comparisons Test to determine which extracts significantly inhibited cancer cell
proliferation compared to the positive control (DFO). * denotes P<0.01; # denotes P<0.05.

~ Chapter 4 ~ 149
As can be seen, out of all the samples tested, no extract was significantly better than either
positive control, DFO or L1, in effecting inhibition of MDA-MB-468 cell proliferation.
However, it must be noted that both DFO and L1 caused significant inhibition themselves
in these cells. For MCF-7 cells, Extracts 2 and 5 caused significantly greater than control
inhibition at the p<0.01 level, while Extracts 3 and 8 were significantly better than the DFO
control at p<0.05. These four active extracts, all from Batch 1, were also significantly more
effective than DFO in inhibiting the proliferation of Caco-2 and MM253 cells, with varying
degrees of significance. Another Batch 1 sample, Extract 1, also caused inhibition of Caco-
2 cell proliferation significantly more so than DFO at P<0.05. Batch 2 extracts displaying
significantly better inhibitory effects than DFO were Extracts 19 and 21 in Caco-2 and
MM253 cells and Extract 28 in MM253 cells. From Batch 3, Extracts A and D were more
inhibitory than DFO against MM253 cells (P<0.01) and Caco-2 cells (P<0.05), while
Extract B was also significantly (P<0.05) better than DFO in MM253 cells.
Similar results were obtained when the antiproliferative effects of extracts were compared
to those of the other positive control, L1. The only differences were that for Caco-2 cells,
Extracts 2 and 3 were only significantly better than L1 at P<0.05, while Extracts 21, A and
D were not significantly more inhibitory in this line. Additionally, in MM253 cells, Extract
A was only significantly better than L1 at P<0.05, while Extracts 3, 8 and 21 were not
significantly different.
Additionally, by presenting these data grouped according to cell line (Fig.4.4), it is more
apparent that there were differences between the effects of the various extracts on the four
cancer cell lines tested. These differential antiproliferative activities are the first suggestion
of some selectivity of the extracts.

150 ~ Chapter 4 ~
Taking all results together, the experiments of the primary screen show that some crude
extracts were more inhibitory than others (compared to each other and to positive controls)
and some displayed selectivity. In the first instance, selectivity was not a criterion for
selection for further study. Extracts were chosen for dose-response analysis based solely on
their relative inhibitory responses at 1 mg/mL. Thus, extracts causing >75% inhibition
compared to the negative control were identified and the pool of plant extracts to be tested
was reduced from 25 to 16.
4.3.3 Dose-response
Preliminary dose-response curves were generated for the 16 plant extracts featured in
Figure 4.4. Based on these screening data, the same four cancer cell lines, MDA-MB-468,
MCF7, Caco-2 and MM253, were exposed to a range of concentrations of the selected
extracts. It was not possible to average the data for each extract-cell line combination as
sometimes the extracts were only tested once against a particular cell line due to
insufficient sample being available and/or low sensitivity shown in the initial screen.
Additionally, the concentrations of extracts selected for use sometimes varied from
experiment to experiment. This was done intentionally in order to optimise the
concentration range and reduce the chance of sudden changes in proliferation rates. Thus,
the graphs presented in Figures 4.5 to 4.7 are ―typical‖ curves obtained from numerous
experiments. For simplicity, only curves obtained for Caco-2 and MM253 cells exposed to
the extracts are presented. Nonlinear regression (sigmoidal dose-response, variable slope)
curves were fitted for each extract-cell line pair using GraphPad Prism (Section 2.9.1).
These curves, along with their corresponding IC50 values (where calculable using the
default 4-Parameter model) and related statistical data, can be found in Appendix E.

151
0 200 400 600 800 10000
25
50
75
100
125
150
Extract 1
Concentration (g/mL)
% C
on
tro
l
0 200 400 600 800 10000
25
50
75
100
125
150
Extract 2
Concentration (g/mL)
% C
on
tro
l
0 200 400 600 800 10000
25
50
75
100
125
Extract 3
Concentration (g/mL)
% C
on
tro
l
0 200 400 600 800 10000
25
50
75
100
125
Extract 5
Concentration (g/mL)%
Co
ntr
ol
0 200 400 600 800 10000
25
50
75
100
125
Extract 6
Concentration (g/mL)
% C
on
tro
l
0 200 400 600 800 10000
25
50
75
100
125
Extract 8
Concentration (g/mL)
% C
on
tro
l
0 200 400 600 800 10000
25
50
75
100
125
150
Extract 11
Concentration (g/mL)
% C
on
tro
l
0 200 400 600 800 10000
25
50
75
100
125
150
Extract 12
Concentration (g/mL)
% C
on
tro
l
Figure 4.5 Typical dose-response curves for promising Batch 1 extracts.
Caco-2 (●) and MM253 (▲) cells were exposed to extracts over a range of concentrations
for 48 h before being subjected to the MTT assay. Results are expressed as % of control
values and are the means ± SE of quadruplicate wells.
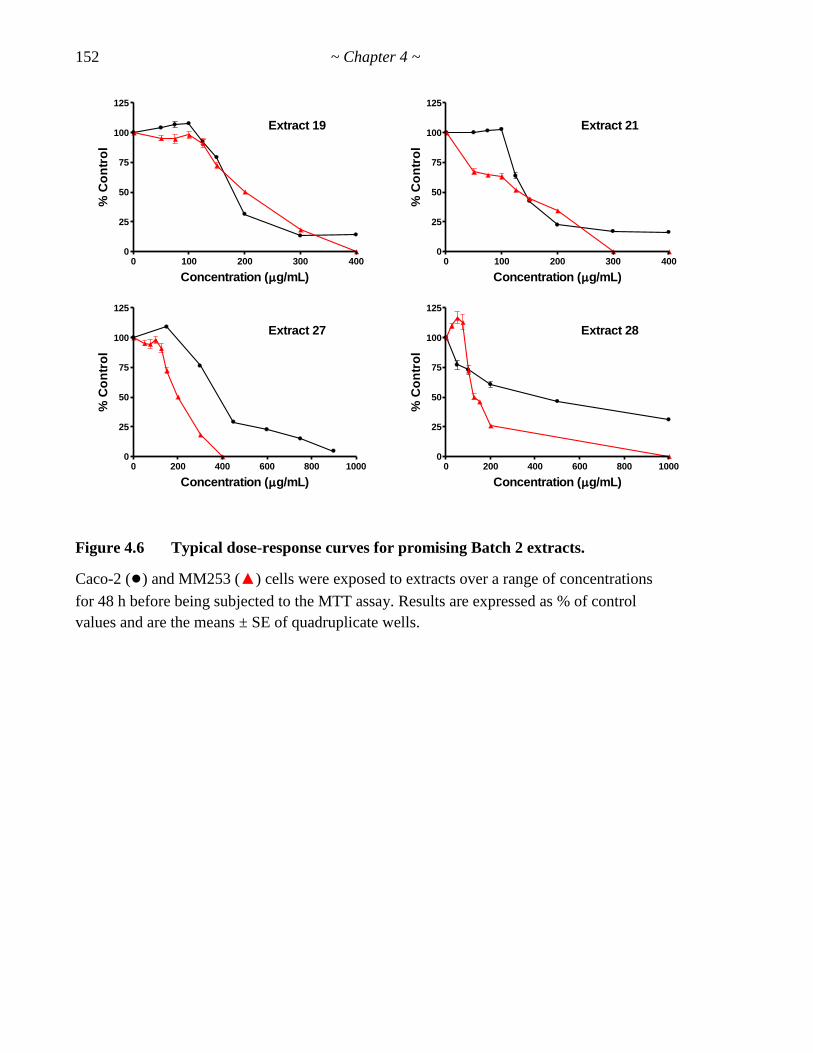
152 ~ Chapter 4 ~
0 100 200 300 4000
25
50
75
100
125
Extract 19
Concentration (g/mL)
% C
on
tro
l
0 100 200 300 4000
25
50
75
100
125
Extract 21
Concentration (g/mL)
% C
on
tro
l
0 200 400 600 800 10000
25
50
75
100
125
Extract 27
Concentration (g/mL)
% C
on
tro
l
0 200 400 600 800 10000
25
50
75
100
125
Extract 28
Concentration (g/mL)
% C
on
tro
l
Figure 4.6 Typical dose-response curves for promising Batch 2 extracts.
Caco-2 (●) and MM253 (▲) cells were exposed to extracts over a range of concentrations
for 48 h before being subjected to the MTT assay. Results are expressed as % of control
values and are the means ± SE of quadruplicate wells.

~ Chapter 4 ~ 153
0 200 400 600 800 10000
25
50
75
100
125
Extract A
Concentration (g/mL)
% C
on
tro
l
0 200 400 600 800 10000
25
50
75
100
125
Extract B
Concentration (g/mL)
% C
on
tro
l
0 200 400 600 800 10000
25
50
75
100
125
150
Extract C
Concentration (g/mL)
% C
on
tro
l
0 200 400 600 800 10000
25
50
75
100
125
150
Extract D
Concentration (g/mL)
% C
on
tro
l
Figure 4.7 Typical dose-response curves for promising Batch 3 extracts.
Caco-2 (●) and MM253 (▲) cells were exposed to extracts over a range of concentrations
for 48 h before being subjected to the MTT assay. Results are expressed as % of control
values and are the means ± SE of quadruplicate wells.
From these data, the six most promising extracts, based on a process of elimination, were
chosen for further study. Selection criteria included potency (relatively high levels of
inhibition at low concentrations and/or low IC50 values) in conjunction with suitably shaped
dose-response curves, as well as guaranteed supply of the extract. At the end of the
reductive process, Extracts 5, 6, 8, 21, 27 and 28, were identified as the six most worthy of
further evaluation. The others were eliminated as outlined below.

154 ~ Chapter 4 ~
Extracts 1 and 2 were rejected because of high (above 350 µg/mL) IC50 values (see
Appendix E). However, Extract 3 was eliminated despite recording the lowest IC50 value of
all the featured curves. While Extract 3 showed great potential as an anticancer agent
against all four cell lines in primary screening, the limited amount of sample available
precluded this extract from further study. Extract 11 was deemed not worthy of further
study based on its relatively flatter dose-response curves compared to the other extracts
available (Fig. 4.5). Like Extract 3, there was an insufficient supply of Extract 12 and so it,
too, was eliminated from the pool of extracts subject to further investigations.
Only one extract from Batch 2 was rejected. As Extract 19 was originally from the same
plant species as Extract 21 and their dose-responses and screening profiles were similar,
just one of these was chosen for further study. Despite Extract 19 recording
antiproliferative activity in the 1 mg/mL screening assays against all four cell lines (Fig.
4.2) and a lower IC50 value than Extract 21 against MM253 cells in the featured dose-
response curves (Fig. 4.6), it was eliminated as Extract 21 was more potent at lower
concentrations.
All extracts from Batch 3 were rejected. Extracts A, B and D (all the same species) were
eliminated as they all showed relatively low levels of inhibition at low concentrations (Fig.
4.7) and correspondingly high IC50 values (Appendix E) against Caco-2 cells. Moreover,
the regularly occurring sudden drops to zero in % control values over a narrow
concentration range in MM253 cells exposed to these extracts were also not desirable (see
Section 4.4.3). Extract C‘s dose-response curves were generally relatively flat, as evidenced
by the featured curves (Fig. 4.7).

~ Chapter 4 ~ 155
Thus, Extracts 5, 6, 8, 21, 27 and 28 were selected for further evaluation of their
bioactivities against a wider range of cell lines. In addition to MDA-MB-468, MCF7, Caco-
2 and MM253 cells, the lung cancer cell line, A549, two prostate cancer cell lines, PC3 and
DU145, and a non cancerous cell line, MRC5, were exposed to a consistent range of
concentrations of these six extracts for 48 h. After this time, changes in cell proliferation, as
measured by the MTT assay, and hence bioactivity, were assessed. The dose-response
curves obtained are presented in Figure 4.8. As can be seen, higher concentrations of
extract generally resulted in greater inhibition of cell proliferation with many extracts
generating the classic sigmoidal dose-response curves for each cell line over the range of
concentrations used.
In toxicology, data from dose-response experiments are frequently analysed by a logistic
model and summarised in the form of the IC50, the concentration or dose which causes a
50% inhibitory effect. In these studies it was desirable to calculate IC50 values in order to
directly compare the activities of various extracts against all the cell lines tested. The
concentrations of extracts used were transformed into logarithmic values and the data
subjected to four different models of nonlinear regression in order to achieve the most
accurate curve fits for each extract-cell line combination. However, for some extract-cell
line combinations this was problematical due to reasons to be discussed in Section 4.4.

156 ~ Chapter 4 ~
MDA-MB-468
0 200 400 600 800 10000
25
50
75
100
125
Concentration (g/mL)
% C
on
tro
lMCF7
0 200 400 600 800 10000
25
50
75
100
125
Concentration (g/mL)
% C
on
tro
l
Caco-2
0 200 400 600 800 10000
25
50
75
100
125
Concentration (g/mL)
% C
on
tro
l
MM253
0 200 400 600 800 10000
25
50
75
100
125
150
175
Concentration (g/mL)
% C
on
tro
l
A549
0 200 400 600 800 10000
25
50
75
100
125
Concentration (g/mL)
% C
on
tro
l
PC3
0 200 400 600 800 10000
25
50
75
100
125
Concentration (g/mL)
% C
on
tro
l
DU145
0 200 400 600 800 10000
25
50
75
100
125
Concentration (g/mL)
% C
on
tro
l
MRC5
0 200 400 600 800 10000
25
50
75
100
125
150
Concentration (g/mL)
% C
on
tro
l
Figure 4.8 Dose-response curves for the 6 most active extracts against all cell lines.
Cell lines were exposed to six different Extracts, 5 (▲), 6 (▲), 8 (▲), 21 (■), 27 (■), 28 (■),
over a range of concentrations for 48 h before being subjected to the MTT assay. Results
are expressed as % of control values and are the means ± SE of at least 3 separate
experiments performed in quadruplicate wells, except for MRC5 cells, which are the data
from only one experiment (means ± SE of quadruplicate wells).

157
Nevertheless, attempts were made to calculate these data using GraphPad Prism software.
Four different models were applied to each extract-cell line combination: the default 4-
Parameter (4P) model in which no constraints are set, the Top-fixed model (T) in which the
upper limit is a constant equal to 100%, the Bottom-fixed model (B) in which only the 0%
level is set and the Top and Bottom-fixed model (TB) in which both the 100% and 0%
constraints are set. The optimum method for each extract-cell line pair was chosen by
employing a function of the GraphPad Prism programme which enabled two models at
once to be directly compared and the preferred model identified. This was done for two
models at a time, the non-preferred equation being successively rejected until only one
―optimum‖ method remained. Usually, the optimum method selected by the software
coincided with that which any reasoned judgment would adopt based on the highest
squared correlation coefficient (r2 value) and the lowest confidence interval as well as the
shape of the curve fitted. All fitted curves are shown in Appendix F.
For simplicity, just the optimum method used for each extract-cell line pair is depicted in
Figure 4.9 and the IC50 values generated using this optimum method are presented in Table
4.8. Blank spaces mean that the IC50 values were incalculable for those particular extract-
cell line combinations, regardless of which model was applied. As the x- axis was a
logarithmic scale, it was not possible to calculate meaningful SEs. Instead, variation
between experiments is reported as a range, expressed as the 95% confidence interval (CI)
in g/mL.

158 ~ Chapter 4 ~
Table 4.8 IC50 Values Calculated Using Optimum Model* for Individual
Cell Line and Extract Combinations
MDA-MB-468
Extract Code
IC50 (g/mL)
IC50 Range
(95% CI) (g/mL)
Fraction of MRC5 (%)
Optimum Model
r2
5 ▲ 324.1 225.4 – 466.2 29.9 TB 0.937
6 ▲ 301.1 58.8 – 1547 TB 0.553
8 ▲ 291.7 230.4 – 369.3 26.8 TB 0.977
21 ■ 33.6 21.0 – 53.6 6.6 TB 0.979
27 ■ 0.902 0.002 – 422.8 0.1 B 0.995
28 ■ 9.56 4.09 – 22.4 3.5 T 0.999
MCF7
Extract Code
IC50 (g/mL)
IC50 Range
(95% CI) (g/mL)
Fraction of MRC5 (%)
Optimum Model
r2
5 ▲ 638.5 573.7 – 710.6 58.9 TB 0.988
6 ▲ 903.3 116.7 – 6990 TB 0.428
8 ▲ 535.7 504.3 – 568.9 49.3 TB 0.997
21 ■ 259.3 154.9 – 434.0 51.2 TB 0.911
27 ■ 225.3 179.5 – 282.9 22.4 TB 0.982
28 ■ 113.2 58.8 – 217.6 41.7 T 0.992
Caco-2
Extract Code
IC50 (g/mL)
IC50 Range
(95% CI) (g/mL)
Fraction of MRC5 (%)
Optimum Model
r2
5 ▲ 694.7 666.4 – 724.1 64.1 TB 0.998
6 ▲ 340.8 162.1 – 716.3 TB 0.849
8 ▲ 666.7 608.3 – 730.6 61.3 TB 0.993
21 ■ 146.7 65.4 – 329.3 28.9 TB 0.878
27 ■ 275.8 168.1 – 452.7 27.4 TB 0.934
28 ■ 11.7 3.46 – 39.5 4.3 T 0.992
MM253
Extract Code
IC50 (g/mL)
IC50 Range
(95% CI) (g/mL)
Fraction of MRC5 (%)
Optimum Model
r2
5 ▲
6 ▲ 272.9 219.8 – 338.9 TB 0.979
8 ▲ 585.6 428.6 – 800.2 53.9 TB 0.926
21 ■ 304.3 188.7 – 490.5 60.0 TB 0.928
27 ■ 425.6 349.3 – 518.5 42.2 B 0.984
28 ■ 74.8 57.5 – 97.4 27.6 T 0.983

~ Chapter 4 ~ 159
A549
Extract Code
IC50 (g/mL)
IC50 Range
(95% CI) (g/mL)
Fraction of MRC5 (%)
Optimum Model
r2
5 ▲ 1091 902.7 – 1319 100.6 TB 0.957
6 ▲ 189.4 178.3 – 201.2 T 0.999
8 ▲ 613.3 544.8 – 690.3 56.4 TB 0.989
21 ■ 285.6 132.0 – 617.7 56.3 TB 0.845
27 ■ 654.3 542.6 – 789.0 64.9 TB 0.972
28 ■ 1667 391.3 – 7106 614.0 TB 0.822
PC3
Extract Code
IC50 (g/mL)
IC50 Range
(95% CI) (g/mL)
Fraction of MRC5 (%)
Optimum Model
r2
5 ▲ 1018 880.8 – 1177 93.9 B 0.970
6 ▲ 232.4 192.1 – 281.2 T 0.990
8 ▲ 468.4 397.0 – 552.6 43.1 TB 0.988
21 ■ 71.0 37.4 – 134.8 14.0 TB 0.925
27 ■ 445.3 349.5 – 567.4 44.2 TB 0.976
28 ■ 605.2 434.5 – 842.8 222.9 TB 0.977
DU145
Extract Code
IC50 (g/mL)
IC50 Range
(95% CI) (g/mL)
Fraction of MRC5 (%)
Optimum Model
r2
5 ▲ 453.6 349.8 – 588.2 41.8 TB 0.958
6 ▲ 148.2 70.6 – 310.9 TB 0.882
8 ▲ 480.3 330.9 – 697.2 44.2 TB 0.931
21 ■ 75.7 26.8 – 214.0 14.9 TB 0.865
27 ■ 294.1 161.9 – 534.1 29.2 TB 0.903
28 ■ 19.7 8.14 – 47.8 7.3 T 0.972
MRC5
Extract Code
IC50 (g/mL)
IC50 Range
(95% CI) (g/mL)
Fraction of MRC5 (%)
Optimum Model
r2
5 ▲ 1084 914.2 – 1286 100 B 0.956
6 ▲
8 ▲ 1087 960.9 – 1230 100 TB 0.976
21 ■ 506.9 251.6 – 1021 100 TB 0.891
27 ■ 1008 605.6 – 1677 100 TB 0.859
28 ■ 271.5 100 4P 0.848
*Four different models were applied to each extract-cell line combination: the default 4-
Parameter (4P) model in which no constraints are set, the Top-fixed model (T) in which the
upper limit is a constant equal to 100%, the Bottom-fixed model (B) in which only the 0%
level is set and the Top and Bottom-fixed model (TB) in which both the 100% and 0%
constraints are set. Where possible, IC50 values are expressed as a percentage of those of
the normal MRC5 cells to aid in scanning for differential toxicity between the cell lines and
extracts.

160 ~ Chapter 4 ~
0.0 0.5 1.0 1.5 2.0 2.5 3.00
25
50
75
100
125
MDA-MB-468
Log of Concentration (g/mL)
% C
on
tro
l
0.0 0.5 1.0 1.5 2.0 2.5 3.00
25
50
75
100
125MCF7
Log of Concentration (g/mL)
% C
on
tro
l
0.0 0.5 1.0 1.5 2.0 2.5 3.00
25
50
75
100
125Caco-2
Log of Concentration (g/mL)
% C
on
tro
l
0.0 0.5 1.0 1.5 2.0 2.5 3.00
25
50
75
100
125
MM253
Log of Concentration (g/mL)
% C
on
tro
l
0.0 0.5 1.0 1.5 2.0 2.5 3.00
25
50
75
100
125
A549
Log of Concentration (g/mL)
% C
on
tro
l
0.0 0.5 1.0 1.5 2.0 2.5 3.00
25
50
75
100
125
PC3
Log of Concentration (g/mL)
% C
on
tro
l
0.0 0.5 1.0 1.5 2.0 2.5 3.00
25
50
75
100
125
DU 145
Log of Concentration (g/mL)
% C
on
tro
l
0.0 0.5 1.0 1.5 2.0 2.5 3.00
25
50
75
100
125MRC5
Log of Concentration (g/mL)
% C
on
tro
l
Figure 4.9 Nonlinear regressions of six most active extracts using the optimum
model for each extract-cell line pair.
Cell lines were exposed to six different Extracts, 5 (▲), 6 (▲), 8 (▲), 21 (■), 27 (■), 28 (■),
over a range of concentrations for 48 h before being subjected to the MTT assay. Dose
values (Fig. 4.8) were transformed into log10 values and curves were fitted using GraphPad
Prism nonlinear regression dose-response (variable slope) according to the optimum
method for each extract-cell line combination.

~ Chapter 4 ~ 161
Based on IC50 values, it would appear that Extract 27 was the most active of all, inhibiting
MDA-MB-468 cell proliferation with an IC50 of 0.902 g/mL. However the range of error
for this value was very large (95% CI = 0.002 – 422.8 g/mL). Extract 28 was also very
active, recording IC50 values of 9.56, 11.7 and 19.7 µg/mL in MDA-MB-468, Caco-2 and
DU145 cells, respectively. The next most potent extract according to these data was Extract
21, with IC50 values below 80 µg/mL in three cancer cell lines. Extract 6 also recorded IC50
values of less than 200 µg/mL in two cell lines, A549 and DU145. The highest IC50 value
recorded for any extract against the non-cancerous MRC5 cells was 271.5 µg/mL for
Extract 28. However, the shape of the curve fitted in this case is clearly not appropriate as
MRC5 cell proliferation was actually stimulated by higher concentrations of this extract
(Fig. 4.9).
It was possible to calculate valid IC50 values for most extract- cell line pairs. However, as
will be addressed in the Discussion (Section 4.4.3), despite using the optimum method of
curve-fitting, IC50 values could not be calculated for some extract-cell line pairs (e.g.
Extract 5 against MM253 cells). Furthermore, in some cases there was a mismatch between
the IC50 value and the shape of the dose-response curve. For example, Extract 28 had
limited effect on reducing the proliferation of MCF7 cells (Fig. 4.8), barely reducing the
proliferation of these cells to less than 50% of the control, and yet it recorded a relatively
low IC50 value of 113.2 g/mL (Table 4.8). Additionally, confidence intervals were
sometimes very large and correlation coefficients small. For example, the 95% CI for
Extract 6 against MDA-MB-468 cells ranged from 58.8 to 1,547 µg/mL and the
corresponding correlation coefficient of the curve fit was only 0.553. Other inconsistencies
162 ~ Chapter 4 ~
between dose-response curves and IC50 values were also apparent and reasons for and the
implications of these discrepancies are discussed in Section 4.4.3.
4.3.4 Morphological changes
Micrographs of selected extract-cell line combinations are presented in Figure 4.10. These
micrographs were taken of cells cultured under the same conditions, except for the presence
or absence of the extract under scrutiny.
From these selected micrographs it is clear that there were differences between the effects
of different extracts on different cell lines. For example, Extract 21 caused MDA-MB-468
cells to round up and lose adherence to the culture surface. Moreover, there were fewer
cells in this scenario than in the DMSO control. The effect was even more pronounced in
MM253 cells. However, the same extract had very little effect on A549 cells with DMSO-
and Extract 21-treated cultures appearing very similar.

~ Chapter 4 ~ 163
Figure 4.10 Micrographs of selected extract-cell line combinations.
Cells were exposed to 500 µg/mL of selected extracts for 48 h and examined under a phase-
contrast light microscope (200X) for confluency and morphological differences to the
control (DMSO).
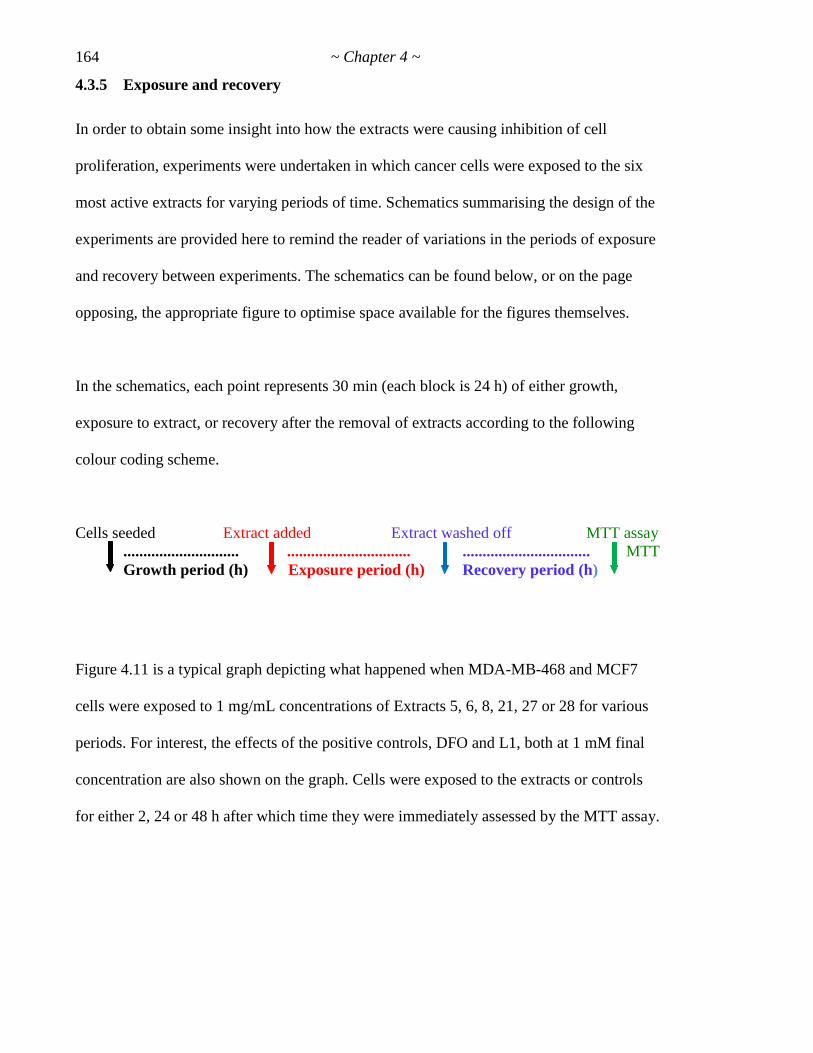
164 ~ Chapter 4 ~
4.3.5 Exposure and recovery
In order to obtain some insight into how the extracts were causing inhibition of cell
proliferation, experiments were undertaken in which cancer cells were exposed to the six
most active extracts for varying periods of time. Schematics summarising the design of the
experiments are provided here to remind the reader of variations in the periods of exposure
and recovery between experiments. The schematics can be found below, or on the page
opposing, the appropriate figure to optimise space available for the figures themselves.
In the schematics, each point represents 30 min (each block is 24 h) of either growth,
exposure to extract, or recovery after the removal of extracts according to the following
colour coding scheme.
Cells seeded Extract added Extract washed off MTT assay
............................. ............................... ................................ MTT
Growth period (h) Exposure period (h) Recovery period (h)
Figure 4.11 is a typical graph depicting what happened when MDA-MB-468 and MCF7
cells were exposed to 1 mg/mL concentrations of Extracts 5, 6, 8, 21, 27 or 28 for various
periods. For interest, the effects of the positive controls, DFO and L1, both at 1 mM final
concentration are also shown on the graph. Cells were exposed to the extracts or controls
for either 2, 24 or 48 h after which time they were immediately assessed by the MTT assay.

~ Chapter 4 ~ 165
0 6 12 18 24 30 36 42 480
25
50
75
100
125
MDA-MB-468
Exposure Period (hours)
% C
on
tro
l
0 6 12 18 24 30 36 42 480
25
50
75
100
125
Exposure Period (hours)
% C
on
tro
l
MCF7
Figure 4.11 Effect of exposure time of most active six extracts on MDA-MB-468 and
MCF7 cell proliferation.
Cell lines were exposed to 1 mg/mL of one of six different Extracts, 5 (▲), 6 (▲), 8 (▲), 21
(■), 27 (■) or 28 (■), or 1 mM of controls, DFO (○) or L1 (□), for various periods before
being subjected to the MTT assay. Results are expressed as % of control values and are the
means ± SE of a representative experiment performed in triplicate wells.
Time line (h) 24 48 72
................................................ ↓.... ↓MTT
Growth (24 h) Exposure (2 h)
................................................ ↓ ................................................ ↓MTT
Growth (24 h) Exposure (24 h)
................................................ ↓ ................................................................................................ ↓MTT
Growth (24 h) Exposure (48 h)

166 ~ Chapter 4 ~
As can be seen from Figure 4.11, in both cell lines all extracts exerted most of their
inhibitory effects within the first 2 h of exposure, most recording >50% inhibition
compared to control levels within this time. Extract 8 against MCF7 cells and Extract 27
against both cell lines were only slightly less inhibitory than this, but even these extracts
still registered inhibition of >40% within 2 h. This initial marked drop within 2 h
indicates that the effects of the extracts were cytotoxic to some cells, as any difference in
the number of viable cells present could not be due to proliferation of control cells within
such a short period. In contrast, both positive controls, DFO and L1, required longer to
elicit a (smaller) response in these cell lines, suggesting their inhibitory actions were via
cytostatic mechanisms.
Extract 6 caused the quickest effect of all the extracts and controls in both cell lines,
causing >95% inhibition within 2 h in both cases. This indicates that the extract was
cytotoxic to at least 95% of the cell population. However, after 24 h exposure to Extract
6, the % of control values had increased in both MDA-MB-468 cells and MCF7 cells, and
even more by 48 h, indicating the surviving cell populations were capable of proliferation.
This also appeared to be the case for Extract 28, although the levels of inhibition were not
as great as with Extract 6. In contrast, longer exposure periods to other extracts caused
increased inhibition of cell proliferation, suggesting either cytostaticity of the surviving
cells, or cytotoxicity that required longer to manifest.
Therefore, it was of interest to clarify how extracts were affecting the surviving cells.
Were the effects of extracts reversible and cells able to return to the cell cycle (see
Appendix A.1.1), or did the extracts irreversibly affect the cells such that they left the cell
cycle and were either static or dead? To answer this question, cells were exposed to the
extracts for various time periods before the extracts were withdrawn and the medium
~ Chapter 4 ~ 167
replaced so the cells may be given a chance to recover. The effects of the six extracts and
two positive controls were assessed after nine exposure periods. It is important to note
that the subsequent MTT assays were performed at the same time on the same day such
that the recovery period differed for each exposure time point. Since the MTT assays
were performed just after the 72 h exposure time point, the recovery periods for each
exposure time point were effectively 72 h minus the exposure period. For example, cells
exposed to an extract for 24 h had 48 h to recover before being assayed and cells exposed
for 4 h had an additional 20 h (=68 h) to recover before they were assayed. The results of
a representative experiment in which the reversibility of the inhibitory effects of the six
most active extracts on MDA-MB-468 and MCF7 cells were assessed are depicted in
Figure 4.12. Similar results were obtained from other experiments, but because the ranges
of exposure periods used were not identical, mean values could not be calculated.
The results depicted in Figure 4.12 echo those of Figure 4.11 in that the inhibitory effects
of all the extracts were relatively rapid, indicating cytotoxic effects. Within just 30 min,
two extracts, 5 and 21, had caused more than 90% inhibition of both MDA-MB-468 and
MCF7 cell proliferation, and within only 1 h all extracts had caused >40% inhibition of
MDA-MB-468 cell proliferation, with Extract 27 also effecting marked inhibition (>85%)
of MCF7 cell growth. By 2.5 h all extracts had caused more than 40% inhibition of
proliferation of both cell lines, and by 6 h all extracts had caused greater than 60%
inhibition. This is a different result than what is depicted in Figure 4.11 in which Extract
6 caused almost total inhibition of both MDA-MB-468 and MCF7 cell growth within just
2 h. However, in the second experiment, the cells were given an opportunity to recover as
the MTT assay was not performed until nearly three days later (for the shortest exposure
periods). While the magnitude of the inhibitory effects of Extract 6 may not have been as
large (as in Fig. 4.11), the pattern was still similar in that the inhibitory effects of this

168 ~ Chapter 4 ~
extract were rapid, with >50% inhibition achieved within the first 30 min in MDA-MB-
468 cells and within 4 h in MCF7 cells.
Figure 4.12 conveys that the inhibitory effects of at least three of the extracts, 5, 21 and
27, were irreversible within 24 h of exposure. That is, even after the extracts were
removed from the cells, proliferation, as measured by the MTT assay, did not increase
after exposure to these extracts. If the treated cells had been able to recover, it would be
expected that the % control values of cells would be higher for short exposure periods
than longer exposure periods. For example, cells exposed to extracts for less than 6 h
would have at least 66 h in which they could proliferate, if they were capable of doing so,
and so should have higher % control values than cells given less time to recover. This
appears to be the case for Extracts 6, 8 and 28. However, as lower % control values could
simply be a function of extract-induced cytostaticity when compared to control cells that
were able to proliferate normally over the same period, it was helpful to compare the
results of Figure 4.12 with those of Figure 4.11.
Experimental design (Fig. 4.12):
Time line (h) 24 48 72 96
................................................ ↓.↓............................................... ................................................ ................................................ ↓ MTT
Growth (24 h) Exposure (0.5 h) Recovery (71.5 h)
................................................ ↓..↓.............................................. ................................................ ................................................ ↓ MTT
Growth (24 h) Exposure (1 h) Recovery (71 h)
................................................ ↓.....↓........................................... ................................................ ................................................ ↓ MTT
Growth (24 h) Exposure (2.5 h) Recovery (69.5 h)
................................................ ↓........↓........................................ ................................................ ................................................ ↓ MTT
Growth (24 h) Exposure (4 h) Recovery (68 h)
................................................ ↓..........↓...................................... ................................................ ................................................ ↓ MTT
Growth (24 h) Exposure (6 h) Recovery (66 h)
................................................ ↓................................................ ↓................................................ ................................................ ↓ MTT
Growth (24 h) Exposure (24 h) Recovery (48 h)
................................................ ↓................................................ ................................................ ↓................................................ ↓ MTT
Growth (24 h) Exposure (48 h) Recovery (24 h)
................................................ ↓................................................ ................................................ ................................................ ↓↓ MTT
Growth (24 h) Exposure (72 h) No recovery

~ Chapter 4 ~ 169
0 1 2 3 4 5 60
25
50
75
100MDA-MB-468
6 12 18 24 30 36 42 48 54 60 66 72
Exposure Period (hours)
% C
on
tro
l
0 1 2 3 4 5 60
25
50
75
100 MCF7
6 12 18 24 30 36 42 48 54 60 66 72
Exposure Period (hours)
% C
on
tro
l
Figure 4.12 Reversibility of inhibitory effects of the six most active extracts on
MDA-MB-468 and MCF7 cell proliferation.
Cell lines were exposed to 1 mg/mL of one of six different Extracts, 5 (▲), 6 (▲), 8 (▲),
21 (■), 27 (■) or 28 (■), or 1 mM of controls, DFO (○) or L1 (□), for the various periods
indicated. The extracts were then washed off, the medium replaced and the cells allowed
to recover before being subjected to the MTT assay at the 72 h time point. Results are
expressed as % of control values and are the means ± SE of triplicate wells of a
representative experiment.
170 ~ Chapter 4 ~
To further ascertain if the inhibitory effects of Extracts 6, 8 and 28 were reversible or just
required longer to manifest, % control values were compared to the corresponding time
points in the experiment presented in Figure 4.11. For Extracts 6 and 28 (but not 8), the %
control in both MDA-MB-468 and MCF7 cells after 2 h was lower when the MTT assay
was performed immediately after the exposure period ended (Fig. 4.11) than when the
cells were allowed to recover (Fig. 4.12). This suggests the inhibitory effects of Extracts 6
and 28 were reversible, while those of Extract 8 were irreversible.
Conversely, fewer viable cells present for a given time point in Figure 4.12 compared to
Figure 4.11 would have been suggestive of cell death (cytotoxicity), or at least complete
growth arrest (cytostaticity) of surviving cells, within the recovery period. Extracts 5 and
21 irreversibly arrested the growth of both cell lines within 30 min, while Extract 27
required 1 h exposure. However, it is not possible to say whether the lower % control
values in Figure 4.12 were because surviving cells had died during the recovery period, or
simply cell-cycle arrested. Nevertheless, after at least 6 h exposure to these extracts, cells
did not recover even when the recovery period was extended to almost six days (data not
shown).
4.4 DISCUSSION
4.4.1 Physical properties
While many physical properties of the extracts could possibly influence their effects on
cells, just three were examined as part of this study. Osmolality and pH were chosen as
they were simple to measure and yet of fundamental physiological significance. Extract
colour was significant as cytotoxicity was assessed primarily via a colourimetric method.
~ Chapter 4 ~ 171
4.4.1.1 Osmolality
According to refractive indices (SG measurements), none of the extracts were particularly
hypertonic. However, it must be remembered that while there is generally a very good
correlation between SG and osmolality, SG is only an estimate of osmolality (Voinescu et
al., 2002). This is because SG is the ratio of a sample‘s density to water and as such it
depends on both the number and mass of the solute particles, whereas osmolality is a
measure of the number of solute particles only (Pradella et al., 1988; Dorizzi & Caputo,
2005).
Given that the refractive index of Extract 28 (and others) was no different to that of the
control (1% DMSO) and cells exposed to this concentration of DMSO were viable and
readily proliferated (see Figs. 3.11 and 3.12 and 6.8), this finding supports the inferences
made, based on measured refractive indices, that the extracts did not have particularly
high osmolalities. Therefore, it was concluded that, except for the possible exception of
Extract 21 (which had a slightly higher refractive index than the control), high osmolality
was not the reason behind the extracts‘ cytotoxic properties.
4.4.1.2 pH
The observed cytotoxicity of the extracts was also not due to excessive acidity or
alkalinity as the pH values of the most effective extracts were similar to that of the
negative control, 1% DMSO.
4.4.1.3 Colour
The fact that the extracts all had some colour is significant as this could potentially
interfere with the results of the MTT assay, which is, of course, spectrophotometrically
based. From Table 4.7 it is obvious that all extracts tested, but 6 and 21 in particular,
absorbed at 570 and 595 nm, the same wavelength range as MTT-formazan. While wells
containing extract and medium only were used as controls for such background
172 ~ Chapter 4 ~
absorbance, very high values still caused complications for the MTT assay. This problem
was the driving force behind changing to the modified assay of Fox et al. (2005) in latter
experiments.
4.4.2 Initial screening
The constraints of this project meant it was not logistically possible to further evaluate all
25 samples for their anticancer potential. Hence, the preliminary screening data were used
to narrow down those extracts to those that showed the greatest potential as anticancer
agents. The theory was that if an extract did not display much bioactivity at the highest
concentration tested (1 mg/mL), it would show less activity at a lower dose. This is the
same principle behind the NCI‘s initial screening studies in which compounds are tested
at a single high concentration against the all cell lines in the NCI-60 panel and only
compounds meeting pre-determined threshold inhibition criteria in a minimum number of
cell lines progress to the full five-concentration assay (Andreani et al., 2010). While it is
acknowledged that this well-established theory does have its flaws, at the time this
seemed to be the most logical method of discriminating between the different extracts.
The weaknesses of this approach, such as possible interactive effects between individual
components of mixtures causing lower doses to display higher bioactivities than higher
doses, will be discussed further in Sections 5 and 8.
Nevertheless, the initial screening data established that some extracts were more potent
than others at 1 mg/mL (Figs 4.1 – 4.3). They also hinted at a degree of cell line
selectivity. Some extracts were even more inhibitory than the positive control (DFO) in
one or more cell lines. The fact that no extract was significantly more inhibitory than
DFO in the MDA-MB-468 cell line could probably be attributed to the fact that DFO
itself was very inhibitory in this line, rather than any lack of sensitivity to the various
extracts.

~ Chapter 4 ~ 173
From these screening data, the 16 extracts showing the greatest inhibition of cancer cell
proliferation at this high dose, as assessed by the MTT assay, were chosen for preliminary
dose-response evaluation. Unfortunately, it was not possible to further evaluate one of the
most active extracts, Extract 3, due to insufficient material being available.
4.4.3 Dose-response
The 16 extracts exhibiting the greatest bioactivity in the initial screen were subjected to
preliminary dose-response studies (Figs 4.5 – 4.7). The most promising extracts were
chosen from this group based on the calculated IC50 values and the general shapes of the
fitted curves (4P model only). From these results, it was concluded that the six most
promising extracts were 5, 6, 8, 21, 27 and 28. The others were eliminated from the pool
for further study.
The six most promising extracts were subjected to more intensive dose-response studies,
using a panel of eight cell lines in total, including one non-cancerous line, MRC5, in
order to evaluate selectivity for cancer cells. It is clear from the dose-response curves in
Figure 4.8 that the extracts did, indeed, have differential effects on different cell lines. For
example, Extract 28 markedly inhibited MDA-MB-468 cell proliferation compared to the
control. However, the same extract had much less effect on A549 cells. Similar low
activity was demonstrated in MCF7, MM253 and PC3 cells exposed to Extract 28, while
Caco-2 cells and DU145 cells displayed intermediary responses. In MRC5 cells, Extract
28 caused no inhibition whatsoever. If anything, it stimulated proliferation of these cells.
Other similarities and differences can be easily discerned between the dose-response
curves of different extracts and between cell lines, indicating selectivity.
This selectivity is confirmed by the range of different IC50 values obtained for different
cell lines exposed to the same extract (Table 4.8). In toxicology, IC50 values are a

174 ~ Chapter 4 ~
generally accepted way of directly comparing dose-responses of various substances.
Unfortunately, despite using several models to calculate IC50 values, it was not possible to
determine these values for all extract-cell line combinations (i.e. Extract 5 on MM253
cells and Extract 6 on MRC5 cells). Moreover, when IC50 values were determined, they
were not always reliable measures of an extract‘s effectiveness. For some extract-cell line
combinations the 95% confidence interval was extremely large or incalculable and the
correlation coefficient was small (e.g. Extract 6 on MDA-MB-468 and MCF7 cells). In
other cases there was a mismatch between the IC50 value and the shape of the dose-
response curve (e.g. Extract 28 on MCF7 cells).
But why was there such a discrepancy between what is evident from the dose-response
curves and what was determined mathematically? In some cases the answer lies in the
fact that the curves do not reach the 50% inhibition level over the concentration range
tested. This was true for Extract 5, for example, where even the highest concentration
tested, 1,000 g/mL, only inhibited proliferation of A549 cells to 55.8% of the control
level. The only way to overcome this problem would have been to perform repeat
experiments using a higher range of concentrations of extract. However, a limiting factor
of the concentrations chosen was the solubility of the extracts. By dissolving the extracts
in DMSO at 100 mg/mL, the highest achievable final concentration of extracts in the
cultures was 1,000 g/mL. This corresponded to a final DMSO concentration of 1% (v/v).
As discussed in Chapter 3, DMSO levels above this concentration were inhibitory on cell
proliferation themselves and would have resulted in skewed IC50 values anyway. Besides,
as the point of the study was to identify extracts with high potency, using concentrations
of extract above the screening concentration was considered something of limited interest
to be done only if time permitted.

~ Chapter 4 ~ 175
In other instances the sigmoidal dose-response (variable slope) nonlinear regression
model was probably not a suitable model in the first place. This would be true in the case
of Extract 6 on MDA-MB-468 (and MCF7, Caco-2 and DU145) cells where the curve
obviously ―kicks up‖ at 1,000 µg/mL. Removing this high concentration data point results
in a lower IC50 value with improved CI and r2 values. However, it was believed that in
order to fairly compare the effects of each individual extract on the different cell lines,
honesty in data reporting was fundamental. Therefore, the same general dose-response
(variable slope) model was applied to each extract-cell line pair; only the equations used
to define the top and bottom parameters were altered as described.
As discussed above, the dose-response curves of some extract- cell line pairs (e.g. Extract
28 against DU145 cells) were flatter than a classical sigmoidal dose-response model
would predict. Conversely, for other extract-cell line combinations, the dose-response
curve was steeper than predicted. For example, just 31.2 µg/mL of Extract 28 caused
more than 75% inhibition of proliferation of MDA-MB-468 cells followed by a flattening
of the curve. As this was the lowest concentration tested, the dose-response curve dropped
suddenly from 100% at 0 µg/mL to 21.7% at 31.2 µg/mL. Similarly, 250 µg/mL of
Extract 27 did not cause significant inhibition of MM253 cells, while 500 µg/mL, the next
concentration tested, and only twice as much, was enough to cause over 60% inhibition of
proliferation of these cells. Usually, this order of change is achieved over a much greater
concentration range, with classical single-site inhibitor increases from 10% to 90%
inhibition recorded over an 80-fold concentration range (Shoichet, 2006). Steep dose-
response curves are very prevalent in early screening studies but the underlying physical
events responsible are poorly understood and beyond the scope of this discussion
(Shoichet, 2006).

176 ~ Chapter 4 ~
While both particularly flat and particularly steep dose-response curves both pose
problems for fitting sigmoidal curves, the especially steep scenario is more likely to be
misinterpreted. In screening studies, extracts causing flat dose-response curves are
generally ignored and eliminated from further investigation. On the other hand, extracts
showing any marked bioactivity are tagged as interesting, warranting further study. While
a steep change in response may be due to extreme potency, the high proportion of this
occurrence in screening studies would suggest otherwise (Shoichet, 2006). In fact, one
common indication of an artifactual hit in screening is a steep dose-response curve, often
signalled by a high Hill slope coefficient (Shoichet, 2006). The general interpretation is
that high Hill slopes indicate more inhibition of a target is being observed than would be
expected if the compound had a simple binding mechanism. Practically, high Hill slopes
often portend compounds less likely to be easily optimised and, therefore, pharmaceutical
companies (e.g.Vertex) use this parameter to eliminate compounds from further
consideration (Walters & Namchuk, 2003). If extracts in the current study had shown
universally steep dose-response curves against all cell lines tested, they would have been
similarly eliminated from the pool for further evaluation.
While Hill coefficients are a valid means of measuring the steepness of a curve, the
values calculated for the dose-response curves featured in Figure 4.9 were not reported in
Table 4.8. This is because Hill coefficients are dependent on the parameters used in a
curve fit and, therefore, there is a danger the values could be over interpreted (Shoichet,
2006). However, regardless of whether the steep dose-responses observed in these studies
are due to artifactual inhibition or are a function of very potent inhibitory properties of the
relevant extracts, the fact remains that the cells‘ sensitivities to small changes in extract
concentrations presented difficulties in accurate curve fitting and therefore the generation
of accurate IC50 values.

~ Chapter 4 ~ 177
Nevertheless, while the calculated IC50 values are possibly not accurate, there can be little
argument that they are of some use in providing a way of directly comparing the dose-
responses of different extract-cell line combinations. Irrespective of their exact values,
what can be undeniably inferred from the calculated IC50 values is that some of the plant
extracts exhibited differential bioactivity against different cancer cell lines. Additionally,
the cell lines displayed heterogeneity of cell sensitivities to the various extracts which was
not a simple function of population doubling time.
4.4.4 Morphological changes
The dose-response data quantitatively reveal the differential bioactive effects of extracts
on the various cell lines. However, these differences were also readily apparent by eye.
From the sample micrographs presented (Fig. 4.10), it is quite evident that some cell lines
are more susceptible to certain extracts than others. For example, Extract 5 clearly caused
MDA-MB-468 and MM253 cells to round up and lift off the culture dish whilst having
little effect on A549 cells. Similarly, MDA-MB-468 cells appeared necrotic after
exposure to Extract 21, as evidenced by their shrivelled appearance, as did MM253 cells
to an even greater extent. However, A549 cells exposed to the same extract appeared no
different to the control (DMSO only). The effects of Extract 28 on MDA-MB-468 cells
were more pronounced than either of the other two extracts featured, whereas it was
Extract 21 that caused the greatest change to the number and morphology of MM253
cells.
These observations highlight the specificity of some extracts for various cell lines. They
can also offer valuable insights, but ultimately only clues, as to their modes of action. For
example, it may be inferred from the above micrograph that there were fewer MDA-MB-
468 cells present after they were exposed to Extract 28, for example, because this extract
was causing the cells to die, either by apoptosis or necrosis, and lift off the culture dish.

178 ~ Chapter 4 ~
However, it is more likely that the observed differences in cell number were due to this
extract inducing inhibition or retardation of cell proliferation (cytostaticity) as these
treated cells appeared bright and rounded (implying viability) and were also noticeably
smaller (suggesting G0 arrest). The case for cell death is more compelling for MM253
cells exposed to Extract 21, the amount of extracellular debris and distorted shapes of the
cells suggesting they were necrotic and the reduced number is because the rest, as they
died, had become non-adherent and been washed away or simply shrivelled up to
virtually nothing. Shrinkage was unlikely to have been due to osmotic effects as the
extracts were not hypertonic (see Section 4.3.1.1). Neither were the observed effects on
cells related to alkalinity or acidity as all extracts were pH neutral (Section 4.3.1.2). The
specificity of the extracts for various cell lines confirms that the effects were not due to
generalised cytotoxicity caused by non-physiological pH or osmolalities.
However, in order to make judgments regarding necrosis, corroborating evidence from
further experiments is necessary. Other ways to detect necrosis are discussed later in
Appendix O. However, a major disadvantage of many of these methods of determining
cell viability by measuring losses in membrane integrity is that, while they are commonly
used as markers for necrosis, they cannot distinguish between primary necrosis resulting
from a physical or chemical insult to the cell and secondary necrosis that eventually
follows apoptosis of cells in vitro (Riss et al., 2006; Krysko et al., 2008). Similarly, in the
current study, it was not possible to discern microscopically whether the perceived
necrosis was primary or secondary as cells were viewed only at a single, late-stage time
point when even cells that died via an apoptotic pathway would have displayed many of
the morphological features of primary necrosis (Krysko et al., 2008; see Section 8.2.4.4).

~ Chapter 4 ~ 179
4.4.5 Exposure and recovery
Although the MTT assay is often described as a cytotoxicity assay (Sgouras & Duncan,
1990; Fotakis & Timbrell, 2006; Bopp & Lettieri, 2008), all it can really do is provide
information about whether there are differences between the numbers of metabolically
active cells present in treated and untreated cultures. If there are differences in the
numbers of viable cells present, the MTT assay does not allow inferences to be made
regarding whether there are fewer cells because the treatment has arrested proliferation or
growth of cells, or whether the treatment has actually killed the cells (Plumb, 1999).
Thus, to gain more insight into the modes of action of the extracts, time-course
experiments were performed in which cancer cells were exposed to the most active
extracts for different durations. In one experiment, the extracts were removed and the
cells cultured for longer periods in order to distinguish between cells that were viable and
able to proliferate and those that remained viable but were incapable of proliferation. The
results of this experiment, depicted in Figure 4.12, suggested that the inhibitory effects of
the extracts were generally irreversible within the time periods tested. Even after recovery
periods of up to six days (data not shown), the numbers of viable cells did not increase at
all compared to control cultures, suggesting, therefore, that the actions of the extracts
were cytotoxic or irreversibly cytostatic.
It was also clear from these experiments that the inhibitory effects of all the extracts were
very rapid. Where cytotoxicity was evident, the relative speed of the response implied an
apoptotic mechanism, as opposed to necrosis which is generally a longer process (Kerr et
al., 1972; Gavrieli et al., 1992; Al-Lamki et al., 1998). From Figure 4.11, it appears that
Extract 6 exhibited the quickest response of all the extracts tested, with >95% of both

180 ~ Chapter 4 ~
MDA-MB-468 and MCF7 cells dying within just 2 h. However, after 24 h exposure to
this extract, the number of cells in both cell lines had increased and by 48 h exposure they
were even higher. These increases in cell numbers suggest that, in contrast to the effects
of some other extracts, the inhibitory effects of Extract 6 were only short-term as
surviving cells were capable of proliferation. Similarly, Extract 28 registered a higher
number of viable cells present after 24 and 48 h compared to 2 h exposure. With Extract
28 there was a primary increase in cell numbers between 2 and 24 h and a subsequent
decrease at the 48 h time point, suggesting a biphasic response of initial cytostaticity
followed by secondary cytotoxicity. This biphasic pattern in which cytostatic effects
become cytotoxic after prolonged exposure (and/or at higher concentrations) is frequently
observed in studies of inhibition of cell proliferation (Krischel et al., 1998; Lori et al.,
2005; Obajimi et al., 2009; Pappa et al., 2007). All other extracts tested, 5, 8, 21 and 27,
and positive controls inhibited cell proliferation of MDA-MB-468 and MCF7 cells in a
time-dependent manner, with Extract 5 being the most inhibitory after both 24 and 48 h
exposure.
The results depicted in Figure 4.12 indicate that Extracts 5 and 21 elicited the fastest
inhibitory responses of all the extracts and controls tested, recording greater than 90%
inhibition of both MDA-MB-468 and MCF7 cell proliferation after just 30 min exposure.
While this is not the same result as that shown in Figure 4.11, where the actions of Extract
6 were the most rapid, the general data presented in both figures are similar in that they
reflect the overall speed of the inhibitory effects of the extracts. Differences in the
magnitudes of the responses of the individual extracts in both figures can be attributed to
several factors. Firstly, in the second experiment (Fig. 4.12), cells were given an
opportunity to recover and proliferate, before being assayed. Hence, a lower % control
value in the first experiment (Fig. 4.11) than for the corresponding time point in the
~ Chapter 4 ~ 181
second experiment (Fig. 4.12), suggested its inhibitory effects were reversible. On the
other hand, lower cell numbers in the second experiment were indicative of additional cell
death (cytotoxicity) or irreversible cytostaticity.
A second reason for observed discrepancies between the data depicted in Figures 4.11 and
4.12 is to do with the fact that the extracts were present in the wells when the MTT assay
was performed in the first experiment, but not in the second. While colour interference
was controlled for by subtracting background absorbance values, it is possible that the
extracts themselves may have interfered with MTT reduction (see Section 8.2.3.2). This is
the main reason why the MTT assay was overhauled to remove extracts before the
addition of MTT (see Chapter 3).
An alternative explanation for higher cell numbers after longer exposure periods is that
the half-life of the extracts (or at least their active constituents) in solution may be short.
Perhaps the extracts were simply degraded within this period. Alternatively, maybe the
cells were able to metabolise the active compounds. Regardless, the possibility that the
extracts were somehow eliminated or otherwise unavailable within the experimental time
frame cannot be excluded and could explain some cell recovery. Certainly, many
anticancer agents, including important chemotherapeutics like paclitaxel, vinblastine and
fluorouracil, have short biological half-lives and yet are still clinically very useful
(Galijatovic et al., 1999; Shalaby, 2004; Yang et al., 2007). Moreover, drug delivery
techniques exist (and more are being developed) that allow the controlled, slow and
sustained release of drugs over prolonged periods. These systems include coating drugs
with various biomaterials, incorporating them into biodegradable copolymer films,
encapsulating them inside hydrogels, nanoparticles or nanotubes, or using nanofibre
scaffolds (Farb et al., 2001; Haider et al., 2004; Nagai et al., 2006; Cheng & Lim, 2009;

182 ~ Chapter 4 ~
Hilder & Hill, 2009; Numata & Kaplan, 2010). Therefore, while it was desirable that the
inhibitory effects were cytotoxic, extracts that exerted potent effects via reversible,
cytostatic mechanisms were also of interest.
In conclusion, from these screening studies, the four most promising extracts, in terms of
their potency and selective cytotoxicity or cytostaticity against cancer cells, were 5, 6, 21
and 28. These were obtained from Eremophila sturtii, Euphorbia drummondii,
Eremophila duttonii and Acacia tetragonophylla, respectively. This is in support of other
research in which four of the same Eremophila species tested in the current study were
screened for bioactivity against three common cancer cell lines (including DU145) and
normal fibroblasts and all, but E. duttonii and E. sturtii in particular, were found to
display substantial and differential cytotoxic activities (Mijajlovic et al., 2006).
4.5 SUMMARY
In summary, a total of 25 plants from two distinct areas were chosen for evaluation of
their anticancer potential based on traditional Indigenous medical knowledge of those
species. Relevant plant parts were harvested and crude methanolic extracts derived. These
plant extracts were assessed for their bioactivity against four different human cancer cell
lines using the MTT assay to measure changes in cell proliferation. Preliminary screening
narrowed the field to a pool of 16 promising extracts which were assessed for their dose-
responses against the same four cell lines. Based on these data, six extracts were chosen
for more thorough assessment of their effects, including morphological changes, the
kinetics of their actions and their dose-response relationships against a panel of several
more cancer cell lines and one non-cancerous cell line. These six extracts exhibited
differences between each other and between cell lines, indicating a degree of selectivity.
The most promising four of these methanolic Extracts, 5, 6, 21 and 28 were chosen for
further evaluation, the results of which constitute Chapter 5.

~ Chapter 5 ~ 183
Chapter 5: Evaluation of Most Promising Plant Extracts
5.1 INTRODUCTION
5.1.1 Sample collection and extract preparation
Of the original 25 plant samples collected, four (5, 6, 21 and 28) were chosen for further
evaluation, based on the bioactivity of their methanolic extracts, as assessed by the MTT
assay (see Chapter 4). However, as these methanol samples were aging (over 2 years old)
and some were almost depleted, it was necessary to collect fresh samples of the relevant
plants in order to perform chemical analysis. For two of the species, two samples from
different locales were collected, giving six plant samples altogether. To ensure the
recovery of more active constituents, these six plant samples were extracted not only with
methanol, but with water or ethyl acetate too. This extraction procedure resulted in three
fractions for each sample and a total of 18 extracts.
5.1.2 Chemical analysis of extracts
The 18 extracts were analysed by High Performance Liquid Chromatography (HPLC)
coupled to UV detection in order to identify the chemical components and provide clues
as to those likely to be responsible for any cytotoxic effects. Additionally, volatiles of the
four plant species were analysed by Gas Chromatography-Mass Spectrometry (GC-MS).
5.1.3 Extract bioactivity
The 18 extracts were subjected to the MTT assay as well as a lethality assay using brine
shrimp. The results of these tests highlighted several extracts worthy of further study as
potential anticancer agents.

184 ~ Chapter 5 ~
5.2 METHODOLOGY
5.2.1 Sample collection and extract preparation
The collection, harvesting and transport of fresh plant samples was carried out as
described in Section 2.4.1, except that the quarantine facility was at the Chemistry Centre
of Western Australia (Hay Street, East Perth) and this was also where the extractions were
performed.
Plant parts were ground up thoroughly into a powder using a café grounder and extracted
into ethyl acetate (EA), methanol (M) and aqueous (A) fractions. The extraction
procedure is summarised in the flowchart presented as Figure 5.1.
Extracted samples were given further identifier codes such that each sample (1 to 6) was
classified accordingly. For example, the ethyl acetate extract of Sample 3 was called EA3
and the aqueous extract of Sample 6 was A6.
Extracts were prepared and chemically analysed by a collaborator, Dr Shao Fang Wang
(ChemCentre, WA). HPLC-UV for chemical profile analysis was performed on all 18
extracts. GC-MS analyses for volatiles were performed only on the essential oils of
samples with strong aromas.
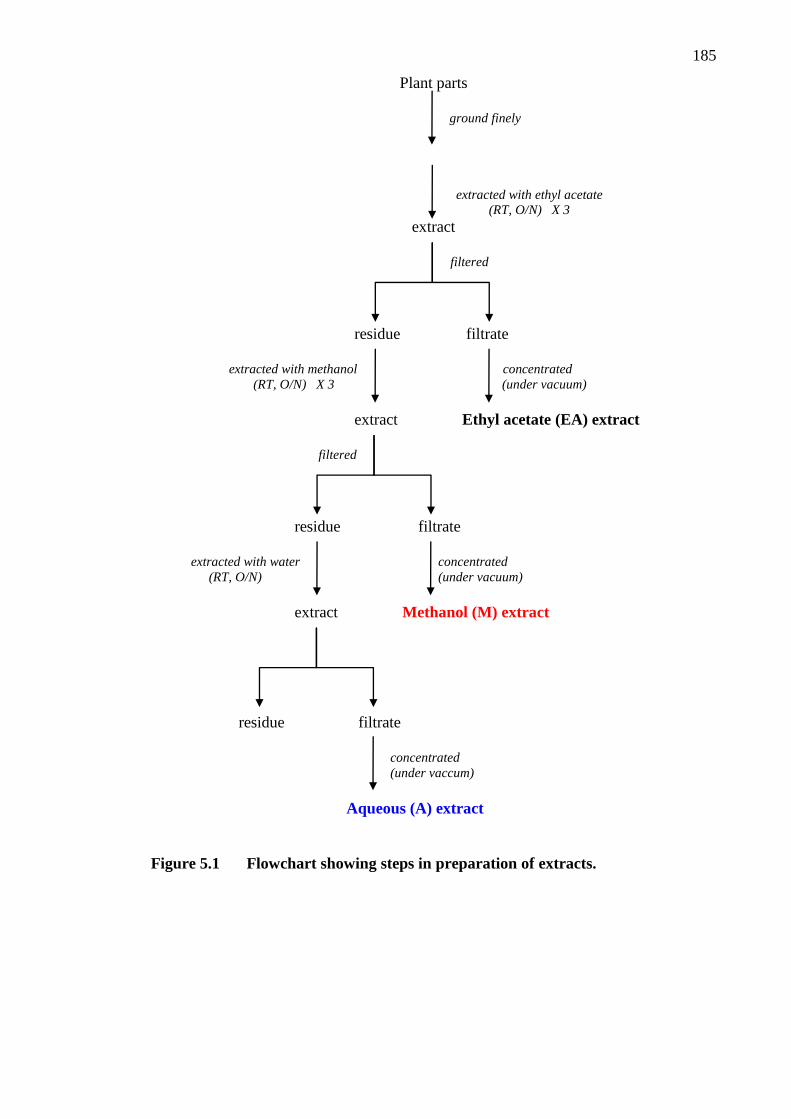
185
Plant parts
ground finely
extracted with ethyl acetate
(RT, O/N) X 3
extract
filtered
residue filtrate
extracted with methanol concentrated
(RT, O/N) X 3 (under vacuum)
extract Ethyl acetate (EA) extract
filtered
residue filtrate
extracted with water concentrated
(RT, O/N) (under vacuum)
extract Methanol (M) extract
residue filtrate
concentrated
(under vaccum)
Aqueous (A) extract
Figure 5.1 Flowchart showing steps in preparation of extracts.

186 ~ Chapter 5 ~
5.2.2 Chemical analysis of extracts
5.2.2.1 HPLC-UV
HPLC-UV for chemical profile analysis and identification of compounds was
performed on an Alliance Waters 2695 HPLC separation module pump with a Waters
2996 Photodiode Array Detector (UV detector). Empower software was used for the
HPLC instrument. The chromatography was performed using an Apollo C18, 5 µm 250
x 4.6 mm column (Alltech) at 30˚C. The analyte was eluted by a gradient mobile phase
system consisting of solvent A (acetonitrile) and solvent B (0.6% H3PO4 in water). As
an example, the solvent gradient used for HPLC-UV analysis of the ethyl acetate
fraction of Sample 3 (EA3) is presented (Table 5.1).
Table 5.1 Solvent Gradient for HPLC-UV Analysis of EA3
Time (min) Acetonitrile Water:H3PO4
initial 10 90
1.00 10 90
25:00 25 75
40:00 90 10
45:00 90 10
46:00 10 90
55:00 10 90
UV absorption spectra at wavelengths of 254 nm, 280 nm and 350 nm allowed for
optimal detection of all phenolic compounds, simple phenolics and flavonoids,
respectively.
5.2.2.2 GC-MS
For identification of essential oils by GC-MS analysis, samples were first extracted with
a solvent mixture (hexane: ether 1:1) and filtered. The organic solution was then
concentrated under N2 and hexane was added to dissolve the residue. Volatiles were
identified based on comparison to standard compounds in the GC-MS library.

~ Chapter 5 ~ 187
5.2.3 Extract bioactivity
All extracts were dissolved at 100 mg/mL in DMSO on the day of use, diluted and
filtered, as described previously (section 4.2.2).
5.2.3.1 MTT assay
The MTT assay was again employed to screen for bioactivity. This procedure was
identical to the alternative method of Fox et al. (2005) as outlined in section 2.7.1.1.
Importantly, extracts were removed before starting the assay. As the four samples had
already been selected on the basis of their potency, all extracts were initially screened
against cancer cells at a lower concentration (250 g/mL) than in the primary screen.
The most active eight were chosen for dose-response studies at concentrations ranging
from 25 to 500 g/mL.
5.2.3.2 Brine shrimp lethality assay (BSLA)
The brine shrimp lethality assay (BSLA) described in section 2.6.3 was used to assess
general toxicity of the eight most bioactive extracts. Briefly, nauplii in artificial sea
water (ASW) in 96-well plates were exposed to various concentrations of extracts and
scored for immobility, equating to death, over time. The effects of eight extracts were
tested at a higher range of concentrations, 125 to 1,000 g/mL at three time points (2,
24 and 48 h) and compared to control wells containing just the vehicle (DMSO) at the
same final concentration. Total numbers of brine shrimp in each well were determined
after sacrifice with methanol (~ 15% v/v final concentration). Extracts were filtered
before use through a 2 m membrane in order to reduce debris that interfered with
visibility and therefore accurate counting of total nauplii. Due to the labour
intensiveness of transferring swimming nauplii to wells, each experiment was
performed with duplicates only, although experiments were repeated up to five times.
Other controls used were deferoxamine mesylate (DFO) and camptothecin (CPT) at
1 mM and 0.1 mM final concentrations, respectively.

188 ~ Chapter 5 ~
5.3 RESULTS
5.3.1 Sample collection and extract preparation
Samples labelled 1 to 6 were collected from sites near the township of Titjikala as
indicated in Table 5.2. As can be seen, Samples 5 and 6 were from the same species,
Acacia tetragonophylla, collected from different trees located approximately 40 km
apart. Similarly, Samples 3 and 4 were from different specimens of the same plant,
Eremophila duttonii, approximately 12 km distant from each other. As these samples
were fresh collections of those displaying bioactivity in the initial screen (see Chapter
4), the original identifier codes are also presented in parentheses for reference.
Table 5.2 Plant Sample Collection Details
Sample Code
(= original code)
Species
Details
1
(=6)
Euphorbia drummondii 14 plants collected at Titjikala town site at top of
sand hill near water tank
2
(=5)
Eremophila sturtii 10 plants collected at Titjikala rubbish tip site
3
(=19 and 21)
Eremophila duttonii Collected 12 km from Titjikala down Chambers
Pillar Rd
4
(=19 and 21)
Eremophila duttonii 10 plants collected near Titjikala rubbish tip site
5
(=28)
Acacia tetragonophylla 4 roots from 3 trees collected 25 km west of
Titjikala (root bark and root shavings)
6
(=28)
Acacia tetragonophylla 7 small roots from 3 trees collected 30 km south
of Titjikala (root scrapings)
5.3.2 Chemical analysis of extracts
5.3.2.1 HPLC-UV
Representative HPLC analyses performed by Dr Shao Fang Wang are presented in
Appendix G. A spreadsheet outlining some of the more important differences and
similarities between the methanol and ethyl acetate fractions of the various samples (in
terms of the major chromatographic peaks) is also provided. According to Dr Wang‘s

~ Chapter 5 ~ 189
expert interpretations of the chromatograms and UV spectra, the following summary of
the composition of each of the extracts is offered (Fang, S.-F., personal
communications, 31st May 2010 and 13
th June, 2010). The methanol extract of Sample 1
(M1) contained fewer flavonoids than all other methanolic samples. Sample M2 had a
very high flavonoid content, as did M3 and M4 whose chromatograms were very
similar to each other and to M2. M5 contained fewer flavonoids, but more than M6
(>M1). There was a particular flavonoid (unidentified, RT = 24.07 min, 350 nm) that
was more concentrated in M5 than any other sample. Peaks corresponding to the
retention times (RTs) typical of catechins and similar UV spectra at 254 nm suggested
the presence of this class of compound in Samples M1, M5 and M6, while cinnamic
acid-like compounds were detected in M2, M3 and M4.
The ethyl acetate fraction of Sample 1 (EA1) did not contain many flavonoids, but there
were some other unidentified polyphenols and perhaps catechins. EA2, EA3 and EA4
contained many flavonoids and other polyphenols, including compounds that may have
been catechins (or similar). The chemical profile of EA2 was much more complex than
that of EA3 or EA4, which were similar to each others. There was not much difference
between the chemical make-ups of EA5 and EA6, which both contained a few
flavonoids and little else.
All aqueous fractions contained some tannins (Fang, S.-F., personal communications,
31st May 2010 and 13
th June, 2010). There were some flavonoids in A1, but at a lower
concentration than was present in any of the ethyl acetate fractions. A1 contained the
highest proportion of phenolics, with one major peak at a RT of 18.298 min (254 nm),
which corresponded to a compound that could not be identified due to a complex UV
spectrum. All other aqueous fractions also contained some phenolics, with A2 having a
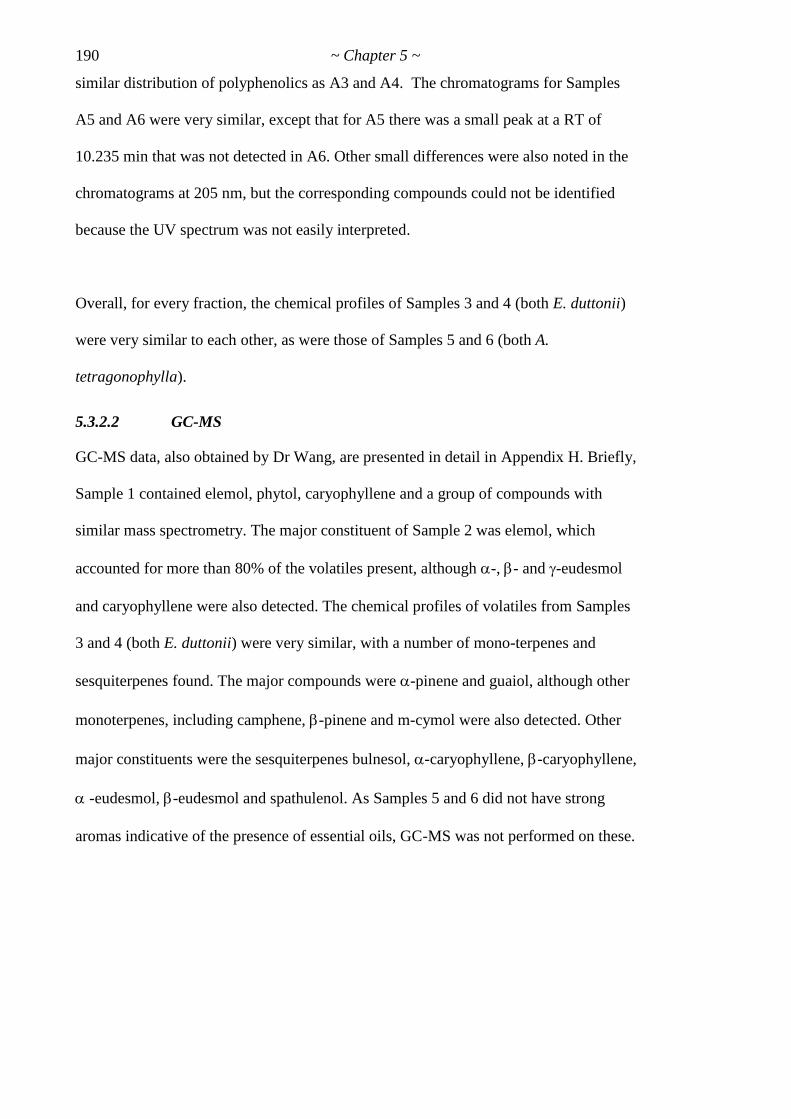
190 ~ Chapter 5 ~
similar distribution of polyphenolics as A3 and A4. The chromatograms for Samples
A5 and A6 were very similar, except that for A5 there was a small peak at a RT of
10.235 min that was not detected in A6. Other small differences were also noted in the
chromatograms at 205 nm, but the corresponding compounds could not be identified
because the UV spectrum was not easily interpreted.
Overall, for every fraction, the chemical profiles of Samples 3 and 4 (both E. duttonii)
were very similar to each other, as were those of Samples 5 and 6 (both A.
tetragonophylla).
5.3.2.2 GC-MS
GC-MS data, also obtained by Dr Wang, are presented in detail in Appendix H. Briefly,
Sample 1 contained elemol, phytol, caryophyllene and a group of compounds with
similar mass spectrometry. The major constituent of Sample 2 was elemol, which
accounted for more than 80% of the volatiles present, although -, - and -eudesmol
and caryophyllene were also detected. The chemical profiles of volatiles from Samples
3 and 4 (both E. duttonii) were very similar, with a number of mono-terpenes and
sesquiterpenes found. The major compounds were -pinene and guaiol, although other
monoterpenes, including camphene, -pinene and m-cymol were also detected. Other
major constituents were the sesquiterpenes bulnesol, -caryophyllene, -caryophyllene,
-eudesmol, -eudesmol and spathulenol. As Samples 5 and 6 did not have strong
aromas indicative of the presence of essential oils, GC-MS was not performed on these.

~ Chapter 5 ~ 191
5.3.3 Extract bioactivity
5.3.3.1 MTT assay
Cancer cell proliferation was inhibited by many of the 18 samples tested at the lower
screening concentration of 250 g/mL (Figure 5.2). The ethyl acetate extracts of
Samples 3 and 4 (EA3 and EA4) were the most potent agents tested at this
concentration. Other extracts that inhibited cell proliferation of at least two cell lines by
more than 75% were M5 and A5 in MM253, PC3 and DU145 cells. Extracts that
reduced cell proliferation of at least one cell line by at least 25% were M1, M5, M6,
EA3, EA4, EA5, EA6 and M5.
The least active extracts were M2, M3, M4, EA1, EA2, A1, A2, A3, A4 and A6, which
did not reduce cancer cell proliferation of any line tested, and, in fact, actually caused
increased cell proliferation in some cases.
From these data, the most promising eight extracts were chosen for further inhibition
studies over a range of concentrations from 25 to 500 g/mL. Dose-response curves
were obtained for extracts EA3, EA4, EA5, EA6, A5, M1, M5 and M6, and these are
presented in Figure 5.3.

192 ~ Chapter 5 ~
MethanolEthyl acetateAqueous
0255075
100125150
1 , 2 , 3 , 4 , 5 , 6
Methanol Ethyl acetate Aqueous0
25
50
75
100
125
150 MDA-MB-468
## #
#
* *
Extract
% C
on
tro
l
Methanol Ethyl acetate Aqueous0
25
50
75
100
125
150 MCF7
Extract
% C
on
tro
l
# ##
##
#
Methanol Ethyl acetate Aqueous0
25
50
75
100
125
150 Caco-2
Extract
% C
on
tro
l
# # ##
#
# ##
Methanol Ethyl acetate Aqueous0
25
50
75
100
125
150 MM253
Extract
% C
on
tro
l
#
# #
##
#
***
Methanol Ethyl acetate Aqueous0
25
50
75
100
125
150 A549
Extract
% C
on
tro
l
#
#
Methanol Ethyl acetate Aqueous0
25
50
75
100
125
150 PC3
Extract
% C
on
tro
l
#
##
#
#
#
*
*
Methanol Ethyl acetate Aqueous0
25
50
75
100
125
150 DU145
Extract
% C
on
tro
l
## # ##
* *
Figure 5.2 Screening of 18 extracts
Cancer cell lines were exposed to various extracts, methanol, ethyl acetate or aqueous
fractions of Samples , at 250 g/mL for
48 h before being subjected to the MTT assay. Results are expressed as % of control
values and are the means ± SE of 4 separate experiments.
# denotes <75% of control; * denotes <25% of control.

~ Chapter 5 ~ 193
0 100 200 300 400 5000
25
50
75
100
125
150
MDA-MB-468
Concentration (g/mL)
% C
on
tro
l
0 100 200 300 400 5000
25
50
75
100
125
150
MCF7
Concentration (g/mL)
% C
on
tro
l
0 100 200 300 400 5000
25
50
75
100
125
150
Caco-2
Concentration (g/mL)
% C
on
tro
l
0 100 200 300 400 5000
25
50
75
100
125
150
175
MM253
Concentration (g/mL)%
Co
ntr
ol
0 100 200 300 400 5000
25
50
75
100
125
150
A549
Concentration (g/mL)
% C
on
tro
l
0 100 200 300 400 5000
25
50
75
100
125
150
PC3
Concentration (g/mL)
% C
on
tro
l
0 100 200 300 400 5000
25
50
75
100
125
150
DU145
Concentration (g/mL)
% C
on
tro
l
0 100 200 300 400 5000
25
50
75
100
125
150
MRC5
Concentration (g/mL)
% C
on
tro
l
Figure 5.3 Dose-response curves for 8 most active extracts.
Cell lines were exposed to eight different extracts, EA3 (■), EA4 (▼), EA5 (●), EA6
(▲), A5 (●), M1 (♦), M5 (●), M6 (▲), over a range of concentrations for 48 h before
being subjected to the MTT assay. Results are expressed as % of control values and are
the means ± SE of at least 5 separate experiments performed in quadruplicate wells.

194 ~ Chapter 5 ~
It is apparent from Figure 5.3 that extracts EA3 and EA4 were bioactive against most
cell lines, even at the low concentrations. At 25 g/mL, the lowest concentration
trialled, the only other extract to cause more than 10% growth inhibition of any cancer
cell line tested was M5 in DU145 cells and MDA-MB-468 cells. However, this extract
also resulted in relatively high reduction in growth of the non-cancerous cell line,
MRC5.
Higher concentrations of extracts generally resulted in increased inhibition of
proliferation of most cell lines. At the highest concentration tested, 500 g/mL, all eight
extracts inhibited the growth of MDA-MB-468 and PC3 cells by more than 50%, while
all but EA6 caused greater than 50% inhibition of MM253 cells. DU145 cells were
almost as susceptible to every extract, with 500 g/mL of each enough to cause greater
than 45% inhibition of growth in each case. Proliferation of MCF7 cells was inhibited
by over 50% by 500 g/mL EA3, EA4 and M5. At this concentration, only extracts
EA3 and M5 reduced proliferation of Caco-2 cells by more than 50%. Except for M5,
no extract caused more than 50% reduction in growth of the lung cancer cell line, A549.
Most extracts generated classic dose-response curves for each cell line over the range of
concentrations used (Fig. 5.3). It was desirable to calculate IC50 values in order to
directly compare the activities of various extracts against all the cell lines tested.
However, for some extract- cell line combinations this was problematical due to reasons
already discussed in Section 4.4 (e.g. not dropping below 50% level). Another factor,
the existence of hormesis, also complicated curve fitting. Hormesis, to be discussed
further in Sections 5.4.3 and 8.2.4.3, is the phenomenon of a stimulatory response at
low doses of an inhibitor. Nevertheless, attempts were made to calculate these data
using GraphPad Prism software.

~ Chapter 5 ~ 195
As in Section 5.2.2, four different models were applied to each extract-cell line
combination: the default 4-Parameter (4P) model in which no constraints are set, the
Top-fixed model (T) in which the upper limit is a constant equal to 100%, the Bottom-
fixed model (B) in which only the 0% level is set and the Top and Bottom-fixed model
(TB) in which both the 100% and 0% constraints are set. The optimum method was
chosen based on the highest correlation coefficient (r2 value) and the lowest confidence
interval as well as the shape of the curve fitted. All fitted curves are shown in Appendix
I. For simplicity, just the optimum method used for each extract-cell line pair is
depicted (Fig. 5.4) and the IC50 values ± 95% CI generated using this optimum method
presented (Table 5.3). The presence of hormetic effects is indicated by asterisks in the
last column of Table 5.3. Those extracts that caused stimulation of more than 20% of
the control values (Fig. 5.3) are denoted by two asterisks (**), while those causing at
least 10% stimulation of growth are denoted by *.
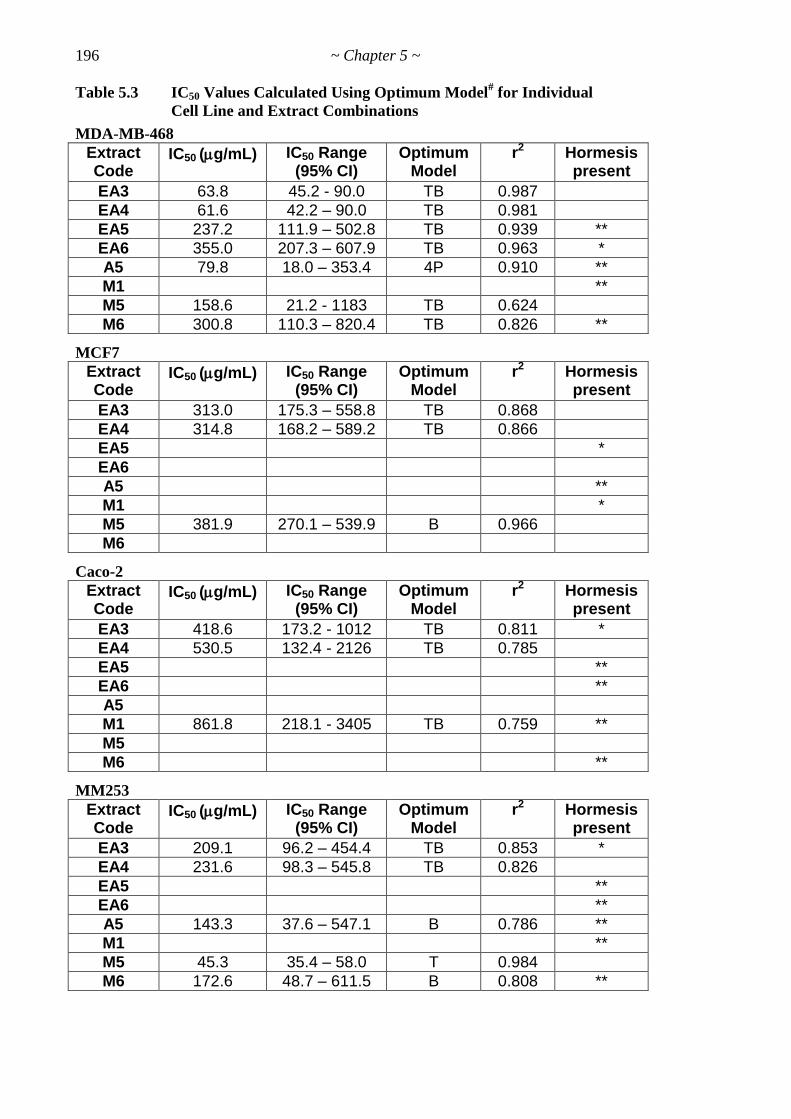
196 ~ Chapter 5 ~
Table 5.3 IC50 Values Calculated Using Optimum Model# for Individual
Cell Line and Extract Combinations
MDA-MB-468
Extract Code
IC50 (g/mL)
IC50 Range (95% CI)
Optimum Model
r2 Hormesis present
EA3 63.8 45.2 - 90.0 TB 0.987
EA4 61.6 42.2 – 90.0 TB 0.981
EA5 237.2 111.9 – 502.8 TB 0.939 **
EA6 355.0 207.3 – 607.9 TB 0.963 *
A5 79.8 18.0 – 353.4 4P 0.910 **
M1 **
M5 158.6 21.2 - 1183 TB 0.624
M6 300.8 110.3 – 820.4 TB 0.826 **
MCF7
Extract Code
IC50 (g/mL)
IC50 Range (95% CI)
Optimum Model
r2 Hormesis present
EA3 313.0 175.3 – 558.8 TB 0.868
EA4 314.8 168.2 – 589.2 TB 0.866
EA5 *
EA6
A5 **
M1 *
M5 381.9 270.1 – 539.9 B 0.966
M6
Caco-2
Extract Code
IC50 (g/mL)
IC50 Range (95% CI)
Optimum Model
r2 Hormesis present
EA3 418.6 173.2 - 1012 TB 0.811 *
EA4 530.5 132.4 - 2126 TB 0.785
EA5 **
EA6 **
A5
M1 861.8 218.1 - 3405 TB 0.759 **
M5
M6 **
MM253
Extract Code
IC50 (g/mL)
IC50 Range (95% CI)
Optimum Model
r2 Hormesis present
EA3 209.1 96.2 – 454.4 TB 0.853 *
EA4 231.6 98.3 – 545.8 TB 0.826
EA5 **
EA6 **
A5 143.3 37.6 – 547.1 B 0.786 **
M1 **
M5 45.3 35.4 – 58.0 T 0.984
M6 172.6 48.7 – 611.5 B 0.808 **

197
A549
Extract Code
IC50 (g/mL)
IC50 Range (95% CI)
Optimum Model
r2 Hormesis present
EA3 28.2 13.4 – 59.1 T 0.883
EA4 25.3 Not given T 0.889
EA5 165.7 97.5 – 281.5 4P 0.984
EA6 760.2 409.0 - 1413 TB 0.900
A5 201.0 112.9 – 357.8 4P 0.951 *
M1 861.0 144.8 - 5121 B 0.850
M5 279.3 155.8 – 500.9 TB 0.892
M6 575.4 330.0 - 1004 TB 0.865
PC3
Extract Code
IC50 (g/mL)
IC50 Range (95% CI)
Optimum Model
r2 Hormesis present
EA3 25.8 22.1 – 30.2 T 0.993
EA4 26.4 25.1 – 27.7 T 0.999
EA5 138.8 95.7 – 201.2 TB 0.955 *
EA6 161.2 96.6 – 268.8 T 0.963
A5 145.4 99.7 – 212.2 B 0.977 *
M1 373.3 242.6 – 574.2 B 0.947 **
M5 49.4 40.5 – 60.4 T 0.993
M6 79.8 53.0 – 119.9 T 0.981
DU145
Extract Code
IC50 (g/mL)
IC50 Range (95% CI)
Optimum Model
r2 Hormesis present
EA3 27.8 12.1 – 63.7 T 0.846
EA4 28.2 19.8 – 40.0 T 0.969
EA5 150.4 99.3 – 227.9 T 0.990
EA6 205.5 126.7 – 333.3 T 0.968
A5 91.8 56.5 – 149.2 T 0.955 *
M1 492.8 331.8 – 731.9 B 0.944 *
M5 37.2 17.6 – 78.5 T 0.938
M6 75.8 16.0 – 359.6 TB 0.927
MRC5
Extract Code
IC50 (g/mL)
IC50 Range (95% CI)
Optimum Model
r2 Hormesis present
EA3 284.4 220.3 – 367.1 TB 0.973
EA4 342.3 184.8 – 633.8 TB 0.793
EA5 *
EA6
A5 50.5 38.7 – 66.1 T 0.991
M1 828.5 466.4 – 1472 TB 0.994
M5 27.8 3.45 – 224.6 TB 0.715
M6 689.3 8.3 – 57238 TB 0.505 (*at least one concentration > 110% of control; ** > 120% of control)
# Four different models were applied to each extract-cell line combination: the default
4-Parameter (4P) model in which no constraints are set, the Top-fixed model (T) in
which the upper limit is a constant equal to 100%, the Bottom-fixed model (B) in which
only the 0% level is set and the Top and Bottom-fixed model (TB) in which both the
100% and 0% constraints are set.

198 ~ Chapter 5 ~
0.0 0.5 1.0 1.5 2.0 2.5 3.00
25
50
75
100
125
150
MDA-MB-468
Log of Concentration (g/mL)
% C
on
tro
l
0.0 0.5 1.0 1.5 2.0 2.5 3.00
25
50
75
100
125
150
MCF7
Log of Concentration (g/mL)
% C
on
tro
l
0.0 0.5 1.0 1.5 2.0 2.5 3.00
25
50
75
100
125
150
Caco-2
Log of Concentration (g/mL)
% C
on
tro
l
0.0 0.5 1.0 1.5 2.0 2.5 3.00
25
50
75
100
125
150
MM253
Log of Concentration (g/mL)
% C
on
tro
l
0.0 0.5 1.0 1.5 2.0 2.5 3.00
25
50
75
100
125
150
A549
Log of Concentration (g/mL)
% C
on
tro
l
0.0 0.5 1.0 1.5 2.0 2.5 3.00
25
50
75
100
125
150
PC3
Log of Concentration (g/mL)
% C
on
tro
l
0.0 0.5 1.0 1.5 2.0 2.5 3.00
25
50
75
100
125
150
DU145
Log of Concentration (g/mL)
% C
on
tro
l
0.0 0.5 1.0 1.5 2.0 2.5 3.00
25
50
75
100
125
150
MRC5
Log of Concentration (g/mL)
% C
on
tro
l
Figure 5.4 Nonlinear regression of the 8 most active extracts using the optimum
model for each extract-cell line pair.
Cell lines were exposed to eight different extracts, EA3 (■), EA4 (▼), EA5 (●), EA6
(▲), A5 (●), M1 (♦), M5 (●), M6 (▲), over a range of concentrations for 48 h before
being subjected to the MTT assay. Dose values (Fig 5.3) were transformed into log10
values and curves were fitted using GraphPad Prism nonlinear regression dose-response
(variable slope) according to the optimum method for each extract- cell line
combination.

~ Chapter 5 ~ 199
As can be seen from Table 5.3, the six lowest IC50 values obtained for cancer cells, (25 -
30 g/mL) were all for extracts EA3 and EA4 for their activities against A549, PC3 and
DU145 cells. Interestingly, the Top-fixed model was used to generate the data in each of
these cases. However, a low IC50 value was also calculated for M5 against the non-
cancerous cell line, MRC5, this time using the model by which both the top and bottom
constraints were set. Other extracts with IC50 values under 100 g/mL were EA3 and
EA4, A5, M5 and M6.
5.3.3.2 Brine shrimp lethality assay (BSLA)
General toxicity of the extracts was assessed using the BSLA and the results after 2, 24
and 48 h exposure are depicted in Figure 5.5.
As can be seen from Fig. 5.5, after just 2 h exposure no tested extract had any effect on
brine shrimp lethality. Although after 24 h 500 µg/mL of EA6 recorded a slight degree
of toxicity towards brine shrimp, it is clear that M5 was the most toxic of all the extracts
tested. After 24 h, M5 had registered >40% lethality at 1,000 µg/mL and >10% at
500 µg/mL. More extracts caused shrimp to die after 48 h exposure, although M5
remained the most potent with 1,000 µg/mL causing >65%. A5 was the next most lethal
extract with 1,000 µg/mL resulting in >20% shrimp death. EA4, EA5 and M1 also
recorded some lethality, but their levels of lethality were under 10% even at the highest
concentration tested. Only the toxic effects of M5 was demonstrably dose-dependent
with a 50% maximal effective concentration (EC50) value of 627.3 g/mL (95% CI =
475.3 to 828.0 g/mL; r2 = 0.984) after 48 h (Figure 5.6).

200 ~ Chapter 5 ~
2 h
0 200 400 600 800 10000
25
50
75
100
Concentration (g/mL)
% L
eth
ality
24 h
0 200 400 600 800 10000
25
50
75
100
Concentration (g/mL)
% L
eth
ality
48 h
0 200 400 600 800 10000
25
50
75
100
Concentration (g/mL)
% L
eth
ality
Figure 5.5 General toxicity of best 8 extracts over time
Brine shrimp were exposed to eight different extracts, EA3 (■), EA4 (▼), EA5 (●), EA6
(▲), A5 (●), M1 (♦), M5 (●), M6 (▲), over a range of concentrations for 2, 24 and 48 h.
Results are expressed as a % of total shrimp death and are the medians ± SE of at least 4
separate experiments, performed in duplicate wells.

~ Chapter 5 ~ 201
2.00 2.25 2.50 2.75 3.000
25
50
75
100
Log of Concentration (g/mL)
% L
eth
ality
Figure 5.6 Nonlinear regression of general toxicity of best 8 extracts over time
Brine shrimp were exposed to 8 different extracts, EA3 (■), EA4 (▼), EA5 (●), EA6
(▲), A5 (●), M1 (♦), M5 (●), M6 (▲), over a range of concentrations for 48 h. Results
are expressed as a % of total shrimp death and are the medians ± SE of at least 4
separate experiments, performed in duplicate wells. Dose values (Fig 5.5) were
transformed into log10 values and curves were fitted using GraphPad Prism nonlinear
regression dose-response (variable slope) with the bottom parameter fixed at 0% and the
top parameter set at 100% (TB model).
Table 5.4 summarises the effects of some controls on brine shrimp survival. The
positive controls used, DFO (1 mM) and CPT (0.1 mM), caused >30% and 4.0%
lethality, respectively, after 48 h. The negative control, DMSO at 1% final concentration
(v/v), the concentration corresponding to 1,000 µg/mL of extract, induced just 2.0%
toxicity after 24 h with no further deaths up to 48 h. For interest, 10 mg/mL
concentrations of extracts were also tested, along with the corresponding DMSO control
(10% v/v). In all but one case (A5), this high concentration caused 100% lethality after
48 h, with varying degrees of toxicity after 2 and 24 h. However, >60% of this toxicity
was due to the high DMSO content alone.

202 ~ Chapter 5 ~
Table 5.4 General Toxicity of Controls and High Concentrations of
Plant Extracts (Mean % Lethality ± SE)
Sample
Concentration
2 h
24 h
48 h
DFO 1 mM 2.2 ± 2.2 27.0 ± 13.5 31.4 ± 17.9
CPT 0.1 mM 0.0 ± 0.0 2.0 ± 1.8 4.0 ± 3.4
DMSO 1% v/v 0.0 ± 0.0 2.0 ± 2.0 2.0 ± 2.0
DMSO 0.25% v/v 0.0 ± 0.0 0.0 ± 0.0 0.8 ± 0.8
DMSO 0.125% v/v 0.0 ± 0.0 0.0 ± 0.0 0.0 ± 0.0
EA3 10 mg/mL 1.5 ± 1.5 72.0 ± 16.1 100.0 ± 0
EA4 10 mg/mL 10.6 ± 6.7 77.7 ± 14.2 100.0 ± 0
EA5 10 mg/mL 3.7 ± 3.7 84.5 ± 9.8 100.0 ± 0
EA6 10 mg/mL 0.0 ± 0.0 72.5 ± 17.5 100.0 ± 0
A5 10 mg/mL 4.2 ± 4.2 31.0 ± 5.8 88.1 ± 7.8
M1 10 mg/mL 4.6 ± 3.0 97.6 ± 2.4 100.0 ± 0
M5 10 mg/mL 4.2 ± 4.2 97.2 ± 2.8 100.0 ± 0
M6 10 mg/mL 0.0 ± 0.0 86.3 ± 7.1 100.0 ± 0
DMSO 10% v/v 0.0 ± 0.0 11.1 ± 5.3 60.0 ± 20.7
5.4 DISCUSSION
5.4.1 Sample collection and extract preparation
As discussed in Section 1.3.5, natural products, especially secondary metabolites, have
been and continue to be a prime source of new drugs or drug leads (Newman & Cragg,
2007). There exists a high diversity of secondary metabolites with the structures of over
200,000 having already been elucidated (Hartmann et al., 2005). The three main
categories of small molecule secondary metabolites are alkaloids, phenols and
terpenoids (Liu et al., 1998). Several major secondary metabolites are commonly
accompanied by many minor components. In general, a set of related compounds is
found in each plant, frequently a few main metabolites and several minor components,
differing in the position of their substituents. The chemical profile can vary between
plant tissues, within developmental stages and, sometimes, even diurnally (Wink &
Witte, 1984). Moreover, great differences can be observed between members of
different populations and often even between individual plants of a single population
too (Wink, 1999). However, the types of secondary metabolites present in plants of the

~ Chapter 5 ~ 203
same species is generally the same; it is the concentration of these particular compounds
that varies (Dufault et al., 2001; Orians et al., 2003).
In order to limit the effects of individual variation between plants of the same
geographical population, plant parts were collected from a few different plants in the
same area. The choice of which particular plant parts were used for each species was
based on local Aboriginal traditional knowledge (TK) of the medicinal value of each
part. To account for geographical variation, different samples of the same plant species
were collected from different areas. Thus, Samples 3 and 4 were both collections of
Eremophila duttonii, gathered from numerous plants from two distinct areas 12 km
apart. Similarly, Samples 5 and 6 were roots of Acacia tetragonophylla, each collected
from 3 separate trees in areas approximately 40 km distant.
These different locales differed in their soil make-up as well as, quite probably, other
environmental parameters too. It is important to realise that none of these environmental
factors were actually quantified in any way, and, in fact, may not have differed
measurably at all. The point is that the different sampling areas were qualitatively
dissimilar and remote from each other, so variation between the secondary metabolite
compositions of the plants was distinctly possible. However, there was essentially no
purpose in artificially manipulating the soil conditions, altitude, light intensity or other
parameters in order to discern the effects of such differences. This was because one of
the main objectives of this study was to evaluate the medicinal properties of plants
naturally occurring within the local area with a view to validating the traditional
Aboriginal knowledge of the community. In other words, any variation between
samples had to be natural.
204 ~ Chapter 5 ~
While most extracts contained predominantly flavonoids, there were differences
observed in their chemical profiles. Sample 1, from Euphorbia drummondii, was quite
different from every other sample. However, extracts of Sample 2 (Eremophila sturtii)
shared similarities with Samples 3 and 4, but both these were from the related
Eremophila duttonii. As might be expected from samples of the same species, extracts
of Sample 3 differed from Sample 4 only in the concentrations of compounds present.
Similarly, the chemical make-up of extracts of Samples 5 and 6 (both Acacia
tetragonophylla) were very similar, differing only in the amounts of particular
compounds. These differences in the secondary metabolites probably account for the
observed variation in bioactivities. For example, except for the ethyl acetate fraction of
Sample 6 (EA6) against Caco-2 cells (Fig. 5.2), every extract of Sample 5 was more
bioactive than its Sample 6 equivalent. This was especially noticeable in the BSLA
where M5 killed many more brine shrimp than M6, or, indeed, any other extract tested
(Fig. 5.10). This may have been something to do with the relatively higher levels of an
unidentified flavonoid it contained (see Appendix G). The bioactive effects of all
extracts of Samples 3 and 4 were very similar, paralleling their similar chemical
profiles.
5.4.2 Chemical analysis of extracts
5.4.2.1 HPLC-UV
The ethyl acetate fractions of Samples 3 and 4 (EA3 and EA4) were the most potent in
terms of their inhibitory effects on cancer cell growth (Fig. 5.2). This fraction generally
contains flavonoids, many of which, such as quercetin and luteolin are known
antitumour agents (Middleton et al., 2000; Kuntz et al., 1999; Lin et al., 2008; Xavier et
al., 2009).

~ Chapter 5 ~ 205
The methanol fractions of Samples 5 and 6 also displayed marked antiproliferative
properties in some cell lines. As methanol is a more polar solvent than ethyl acetate, a
larger range of compounds is extracted (Houghton & Raman, 1998; Fang, S.-F.,
personal communication, 31st May 2010). Hence, more polyphenolics would probably
present in this fraction and some of these, such as caffeic acid and resveratrol, also have
reported anticancer properties (Hudson et al., 2000; Li et al., 2002; Cecchinato et al.,
2007). Additionally, the methanol fraction may contain more flavonoids as this class of
compounds has a wide polarity range (Yuan, 2005).
Apart from Sample 5 (A5), the aqueous extracts of the samples tested were the least
inhibitory in terms of their effects on cancer cell proliferation. This fraction generally
contained lower concentrations of flavonoids and more tannins compared to the
corresponding ethyl acetate and methanol fractions. Many tannins can have antitumour
activity (Fong et al., 1972; Jain et al., 2009), but the constituent of A5 responsible for
its cytotoxicity was not identified as part of the present study as the effect seemed to be
non-specific and therefore not worth pursuing. This could have been due to tannins,
which were prevalent in this fraction. Tannins can interact with biological assays and
they are also considered to be non-specific inhibitors (Ayehunie et al., 1998; Marcy et
al., 2006). Additionally, since the almost ubiquitous presence of tannins in plant
extracts makes the isolation and characterization of other compounds from these sources
very difficult, many researchers choose to remove them prior to screening (Collins et
al., 1998). However, there are arguments that this practice may mean bioactive
compounds with specificity of action may be missed (Zhu et al., 1997). As this study
was interested in validating ethnomedical data, it was important to test the whole
extracts.

206 ~ Chapter 5 ~
Future directions will involve the removal of polyphenolic compounds to assess if the
extracts are still bioactive. This will be the first step in elucidating whether the observed
cytotoxicity is mainly due to known compound/s or a NCE.
5.4.2.2 GC-MS
The chemical profiles of volatiles, as assessed by GC-MS, for Samples 3 and 4 were
very similar. This is not unexpected given that these samples were prepared from the
same species of plant, Eremophila duttonii. However, it does suggest that the variation
that existed between the two different locales from which the samples were sourced was
not enough to significantly influence the secondary metabolite profile of this species.
Unsurprisingly, distinct differences were observed between the different species, E.
drummondii (Sample 1), E. sturtii (Sample 2) and E. duttonii (Samples 3 and 4).
5.4.3 Extract bioactivity
5.4.3.1 MTT assay
Figure 5.2 depicts how different cell lines responded to the extracts to varying degrees.
Although some researchers continue to report significant antiproliferative effects of
plant extracts at concentrations above 200 µg/mL (Lee et al., 2008), 10 mg/mL (Rao et
al., 2009) and even over 100 mg/mL (De Martino et al., 2006), these values are
physiologically quite meaningless and the implementation of a standard extract
concentration cut-off of 50 µg/mL has been recommended (Gertsch, 2009). Based on
this, it is clear that the ethyl acetate extracts of Samples 3 and 4 (EA3 and EA4) were
potent against some cell lines (e.g. MDA-MB-468 and PC3), but less so against others
(e.g. Caco-2, A549 and DU145) (Fig. 5.2).
However, according to the IC50 values (Table 5.3) calculated from the dose-response
curves (Fig. 5.3), it is the A549, PC3 and DU145 cell lines that are most susceptible to
these two extracts. Possible reasons for this discrepancy are addressed below.

~ Chapter 5 ~ 207
Nevertheless, regardless of which method was used to assess potency, it is clear that
there were definite differences between the cell lines. These differences indicate
specificity, a very important factor in drug discovery. In fact, according to the NCI,
specificity is one of the defining factors in deciding if an agent showing antitumour
potential in the initial screen should progress to secondary testing or not (Grever et al.,
1992; Boyd & Paull, 1995).
Despite using several models to calculate IC50 values, it was not possible to determine
these values for all extract-cell line combinations. Moreover, when IC50 values were
determined, they were not always reliable measures of an extract‘s effectiveness. For
example, from Figure 5.3 it is clear that EA4 had limited effect on reducing the
proliferation of A549 cells, and yet, it recorded the lowest IC50 value of any extract in
any cell line tested (Table 5.3). While a 95% confidence interval was inexplicably
incalculable by the GraphPad Prism programme, the correlation coefficient of the curve
fit was not low (r2 = 0.890) and the results for EA3 (from the same plant) were very
similar. As explained in Section 4.4.3, sometimes the reason for imperfect curve fits
was because a level of 50% inhibition was never reached over the concentration range
tested. This was true for the above situation where even the highest concentration of
EA4 tested, 500 g/mL, only inhibited proliferation of A549 cells to 64.8% of the
control level. Such flat dose-response curves would suggest that the classic sigmoidal
dose-response model was not appropriate in these cases. However, it was thought that
the same model should be applied to every extract- cell line pair so as direct
comparisons could be made between them. It was not possible to perform repeat
experiments using a higher range of concentrations due to the limited solubility of the
extracts and the toxicity of DMSO at high concentrations. Therefore, the IC50 values
generated for flat dose-response curves were interpreted with some scepticism.

208 ~ Chapter 5 ~
Similarly, steeper dose-response curves (than the classic sigmoidal dose-response model
would predict) suggested that this model was not appropriate in these cases either and
so their IC50 values were also accepted with some diffidence.
However, another complicating factor in calculating IC50 values in this study was the
existence of the intriguing phenomenon of hormesis. A biphasic dose-response in which
opposite effects are displayed at high and low doses, researchers have typically reported
low-dose stimulation and high-dose inhibition (Calabrese, 2005a). In fact, according to
Anderson (2005), Stedman’s Medical Dictionary defines hormesis as ―the stimulating
effect of subinhibitory concentrations of any toxic substance‖. In other words, if high
doses of a compound have an inhibitory effect on growth, for example, low doses of
that compound would cause increased growth. Hormesis has been described for many
dose-response relationships, including antineoplastic agents tested against cell lines in
the NCI screen (Calabrese, 2005a; Calabrese et al., 2006b). The prevalence of hormesis
will be discussed further in the General Discussion (Chapter 8) and Appendix N, along
with its controversial history in gaining acceptance as a concept, further characterisation
of the model and the implications that hormesis has in medicine.
In toxicology many experiments are performed to determine the dose-response
relationship between a certain compound and a living entity (e.g. group of cells or
whole organism). Data from these experiments are frequently analysed by a logistic
model and summarised in the form of the IC50. However, when hormesis is present, it is
not appropriate to use the standard log-logistic model to fit dose-response curves and
calculate IC50 values (Schabenberger et al., 1999; Vanewijk & Hoekstra, 1993).
Common practice is to drop some of the data or to use the log-logistic model anyway.
Formulae have been developed to calculate IC50 values for biphasic relationships, such
~ Chapter 5 ~ 209
as when hormesis is present (Brain & Cousens, 1989; Vanewijk & Hoekstra, 1993;
Schabenberger et al., 1999; Beckon et al., 2008). However, without access to computer
software based on these models, the adoption of these formulae was beyond the
capabilities of this PhD candidate. Nevertheless, it is acknowledged that it can be
dangerous to simply ignore the presence of hormetic effects which cannot be adequately
captured by a log-logistic function. Fitting a log-logistic model when hormesis is
present can lead to serious bias and erroneous inferences (Schabenberger et al., 1999).
Therefore, the IC50 values obtained in this study when hormesis was present (Table 5.3)
were also taken with some reservation.
Hormesis is one possible explanation for the wide range of IC50 values calculated on
different days. However, Alley et al. (1988) also reported large variations from the
mean IC50 value for each cell line when the MTT assay was used to measure sensitivity
to a ―standard‖ agent, doxorubicin. One third of the cell lines tested exhibited greater
than a 5-fold range in IC50 values, and these large deviations occurred randomly over
time. These authors could offer no explanation for most of the variations, instead
claiming that the fact that they occurred at all ―prompted the development and inclusion
of several biological and pharmacological quality assurance criteria in the performance
of subsequent screening assays‖, although they did not elaborate on what those may
have been (Alley et al., 1988, p596). Thus, in the current study, every effort was made
to ensure that controllable experimental conditions, such as incubation times and
preparation of all reagents and extracts (which were stored optimally) were consistent
and internal controls were included so as to facilitate reproducibility and ensure quality
control as much as possible. Therefore, any variability between experiments was taken
to be due to differences in the sampling of extracts, which were prepared fresh on the
day of use.

210 ~ Chapter 5 ~
While acceptable IC50 values were considered when choosing extracts for further study,
due to hormetic effects and other concerns discussed above, more credence was placed
on a certain level of growth inhibition obtained at a given concentration. The
concentration chosen was 250 g/mL and a mean score of less than 50% of the control
was chosen as a cut-off threshold. Thus, any extracts exhibiting less than 50% inhibition
of proliferation of any cell line at 250 g/mL (Fig. 5.3) were eliminated from the pool
of promising extracts. This method of reporting bioactivity is not without precedent. In
fact, it is quite common in preliminary drug discovery studies that effects are reported
for discrete concentrations only, especially when the test agent is not a pure compound
and is subject to the interactions and complications inherent of mixtures (discussed in
Section 8.2.6.2). For example, Argarwal et al. (2000), Opoku et al. (2000), Russo et al.
(2005) and Paschke et al. (2009) all used the MTT assay to assess the antiproliferative
effects of different concentrations of plant extracts against various cancer cells and
reported the results in terms of their % of control values at specified concentrations,
rather than calculated IC50 value. Additionally, Hunt and Rai (2005), applied a score
test of a random effects hormetic-threshold dose-response model. In their study, the
investigators were not primarily interested in completely analysing the data, but instead
sought to develop an inference procedure for a threshold effect.
5.4.3.2 Brine shrimp lethality assay (BSLA)
The BSLA is commonly employed as an initial screen for broad spectrum bioactivity. It
has been used to detect the presence of bioactive compounds in crude extracts and has
been shown to be predictive of cytotoxicity in many studies. For example, a positive
correlation has been shown to exist between BSLA lethality and cytotoxicity toward the
9KB cell line (Meyer et al., 1982 as cited by Turker & Camper, 2002).

~ Chapter 5 ~ 211
However, in this study, a high level of bioactivity in the BSLA meant that promising
plant extracts were eliminated from further evaluation, despite their strong
antiproliferative effects in the MTT assay. The logic behind this decision was that as
selective bioactivity against cancer cells was being sought, any extracts that killed brine
shrimp were doing so by some nonspecific mechanism, possibly via arresting protein
synthesis as is the case with some lectins (Lord, 1987) or perhaps by damaging the
membrane integrity of all cells. In such a case, they would have little potential as new
antineoplastic agents.
Unfortunately, the BSLA was rather inaccurate, as seen in the high standard error values
obtained. This high degree of error was due to the necessarily small numbers of nauplii
in each well, a byproduct of the labour intensiveness of the assay. While it must be
remembered that the SEs were of median values, which are 25% times higher than those
of means, these high SE values obtained highlighted the inherent shortcomings of the
assay and the absolute necessity of the repeat experiments performed. Nonetheless,
useful information was garnered from these experiments, including the fact that the
methanol fraction of Sample 5 (M5) caused more nauplii to die than any other extract
tested. This was interpreted to mean that it displayed a high level of nonspecific
cytotoxicity. In corroboration of this was the fact that, while M5 showed bioactivity
against most cancer cell lines in the antiproliferation studies (Fig. 5.2), it also inhibited
the proliferation of the non-cancerous cell line, MRC5 with an IC50 value of
27.8 g/mL. These inferences marked M5 inappropriate as a drug candidate, resulting in
its exclusion from further investigations.
On the other hand, the ethyl acetate extracts of Samples 3 and 4 (EA3 and EA4)
displayed relatively low levels of cytotoxicity towards brine shrimp. This, along with

212 ~ Chapter 5 ~
their comparatively high IC50 values against non-cancerous MRC5 cells (284.4 and
343.3 µg/mL, respectively), suggests that their potent bioactivity against some cancer
cells in the antiproliferation studies was due to a more specific mechanism than simply
a direct cell poison. As the objective of chemotherapeutics is to eliminate cancer cells
while causing minimal damage to normal cells, this finding was exactly the type of
scenario sought, meaning that further investigation of EA3 and EA4 as potential
anticancer agents was warranted. Since EA3 and EA4 were both ethyl acetate extracts
from the same plant species and had similar chemical profiles, EA3 was chosen for
further study on the simple basis that there was more of it available.
5.5 SUMMARY
In summary, more plant samples of those with the most bioactive methanolic extracts
from the initial screen were collected and extracted to give aqueous, methanol or ethyl
acetate fractions. These were subjected to various chemical analyses and assessed for
their specificity and selectivity against cancer cells. From these data, the extract with the
greatest potential as an anticancer agent, the ethyl acetate extract of Eremophila duttonii
(EA3), was chosen for further study, the basis of which forms Chapter 6.

~ Chapter 6 ~ 213
Chapter 6: Further Evaluation of Plant Extract, EA3
6.1 INTRODUCTION
Previous chapters describe the bioactivity screening of extracts of various native plants
identified by Aboriginal people as having medicinal qualities. Several of these extracts
were shown to have varying inhibitory effects on different cancer cell lines. However,
due to time and budget constraints, only the extract with the most promising anticancer
potential was chosen for further evaluation. The ethyl acetate fraction of Sample 3
(EA3) was selected, based on data suggesting it induced cytotoxicity (cell death) or
cytostaticity (cell cycle arrest) in several, but not all, cancer cell lines while having
minimal effect on normal cells. The focus of this chapter is to describe the further
characterization of this extract‘s chemical composition and studies undertaken to
elucidate its mechanism of action.
6.1.1 Chemical composition
Since all metabolomic detection techniques have unavoidable intrinsic bias towards
certain metabolite groups, no single technique is adequate for determining the complete
chemical make-up of an extract. Hence, multiparallel technologies are necessary to
obtain the desired broad metabolic picture (Hall, 2006). HPLC coupled to a UV
photodiode array detect (HPLC-UV) has been widely used for the primary chemical
analysis of crude plant extracts (Moco et al., 2006; De Vos et al., 2007). The UV
spectra of natural products obtained by HPLC-UV gives useful information on the type
of constituents present in an extract. Liquid chromatography coupled to mass
spectrometry (LC-MS) is a newer and more expensive technique that combines the
physical separation capabilities of liquid chromatography with the mass analysis
capabilities of mass spectrometry. Mass spectrometry is one of the most sensitive
methods of molecular analysis and provides information on the molecular weight as
well as on the structure of the individual compounds. LC-MS is the preferred technique

214 ~ Chapter 6 ~
for the separation and detection of the large and often unique group
of semipolar
secondary metabolites in plants. LC-MS enables the detection of large numbers of
parent ions present in a single extract and can yield valuable information on the
chemical composition and hence the putative identities of many metabolites at once
(Moco et al., 2006; De Vos et al., 2007). It is very useful for answering the questions
―what is it?‖ and ―how much is there?‖ (Lee & Kerns, 1999). Therefore, LC-MS was
used to identify and establish the relative proportions of the main non-volatiles present
in EA3. Subsequent HPLC-UV analysis of EA3 compared to known standards was
performed to quantify the absolute amounts of some of the main constituents.
6.1.2 Identification of active constituents
One of the specific objectives of this study was to try to identify plant compounds that
may be of use in the treatment of cancer. Hence, it was important to establish if the
cytotoxic effects of EA3 on cancer cells were due to a novel compound or a known one.
Therefore, three of the major components of EA3, as determined by LC-MS, were
tested for their individual cytotoxic effects and compared with those of the whole
extract.
6.1.3 Exposure and recovery
As the experimental work of this project was drawing to a close, access to a new system
capable of assessing the growth of cell cultures became available. This new Cellscreen
(CS) system (see Sections 2.2.2.10 and 2.6.4) measures the percentage confluence of
cells grown in 96-well microtitre plates. As discussed in Chapter 3, the precision of the
CS system is comparable to that of the MTT assay (Viebahn et al., 2006). However, the
CS holds the major advantage of being non-invasive, meaning the proliferation of the
same population of cells can be monitored over time.

~ Chapter 6 ~ 215
Therefore, the CS was used to study the kinetics of exposure of cancer cells to EA3. In
this way, it was hoped that clues could be obtained about whether EA3-induced
inhibition of cell proliferation (as measured by the MTT assay) was due to cytotoxic or
cytostatic effects.
As discussed in Chapter 4, apoptosis is generally a much quicker process than necrosis,
occurring within just 1-3 h (Kerr et al., 1972; Gavrieli et al., 1992; Majno & Joris,
1995), so a relatively rapid cytotoxic response would be suggestive of the involvement
of an apoptotic pathway. Additionally, by monitoring cell growth after the extract was
removed from the culture, it was possible to ascertain if any EA3-induced cytostatic
effects were reversible, or not.
6.1.4 Intracellular Ca2+
measurement
Another method employed to help distinguish between necrosis and apoptosis was the
measurement of intracellular Ca2+
levels. A loss in cell membrane integrity can be
demonstrated by measuring a rapid and prolonged influx of extracellular Ca2+
into the
cytosol (Orrenius et al., 1989; Endo, 2006). In contrast, as Ca2+
is a key second
messenger, any rapid but transient change in intracellular Ca2+
concentration ([Ca2+
]i) is
indicative of a physiological response to a given stimulus (Wasilenko et al., 1997;
Endo, 2006). To assist the reader if necessary, the basic processes involved in Ca2+
signalling are provided in Appendix J.
Transient increases in [Ca2+
]i have been implicated in the regulation of a host of cellular
processes in a wide variety of cell types (Campbell, 1990). Such Ca2+
signalling is
essential for the growth, death, differentiation and function of cells (Dolmetsch et al.,
1997). Cell functions regulated by Ca2+
are too numerous to name individually, but
include such basic processes as cell motility, contraction, secretion and division
216 ~ Chapter 6 ~
(Clapham, 2007). Additional biochemical roles of Ca2+
include regulating enzyme
activity (Nalamachu et al., 1994), controlling gene expression (Giles & Hilmar, 1999)
and, of particular significance here, initiating apoptosis (Tombal et al., 1999; Sylvie et
al., 2000; Baumgartner et al., 2009). Therefore, it was of considerable interest to
investigate the dynamics of any changes to [Ca2+
]i in cancer cells exposed to EA3 and to
compare any such changes to that of a known endogenous activator of Ca2+
signalling,
such as histamine (Lee et al., 2001; Akdis & Blaser, 2003; Montero et al., 2003). PC3
cells were selected for this purpose as they express histamine receptors which are
involved in Ca2+
signalling pathways (Lee et al., 2001). They were chosen above other
cancer cell lines studied as EA3 potently inhibited their proliferation (see Fig. 5.3) and
because they grew well on glass. It was assumed that if necrosis was responsible for the
observed cytotoxicity of EA3 in PC3 cells, any breach in membrane integrity would be
revealed by an increase in [Ca2+
]i that increased suddenly and remained elevated. On the
other hand, a Ca2+
transient would suggest some Ca2+
signalling taking place, which
may be a normal signalling process or activation of cell death pathways. Increased
intracellular Ca2+
is known to be an initial step in many pathways leading to apoptosis
(Tombal et al., 1999; Sylvie et al., 2000; Olofsson et al., 2008; Baumgartner et al.,
2009).
6.2 METHODOLOGY
6.2.1 Chemical composition
LC-MS for identification of non-volatiles was carried out on EA3 by a collaborator, Dr
Shao Fang Wang (ChemCentre, WA). Briefly, LC-MS spectra were recorded on an
Agilent Triple Quad 6400 LC-MS system. The column used in LC-MS was an Agilent
Zorbax 80 Å, C18, 4.6 x 150 mm, 5 µm. An Electronic Spray Ionisation in negative
ionisation mode was used. The typical source conditions were a gas temperature of
350˚C, gas flow of 8 L/min, and the nebulizer set at 55 psi. The scan time was 500 s and

~ Chapter 6 ~ 217
fragment voltage was 135 V. The software used to run LC-MS was Agilent Masshunter
Workstation and software used for data analysis was Agilent Masshunter Qualitative
Analysis (Santa Clara, CA, USA).
Due to the relative expense of LC-MS as well as the limited availability of the
equipment, the absolute amounts of each of the main constituents present in EA3 were
determined by HPLC-UV analysis. The HPLC-UV chromatograms obtained for EA3
after UV absorption at 254 nm and 350 nm were compared to those of a standard
mixture containing known quantities of rutin, luteolin and apigenin. The equipment and
conditions used have been described previously (Section 5.2.2.1).
6.2.2 Identification of active constituents
Three of the main components of EA3 identified by LC-MS, rutin, luteolin and
quercetin, were tested for their antiproliferative effects on cancer cells compared to
those of the whole extract. Briefly, these pure compounds were dissolved in DMSO at
10 mg/mL, diluted 1/20 in DMEM without phenol red and filter-sterilised. Further
dilutions were made such that when 10 µL was added to 100 µL of cells in microtitre
plates, the final concentrations of the compounds ranged from 200 µg/mL down to
2.5 µg/mL. EA3 was dissolved at 100 mg/mL, filtered and diluted as above such that
cells were exposed to final concentrations of between 500 µg/mL and 25 µg/mL. The
MTT assay in its final modified form (Section 2.6.1) was again employed to assess the
cytotoxicity of these pure compounds compared to EA3 against a range of human
cancer cell lines and one non-cancerous cell line.
6.2.3 Exposure and recovery
The CS system (see Sections 2.2.2.10 and 2.6.4) was used to evaluate the exposure
kinetics of EA3 on different cancer cell lines. Briefly, cells in their appropriate culture
medium were seeded at 10,000 cells per well and allowed to adhere and grow O/N at

218 ~ Chapter 6 ~
37˚C. Various dilutions of EA3 (initially 100 mg/mL in DMSO) were added in 10 L
aliquots to quadruplicate wells and the effects on cells tracked over time. Final
concentrations of EA3 ranged from 25 to 500 g/mL and cell growth was monitored
over 48 h of exposure.
It was assumed that, in the presence of the extract, no change in cell confluency would
indicate an overall cytostatic effect, whereby all cells had left the cell cycle or cell
proliferation was in equilibrium with cell death. On the other hand, reduced confluency
over time would indicate cells had lifted off the surface of the well, suggesting they had
died or were at least very unhealthy. Thus, a flat line on the growth curve was taken to
mean cytostaticity and any drop compared to initial levels indicated cytotoxicity.
In another experiment designed to establish if the EA3-induced inhibitory effects were
reversible or not, after approximately 48 h exposure to various concentrations of EA3,
cells were washed twice with warm balanced salts solution (BSS) and the culture
medium replaced with cell line-appropriate fresh medium. The CS system was used to
track changes in confluency levels for two days during exposure to EA3 and for a
further three days after it was removed. In the absence of extract, increased confluency
over time would indicate surviving cells were capable of proliferation, suggesting any
EA3-induced cytostatic effects were reversible.
6.2.4 Intracellular Ca2+
measurement
In these experiments, PC3, MDA-MB-468 or A549 cells (2-3 x 10⁶ cells in 1 mL) were
seeded onto round (25 mm in diameter) collagen-coated cover slips in 35 mm TC petri
dishes. Cells were allowed to adhere and grow for 24 to 48 h under standard culture
conditions. Just prior to use, medium was removed and the cells washed three times
with Physiological Rodent Saline (PRS, see section 2.2.3.16) before being passively

~ Chapter 6 ~ 219
loaded with 1 mL of the fluorescent Ca2+
- sensitive dye, Fura-2, bound to an
acetoxymethyl ester group (Fura-2-AM) to make it cell-permeant (Huang & Jan, 2001;
Jackisch et al., 2000; Bruschi et al., 1988). Fura-2-AM is readily converted into the
calcium-sensitive form within the cell through the activity of endogenous esterases so
the non-ionic detergent and dispersing agent, Pluronic F-127, was employed to prevent
Fura-2-AM precipitation and promote dye dispersion (Poenie et al., 1986; Drummond et
al., 1987). Hence, the loading solution consisted of 3 M Fura-2-AM and 0.06%
Pluronic F-127 in PRS (=1.8 mM Ca2+
). Cells were incubated with this dye mixture for
25 min at RT in the dark.
Following Fura-2 loading, cells were rinsed three times with PRS before being left to
bathe in PRS for a further 30 min. These steps removed the remaining extracellular
Fura-2-AM and allowed time for the complete de-esterification of the Fura-2-AM
within the cells into the cell-impermeant Ca2+
-sensitive Fura-2 free acid form (Moore et
al., 1990). The cover slip was then mounted in a chamber and placed on the stage of the
microscope attached to the Ca2+
measurement apparatus (Section 2.2.2.11).
Under the 40X objective, a group of approximately 5-15 viable cells were selected and
these were illuminated at alternating excitation wavelengths of 340 and 380 nm
(bandwidth 10 mm). Fluorescence emission at 510 nm was captured and approximately
three measurements were recorded every second. Current output from the
photomultiplier tube of the spectrophotometer was converted to voltage and amplified
for display using the supplied Optoscan control system. The spectrophotometer was
connected to a personal computer for subsequent data analyses which were performed
with Cairn software (see Section 2.6.4).

220 ~ Chapter 6 ~
Raw fluorescence measurements depend on variable or poorly quantified factors such as
the efficiency of the instrument, the effective thickness of the cells in the optical beam,
and the number of cells and the concentration of dye inside them (Grynkiewicz et al.,
1985; Moore et al., 1990). However, the ratio of the fluorescence intensities at 340 and
380 nm (F340/F380) takes into account such variations between experiments and is a very
good, well-established indicator of [Ca2+
]i in groups of cells, and even single cells
(Grynkiewicz et al., 1985; Wasilenko et al., 1997; Devipriya et al., 2006). Hence,
[Ca2+
]i was taken as the F340/F380 ratio (sometimes referred to simply as the ―ratio‖).
As [Ca2+
]i increases as cells become sick or apoptotic (Orrenius et al., 1989), cells were
only considered healthy if resting ratios were below the arbitrarily determined value of
0.6. After a baseline ratio was established for at least 1 min, individual test agents were
added via a syringe system (50-100 L aliquots) and the trace recorded for 5 to 10 min.
EA3 was added at a final concentration of 500 g/mL (w/v), while the negative control
was simply the vehicle, DMSO at 0.5% final concentration (v/v). The positive control
employed was the endogenous agonist histamine, which was added at a final
concentration of 100 M.
At the end of each experiment, the maximal ratio for that particular population of Fura-
2-loaded cells was measured by saturating Fura-2 with Ca2+
. This was achieved by
adding 10 M ionomycin, a calcium ionophore that increases the permeability of the
plasma membrane to Ca2+
, consequently equalising the concentration of extracellular
Ca2+
([Ca2+
]o) and [Ca2+
]i (Liu & Hermann, 1978; Himmel et al., 1990). F340/F380 ratios
were translated into [Ca2+
]i values using the Grynkiewicz equation (Grynkiewicz et al.,
1985):

~ Chapter 6 ~ 221
[Ca2+
]i = Kd (R – Rmin)
Rmax – R
where
Kd is the dissociation constant for Ca2+
R is the measured F340/F380 ratio at a particular point
Rmin is the F340/F380 ratio in the absence of Ca2+
Rmax is the F340/F380 ratio in the presence of 1 mM Ca2+
is theratio at 380 nm excitation for zero (nominally) Ca2+
and saturating Ca2+
.
Constants previously established in this laboratory for another cell line (C2C12) were a
Kd of 224nM, a value of 7.63 and Rmin and Rmax values of 0.335 and 2.75,
respectively.
6.3 RESULTS
6.3.1 Chemical composition
According to LC-MS analysis, the major compounds identified in EA3, in order of
proportion, were rutin, luteolin, quercetin, apigenin and naringenin (Figure 6.1). A few
other prominent peaks could not be identified by Dr Wang without a standard, although
their molecular weights were known (given in red).
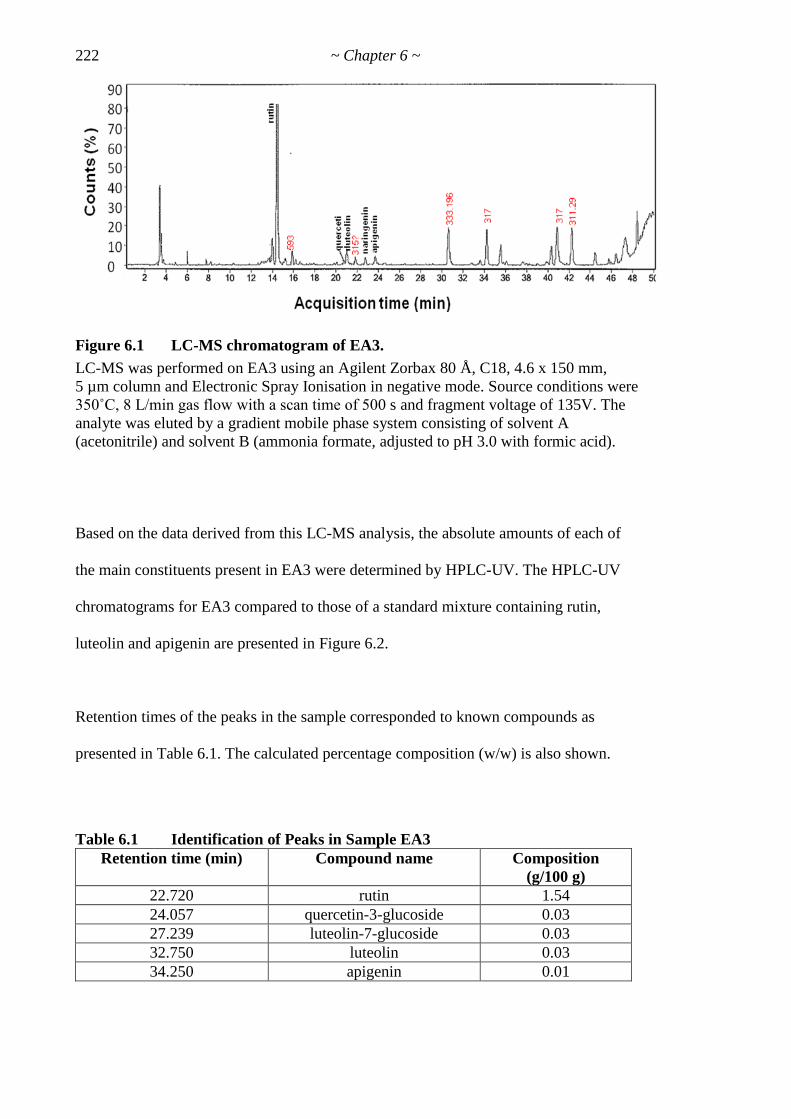
222 ~ Chapter 6 ~
Figure 6.1 LC-MS chromatogram of EA3.
LC-MS was performed on EA3 using an Agilent Zorbax 80 Å, C18, 4.6 x 150 mm,
5 µm column and Electronic Spray Ionisation in negative mode. Source conditions were
350˚C, 8 L/min gas flow with a scan time of 500 s and fragment voltage of 135V. The
analyte was eluted by a gradient mobile phase system consisting of solvent A
(acetonitrile) and solvent B (ammonia formate, adjusted to pH 3.0 with formic acid).
Based on the data derived from this LC-MS analysis, the absolute amounts of each of
the main constituents present in EA3 were determined by HPLC-UV. The HPLC-UV
chromatograms for EA3 compared to those of a standard mixture containing rutin,
luteolin and apigenin are presented in Figure 6.2.
Retention times of the peaks in the sample corresponded to known compounds as
presented in Table 6.1. The calculated percentage composition (w/w) is also shown.
Table 6.1 Identification of Peaks in Sample EA3
Retention time (min) Compound name Composition
(g/100 g)
22.720 rutin 1.54
24.057 quercetin-3-glucoside 0.03
27.239 luteolin-7-glucoside 0.03
32.750 luteolin 0.03
34.250 apigenin 0.01

~ Chapter 6 ~ 223
Figure 6.2 HPLC-UV chromatograms
HPLC chromatograms for EA3 compared to that of a standard mixture (containing
rutin, luteolin and apigenin) after UV absorption at 254 (A) or 350 nm (B). HPLC-UV
was performed on an Alliance Waters 2695 HPLC separation module pump with a
Waters 2996 Photodiode Array Detector. Chromatography used an Apollo C18, 5 µm
250 x 4.6 mm column (30˚C). Solvent A was acetonitrile and solvent B was 0.6%
H3PO4 in water.
A 254nm
B 350 nm

224 ~ Chapter 6 ~
6.3.2 Identification of active constituents
In order to determine if any of the main identifiable components of EA3 were likely
responsible for its antiproliferative effects, human cancer cells were exposed to three
purified compounds, rutin, luteolin and quercetin, for 48 h and their effects evaluated
using the MTT assay and compared to those of the whole extract, EA3. The resultant
dose-response curves are shown in Figures 6.3 to 6.6.
It is obvious from Figure 6.3 that, with the possible exception of MDA-MB-468 cells,
rutin had no inhibitory effect on the proliferation of any cell line tested. If anything, it
elicited a small stimulatory effect at lower doses (hormesis) against MCF7, Caco-2 and
MRC5 cells. On the other hand, luteolin (Fig. 6.4) and quercetin (Fig. 6.5) both
inhibited the proliferation of every cell line tested in a dose-dependent manner. For both
these pure compounds, the greatest effects were seen against PC3 cells. Hormetic
effects were observed for luteolin against MCF7 and Caco-2 cells, while quercetin
caused hormesis against Caco-2, A549 and MRC5 cells.
However, given that the percentage of luteolin in the whole extract (EA3) is only 0.06%
(Table 6.1), an EA3 concentration of 100 g/mL corresponds to only 0.06 g/mL
luteolin. This value is over 40-fold less than 2.5 g/mL, the lowest concentration of
luteolin tested in dose-response studies and which caused no inhibition of proliferation
of any cell line (Fig. 6.4). Quercetin was present in EA3 at half this level again,
equating to 80-fold less than the minimum concentration tested (Fig. 6.5).
Looking at these data another way, the highest level of pure luteolin tested, 100 g/mL,
corresponded to an EA3 concentration of 167 mg/mL, 334-fold higher than the highest
concentration tested, 500 g/mL (Fig.6.6). Similarly, 100 g/mL quercetin

~ Chapter 6 ~ 225
0 25 50 75 1000
25
50
75
100
125 MDA-MB-468
Concentration (g/mL)
% C
on
tro
l
0 25 50 75 1000
25
50
75
100
125 MCF7
Concentration (g/mL)
% C
on
tro
l
0 25 50 75 1000
25
50
75
100
125
150 Caco-2
Concentration (g/mL)
% C
on
tro
l
0 25 50 75 1000
25
50
75
100
125 MM253
Concentration (g/mL)%
Co
ntr
ol
0 25 50 75 1000
25
50
75
100
125 A549
Concentration (g/mL)
% C
on
tro
l
0 25 50 75 1000
25
50
75
100
125 PC3
Concentration (g/mL)
% C
on
tro
l
0 25 50 75 1000
25
50
75
100
125 DU145
Concentration (g/mL)
% C
on
tro
l
0 25 50 75 1000
25
50
75
100
125
150 MRC5
Concentration (g/mL)
% C
on
tro
l
Figure 6.3 Effects of rutin on cell proliferation
Cells were exposed to various concentrations of rutin for 48 h before being subjected to
the MTT assay. Results are means ± SE of at least 4 separate experiments, except for
MRC5, which are the values obtained from a single experiment only.
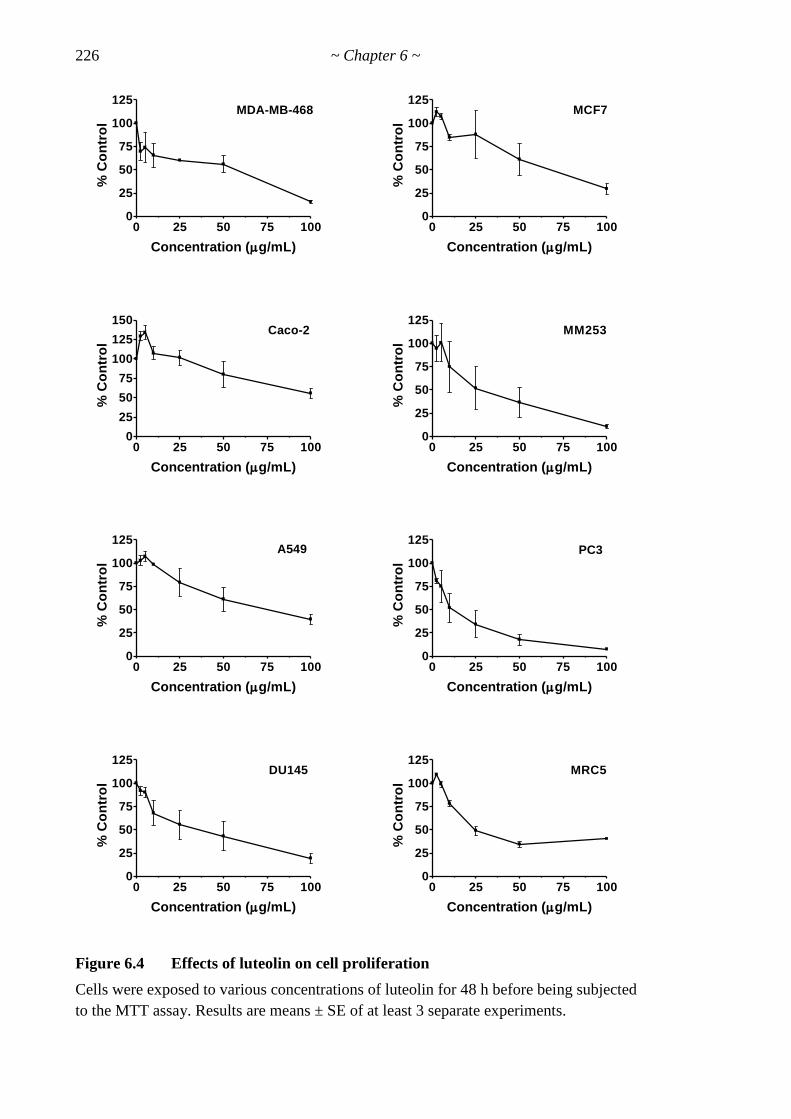
226 ~ Chapter 6 ~
0 25 50 75 1000
25
50
75
100
125 MDA-MB-468
Concentration (g/mL)
% C
on
tro
l
0 25 50 75 1000
25
50
75
100
125 MCF7
Concentration (g/mL)
% C
on
tro
l
0 25 50 75 1000
25
50
75
100
125
150 Caco-2
Concentration (g/mL)
% C
on
tro
l
0 25 50 75 1000
25
50
75
100
125 MM253
Concentration (g/mL)
% C
on
tro
l
0 25 50 75 1000
25
50
75
100
125 A549
Concentration (g/mL)
% C
on
tro
l
0 25 50 75 1000
25
50
75
100
125 PC3
Concentration (g/mL)
% C
on
tro
l
0 25 50 75 1000
25
50
75
100
125 DU145
Concentration (g/mL)
% C
on
tro
l
0 25 50 75 1000
25
50
75
100
125 MRC5
Concentration (g/mL)
% C
on
tro
l
Figure 6.4 Effects of luteolin on cell proliferation
Cells were exposed to various concentrations of luteolin for 48 h before being subjected
to the MTT assay. Results are means ± SE of at least 3 separate experiments.
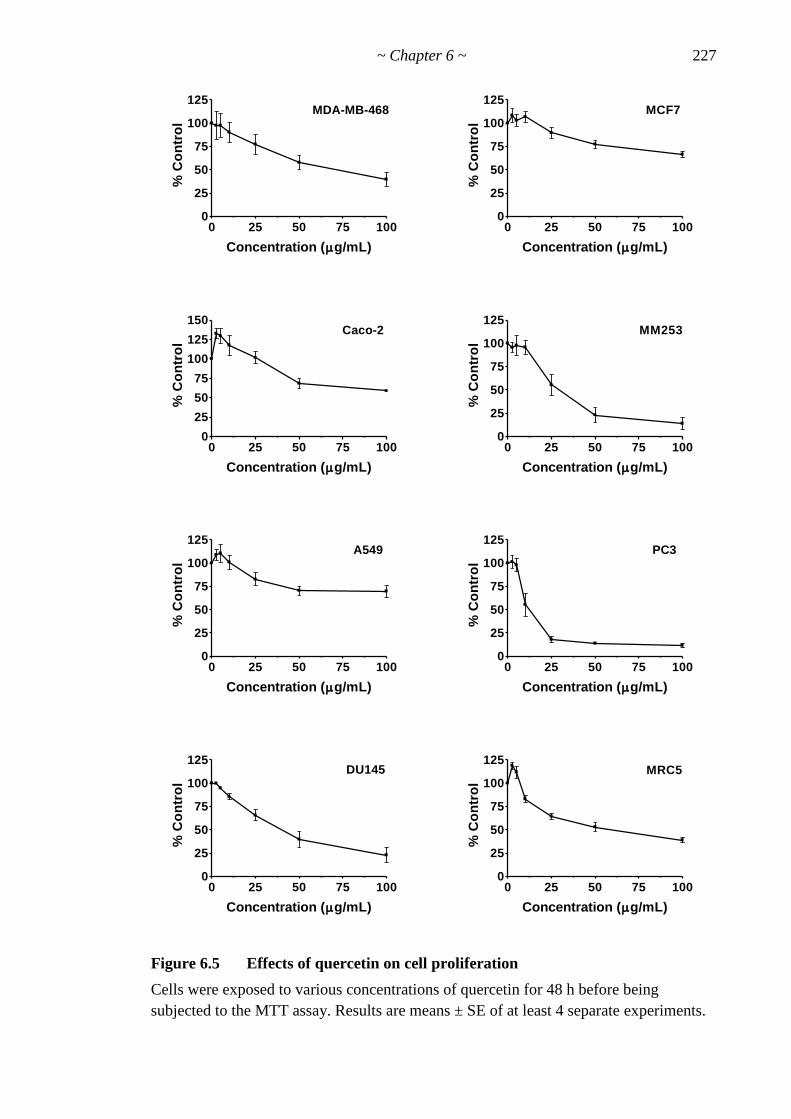
~ Chapter 6 ~ 227
0 25 50 75 1000
25
50
75
100
125 MDA-MB-468
Concentration (g/mL)
% C
on
tro
l
0 25 50 75 1000
25
50
75
100
125 MCF7
Concentration (g/mL)
% C
on
tro
l
0 25 50 75 1000
25
50
75
100
125
150 Caco-2
Concentration (g/mL)
% C
on
tro
l
0 25 50 75 1000
25
50
75
100
125 MM253
Concentration (g/mL)%
Co
ntr
ol
0 25 50 75 1000
25
50
75
100
125 A549
Concentration (g/mL)
% C
on
tro
l
0 25 50 75 1000
25
50
75
100
125 PC3
Concentration (g/mL)
% C
on
tro
l
0 25 50 75 1000
25
50
75
100
125 DU145
Concentration (g/mL)
% C
on
tro
l
0 25 50 75 1000
25
50
75
100
125 MRC5
Concentration (g/mL)
% C
on
tro
l
Figure 6.5 Effects of quercetin on cell proliferation
Cells were exposed to various concentrations of quercetin for 48 h before being
subjected to the MTT assay. Results are means ± SE of at least 4 separate experiments.

228 ~ Chapter 6 ~
0 100 200 300 400 5000
25
50
75
100
125 MDA-MB-468
Concentration (g/mL)
% C
on
tro
l
0 100 200 300 400 5000
25
50
75
100
125 MCF7
Concentration (g/mL)
% C
on
tro
l
0 100 200 300 400 5000
25
50
75
100
125 Caco-2
Concentration (g/mL)
% C
on
tro
l
0 100 200 300 400 5000
25
50
75
100
125 MM253
Concentration (g/mL)
% C
on
tro
l
0 100 200 300 400 5000
25
50
75
100
125 A549
Concentration (g/mL)
% C
on
tro
l
0 100 200 300 400 5000
25
50
75
100
125 PC3
Concentration (g/mL)
% C
on
tro
l
0 100 200 300 400 5000
25
50
75
100
125 DU145
Concentration (g/mL)
% C
on
tro
l
0 100 200 300 400 5000
25
50
75
100
125 MRC5
Concentration (g/mL)
% C
on
tro
l
Figure 6.6 Effects of EA3 on cell proliferation
Cells were exposed to various concentrations of EA3 for 48 h before being subjected to
the MTT assay. Results are means ± SE of at least 5 separate experiments.

~ Chapter 6 ~ 229
corresponded to 333 mg/mL of EA3, over 666-fold more than was tested. In other
words, although the dose-response curves of luteolin (Fig. 6.4) and quercetin (Fig. 6.5)
appear similar in shape to that of the whole extract, EA3 (Fig. 6.6), they are not directly
comparable.
Therefore, the concentrations of pure luteolin or quercetin required to induce a given
level of inhibition were compared to the concentration of EA3 required to produce the
same effect. For example, 50 g/mL luteolin and 25 g/mL quercetin produced similar
degrees of inhibition of proliferation of PC3 cells as EA3 at 100 g/mL (17% of
control). Given the concentrations of luteolin and quercetin in EA3 are 0.06% and
0.03% (w/w), respectively, this means that these concentrations of pure luteolin and
quercetin each correspond to approximately 83 mg/mL of EA3, 830-fold more than
what was actually required to produce the same effect. Similar values were obtained for
other selected inhibitory effects in PC3 cells and other cell lines. Hence, the magnitude
of the observed cytotoxic effects of EA3 cannot be accounted for by luteolin or
quercetin acting alone. Even if the individual effects of luteolin and quercetin were
added together, this would only explain 1/415 of the observed cytotoxicity in these
cells.
From these dose-response curves, IC50 values were determined, where possible, using
GraphPad Prism software as described in Section 4.3.3. The fitted curves obtained by
using the optimum model for each compound- (or the whole extract, EA3-) cell line
combination are depicted in Figure 6.7. The IC50 values calculated in this way and
related data are tabulated on the following page (Table 6.2). Of the five main
constituents of EA3, luteolin and quercetin were the most active with IC50 values below
100 µM in Caco-2 cells after 48 h exposure.

230 ~ Chapter 6 ~
0.0 0.5 1.0 1.5 2.0 2.5 3.00
25
50
75
100
125 MDA-MB-468
Log of Concentration (g/mL)
% C
on
tro
l
0.0 0.5 1.0 1.5 2.0 2.5 3.00
25
50
75
100
125 MCF7
Log of Concentration (g/mL)
% C
on
tro
l
0.0 0.5 1.0 1.5 2.0 2.5 3.00
25
50
75
100
125
150 Caco-2
Log of Concentration (g/mL)
% C
on
tro
l
0.0 0.5 1.0 1.5 2.0 2.5 3.00
25
50
75
100
125
150 MM253
Log of Concentration (g/mL)
% C
on
tro
l
0.0 0.5 1.0 1.5 2.0 2.5 3.00
25
50
75
100
125 A549
Log of Concentration (g/mL)
% C
on
tro
l
0.0 0.5 1.0 1.5 2.0 2.5 3.00
25
50
75
100
125 PC3
Log of Concentration (g/mL)
% C
on
tro
l
0.0 0.5 1.0 1.5 2.0 2.5 3.00
25
50
75
100
125DU145
Log of Concentration (g/mL)
% C
on
tro
l
0.0 0.5 1.0 1.5 2.0 2.5 3.00
25
50
75
100
125
150 MRC5
Log of Concentration (g/mL)
% C
on
tro
l
Figure 6.7 Nonlinear regression of pure compounds and Extract EA3 using the
optimum model for each compound or extract-cell line pair.
Cells were exposed to various concentrations of the pure compounds, luteolin (▲) or
quercetin (●), or the whole extract, EA3 (■), as described above (Figs 6.3 -6.6). Dose
values were transformed into log10 values and curves were fitted using Graph Pad Prism
nonlinear regression dose-response (variable slope) according to the optimum method
for each compound- or extract- cell line combination.

231
Table 6.2 IC50 Values Calculated Using Optimum Model for Individual
Cell Line and Pure Compound or Extract Combinations
MDA-MB-468 IC50
(g/mL)
IC50 Range
(95% CI) (g/mL)
Best Model
r2 Hormesis present
Luteolin ▲ 30.0 10.9 – 82.6 TB 0.791
Quercetin ● 51.9 26.5 – 101.9 4P 0.998
EA3 ■ 26.6 11.4 – 62.0 4P 0.973
MCF7 IC50
(g/mL)
IC50 Range
(95% CI) (g/mL)
Best Model
r2 Hormesis present
Luteolin ▲ 63.4 44.5 – 90.3 TB 0.927 *
Quercetin ● 151.7 68.6 – 335.9 TB 0.864
EA3 ■ 335.9 202.5 – 557.0 TB 0.871 *
Caco-2 IC50
(g/mL)
IC50 Range
(95% CI) (g/mL)
Best Model
r2 Hormesis present
Luteolin ▲ 51.8 0.421 -6386 4P 0.823 **
Quercetin ● 31.8 9.14 – 110.7 4P 0.868 **
EA3 ■ 595.3 130.9 - 2708 TB 0.735 *
MM253 IC50
(g/mL)
IC50 Range
(95% CI) (g/mL)
Best Model
r2 Hormesis present
Luteolin ▲ 27.9 21.1 – 36.8 TB 0.976
Quercetin ● 24.7 21.9 – 27.9 T 0.997
EA3 ■ 186.0 95.3 – 362.8 TB 0.891
A549 IC50
(g/mL)
IC50 Range
(95% CI) (g/mL)
Best Model
r2 Hormesis present
Luteolin ▲ 70.9 55.6 – 90.6 TB 0.969
Quercetin ● 20.4 10.0 – 41.6 4P 0.961 *
EA3 ■ 40.0 20.6 – 77.4 4P 0.949
PC3 IC50
(g/mL)
IC50 Range
(95% CI) (g/mL)
Best Model
r2 Hormesis present
Luteolin ▲ 12.1 9.78 – 15.0 TB 0.989
Quercetin ● 9.86 9.29 -10.5 T 0.998
EA3 ■ 19.4 13.2 – 28.4 T 0.975
DU145 IC50
(g/mL)
IC50 Range
(95% CI) (g/mL)
Best Model
r2 Hormesis present
Luteolin ▲ 30.3 22.7 – 40.4 TB 0.976
Quercetin ● 38.8 36.0 – 41.7 TB 0.998
EA3 ■ 864.4 55.0 - 13592 TB 0.674
MRC5 IC50
(g/mL)
IC50 Range
(95% CI) (g/mL)
Best Model
r2 Hormesis present
Luteolin ▲ 13.0 8.15 – 20.8 T 0.976
Quercetin ● 56.5 27.5 – 115.9 TB 0.843 *
EA3 ■ 143.2 108.8 – 188.4 TB 0.951 *at least one concentration > 110% of control; ** > 120% of control

232 ~ Chapter 6 ~
6.3.3 Exposure and recovery
Using the CS system, the effects of EA3 on various cancer cell lines were monitored
over time. Figure 6.8 is a representative graph depicting how different concentrations of
EA3 affected the proliferation of cells over the course of 48 h culture at 37˚C. From
these graphs, the doubling times of the various cell lines were calculated (see Section
3.3.1) with and without EA3 (Fig. 6.9). For simplicity, this figure does not include the
doubling times calculated for all concentrations of EA3.
From Figures 6.8 and 6.9 it is clear that EA3 did, indeed, inhibit the proliferation of all
cell lines tested in a concentration and time-dependent manner. The inhibitory effects
began within 90 min of exposure in the most susceptible cell lines, MDA-MB-468,
MCF7, PC3, DU145 and MRC5. It was assumed that, following the addition of extract,
a growth curve with a lower slope was indicative of a reduced rate of proliferation,
while a flat growth curve implied complete inhibition of proliferation (or rate of cell
proliferation = cell death). This assumption was supported by the very high, or
incalculable, doubling times obtained from flat growth curves of some cell lines after
EA3 exposure. Thus, the highest concentration used, 500 µg/mL, completely inhibited
the proliferation of MDA-MB-468, MCF7, PC3, DU145 and MRC5 cells within 48 h.
However, the same concentration only retarded the growth of the other three cell lines.
MCF7 and PC3 cell proliferation was also totally inhibited by 200 and 100 µg/mL
concentrations of EA3, although this effect required longer to manifest.
In a separate experiment, after 48 h exposure to various concentrations of EA3, the
extracts were washed out, the medium replaced and the cells monitored for recovery
over several more days. In this way, if the EA3-induced inhibition of cell proliferation
was due to merely cytostatic effects, it could be ascertained if these effects were
reversible or not. Data from a representative experiment are shown in Figure 6.10.

233
0 10 20 30 40 500
25
50
75
100 MDA-MB-468
Exposure Period (h)
% C
on
flu
en
cy
0 10 20 30 40 500
25
50
75
100 MCF7
Exposure Period (h)
% C
on
flu
en
cy
0 10 20 30 40 500
25
50
75
100 Caco-2
Exposure Period (h)
% C
on
flu
en
cy
0 10 20 30 40 500
25
50
75
100 MM253
Exposure Period (h)%
Co
nfl
ue
nc
y
0 10 20 30 40 500
25
50
75
100 A549
Exposure Period (h)
% C
on
flu
en
cy
0 10 20 30 40 500
25
50
75
100 PC3
Exposure Period (h)
% C
on
flu
en
cy
0 10 20 30 40 500
25
50
75
100 DU145
Exposure Period (h)
% C
on
flu
en
cy
0 10 20 30 40 500
25
50
75
100 MRC5
Exposure Period (h)
% C
on
flu
en
cy
Figure 6.8 Effect of exposure time of EA3 on cell proliferation (CS system).
Cells were exposed to various concentrations of EA3, 0 (○), 25 (▲), 50 (▲), 100 (□),
200 (●) or 500 (●) g/mL, and their confluency monitored by the Cellscreen system
over time. Results are the means ± SE of quadruplicate wells of one representative
experiment.

234 ~ Chapter 6 ~
MDA-M
B-4
68
MCF7
Cac
o-2
MM
253
A54
9PC3
DU14
5
MRC5
0
25
50
75
100
125
150
175
200
Cell line
Do
ub
lin
g t
ime (
h)
Figure 6.9 Effect of EA3 on cell doubling times.
Cells were exposed to various concentrations of EA3, 0 (□), 50 (■), 100 (■) or 500 (■)
g/mL, and their confluency monitored by the Cellscreen system over time (Fig. 6.8).
Percent confluency values were transformed into logarithmic values and the doubling
times calculated using the slope of the resultant linear regression lines fitted to data
points over the final 40 h of exposure, as described in Section 3.3.1.
denotes the calculated doubling time was above 200 µg/mL.
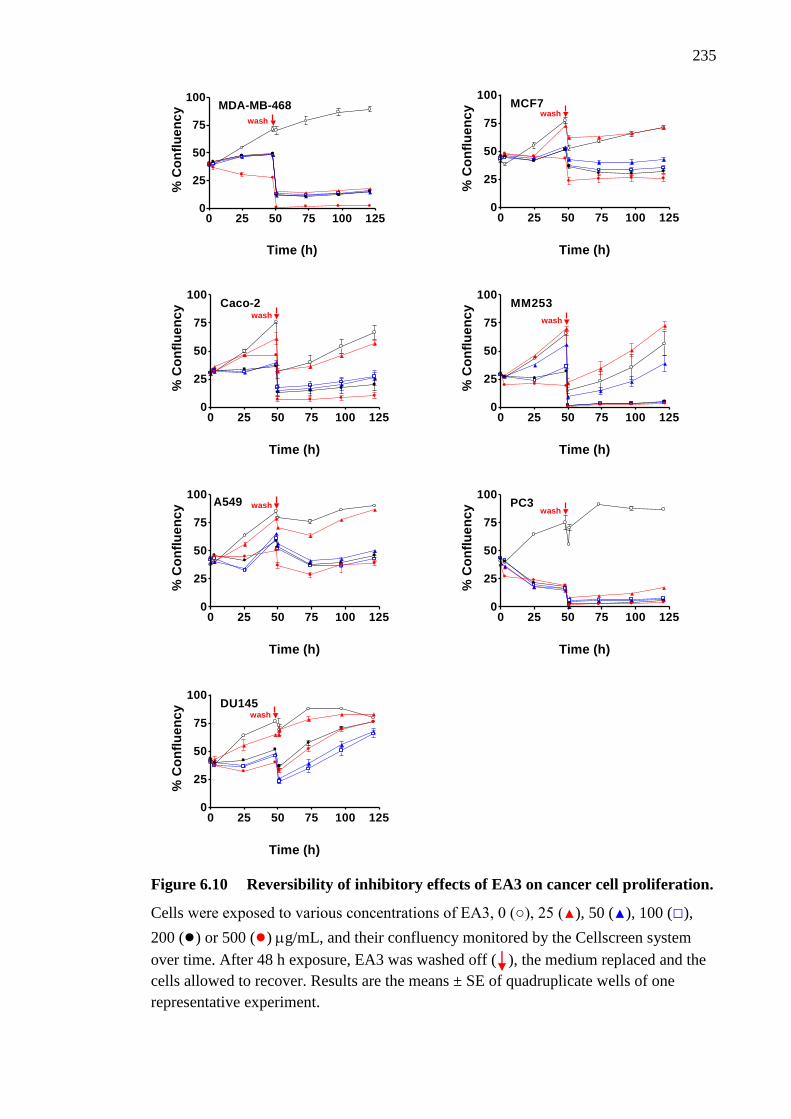
235
0 25 50 75 100 1250
25
50
75
100 MDA-MB-468
wash
Time (h)
% C
on
flu
en
cy
0 25 50 75 100 1250
25
50
75
100 MCF7
Time (h)
% C
on
flu
en
cy
wash
0 25 50 75 100 1250
25
50
75
100 Caco-2
Time (h)
% C
on
flu
en
cy
wash
0 25 50 75 100 1250
25
50
75
100 MM253
Time (h)
% C
on
flu
en
cy
wash
0 25 50 75 100 1250
25
50
75
100 A549
Time (h)
% C
on
flu
en
cy wash
0 25 50 75 100 1250
25
50
75
100 PC3
Time (h)
% C
on
flu
en
cy wash
0 25 50 75 100 1250
25
50
75
100 DU145
Time (h)
% C
on
flu
en
cy
wash
Figure 6.10 Reversibility of inhibitory effects of EA3 on cancer cell proliferation.
Cells were exposed to various concentrations of EA3, 0 (○), 25 (▲), 50 (▲), 100 (□),
200 (●) or 500 (●) g/mL, and their confluency monitored by the Cellscreen system
over time. After 48 h exposure, EA3 was washed off ( ), the medium replaced and the
cells allowed to recover. Results are the means ± SE of quadruplicate wells of one
representative experiment.
236 ~ Chapter 6 ~
From Figure 6.10 it can be seen that the inhibitory effects of EA3 were sometimes, but
not always, irreversible. After EA3 was removed, Caco-2, MM253, A549 and DU145
cells resumed proliferation within the 72 h period assessed. This resumption of growth
was most evident when low concentrations of EA3 were used, but was also noticeable
even when these cells were exposed to the highest concentration of EA3, 500 µg/mL.
On the other hand, MDA-MB-468, MCF7 and PC3 cells did not recover from exposure
to EA3 even at 50 µg/mL within 72 h of its removal.
It must be noted that the wash step itself removed many cells as evidenced by the drop
in confluency between 48 and 50 h even when no EA3 was present. This effect was
most noticeable in Caco-2 and MM253, but the remaining cells rapidly recovered,
which was not the case for EA3-induced cells.
6.3.4 Intracellular Ca2+
measurement
The effect of EA3 on intracellular Ca2+
signalling was then examined in PC3 cells.
When PC3 cells were exposed to 500 g/mL EA3, [Ca2+
]i significantly increased and
then gradually declined, plateauing between 5 min and 10 min post-peak (Fig. 6.11A).
The mean data obtained from all the experiments on PC3 cells in which a response was
recorded (n=5) are presented in Table 6.3. ANOVAs (Student Newman-Keuls, SNK)
revealed significant differences between the mean resting ratio and the peak ratio after
addition of EA3 (p<0.001). Significant differences (p<0.001) were also found between
the mean resting ratio and the ratios at 5 min (P<0.01) and 10 min (P<0.001) post-peak,
and between the mean peak ratio and the ratios 5 min and 10 min post-peak (p<0.001),
indicating that the ratio initially declined, but did not return to the resting level within
the period tested. There was no significant difference between the ratios at 5 min and
10 min post-peak. This response was a consistent result, with a transient increase in the
ratio observed in 13 of 14 tests using different cancer cell lines.
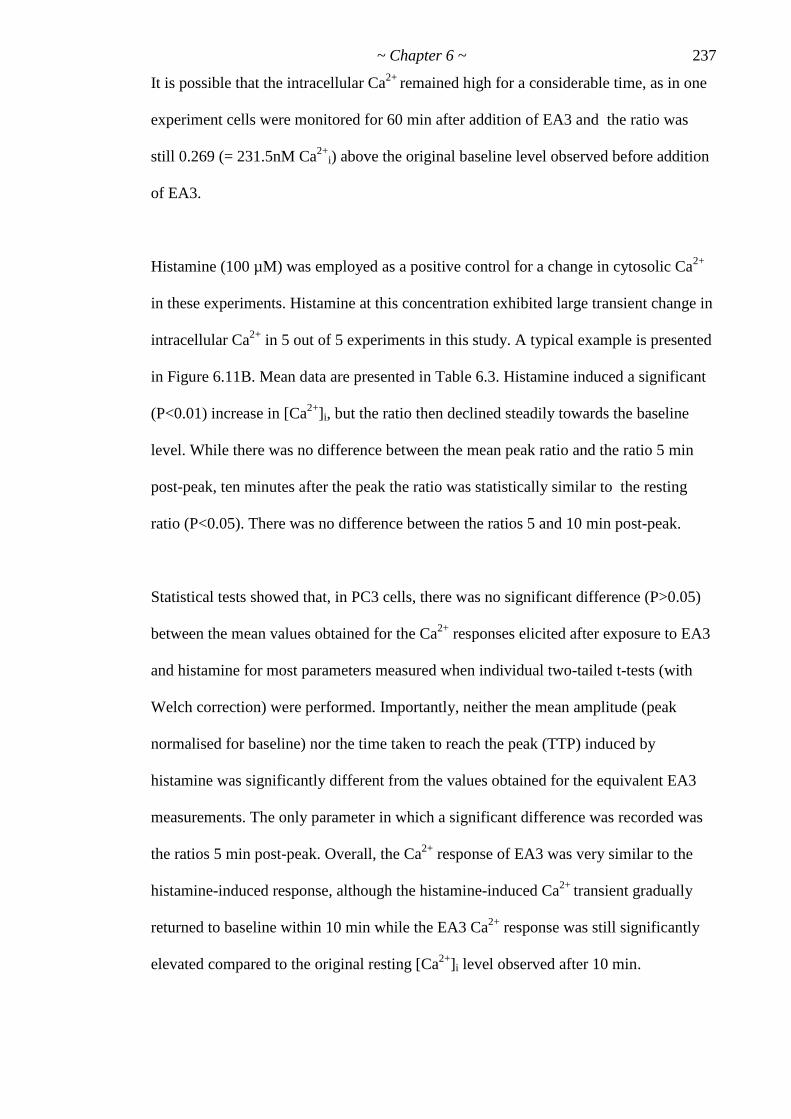
~ Chapter 6 ~ 237
It is possible that the intracellular Ca2+
remained high for a considerable time, as in one
experiment cells were monitored for 60 min after addition of EA3 and the ratio was
still 0.269 (= 231.5nM Ca2+
i) above the original baseline level observed before addition
of EA3.
Histamine (100 µM) was employed as a positive control for a change in cytosolic Ca2+
in these experiments. Histamine at this concentration exhibited large transient change in
intracellular Ca2+
in 5 out of 5 experiments in this study. A typical example is presented
in Figure 6.11B. Mean data are presented in Table 6.3. Histamine induced a significant
(P<0.01) increase in [Ca2+
]i, but the ratio then declined steadily towards the baseline
level. While there was no difference between the mean peak ratio and the ratio 5 min
post-peak, ten minutes after the peak the ratio was statistically similar to the resting
ratio (P<0.05). There was no difference between the ratios 5 and 10 min post-peak.
Statistical tests showed that, in PC3 cells, there was no significant difference (P>0.05)
between the mean values obtained for the Ca2+
responses elicited after exposure to EA3
and histamine for most parameters measured when individual two-tailed t-tests (with
Welch correction) were performed. Importantly, neither the mean amplitude (peak
normalised for baseline) nor the time taken to reach the peak (TTP) induced by
histamine was significantly different from the values obtained for the equivalent EA3
measurements. The only parameter in which a significant difference was recorded was
the ratios 5 min post-peak. Overall, the Ca2+
response of EA3 was very similar to the
histamine-induced response, although the histamine-induced Ca2+
transient gradually
returned to baseline within 10 min while the EA3 Ca2+
response was still significantly
elevated compared to the original resting [Ca2+
]i level observed after 10 min.

238 ~ Chapter 6 ~
Similar trends were observed when EA3 was added to MDA-MB-468 and A549 cells
(data not shown). However, the resting ratios were higher in these cells and peak ratios
were also correspondingly higher. Additionally, more time was required to reach peak
values. The effects of histamine and ionomycin were not evaluated in these cell lines.
Table 6.3 Mean ± SE Data from F340/F380 Traces of PC3 Cells
EA3
(500 g/mL)
Histamine
(100 M)
Resting Ratio 0.421 ± 0.013
0.503 ± 0.033
Peak Ratio 0.719 #
± 0.028
0.722 †
± 0.055
Peak + 5 min 0.528 # ^
± 0.006
0.632 * ± 0.034
Peak + 10 min 0.563 # ^
± 0.026
0.565 ‡ ± 0.041
Amplitude 0.297 ± 0.031
0.219 ± 0.033
TTP (s) 98.2 ± 10.8
107.8 ± 35.9
Peak [Ca2+]i Increase (nM) 260
± 30.0
198
± 61.0
% of Maximal 36.3 ± 5.3
26.8 ± 4.9
The effects of EA3 and histamine exposure on [Ca2+
]i in Fura-2-loaded PC3 cells (n=5).
The Resting Ratio is the basal F340/F380, the Peak Ratio is the maximum ratio attained,
the Amplitude is the peak ratio minus the resting ratio, and TTP (―time to peak‖) is the
duration of time taken to reach the peak. Peak + 5 min and Peak + 10 min are the ratios
at 5 min and 10 min post peak. Peak [Ca2+
]i Increase is an estimation of the maximal
rise in [Ca2+
]i, calculated using the Grynkiewicz equation. Finally, % of Maximal values
are changes in [Ca2+
]i as a percentage of the fluorophore‘s total capacity for Ca2+
,
calculated using the mean ratios recorded upon addition of 10 M ionomycin. ANOVAs
(SNK) were performed to assess changes in [Ca2+
]i for both EA3 and histamine. For
EA3, # denotes a significant (P<0.01) difference between the value and the Resting
Ratio, while ^ means the value is significantly (P<0.001) different from the Peak Ratio.
For histamine, † denotes a significant (P<0.01) difference from the Resting Ratio, while
‡ means a significant (P<0.05) difference from the Peak Ratio. Significant (P<0.05)
differences between histamine values and the corresponding EA3 value are denoted * (t-
tests with Welch correction).
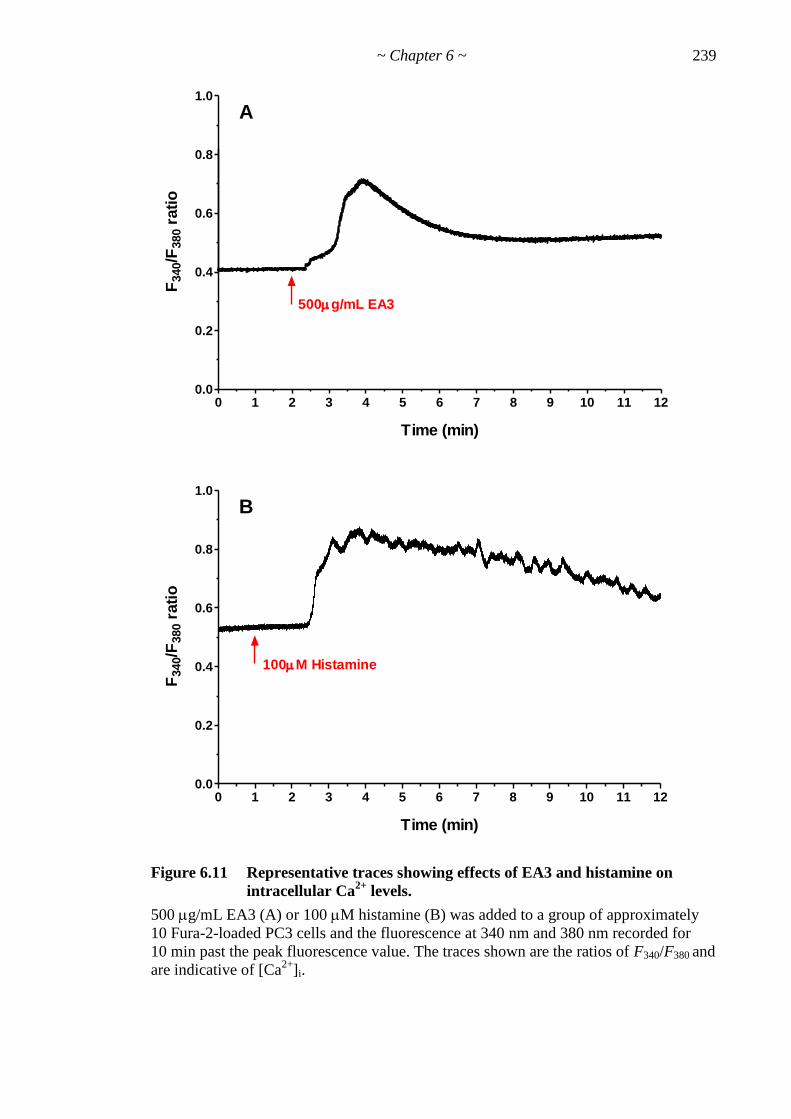
~ Chapter 6 ~ 239
0 1 2 3 4 5 6 7 8 9 10 11 120.0
0.2
0.4
0.6
0.8
1.0
500g/mL EA3
A
Time (min)
F340/F
380 r
ati
o
0 1 2 3 4 5 6 7 8 9 10 11 120.0
0.2
0.4
0.6
0.8
1.0
100M Histamine
B
Time (min)
F340/F
380 r
ati
o
Figure 6.11 Representative traces showing effects of EA3 and histamine on
intracellular Ca2+
levels.
500 g/mL EA3 (A) or 100 M histamine (B) was added to a group of approximately
10 Fura-2-loaded PC3 cells and the fluorescence at 340 nm and 380 nm recorded for
10 min past the peak fluorescence value. The traces shown are the ratios of F340/F380 and
are indicative of [Ca2+
]i.
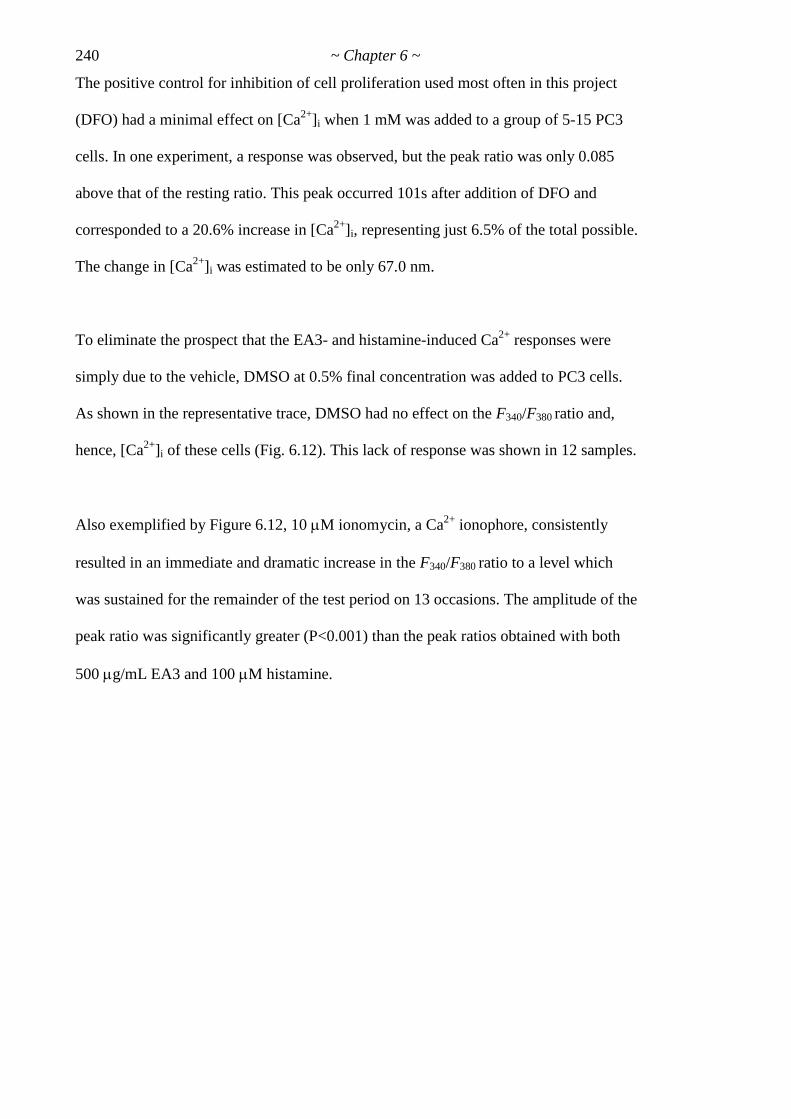
240 ~ Chapter 6 ~
The positive control for inhibition of cell proliferation used most often in this project
(DFO) had a minimal effect on [Ca2+
]i when 1 mM was added to a group of 5-15 PC3
cells. In one experiment, a response was observed, but the peak ratio was only 0.085
above that of the resting ratio. This peak occurred 101s after addition of DFO and
corresponded to a 20.6% increase in [Ca2+
]i, representing just 6.5% of the total possible.
The change in [Ca2+
]i was estimated to be only 67.0 nm.
To eliminate the prospect that the EA3- and histamine-induced Ca2+
responses were
simply due to the vehicle, DMSO at 0.5% final concentration was added to PC3 cells.
As shown in the representative trace, DMSO had no effect on the F340/F380 ratio and,
hence, [Ca2+
]i of these cells (Fig. 6.12). This lack of response was shown in 12 samples.
Also exemplified by Figure 6.12, 10 M ionomycin, a Ca2+
ionophore, consistently
resulted in an immediate and dramatic increase in the F340/F380 ratio to a level which
was sustained for the remainder of the test period on 13 occasions. The amplitude of the
peak ratio was significantly greater (P<0.001) than the peak ratios obtained with both
500 g/mL EA3 and 100 M histamine.
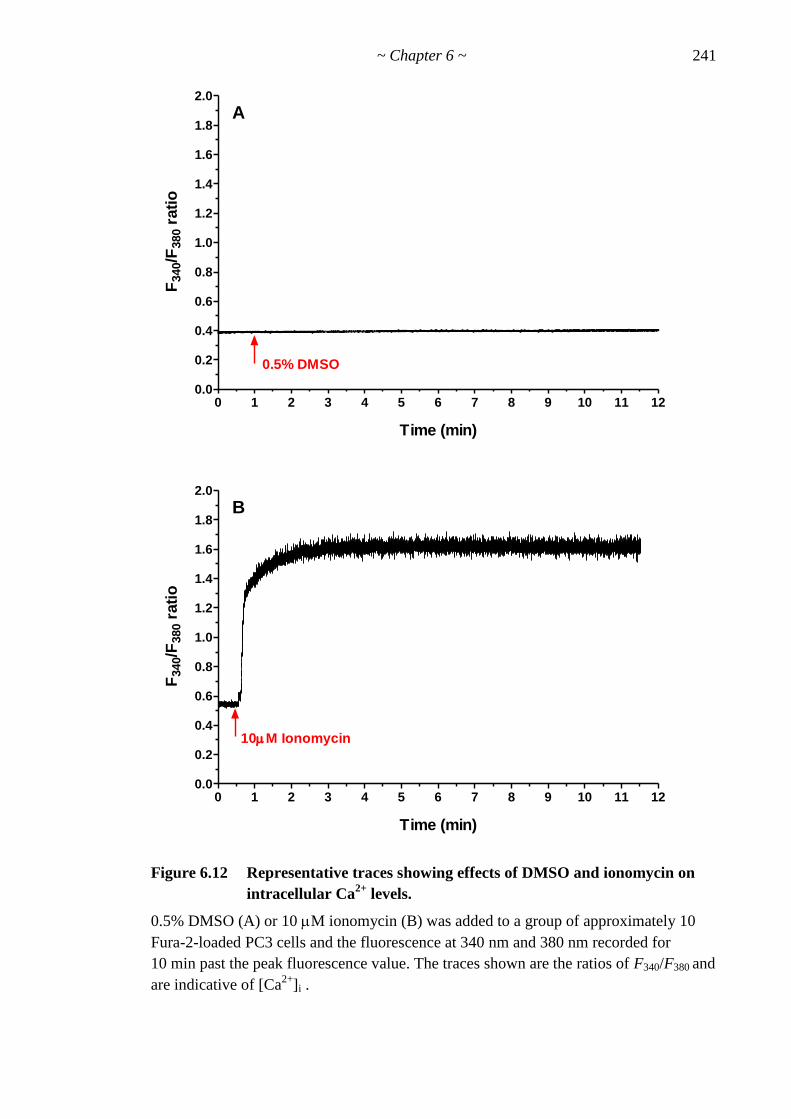
~ Chapter 6 ~ 241
0 1 2 3 4 5 6 7 8 9 10 11 120.0
0.2
0.4
0.6
0.8
1.0
1.2
1.4
1.6
1.8
2.0
0.5% DMSO
A
Time (min)
F340/F
380 r
ati
o
0 1 2 3 4 5 6 7 8 9 10 11 120.0
0.2
0.4
0.6
0.8
1.0
1.2
1.4
1.6
1.8
2.0
10M Ionomycin
B
Time (min)
F340/F
380 r
ati
o
Figure 6.12 Representative traces showing effects of DMSO and ionomycin on
intracellular Ca2+
levels.
0.5% DMSO (A) or 10 M ionomycin (B) was added to a group of approximately 10
Fura-2-loaded PC3 cells and the fluorescence at 340 nm and 380 nm recorded for
10 min past the peak fluorescence value. The traces shown are the ratios of F340/F380 and
are indicative of [Ca2+
]i .

242 ~ Chapter 6 ~
6.4 DISCUSSION
6.4.1 Chemical composition
The main constituents of EA3 identified by LC-MS were rutin, luteolin, quercetin, apigenin
and naringenin. These compounds are all flavonoids, sometimes known as bioflavonoids,
the largest and most important group of polyphenolic compounds that are universally
present in flowering plants (Kuntz et al., 1999; Brusselmans et al., 2005). Flavonoids are
one of the largest groups of plant secondary metabolites, with over 6,500 different
compounds identified to date, although it has been speculated that thousands more are
likely to exist (Ververidis et al., 2007). They are primarily recognised as the molecules
responsible for the red, yellow and orange pigments of many plant parts and are consumed
regularly as part of the human diet (Middleton et al., 2000). For example, flavonoids are
prominent components of citrus fruits, but they are also found in other fruits, vegetables,
seeds, herbs, spices as well as in tea and red wine (Middleton et al., 2000). Flavonoid
compounds also play important roles as plant defence mechanisms (Ververidis et al., 2007).
Flavonoids are low molecular weight compounds comprised of a basic 3-ring structure with
various substitutions as seen in Figure 6.13 (Middleton et al., 2000; Graf et al., 2005).
Figure 6.13 Basic structure and numbering system of flavonoids.
Flavonoids contain two aromatic rings (A and B) that are linked via an oxygenated
heterocycle (ring C).
Note. From ―Flavonols, flavones, flavanones, and human health: epidemiological
evidence.‖ by B.A. Graf, P.E. Milbury and J.B. Blumberg, 2005, Journal of Medicinal
Food 8(3), p. 282.

~ Chapter 6 ~ 243
There are six commonly recognised subclasses of flavonoids and more information about
the differences in their chemical structures can be found in Appendix K. For this study the
important thing to note is that the structures of rutin, quercetin and luteolin are very closely
related, differing only in the functional group (R) attached to carbon 3 (Fig. 6.14).
Quercetin mainly occurs in plants as a glycoside, of which rutin is an example (quercetin
rutinoside) present in tea (Erlund et al., 2000).
Figure 6.14 Chemical structures of luteolin, quercetin and rutin.
Note. From ―Structure-activity relationships for antioxidant activities of a series of
flavonoids in a liposomal system.‖ by A. Arora, M.G. Nair and G.M. Strasburg, 1998, Free
Radical Biology and Medicine 24(9), p. 1356.
Besides the flavonoids, several other components of known molecular weight were also
present in EA3. However, given the limited resources, unfortunately these could not be
identified as part of the present study. Since the identified compounds are known to have
antitumour activity (see Section 6.4.2), it was decided to focus the remaining experiments
on comparing the actions of these pure compounds with those of the whole extract, EA3.

244 ~ Chapter 6 ~
6.4.2 Identification of active constituents
The main components of EA3, as identified by LC-MS, were rutin, luteolin, quercetin,
apigenin and naringenin. These compounds, like many flavonoids, have all been reported to
possess antitumour properties (Kandaswami et al., 2005; Plochmann et al., 2007). For
example, Kuntz et al. (1999) screened 36 flavonoids for their anticancer effects in three
cancer cell lines and demonstrated all were growth-inhibitory to varying degrees. Quercetin
has been shown to reduce cell proliferation, cause cell cycle arrest in the G0/G1 phase, the
G2/M-phase and the S-phase and induce caspase-3 activity and apoptosis in in vitro
experiments with various cell lines (Mertens-Talcott & Percival, 2005). These properties of
luteolin and quercetin are consistent with the cytostatic properties of extracts discussed in
Chapter 4. Additionally, Han et al. (2001) showed that both luteolin and quercetin in
nanomolar quantities were able to inhibit MCF7 cell proliferation. Evidence that these
effects extend to the in vivo situation was provided by Devipriya et al. (2006), who showed
quercetin reduced the tumour volume in rats induced for mammary carcinoma, and
Selvendiran et al. (2006), who demonstrated luteolin significantly inhibited the growth of
xenografted tumours in nude mice in a dose-dependent manner.
The results of the present study support those in the literature in that pure compounds of
luteolin and quercetin both inhibited the proliferation of several cancer cell lines in a dose-
dependent manner. After 48 h exposure, the calculated IC50 values for luteolin were in
accordance with several other studies (Saleem et al., 2002; Chang et al., 2005; Yoo et al.,
2009). Similarly, IC50 values obtained for quercetin agreed with published data (Yoshida et
al., 1990; Wenzel et al., 2004). Rutin did not inhibit the proliferation of any cell line tested,
a finding which is also in agreement with those of other groups (Scambia et al., 1994;
Kawaii et al., 1999; Chao et al., 2007). It appears that rutin is not able to induce
~ Chapter 6 ~ 245
antiproliferative effects until the glycosidic bond of the rutinose moiety is cleaved to yield
quercetin (Campbell et al., 2006). Indeed, as a group, flavonoid glycosides typically show
little effect on the proliferation of cancer cells in vitro. It is likely that by making the
molecules more polar and less planar, glycosidation blocks the entry of flavonoids into
cells and may also sterically inhibit their binding to receptors involved in gene expression n
(Manthey & Guthrie, 2002). While several glycosidic flavonoids, including rutin, have
shown antitumour activities in vivo, this is probably due to their antioxidant properties and
their abilities to modulate the levels of detoxifying hepatic enzymes or inhibit angiogenesis
(Deschner et al., 1991; Shen et al., 2002; Manthey & Guthrie, 2002; Guruvayoorappan &
Kuttan, 2007).
However, while luteolin and quercetin are two of the main constituents of EA3, they are
present at less than 0.1% (w/w). Calculations comparing the effects of pure compounds
with the effects of the whole extract (see Section 6.3.2) indicated that the observed EA3-
induced cytotoxicity/cytostaticity was not attributable to luteolin or quercetin acting alone.
However, it is unusual for a single compound to be responsible for the observed activity.
Indeed, very often several compounds are isolated from an extract which exert the same
effect, although they may have different potencies (Houghton et al., 2007). Therefore, the
individual effects of pure luteolin and quercetin were added together to see if that would
account for the observed bioactivity of EA3. These calculations implied that even if they
had additive effects, the bioactivity of EA3 could not be explained by quercetin and
luteolin.

246 ~ Chapter 6 ~
However, according to Wagner2, an international expert in the field of interactions between
plant constituents, ―it is not possible to compare extracts and pure constituents thereof,
because interactions of constituents in extracts cannot be calculated because of the many
possible complex and antagonistic interactions‖ (Wagner, H., personal communication, 7th
June, 2010). Thus, it is quite possible that luteolin and quercetin could
have acted synergistically, together with other flavonoids, other polyphenolics, and even
other constituents, in the whole extract. This possibility is discussed in more depth in
Section 8.2.6.2.
Unfortunately, due to time and budget constraints, only three of the secondary metabolites
present in the extract could be examined as part of the current study. The choice of pure
compounds tested was based on their relative presence in EA3 and previous studies
implicating them as anticancer agents. However, it would also be worth examining the
effects of other flavonoids, especially apigenin and possibly naringenin, which LC-MS
revealed were also major components of EA3. Apigenin has been shown to inhibit
proliferation and/or induce apoptosis in many cancer cells, including all those used in the
present study except MM253, although inhibition of growth of other melanomas has been
reported (Weiqun et al., 2000; Yin et al., 2001; Gupta et al., 2001; Liu et al., 2005). While
there are reports of naringenin causing low-level inhibition of proliferation of some cell
lines, these effects are markedly increased when it is used in combination with other
flavonoids (So et al., 1997; Knowles et al., 2000; Campbell et al., 2004; Brusselmans et al.,
2005; Campbell et al., 2006).
2 Emeritus Professor Hildebert Wagner is an internationally renowned pharmaceutical biologist. Based at the
University of Munich‘s Institute of Pharmacy, he is the author of over 950 original papers and 30 review
articles on various areas of phamacognosy, including the pharmacological screening of plants and isolated
constituents (http://www.cup.uni-muenchen.de/pb/aks/wagner/).

~ Chapter 6 ~ 247
Indeed, this sort of synergistic interaction is quite common with flavonoids (Mertens-
Talcott et al., 2003; Campbell et al., 2006; Kale et al., 2008; Harasstani et al., 2010).
Significantly, quercetin and luteolin have both been shown to interact synergistically with
other compounds to inhibit proliferation of some cancer cells in vitro (Shen & Weber,
1997; Ackland et al., 2005; Wu et al., 2008a). Therefore, a future direction of this study is
to investigate the effects of a range of cocktails containing quercetin and luteolin, as well as
other flavonoids like apigenin, mixed together in various ratios to see if their individual
inhibitory effects are potentiated when in combination (see Section 8.2.6.2).
Ideally, flavonoids would be removed from EA3 during the extraction process and the
flavonoid-free extract tested for its ability to inhibit the proliferation of cancer cells. If the
cytotoxic/cytostatic effects are still evident, then other constituents must be responsible.
These would then need to be identified and individually tested for activity too. In this
manner, eventually, it should be possible to clarify if the active principle/s is a known or
novel compound.
While it seems likely that the observed effects of EA3 were due to luteolin and quercetin
acting in synergy, future studies must be done in order to confirm this. There are many
other constituents of EA3, including other flavonoids and other polyphenolics, that could
be tested to definitively identify the compound/s responsible for its observed
cytotoxicity/cytostaticity. While most of these substituents are known compounds, until
these are proven to be responsible, the possibility exists that the antiproliferative effects
may be due to a novel compound.

248 ~ Chapter 6 ~
6.4.3 Exposure and recovery
EA3 inhibited the proliferation of all cell lines tested in a concentration and time-dependent
manner (Figs. 6.8 and 6.9). The most susceptible cell lines were MDA-MB-468, MCF7,
PC3, DU145 and MRC5 cells in which 500 µg/mL EA3 caused total inhibition of
proliferation within just 90 min. However, the same concentration only retarded the growth
of the other three cell lines (Caco-2, MM253 and A549), which recovered to proliferate
within 48 h. Even lower concentrations (200 and 100 g/mL) of EA3 caused total
inhibition of the proliferation of MCF7 and PC3 cells, but only reduced the rate of
proliferation in other cells.
In PC3 and DU145 cells, % confluency actually decreased over time, suggesting some level
of cytotoxicity at higher concentrations of extract. This cytotoxicity was rapid, occurring
well within the time span of 1-3 h reported for cells to undergo apoptosis (Gavrieli et al.,
1992). Therefore, in these cells, it is feasible that EA3 induced cell death via an apoptotic
mechanism. As the % confluency levels did not rise again, surviving cells had either left the
cell cycle or were proliferating at the same rate as other cells were dying. Results of the
next experiment in which extracts were washed out (see Fig. 6.10 and discussion below),
indicate the former scenario in PC3 cells and the latter in DU145 cells.
Cytotoxicity was also observed in A549 cells, but these cytotoxic effects were not apparent
until at least 8 h after addition of the extract, which may suggest cell death was via
necrosis. However, in this case, surviving cells were able to proliferate.
Cytostatic effects were apparent when MDA-MB-468, MCF7 and MRC5 cells were
exposed to 500 g/mL of EA3, as evidenced by the flat growth curves. In MRC5 cells, all

~ Chapter 6 ~ 249
concentrations of EA3 were cytostatic, although it must be noted that even the control cells
were not growing very fast.
From Figure 6.10 it can be seen that the inhibitory effects of EA3 were mostly irreversible
at high concentrations. Except for A549 and DU145 cells, high concentrations of this
extract generally caused cells to irreversibly leave the cell cycle, as even after they were
washed out, cell proliferation did not resume within 72 h period assessed. This result
suggests that, while EA3 induced cytotoxicity in both PC3 cells and DU145 cells, surviving
DU145 cells were able to proliferate in the absence of extract, while all PC3 cells were
irreversibly affected. In MDA-MB-468 and PC3 cells, concentrations as low as 50 µg/mL
were enough to cause irreversible growth arrest.
Overall, these experiments revealed that EA3 causes cytotoxic effects in some cell lines and
cytostatic effects in others, thus displaying selectivity. Additionally, the speed of the
cytotoxic response in PC3 and DU145 cells was suggestive of apoptosis as necrosis is
generally a slower process (Gavrieli et al., 1992; Majno & Joris, 1995), although further
studies are required to confirm this.
6.4.4 Intracellular Ca2+
measurement
Ca2+
is the most widely used second messenger, regulating a diverse array of cellular
functions, including adhesion, motility, gene expression and proliferation (Campbell,
1990). Indeed, Ca2+
signals control almost every aspect of cellular life, from short-term
cytoskeletal modifications to long-term alterations in gene expression (Clapham, 2007;
Gallo et al., 2006). However, too much intracellular Ca2+
is cytotoxic, so it is vital that a
cell maintains a relatively low resting [Ca2+
]i and Ca2+
increases during signalling are
250 ~ Chapter 6 ~
transient (Carafoli et al., 2001; Clapham, 2007). Hence, to facilitate Ca2+
homeostasis and
yet provide easily accessible Ca2+
when required for signalling purposes, excess Ca2+
is
stored in intracellular organelles, such as the mitochondria, Golgi apparatus or, in
particular, the endoplasmic reticulum (ER) (Campbell, 1990). A sophisticated system of
membrane channels and pumps (see Appendix J) coordinates the entry of Ca2+
into the
cytosol from the extracellular fluid or these intracellular storage organelles, and its
subsequent extrusion from the cell (Clapham, 2007).
However, when a cell becomes injured, impairment of normal intracellular Ca2+
homeostasis usually results. Following injury, the integrity of the plasma membrane can
become compromised and Ca2+
flows into the cytosol down its 20,000-fold concentration
gradient from the extracellular fluid. Ca2+
extrusion systems are quickly overcome, leading
to uncontrolled, sustained rises in [Ca2+
]i with cell death often ensuing. Ca2+
influx can also
be enhanced due to changes in the opening of plasma membrane Ca2+
ion channels or
release of Ca2+
into the cytosol from intracellular stores, constituting Ca2+
signalling
(Campbell, 1990). Mobilisation of intracellular Ca2+
stores is the usual explanation behind
rapid and transient increases in [Ca2+
]i . Such a pattern is indicative of a physiological
response and may or may not be associated with cell death (Orrenius et al., 1989). There is
evidence suggesting that very high [Ca2+
]i causes cell death through necrosis, whereas
lower increases in [Ca2+
]i induced by milder insults promote cell death via apoptosis
(Rizzuto et al., 2003). A rise in [Ca2+
]i is associated with both early and late stages of some
apoptotic pathways (Tombal et al., 1999; Sylvie et al., 2000; Baumgartner et al., 2009).
The aim of this series of experiments was to detect any changes in [Ca2+
]i when cells were
exposed to EA3 in order to obtain clues to the mechanism by which EA3 induces cell
death. The basic premise was that if cells were dying via necrosis, a rapid and sustained

~ Chapter 6 ~ 251
increase in [Ca2+
]i of high magnitude would ensue, while a more transient, smaller response
would indicate Ca2+
signalling, possibly suggesting a more regulated mechanism, such as
apoptosis. On the other hand, a Ca2+
transient could also be activating a normal
physiological change within the cells.
The compounds used elsewhere in this thesis as positive controls for proliferation studies
were DFO and camptothecin (CPT). The effect of CPT on intracellular Ca2+
was precluded
due to autofluorescence which interfered with fluorescence measurements, rendering the
traces obtained nonsensical (data not shown). However, DFO was examined and was found
to have very little effect on intracellular Ca2+
. This result was surprising as it contrasts with
the findings of Wang and colleagues (2005) who, using a different fluorophore,
demonstrated that DFO significantly (P<0.01) increased [Ca2+
]i of Caco-2 cells in a dose-
dependent manner. Nevertheless, the results of the current study indicate that DFO was not
inhibiting proliferation of PC3 cells by acutely increasing Ca2+
. Considering that EA3 did
acutely increase [Ca2+
]i in the PC3 cells, it is possible that EA3 and DFO act via different
pathways. However, these experiments do not rule out the possibility that DFO may also
increase cytosolic Ca2+
in the PC3 cells after an initial delay, which would not be detected
in the 10 min monitoring window used in this study.
Histamine is a widely occurring chemical mediator that has been shown to mobilise Ca2+
in
cells expressing the H1 and H4 type receptors (Tilly et al., 1990; Thurmond et al., 2008).
Significantly, PC3 cells express the H1 receptor and histamine has been shown to elevate
[Ca2+
]i in a concentration-dependent manner in these cells, with an IC50 value of 1 M
(Wasilenko et al., 1997; Lee et al., 2001; Suzuki et al., 2007). Wasilenko and colleagues

252 ~ Chapter 6 ~
(1997) reported that 10 M histamine caused an increase of [Ca2+
]i in PC3 cells which was
261nM above baseline levels. While this concentration of histamine was not enough to
induce a detectable Ca2+
response in the same cell type under the experimental conditions
used in this project, 100 M histamine caused a mean increase in [Ca2+
]i 198nM above the
basal level. This elevation in [Ca2+
]i was not significantly different to the increase
published by Wasilenko et al. (1997, p169), who described histamine as one of the ―most
effective calcium agonists‖ of all the compounds they tested. Therefore, histamine was
introduced as a suitable positive control for the experiments designed to evaluate changes
in intracellular Ca2+
levels of PC3 cells.
Accordingly, the Ca2+
response of PC3 cells to histamine was compared to that of EA3.
From Table 6.3, it appeared 500 g/mL EA3 caused a higher increase above basal
intracellular Ca2+
levels than 100 M histamine. However, there was no statistically
significant difference between the amplitudes of the two responses. Similarly, the speeds of
responses, as indicated by the times taken to reach peak (TTP) fluorescence values, were
not significantly different for the two agents. Histamine is well known to be an effective
mediator involved in many Ca2+
signalling processes (Lee et al., 2001). For example,
histamine receptors couple with and activate specific G-proteins which leads to enhanced
Ca2+
mobilisation in the case of three of the four known receptor subtypes (Akdis & Blaser,
2003; Thurmond et al., 2008). Therefore, the similarities between the EA3- and histamine-
induced Ca2+
transients suggest that the action of EA3 could be, at least in part, via Ca2+
signalling. Further study needs to be done to resolve this suggestion.
~ Chapter 6 ~ 253
The main difference between the effects of EA3 and histamine on [Ca2+
]i was that in the
case of EA3, the [Ca2+
]i remained elevated above the initial resting [Ca2+
]i value for at least
10 min after activation whereas the [Ca2+
]i had returned to resting levels after 10 min after
histamine application. This suggests that the histamine-induced Ca2+
response was
transient, with the peak slowly decaying towards the baseline within the experimental time
frame, while the EA3-induced Ca2+
response was biphasic, consisting of a peak then a
plateau phase. For many cell types, it is well known that an initial rise in [Ca2+
]i is mainly
due to the mobilisation of stored Ca2+
, while a secondary rise or plateau is due to sustained
Ca2+
influx across the plasma membrane (Tilly et al., 1990; Liou et al., 2005; Chen et al.,
2010}. It is possible that the plateau phase recorded for EA3 was actually a slight (non-
significant) rise in [Ca2+
]i, but since this secondary rise was only gradual, it was probably
not due to EA3-induced damage to the integrity of the plasma membrane. If a breach in
membrane integrity had occurred, Ca2+
would flood down its considerable gradient into the
cytosol and the trace would more closely resemble that of the ionomycin-induced Ca2+
response (Fig. 6.12). Previous experiments demonstrated that a crude methanol extract of
the same source as EA3 reduced the proliferation of cancer cells within 30 min (section
5.3.5). Subsequent CS experiments described above revealed that inhibition of PC3 cell
proliferation by EA3 was rapid and non-reversible, indicating a cytotoxic effect within this
period. Given that a rapid influx of Ca2+
did not transpire within a similar time frame, it is
therefore unlikely that EA3 at this concentration causes cell death via necrosis.
These results clearly demonstrate that some Ca2+
signalling is taking place upon exposure
of PC3 cells to EA3. However, while the Ca2+
response to EA3 may be a signal for
apoptosis, it could also be a part of normal physiological signalling processes. Further
experiments, discussed in Chapter 8, are therefore required.

254 ~ Chapter 6 ~
6.5 SUMMARY
The results of these experiments suggest that EA3 causes cytotoxicity in some cancer cell
lines and yet has only cytostatic effects in others, illustrating a degree of selectivity. Both
cytotoxicity and cytostaticity could be due to the synergistic actions of two or its major
constituents, the flavonoids luteolin and quercetin. On the other hand, it is possible that the
observed effects are attributable to other known or unknown compounds, acting alone or
synergistically. EA3-induced cytotoxicity may involve Ca2+
signalling processes as EA3
clearly induced a transient rise in [Ca2+
]i in PC3 cells within minutes of their exposure to
this extract. The Ca2+
response was biphasic which is consistent with release of Ca2+
from
internal stores followed by extracellular Ca2+
influx. The pattern of the trace also indicates
that the elevated [Ca2+
]i was unlikely to be due to a breach in the plasma membrane
integrity within the experimental time frame. As cytotoxic effects were evident in
susceptible cells within just 90 min of exposure to EA3, taken together, these results
suggest that the observed EA3-induced could be due to apoptosis, as it is unlikely to be due
to necrosis. However, further experiments to corroborate these findings are necessary.
Accordingly, some possible future directions are considered in the General Discussion
which follows the next and final experimental chapter.

~ Chapter 7 ~ 255
Chapter 7: Two Different Biodiscovery Strategies
7.1 INTRODUCTION
As discussed in Chapter 1, the enviable record of successful hits from naturally derived
compounds bears witness to the argument that bioprospecting is an excellent approach to
drug discovery (Clardy & Walsh, 2004; Newman & Cragg, 2007). Indeed, despite an
overall deviance towards HTS and CC in the 1980s and ‗90s, Big Pharma companies
including Novartis, Merck, Pfizer, Wyeth and Bristol Myers Squibb maintained drug
screening programmes based on bioprospecting during this period as the advantages of this
traditional method of drug discovery over more modern techniques were recognised (CBD,
2008). Other pharmaceutical companies have renewed their strategies in favour of natural
product (NP) drug development and discovery (Patwardhan et al., 2005). Moreover,
advances in instrumentation, robotics, and bioassay technology have improved the speed of
purification and characterization processes, which have promoted renewed interest in
bioprospecting amongst other researchers (Butler, 2004; Svarstad, 2005; Baker et al., 2007;
Laird et al., 2008).
Approaches to selecting appropriate NPs for screening potential new bioactive compounds
range from random selection to more guided selection strategies, such as the
ethnopharmacological approach (Cordell et al., 1991; Shoemaker et al., 2005; McRae et al.,
2007). The random approach is basically a numbers game and is, therefore, more suited to
large companies with lots of money and resources. In contrast, more time-consuming
selection strategies guided by prior information about chemical make-up, traditional
ethomedical use or other clues have generally been the domain of academic institutions and
small biotechnology operators. While the typical industrial drug discovery process

256 ~ Chapter 7 ~
uses medium to high-throughput bioassay screening platforms to find promising
compounds for a specific biological target, ethnopharmacology uses almost the opposite
approach, whereby anecdotal efficacy of medicinal plants is tested in the laboratory
(Gertsch, 2009).
As the title of this thesis asserts, the overall objective of this project was to use traditional
Aboriginal medical knowledge as a guide to identifying plants that may be helpful in the
treatment of cancer. To this end, extracts of plants identified by local Aboriginal people as
having medicinal properties were evaluated for their anticancer potential. This screening
programme and the subsequent analyses of bioactive compounds form the basis of Chapters
4 to 6. However, it was also of interest to compare this ethnopharmacological tactic to
screening with a more random approach in order to provide evidence for the hypothesis that
the ethnopharmacological method does, indeed, provide a greater chance of success. Hence,
this chapter is concerned with screening a randomly selected NP sample for cytotoxic
activity in cancer cells and comparing this to the effects of a sample with purported
medicinal properties.
7.1.1 Random approach
The first samples to be examined in this study were extracts of a marine sponge with no
known ethnomedical use. Besides plants, many other relatively available organisms have
evolved biosynthetic pathways containing a vast array of NPs which enable them to adapt
to a specific lifestyle. For example, marine invertebrates, such as sponges, are sessile
organisms that rely on chemical defence systems for protection against predators. Certain
sponges also produce other secondary metabolites including those that help prevent
infections, facilitate reproduction and protect from ultraviolet radiation (Shimizu, 1985).

~ Chapter 7 ~ 257
Thus, marine sponges are potentially a rich source of therapeutically useful bioactive
compounds. Indeed, already a plethora of pharmacologically valuable novel NPs obtained
from some sponges have been reported. Biological activities described so far include
antifungal, antibacterial, anticancer, antiviral, antimalarial, antiinflammatory, anticoagulant,
antituberculosis and immunosuppressive actions (Sipkema et al., 2005).
7.1.2 Guided approach
The second samples screened were extracts of the plant, Haemodorum spicatum. This
perennial herbaceous geophyte (bulb), is endemic to south-west Western Australia
(Paczkowska, 1994; Woodall et al., 2010). Commonly known as bloodroot due to the deep
red colour of its bulbs (Clarke, 2007), Aboriginal names for H. spicatum include mardja,
meen, born and bohn, depending on location (Paczkowska, 1994; Daw et al., 1997;
Woodall et al., 2010). These bulbs were an important resource for local Aboriginal people.
They were traditionally used as food, eaten either raw or roasted or ground up and used as a
spice (Clarke, 2007; Flugge, 2009). Additionally, when cut, crimson red gelatin exuded
from the bulbs and this could be used as a dye (Daw et al., 1997; Flugge, 2009). There are
also reports of extracts of the bulbs of various Haemodorum species being used as
medicines (Dias et al., 2009). For example, H. spicatum was used as a remedy for
dysentery while H. corymbosum was used to treat snakebite (Bindon, 1996; Lassak &
McCarthy, 2001). More significantly to this study, the compound responsible for the red
pigmentation, haemocorin, has demonstrated antibacterial activity as well as purported
antitumour activity (Cooke & Segal, 1955; Simpson, 1990; Daw et al., 1997; Harborne et
al., 1999; Dias et al., 2009). As bulbs from different geographical regions display varying
degrees of colour (Woodall et al., 2010) it was hypothesised that they would show
corresponding variation in cytotoxicity against cancer cells.
258 ~ Chapter 7 ~
7.2 METHODOLOGY
For both sets of samples, the MTT assay (Section 2.6.1) was employed to screen for
bioactivity.
The negative control was the vehicle only, DMSO or methanol, at the same final
concentration as in the sample. Methanol was used to dissolve powdered bulbs in later
experiments as data (not shown) from a preliminary experiment in which fresh bulbs were
steeped in methanol showed some bioactivity, albeit at very high concentrations
(6 mg/mL).
Positive controls employed were deferoxamine mesylate (DFO) and deferriprone (L1) at
1 mM, camptothecin (CPT) and 5-fluorouracil (5FU) at 100 µM, and paclitaxel (PAC),
vinblastine sulfate (VIN) and etoposide (ETO) at 10 µM final concentrations. To induce
total cytotoxicity, 1 mg/mL HgCl2 and 0.1% TX-100 were incubated with cells.
7.2.1 Random approach
A sample of a marine sponge of unknown taxonomy was collected randomly from Nelson
Bay, NSW, Australia (32° 43′ S, 152° 08′ E) in February 2008 by Dr Ian van Altena
(University of Newcastle). Frozen samples were stored at –8 °C prior to analysis. A
voucher specimen was retained at the University of Newcastle.
Extraction of this sponge was performed by Ms Jessie Moniodis, an Honours candidate
within the Discipline of Pharmacy (UWA). Details of the extraction procedure can be found
in Appendix L. Briefly, the freeze dried sponge was crumbled manually and extracted with
methanol. The crude methanolic extract was prefractionated and separated using various
solvents. Subsequent fractions were dried under reduced vacuum and labeled 1-8. Sample 7
was the parent compound of samples 3, 4, 5, 6 and 8.
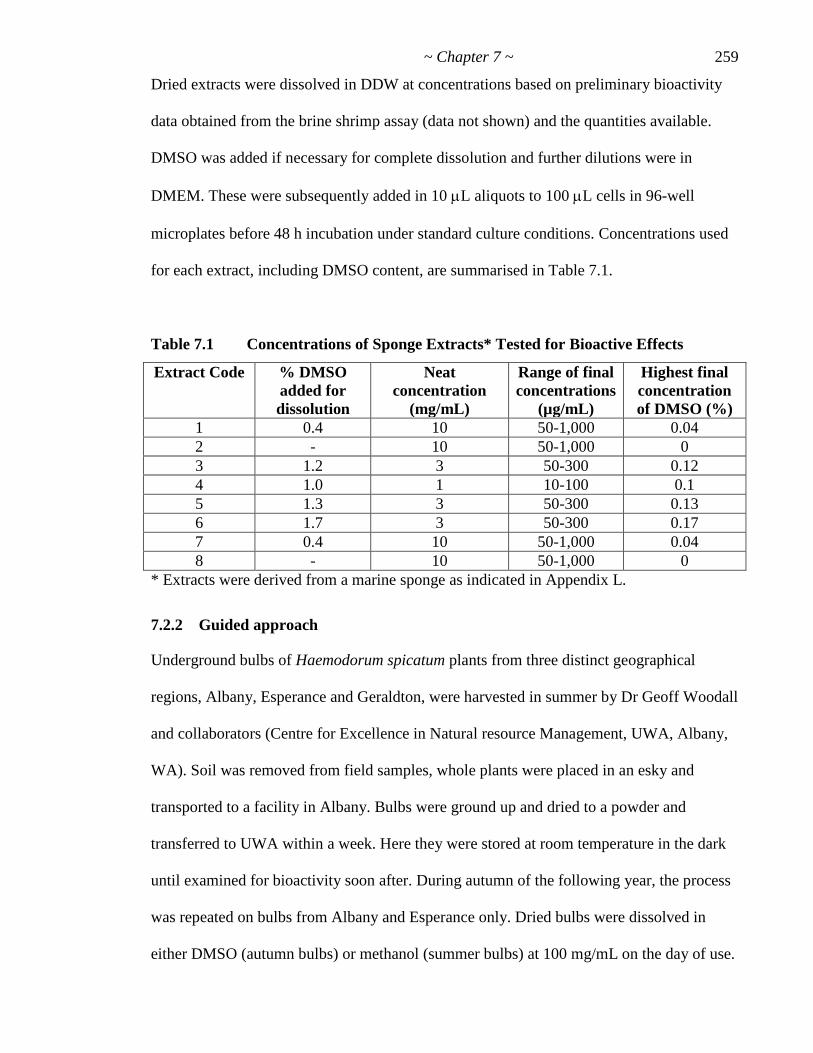
~ Chapter 7 ~ 259
Dried extracts were dissolved in DDW at concentrations based on preliminary bioactivity
data obtained from the brine shrimp assay (data not shown) and the quantities available.
DMSO was added if necessary for complete dissolution and further dilutions were in
DMEM. These were subsequently added in 10 L aliquots to 100 L cells in 96-well
microplates before 48 h incubation under standard culture conditions. Concentrations used
for each extract, including DMSO content, are summarised in Table 7.1.
Table 7.1 Concentrations of Sponge Extracts* Tested for Bioactive Effects
Extract Code % DMSO
added for
dissolution
Neat
concentration
(mg/mL)
Range of final
concentrations
(µg/mL)
Highest final
concentration
of DMSO (%)
1 0.4 10 50-1,000 0.04
2 - 10 50-1,000 0
3 1.2 3 50-300 0.12
4 1.0 1 10-100 0.1
5 1.3 3 50-300 0.13
6 1.7 3 50-300 0.17
7 0.4 10 50-1,000 0.04
8 - 10 50-1,000 0
* Extracts were derived from a marine sponge as indicated in Appendix L.
7.2.2 Guided approach
Underground bulbs of Haemodorum spicatum plants from three distinct geographical
regions, Albany, Esperance and Geraldton, were harvested in summer by Dr Geoff Woodall
and collaborators (Centre for Excellence in Natural resource Management, UWA, Albany,
WA). Soil was removed from field samples, whole plants were placed in an esky and
transported to a facility in Albany. Bulbs were ground up and dried to a powder and
transferred to UWA within a week. Here they were stored at room temperature in the dark
until examined for bioactivity soon after. During autumn of the following year, the process
was repeated on bulbs from Albany and Esperance only. Dried bulbs were dissolved in
either DMSO (autumn bulbs) or methanol (summer bulbs) at 100 mg/mL on the day of use.

260 ~ Chapter 7 ~
Samples were diluted in appropriate culture medium to give a range of concentrations from
6 mg/mL to 0.03 mg/mL (w/v). These were subsequently added in 10 L aliquots to
100 L cells in 96-well microplates and incubated for 48 h under standard conditions as
used in previous chapters. In preliminary studies autumn bulbs were assessed for their
ability to inhibit the proliferation of the two human breast cancer cell lines, MDA-MB-468
and MCF7, only. Summer bulbs were tested against these two cell lines as well as five
other human cancer cell lines, Caco-2, MM253, A549, PC3 and DU145.
7.3 RESULTS
7.3.1 Random approach
The random sponge sample known as 080211NB09 had a tawny exterior and a dense
packing which appeared dullish grey and was highly porous (Figure 7.1).
Figure 7.1 Marine sponge sample 080211NB09.
A photograph of the marine sponge sample collected from Nelson Bay, NSW, in February
2008. No sizing information was available.
~ Chapter 7 ~ 261
The antiproliferative effects of extracts of the sponge were assessed against a panel of
cancer cell lines and one non-tumourigenic line, MRC5 (Fig. 7.2). It must be noted that
after the extraction procedures, only small quantities of each extract were obtained. As
most of this was required for experiments pertaining to Ms Moniodis‘s Honours project,
very little was available for these screening studies and optimal concentrations for each
extract could not be established.
As can be seen from Fig 7.2, the most potent extract in terms of its antiproliferative ability
was Extract 4, which produced the steepest curve. With the exception of Caco-2 cells,
100 µg/mL of this extract was enough to cause greater than 50% inhibition of proliferation
in every cell line tested, including MRC5.
The greatest single level of inhibition of proliferation was obtained using 300 µg/mL of
Extract 3. At this concentration, this extract resulted in >90% inhibition in all cancer cell
lines and >80% inhibition of proliferation of MRC5 cells. At 100 µg/mL, >25% inhibition
was achieved in four cell lines, A549, PC3, DU145 and MRC5.
Extract 6 showed a range of bioactivity across all cell lines. While still causing some
inhibition of proliferation in other cell lines, 300 µg/mL of Extract 6 resulted in PC3 cell
proliferation of only 12% of the control. The inhibitory effect of this concentration ranged
upwards from this value for other cell lines to be 72% and 78% for MRC5 and Caco-2
cells, respectively. At 200 µg/mL, inhibition of proliferation was nearly 60% in MDA-MB-
468, A549 and PC3 cells, while there was no effect in MRC5 cells. Lower concentrations
generally resulted in higher % control values, indicating dose-dependence. Similar results
were obtained with Extract 5, the most susceptible cell lines being MM253, A549 and PC3.
Extract 7 caused some inhibition of proliferation of all cell lines at higher concentrations.

262 ~ Chapter 7 ~
0 100 200 300 400 5000
25
50
75
100
125
150 MDA-MB-468
Concentration (g/mL)
% C
on
tro
l
0 200 400 600 800 10000
25
50
75
100
125
150MCF7
Concentration (g/mL)
% C
on
tro
l
0 200 400 600 800 10000
25
50
75
100
125
150Caco-2
Concentration (g/mL)
% C
on
tro
l
0 200 400 600 800 10000
25
50
75
100
125
150MM253
Concentration (g/mL)
% C
on
tro
l
0 200 400 600 800 10000
25
50
75
100
125
150A549
Concentration (g/mL)
% C
on
tro
l
0 200 400 600 800 10000
25
50
75
100
125
150PC3
Concentration (g/mL)
% C
on
tro
l
0 200 400 600 800 10000
25
50
75
100
125
150DU145
Concentration (g/mL)
% C
on
tro
l
0 200 400 600 800 10000
25
50
75
100
125
150 MRC5
Concentration (g/mL)
% C
on
tro
l
Figure 7.2 Effects of extracts of marine sponge on proliferation of cancer cell lines.
Cancer cells were exposed to a range of concentrations of various extracts, 1 (▲), 2 (■),
3 (○), 4, (■), 5 (●), 6 (●), 7 (▲) or 8 (■), of a marine sponge for 48 h. The MTT assay
was used to assess changes in cell proliferation. Results are expressed as % of control
values and are the means ± SE of quadruplicate wells from two separate experiments.

263
Where possible, IC50 values were calculated from fitted nonlinear regression dose-response
(variable slope) curves of log-transformed concentrations (Fig 7.3). These are presented
along with their corresponding 95% confidence intervals and r2 values in Table 7.2. The
Top- and Bottom-fixed model described in section 4.3.3 was the optimum model in all
cases. Numbers in red represent IC50 values >15% above the highest concentration of that
extract tested. As this means the programme performed extrapolation beyond the tested
range, these values are not necessarily reliably accurate.
Extracts 1, 2 and 8 caused little or no inhibition of proliferation in any cell line over the
concentration ranges tested, thus IC50 values were not calculated for these extracts.

264 ~ Chapter 7 ~
0.0 0.5 1.0 1.5 2.0 2.5 3.00
25
50
75
100
125MDA-MB-468
Log of Concentration (g/mL)
% C
on
tro
l
0.0 0.5 1.0 1.5 2.0 2.5 3.00
25
50
75
100
125MCF7
Log of Concentration (g/mL)
% C
on
tro
l
0.0 0.5 1.0 1.5 2.0 2.5 3.00
25
50
75
100
125Caco-2
Log of Concentration (g/mL)
% C
on
tro
l
0.0 0.5 1.0 1.5 2.0 2.5 3.00
25
50
75
100
125MM253
Log of Concentration (g/mL)
% C
on
tro
l
0.0 0.5 1.0 1.5 2.0 2.5 3.00
25
50
75
100
125A549
Log of Concentration (g/mL)
% C
on
tro
l
0.0 0.5 1.0 1.5 2.0 2.5 3.00
25
50
75
100
125PC3
Log of Concentration (g/mL)
% C
on
tro
l
0.0 0.5 1.0 1.5 2.0 2.5 3.00
25
50
75
100
125DU145
Log of Concentration (g/mL)
% C
on
tro
l
0.0 0.5 1.0 1.5 2.0 2.5 3.00
25
50
75
100
125MRC5
Log of Concentration (g/mL)
% C
on
tro
l
Figure 7.3 Nonlinear regressions of sponge extracts.
Dose-responses for extracts 3 (○), 4, (■), 5 (●), 6 (●) and 7 (▲) for each cell line from
Fig. 7.2. Concentrations were transformed into log10 values and curves were fitted using
GraphPad Prism nonlinear regression dose-response (variable slope with the top parameter
set at 100%and the bottom parameter fixed at 0%.

265
Table 7.2 IC50 Values Calculated Using Top- and Bottom-Fixed Model for
Individual Cell Line and Extract Combinations
MDA-MB-468 MCF7
Extract IC50
(g/mL)
IC50 Range
(95% CI)
r2 IC50
(g/mL)
IC50 Range
(95% CI)
r2
3 323.4 76.9 – 1359 0.517 426.8 74.4 – 2450 0.400
4 70.2 36.1 – 136.7 0.835 164.4 101.9 – 265.3 0.865
5 266.7 167.6 – 424.5 0.861 442.6 272.5 – 718.8 0.834
6 131.3 42.8 – 403.0 0.505 703.8 646.6 – 766.1 0.991
7 559.4 148.7 – 2105 0.723 2145 1176 – 3915 0.600
Caco-2 MM253
Extract IC50
(g/mL)
IC50 Range
(95% CI)
r2 IC50
(g/mL)
IC50 Range
(95% CI)
r2
3 574.4 61.1 – 5404 0,326 315.3 118.4 – 839.5 0.662
4 339.3 115.3 – 999.1 0.483 71.0 42.8 – 118.0 0.882
5 2591 215.0 – 31221 0.256 137.8 112.2 – 169.3 0.972
6 2233 391.9 – 12725 0.344 344.2 238.4 – 497.0 0.898
7 3354 255.4 – 44033 0.272 1056 583.3 – 1910 0.878
A549 PC3
Extract IC50
(g/mL)
IC50 Range
(95% CI)
r2 IC50
(g/mL)
IC50 Range
(95% CI)
r2
3 125.8 63.6 – 248.7 0.828 137.1 64.0 – 293.8 0.793
4 61.6 50.0 – 75.8 0,977 48.9 38.6 – 61.8 0.972
5 177.7 142.1 – 222.2 0.975 199.4 154.7 – 257.0 0.966
6 147.9 117.0 –187.0 0.970 116.3 77.4 – 174.9 0.930
7 977.1 509.8 – 1873 0.822 798.7 519.8 –1227 0.884
DU145 MRC5
Extract IC50
(g/mL)
IC50 Range
(95% CI)
r2 IC50
(g/mL)
IC50 Range
(95% CI)
r2
3 161.2 78.2 – 332.5 0.790 174.4 105.4 – 288.7 0.860
4 47.1 33.0 – 67.1 0.951 49.4 22.7 – 107.2 0.860
5 270.4 143.0 – 511.1 0.820
6 307.9 282.1 – 336.1 0.992
7 747.5 341.0 – 1639 0.816 526.8 334.7 – 829.2 0.936
IC50 values were calculated for five extracts of marine sponge against various cell lines
using the top- and bottom- fixed parameter model in GraphPad Prism.
Numbers in red represent IC50 values >15% above the highest concentration of extract
tested and therefore are considered possibly inaccurate.

266 ~ Chapter 7 ~
7.3.2 Guided approach
Figure 7.4 shows H. spicatum bulbs from Albany and Esperance both whole and in cross-
section.
Figure 7.4 Haemodorum spicatum bulbs from different regions.
Underground H. spicatum bulbs were collected from Geraldton or Esperance. Soil was
removed and photographs taken of whole bulbs (left) or after longitudinal cross-sectioning
(right). The sizing bars on white cards indicate 1 cm lengths.
Clearly, there was a distinct difference in pigmentation of bulbs from Albany compared to
those from Esperance. Samples from Albany display a deeper red hue compared to their
counterparts from Esperance, which are more orange. The depth of colour did not appear to
change according to season (Woodall, G., personal communication, 3rd
March 2010).
The effects of H. spicatum extracts obtained from three different geographical regions,
Albany, Esperance or Geraldton, on the proliferation of two breast cancer cell lines, MDA-
MB-468 and MCF7 are depicted in Figure 7.5.

~ Chapter 7 ~ 267
1 10 100 10000
25
50
75
100
125
150
0
MDA-MB-468
*
Concentration (g/mL)
% C
on
tro
l
1 10 100 10000
25
50
75
100
125
150
0
MCF7
Concentration (g/mL)
% C
on
tro
l
Figure 7.5 Effects of H. spicatum extracts from different regions
on proliferation of two breast cancer cell lines.
MDA-MB-468 and MCF7 cells were exposed for 48 h to a range of concentrations of dried
autumn bulbs from Albany (●), Esperance (▲) or Geraldton (■) dissolved in DMSO and
diluted accordingly in medium. The MTT assay was used to assess changes in cell
proliferation. Results are expressed as % of control values and are the means ± SE of
quadruplicate wells from three different samples collected from the same region (Esperance
and Geraldton) or the means ± SE of quadruplicate wells of a single sample (Albany).
* denotes significantly different from DMSO control (P<0.01).

268 ~ Chapter 7 ~
It is clear from Figure 7.5 that only the sample from Albany had any effect on either cell
line over the concentration range tested. At 1,000 g/mL, the highest concentration used,
the proliferation of MDA-MB-468 cells was inhibited by more than 65%. Using a one-way
ANOVA and Dunnet‘s Multiple Comparisons Test, this was the only significantly different
value from the DMSO control (P<0.01).
Samples collected from Albany and Esperance in summer of the following year were also
tested for bioactivity, this time against a larger panel of human cancer cell lines. These
bulbs were dissolved in methanol on the day of use and diluted accordingly before being
subjected to the MTT assay for evaluation of their effects on cancer cell proliferation. The
results of these dose-response experiments are shown in Figure 7.6.
From Figure 7.6 it is evident that neither the H. spicatum samples from Albany or
Esperance caused any significant effect. While the highest concentration of the Albany
sample, 6 mg/mL, caused some reduction in proliferation of MCF7 and PC3 cells, neither
of these values was statistically significant from the negative control (P>0.05).
This general lack of bioactivity is perhaps more obvious from Figure 7.7, which shows the
effects of just the highest concentration of extracts, 6 mg/mL, on all the cell lines in the
panel compared to the positive controls DFO, L1 and CPT.
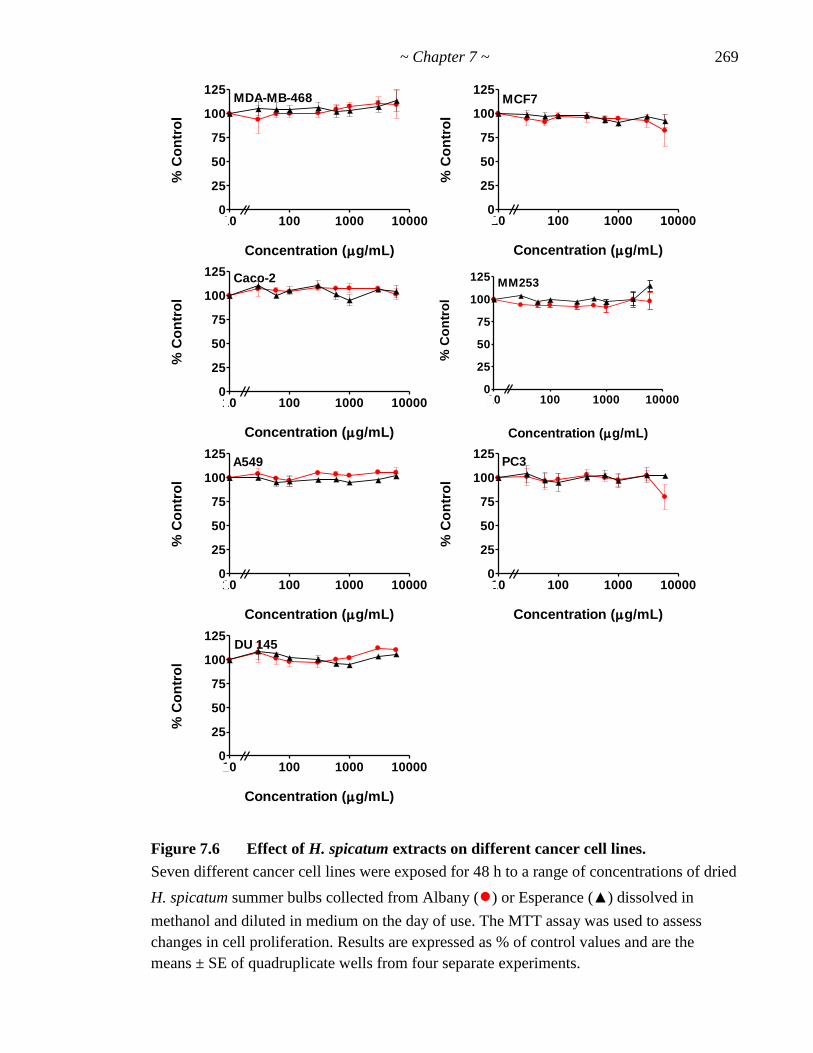
~ Chapter 7 ~ 269
10 100 1000 100000
25
50
75
100
125MDA-MB-468
Concentration (g/mL)
% C
on
tro
l
10 100 1000 100000
25
50
75
100
125MCF7
Concentration (g/mL)
% C
on
tro
l
10 100 1000 100000
25
50
75
100
125Caco-2
Concentration (g/mL)
% C
on
tro
l
10 100 1000 100000
25
50
75
100
125MM253
Concentration (g/mL)%
Co
ntr
ol
10 100 1000 100000
25
50
75
100
125A549
Concentration (g/mL)
% C
on
tro
l
10 100 1000 100000
25
50
75
100
125PC3
Concentration (g/mL)
% C
on
tro
l
10 100 1000 100000
25
50
75
100
125DU 145
Concentration (g/mL)
% C
on
tro
l
Figure 7.6 Effect of H. spicatum extracts on different cancer cell lines.
Seven different cancer cell lines were exposed for 48 h to a range of concentrations of dried
H. spicatum summer bulbs collected from Albany (●) or Esperance (▲) dissolved in
methanol and diluted in medium on the day of use. The MTT assay was used to assess
changes in cell proliferation. Results are expressed as % of control values and are the
means ± SE of quadruplicate wells from four separate experiments.

270 ~ Chapter 7 ~
MDA-M
B-4
68
MCF7
Cac
o-2
MM
253
A54
9PC3
DU 1
450
25
50
75
100
125%
Co
ntr
ol
Figure 7.7 Effect of H. spicatum extracts on different cancer cell lines.
Cancer cell lines were exposed to H. spicatum summer bulbs from Albany (■) or
Esperance (■) at 6 mg/mL (w/v) in methanol or 1 mM of DFO (□), L1( ) or 100 M
CPT ( ) for 48 h before changes in proliferation was assessed by the MTT assay. Results
are expressed as % of control values and are the means ± SE of quadruplicate wells from at
least three separate experiments.

~ Chapter 7 ~ 271
Other positive controls used, namely 100 M 5FU and 10 M PAC, VIN and ETO, also
inhibited proliferation of all cancer cell lines tested to a greater degree than the H.
spicatum sample from Albany. These data are not included in the figure for the sake of
brevity. HgCl2 and TX-100 caused 100% cell death.
7.4 DISCUSSION
7.4.1 Random approach
It must be emphasised that the collection and subsequent extraction of sponge material
was performed by others, who generously provided me with a limited supply of material
for testing in these cytotoxicity screening studies. Unfortunately, this meant, once
depleted, no further samples were available for assessment.
The extracts of marine sponge assessed for bioactivity in these experiments were chosen
based on preliminary data and availability by a collaborator, Ms Jessie Moniodis
(Pharmacy, UWA). Ms Moniodis showed that some of these extracts were cytotoxic to
brine shrimp (see section 2.7.2.1) and the concentrations chosen were based on her data.
Some promising data were gathered despite having only enough sample for two
experiments. For example, Extract 6 caused strong inhibitory effects in PC3 cells while
having little effect against MRC5 cells, suggesting selectivity. A similar trend, albeit not
as strong activity, was also recorded for this extract in some other cancer cell lines.
Similarly, Extract 5 was also somewhat selective, but its activity was generally not as
potent.
Extract 3 was also very potent at inhibiting the proliferation of every cell line tested.
Indeed, at 300 µg/mL, Extract 3 caused almost total inhibition of A549 and PC3 cells,
while inhibiting the others by at least 20%. Unfortunately, this was also the case for the
non-tumourigenic cell line, MRC5 cells, suggesting the effect was likely due to a non-
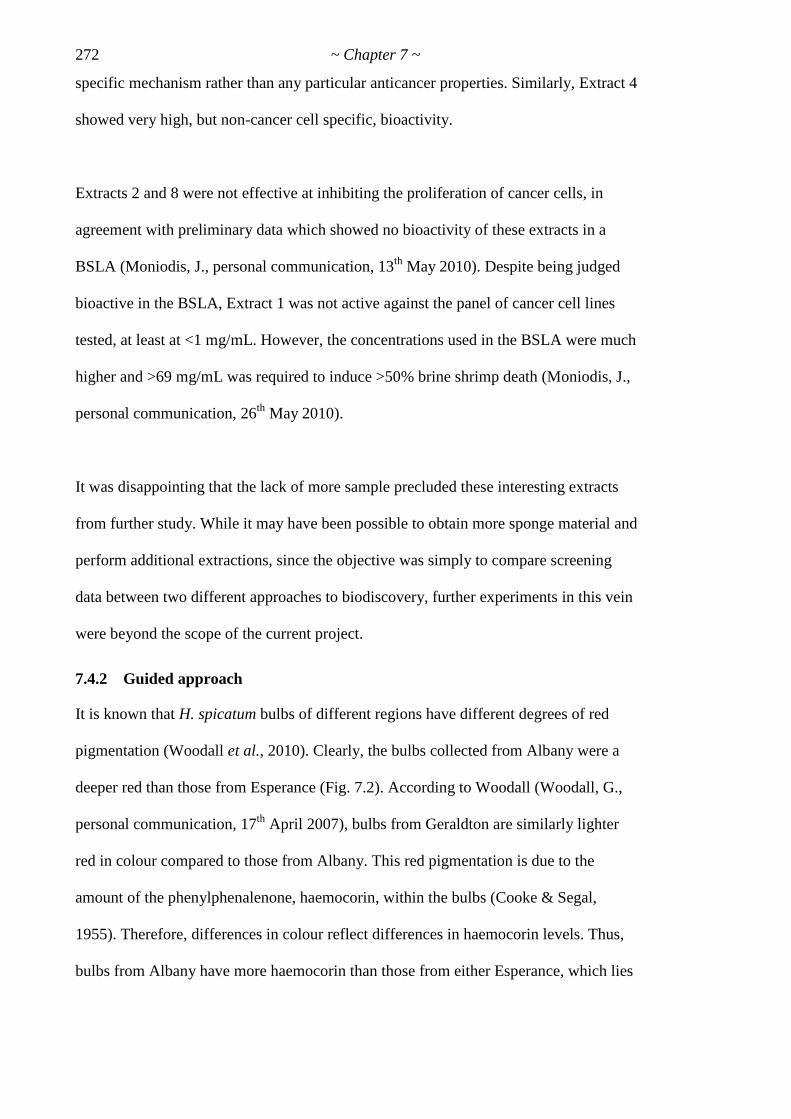
272 ~ Chapter 7 ~
specific mechanism rather than any particular anticancer properties. Similarly, Extract 4
showed very high, but non-cancer cell specific, bioactivity.
Extracts 2 and 8 were not effective at inhibiting the proliferation of cancer cells, in
agreement with preliminary data which showed no bioactivity of these extracts in a
BSLA (Moniodis, J., personal communication, 13th
May 2010). Despite being judged
bioactive in the BSLA, Extract 1 was not active against the panel of cancer cell lines
tested, at least at <1 mg/mL. However, the concentrations used in the BSLA were much
higher and >69 mg/mL was required to induce >50% brine shrimp death (Moniodis, J.,
personal communication, 26th
May 2010).
It was disappointing that the lack of more sample precluded these interesting extracts
from further study. While it may have been possible to obtain more sponge material and
perform additional extractions, since the objective was simply to compare screening
data between two different approaches to biodiscovery, further experiments in this vein
were beyond the scope of the current project.
7.4.2 Guided approach
It is known that H. spicatum bulbs of different regions have different degrees of red
pigmentation (Woodall et al., 2010). Clearly, the bulbs collected from Albany were a
deeper red than those from Esperance (Fig. 7.2). According to Woodall (Woodall, G.,
personal communication, 17th
April 2007), bulbs from Geraldton are similarly lighter
red in colour compared to those from Albany. This red pigmentation is due to the
amount of the phenylphenalenone, haemocorin, within the bulbs (Cooke & Segal,
1955). Therefore, differences in colour reflect differences in haemocorin levels. Thus,
bulbs from Albany have more haemocorin than those from either Esperance, which lies

~ Chapter 7 ~ 273
390 km NE, or Geraldton, approximately 760 km NNW of Albany. Variations could be
due to local soil conditions, microclimate and/or genetic differences.
In a preliminary experiment, dried H. spicatum bulbs collected from Albany, Esperance
or Geraldton and dissolved in DMSO had little effect on the proliferation of the two
human breast cancer cell lines, MDA-MB-468 and MCF7 (Fig. 7.4). Only the sample
from Albany showed any significant bioactivity, and this was just at the highest
concentration tested (1,000 g/mL) and in MDA-MB-468 cells only. Additionally, no
dose-dependency was apparent. Hence, the H. spicatum experiments were put on hold
until fresh samples became available the following year.
Figures 7.5 and 7.6 depict the effects of H. spicatum bulb samples collected from
Albany and Esperance. Clearly, besides a moderate (but not significant) effect in MCF7
and PC3 cells by the sample from Albany, no bioactivity was evident against the panel
of cell lines over the range of concentrations tested. Given the positive controls were
capable of inhibiting proliferation of every cell line, it must be assumed that the system
was working and the findings were credible.
Therefore, there was no evidence that bulbs from different regions had differential
cytotoxic effects, despite their variability in colour. This would seem to undermine the
claim that haemocorin has antitumour activity (Daw et al., 1997). However, it may
simply be that the levels of haemocorin were not high enough in the bulbs, even the
reddest ones from Albany, to cause a detectable effect, or that the extraction process
failed to isolate or enrich for the antitumour compound. In order to test this, it would be
necessary to develop an assay to quantitate the levels of haemocorin in samples instead
of simply relying on a colour judgment. The cytotoxic activity of known amounts of
pure haemocorin could then be measured and compared to the amount of haemocorin in

274 ~ Chapter 7 ~
bulbs from different regions and seasons. However, this was beyond the scope of the
present research.
Another possibility is that by the time the samples arrived from Albany (5 days), the
haemocorin had oxidised, resulting in a loss of bioactivity. This notion was
strengthened by an experiment in which a methanol sample of bulbs from Albany was
tested a short time after collection and then again one year later. Moderate bioactivity
present in the fresh sample was lost upon storage (data not shown). This effect was
thought to have been due to the oxidation of haemocorin during that period. However,
there was no obvious loss in colour of the sample to support this theory.
Alternatively, perhaps the haemocorin in H. spicatum is in the wrong chemical form to
cause any anticancer effects. According to Harborne et al. (1999), the aglycone of
haemocorin displays antitumour effects, but it is the cellobioside that is present in a
close relative of H. spicatum, Haemodorum corymbosum. If this is also the case in H.
spicatum, that may explain the lack of bioactivity shown.
Then again, perhaps another compound in the crude extract masked, or even
antagonised, the cytotoxic activity of the haemocorin. Such interactions are common
when crude extracts are screened and is one of the arguments against bioprospecting
(Farnsworth & Bingel, 1977). On the other hand, sometimes the ingredients of mixtures
act synergistically and bioactivity is lost upon isolation of the active ingredient
(Houghton et al., 2007). These interactions and their possible significance to the
samples evaluated in this thesis, as well as to bioprospecting in general, will be
discussed further in the next chapter.

~ Chapter 7 ~ 275
7.4 SUMMARY
In Chapter 4 of this thesis it was demonstrated that of the plant species identified by
local Aboriginal people as having a traditional medical use, over half displayed
bioactivity in initial screening studies. This chapter aimed to compare the confirmed
high success rate of the ethnopharmacological approach to drug screening with a less
guided approach. To this end, various extracts of a randomly harvested marine sponge
of unknown taxonomy were assessed for their effects on a panel of human cancer cell
lines. Out of eight extracts tested, two displayed some moderate, selective cytotoxic
activity for cancer cells. In contrast, bulbs of the native plant, H. spicatum, were also
tested and found to have no discernible bioactivity, despite its traditional medicinal use
and published claims that a major constituent has possible antitumour effects. Overall,
then, these results do not support the hypothesis that guided approaches to biodiscovery,
such as choosing samples based on ethnomedical knowledge, are superior to random
sampling as measured by their hit rate in screening studies. However, it must be
remembered that the final concentrations of H. spicatum and sponge extracts were not
equal. Moreover, since the sample size was just two, these results provide only
anecdotal evidence at best.

276 ~ Chapter 7 ~

~ Chapter 8 ~ 277
Chapter 8: General Discussion
This chapter seeks to integrate the elements of the foregoing chapters and to discuss the
significance of the study. Additionally, issues and limitations raised in the main body
will be discussed in more depth. Some possible future research directions will also be
suggested. However, to do that, it is first necessary to summarise the major findings of
each of the experimental chapters. While these summaries are basically duplications of
those appearing at the end of each results chapter, they are reproduced again here in one
place amongst outlines of every chapter to highlight how each chapter links to the next,
making clear the framework for the entire study.
8.1 SUMMARIES
8.1.1 Chapter 1: General Introduction
In Chapter 1, a broad overview of the published literature surrounding the three broad
themes of cancer, drug discovery and ethnopharmacology was provided. In reviewing
the relevant literature, a rationale for the current project was developed.
8.1.2 Chapter 2: Materials and Methods
A basic materials and methods section, this chapter provided a portal for common
procedures used in the experiments described in later chapters.
8.1.3 Chapter 3: Optimisation of Experimental Techniques
This chapter described the validation and optimisation of the experimental design.
Firstly, the panel of cell lines chosen was justified and their growth characteristics
defined in order to optimise the culture conditions required for experiments. Secondly,
the rationale for choosing the MTT assay to monitor cytotoxic effects of test agents was
provided, and the refinement of the routine procedure hitherto employed in this
laboratory was recounted. Next, the suitability of DMSO as a vehicle was examined and
shown to be appropriate. Finally, a fitting positive control, DFO, was chosen from a

278 ~ Chapter 8 ~
range of potentially suitable compounds. From these studies, a standard protocol was
devised which was used in subsequent experiments to evaluate the cytotoxic activity of
extracts of plants traditionally used as medicines by Aboriginal people.
8.1.4 Chapter 4: Preliminary Screening of Plant Extracts
A total of 25 plants from two distinct areas were chosen for evaluation of their
anticancer potential based on traditional Indigenous medical knowledge of those
species. Relevant plant parts were harvested and crude methanolic extracts derived.
These plant extracts were assessed for their bioactivity against four different human
cancer cell lines using the MTT assay to measure changes in cell proliferation.
Preliminary screening narrowed the field to a pool of 16 promising extracts which were
assessed for their dose-responses against the same four cell lines. Based on these data, 6
extracts were chosen for more thorough assessment of their effects, including
morphological changes, the speed of their actions and their dose-response relationships
against a panel of several more cancer cell lines and one non-cancerous cell line. These
six extracts exhibited differences between each other and between cell lines, indicating
a degree of selectivity. The most promising four of these methanolic extracts, 5, 6, 21
and 28 were chosen for further evaluation, the results of which constitute Chapter 5.
8.1.5 Chapter 5: Evaluation of Most Promising Plant Extracts
More plant samples of those with the most bioactive methanolic extracts in the initial
screen were collected. These were extracted to give aqueous, methanol or ethyl acetate
fractions which were subjected to various chemical analyses and assessed for their
specificity and selectivity against cancer cells. On the basis of these cytotoxicity studies,
the extract with the greatest potential as an anticancer agent, the ethyl acetate extract of
Eremophila duttonii (EA3), was chosen for further study, which was the focus of the
following chapter.
~ Chapter 8 ~ 279
8.1.6 Chapter 6: Further Evaluation of Plant Extract, EA3
The results of experiments undertaken in Chapter 6 suggested that EA3 causes
cytotoxicity in some cancer cell lines and yet has only cytostatic effects in others,
illustrating a degree of selectivity. Both cytotoxicity and cytostaticity are possibly
attributable to the actions of two or its major constituents, the flavonoids luteolin and
quercetin, acting synergistically. However, it is also possible that the observed effects of
EA3 are due to other known or novel compounds. EA3-induced cytotoxicity appears to
be mediated via Ca2+
signalling processes as EA3 clearly induced a transient rise in
[Ca2+
]i in PC3 cells within minutes of their exposure to this extract. The Ca2+
response
was biphasic which is consistent with release of Ca2+
from internal stores followed by
extracellular Ca2+
influx. The pattern of the trace also indicates that the elevated [Ca2+
]i
was unlikely to be due to sudden chemical damage to the cells as there was no evidence
of a breach in the plasma membrane integrity within the experimental time frame. As
cytotoxic effects were evident in susceptible cells within just 90 min of exposure to
EA3, taken together, these results suggest that the observed EA3-induced cytotoxicity is
likely due to apoptosis, not necrosis.
8.1.7 Chapter 7: Two Different Biodiscovery Strategies
This chapter aimed to compare the confirmed high success rate of the
ethnopharmacological approach to drug screening with a less guided approach. To this
end, various extracts of a randomly harvested marine sponge of unknown taxonomy
were assessed for their effects on a panel of human cancer cell lines. Out of eight
extracts tested, two displayed some moderate, selective cytotoxic activity against cancer
cells. In contrast, bulbs of the native plant, H. spicatum, were also tested and found to
have no discernible bioactivity over the concentration range studied, despite its
traditional medicinal use and published claims that a major constituent has possible
antitumour effects. Overall, then, these results do not support the hypothesis that guided

280 ~ Chapter 8 ~
approaches to biodiscovery, such as choosing samples based on ethnomedical
knowledge, are superior to random sampling as measured by their hit rate in screening
studies.
8.2 DISCUSSION
8.2.1 Significance
Aboriginal people living in traditional communities had an encyclopaedic knowledge of
Australian plants and animals and of the seasonal changes of their environment. They
knew, for example, that when the bat-wing coral trees flowered, it was time to go and
dig mangrove crabs out of the mud. The Aboriginal awareness of life cycles of animals
and plants was gathered over thousands of years and was understood by everyone in the
community. Despite not being written down, it was shared from generation to
generation through example, song and dance so that every child learnt the significance
of the natural signs. This TK was specific for each local area and covered not only food
resources, but extended to the medical uses of various plants. At one stage, all members
of the family knew the names, location, structure, value and application of medicinal
plants (Isaacs, 1987; ACNTA, 1988).
Aboriginal people have historically shared their TK generously. Indeed, it was their
open revelation of details of edible seeds, fruits and roots, water sources, and how best
to catch animals that convinced sceptical outback settlers of the authenticity of
Aboriginal claims to tribal lands (Isaacs, 1987). However, as a consequence of having
no written language and young Aboriginals moving away from traditional lands and
showing a declining interest in their heritage, this well of information is in serious
danger of drying up. For this reason, a project aimed at determining the therapeutic
effectiveness of Aboriginal traditional medicines was undertaken in the mid 1980s. The
importance of this endeavour was recognised by both the Northern Territory and

~ Chapter 8 ~ 281
Federal Governments who jointly supported the project as part of a Bicentennial
Commemorative Programme (Stack, 1989). It resulted in the publication of an
Aboriginal Pharmacopoeia which linked traditional Aboriginal medicine with modern
science (ACNTA, 1988). Over 40 Aboriginal communities shared their traditional
ethnomedical knowledge about specific bush medicines which is detailed in the
internationally recognised document, along with a botanical description for each species
and the chemical composition and therapeutic activity known to that time. More
recently, the web-based Customary Medicinal Knowledgebase has been developed as an
integrated multidisciplinary resource to document, conserve and disseminate the
valuable Aboriginal TK that is scattered throughout the published literature and
amongst various Aboriginal communities (Gaikwad et al., 2008).
Isaacs (1987) suggested that the greatest repository of centuries of botanical knowledge
and experience lies with Aboriginal women rather than men. Theoretically, everyone in
a community knew the names and locations of all useful plants, but sex roles were well
defined in traditional communities. It was the women who were the gatherers of plant
foods and herbal medicines while the men were preoccupied with preparing for the
hunt. While men knew all the plants, it was the women who knew the finer details of
their respective uses (Lassak & McCarthy, 2001). For this reason, the plants collected
for this study were those identified by mostly Aboriginal women guides.
The Australian continent covers a vast range of botanical environments: from tropical
coast to rainforest, from open scrub to wet schlerophyll forest, from woodland to desert
and from temperate riverine environments to snowy alpine mountains. Aboriginal
people once lived in all these areas and continue to live in most, utilising the natural
foods and medicines unique to Australia (Isaacs, 1987). This project has looked at

282 ~ Chapter 8 ~
plants traditionally used as medicines by Aboriginal people of just two desert
communities. Screening for cytotoxic activity verified the bioactivity of several of these
medicinal plants, scientifically validating what the Aboriginal people have known for
thousands of years. Several flavonoids identified in one particular species, Eremophila
duttonii, accounted for some of its observed bioactivity, which agreed with published
data. However, the compound likely responsible for the main cytotoxic/cytostatic
actions of this species could not be definitively identified as part of this study, leaving
open the possibility that the inhibitory effects were due to a new chemical entity (NCE).
Given the success of this study, it would be interesting to further evaluate the anticancer
potential of other bioactive plants identified in the initial screen. This approach could
also be used to evaluate plants for use against other diseases besides cancer. While
several extracts displayed selective antibacterial properties and one showed modest
antiviral activity in independent screening tests performed (at another university) on the
same plants examined in the current study (Evans et al., 2007), many other disease
targets could also be assessed (see Section 8.2.7.2). Provided that local guides can be
persuaded to help, the entire procedure could then be repeated for other Aboriginal
communities living in other regions of Australia. In this way, not only will Aboriginal
TK be recorded for preservation, but it will also hopefully be scientifically validated
too. By using ethnopharmacological knowledge from other Australian landscapes, the
chances of discovering a novel therapeutically useful agent will be multiplied.
As described in the General Introduction to this thesis, one of the main goals of this
particular study was to identify a potential anticancer agent for chemotherapeutic use
outside of the Indigenous community who provided the lead, hopefully resulting in a
direct economic benefit to that community. While a NCE was not identified, it is still

~ Chapter 8 ~ 283
possible that further tests may reveal that the observed bioactivity of plant extracts were
due to a novel compound/s.
However, a second objective of the study was the validation of Traditional Aboriginal
medical knowledge. Therefore, even though a novel compound could not be identified,
the fact that extracts of the medicinal plant were bioactive is still significant. In the end,
if bioactivity is not due to a NCE that can be exploited, then maybe it does not really
matter what the active principle/s are. Perhaps the real point is that, regardless of what
compound/s are responsible, something in the plants, acting alone or in combination, is
bioactive. It seems likely that the various active constituents of extracts have to work as
a whole, not in isolation, to be most effective. This would support the idea of the
usefulness of traditional herbal medicines.
Therefore, this study may be considered a positive step towards reconciling traditional
Aboriginal knowledge with Western medicinal ideals. While many more experiments are
required before any anticancer drug can be developed, these preliminary results may pique
the interest of a pharmaceutical company willing to invest in such a project. In such a case,
the Aboriginal communities would be considered as major stakeholders of the enterprise.
If not, marketable products based on some plants tested in the present study may still be
feasible. As outlined in a previous section (1.2.3), there is a growing demand for
medicines based on T/CAM, so the communities may choose to develop extracts of
plants as alternative remedies for treatment of cancers and supply an industry partner
with the required raw materials.
An excellent example of a successful international company founded on Aboriginal
ethnomedical knowledge is Mount Romance, a manufacturer of a range of beauty

284 ~ Chapter 8 ~
products based on the sandalwood tree, Santalum spicatum, and located in Albany, WA
("Mount Romance," 2010). A groundbreaking partnership between Mt Romance, Aveda
(a US-based multinational cosmetics corporation) and the Kutkabubba Aboriginal
community (represented by the Songman Circle of Wisdom) was launched in 2004 at
Murdoch University in Perth (WA), representing the world‘s first case of indigenous
intellectual accreditation. According to this protocol, Aveda and Mt Romance each
donate $50,000 to the Kutkabubba community for using the land and knowledge of the
Aboriginal people. Ongoing funds are used by the community for any purpose they
desire. Under the accreditation protocol, the partnership provides a new approach to
protecting indigenous knowledge, which is very different from the patenting law. The
Indigenous accreditation is a voluntary undertaking under a sustainability framework,
allowing a holistic approach to indigenous knowledge (Marinova & Raven, 2006). As
such, it represents a good model for partnerships between Indigenous communities and
other groups who wish to apply their TK or employ their skills for commercial gain.
Another option is for Aboriginal communities themselves to set up a cottage industry based
on skin creams or lotions to be sold directly to the public. Various examples of such
cottage-style industry products traditionally used by Aboriginals exist. Many, such as the
herbal remedy Gumbi(y) Gumbi(y) (Pittosporum phylliraeoides) and Emu Oil are sold at
local markets or via various internet sites and can be found simply by doing an online
search (e.g. "Gumby Gumby," 2010; "Essentially Bliss," 2009). Both Aboriginal
communities involved in the current project already run viable businesses directly from
their lands. The Titjikala community in the Northern Territory operates a tourist resort and
sells authentic Aboriginal artwork directly to travellers who visit their purpose built gallery
("Remote communities," 2009; "Tapatjatjaka," n.d). Similarly, the Scotdesco Aboriginal
Community operates several enterprising schemes, including running Aboriginal cultural
~ Chapter 8 ~ 285
awareness presentations and Wirangu language and cultural experience camps. In addition,
they sell books on the Wirangu language, various arts and crafts, and jars of Gujaru, a
natural bush remedy to reduce pain, relieve breathing difficulties and dry itchy skin or
rashes ("Scotdesco," 2010). Provided that further tests indicate no human toxicity, other
herbal remedies based on any of the plants that showed bioactivity in the current studies
could be similarly developed and marketed as traditional bush medicines with the additional
selling point that the effects have been scientifically validated. However, even if it proves to
be unviable to profit financially from this knowledge, it is hoped that Aboriginal people
who shared their TK of medicinal plants will still feel empowered by the realisation that it
has been scientifically verified and therefore seen to be valuable by the Western world.
8.2.2 Limitations
Even though the research described in this thesis has demonstrated clear cytotoxic
effects of a plant extract (EA3) against cancer cells, it must be recognised that cytotoxic
activity in vitro does not necessarily translate to clinical significance or even antitumour
activity in vivo. For example, it may not be practicable (or cost-effective) to extrapolate
the dose from that giving activity in vitro, to that which would be required for the size
of a person. More importantly, physiological factors including absorption and
metabolism may cause discrepancies between in vitro and in vivo activity (Houghton et
al., 2007). However, while in vitro cytotoxicity is not always the most effective or
reliable means of predicting in vivo antitumour activity, in vitro cytotoxicity assays are
generally rapid and inexpensive, and are therefore the most popular methods for initial
tests (Dewick, 2002), hence the use of the MTT assay in the current study.
Nevertheless, it is vital that these results are not over-interpreted, which, according to
Gertsch (2009), is often the case in many ethnopharmacologically-based articles in the
literature. This means recognising the dangers inherent in focussing on just a part of
286 ~ Chapter 8 ~
something that, as a whole, is much more complex, just as in the old tale of the blind
men and the elephant. In this context, it must be stressed that the findings of this study
are preliminary only, and many more experiments are required before they can be
accurately correlated with human use.
There were many other issues arising from the current study that require commentary.
For simplicity, this will be broken down such that each experimental chapter is
discussed in turn. Conclusions, limitations or implications of each topic will be
addressed, as well as some possible future directions.
8.2.3 Chapter 3: Optimisation of Experimental Techniques
8.2.3.1 Cell lines
According to Lord (1987), any successful therapy should ideally eliminate the abnormal
cells while leaving all normal cells functionally undisturbed. In practice, this objective
is usually never realised, particularly in the case of cancer chemotherapy. Even the most
successful anticancer drugs have often been chosen because of their ability to
preferentially inhibit rapidly dividing cells. Their therapeutic use represents a
predictable compromise which seeks to achieve elimination of neoplastic
cells while causing minimal damage to normal cells. Even in the best situations,
undesirable side effects are inevitable.
This is because some normal cells (e.g. cells of the epithelial lining of the gut, bone marrow
and hair follicles) grow at a faster rate than most tumour cells, and chemotherapeutic agents
may kill these cells more efficiently than cancer cells, resulting in devastating side effects or
even dose-limiting toxicities which can allow tumour cells to escape treatment and develop
drug resistance (Keyomarsi & Pardee, 2003). Nevertheless, it may be possible to markedly
reduce any cytotoxic effects on normal cells by exploiting other differences in their cell cycle
~ Chapter 8 ~ 287
regulation (Keyomarsi & Pardee, 2003) or by employing special drug delivery systems that
specifically target cancer cells (Dharap et al., 2005; Lord, 1987).
Indeed, cancerous cell lines provide a very good model for studying the effects of
various potential anticancer agents at the cellular level. While host factors such as drug
metabolism, neurohormonal mechanisms, immune response and other physiological
interactions often modify the effects and toxicity of a drug within the body, in vitro
results generally give a good indication of cytotoxicity (Friedman et al., 1984; Hofs et
al., 1992; Korting & Schafer-Korting, 1999). Indeed, Shrivastava et al. (1992) showed
that an accurate in vivo LD50 dose could be predicted from in vitro data for at least 75%
of the compounds tested. There is usually a good correlation between lack of potency in
vitro and lack of antitumour activity in vivo. However, high cytotoxic potency in vitro
does not necessarily predict activity in vivo (Mirabell et al., 1986; Cushion et al., 2006).
Thus, while not able to give definitive answers regarding anticancer activity, cell lines
are very useful tools for initial screening programmes. As this project was, in essence, a
screening study, the use of cell lines was considered an appropriate methodology. The
significance of the cell lines chosen was that they represented the five most commonly
occurring cancers in Australia.
According to the third ―law of toxicology‖, humans are animals and therefore the study
of animals can provide useful insight into effects on humans (Goldstein & Gallo, 2001).
Thus, the next step in this work will be to further evaluate promising extracts or
compounds in in vivo studies (after obtaining appropriate Animal Ethics approval). This
will mean inoculating cancer cells subcutaneously in nude mice to induce tumours and
then administering the active compound/s to determine if a significant reduction in the

288 ~ Chapter 8 ~
size of the tumours occurs over time. The physiological indicators of normal
metabolism will also be monitored.
8.2.3.2 MTT assay
Much effort was expended in optimizing the MTT assay as it was the primary method
of assessing cytotoxicity in these studies. In particular, time was spent selecting an
appropriate solvent for solubilising the MTT formazan crystals as this process is crucial
to the accuracy and reproducibility of the MTT colourimetric method (Li & Song,
2007). Initially, it was determined that the best extraction buffer consisted of 10% SDS,
50% isobutanol, 0.1M HCl (see Appendix C). This was based on this buffer producing
the highest absorbance readings and so it was inferred that this would translate to the
greatest sensitivity. However, background absorbance values were unacceptably high
using this buffer, which interfered with the interpretation of data. The high background
levels were probably due to undissolved formazan crystals which were apparent in some
wells containing comparatively many viable cells even after mixing. The same
phenomenon was reported by Li and Song (2007) who used isopropanol. As in the
current study, these authors switched to DMSO for extraction because, in contrast,
formazan was completely dissolved within 2 min using this solvent. Significantly, after
assessment of many formazan solvent systems, DMSO was also the solubilising agent
adopted by the NCI anticancer drug screening programme (Alley et al., 1988).
The main modification to the original assay procedure was discarding the contents of
the wells before the addition of MTT. This change reduced interference effects
associated with the mixture of substances in wells, resulting in lower background
absorbances.

~ Chapter 8 ~ 289
Overall, the MTT assay was shown to be a reliable indirect method of measuring cell
viability and hence appropriate for assessing cytotoxicity in the current study. However,
it should be mentioned that there can be limitations with the MTT assay as metabolic
activity may be altered by various conditions or chemical treatments, or there can be
chemical interactions with MTT itself (Plumb, 1999; Ulukaya et al., 2004; Ganapathy-
Kanniappan et al., 2010). While some compounds inhibit the reduction of MTT, others
can augment it, or at least appear to due to chemical interference (Schubert, 1997;
Ulukaya et al., 2004; Ahmad et al., 2006). When certain compounds are tested, the use
of MTT as an indicator of metabolically active mitochondria has been shown to
overestimate the number of viable cells by comparison with the ATP, DNA, or trypan
blue determination (Ulukaya et al., 2004; Wang et al., 2010).
Increased absorbances due to MTT-formazan production via upregulation of
mitochondrial dehydrogenases or chemical interference results in an underestimation of
the antiproliferative effects of the test compound. It is possible that if this occurred in
the initial screening studies of the current study, potential useful agents may have been
lost in the elimination process as they were falsely classed as inactive. Inhibition of
MTT reduction or chemical interference causing lower absorbances would lead to a bias
that produced false-positives. This would not have been such a problem as false-
postives were likely to have been removed at a later stage, after the modifications to the
MTT assay were introduced. The removal of all compounds that would potentially
interfere with the MTT assay prior to the addition of MTT went some way towards
alleviating such problems, but it should be acknowledged that residual amounts may
have had some influence on results obtained. In later experiments, the CS system was
employed to back up the data obtained from cytotoxicity studies using the MTT assay.

290 ~ Chapter 8 ~
While the direct effects of extracts on MTT reduction were not measured, their effects
on absorbance were taken into account by measurement in cell-free media.
8.2.3.3 Vehicle
DMSO is commonly used as a carrier solvent and is therefore often included in
experiments as a vehicle control (Damm et al., 2001; Chang et al., 1996; Dent et al.,
1999). For example, Xiao and Singh (2002) used DMSO to dissolve the
chemopreventative agent they were testing against PC3 cells and so used an equal
volume of DMSO (<1%) in control wells and Yamamoto et al. (1998) used 1% DMSO
as the vehicle control in their studies.
At low levels DMSO does not generally affect cell viability or proliferation. For
example, Song et al. (2002) and Anderson et al. (1998) demonstrated that 0.1% DMSO
had no effect on cell number, cell viability or 3H- DNA synthesis when incubated with
PC3 cells for 48 h and DMSO added at concentrations between 0.6-1% did not appear
to change the cell cycle parameters or appearance of HT-29 colon cancer cells (Shiff et
al., 1996; Siavoshian et al., 2000). DMSO at 0.1% was shown to be irrelevant to
morphology, viability and proliferation of MDA-MB-468 cells (Prassas et al., 2008).
Kuntz et al. (1999) used DMSO as a vehicle control at concentrations up to 2% in
studies on cell proliferation, cytotoxicity and apoptosis in four cell lines, including
MCF7 and Caco-2. However, Blom et al. (1998) found that DMSO had a stimulatory
effect on MCF7 cell proliferation at low concentrations, but decreased cell proliferation
at concentrations of 0.8 and 1%.
Vesey, et al. (1991) showed that while only slight morphological differences between
control Hep-G2 cells and those treated with 2% DMSO could be observed under a
phase-contrast microscope, scanning electron microscopy showed that DMSO-treated

~ Chapter 8 ~ 291
cells were flatter and spread out more than their untreated counterparts. More relevant to
this thesis, DMSO reduced cell proliferation in a dose-dependent manner, such that
significant differences were observed even at final concentrations of only 1%. However,
these results were described for a cell line in which DMSO induces differentiation.
While DMSO can induce the differentiation of some cell lines, including the murine
erythropoetic line FLC (Friend et al., 1971) and the human hepatoblastoma-derived
Hep-G2 (Vesey et al., 1991), the only cell line of those employed in this study that can
undergo differentiation is Caco-2 and it does so spontaneously anyway upon attaining
confluence and with regular changes of culture medium (Mariadason et al., 1997).
Besides, other researchers (Wolter & Stein, 2002) have used DMSO as the carrier
vehicle in differentiation studies using Caco-2 cells, so it was a considered decision to
use it here.
8.2.3.4 Controls
As the carrier vehicle, DMSO was therefore employed as the negative control in
cytotoxicity assays. Initial studies used a fixed concentration of 1% DMSO (v/v), as this
was the maximum amount that cells incubated with plant extracts were exposed to.
However, it was subsequently shown that DMSO itself did inhibit proliferation of some
cell lines in the panel in a dose-dependent manner (Fig. 3.12). Therefore, it was
necessary to include extra control wells consisting of DMSO at concentrations
corresponding to the amount in wells containing different dilutions of plant extract (or
positive controls). While this step complicated the procedure, it was deemed crucial to
the accuracy of the data.
Based on effectiveness against all cell lines in the panel and reproducibility the primary
positive control chosen was DFO (Fig. 3.13 and 3.14). This control acted as a universal
292 ~ Chapter 8 ~
internal standard to ensure the system was reproducible and that experiments performed
on separate days could be compared. L1 and CPT were sometimes also used as
additional controls. Other compounds tested were not suitable due to ineffectiveness in
one or more cell lines. Upon reflection, this ineffectiveness may have been due to an
overestimation of cell viability by the MTT assay as reported for some cytotoxic agents,
including vinblastine and paclitaxel (Sobottka & Berger, 1992; Ulukaya et al., 2004).
To confirm this, the direct effects of these compounds on MTT reduction could be
evaluated by showing dose-dependent changes in absorbance readings in cell-free
media. Regardless, these other drugs were inappropriate using the system employed in
the present study and were not investigated further.
It is worth mentioning here that tamoxifen (TAM) was trialled against all cell lines in
the panel. This might seem a curious tactic at first, given that TAM is widely recognised
as the standard therapy for hormonally-sensitive breast cancers (Zarubin et al., 2005;
Valachis et al., 2010). This is because its mechanism of action is primarily via estrogen
receptor-dependent modulation of gene expression (Zheng et al., 2007). However, TAM
at higher doses (>10 M) has also been shown to have (cytostatic and cytotoxic)
antiproliferative and pro-apoptotic activity against many estrogen receptor-negative
cells, possibly due to its ability to generate oxidative stress and activate signal
transduction pathways (Perry et al., 1995; Cai & Lee, 1996; Robinson et al., 1998;
Ferlini et al., 1998).
Of the cancer cells used in the current study, only MCF7 expresses estrogen receptors.
However, TAM at low concentrations (<10 M) did not affect the proliferation of these
cells under the conditions employed. The reason for this was not investigated, but is
probably not related to TAM interfering with the MTT assay as it is not known to do so

~ Chapter 8 ~ 293
and is frequently used to evaluate antiproliferative activity (Al-Joudi et al., 2005; Bopp
& Lettieri, 2008; Rossi et al., 2009). However, 50 M TAM dramatically reduced the
proliferation of both breast cancer cell lines, MDA-MB-468 and MCF7 cells, suggesting
an estrogen receptor-independent mechanism as MDA-MB-468 cells are estrogen
receptor-negative (Wang et al., 1997). Nevertheless, it did not inhibit the proliferation
of any other cell line tested and so was not suitable as a universal positive control.
8.2.4 Chapter 4: Preliminary Screening of Plant Extracts
8.2.4.1 Physical properties
The physical properties of plant extracts that were assessed in these studies were chosen
in order to eliminate the possibility that any cytotoxic effects were due to simple
physical assault. As the pH and osmolality were shown to be similar to controls, it was
concluded that cells were not damaged due to excessive acidity or alkalinity or hyper- or
hypo-tonicity. As the principal method used to assess cytotoxicity, the MTT assay, was
spectrophotometrically-based, the colour of the extracts caused initial problems via
colour interference with MTT formazan. However, this issue was resolved by adapting
the method by removal of the extracts before addition of MTT.
8.2.4.2 Initial screening
According to Boyd and Paull (1995), the least interesting or useful (but most common)
response to a random selection of chemical structures is none at all. A similarly
unremarkable profile is one in which one or more concentrations of the tested
compound produce/s growth inhibition and/or cytotoxicity of basically the same
magnitude across all the cell lines of a panel. Of course, most screening studies,
including the NCI programme, are capable of identifying highly potent, indiscriminate
direct cell poisons, but that is not a particularly useful attribute of a screen. What is
important to ascertain is evidence of a differential response between cell lines (Boyd &
Paull, 1995). It is especially desirable to show selective activity for cancer cells

294 ~ Chapter 8 ~
compared to non-cancerous cells. Therefore, as part of the current study, both potency
and selectivity were key when selecting plant extracts with promising cytotoxic or
cytostatic effects.
In that light, the most promising plant extract from the initial screen was Extract 3.
However, unfortunately, the limited amount of this extract precluded it from selection.
While it was feasible that more material could have been obtained for further study, it
must be remembered that a major objective of this research was to discover a cytotoxic
agent that could potentially be developed so as to economically benefit the Aboriginal
community that provided the TK that originally identified the plant of interest. Extract 3
was derived from the roots of Thysanotus exiliflorus, a plant that, according to the
Aboriginal women guiding the collections, is only found after ―a good rain‖ and,
indeed, was not found on three subsequent expeditions after the original collection took
place. Moreover, the roots of T. exiflorus are only very small, so harvesting enough of
them to produce an adequate supply for a drug company to derive the active constituent
would likely not be economically viable. A cottage-style industry based on the crude
extract would likely be, similarly, unviable. However, many important current
chemotherapeutics, including Taxol®, are chemically synthesised or semi-synthesised
after having been developed from natural product (NP) leads (Cragg & Newman, 2005).
This means that there is still potential for Extract 3 to be of use as an anticancer agent
and generate income for the providers of the TK via royalties paid by the drug company
that develops it. Obviously, this enterprise would require the expertise of a chemist and
a sophisticated chemistry laboratory as well as many more thousands of investment
dollars, none of which were available for this PhD project.
~ Chapter 8 ~ 295
Another option could be to investigate other, larger species of the Thysanotus genus for
similar levels of bioactivity in the hope that harvesting a greater biomass will mean
greater yields of bioactive compounds. However, while over 40 species of Thysanotus
have been identified, they are very alike in that they are all perennial herbs characterised
by distinctive fringed lily-like purple flowers (Brittan, 1981; Gathe & Watson, 2008).
As monocotyledons, they do not typically display any secondary thickening, the usual
means for plants to increase their girth. Only T. spiniger has been reported to exhibit
secondary growth, but this is in the form of a woody underground stem (Rudall, 1995)
and is unlikely to mean much greater yields of plant matter. While being herbaceous
definitely does not preclude a plant from being cultivated for harvest (e.g. wheat and
barley) and a lack of true secondary thickening does not necessarily correspond to small
plant size (e.g. palm trees), Thysanotus species have generally proved difficult to
maintain in cultivation despite being relatively easily propagated from seed (ANPSA,
2007).
Perhaps there could be some merit in procuring a botanist to research the potential
cultivation of Thysanotus. The goal would be to produce large quantities of the
bioactive constituents present in T. exiflorus by ongoing harvest. However, given the
growth restrictions of Thysanotus species, a more realistic idea might be to harvest just
enough plant matter for identification of the active compound/s so that subsequent
laboratory synthesis may be possible. This synthesised compound could then be further
studied in terms of its potency and specificity for cancer cells. This scenario is very
similar to what happened in the case of the major cancer chemotherapeutic, paclitaxel,
the discovery and development of which is discussed further in Section 1.4.4.1.3 and
Appendix M. However, this synthesis would also require the collaboration of other
scientists, in this case organic chemists, and both options would require a great deal of
296 ~ Chapter 8 ~
capital and many years of research. Unless government funding could be obtained, the
challenge would be to find an investment company willing to inject the millions of
dollars necessary. However, without further evidence of the potency and specificity of
the crude extract, this would seem to be a catch-22 situation. If funding could be
secured to follow either avenue of further research, the process would be coordinated by
members of the Titjikala community whose TK provided the lead in the first place and
any profits generated would naturally flow directly to the community.
8.2.4.3 Dose-response
Cytotoxicity is one of the most common biological parameters measured following
experimental manipulation, largely because it is easily measured and is dose-dependent
(Cho et al., 2008). For this reason, cytotoxicity, as measured by the MTT assay, was
used in these studies to assess the effects of various plant extracts on cancer cell lines.
However, during the course of this research it became apparent that lower
concentrations of an extract did not always correspond to lower levels of inhibition of
cell proliferation. Indeed, in some cases, low doses of an extract caused an increase in
cell proliferation. In other words, the data were inconsistent with the generally accepted
monotonic sigmoidal, threshold model of dose-response (Calabrese et al., 2006a).
Given the dose-response relationship is so fundamental to toxicology, a search for an
explanation in the published literature uncovered the phenomenon of hormesis, an
alternative model of dose-response. Hormesis is a biphasic dose-response concept in
which opposite effects are displayed at high and low doses, although typically it is
characterised by a low-dose stimulation and a high-dose inhibition (Calabrese, 2008b).
It is seen with a wide variety of toxic agents and NPs in multiple organ and cell
systems, regardless of endpoint measured, leading to the proposal that hormesis is
broadly generalizable (Calabrese, 2005a; Calabrese, 2008a). Generally, hormetic

~ Chapter 8 ~ 297
responses are modest, with values typically about 30-60% above control levels
(Calabrese & Baldwin, 2003a; Calabrese, 2008a). The width of the low-dose
stimulatory range is generally limited to about one order of magnitude (Calabrese &
Baldwin, 1998; Calabrese, 2008a). For interest, more information on the hormetic
model is provided in Appendix N. As the stimulation of cancer cell proliferation
observed after exposure to some plant extracts occurred only at low doses and was less
than 150% of control values (e.g. see Fig 5.3), it was concluded that hormetic effects
were present in these cases.
As explained further in Appendix N, because hormesis has been observed for so many
different species, substances and endpoints, it is thought that it is a generalised
mechanistic strategy, but no single molecular mechanism has yet been proposed to
explain its existence. Nevertheless, this high generalizability suggests that the hormetic
dose-response strategy has been selected for and is adaptive in nature (Stebbing, 1998).
It has been suggested that the hormetic process may be a common tactic for cells to
allocate resources when a response to low-level metabolic perturbations is required
(Calabrese & Baldwin, 2003). Thus, it represents an overcompensation to an alteration
in homeostasis. When the dose progressively increases, the system‘s capacity to
compensate becomes overwhelmed, the toxicity threshold is exceeded, and toxic effects
are seen (Calabrese et al., 1999).
The actions of agonists and opposing receptor subtypes may help account for numerous
cases of hormetic-like biphasic dose-responses. In this model, a single agonist may bind
to two receptor subtypes, one activating a stimulatory pathway and the other an
inhibitory one. The receptor subtype with greatest agonist affinity would typically have
fewer receptors, hence a lower capacity, and its pathway activation effects would

298 ~ Chapter 8 ~
dominate at lower doses. Conversely, the other receptor subtype would have lower
agonist affinity, more receptors and greater capacity, becoming dominant at higher
concentrations (Calabrese, 2008). A variation on this theme may explain the hormesis
seen in the extract-cell interactions of the current study. As the plant extracts contained
many different compounds (ligands), cell receptors could have had specificity for
activating cell growth with certain ligands at low concentrations, but binding to other,
less specific, ligands at higher levels which resulted in cell death.
In the experiments of this study, hormesis accounted for some of the inaccuracies in
calculating valid IC50 values. This is because the conventional nonlinear regression
procedure (used by GraphPad Prism) is based on the simple log-logistic model, which is
not appropriate for biphasic relationships (Beckon et al., 2008). While formulae have
been developed to calculate IC50 values when hormesis is present (Brain & Cousens,
1989; Vanewijk & Hoekstra, 1993; Schabenberger et al., 1999), it was not possible to
adopt these models as part of the current study due to unavailable expertise.
Nonetheless, it is acknowledged that fitting a log-logistic model and simply ignoring the
presence of hormetic effects can lead to serious bias and erroneous inferences
(Schabenberger et al., 1999). Therefore, the IC50 values obtained in this study when
hormesis was present were taken with some reservation.
However, there are more serious concerns with hormesis than merely making fitted
dose-response curves look untidy and complicating IC50 value determinations.
Assuming hormesis is a real effect and not an artefact, there are grave implications in
not getting the dose right. Consider the likely scenario of, for example, an anticancer
chemotherapeutic with a relatively long biological half life that displayed hormetic low
dose stimulation. In this case, as the drug is metabolised within the body, its effective
~ Chapter 8 ~ 299
dose is reduced to subtoxic levels, which would result in an increase proliferation of the
very cancer cells the medicine (at higher doses) is targeting. Additionally, as the
hormetic stimulatory zone is close to the pharmacologic threshold, there is a distinct
possibility that a desired therapeutic dose could be toxic to some individuals due to
inter-individual variability (Calabrese, 2008a). Obviously, either of these cases would
be harmful to a patient and is the main reason why plant extracts displaying high levels
of hormesis were excluded from the pool for further study as suitable drug candidates.
8.2.4.4 Morphological changes
Morphological changes to cancer cells upon addition of plant extracts were evaluated
qualitatively under phase contrast light microscopy at 400X total magnification. This
technique was suitable to establish cell death and to distinguish the relative effects of
different extracts on different cell lines for screening studies. However, it was not
possible to definitively say via which mechanism, apoptosis or necrosis, cells were
likely to have died. In retrospect, it would have been better to have stained the cells with
hematoxylin-eosin or one of the Romanowski group of stains (based on methylene blue
and eosin) as this allows the classical hallmarks of apoptosis such as cell shrinkage,
membrane blebbing and formation of apoptotic bodies to be viewed more easily
(Hengartner, 2000; Doonan & Cotter, 2008; Krysko et al., 2008). Sometimes it is also
possible to see other features characteristic of apoptosis, like nuclear pyknosis
(chromatin condensation) and karyorrhexis (DNA fragmentation) under light
microscopy (Canalejo et al., 2000). However, fluorescence microscopy using
fluorescent dyes (e.g. Dapi and Hoechst stains 33258 and 33342) that stain the nuclei of
the cells is more widely used as it enhances differentiation of smaller apoptotic nuclei
and visualisation condensed chromatin at the nuclear membrane and even nuclear
fragmentation (Doonan & Cotter, 2008), and perhaps this technique could be employed
in future studies that focus on one or two extracts or compounds.

300 ~ Chapter 8 ~
While it is possible to perceive many of the characteristic features of late apoptosis
using light and fluorescence microscopy, to improve resolution electron microscopy
could be employed. Scanning electron microscopy (SEM) provides detailed information
about the cell surface, and the membrane in particular, enabling visualization of
membrane blebs. For example, using SEM, Canalejo et al. (2000) visualised an intact
cell membrane with nuclear changes that included chromatin condensation and
fragmentation as well as the occasional apoptotic body surrounded by a cell membrane.
On the other hand, transmission electron microscopy (TEM) facilitates the analysis of
sectioned specimens providing internal images of the cell. Where detection of
morphological features of apoptosis by regular microscopy is difficult, TEM can assist.
Moreover, the shape adopted by the condensed chromatin can be visualised by TEM,
providing information about the biochemical nature of the pathway. For example,
chromatin adopts a different morphology depending on the type of death programme
initiated. Caspase-dependent apoptosis mostly induces strong chromatin compaction in
crescent shaped masses at the nuclear periphery, whereas caspase-independent
apoptosis often results in lumpy, incomplete chromatin condensation (Doonan & Cotter,
2008). However, both SEM and TEM are considerably more expensive than light
microscopy, more time consuming and require specialist training and equipment
(Huerta et al., 2007) and so would only be used to confirm apoptosis after other
techniques had been used.
Necrosis is mostly defined in negative terms, by the absence of features characteristic of
apoptosis (Krysko et al., 2008). However, Rello et al., (2005) described several
morphological features of necrotic cells. In early necrosis there was typically immediate
formation of membrane bubbles followed by coalescence and rupture, while
disorganization of the cytoplasm, homogeneous nuclear condensation and final

~ Chapter 8 ~ 301
chromatin disintegration within flattened polygonal cell remnants still attached to the
substrate characterised late necrosis.
Another improvement to the experimental design and possible future direction would be
to monitor changes in morphology over time. This is because all microscopic techniques
can only detect apoptosis at a single point in time. It is known that apoptosis is a
relatively rapid procedure, with cell elimination occurring within 1-3 h of initiation
(Kerr et al., 1972; Gavrieli et al., 1992). Thus, using microscopy, it is possible to miss
the characteristic markers of apoptosis (Huerta et al., 2007). Additionally, in vitro, in
the absence of phagocytic cells, apoptotic cells can undergo secondary necrosis, which
shares many morphological features with primary necrosis (Saraste & Pulkki, 2000;
Krysko et al., 2008). By examining cell morphology at regular intervals over a long
time course, it may be possible to ―catch‖ apoptosis as it happens.
Another way to discriminate between primary and secondary necrosis is to stain the
nucleus with propidium iodide. As secondary necrotic cells have already passed through
an apoptotic stage, their nuclei are fragmented and/or condensed and chromatin
structure is lost so nuclei stain homogeneously with propidium iodide. On the other
hand, necrotic cells have uncondensed nuclei with prominent nucleoli. Secondary
necrosis can also be distinguished from primary necrosis by detection of caspase-3 and -
7 activity in the supernatant (Krysko et al., 2008) (see Section 8.2.6.3).
However, even if these experiments were performed, it is still not certain that apoptosis
could be unambiguously distinguished from necrosis. Apoptosis and necrosis represent
two extremes of cell death, and there is often a continuum of apoptosis and necrosis in
response to high and low doses of the same stimulus (Yeung et al., 1999; Kemény-Beke
et al., 2006; Hsuuw & Chan, 2007; Shang et al., 2009). Features of both apoptosis and

302 ~ Chapter 8 ~
necrosis may even coexist in the same cell (Doonan & Cotter, 2008; Shang et al., 2009).
Therefore, the long-standing view of two distinct death programmes is an over-
simplification of a much more complex process and this should be considered when
performing morphological examination of cell death (Doonan & Cotter, 2008).
8.2.4.5 Exposure and recovery
The MTT assay is often described as a cytotoxicity assay (Sgouras & Duncan, 1990;
Fotakis & Timbrell, 2006; Bopp & Lettieri, 2008), but it does not actually allow for the
discrimination between cytostatic (growth arrest) and cytotoxic (cell death) effects
(Plumb, 1999). All it can reveal is whether there are fewer or more viable cells present
than there would have been without the treatment. Therefore, in order to distinguish
between cytostaticity and cytotoxicity, cells were exposed to extracts for various periods
and then the extracts were withdrawn to give the cells an opportunity to recover and
resume proliferation. This approach has been widely used to discern the antiproliferative
effects of numerous test agents in a range of cell types under diverse conditions (Pollack
et al., 1996; Pedro et al., 2005; Marzano et al., 2007; Pascutti et al., 2009; Fang et al.,
2009).
Using this method, the inhibitory effects of several extracts were shown to be cytotoxic
or irreversibly cytostatic. However, in retrospect, for each exposure period, it would
have been good to have measured cell numbers at various endpoints, not just at a single
point in time, so that proliferation could have been assessed more readily. In this way,
% inhibition could have been viewed on a graph against recovery time on the x-axis.
Interpretation of data could also have been improved by the inclusion of another control,
a time zero point, marking the moment of addition of the test agent (and control). MTT-
formazan absorbance (optical density, OD) at time zero (ODzero) could then be
subtracted from the absorbance reading after various recovery periods (ODtreated) and the

~ Chapter 8 ~ 303
vehicle control (ODcontrol) and plotted on a graph against recovery time. As absorbance
reflects cell numbers on the day of assay, if ODtreated > ODzero, a cytostatic effect can be
inferred, whereas an ODtreated < ODzero indicates cell death has occurred.
Using the formula, [(ODtreated - ODzero)/(ODcontrol - ODzero)] × 100%, the result will be
= 100, if an agent does not affect cell growth or viability,
= 0 to 100, if it induces a cytostatic effect, or
= -100 to 0, if it induces cell death (cytotoxicity) (Monks et al., 1991; Fabbri et al.,
2006).
8.2.5 Chapter 5: Evaluation of Most Promising Plant Extracts
8.2.5.1 Sample collection
It is well established that the chemical make-up of an organism is dependent on the
locality of collection (Cragg & Newman, 2002). In addition, seasonal variation may
play a part in the biochemistry of plant cellular products (e.g. germination). Indeed, in
most plants, the synthesis and accumulation of secondary metabolites is regulated by
both space and time. For example, in the case of compounds involved in defence
mechanisms, more vulnerable tissues like seeds, seedlings, buds and young tissues are,
generally, defended more than older, senescing tissues, sequestering larger amounts of
defence chemicals or even sometimes actively synthesising them. Organs important for
survival and multiplication (e.g. flowers, fruits and seeds) are almost invariably a rich
source of defence compounds (Wink, 1999). Liu et al. (1998) showed that the
concentration of the secondary metabolite, camptothecin, in leaves declined with aging
and as the growing season progressed. In addition, it is known that soil composition and
other geographical features can influence the potency of plant secondary metabolites
(Seigler, 1998; Cragg & Newman, 2002). For example, increased light intensity tends to
increase the amount of terpenoids and phenolic compounds present in a plant and water

304 ~ Chapter 8 ~
stress leads to increased terpenoid, alkaloid and condensed tannins, among others
(Seigler, 1998).
Therefore, the original plan of this study included experiments to determine whether the
time of year or the geographical location from which the plant was harvested had any
effect on the potency of the final product. Bearing in mind that one of the initial
concepts of this project was to validate traditional Indigenous knowledge and thereby
empower Aboriginal people, any variation in activity could have enormous
consequences on the credibility of any cottage industry products generated.
Unfortunately, time and financial constraints meant that it was not possible to address
these issues fully in this study. It was not possible to say which particular environmental
differences, if any, accounted for the variation observed between extracts of Samples 3
and 4 and between 5 and 6 in terms of their secondary metabolite profiles or their
bioactivities. While the differences in chemical composition were subtle, they were,
nevertheless, present. However, future directions of this research would include
properly evaluating the extent of any variation in chemical composition or bioactivity
between extracts of plants spatially or temporally removed. This information could
provide useful when setting up any cottage industry to harvest a local product.
8.2.5.2 Extract preparation and analyses
The extraction process and chemical analyses of the current study were performed by
specialist chemists. Obviously, it would take a person untrained in such procedures
much longer to accomplish the work described in this thesis, if it ever was completed at
all. This highlights the importance of collaborative efforts, not only in
ethnopharmacological research, but in all areas of science that require diverse areas of
expertise.

~ Chapter 8 ~ 305
A good example of a successful biodiscovery collaboration is Queensland‘s Natural
Product Discovery Unit (NPD), a formal partnership between the international
pharmaceutical company Astra Zeneca and the Eskitis Institute for Cell and Molecular
Therapies at Griffith University, as well as the Queensland Museum (collection of
marine samples) and the Queensland Herbarium (terrestrial collections) (Laird et al.,
2008). This exclusive relationship lasted 17 years from 1993, but collaboration on
specific projects continues and the know-how and infrastructure allowing further
development remains. Each partner contributed funding, specialised expertise and/or
facilities in return for monetary (potential and real) and non-monetary benefits (e.g.
technological experience and biodiversity information). For example, Griffith
University is now able to identify, separate and convert a NP into a medicinal chemistry
product, which removes much of the complexity and cost traditionally associated with
NPs. To 2007, the collaborative efforts of the NPD resulted in the discovery over 700
new bioactive compounds from its approximately 45,000 specimens, many of which are
new to science. While no new drugs have resulted from the partnership, this is not
unusual given the long timelines for drug-discovery and development, especially for
NPs, and the low odds of developing a commercial product in this sector (Laird et al.,
2008).
Several other Australian companies involved in drug discovery from NPs have
collaborations with academic or government institutions and other commercial
concerns. The Queensland-based life science company, EcoBiotics Ltd, which has
Access and Benefits Sharing Agreements (ABAs) with the Drug Discovery Group at the
Queensland Institute of Medical Research (QIMR) and private landholders, recently
announced plans to fast-track human clinical trials of EBC-46, a small molecule isolated
from the fruit of a north-Queensland rainforest tree, after it showed very promising
306 ~ Chapter 8 ~
results against a range of inoperable tumours in horses and dogs ("First cancer drug,"
2009). To further develop and market its products, EcoBiotics actively builds
partnerships with companies with complementary expertise and technologies
("EcoBiotics," 2010). To this end they have also signed research and development
agreements with industry partners in the USA, Europe, Japan and Australia. These
partners include Antisoma, a British biotechnology company specialising in novel
cancer chemotherapeutics, and Jurox, an Australian veterinary pharmaceuticals
company (Laird et al., 2008; "Antisoma," 2006).
Another collaborative partnership is between the Australian Institute of Marine Science
(AIMS), which has an ABA with the State of Queensland, and the agricultural company
Nufarm Pty Ltd. Other examples of Australian biodiscovery companies that collaborate
with government institutes and/or other corporations include Entocosm Pty Ltd (ACT),
BioProspect Ltd (WA) and Xenome Ltd (Qld) ("New drug," 2002; Laird et al., 2008;
"Xenome," 2009; "BioProspect," 2010).
Clearly, these relationships must be advantageous or they would not subsist. What is
implicit by the existence of these collaborations is that it is unrealistic for one company
to be responsible for the entire drug discovery and development process. It follows,
then, that one person cannot be expected to be competent in all the various aspects of
biodiscovery and at some point must join forces with others. In the case of the current
study, a single operator worked alone in a laboratory with limited funds and equipment,
so it made sense to entrust the extraction and subsequent chemical analyses of bioactive
fractions to chemists with the appropriate expertise. In this way, time that would
otherwise be spent on learning and performing the techniques was dedicated to more
cell biological experiments.

~ Chapter 8 ~ 307
In retrospect, however, the collaboration with the chemists should have been closer.
Ideally, after the extractions were performed, further fractionations directed by the
results of cytotoxicity screening (bioassay-guided fractionation) could have led to the
isolation of the active principle/s. The widespread presence of known active ―nuisance‖
compounds or ―frequent hitters‖, like tannins and polyphenols, including quercetin and
luteolin, could have been detected and removed (dereplication) to enhance the chance of
finding more interesting compounds (Butler, 2004; Lang et al., 2008; Gertsch, 2009).
Unfortunately, funding was an obstacle to this happening as part of the current study.
8.2.5.3 Extract cytotoxicity
The aim of this study was to find extracts of plants that could be of use in the treatment
of cancer. To this end, the effects of various plant extracts were assessed for their
cytotoxic effects on a panel of human cancer cell lines. To differentiate between specific
anticancerous bioactivity and non-specific, general cytotoxicity, extracts were also
tested against a non-cancerous cell line, MRC5. Selective anticancer activity was
presumed when extracts displayed more bioactivity against the cancer cells compared to
MRC5 cells. Additionally, general toxicity was also assessed by employing the brine
shrimp lethality assay (BSLA). The theory was that if brine shrimp (which are normal
organisms) were killed by a particular plant extract, then that extract would be toxic to
all normal cells, including noncancerous human cells, grounds for elimination from the
pool of extracts displaying promising anticancer activity. From these studies, the extract
that showed the most potential as an anticancer agent, EA3, was subjected to a more
intensive test to assess if the observed cytotoxicity was simply due to general toxicity or
a more physiologically controlled, selective mechanism. Ca2+
entry into the cell was
measured (see Chapter 6) and shown to be transient, indicating that no breach in plasma
membrane integrity had occurred and, hence, cytotoxicity was a physiologically
controlled event.
308 ~ Chapter 8 ~
Of course, it should have been possible to determine any losses in membrane integrity
by measuring the release of enzymes from cells in culture into the incubation media (see
Appendix O). However, due to various reasons, discussed further in Appendix O, none
of these assays were suitable for the current study. Mainly, it was because the extracts
were coloured and absorbed at the same wavelengths used in these commonly used
assays. Another alternative, assessing the cells‘ abilities to take up or release a
radioisotope tracer was also not possible due to the lack of facilities and funding.
Thus, the unavailability of a suitable scalable assay for measuring general cytotoxicity
meant it was beyond the scope of this project to examine the mode of action of every
extract. Hence, the quest for a single extract to study further was continued by
successively eliminating extracts displaying qualities suggestive of inferior potential as
an anticancer agent. Nonetheless, determining the modes of action of the rejected
extracts is a possible future direction of this study.
8.2.6 Chapter 6: Further Evaluation of Plant Extract, EA3
8.2.6.1 Chemical composition
While UV and MS detection are very powerful tools for identifying specific structural
features and providing information about the molecular weight and nature of the
individual constituents of an extract, only tentative structures can be assigned from
these data. Complete elucidation of the configuration of the substituents on the skeletal
structure usually requires complementary information from Nuclear magnetic resonance
(NMR) experiments (Koehn & Carter, 2005; Cheng et al., 2008). Although beyond the
scope of this study, NMR spectroscopy to determine the molecular structures of
interesting constituents is something that can be done in the future.

~ Chapter 8 ~ 309
8.2.6.2 Identification of active constituents
Theoretically, the activity shown by a mixture, such as an extract, is due to the activities
of the individual constituents (Houghton et al., 2007). Therefore, fractionation, resulting
in the isolation of individual compounds, should mean aliquots have a higher activity
than the original extract. This is the foundation of lead compound discovery from NPs.
This approach has led to the introduction of many important drugs (e.g. vincristine) and
also provides a basis for standardising extracts for predictable activity (Houghton et al.,
2007).
However, several factors undermine the assumptions underlying this approach, making
the process of biodiscovery not that simple. For one, it is unusual for a single compound
to be responsible for the activity observed, and frequently several constituents are
isolated which exert the same effect, although they may differ in their potency.
Additionally, the most active compound is not necessarily responsible for the major part
of the effect (Houghton et al., 2007). Therefore, it is critical to determine the
concentration of each compound in an extract and correlate it with the dose-response
characteristics being tested. It is important that the most active compound is present in
sufficiently high quantities in the extract to produce an activity. Until the amounts of
active compounds in an extract are quantified, it is not possible to conclude the identity
of the compounds responsible for any observed effects (Houghton et al., 2007). In the
current study, while pure compounds of luteolin and quercetin induced
cytotoxic/cytostatic effects in several cancer cell lines, they did not display activity at
the concentrations present in the whole extract, EA3.
However, as many ingredients of plants can work together to produce their effects,
fractionation of an active extract will not necessarily produce active principles (Dufault

310 ~ Chapter 8 ~
et al., 2001). Sometimes, the activity of the whole extract may be less than that
predicted from the activities of the major constituents (Ren et al., 2004; Aspollah Sukari
et al., 2010). This is due to antagonistic interactions of the individual constituents, often
because of competition between two or more compounds for the enzyme active site
(Houghton et al., 2007). On the other hand, it is quite common for a whole extract to
have an activity greater than the sum of any one of its individual fractions (Williamson,
2001; Houghton et al., 2007; Prakash et al., 2009). This is what occurred in the current
study where the sum of the cytostatic/cytotoxic actions of luteolin and quercetin was not
as high as that of the whole extract, EA3.
One possible reason why a loss of activity may occur following fractionation is
decomposition of the active compounds during the process. Decomposition, or
transformation of constituents to less active substances, may arise due to reactions with
the solvents used. Oxidation is another common occurrence due to the methods
employed in fractionation. Additionally, many plant extracts contain antioxidants,
which might protect labile substances in a crude extract. However, fractionation may
separate these protective substances from the vulnerable compounds, which become
quickly oxidised (Houghton et al., 2007). As commercially purchased pure compounds
of quercetin and luteolin were used in the current study, and not compounds isolated
from the whole extract, decomposition did not account for the lower activity of these
compounds compared to the whole extract. Instead, it was postulated that these
compounds have synergistic effects within the whole extract. This synergy, which has
been claimed for a long time by herbalists, is actually a very commonly observed
phenomenon in phytotherapy research (Williamson, 2001; Gilbert & Alves, 2003;
Houghton et al., 2007; Prakash et al., 2009). Synergistic effects can be produced if the
constituents of an extract affect different targets (Wagner & Ulrich-Merzenich, 2009).

~ Chapter 8 ~ 311
In the current study, the individual cytotoxic effects of pure samples of luteolin and
quercetin implied that the cytotoxicity/cytostaticity of the whole extract, EA3, was not
attributable to these major constituents, even if added together (see Section 6.3.2).
However, the calculations were based on the use of pure compounds, and were therefore
not directly comparable to the effects of the whole extract because of the many possible
complex interactions (synergistic and antagonistic) between all the constituents of the
mixture (Wagner, H., personal communication, 7th
June, 2010). Therefore, it is possible
that, in the combination, luteolin and quercetin did act synergistically to produce the
observed bioactivity. ―It is impossible to give typical ranges for synergistic effects‖
(Wagner, H., personal communication, 8th
June 2010), so it is not known if other
constituents were also acting synergistically with quercetin and luteolin, or if the
observed bioactivity of EA3 was entirely due to the interactive effects of these two
flavonoids.
While there are methods and statistical models available to ascertain the degree of
interaction between two or more individual compounds (see Appendix P), time
constraints precluded experiments to be performed that would allow this determination.
Indeed, very few studies have reported the systematic identification of the exact
components in a crude NP extract that act together synergistically as there are serious
logistical barriers to conducting bioassay-guided isolation of synergistic components
(Jones et al., 2006). Nevertheless, a future study would be to use the isobol method of
assessing additive and synergistic interactions by measuring the concentration of
individual components required to exert a particular effect compared to their actions in
various fractional combinations (Stergiopoulou et al., 2008; Wagner & Ulrich-
Merzenich, 2009). For example, cocktails containing luteolin and quercetin in different

312 ~ Chapter 8 ~
fixed ratios (e.g. 10:1, 5:1, 2:1, 1:1, 1:2, 1:5, 1:10) would be tested for their
antiproliferative effects and the IC50 values plotted on an isobologram. From this, an
interaction index () could be derived. When = 1, no interaction is assumed, while <1
signifies synergy and > 1 antagonism (Wagner & Ulrich-Merzenich, 2009).
Additionally, combinations involving other flavonoids found in EA3 (e.g. apigenin),
and even other constituents, could be tested and the effects compared to those of the
whole extract in order to obtain interaction indices.
As there were many other compounds present in EA3 besides flavonoids, a future study
could be to elucidate the structure of the unidentified compounds and evaluate them for
anticancer activity too. In this way, a NCE may be identified and if it does happen to
have anticancer activity, a potential novel anticancer drug may have been discovered.
8.2.6.3 Exposure and recovery (Cellscreen)
While the Cellscreen (CS) system provided an excellent method of monitoring cell
growth, the software unfortunately became corrupted, resulting in a total system break-
down. This meant several planned experiments could not be completed. The problem
has since been resolved and future directions would involve studying the effects of other
promising extracts on both cancer cell and non-tumourigenic cell growth, as well as the
actions of individual constituents, as identified by HPLC.
Nevertheless, it was possible to show that EA3 induced cytotoxicity in some cancer cell
lines, a response which began within 90 min of exposure. Given apoptosis is a relatively
quick process, it was thought that this rapid response suggested cell death may have
been via apoptosis. However, time constraints meant experiments had to be finalised
before this impression could be confirmed.

~ Chapter 8 ~ 313
The gold standard test of distinguishing apoptosis from necrosis is detecting specific
morphological changes via electron microscopy (Huerta et al., 2007). However, as
already mentioned (Section 8.2.4.4), this is an expensive and time-consuming
technique, but could be considered if other tests also suggested apoptosis taking place.
Classical morphological features of apoptotic cells may be identified using simpler
microscopic techniques, as outlined in Section 8.2.4.4, but this is subjective and tedious
(Staunton & Gaffney, 1998). Furthermore, even if the characteristic morphological
changes are evident, it is generally recommended that no single measure of apoptosis
should be relied upon as definitive (Huerta et al., 2007). Apoptosis can really only be
inferred after it is verified by multiple, complementary techniques (Huerta et al., 2007).
The definitive determinant of programmed cell death is the step-wise cleavage of
nucleosomal DNA into 180-200bp fragments (Staunton & Gaffney, 1998; Saraste &
Pulkki, 2000; Huerta et al., 2007). Since the biochemical hallmark of apoptosis is
initiation of a caspase cascade that ultimately leads to DNA fragmentation (see
Appendix A), both caspase activation and DNA fragmentation must be demonstrated to
determine that a cell has undergone apoptosis (Huerta et al., 2007). Identification of
DNA fragmentation is frequently by detection of ―laddering‖ of the DNA fragments via
DNA gel electrophoresis (Staunton & Gaffney, 1998; Huerta et al., 2007). In this
technique, DNA is first extracted from apoptotic cells and applied to a conventional
agarose gel. Upon electrophoretic separation, DNA fragments are seen as a ladder of
bands of the size equivalent to multimers of approximately 180-200bp (Zamai et al.,
1993). In contrast, the absence of a ladder pattern indicates necrosis has occurred as this
process is associated with random (not ordered) DNA fragmentation due to the release
of multiple endonucleases (Staunton & Gaffney, 1998). However, guidelines laid down
by the Nomenclature Committee on Cell Death advise against using biochemical
314 ~ Chapter 8 ~
analyses like DNA ladders to define apoptosis as the degree of DNA fragmentation is
noticeably different depending on the cell type, which can result in false-negatives
(Doonan & Cotter, 2008). Nevertheless, it remains a popular tool of detecting apoptosis
when used in conjunction with other techniques (Ajiro et al., 2010; Matsuda et al.,
2010). An alternative is to use flow cytometry to detect DNA fragmentation using the
monoclonal antibody (mAb) B-F6, which detects internucleosomal breaks, or perhaps
an enzyme-linked immunosorbent assay (ELISA) to detect histone associated DNA
fragments (Huerta et al., 2007). The terminal deoxynucleotidyl transferase-dUTP nick
end labelling (TUNEL) assays can also be used to detect DNA fragmentation in vitro
and are accepted as a reliable way to establish apoptosis if confirmed with other
methods (Huerta et al., 2007).
Another option is to ascertain activation of caspases. Given the essential role of
caspases in apoptosis and the fact that they operate in a cascade system, cleaved
caspases are markers for various stages in early apoptosis. For example, the initiator
caspases, caspase-8 (extrinsic pathway) and -9 (intrinsic pathway), activate executioner
caspases, like caspase-3 and -7, which would be detected later (Kim et al., 2007; Huerta
et al., 2007). mAbs are available against all of the caspases for immunochemistry,
immunohistochemistry, ELISA and even (in the case of caspase-3) for flow cytometry
(Huerta et al., 2007). The most informative assay for the activation of caspases involves
detection of proteolytic cleavage of their target molecules (Huerta et al., 2007).
Alternatively, cells could be cultured in the presence or absence of a caspase inhibitor,
such as Z-DEVD-FMK to target caspases-3/7 or Z-IETD-FMK for caspase-8, to see if
apoptosis still occurs when caspases are blocked, although these inhibitors can exhibit
significant cross-reactivity towards non-target caspases (Berger et al., 2006). The
easiest way to infer apoptosis by assaying for caspase activation might be to employ one

~ Chapter 8 ~ 315
of the various commercially available kits (e.g. Promega‘s Apo-ONE®
Homogeneous
Caspase-3/7).
There are many other techniques commonly employed to establish apoptosis (see
Huerta et al., 2007 for review). These include measuring changes in mitochondrial
membrane potential with dyes like JC-1 and measurement of cytochrome C release
from mitochondria via Western blotting (Mantena et al., 2006; Sun et al., 2007a).
Regardless of which technique is settled on, confirming that EA3 is inducing
cytotoxicity via apoptosis is a priority future direction of the current research.
8.2.6.4 Intracellular Ca2+
measurement
Other results that suggested (but did not prove) that EA3-induced cytotoxicity was
mediated via an apoptotic pathway were obtained by measuring changes in intracellular
Ca2+
concentrations ([Ca2+
]i). Increased [Ca2+
]i is a universal second messenger system
in cells which links receptor activation to signalling pathways downstream (Price et al.,
2003; Clapham, 2007). A transient increase in [Ca2+
]i has been implicated in apoptosis,
while a sudden increase that remains elevated is indicative of a breach in cell
membrane integrity and necrosis (Sylvie et al., 2000; Baumgartner et al., 2009).
Therefore, in Chapter 6 the dynamics of changes to [Ca2+
]i in cancer cells exposed to
EA3 were examined and compared to those of histamine, a known endogenous activator
of Ca2+
signalling. It was shown that the Ca2+
response to EA3 was biphasic, consisting
of a transient rise in [Ca2+
]i , followed by a plateau phase. Histamine induced a transient
Ca2+
response of similar speed and magnitude to EA3, although [Ca2+
]i gradually
returned to baseline. Some of the transport mechanisms described in section 6.1.4 could
account for the observed decline in [Ca2+
]i after the initial peaks in both the EA3- and
histamine-induced Ca2+
response traces. For example, it is well known that an initial
rise in [Ca2+
]i is mainly due to the mobilisation of Ca2+
from internal stores, while a
316 ~ Chapter 8 ~
plateau is due to a sustained influx of Ca2+
from the extracellular fluid across the plasma
membrane that is in equilibrium with processes that deplete intracellular Ca2+
levels,
such as efflux or storage (Tilly et al., 1990; Liou et al., 2005; Chen et al., 2010).
Therefore, a future direction of this study is to conduct further experiments with EA3 in
which the cell bathing solution contains no added Ca2+
, as well as EGTA to chelate
residual Ca2+
. If the plateau phase is still evident, then it is cannot be due to extracellular
Ca2+
influx via capacitative Ca2+
entry (see Appendix J). Also, specific Ca2+
channel
blockers (e.g. nifedipine) could be employed to attempt to prevent increases in [Ca2+
]i,
and ATPase inhibitors (e.g. bafilomycin A1) could be used to block the plasma
membrane Ca2+
-ATPase and impede Ca2+
efflux. This may help elucidate which
channels and pumps are involved in the Ca2+
signalling processes at play. Moreover, in
this vein, the Ca2+
response could be blocked and cell proliferation studies conducted to
see if the anti-proliferative effect of EA3 is inhibited. If cells were able to proliferate
normally in the absence of Ca2+
but presence of an appropriate concentration of EA3,
this would provide further evidence for the involvement of Ca2+
in EA3-induced
cytotoxicity. However, it must first be established that the cancer cells used in such
studies can survive long periods without extracellular Ca2+
, although it has been shown
that, in contrast to normal cells, the ability to proliferate at low calcium levels seems to
be a general property of the neoplastic phenotype (Parsons et al., 1983; Parsons et al.,
1985; Chan, 1989).
It has been shown that a key event in triggering some apoptotic signals is the release of
Ca2+
from ER stores into the cytosol, followed by its entry into the mitochondria (Nutt
et al., 2002; Baumgartner et al., 2009). Therefore, it would also be interesting to deplete
ER Ca2+
stores with a sarco(endo)plasmic reticulum Ca2+
-ATPase inhibitor (e.g.

~ Chapter 8 ~ 317
thapsigargin) and use a ratiometric mitochondria-targeted fluorescent Ca2+
-sensitive dye
(eg. the pericams 2 mt8 or RPmt) to monitor subsequent Ca2+
entry into the
mitochondria in a Ca2+
-free solution in the presence and absence of an inhibitor of the
mitochondrial Ca2+
uniporter (e.g. RU-360) (Jackisch et al., 2000; Nutt et al., 2002;
Baumgartner et al., 2009). In this way, it should be possible to determine the relative
roles of ER and mitochondria mobilisation of Ca2+
stores in producing the initial Ca2+
signal. Showing an increase in the amount of Ca2+
released by the ER and its subsequent
uptake by the mitochondria would suggest that the observed Ca2+
transient is a death
signal which triggers apoptosis (Rizzuto et al., 2003).
Additionally, as cell apoptosis occurs over hours and not minutes, another worthwhile
future endeavour would be to explore the temporal relationship between the initial EA3-
induced elevation of [Ca2+
]i and activation of apoptosis by measuring changes in [Ca2+
]i
over a longer term. However, the passive loading technique routinely used in this
laboratory results in underestimations of [Ca2+
]i as, gradually over time, Fura-2 leaks
out of cells (Putney, 2006). It is also compartmentalised inside the ER within hours
(Jackisch et al., 2000). Therefore, for longer time course experiments, it would be
necessary to adopt a new loading technique, such as the microinjection of cells with
Fura dye complexed to high molecular weight dextran that is resistant to leakage and
compartmentalisation (Jackisch et al., 2000). Of course, the adoption of any new
method would have to be practicable within the limitations of the facilities and expertise
available at this university.
Another worthy future experiment would be to track changes in [Ca2+
]i over time using
a range of concentrations of EA3. Any dose-dependence could then be ascertained and
compared to the results obtained using the MTT assay and CS system. Ideally, these
experiments would be conducted over a longer period of time, preferably over at least

318 ~ Chapter 8 ~
48 h. This would allow for the possibility of determining at what concentration EA3-
induced cytotoxicity becomes due to necrosis rather than apoptosis (as inferred), since it
is widely known that the mode of cell death is dependent upon the dose of a compound
(Healy et al., 1998; Mattson, 2008).
8.2.7 Chapter 7: Two Different Biodiscovery Strategies
8.2.7.1 Random approach
Two extracts of a marine sponge chosen randomly were shown to have strong, selective
cytotoxicity against several cancer cell lines. If more material could be obtained, it
would be worth investigating these particular extracts further in future experiments.
Although not yet taxonomically identified, a voucher specimen was retained, and this
could be used to correctly identify the species so that more can be collected for future
extraction. Importantly, the geographical coordinates of the collection site were
recorded to ensure consistency in sampling when different expeditions take place. These
measures help to safeguard against possible pitfalls associated with the random
collection method where subsequent expeditions can fail to relocate the same organism
(Soejarto, 1996; Hildreth et al., 2007).
8.2.7.2 Guided approach
Despite its use as a traditional medicine, extracts of Haemodorum spicatum displayed
no bioactivity against a panel of several human cancer cell lines. This might have been
because the levels of haemocorin in the extracts were too low, or because the compound
was oxidised, destroyed in methanol, or in a biologically unavailable form.
Alternatively, perhaps another compound in the crude extract masked, or even
antagonised, the cytotoxic activity of the haemocorin. Then again, maybe haemocorin
does not have any antitumour properties, regardless of unsubstantiated claims it does
(Daw et al., 1997; Harborne et al., 1999).

~ Chapter 8 ~ 319
It must be recognised that the traditional medical use of H. spicatum was not necessarily
in the treatment of cancer. Despite haemocorin having purported antitumour properties
(Daw et al., 1997; Harborne et al., 1999), no references could be found that state it was
ever used by Aboriginal people to treat cancer. Of course, this was also the case for
most of the plants initially screened for bioactivity in the current study as it is generally
difficult to establish a direct link between traditional plant remedies and true cancer
(Heinrich and Bremner, 2006). Cancer is not a well-defined disease state in Aboriginal
traditional culture, although it is likely it was recognised as a wasting syndrome and
may have had a specific name (Carrick et al., 1996). However, McGrath et al. (2006)
asserted there is not even an Aboriginal word for cancer. A problem is there is little or
no historical data on cancer in traditional Aboriginal societies prior to white settlement
to know for sure (Low, 1990; Cunningham et al., 2008).
Most ethnomedicines have been developed to treat symptoms of infectious diseases like
gastrointestinal problems, skin diseases and respiratory illnesses (Heinrich & Bremner,
2006) and this appears to be the case for Aboriginal traditional medicines on the whole,
although certain plants were also commonly used as painkillers or to treat ailments like
snakebites and wounds (ACNTA, 1988; Lassak & McCarthy, 2001). To complicate
matters, the same plant was often used to treat many conditions, including symptoms
that may be part of very different disease states. As an example, among its other
medical uses, Eremophila freelingii (part of the current screen) was traditionally used to
treat headache (Low, 1990; Latz, 1995; Lassak & McCarthy, 2001). However,
headaches may be due to stress, tiredness, migraine attack or a brain tumour and so
appropriate screening tests should cover all of the possible underlying biological causes.
Conversely, a particular disease state might be characterised by an array of symptoms

320 ~ Chapter 8 ~
which all must be addressed when searching for leads to treat that particular disease
(Houghton, 2002).
In addition, many different plants could be used to treat the same symptoms. Using the
same example, Latz (1999) reported seven different plants that were used to relieve
headaches, just in Central Australia. Similarly, seven plants were traditionally used to
treat wounds, burns and sores, while 58 were described as ―general medicines‖. Indeed,
few plants were used for very specific purposes and this is thought to be related to the
traditional nomadic lifestyle of Aboriginal people. That is to say, when on the move, it
was better to concentrate on a range of plants with a broad spectrum of uses as the
specific plant required for a particular ailment may be a long way away just when it was
needed (Latz, 1995). Moreover, the season of the year could restrict the availability of
useful plants as the effectiveness of traditional medicines was known to depend on
using the appropriate plant parts or plants at a particular stage of maturation (Lassak &
McCarthy, 2001; Latz, 1995).
This is why the plants in this study were selected based on their purported medicinal
properties against a wide range of conditions, not any specific use against cancer. It is
common practice to screen plants with any reputed ethnomedical use at all for bioactive
compounds that may be useful in treating conditions that may or may not be related to
their traditional use (Lewis et al., 1999, Calderón et al., 2006; Mazzio & Soliman, 2009;
Rizwana et al., 2010). For example, Pennachio et al. (1996, 2005) showed that
methanolic extracts of the leaves of the Aboriginal ―number one medicine‖, Eremophila
alternifolia (ACNTA, 1988; Low, 1990), significantly affected certain aspects of heart
activity in hypertensive rats.

~ Chapter 8 ~ 321
If screening is only performed against one disease target, compounds useful to treat
other diseases may not otherwise be found. However, sometimes even if not specifically
screened for, bioactivity against another disease state may be discovered during testing
against a different target via serendipitous means. A famous example is the discovery of
the powerful antileukemia drugs, vincristine and vinblastine, after researchers
investigating the reputed antidiabetic activity of Catharantus roseus observed that
treated test animals had reduced leukocyte counts (see Section 1.4.4.1.2). For this
reason, the more generalised screening approach to ethnopharmacology is advocated by
many prominent scientists in the field, including Lars Bohlin who advised researchers at
a conference not to discard samples if they show inactivity against one disease target as
they may prove to be useful against another target (Bohlin, 2008).
While this study did not uncover a NCE, the bioactivity of many plants traditionally
used as medicines was supported. Thus, it was concluded that the ethnopharmacological
approach to drug discovery has some merit because the potential for discovering new
compounds exists. However, it may not necessarily be a superior strategy to random
selection when plants are screened against disease targets that are unrelated to their
traditional medical use. This conclusion is endorsed by many, including the editor of
The Practice of Medicinal Chemistry, who concluded that ―all strategies resulting in
identification of lead compounds are a priori equally good and advisable, provided that
the research they subsequently induce is done in a rational manner‖ (Wermuth, 2008).
And in the words of Bohlin‘s colleague, Tulp (1999), ―ethnopharmacology is one road,
but certainly not the only one, and most likely not the best one‖. At least anymore. As
Gertsch (2009) pointed out, the ethnopharmacological approach has historically been
very successful, but few significant discoveries have been made in recent years. He
wonders if the golden years of ethnopharmacology are in the past because the most
322 ~ Chapter 8 ~
relevant plant constituents have already been found, ―the low-hanging fruits have
already been picked‖, or if ethnopharmacologists just have to work harder to find a new
therapeutically useful molecule (Gertsch, 2009, p178).
8.3 OTHER CONSIDERATIONS
It was beyond the scope of this thesis to discuss many other important aspects of
ethnopharmacological research. However, it is important to at least acknowledge the
existence of a few.
8.3.1 Traditional usage
The first point is that it must be recognised that traditional methods of making herbal
medicines, treatment of the extract prior to administration, the effects of other
substances used in herbal mixtures and the dose used should all be taken into account
when scientifically evaluating the efficacy or mechanism of action of traditional
medicines (Houghton et al., 2007). For example, sometimes, a traditional medicine is
prescribed for a substantial length of time, often with no significant improvement
expected for weeks or even months. This type of prolonged dosage is usually not
considered in new drug screening programmes, largely due to a lack of awareness on
the part of the researchers but also because of practical reasons. In vitro technologies are
not suitable for assessing the effects of repeated interactions with tissues or molecular
targets, which also requires large quantities of test materials. Thus, traditional claims of
efficacy may be falsely rejected (Etkin & Elisabetsky, 2005).
8.3.2 Holistic medicine
Secondly, and related to this, is that, traditional medical practices are generally holistic
in nature. For example, in traditional Chinese medicine, the essence of illness is viewed
as symptom-complex (zheng) of the whole body, in contrast to modern scientific
medicine which views it as anatomicopathological (Fan, 2003).

~ Chapter 8 ~ 323
Additionally, many traditional remedies have been shrouded in religion and even magic
over the centuries (Dubick, 1986). Religion and mysticism can often play a big part in
the lives of indigenous cultures and their beliefs, influencing their medical treatments
much more commonly than in conventional, western therapies. While western medicine
often seems to underestimate or ignore the power of the human spirit (Cassell, 1998), in
a 1996 survey of 296 practicing US physicians, 99% were convinced that religious
beliefs can heal, and 75% believed that prayers of others could promote a patient‘s
recovery (Sloan et al., 1999).
However, who are we to judge which philosophy is correct? Surely, if a treatment
works, it works; if it doesn‘t, it doesn‘t. So what if it is due to suggestibility or the
placebo effect if a patient‘s condition is improved? Both systems of healthcare have
their place and should be free to operate according to their own medical standards (Fan
& Hollliday, 2007). However, if the goal of ethnopharmacological research is to
discover a new drug, then evidence-based, placebo-controlled experiments are an
absolute requirement.
It has been suggested that because of the holistic approach of traditional medicine, a
holistic approach to study drug activity of these medicines seems more appropriate than
a reductionist approach (Verpoorte et al., 2006). Etkin & Elisabetsky (2005) argue for a
transdisciplinary approach to ethnopharmacology, spanning both the biological and
social sciences, creating a dynamic tension that encourages dialogue and collaboration.
At the moment, ethnopharmacology is heavily focussed on the biology and
pharmacology of the (mostly) botanical sources of potential drugs, only sometimes
touching on areas like cultural anthropology (Gertsch, 2009). A truly integrated
324 ~ Chapter 8 ~
approach would aid in facing the particular challenges of ethnopharmacology that were
described in Section 1.4.4.2 of the General Introduction.
8.3.3 Endophytes
Thirdly, it has been shown for many bioactive plant extracts that the active constituents
are also produced by bacteria or fungi living inside the plant (Tan & Zou, 2001; Strobel
& Daisy, 2003). These microorganisms, which do not overtly harm the plant, are known
as endophytes and are ubiquitous in nature (Tan & Zou, 2001; Guo et al., 2008). In fact,
it is believed that of the nearly 300,000 known plant species, each individual plant is
host to one or more endophytes (Strobel & Daisy, 2003). It is thought that the reason
why some endophytes produce phytochemicals originally characteristic of the host
might be due to a recombination of the endophyte and host genes during evolution of
the symbiotic or commensal relationship (Stierle et al., 1993; Tan & Zou, 2001). As
very few plants have been studied in terms of their endophyte biology, great
opportunities exist to find new and interesting endophytic microorganisms that may
prove useful in drug discovery and development (Strobel & Daisy, 2003). Indeed, if
endophytes can produce the same rare and important bioactive compounds as their host
plants, this would reduce the need to harvest slow growing and/or rare plants, in the
process helping to preserve the world‘s ever-diminishing biodiversity. Moreover, as a
microbial source of a valued product may be easier and more economical to produce, its
market price would be effectively reduced (Strobel & Daisy, 2003). Already, isolates of
different fungal endophytes, obtained from various Taxus species have been shown to
produce the potent and expensive anticancer drug paclitaxel (see Appendix M) in
culture (Stierle et al., 1993; Strobel et al., 1996; Li et al., 1996). Paclitaxel isolated from
these sources is biologically active against certain cancer cell lines, is spectroscopically
identical to authentic paclitaxel, and accumulates in cultures at the level of micrograms
per litre. Hence, via fermentation technology, endophytes may present a dependable and

~ Chapter 8 ~ 325
cheaper source of NPs than their corresponding host plants and this potential should be
further investigated.
8.3.4 Drug development
Finally, there remains a gulf between converting potential drug leads into clinically
effective drugs. The high failure rate of drug candidates during drug discovery and
development is often due to their lack of ―drug-like properties‖, including
physicochemical, (e.g. solubility, stability) and biological (e.g. absorption, metabolism,
toxicity) characteristics that are consistent with good clinical performance (Borchardt et
al., 2004; see Section 1.3.5). Inadequate drug-like properties can mean increased
development time and costs and even project cancellation. For example, an elaborate
formulation may be required for poorly soluble compounds, an expensive delivery
vehicle may be needed for poorly permeable compounds, low bioavailability may create
concerns about patient variability, rapid clearance may mean many doses per day are
required, and clinical drug-drug interactions and toxicity could all result in an abrupt
end to further clinical development (Borchardt et al., 2004). Thus, there are arguments
that it is better for a drug candidate to ―fail early and cheaply‖, but the reality is that
active pharmacophores are rare and precious and cannot be discarded lightly. Therefore,
the newer strategy is to try to fix pharmaceutical properties during the discovery process
via structural modifications (Borchardt et al., 2004).
Orally administered drugs account for more than 75% of the drug market. However, the
inability to predict absorption, distribution, metabolism, excretion and toxicity
(ADMET) properties has been the main reason why clinical testing of drug candidates
has been terminated (Hodgson, 2001; Artursson & Mattsson, 2004; Lee & Dordick,
2006). If a drug cannot be administered orally due to low absorption, it will not be
considered for further development simply because alternative administration routes are

326 ~ Chapter 8 ~
too complex (Artursson & Mattsson, 2004). The rate limiting steps of oral drug
absorption are drug solubility in the intestinal lumen and passive drug permeability
across the intestinal wall (Artursson & Mattsson, 2004; Bergström, 2005). Therefore,
drug delivery strategies are an increasingly important part of current development
tactics. For example, within the same School as the current studies were undertaken,
there is ongoing research on the prospect of using nanoparticles to deliver drugs into
cells (Ren et al., 2007; Cheng & Lim, 2009). Potentially, future collaborations between
these two laboratories could result in the optimisation of any potent anticancer drug
candidate that is identified via ethnopharmacological knowledge, regardless of poor
ADMET properties.
This is a similar situation to what is occurring at the University of Wollongong, where
cancer researchers based in the School of Biological Sciences are collaborating with
chemists in the same Faculty (Vine et al., 2007; Matesic et al., 2008; Locke et al.,
2009). These researchers, who have patented their ideas (Australian Patent No.
AU2007/001966, Perrow et al., 2008), hope to develop a new generation of targeted
cancer therapeutics based on potent toxins coupled to an improved delivery agent that
selectively identifies and targets a critical biomarker of cancer malignancy in order to
deliver novel toxins directly to tumours, thus minimising toxicity and adverse side
effects ("Identifying malignancy markers," 2009). Meanwhile, related theoretical
research is being carried out by members of the Nanomechanics Group in the School of
Mathematics and Applied Statistics within the same university, providing further
opportunity for future collaborations. These researchers are investigating the feasibility
of using carbon nanotubes as drug carriers (Hilder & Hill, 2008). Nanotubes are an
improvement on nanoparticle delivery methods, offering the perfect isolated
environment for a drug, until it reaches its target site, protecting it from degradation as

~ Chapter 8 ~ 327
well as from reactions with healthy cells. Efficient intracellular delivery of a drug can
allow a stronger drug to be used at a smaller dosage and can reduce nonspecific effects
and toxicity, as well as enhance the effectiveness of drugs incapable of reaching their in
vivo therapeutic targets (Hilder & Hill, 2009). The use of such targeted drug delivery
techniques means that the ―magic bullet‖ concept proposed by Paul Ehrlich over a
century ago is fast becoming reality for cancer therapy (Strebhardt & Ullrich, 2008).
8.4 FINAL WORD
Even though this project did not result in the discovery of a NCE to treat cancer, it is
argued that the exercise was worthwhile. Several of the main constituents of EA3 have
known antitumour properties, although these were likely not responsible for all of its
observed cytotoxicity. The active principle/s of this and other promising extracts were
not identified as part of the present study, but it was only possible to evaluate three
constituents. Any of the compounds not tested may yet be shown to be therapeutically
useful, or even be a NCE. Additionally, all the extracts could be tested for bioactivity

328 ~ Chapter 8 ~
against a plethora of other targets, including diseases that the plants are used to treat in
traditional Aboriginal societies. Moreover, simply scientifically verifying the medicinal
value of the extracts of plants traditionally used as medicines by Aboriginal people has
its own merit. The validation of the bioactivity of their medicines will hopefully give
the Indigenous communities who provided the TK a sense of empowerment and can
only add to their rich heritage. It might also inspire other Aboriginal communities to
share their TK of plant medicines to aid in the never-ending search for new compounds
to combat diseases.

329
330
Bibliography
ACRONYMS
ABS Australian Bureau of Statistics
ACNTA Aboriginal Communities of the Northern Territory of Australia
AIHW and AACR Australian Institute of Health and Welfare and
Australasian Association of Cancer Registries
ANSPA Australian Native Plants Society Australia
CBD Convention on Biological Diversity
CCWA Chemistry Centre of Western Australia
DKCRC Desert Knowledge Cooperative Research Centre
NEPAD New Partnership for Africa‘s Development
REFERENCES
The Australian Concise Oxford Dictionary 5th
. (2009). Melbourne: Oxford University
Press.
Abate, T. (1999, 3rd
February). Shaman quits the drug business. San Francisco
Chronicle. Retrieved 5th
May 2007, from http://www.sfgate.com/cgi-
bin/article.cgi?file=/chronicle/archive/1999/02/03/BU6549.DTL.
Abe, K., & Matsuki, N. (2000). Measurement of cellular 3-(4,5-dimethylthiazol-2-yl)-
2,5-diphenyltetrazolium bromide (MTT) reduction activity and lactate
dehydrogenase release using MTT. Neuroscience Research, 38(4), 325-329.
ABS. (2007). Year book Australia, 2007. Mortality trends of people aged 50 years and
over. (No. 1301.0 ). Canberra. ABS. Retrieved 17th
January 2007, from
http://www.abs.gov.au/Ausstats/[email protected]/bb8db737e2af84b8ca2571780015701
e/D4CAD35CB0C23B40CA2572360002AE29?opendocument#1.%20Australia
n%20Bureau%20of%20Statistic.
Abu-Surrah, A. S., & Kettunen, M. (2006). Platinum group antitumor chemistry: design
and development of new anticancer drugs complementary to cisplatin. Current
Medicinal Chemistry, 13(11), 1337-1357.
Ackland, M. L., van de Waarsenburg, S., & Jones, R. (2005). Synergistic
antiproliferative action of the flavonols quercetin and kaempferol in cultured
human cancer cell lines. In Vivo, 19(1), 69-76.
ACNTA. (1988). Traditional bush medicines: an Aboriginal pharmacopoeia.
Melbourne: Greenhouse Publications.
Adams, D. J. (2005). The impact of tumor physiology on camptothecin-based drug
development. Current Medicinal Chemistry Anticancer Agents, 5(1), 1-13.
331
Adams, D. J., Wahl, M. L., Flowers, J. L., Sen, B., Colvin, M., Dewhirst, M. W., et al.
(2006). Camptothecin analogs with enhanced activity against human breast
cancer cells. II. Impact of the tumor pH gradient. Cancer Chemotherapy and
Pharmacology, 57(2), 145-154.
Adams, G. P., & Weiner, L. M. (2005). Monoclonal antibody therapy of cancer. Nature
Biotechnology, 23(9), 1147-1157.
Agarwal, C., Singh, R. P., & Agarwal, R. (2002). Grape seed extract induces apoptotic
death of human prostate carcinoma DU145 cells via caspases activation
accompanied by dissipation of mitochondrial membrane potential and
cytochrome c release. Carcinogenesis, 23(11), 1869-1876.
Agarwal, C., Yogesh, S., & Agarwal, R. (2000). Anticarcinogenic effect of a
polyphenolic fraction isolated from grape seeds in human prostate carcinoma
DU145 cells: modulation of mitogenic signaling and cell-cycle regulators and
induction of G1 arrest and apoptosis. Molecular Carcinogenesis, 28(3), 129-138.
Aggarwal, B. B., Kumar, A., & Bharti, A. C. (2003). Anticancer potential of curcumin:
preclinical and clinical studies. Anticancer Research, 23(1A), 363-398.
Agrawal, P., & Saibaba, P. (2001). TRIPS and India's pharmaceuticals industry.
Economic and Political Weekly, 36(39), 3787-3790.
Agutter, P. S. (2008). Elucidating the mechanism(s) of hormesis at the cellular level: the
universal cell response. American Journal of Pharmacology and Toxicology,
3(1), 100-110,.
Aherne, W., Garrett, M., McDonald, T., & Workman, P. (2002). Mechanism-based
high-throughput screening for novel anticancer drug discovery. In Baguley, B.
C. & Kerr, D. J. (Eds.), Anticancer Drug Development (pp. 249-267). London:
Academic Press.
Ahmad, S., Ahmad, A., Schneider, K. B., & White, C. W. (2006). Cholesterol interferes
with the MTT assay in human epithelial-like (A549) and endothelial (HLMVE
and HCAE) cells. International Journal of Toxicology, 25(1), 17-23.
AIHW, & AACR. (2008). Cancer in Australia: an overview, 2008. Canberra: AIHW.
Retrieved 15th
November, 2009, from
http://www.aihw.gov.au/publications/can/ca08/ca08.pdf.
Ajiro, K., Scoltock, A. B., Smith, L. K., Ashasima, M., & Cidlowski, J. A. (2010).
Reciprocal epigenetic modification of histone H2B occurs in chromatin during
apoptosis in vitro and in vivo. Cell Death and Differentiation, 17(6), 984-993.
Akdis, C. A., & Blaser, K. (2003). Histamine in the immune regulation of allergic
inflammation. Journal of Allergy and Clinical Immunology, 112(1), 15-22.
Al-Joudi, F. S., Alias, I. Z., & Samsudin, A.-R. (2005). The effects of chemotherapeutic
drugs on viabilty, apoptosis, and survivin expression in MCF-7 cells. Acta
Histochemica et Cytochemica, 38(5), 323-330.
Al-Lamki, R. S., Skepper, J. N., Loke, Y. W., King, A., & Burton, G. J. (1998).
Apoptosis in the early human placental bed and its discrimination from necrosis
using the in-situ DNA ligation technique. Human Reproduction, 13(12), 3511-
3519.
Albanell, J., Codony, J., Rovira, A., Mellado, B., & Gascon, P. (2003). Mechanism of
action of anti-HER2 monoclonal antibodies: scientific update on trastuzumab
and 2C4. Advances in Experimental Medicine and Biology, 532, 253-268.
Alberts, B., Bray, D., Hopkin K., Johnson, A., Lewis, J., Raff, M., et al. (2004).
Essential cell biology (2nd ed.). New York: Garland Science.
Alberts, B., Johnson, A., Lewis, J., Raff, M., Roberts, K. a., & Walter, P. (2002).
Molecular biology of the cell. New York: Garland Science.

332
Alley, M. C., Scudiero, D. A., Monks, A., Hursey, M. L., Czerwinski, M. J., Fine, D. L.,
et al. (1988). Feasibility of drug screening with panels of human tumor cell lines
using a microculture tetrazolium assay. Cancer Research, 48(3), 589-601.
Alter, J. M. (2000). International biopiracy versus the value of local knowlege.
Capitalism Nature Socialism, 11(2), 59 - 66.
Altınoğlu, E. I., & Adair, J. H. (2009). Calcium phosphate nanocomposite particles: a
safer and more effective alternative to conventional chemotherapy? Future
Oncology, 5(3), 279-281.
Altmann, K. H. (2001). Microtubule-stabilizing agents: a growing class of important
anticancer drugs. Current Opinion in Chemical Biology, 5(4), 424-431.
Amador, E., & Wacker, W. E. C. (1962). Serum glutamic-oxaloacetic transaminase
activity: a new modification and an analytical assessment of current assay
technics. Clinical Chemistry, 8(4), 343-350.
Amaro, M. I., Monasterios, M., Avendano, M., & Charris, J. (2009). Preliminary
evaluation of the toxicity of some synthetic furan derivatives in two cell lines
and Artemia salina. Journal of Applied Toxicology, 29(1), 36-41.
Amirghofran, Z., Bahmani, M., Azadmehr, A., Ashouri, E., & Javidnia, K. (2007).
Antitumor activity and apoptosis induction in human cancer cell lines by
Dionysia termeana. Cancer Investigation, 25(7), 550-554.
Anderson, K. M., Seed, T., Vos, M., Mulshine, J., Meng, J., Alrefai, W., et al. (1998).
5-Lipoxygenase inhibitors reduce PC-3 cell proliferation and initiate nonnecrotic
cell death. The Prostate, 37(3), 161-173.
Anderson, L. M. (2005). Cancer biology and hormesis: comments on Calabrese (2005).
Critical Reviews in Toxicology, 35(6), 583-586.
Andreani, A., Burnelli, S., Granaiola, M., Leoni, A., Locatelli, A., Morigi, R., et al.
(2010). Antitumor activity and COMPARE analysis of bis-indole derivatives.
Bioorganic and Medicinal Chemistry, 18(9), 3004-3011.
ANPSA. (2007). Thysanotus tuberosus. Retrieved 20th
February, 2010, from
http://asgap.org.au/t-tub.html.
Ansah, C., & Gooderham, N. J. (2002). The popular herbal antimalarial, extract of
Cryptolepis sanguinolenta, is potently cytotoxic. Toxicological Sciences, 70(2),
245-251.
Antimicrobial Agents and Chemotherapy: 2007 Instructions to Authors. (2007).
Antimicrobial Agents and Chemotherapy, 51(1), 1-22.
Antisoma- Targeting cancer. (2006). Retrieved 12th
June, 2010, from
http://www.antisoma.com/asm/siteservices/search?freesearch=ecobiotics.
Archer, R. (1999). The drug discovery factor: An inevitable evolutionary consequence
of high-throughput parallel processing. Nature Biotechnology, 17(9), 834.
Arpino, G., Weiss, H., Lee, A. V., Schiff, R., De Placido, S., Osborne, C. K., et al.
(2005). Estrogen receptor-positive, progesterone receptor-negative breast cancer:
association with growth factor receptor expression and tamoxifen resistance.
Journal of the National Cancer Institute, 97(17), 1254-1261.
Artursson, P., & Mattsson, P. (2004). Absorption prediction. In Borchardt, R. T., Kerns,
E. H., Lipinski, C. A., Thakker, D. R. & Wang, B. (Eds.), Pharmaceutical
profiling in drug discovery for lead selection (pp. 3-26). Arlington: Springer.
Aspollah Sukari, M., Wah, T. S., Saad, S. M., Rashid, N. Y., Rahmani, M., Lajis, N. H.,
et al. (2010). Bioactive sesquiterpenes from Curcuma ochrorhiza and Curcuma
heyneana. Natural Product Research, 24(9), 838 - 845.
Astin, J. A. (1998). Why patients use alternative medicine: results of a national study.
Journal of the American Medical Association, 279(19), 1548-1553.

333
Astsaturov, I., Cohen, R. B., & Harari, P. M. (2006). EGFR-targeting monoclonal
antibodies in head and neck cancer. Current Cancer Drug Targets, 6(8), 691-
710.
Ayehunie, S., Belay, A., Baba, T. W., & Ruprecht, R. M. (1998). Inhibition of HIV-1
replication by an aqueous extract of Spirulina platensis (Arthrospira platensis).
Journal of Acquired Immune Deficiency Syndromes, 18(1), 7-12.
Bagchi, D. (2006). Nutraceuticals and functional foods regulations in the United States
and around the world. Toxicology, 221(1), 1-3.
Baker, D. D., Chu, M., Oza, U., & Rajgarhia, V. (2007). The value of natural products
to future pharmaceutical discovery. Natural Product Reports, 24(6), 1225-1244.
Barry, E., Alvarez, J. A., Scully, R. E., Miller, T. L., & Lipshultz, S. E. (2007).
Anthracycline-induced cardiotoxicity: course, pathophysiology, prevention and
management. Expert Opinion on Pharmacotherapy, 8(8), 1039-1058.
Basson, M. D., Hong, F., & Emenaker, N. J. (1995). Specific modulation of intestinal
epithelial brush border enzyme expression by a phorbol ester. Journal of
Surgical Research, 59(1), 121-126.
Batchelor, R. H., & Zhou, M. (2004). Use of cellular glucose-6-phosphate
dehydrogenase for cell quantitation: applications in cytotoxicity and apoptosis
assays. Analytical Biochemistry, 329(1), 35-42.
Baumgartner, H. K., Gerasimenko, J. V., Thorne, C., Ferdek, P., Pozzan, T., Tepikin, A.
V., et al. (2009). Calcium elevation in mitochondria is the main Ca2+
requirement for mitochondrial permeability transition pore (mPTP) opening
Journal of Biological Chemistry, 284(31), 20796-20803.
Becerra, J. X., Noge, K., & Venable, D. L. (2009). Macroevolutionary chemical
escalation in an ancient plant-herbivore arms race. Proceedings of the National
Academy of Sciences, 106(43), 18062-18066.
Beckon, W. N., Parkins, C., Maximovich, A., & Beckon, A. V. (2008). A general
approach to modeling biphasic relationships. Environmental Science and
Technology, 42(4), 1308-1314.
Beecher, G. R. (2003). Overview of dietary flavonoids: nomenclature, occurrence and
intake. Journal of Nutrition, 133(10), 3248S-3254S.
Beecken, W. D., Engl, T., Ringel, E. M., Camphausen, K., Michaelis, M., Jonas, D., et
al. (2006). An endogenous inhibitor of angiogenesis derived from a transitional
cell carcinoma: clipped 2-glycoprotein-I. Annals of Surgical Oncology, 13(9),
1241-1251.
Berger, A. B., Sexton, K. B., & Bogyo, M. (2006). Commonly used caspase inhibitors
designed based on substrate specificity profiles lack selectivity. Cell Research,
16(12), 961-963.
Bergström, C. A. S. (2005). Computational models to predict aqueous drug solubility,
permeability and intestinal absorption. Expert Opinion on Drug Metabolism &
Toxicology, 1(4), 613-627.
Bernhardt, P. V., Chin, P., Sharpe, P. C., Wang, J. Y., & Richardson, D. R. (2005).
Novel diaroylhydrazine ligands as iron chelators: coordination chemistry and
biological activity. Journal of Biological Inorganic Chemistry, 10(7), 761-777.
Berridge, M. J. (1995). Capacitative calcium entry. Biochemical Journal, 312 ( Pt 1), 1-
11.
Bierer, D. E., Thomas, J. C., & King, S. R. (1997). Shaman pharmaceuticals: integrating
indigenous knowledge, tropical medicinal plants, medicine, modern science and
reciprocity into a novel drug discovery approach. . Network science. Retrieved
10th
April 2010, from http://www.netsci.org/Science/Special/feature11.html

334
Binaschi, M., Bigioni, M., Cipollone, A., Rossi, C., Goso, C., Maggi, C. A., et al.
(2001). Anthracyclines: selected new developments. Current Medicinal
Chemistry Anticancer Agents, 1(2), 113-130.
Bindon, P. (1996). Useful bush plants. Perth, Australia: Western Australian Museum.
BioProspect. (2010). Retrieved 12th
June, 2010, from
http://www.bioprospect.com/index.html.
Birnbaumer, L. (2009). The TRPC class of ion channels: A critical review of their roles
in slow, sustained increases in intracellular Ca2+
concentrations. Annual Review
of Pharmacology and Toxicology, 49(1), 395-426.
Blagosklonny, M. V. (2006). Target for cancer therapy: proliferating cells or stem cells.
Leukemia, 20(3), 385-391.
Blaustein, M. P., & Lederer, W. J. (1999). Sodium/calcium exchange: Its physiological
implications. Physiological Reviews, 79(3), 763-854.
Blaustein, R. (2006). Genetic resources and the Convention on Biological Diversity.
BioScience, 56(7), 560-563.
Bleyer, W. A. (1978). The clinical pharmacology of methotrexate. New applications of
an old drug. Cancer, 41(1), 36-51.
Blom, A., Ekman, E., Johannisson, A., Norrgren, L., & Pesonen, M. (1998). Effects of
xenoestrogenic environmental pollutants on the proliferation of a human breast
cancer cell line (MCF-7). Archives of Environmental Contamination and
Toxicology, 34(3), 306-310.
Blume, E. (1991). Government moves to increase taxol supply. Journal of the National
Cancer Institute, 83(15), 1054-1056.
Bodeker, G., & Kronenberg, F. (2002). A public health agenda for traditional,
complementary, and alternative medicine. American Journal of Public Health,
92(10), 1582-1591.
Boehm-Viswanathan, T. (2000). Is angiogenesis inhibition the holy grail of cancer
therapy? Current Opinion in Oncology, 12(1), 89-94.
Bohlin, L. "In the foot steps of Linnaeus – an integrated view on pharmacognosy."
Natural Products with pharmaceutical, nutraceutical, cosmetic and agrochemical
interest (Conference). Athens, Greece. 6th
August, 2008
Bopp, S., & Lettieri, T. (2008). Comparison of four different colorimetric and
fluorometric cytotoxicity assays in a zebrafish liver cell line. BMC
Pharmacology, 8(1), 8.
Borchardt, R. T., Kerns, E. H., Lipinski, C. A., Thakker, D. R., & Wang, B. (2004).
Pharmaceutical profiling in drug discovery for lead selection. Arlington:
Springer.
Borner, M. M., Schneider, E., Pirnia, F., Sartor, O., Trepel, J. B., & Myers, C. E.
(1994). The detergent Triton X-100 induces a death pattern in human carcinoma
cell lines that resembles cytotoxic lymphocyte-induced apoptosis. FEBS Letters,
353(2), 129-132.
Bose, R. N. (2002). Biomolecular targets for platinum antitumor drugs. Mini Reviews in
Medicinal Chemistry, 2(2), 103-111.
Boumendjel, A., Baubichon-Cortay, H., Trompier, D., Perrotton, T., & Di Pietro, A.
(2005). Anticancer multidrug resistance mediated by MRP1: recent advances in
the discovery of reversal agents. Medicinal Research Reviews, 25(4), 453-472.
Boyd, M. R., & Paull, K. D. (1995). Some practical considerations and applications of
the National Cancer Institute in vitro anticancer drug discovery screen. Drug
Development Research, 34(2), 91-109.
Brain, P., & Cousens, R. (1989). An equation to describe dose responses where there is
stimulation of growth at low doses. Weed Research, 29(2), 93-96.
335
Bravo, E. (1998). The impact of the Convention on Biological Diversity in Ecuador.
Beyond Law, 6(18-19), 73-81.
Brinkley, B. R., Beall, P. T., Wible, L. J., Mace, M. L., Turner, D. S., & Cailleau, R. M.
(1980). Variations in cell form and cytoskeleton in human breast carcinoma cells
in vitro. Cancer Research, 40(9), 3118-3129.
Brittan, N. H. (1981). Revision of the genus Thysanotus R.Br. (Liliaceae). Brunonia,
4(1), 67-181.
Broach, J. R., & Thorner, J. (1996). High-throughput screening for drug discovery.
Nature, 384(6604 Suppl), 14-16.
Brower, V. (2010). Telomerase-based therapies emerging slowly. Journal of the
National Cancer Institute, 102(8), 520-521.
Brown, C. J., Lain, S., Verma, C. S., Fersht, A. R., & Lane, D. P. (2009). Awakening
guardian angels: drugging the p53 pathway. Nature Reviews Cancer, 9(12), 862-
873.
Brown, J. M., & Wilson, W. R. (2004). Exploiting tumour hypoxia in cancer treatment.
Nature Reviews. Cancer, 4(6), 437-447.
Bruchey, A. K., & Gonzalez-Lima, F. (2008). Behavioral, physiological and
biochemical hormetic responses to the autoxidizable dye methylene blue.
American Journal of Pharmacology and Toxicology, 3(1), 72-79.
Brunner, K. T., Mauel, J., Ceronttini, J. C., & Chapuis, B. (1968). Quantitative assay of
the lytic action of immune lymphoid cells on 51
Cr-labelled allogeneic target cells
in vitro; inhibition by isoantibody and by drugs. Immunology, 14(2), 181-196.
Bruschi, G., Bruschi, M. E., Regolisti, G., & Borghetti, A. (1988). Myoplasmic Ca2+
-
force relationship studied with fura-2 during stimulation of rat aortic smooth
muscle. American Journal of Physiology, 254(5 Pt 2), H840-854.
Brusselmans, K., Vrolix, R., Verhoeven, G., & Swinnen, J. V. (2005). Induction of
cancer cell apoptosis by flavonoids is associated with their ability to inhibit fatty
acid synthase activity. Journal of Biological Chemistry, 280(7), 5636-5645.
Budman, D. R., Calabro, A., & Kreis, W. (2002). Synergistic and antagonistic
combinations of drugs in human prostate cancer cell lines in vitro. Anticancer
Drugs, 13(10), 1011-1016.
Bull, A. T., & Stach, J. E. M. (2007). Marine actinobacteria: new opportunities for
natural product search and discovery. Trends in Microbiology, 15(11), 491-499.
Burger, A. M., & Seth, A. K. (2004). The ubiquitin-mediated protein degradation
pathway in cancer: therapeutic implications. European Journal of Cancer,
40(15), 2217-2229.
Busse, D., Doughty, R. S., Ramsey, T. T., Russell, W. E., Price, J. O., Flanagan, W. M.,
et al. (2000). Reversible G1 arrest induced by inhibition of the epidermal growth
factor receptor tyrosine kinase requires up-regulation of p27KIP1 independent of
MAPK activity. Journal of Biological Chemistry, 275(10), 6987-6995.
Butler, M. S. (2004). The role of natural product chemistry in drug discovery Journal of
Natural Products, 67(12), 2141-2153.
Caesar, J. (50-40 B.C.). The Gallic Wars.Translated by McDevitte, W. A. & Bohn, W.
S. The Internet Classics Archive by Daniel C. Stevenson, Book 6, Chapter 31.
Web Atomics. Retrieved 3rd
March, 2010 from
http://classics.mit.edu//Caesar/gallic.html
Cai, J., & Lee, C. W. (1996). Tamoxifen inhibits nitrobenzylthioinosine-sensitive
equilibrative uridine transport in human MCF-7 breast cancer cells. Biochemical
Journal, 320(3), 991-995.
Calabrese, E. J. (2004). Hormesis: from marginalization to mainstream: a case for
hormesis as the default dose-response model in risk assessment. Toxicology and
Applied Pharmacology, 197(2), 125-136.
336
Calabrese, E. J. (2005a). Cancer biology and hormesis: human tumor cell lines
commonly display hormetic (biphasic) dose responses. Critical Reviews in
Toxicology, 35(6), 463-582.
Calabrese, E. J. (2005b). Historical blunders: how toxicology got the dose-response
relationship half right. Cellular and Molecular Biology (Noisy-le-grand), 51(7),
643-654.
Calabrese, E. J. (2005c). Paradigm lost, paradigm found: the re-emergence of hormesis
as a fundamental dose response model in the toxicological sciences.
Environmental Pollution, 138(3), 379-411.
Calabrese, E. J. (2005d). Toxicological awakenings: the rebirth of hormesis as a central
pillar of toxicology. Toxicology and Applied Pharmacology, 204(1), 1-8.
Calabrese, E. J. (2008a). Hormesis and medicine. British Journal of Clinical
Pharmacology, 66(5), 594-617.
Calabrese, E. J. (2008b). Hormesis: why it is important to toxicology and toxicologists.
Environmental Toxicology and Chemistry, 27(7), 1451-1474.
Calabrese, E. J. (2009a). Getting the dose-response wrong: why hormesis became
marginalized and the threshold model accepted. Archives of Toxicology, 83(3),
227-247.
Calabrese, E. J. (2009b). Hormesis: a conversation with a critic. Environmental Health
Perspectives, 117, 1339-1343.
Calabrese, E. J. (2010). Hormesis: Calabrese responds, Environmental Health
Perspectives (Vol. 118, pp. A153-A154): Superintendent of Documents.
Calabrese, E. J., Bachmann, K. A., Bailer, A. J., Bolger, P. M., Borak, J., Cai, L., et al.
(2007). Biological stress response terminology: integrating the concepts of
adaptive response and preconditioning stress within a hormetic dose-response
framework. Toxicology and Applied Pharmacology, 222(1), 122-128.
Calabrese, E. J., & Baldwin, L. A. (1998). Hormesis as a biological hypothesis.
Environmental Health Perspectives, 106 Suppl 1, 357-362.
Calabrese, E. J., & Baldwin, L. A. (1999). The marginalization of hormesis. Toxicologic
Pathology, 27(2), 187-194.
Calabrese, E. J., & Baldwin, L. A. (2000a). Chemical hormesis: its historical
foundations as a biological hypothesis. Human and Experimental Toxicology,
19(1), 2-31.
Calabrese, E. J., & Baldwin, L. A. (2000b). Tales of two similar hypotheses: the rise
and fall of chemical and radiation hormesis. Human and Experimental
Toxicology, 19(1), 85-97.
Calabrese, E. J., & Baldwin, L. A. (2002). Defining hormesis. Human and Experimental
Toxicology, 21(2), 91-97.
Calabrese, E. J., & Baldwin, L. A. (2003a). Hormesis: the dose-response revolution.
Annual Review of Pharmacology and Toxicology, 43(1), 175-197.
Calabrese, E. J., & Baldwin, L. A. (2003b). The hormetic dose-response model is more
common than the threshold model in toxicology. Toxicological Sciences, 71(2),
246-250.
Calabrese, E. J., Baldwin, L. A., & Holland, C. D. (1999). Hormesis: a highly
generalizable and reproducible phenomenon with important implications for risk
assessment. Risk Analysis, 19(2), 261-281.
Calabrese, E. J., Stanek, E. J., 3rd, Nascarella, M. A., & Hoffmann, G. R. (2008).
Hormesis predicts low-dose responses better than threshold models.
International Journal of Toxicology, 27(5), 369-378.
Calabrese, E. J., Staudenmayer, J. W., & Stanek, E. J. (2006a). Drug development and
hormesis: changing conceptual understanding of the dose response creates new

337
challenges and opportunities for more effective drugs. Current Opinion in Drug
Discovery and Development, 9(1), 117-123.
Calabrese, E. J., Staudenmayer, J. W., Stanek, E. J., 3rd, & Hoffmann, G. R. (2006b).
Hormesis outperforms threshold model in National Cancer Institute antitumor
drug screening database. Toxicological Sciences, 94(2), 368-378.
Calderón, Ã. I., Vázquez, Y., Solís, P. N., Caballero-George, C., Zacchino, S.,
Gimenez, A., et al. (2006). Screening of Latin American plants for cytotoxic
activity. Pharmaceutical Biology, 44(2), 130-140.
Callahan, B. G. (2005). Can hormesis be a default for dose-response? Human and
Experimental Toxicology, 24(5), 271-273.
Campbell, A. K. (1990). Calcium as an intracellular regulator. Proceedings of the
Nutrition Society, 49(1), 51-56.
Campbell, J. K., Canene-Adams, K., Lindshield, B. L., Boileau, T. W. M., Clinton, S.
K., & Erdman, J. W., Jr. (2004). Tomato phytochemicals and prostate cancer
risk. Journal of Nutrition, 134(12), 3486S-3492.
Campbell, J. K., King, J. L., Harmston, M., Lila, M. A., & Erdman Jr., J. W. (2006).
Synergistic effects of flavonoids on cell proliferation in Hepa-1c1c7 and LNCaP
cancer cell lines. eJournal of Food Science, 71(4), S358-S363.
Canalejo, A., Almaden, Y., Torregrosa, V., Gomez-Villamandos, J. C., Ramos, B.,
Campistol, J. M., et al. (2000). The in vitro effect of calcitriol on parathyroid
cell proliferation and apoptosis. Journal of the American Society of Nephrology,
11(10), 1865-1872.
Cantoni, O., Christie, N. T., Swann, A., Drath, D. B., & Costa, M. (1984). Mechanism
of HgCl2 cytotoxicity in cultured mammalian cells. Molecular Pharmacology,
26(2), 360-368.
Capdeville, R., Buchdunger, E., Zimmermann, J., & Matter, A. (2002). Glivec (STI571,
imatinib), a rationally developed, targeted anticancer drug. Nature Reviews.
Drug Discovery, 1(7), 493-502.
Carafoli, E. (1992). The Ca2+
pump of the plasma membrane. Journal of Biological
Chemistry, 267(4), 2115-2118.
Carafoli, E., Santella, L., Branca, D., & Brini, M. (2001). Generation, control, and
processing of cellular calcium signals. Critical Reviews in Biochemistry and
Molecular Biology, 36(2), 107-260.
Carballo, J. L., Hernandez-Inda, Z. L., Perez, P., & Garcia-Gravalos, M. D. (2002). A
comparison between two brine shrimp assays to detect in vitro cytotoxicity in
marine natural products. BMC Biotechnology, 2, 17.
Cardoso, F., Ross, J. S., Picart, M. J., Sotiriou, C., & Durbecq, V. (2004). Targeting the
ubiquitin-proteasome pathway in breast cancer. Clinical Breast Cancer, 5(2),
148-157.
Carelli, G., & Iavicoli, I. (2002). Defining hormesis: the necessary tool to clarify
experimentally the low dose-response relationship. Human and Experimental
Toxicology, 21(2), 103-104; discussion 113-104.
Carnero, A. (2006). High throughput screening in drug discovery. Clinical and
Translational Oncology, 8(7), 482-490.
Carr, R. A. E., Congreve, M., Murray, C. W., & Rees, D. C. (2005). Fragment-based
lead discovery: leads by design. Drug Discovery Today, 10(14), 987-992.
Carrick, S., Clapham, K., Paul, C., Plant, A., & Redman, S. (1996). Breast cancer and
Aboriginal and Torres Strait Islander women. Sydney. Centre, N. N. B. C.
Retrieved 12th
June, 2010, from http://www.nbcc.org.au.
Cassell, E. J. (1998). The nature of suffering and the goals of medicine. Loss, Grief and
Care, 8(1), 129-142.

338
CBD. (2000). Sustaining life on Earth. How the Convention on Biological Diversity
promotes nature and human well-being. Montreal. United Nations Environment
Programme. Retrieved 4th
April, 2010, from
http://www.cbd.int/iyb/doc/prints/cbd-sustain-en.pdf.
CBD. (2008). Access and benefit-sharing in practice: Trends in partnerships across
sectors (No. Technical Series No. 38). Montreal. United Nations Environment
Programme. Retrieved 4th April, 2010, from
http://www.peopleandplants.org/storage/CBD-TS38-web.pdf.
CCWA. (2001). Annual Report 2000/01. Perth: Department of Mineral and Petroleum
Resources. Government of Western Australia. Retrieved 28th
May, 2010, from
http://www.parliament.wa.gov.au/publications/tabledpapers.nsf/displaypaper/36
10806ace25f11df198859448256aff00120a26/$file/chemcentre2001.pdf.
Cecchinato, V., Chiaramonte, R., Nizzardo, M., Cristofaro, B., Basile, A., Sherbet, G.
V., et al. (2007). Resveratrol-induced apoptosis in human T-cell acute
lymphoblastic leukaemia MOLT-4 cells. Biochemical Pharmacology, 74(11),
1568-1574.
Chacko, S., & Sambuc, H.-P. (2003). Blockbusters, traditional knowledge and
intellectual property. Indigenous Law Bulletin, 5(22), 12-13.
Chadha, V., Garg, U., & Alon, U. S. (2001). Measurement of urinary concentration: a
critical appraisal of methodologies. Pediatric Nephrology, 16(4), 374-382.
Chan, F. L., Choi, H. L., Chen, Z. Y., Chan, P. S. F., & Huang, Y. (2000). Induction of
apoptosis in prostate cancer cell lines by a flavonoid, baicalin. Cancer Letters,
160(2), 219-228.
Chan, T. C. K. (1989). Calcium-independent growth of human ovarian carcinoma cells.
Journal of Cellular Physiology, 141(3), 461-466.
Chang, J., Hsu, Y., Kuo, P., Kuo, Y., Chiang, L., & Lin, C. (2005). Increase of Bax/
Bcl-XL ratio and arrest of cell cycle by luteolin in immortalized human
hepatoma cell line. Life Sciences, 76(16), 1883-1893.
Chang, J. T.-C., Chen, Y.-L., Yang, H.-T., Chen, C.-Y., & Cheng, A.-J. (2002).
Differential regulation of telomerase activity by six telomerase subunits.
European Journal of Biochemistry, 269(14), 3442-3450.
Chang, Y. F., Li, L. L., Wu, C. W., Liu, T. Y., Lui, W. Y., P'Eng F, K., et al. (1996).
Paclitaxel-induced apoptosis in human gastric carcinoma cell lines. Cancer,
77(1), 14-18.
Chao, J.-I., Su, W.-C., & Liu, H.-F. (2007). Baicalein induces cancer cell death and
proliferation retardation by the inhibition of CDC2 kinase and survivin
associated with opposite role of p38 mitogen-activated protein kinase and AKT.
Molecular Cancer Therapeutics, 6(11), 3039-3048.
Chattopadhyay, S. K., Saha, G. C., Sharma, R. P., Kumar, S., & Roy, R. (1996). A
rearranged taxane from the himalayan yew Taxus wallichiana. Phytochemistry,
42(3), 787-788.
Chen, J.-P., Luan, Y., You, C.-X., Chen, X.-H., Luo, R.-C., & Li, R. (2010). TRPM7
regulates the migration of human nasopharyngeal carcinoma cell by mediating
Ca2+
influx. Cell Calcium, 47(5), 425-432.
Chen, Z. P., Schell, J. B., Ho, C.-T., & Chen, K. Y. (1998). Green tea epigallocatechin
gallate shows a pronounced growth inhibitory effect on cancerous cells but not
on their normal counterparts. Cancer Letters, 129(2), 173-179.
Cheng, J., Imanishi, H., Amuro, Y., & Hada, T. (2002). NS-398, a selective
cyclooxygenase 2 inhibitor, inhibited cell growth and induced cell cycle arrest in
human hepatocellular carcinoma cell lines. International Journal of Cancer,
99(5), 755-761.

339
Cheng, K.-W., Chen, F. C., & Wang, M. (2008). Liquid chromatography-mass
spectrometry in natural product research. In Colegate, S. M. & Molyneux, R. J.
(Eds.), Bioactive natural products. Detection, isolation and structural
determination (2nd
ed., pp. 245-265). Boca Raton: CRC Press.
Cheng, W., & Lim, L.-Y. (2009). Synthesis, characterization and in vivo activity of
salmon calcitonin coconjugated with lipid and polyethylene glycol. Journal of
Pharmaceutical Sciences, 98(4), 1438-1451.
Cheng, Y.-L., Lee, S.-C., Lin, S.-Z., Chang, W.-L., Chen, Y.-L., Tsai, N.-M., et al.
(2005). Anti-proliferative activity of Bupleurum scrozonerifolium in A549
human lung cancer cells in vitro and in vivo. Cancer Letters, 222(2), 183-193.
Chin, D., Boyle, G. M., Kane, A. J., Theile, D. R., Hayward, N. K., Parson, P. G., et al.
(2005). Invasion and metastasis markers in cancers. British Journal of Plastic
Surgery, 58(4), 466-474.
Chinkwo, K. A. (2005). Sutherlandia frutescens extracts can induce apoptosis in
cultured carcinoma cells. Journal of Ethnopharmacology, 98(1-2), 163-170.
Cho, M. H., Niles, A., Huang, R., Inglese, J., Austin, C. P., Riss, T., et al. (2008). A
bioluminescent cytotoxicity assay for assessment of membrane integrity using a
proteolytic biomarker. Toxicology in Vitro, 22(4), 1099-1106.
Choi, B.-H., Feng, L., Amaravadhi, H., Bharatham, N., Prakash, R., & Yoon, H. S.
(2010). SRF, a novel anti-cancer drug, inhibits microtubule polymerization and
dynamics and induces hyperphosphorylation of Bcl-2 in cancer cells. FASEB
Journal, 24(1_MeetingAbstracts), 527.521-.
Ciardiello, F., De Vita, F., Orditura, M., Comunale, D., & Galizia, G. (2005).
Cetuximab in the treatment of colorectal cancer. Future Oncology, 1(2), 173-
181.
Clapham, D. E. (2007). Calcium signaling. Cell, 131(6), 1047-1058.
Clapp, R. A., & Crook, C. (2002). Drowning in the Magic Well: Shaman
Pharmaceuticals and the Elusive Value of Traditional Knowledge. The Journal
of Environment Development, 11(1), 79-102.
Clardy, J., & Walsh, C. (2004). Lessons from natural molecules. Nature, 432(7019),
829-837.
Clarke, P. A. (2007). Aboriginal people and their plants. Dural: Rosenberg.
Cohen, A. M., Burdick, J. F., & Ketcham, A. S. (1971). Cell-mediated cytotoxicity: an
assay using 125
I-iododeoxyuridine-labeled target cells. Journal of Immunology,
107(3), 895-898.
Colegate, S. M., & Molyneux, R. J. (2008). An introduction and overview. In Colegate,
S. M. & Molyneux, R. J. (Eds.), Bioactive natural products: Detection, isolation
and structural determination (Second ed., pp. 1-10). Boca Raton: CRC Press.
Coley, P. D., Heller, M. V., Aizprua, R., Araúz, B., Flores, N., Correa, M., et al.
(2003). Using ecological criteria to design plant collection strategies for drug
discovery. Frontiers in Ecology and the Environment, 1(8), 421-428.
Collins, K., Jacks, T., & Pavletich, N. P. (1997). The cell cycle and cancer. Proceedings
of the National Academy of Sciences, 94(7), 2776-2778.
Collins, R. A., Ng, T. B., Fong, W. P., Wan, C. C., & Yeung, H. W. (1998). Removal of
polyphenolic compounds from aqueous plant extracts using polyamide
minicolumns. Biochemistry and Molecular Biology International, 45(4), 791-
796.
Cooke, R. G., & Segal, W. (1955). Colouring matters of Australian plants. IV.
Haemocorin: A unique glycoside from Haemodorum corymbosum Vahl.
Australian Journal of Chemistry, 8(1), 107-113.
340
Cordell, G. A., Beecher, C. W. W., & Pezzuto, J. M. (1991). Can ethnopharmacology
contribute to the development of new anticancer drugs? Journal of
Ethnopharmacology, 32(1-3), 117-133.
Cover, C. M., Hsieh, S. J., Cram, E. J., Hong, C., Riby, J. E., Bjeldanes, L. F., et al.
(1999). Indole-3-carbinol and tamoxifen cooperate to arrest the cell cycle of
MCF-7 human breast cancer cells. Cancer Research, 59(6), 1244-1251.
Cox, P. A., & Balick, M. J. (1994). The ethnobotanical approach to drug discovery.
Scientific American, 270(6), 82.
Cragg, G. M., Boyd, M. R., Cardellina, J. H., 2nd, Newman, D. J., Snader, K. M., &
McCloud, T. G. (1994). Ethnobotany and drug discovery: the experience of the
US National Cancer Institute. Ciba Foundation Symposium, 185, 178-190;
discussion 190-176.
Cragg, G. M., & Newman, D. J. (2002). Chemical diversity: a function of biodiversity.
Trends in Pharmacological Sciences, 23(9), 404-405; author reply 405.
Cragg, G. M., & Newman, D. J. (2005). Plants as a source of anti-cancer agents.
Journal of Ethnopharmacology, 100(1-2), 72-79.
Cragg, G. M., Newman, D. J., & Snader, K. M. (1997). Natural products in drug
discovery and development. Journal of Natural Products, 60(1), 52-60.
Cragg, G. M., Newman, D. J., & Yang, S. S. (1998). Bioprospecting for drugs. Nature,
393(6683), 301-301.
Cragg, G. M., Schepartz, S. A., Suffness, M., & Grever, M. R. (1993). The taxol supply
crisis. New NCI policies for handling the large-scale production of novel natural
product anticancer and anti-HIV agents. Journal of Natural Products, 56(10),
1657-1668.
Crellin, J. K., & Philpott, J. (1989). Herbal medicine past and present. A reference
guide to medicinal plants (Vol. 2). Durham: Duke University.
Crump, K. S. (2007). Limitations in the National Cancer Institute antitumor drug
screening database for evaluating hormesis. Toxicological Sciences, 98(2), 599-
601; author reply 602-593.
Cunningham, J., Rumbold, A. R., Zhang, X., & Condon, J. R. (2008). Incidence,
aetiology, and outcomes of cancer in Indigenous peoples in Australia. The
Lancet Oncology, 9(6), 585-595.
Cushion, M. T., Walzer, P. D., Ashbaugh, A., Rebholz, S., Brubaker, R., Vanden
Eynde, J. J., et al. (2006). In vitro selection and in vivo efficacy of piperazine-
and alkanediamide-linked bisbenzamidines against Pneumocystis pneumonia in
mice. Antimicrobial Agents and Chemotherapy, 50(7), 2337-2343.
Damm, K., Hemmann, U., Garin-Chesa, P., Hauel, N., Kauffmann, I., Priepke, H., et al.
(2001). A highly selective telomerase inhibitor limiting human cancer cell
proliferation. EMBO Journal, 20(24), 6958-6968.
Daw, B., Walley, T., & Keighery, G. (1997). Bush tucker plants of the South-West.
Perth: Department of Conservation and Land Management.
De Martino, L., Martinot, J. L. S., Franceschelli, S., Leone, A., Pizza, C., & De Feo, V.
(2006). Proapoptotic effect of Uncaria tomentosa extracts. Journal of
Ethnopharmacology, 107(1), 91-94.
De Vos, R. C. H., Moco, S., Lommen, A., Keurentjes, J. J. B., Bino, R. J., & Hall, R. D.
(2007). Untargeted large-scale plant metabolomics using liquid chromatography
coupled to mass spectrometry. Nature Protocols, 2(4), 778-791.
Deeb, D., Jiang, H., Gao, X., Al-Holou, S., Danyluk, A. L., Dulchavsky, S. A., et al.
(2007). Curcumin [1,7-Bis(4-hydroxy-3-methoxyphenyl)-1-6-heptadine-3,5-
dione; C21H20O6] sensitizes human prostate cancer cells to tumor necrosis
factor-related apoptosis-inducing ligand/Apo2L-induced apoptosis by
suppressing nuclear factor- via inhibition of the prosurvival Akt signaling
341
pathway. Journal of Pharmacology and Experimental Therapeutics, 321(2),
616-625.
Deininger, M. W. N., & Druker, B. J. (2003). Specific targeted therapy of chronic
myelogenous leukemia with imatinib. Pharmacological Reviews, 55(3), 401-
423.
Denis, J. N., Greene, A. E., Guenard, D., Gueritte-Voegelein, F., Mangatal, L., & Potier,
P. (1988). Highly efficient, practical approach to natural taxol. Journal of the
American Chemical Society, 110(17), 5917-5919.
Dent, P., Curiel, D. T., Fisher, P. B., & Grant, S. (2009). Synergistic combinations of
signaling pathway inhibitors: mechanisms for improved cancer therapy. Drug
Resistance Updates, 12(3), 65-73.
Dent, P., Reardon, D. B., Park, J. S., Bowers, G., Logsdon, C., Valerie, K., et al. (1999).
Radiation-induced release of transforming growth factor alpha activates the
epidermal growth factor receptor and mitogen-activated protein kinase pathway
in carcinoma cells, leading to increased proliferation and protection from
radiation-induced cell death. Molecular Biology of the Cell, 10(8), 2493-2506.
Deschner, E. E., Ruperto, J., Wong, G., & Newmark, H. L. (1991). Quercetin and rutin
as inhibitors of azoxymethanol-induced colonic neoplasia. Carcinogenesis,
12(7), 1193-1196.
Deshpande, A., Sicinski, P., & Hinds, P. W. (2005). Cyclins and cdks in development
and cancer: a perspective. Oncogene, 24(17), 2909-2915.
Desmarchelier, C., Mongelli, E., Coussio, J., & Ciccia, G. (1996). Studies on the
cytotoxicity, antimicrobial and DNA-binding activities of plants used by the
Ese'ejas. Journal of Ethnopharmacology, 50(2), 91-96.
Dessler, A. E., & Parson, E. A. (2010). The science and politics of global climate
change: A guide to the debate (2nd
ed.). Cambridge: Cambridge University
Press.
Devipriya, S., Vani, G., Ramamurthy, N., & Shyamaladevi, C. S. (2006). Regulation of
intracellular calcium levels and urokinase activity in MDA MB 231 cells by
quercetin. Chemotherapy, 52(2), 60-65.
Dewick, P. M. (2002). Tumour inhibitors from plants. In Evans, W. C. (Ed.), Trease
and Evans Pharmacognosy (15th ed., pp. 394-406). Edinburgh: WB Saunders.
Dewick, P. M. (2009). The mevalonate and methylerythritol phosphate pathways:
terpenoids and steroids. In Medicinal natural products: a biosynthetic approach
(3rd
ed., pp. 539). Chichester: John Wiley and Sons.
Dharap, S. S., Wang, Y., Chandna, P., Khandare, J. J., Qiu, B., Gunaseelan, S., et al.
(2005). Tumor-specific targeting of an anticancer drug delivery system by
LHRH peptide. Proceedings of the National Academy of Sciences, 102(36),
12962-12967.
Dias, D. A., Goble, D. J., Silva, C. A., & Urban, S. (2009). Phenylphenalenones from
the Australian plant Haemodorum simplex. Journal of Natural Products, 72(6),
1075-1080.
Dias, N., Mortara, R. A., & Lima, N. (2003). Morphological and physiological changes
in Tetrahymena pyriformis for the in vitro cytotoxicity assessment of Triton X-
100. Toxicology in Vitro, 17(3), 357-366.
DiPasquale, L. C., & Hayes, A. W. (2001). Acute toxicity and eye irritancy. In Hayes,
A. W. (Ed.), Principles and Methods of Toxicology (4th
ed., pp. 853-916).
Philadelphia: Taylor and Francis.
DKCRC. (2008). Protocol for Aboriginal nnowledge and intellectual property.
Retrieved 31st May, 2010, from
http://www.desertknowledgecrc.com.au/socialscience/downloads/DKCRC-
Aboriginal-Intellectual-Property-Protocol.pdf.

342
Dobson, C. M. (2004). Chemical space and biology. Nature, 432(7019), 824-828.
Dolmetsch, R. E., Lewis, R. S., Goodnow, C. C., & Healy, J. I. (1997). Differential
activation of transcription factors induced by Ca2+
response amplitude and
duration. Nature, 386(6627), 855-858.
Doonan, F., & Cotter, T. G. (2008). Morphological assessment of apoptosis. Methods,
44(3), 200-204.
Dorizzi, R. M., & Caputo, M. (2005). Measurement of urine relative density using
refractometer and reagent strips. Clinical Chemistry and Laboratory Medicine,
36(12), 925-928.
Douglas, H. (2008). Science, hormesis and regulation. Human and Experimental
Toxicology, 27(8), 603-607.
Druker, B. J., & Lydon, N. B. (2000). Lessons learned from the development of an abl
tyrosine kinase inhibitor for chronic myelogenous leukemia. Journal of Clinical
Investigation, 105(1), 3-7.
Drummond, I. A., Lee, A. S., Resendez, E., & Steinhardt, R. A. (1987). Depletion of
intracellular calcium stores by calcium ionophore A23187 induces the genes for
glucose-regulated proteins in hamster fibroblasts. Journal of Biological
Chemistry, 262(26), 12801-12805.
Dubick, M. A. (1986). Historical perspectives on the use of herbal preparations to
promote health. Journal of Nutrition, 116(7), 1348-1354.
Dubowchik, G. M., & Walker, M. A. (1999). Receptor-mediated and enzyme-dependent
targeting of cytotoxic anticancer drugs. Pharmacology and Therapeutics, 83(2),
67-123.
Ducreux, M., Boige, V., & Malka, D. (2007). Treatment of advanced pancreatic cancer.
Seminars in Oncology, 34(2 Suppl 1), S25-30.
Dufault, R. J., Hassell, R., Rushing, J. W., McCutcheon, G., Shepard, M., & Keinath, A.
(2001). Revival of herbalism and its roots in medicine Journal of Agromedicine,
7(2), 21-29.
Duffin, J. (2000). Poisoning the spindle: serendipity and discovery of the anti-tumor
properties of the Vinca alkaloids. Canadian Bulletin of Medical History, 17(1-
2), 155-192.
Duke, J. A. (1990). Promising phytomedicinals. In Janick, J. & Simon, J. E. (Eds.),
Advances in new crops (pp. 491-498). Portland: Timber Press. Retrieved 28th
May, 2010, from http://www.hort.purdue.edu/newcrop/proceedings1990/v1-
491.html.
Duncan-Achanzar, K. B., Jones, J. T., Burke, M. F., Carter, D. E., & Laird, H. E.
(1996). Inorganic mercury chloride-induced apoptosis in the cultured porcine
renal cell line LLC-PK1. Journal of Pharmacology and Experimental
Therapeutics, 277(3), 1726-1732.
Dutfield, G. (2001). TRIPS-related aspects of traditional knowledge. Case Western
Reserve Journal of International Law, 33(2), 233-275.
Eberman, L. E., Minton, D. M., & Cleary, M. A. (2009). Comparison of refractometry,
urine color, and urine reagent strips to urine osmolality for measurement of
urinary concentration. Athletic Training and Sports Health Care, 1(6), 267–271.
EcoBiotics. (2010). Retrieved 8th
June, 2010, from http://www.ecobiotics.com.au/.
Edwards, A. M. (2005). The discovery of cromolyn sodium and its effect on research
and practice in allergy and immunology. Journal of Allergy and Clinical
Immunology, 115(4), 885-888.
Edwards, V., Markovic, E., Matisons, J., & Young, F. (2008). Development of an in
vitro reproductive screening assay for novel pharmaceutical compounds.
Biotechnology and Applied Biochemistry, 51(Pt 2), 63-71.

343
Eichhorn, M. E., Kleespies, A., Angele, M. K., Jauch, K. W., & Bruns, C. J. (2007).
Angiogenesis in cancer: molecular mechanisms, clinical impact. Langenbecks
Archives of Surgery, 392(3), 371-379.
El-Daly, H., Kull, M., Zimmermann, S., Pantic, M., Waller, C. F., & Martens, U. M.
(2005). Selective cytotoxicity and telomere damage in leukemia cells using the
telomerase inhibitor BIBR1532. Blood, 105(4), 1742-1749.
Endo, M. (2006). Calcium ion as a second messenger with special reference to
excitation-contraction coupling. Journal of Pharmacological Sciences, 100(5),
519-524.
Engblom, P., Rantanen, V., Kulmala, J., & Grenman, S. (1996). Paclitaxel and cisplatin
sensitivity of ovarian carcinoma cell lines tested with the 96-well plate
clonogenic assay. Anticancer Research, 16(4A), 1743-1747.
Ergüven, M., Bilir, A., Altug, T., Aktar, F., & Akev, N. (2007). Suramin increased
telomerase activity in the C6 Glioma/ Wistar experimental brain tumor model.
International Journal of Biomedical Science, 3(2), 105-112.
Erlund, I., Kosonen, T., Alfthan, G., Mäenpää, J., Perttunen, K., Kenraali, J., et al.
(2000). Pharmacokinetics of quercetin from quercetin aglycone and rutin in
healthy volunteers. European Journal of Clinical Pharmacology, 56(8), 545-
553.
Ernst, E. (2005). Is homeopathy a clinically valuable approach? Trends in
Pharmacological Sciences, 26(11), 547-548.
Ernst, E., & Pittler, M. H. (1998). Efficacy of homeopathic arnica: a systematic review
of placebo-controlled clinical trials. Archives of Surgery, 133(11), 1187-1190.
Essentially Bliss. (2009). Retrieved 23rd
May, 2010, from
http://www.essentiallybliss.com.au/index.htm.
Etkin, N. L., & Elisabetsky, E. (2005). Seeking a transdisciplinary and culturally
germane science: the future of ethnopharmacology. Journal of
Ethnopharmacology, 100(1-2), 23-26.
Evans, L., Briscoe, J., Baker, E., Locher, C., Muir, K., Semple, S., et al. (2007). Plants
for people final report. Part C- laboratory study report. Alice Springs: DKCRC.
Evrard, A., Cuq, P., Robert, B., Vian, L., Pèlegrin, A., & Cano, J.-P. (1999).
Enhancement of 5-fluorouracil cytotoxicity by human thymidine-phosphorylase
expression in cancer cells: In vitro and in vivo study. International Journal of
Cancer, 80(3), 465-470.
Fabbri, F., Carloni, S., Brigliadori, G., Zoli, W., Lapalombella, R., & Marini, M. (2006).
Sequential events of apoptosis involving docetaxel, a microtubule-interfering
agent: a cytometric study. BMC Cell Biology, 7, 6.
Fabricant, D. S., & Farnsworth, N. R. (2001). The value of plants used in traditional
medicine for drug discovery. Environmental Health Perspectives, 109 Suppl 1,
69-75.
Faircloth, G., & Cuevas, C. (2006). Kahalalide F and ES285: potent anticancer agents
from marine molluscs. Progress in Molecular and Subcellular Biology, 43, 363-
379.
Fan, R. (2003). Modern western science as a standard for traditional Chinese medicine:
a critical appraisal. Journal of Law, Medicine and Ethics, 31(2), 213-221.
Fan, R., & Hollliday, I. (2007). Which medicine? Whose standard? Critical reflections
on medical integration in China. Journal of Medical Ethics, 33, 454-461.
Fang, J.-L., McGarrity, L. J., & Beland, F. A. (2009). Interference of cell cycle
progression by zidovudine and lamivudine in NIH 3T3 cells. Mutagenesis,
24(2), 133-141.

344
Farb, A., Heller, P. F., Shroff, S., Cheng, L., Kolodgie, F. D., Carter, A. J., et al. (2001).
Pathological analysis of local delivery of paclitaxel via a polymer-coated stent.
Circulation, 104(4), 473-479.
Farivar-Mohseni, H., Kandzari, S. J., Zaslau, S., Riggs, D. R., Jackson, B. J., &
McFadden, D. W. (2004). Synergistic effects of Cox-1 and -2 inhibition on
bladder and prostate cancer in vitro. American Journal of Surgery, 188(5), 505-
510.
Farnsworth, N. R., & Bingel, A. S. (1977). Problems and prospects of discovering new
dugs from higher plants by pharmacological screening. In Wagner, H. & Wolff,
P. (Eds.), New Natural Products and Plant Drugs with Pharmacological,
Biological or Therapeutical Activity. . Berlin: Springer-Verlag.
Fearon, E. R. (1997). Human cancer syndromes: Clues to the origin and nature of
cancer. Science, 278(5340), 1043-1050.
Feeley, K. J., & Silman, M. R. (2009). Extinction risks of Amazonian plant species.
Proceedings of the National Academy of Sciences, 106(30), 12382-12387.
Feher, M., & Schmidt, J. M. (2003). Property distributions: Differences between drugs,
natural products, and molecules from combinatorial chemistry. Journal of
Chemical Information and Modeling, 43(1), 218-227.
Feng, J., Funk, W. D., Wang, S. S., Weinrich, S. L., Avilion, A. A., Chiu, C. P., et al.
(1995). The RNA component of human telomerase. Science, 269(5228), 1236-
1241.
Feng, S.-S., & Huang, G. (2001). Effects of emulsifiers on the controlled release of
paclitaxel (Taxol®) from nanospheres of biodegradable polymers. Journal of
Controlled Release, 71(1), 53-69.
Fennell, D., Liberato, A. S. Q., & Zsembik, B. (2009). Definitions and patterns of CAM
use by the lay public. Complementary Therapies in Medicine, 17(2), 71-77.
Ferlini, C., Scambia, G., Marone, M., Distefano, M., Gaggini, C., Ferrandina, G., et al.
(1998). Tamoxifen induces oxidative stress and apoptosis in oestrogen receptor-
negative human cancer cell lines. British Journal of Cancer, 79(2), 257-263.
Ferrara, N. (2004a). Vascular endothelial growth factor as a target for anticancer
therapy. Oncologist, 9 Suppl 1, 2-10.
Ferrara, N. (2004b). Vascular endothelial growth factor: basic science and clinical
progress. Endocrine Reviews, 25(4), 581-611.
Fidler, I. J. (1978). Tumor heterogeneity and the biology of cancer invasion and
metastasis. Cancer Research, 38(9), 2651-2660.
Firn, R. D. (2003). Bioprospecting – why is it so unrewarding? Biodiversity and
Conservation, 12, 207-216.
First cancer drug from the Australian rainforest to enter human clinical trials. (2009).
Retrieved 8th
June, 2010, from
http://www.wholesaleinvestor.com.au/public_panel/news_detail/first_cancer_dr
ug_from_the_australian_rainforest_to_enter_human_clinical_trials_as_seen_on
_a_current/?id_NEW=98.
Flugge, K. (2009). Southern prospects 2004 - 2009. South Coast regional strategy for
natural resource management. from
http://www.script.asn.au/documents/publications/strategy/background/Backgrou
nd_Paper_01_Noongar_Strategy.pdf.
Folkman, J. (1971). Tumor angiogenesis: therapeutic implications. New England
Journal of Medicine, 285(21), 1182-1186.
Folkman, J. (2006a). Angiogenesis. Annual Review of Medicine, 57, 1-18.
Folkman, J. (2006b). Antiangiogenesis in cancer therapy--endostatin and its
mechanisms of action. Experimental Cell Research, 312(5), 594-607.

345
Fong, H. H. S., Bhatti, W., & Farnsworth, N. R. (1972). Antitumor activity of certain
plants due to tannins. Journal of Pharmaceutical Sciences, 61(11), 1818.
Ford, H. L., & Pardee, A. B. (1999). Cancer and the cell cycle. Journal of Cellular
Biochemistry, Suppl 32-33, 166-172.
Fosslien, E. (2009). The hormetic morphogen theory of curvature and the
morphogenesis and pathology of tubular and other curved structures. Dose
Response, 7(4), 307-331.
Fotakis, G., & Timbrell, J. A. (2006). In vitro cytotoxicity assays: Comparison of LDH,
neutral red, MTT and protein assay in hepatoma cell lines following exposure to
cadmium chloride. Toxicology Letters, 160(2), 171-177.
Fox, S. A., Kusmiaty, Loh, S. S. W., Dharmarajan, A. M., & Garlepp, M. J. (2005).
Cisplatin and TNF- downregulate transcription of Bcl-xL in murine malignant
mesothelioma cells. Biochemical and Biophysical Research Communications,
337(3), 983-991.
Friedman, H. S., Schold, S. C., Jr., Muhlbaier, L. H., Bjornsson, T. D., & Bigner, D. D.
(1984). In vitro versus in vivo correlations of chemosensitivity of human
medulloblastoma. Cancer Research, 44(11), 5145-5149.
Friend, C., Scher, W., Holland, J. G., & Sato, T. (1971). Hemoglobin synthesis in
murine virus-induced leukemic cells in vitro: stimulation of erythroid
differentiation by dimethyl sulfoxide. Proceedings of the National Academy of
Sciences, 68(2), 378-382.
Fujimori, A., Gupta, M., Hoki, Y., & Pommier, Y. (1996). Acquired camptothecin
resistance of human breast cancer MCF-7/C4 cells with normal topoisomerase I
and elevated DNA repair. Molecular Pharmacology, 50(6), 1472-1478.
Furuya, Y., Lundmo, P., Short, A. D., Gill, D. L., & Isaacs, J. T. (1994). The role of
calcium, pH, and cell proliferation in the programmed (apoptotic) death of
androgen-independent prostatic cancer cells induced by thapsigargin. Cancer
Research, 54(23), 6167-6175.
Gaikwad, J., Khanna, V., Vemulpad, S., Jamie, J., Kohen, J., & Ranganathan, S. (2008).
CMKb: a web-based prototype for integrating Australian Aboriginal customary
medicinal plant knowledge. BMC Bioinformatics, 9(Suppl 12), S25.
Gali-Muhtasib, H., & Bakkar, N. (2002). Modulating cell cycle: current applications
and prospects for future drug development. Current Cancer Drug Targets, 2(4),
309-336.
Galijatovic, A., Otake, Y., Walle, U. K., & Walle, T. (1999). Extensive metabolism of
the flavonoid chrysin by human Caco-2 and Hep G2 cells. Xenobiotica, 29(12),
1241-1256.
Gallo, E. M., Cante-Barrett, K., & Crabtree, G. R. (2006). Lymphocyte calcium
signaling from membrane to nucleus. Nature Immunology, 7(1), 25-32.
Galmarini, C. M., Mackey, J. R., & Dumontet, C. (2002). Nucleoside analogues and
nucleobases in cancer treatment. The Lancet Oncology, 3(7), 415-424.
Ganapathy-Kanniappan, S., Geschwind, J.-F. H., Kunjithapatham, R., Buijs, M., Syed,
L. H., Rao, P. P., et al. (2010). The pyruvic acid analog 3-bromopyruvate
interferes with the tetrazolium reagent MTS in the evaluation of cytotoxicity.
Assay and Drug Development Technologies, 8(2), 258-262.
Ganesan, A. (2008). The impact of natural products upon modern drug discovery.
Current Opinion in Chemical Biology, 12(3), 306-317.
Ganti, A. K., & Potti, A. (2005). Epidermal growth factor inhibition in solid tumours.
Expert Opinion on Biological Therapy, 5(9), 1165-1174.
Gao, B., Shen, X., Kunos, G., Meng, Q., Goldberg, I. D., Rosen, E. M., et al. (2001).
Constitutive activation of JAK-STAT3 signaling by BRCA1 in human prostate
cancer cells. FEBS Letters, 488(3), 179-184.

346
Gathe, J., & Watson, L. (2008). FloraBase, Thysanotus R.Br. Retrieved 20th
February,
2010, from http://florabase.calm.wa.gov.au/browse/profile/21208.
Gavrieli, Y., Sherman, Y., & Ben-Sasson, S. A. (1992). Identification of programmed
cell death in situ via specific labeling of nuclear DNA fragmentation. Journal of
Cell Biology, 119(3), 493-501.
Georgiadis, M. S., Russell, E. K., Gazdar, A. F., & Johnson, B. E. (1997). Paclitaxel
cytotoxicity against human lung cancer cell lines increases with prolonged
exposure durations. Clinical Cancer Research, 3(3), 449-454.
Gertsch, J. (2009). How scientific is the science in ethnopharmacology? Historical
perspectives and epistemological problems. Journal of Ethnopharmacology,
122(2), 177-183.
Ghisalberti, E. L. (2004). The Goodeniaceae. Fitoterapia, 75(5), 429-446.
Ghisalberti, E. L. (2008). Detection and isolation of bioactive natural products. In
Colegate, S. M. & Molyneux, R. J. (Eds.), Bioactive natural products:
Detection, isolation and structural determination (2nd
ed., pp. 11-76). Boca
Raton: CRC Press.
Gibbs, M. A., Baillie, M. T., Shen, D. D., Kunze, K. L., & Thummel, K. E. (2000).
Persistent inhibition of CYP3A4 by ketoconazole in modified Caco-2 cells.
Pharmaceutical Research, 17(3), 299-305.
Gilbert, B., & Alves, L. F. (2003). Synergy in plant medicines. Current Medicinal
Chemistry, 10(1), 13.
Giles, E. H., & Hilmar, B. (1999). Calcium as a versatile second messenger in the
control of gene expression. Microscopy Research and Technique, 46(6), 348-
355.
Giuliano, M., D'Anneo, A., De Blasio, A., Vento, R., & Tesoriere, G. (2003). Apoptosis
meets proteasome, an invaluable therapeutic target of anticancer drugs. Italian
Journal of Biochemistry, 52(2), 112-121.
Gocke, E., & Wall, M. (2009). In vivo genotoxicity of EMS: statistical assessment of
the dose response curves. Toxicology Letters, 190(3), 298-302.
Goel, R. (2008). Protection and conservation--TRIPs and CBD: a way forward. Journal
of Intellectual Property Law Practice, March 6,1-5. Retrieved 27th
May, 2010
from http://jiplp.oxfordjournals.org/cgi/content/abstract/jpn032v1
Goldenberg, M. M. (1999). Trastuzumab, a recombinant DNA-derived humanized
monoclonal antibody, a novel agent for the treatment of metastatic breast cancer.
Clinical Therapeutics, 21(2), 309-318.
Goldstein, B. D., & Gallo, M. A. (2001). Pare's Law: the second law of toxicology.
Toxicological Sciences, 60(2), 194-195.
Gollin, M. A. (1999). New rules for natural product research. Nature Biotechnology,
17(9), 921-922.
Goodin, S., Kane, M. P., & Rubin, E. H. (2004). Epothilones: mechanism of action and
biologic activity. Journal of Clinical Oncology, 22(10), 2015-2025.
Goodman, J., & Walsh, V. (2001). The story of taxol: nature and politics in the pursuit
of an anti-cancer drug Cambridge: Cambridge university Press.
Goss, P., & Parsons, P. G. (1977). The effect of hyperthermia and melphalan on
survival of human fibroblast strains and melanoma cell lines. Cancer Research,
37(1), 152-156.
Graf, B. A., Milbury, P. E., & Blumberg, J. B. (2005). Flavonols, flavones, flavanones
and human health: epidemiological evidence. Journal of Medicinal Food, 8(3),
281-290.
Graham, J. G., Quinn, M. L., Fabricant, D. S., & Farnsworth, N. R. (2000). Plants used
against cancer - an extension of the work of Jonathan Hartwell. Journal of
Ethnopharmacology, 73(3), 347-377.

347
Greenblatt, M. S., Bennett, W. P., Hollstein, M., & Harris, C. C. (1994). Mutations in
the p53 tumor suppressor gene: clues to cancer etiology and molecular
pathogenesis. Cancer Research, 54(18), 4855-4878.
Grever, M. R., Schepartz, S. A., & Chabner, B. A. (1992). The National Cancer
Institute: cancer drug discovery and development program. Seminars in
Oncology, 19(6), 622-638.
Grice, I. D., Rogers, K. L., & Griffiths, L. R. (2010). Isolation of bioactive compounds
that relate to the anti-platelet activity of Cymbopogon ambiguus. Evidence-based
Complementary and Alternative Medicine,
Grynkiewicz, G., Poenie, M., & Tsien, R. Y. (1985). A new generation of Ca2+
indicators with greatly improved fluorescence properties. Journal of Biological
Chemistry, 260(6), 3440-3450.
Guarrera, P. M., & Lucia, L. M. (2007). Ethnobotanical remarks on central and southern
Italy. Journal of Ethnobiology and Ethnomedicine, 3, 23.
Guevara-Aguirre, A., & Chiriboga, X. (2005). Biological, economic, ecological and
legal aspects of harvesting traditional medicine in Ecuador. In Zhang, L. &
Demain, A. L. (Eds.), Natural Products. Drug Discovery and Therapeutic
Medicine. Totowa: Humana Press Inc.
Gumby Gumby. (2010). Retrieved 23rd
May, 2010, from
http://www.gumbygumby.com/index.html.
Guo, B., Wang, Y., Sun, X., & Tang, K. (2008). Bioactive natural products from
endophytes: a review. Applied Biochemistry and Microbiology, 44(2), 136-142.
Guo, T. L., Miller, M. A., Shapiro, I. M., & Shenker, B. J. (1998). Mercuric chloride
induces apoptosis in human T lymphocytes: evidence of mitochondrial
dysfunction. Toxicology and Applied Pharmacology, 153(2), 250-257.
Gupta, S., Afaq, F., & Mukhtar, H. (2001). Selective growth-inhibitory, cell-cycle
deregulatory and apoptotic response of apigenin in normal versus human
prostate carcinoma cells. Biochemical and Biophysical Research
Communications, 287(4), 914-920.
Guruvayoorappan, C., & Kuttan, G. (2007). Antiangiogenic effect of rutin and its
regulatory effect on the production of VEGF, IL-1β and TNF-α in tumor
associated macrophages. Journal of Biological Sciences, 7(8), 1511-1519.
Guthrie, N., Gapor, A., Chambers, A. F., & Carroll, K. K. (1997). Inhibition of
proliferation of estrogen receptor-negative MDA-MB-435 and -positive MCF-7
human breast cancer cells by palm oil tocotrienols and tamoxifen, alone and in
combination. Journal of Nutrition, 127(3), 544S-.
Hadjur, C., Richard, M. J., Parat, M. O., Favier, A., & Jardon, P. (1995).
Photodynamically induced cytotoxicity of hypericin dye on human fibroblast
cell line MRC5. Journal of Photochemistry and Photobiology. Biology, 27(2),
139-146.
Hadley, C. (2003). What doesn't kill you makes you stronger. A new model for risk
assessment may not only revolutionize the field of toxicology, but also have vast
implications for risk assessment. EMBO Reports, 4(10), 924-926.
Hafeez, B. B., Siddiqui, I. A., Asim, M., Malik, A., Afaq, F., Adhami, V. M., et al.
(2008). A dietary anthocyanidin delphinidin induces apoptosis of human
prostate cancer PC3 cells in vitro and in vivo: involvement of nuclear factor-
kappaB signaling. Cancer Research, 68(20), 8564-8572.
Haider, M., Megeed, Z., & Ghandehari, H. (2004). Genetically engineered polymers:
status and prospects for controlled release. Journal of Controlled Release, 95(1),
1-26.

348
Hall, E. T., & Reed Hall, M. (2001). Key concepts: Underlying structures of culture. In
Albrecht, M. H. (Ed.), International HRM. Managing Diversity in the
Workplace (pp. 24-40). Oxford: Blackwell.
Hall, R. D. (2006). Plant metabolomics: from holistic hope, to hype, to hot topic. New
Phytologist, 169(3), 453-468.
Hamilton, C. (2006). Biodiversity, biopiracy and benefts: what allegations of biopiracy
tell us about intellectual property Developing World Bioethics, 6(3), 158-173.
Hampson, P., Chahal, H., Khanim, F., Hayden, R., Mulder, A., Assi, L. K., et al.
(2005). PEP005, a selective small-molecule activator of protein kinase C, has
potent antileukemic activity mediated via the delta isoform of PKC. Blood,
106(4), 1362-1368.
Hanahan, D., & Weinberg, R. A. (2000). The hallmarks of cancer. Cell, 100(1), 57-70.
Hande, K. R. (1998). Etoposide: four decades of development of a topoisomerase II
inhibitor. European Journal of Cancer, 34(10), 1514-1521.
Harasstani, O. A., Moin, S., Tham, C. L., Liew, C. Y., Ismail, N., Rajajendram, R., et
al. (2010). Flavonoid combinations cause synergistic inhibition of
proinflammatory mediator secretion from lipopolysaccharide-induced RAW
264.7 cells. Inflammation Research,
Harborne, J. B., Baxter, H., & Moss, G. P. (1999). Phytochemical dictionary: a
handbook of bioactive compounds from plants. London: Taylor and Francis.
Hartmann, T., Kutchan, T. M., & Strack, D. (2005). Evolution of metabolic diversity.
Phytochemistry, 66(11), 1198-1199.
Hatcher, H., Planalp, R., Cho, J., Torti, F., & Torti, S. (2008). Curcumin: from ancient
medicine to current clinical trials. Cellular and Molecular Life Sciences, 65(11),
1631-1652.
He, L., Jagtap, P. G., Kingston, D. G. I., Shen, H.-J., Orr, G. A., & Band Horwitz, S.
(2000). A Common pharmacophore for Taxol and the epothilones based on the
biological activity of a taxane molecule lacking a C-13 side chain Biochemistry,
39(14), 3972-3978.
Healy, E., Dempsey, M., Lally, C., & Ryan, M. P. (1998). Apoptosis and necrosis:
Mechanisms of cell death induced by cyclosporine A in a renal proximal tubular
cell line. Kidney International, 54(6), 1955-1966.
Hee Sun, P., Sun Young, K. I. M., So Ri, K. I. M., & Yong Chul, L. E. E. (2010).
Targeting abnormal airway vascularity as a therapeutical strategy in asthma.
Respirology, 15(3), 459-471.
Hefti, F. (2008). Requirements for a lead compound to become a clinical candidate.
BMC Neuroscience, 9(Suppl 3), S7.
Heinrich, M., & Bremner, P. (2006). Ethnobotany and ethnopharmacy - their role for
anti-cancer drug development. Current Drug Targets, 7(3), 239-245.
Hellawell, G. O., & Brewster, S. F. (2002). Growth factors and their receptors in
prostate cancer. BJU International, 89(3), 230-240.
Hengartner, M. O. (2000). The biochemistry of apoptosis. Nature, 407(6805), 770-776.
Henschler, D. (2006). The origin of hormesis: historical background and driving forces.
Human and Experimental Toxicology, 25(7), 347-351.
Herbst, R. S. (2004). Review of epidermal growth factor receptor biology. International
Journal of Radiation Oncology*Biology*Physics, 59(2, Supplement 1), S21-
S26.
Herbst, R. S. (2006). Therapeutic options to target angiogenesis in human malignancies.
Expert Opinion on Emerging Drugs, 11(4), 635-650.
Hernandez-Vargas, H., Ballestar, E., Carmona-Saez, P., von Kobbe, C., Banon-
Rodriguez, I., Esteller, M., et al. (2006). Transcriptional profiling of MCF7
breast cancer cells in response to 5-Fluorouracil: relationship with cell cycle
349
changes and apoptosis, and identification of novel targets of p53. International
Journal of Cancer, 119(5), 1164-1175.
Hilder, T. A., & Hill, J. M. (2008). Carbon nanotubes as drug delivery nanocapsules.
Current Applied Physics, 8(3-4), 258-261.
Hilder, T. A., & Hill, J. M. (2009). Modeling the loading and unloading of drugs into
nanotubes. Small, 5(3), 300-308.
Hildreth, J., Hrabeta-Robinson, E., Applequist, W., Betz, J., & Miller, J. (2007).
Standard operating procedure for the collection and preparation of voucher plant
specimens for use in the nutraceutical industry. Analytical and Bioanalytical
Chemistry, 389(1), 13-17.
Himmel, H. M., Riehle, R., Stieler, K., & Siess, M. (1990). Effects of the divalent
cation ionophore ionomycin on the performance of isolated guinea-pig atria.
Basic Research in Cardiology, 85(3), 247-256.
Hirpara, K. V., Aggarwal, P., Mukherjee, A. J., Joshi, N., & Burman, A. C. (2009).
Quercetin and its derivatives: synthesis, pharmacological uses with special
emphasis on anti-tumor properties and prodrug with enhanced bio-availability.
Anticancer Agents in Medicinal Chemistry, 9(2), 138-161.
Hodgson, J. (2001). ADMET-turning chemicals into drugs. Nature Biotechnology,
19(8), 722-726.
Hoffmann, G. R. (2009). A perspective on the scientific, philosophical, and policy
dimensions of hormesis. Dose Response, 7(1), 1-51.
Hofs, H. P., Wagener, D. J., De Valk-Bakker, V., Van Rennes, H., Van Zeist, A. J., Van
Den Broek, L. A., et al. (1992). Potentiation of cisplatin antitumour activity by
Ethyldeshydroxy-Sparsomycin in L1210 leukemia. Anticancer Research, 12(1),
167-170.
Hogan, J. C., Jr. (1996). Directed combinatorial chemistry. Nature, 384(6604 Suppl),
17-19.
Hogan, J. C., Jr. (1997). Combinatorial chemistry in drug discovery. Nature
Biotechnology, 15(4), 328-330.
Holding, E. (2010, 6th
April). While the world waits: Environmental groups determined
to see U.S. ratification San Diego News Room. Retrieved 9th
April 2010, from
http://sandiegonewsroom.com/news/index.php?option=com_content&view=arti
cle&id=42132:emily-holding&catid=43:wildlife&Itemid=59.
Holton, R. A., Blediger, R. J., & Boatman, P. D. (1995). Semisynthesis of taxol and
taxotere. In Suffness, M. (Ed.), Taxol: science and applications (pp. 97-122).
Boca Raton: CRC Press.
Holton, R. A., Somoza, C., Kim, H. B., Liang, F., Biediger, R. J., Boatman, P. D., et al.
(1994). First total synthesis of taxol. 1. Functionalization of the B ring. Journal
of the American Chemical Society, 116(4), 1597-1598.
Houghton, P., & Raman, A. (1998). Important concepts. In Laboratory handbook for
the fractionation of natural extracts (pp. 14-21). London: Thomson Science.
Houghton, P. J. (2002). Traditional plant medicines as a source of new drugs. In Evans,
W. C. (Ed.), Trease and Evans Pharmacognosy (15th
ed., pp. 125-134).
Edinburgh: WB Saunders.
Houghton, P. J., Howes, M. J., Lee, C. C., & Steventon, G. (2007). Uses and abuses of
in vitro tests in ethnopharmacology: visualizing an elephant. Journal of
Ethnopharmacology, 110(3), 391-400.
Hsuuw, Y.-D., & Chan, W.-H. (2007). Epigallocatechin gallate dose-dependently
induces apoptosis or necrosis in human MCF-7 cells. Annals of the New York
Academy of Sciences, 1095(Signal Transduction Pathways, Part C: Cell
Signaling in Health and Disease), 428-440.

350
Huang, J. K., & Jan, C. R. (2001). Mechanism of estrogens-induced increases in
intracellular Ca2+
in PC3 human prostate cancer cells. The Prostate, 47(3), 141-
148.
Huang, P., & Oliff, A. (2001a). Signaling pathways in apoptosis as potential targets for
cancer therapy. Trends in Cell Biology, 11(8), 343-348.
Huang, P. S., & Oliff, A. (2001b). Drug-targeting strategies in cancer therapy. Current
Opinion in Genetics and Development, 11(1), 104-110.
Huang, S.-T., Wang, C.-Y., Yang, R.-C., Chu, C.-J., Wu, H.-T., & Pang, J.-H. S.
(2010). Wogonin, an active compound in Scutellaria baicalensis, induces
apoptosis and reduces telomerase activity in the HL-60 leukemia cells.
Phytomedicine, 17(1), 47-54.
Hubbell, S. P., He, F., Condit, R., Borda-de-Õgua, L. s., Kellner, J., & ter Steege, H.
(2008). How many tree species are there in the Amazon and how many of them
will go extinct? Proceedings of the National Academy of Sciences,
105(Supplement 1), 11498-11504.
Hudson, E. A., Dinh, P. A., Kokubun, T., Simmonds, M. S., & Gescher, A. (2000).
Characterization of potentially chemopreventive phenols in extracts of brown
rice that inhibit the growth of human breast and colon cancer cells. Cancer
Epidemiology, Biomarkers and Prevention, 9(11), 1163-1170.
Huerta, S., Goulet, E. J., Huerta-Yepez, S., & Livingston, E. H. (2007). Screening and
detection of apoptosis. Journal of Surgical Research, 139(1), 143-156.
Hunt, D., & Rai, S. N. (2005). Testing threshold and hormesis in a random effects dose-
response model applied to developmental toxicity data. Biometrical Journal,
47(3), 319-328.
Hurst, D. (2009, 18th
May). Old wives' tale to fight skin cancer. Brisbane Times.
Retrieved 3rd
April 2010, from
http://www.brisbanetimes.com.au/queensland/old-wives-tale-to-fight-skin-
cancer-20090518-bca6.html.
Identifying malignancy markers. (2009). Retrieved 23rd
May, 2010, from
http://www.cure.org.au/_upload/files/3886%20CAN%20TOO%20PROFILES%
20 hi%20res%2012.pdf.
Ikezoe, T., Chen, S. S., Heber, D., Taguchi, H., & Koeffler, H. P. (2001). Baicalin is a
major component of PC-SPES which inhibits the proliferation of human cancer
cells via apoptosis and cell cycle arrest. The Prostate, 49(4), 285-292.
Intellectual property: protection and enforcement. (n.d.). Retrieved 27th
May, 2010,
from http://www.wto.org/english/thewto_e/whatis_e/tif_e/agrm7_e.htm.
Isaacs, J. (1987). Bush food: Aboriginal food and herbal medicine. Sydney: Weldons
Pty. Ltd.
Jachak, S. M., & Saklani, A. (2007). Challenges and opportunities in drug discovery
from plants. Current Science, 92(9), 1251-1257.
Jackisch, C., Hahm, H. A., Tombal, B., McCloskey, D., Butash, K., Davidson, N. E., et
al. (2000). Delayed micromolar elevation in intracellular calcium precedes
induction of apoptosis in thapsigargin-treated breast cancer cells. Clinical
Cancer Research, 6(7), 2844-2850.
Jain, S., Yadav, P., Gill, V., Vasudeva, N., & Singla, N. (2009). Terminalia arjuna a
sacred medicinal plant: phytochemical and pharmacological profile.
Phytochemistry Reviews, 8(2), 491-502.
Jakupovic, J., Morgenstern, T., Bittner, M., & Silva, M. (1998). Diterpenes from
Euphorbia peplus. Phytochemistry, 47(8), 1601-1609.
Janke, T., Morse, J., Charles, A., Holcombe, S., & Davis, M. (2009). Indigenous
ecological knowledge and natural resources in the Northern Territory. report on
the current status of Indigenous intellectual property. Canberra: The Australian
351
National University. Retrieved 27th
May, 2010, from
http://law.anu.edu.au/NCIS/SH%20IEK%20Report.pdf.
Janzowski, C., Glaab, V., Mueller, C., Straesser, U., Kamp, H. G., & Eisenbrand, G.
(2003). Alpha,beta-unsaturated carbonyl compounds: induction of oxidative
DNA damage in mammalian cells. Mutagenesis, 18(5), 465-470.
Jassbi, A. R. (2006). Chemistry and biological activity of secondary metabolites in
Euphorbia from Iran. Phytochemistry, 67(18), 1977-1984.
Jeggo, P., Defais, T. M., Samson, L., & Schendel, P. (1977). An adaptive response of E.
coli to low levels of alkylating agent: comparison with previously characterised
DNA repair pathways. Molecular and General Genetics, 157(1), 1-9.
Jennewein, S., & Croteau, R. (2001). Taxol: biosynthesis, molecular genetics, and
biotechnological applications. Appl Microbiol Biotechnol, 57, 13-19.
Jeong, J. H., An, J. Y., Kwon, Y. T., Rhee, J. G., & Lee, Y. J. (2009). Effects of low
dose quercetin: cancer cell-specific inhibition of cell cycle progression. Journal
of Cellular Biochemistry, 106(1), 73-82.
Jevtovic-Todorovic, V., & Guenthner, T. M. (1991). Sensitization of human melanoma
cells to melphalan cytotoxicity by adriamycin and carmustine. Journal of
Cancer Research and Clinical Oncology, 117(4), 313-320.
Ji, H., Rha, S., Jeung, H. C., Yang, S., An, S., & Chung, H. (2005). Cyclic induction of
senescence with intermittent AZT treatment accelerates both apoptosis and
telomere loss. Breast Cancer Research and Treatment, 93(3), 227-236.
Johnson, D. G., & Walker, C. L. (1999). Cyclins and cell cycle checkpoints. Annual
Review of Pharmacology and Toxicology, 39, 295-312.
Johnson, M. D., MacDougall, C., Ostrosky-Zeichner, L., Perfect, J. R., & Rex, J. H.
(2004). Combination antifungal therapy. Antimicrobial Agents and
Chemotherapy, 48(3), 693-715.
Jonas, W. B., & Ives, J. A. (2008). Should we explore the clinical utility of hormesis?
Human and Experimental Toxicology, 27(2), 123-127.
Jonas, W. B., Kaptchuk, T. J., & Linde, K. (2003). A critical overview of homeopathy.
Annals of Internal Medicine, 138(5), 393-399.
Jones, C. B., Clements, M. K., Wasi, S., & Daoud, S. S. (1997). Sensitivity to
camptothecin of human breast carcinoma and normal endothelial cells. Cancer
Chemotherapy and Pharmacology, 40(6), 475-483.
Jones, K. L., Anderson, N. S., III, & Addison, J. (1978). Glucocorticoid-induced growth
inhibition of cells from a human lung alveolar cell carcinoma. Cancer Research,
38(6), 1688-1693.
Jones, W. P., Young-Won, C., & Kinghorn, A. D. (2006). The role of pharmacognosy in
modern medicine and pharmacy. Current Drug Targets, 7(3), 247-264.
Jordan, M. A. (2002). Mechanism of action of antitumor drugs that interact with
microtubules and tubulin. Current Medicinal Chemistry Anticancer Agents, 2(1),
1-17.
Kale, A., Gawande, S., & Kotwal, S. (2008). Cancer phytotherapeutics: role for
flavonoids at the cellular level. Phytotherapy Research, 22(5), 567-577.
Kalua, F. A., Awotedu, A., Kamwanja, L. A., & Saka, J. D. K. (Eds.). (2009). Science,
Technology and Innovation for Public Health in Africa. Monograph. Pretoria:
NEPAD Office of Science and Technology.
Kandaswami, C., Lee, L. T., Lee, P. P., Hwang, J. J., Ke, F. C., Huang, Y. T., et al.
(2005). The antitumor activities of flavonoids. In Vivo, 19(5), 895-909.
Kang, M. H., & Reynolds, C. P. (2009). Bcl-2 inhibitors: targeting mitochondrial
apoptotic pathways in cancer therapy. Clinical Cancer Research, 15(4), 1126-
1132.

352
Karunagaran, D., Rashmi, R., & Kumar, T. R. (2005). Induction of apoptosis by
curcumin and its implications for cancer therapy. Current Cancer Drug Targets,
5(2), 117-129.
Kawada, K., Yonei, T., Ueoka, H., Kiura, K., Tabata, M., Takigawa, N., et al. (2002).
Comparison of chemosensitivity tests: clonogenic assay versus MTT assay. Acta
Medica Okayama, 56(3), 129-134.
Kawaii, S., Tomono, Y., Katase, E., Ogawa, K., & Yano, M. (1999). Antiproliferative
activity of flavonoids on several cancer cell lines. Bioscience, Biotechnology,
and Biochemistry, 63(5), 896-899.
Kawamura, T., Liu, D., Towle, M. J., Kageyama, R., Tsukahara, N., Wakabayashi, T.,
et al. (2003). Anti-angiogenesis effects of borrelidin are mediated through
distinct pathways: threonyl-tRNA synthetase and caspases are independently
involved in suppression of proliferation and induction of apoptosis in endothelial
cells. Journal of Antibiotics, 56(8), 709-715.
Kelland, L. R. (2005). Overcoming the immortality of tumour cells by telomere and
telomerase based cancer therapeutics--current status and future prospects.
European Journal of Cancer, 41(7), 971-979.
Kemény-Beke, Á., Aradi, J., Damjanovich, J., Beck, Z., Facskó, A., Berta, A., et al.
(2006). Apoptotic response of uveal melanoma cells upon treatment with
chelidonine, sanguinarine and chelerythrine. Cancer Letters, 237(1), 67-75.
Kenakin, T. (2003). Predicting therapeutic value in the lead optimization phase of drug
discovery. Nature Reviews. Drug Discovery, 2(6), 429-438.
Kendig, E. L., Le, H. H., & Belcher, S. M. (2010). Defining hormesis: evaluation of a
complex concentration response phenomenon. International Journal of
Toxicology, 29(3), 235-246.
Kerbel, R. S., & Kamen, B. A. (2004). The anti-angiogenic basis of metronomic
chemotherapy. Nature Reviews. Cancer, 4(6), 423-436.
Kerr, J. F., Wyllie, A. H., & Currie, A. R. (1972). Apoptosis: a basic biological
phenomenon with wide-ranging implications in tissue kinetics. British Journal
of Cancer, 26(4), 239-257.
Kerr, P. G. (1999). Scaevola spinescens R.Br. (Goodeniaceae) phytochemical and
biological screening studies of a West Australian medicinal plant. Unpublished,
Curtin University of Technology, Perth. Retrieved 28th May, 2010, from
http://opac.library.curtin.edu.au/F/34S9AYEUT2G5Y6AJA2TSM8J51XHVSR
N6AL2567AEKAL3A8ABGM-00031?func=find-
acc&acc_sequence=002637487.
Kerr, P. G., Longmore, R. B., & Betts, T. J. (1996). Myricadiol and other taraxerenes
from Scaevola spinescens. Planta Medica, 62(6), 519-522.
Keseru, G. M., & Makara, G. M. (2006). Hit discovery and hit-to-lead approaches.
Drug Discovery Today, 11(15-16), 741-748.
Keyomarsi, K., & Pardee, A. B. (2003). Selective protection of normal proliferating
cells against the toxic effects of chemotherapeutic agents. Progress in Cell Cycle
Research, 5, 527-532.
Khosravi-Far, R., & Esposti, M. D. (2004). Death receptor signals to mitochondria.
Cancer Biology and Therapy, 3(11), 1051-1057.
Kicic, A., Chua, A. C., & Baker, E. (2002). Desferrithiocin is a more potent
antineoplastic agent than desferrioxamine. British Journal of Pharmacology,
135(6), 1393-1402.
Kicic, A., Chua, A. C. G., & Baker, E. (2001). Effect of iron chelators on proliferation
and iron uptake in hepatoma cells. Cancer, 92(12), 3093-3110.

353
Kim, E. J., Park, S. Y., Shin, H. K., Kwon, D. Y., Surh, Y. J., & Park, J. H. (2007).
Activation of caspase-8 contributes to 3,3'-Diindolylmethane-induced apoptosis
in colon cancer cells. Journal of Nutrition, 137(1), 31-36.
King, S. R., Carlson, T. J., & Moran, K. (1996). Biological diversity, indigenous
knowledge, drug discovery, and intellectual property rights. In Brush, S. B. &
Stabinsky, D. (Eds.), Valuing local knowledge: Indigenous people and
intellectual property rights (pp. 337). Washington D.C.: Island Press.
Kingston, D. G. I. (2001). Taxol, a molecule for all seasons. Chem. Commun., 867-880.
Kirichok, Y., Krapivinsky, G., & Clapham, D. E. (2004). The mitochondrial calcium
uniporter is a highly selective ion channel. Nature, 427(6972), 360-364.
Knowles, L. M., Zigrossi, D. A., Tauber, R. A., Hightower, C., & Milner, J. A. (2000).
Flavonoids suppress androgen-independent human prostate tumor proliferation.
Nutrition and Cancer, 38(1), 116 - 122.
Knudsen, E. S., & Wang, J. Y. (2010). Targeting the RB-pathway in cancer therapy.
Clinical Cancer Research, 16(4), 1094-1099.
Knudson, A. G., Jr. (1971). Mutation and cancer: statistical study of retinoblastoma.
Proceedings of the National Academy of Sciences, 68(4), 820-823.
Koehn, F. E., & Carter, G. T. (2005). The evolving role of natural products in drug
discovery. Nature Reviews Drug Discovery, 4(3), 206-220.
Koike, M., Fujita, F., Komori, K., Katoh, F., Sugimoto, T., Sakamoto, Y., et al. (2004).
Dependence of chemotherapy response on p53 mutation status in a panel of
human cancer lines maintained in nude mice. Cancer Science, 95(6), 541-546.
Kong, J. M., Goh, N. K., Chia, L. S., & Chia, T. F. (2003). Recent advances in
traditional plant drugs and orchids. Acta Pharmacologica Sinica, 24(1), 7-21.
Kopnin, B. P. (2000). Targets of oncogenes and tumor suppressors: key for
understanding basic mechanisms of carcinogenesis. Biochemistry (Mosc), 65(1),
2-27.
Korting, H. C., & Schafer-Korting, M. (1999). Prediction of the benefit/risk ratio from
in vitro data In The benefit/risk ratio: a handbook for the rational use of
potentially hazardous drugs (Vol. Issue 1640). Boca Raton: CRC Press.
Korzeniewski, C., & Callewaert, D. M. (1983). An enzyme-release assay for natural
cytotoxicity. Journal of Immunological Methods, 64(3), 313-320.
Kouniavsky, G., Khaikin, M., Zvibel, I., Zippel, D., Brill, S., Halpern, Z., et al. (2002).
Stromal extracellular matrix reduces chemotherapy-induced apoptosis in colon
cancer cell lines. Clinical and Experimental Metastasis, 19(1), 55-60.
Krischel, V., Bruch-Gerharz, D., Suschek, C., Kroncke, K.-D., Ruzicka, T., & Kolb-
Bachofen, V. (1998). Biphasic effect of exogenous nitric oxide on proliferation
and differentiation in skin derived keratinocytes but not fibroblasts. 111(2), 286-
291.
Krishnamurthy, K. V. (2003). Biodiversity prospecting and indigenous knowledge
systems. In Textbook of biodiversity (pp. 183-194). Enfield: Science Publishers,
Inc.
Krishnaraju, A. V., Rao, T. V. N., Sundararaju, D., M, V., Tsay, H.-S., & Subbaraju, G.
V. (2005). Assessment of bioactivity of Indian medicinal plants using brine
shrimp (Artemia salina) lethality assay. International Journal of Applied Science
and Engineering, 3(2), 125-134.
Krueger, J. S., Keshamouni, V. G., Atanaskova, N., & Reddy, K. B. (2001). Temporal
and quantitative regulation of mitogen-activated protein kinase (MAPK)
modulates cell motility and invasion. Oncogene, 20(31), 4209-4218.
Krysko, D. V., Vanden Berghe, T., D'Herde, K., & Vandenabeele, P. (2008). Apoptosis
and necrosis: detection, discrimination and phagocytosis. Methods, 44(3), 205-
221.
354
Kunick, C. (2004). Novel molecular targets in cancer chemotherapy waiting for
discovery. Current Medicinal Chemistry Anticancer Agents, 4(5), 421-423.
Kuntz, S., Wenzel, U., & Daniel, H. (1999). Comparative analysis of the effects of
flavonoids on proliferation, cytotoxicity, and apoptosis in human colon cancer
cell lines. European Journal of Nutrition, 38(3), 133-142.
Kwok, J. C., & Richardson, D. R. (2002). Unexpected anthracycline-mediated
alterations in iron-regulatory protein-RNA-binding activity: the iron and copper
complexes of anthracyclines decrease RNA-binding activity. Molecular
Pharmacology, 62(4), 888-900.
Lacroix, A., & Lippman, M. E. (1980). Binding of retinoids to human breast cancer cell
lines and their effects on cell growth. Journal of Clinical Investigation, 65(3),
586-591.
Lacroix, M., Toillon, R. A., & Leclercq, G. (2006). p53 and breast cancer, an update.
Endocrine-Related Cancer, 13(2), 293-325.
Lahana, R. (1999). How many leads from HTS? Drug Discovery Today, 4(10), 447-
448.
Laird, S., Monagle, C., & Johnston, S. (2008). Queensland biodiscovery collaboration.
The Griffith University AstraZeneca partnership for natural product discovery.
An access & benefit sharing case study. Yokohama: United Nations University.
Institute of Advanced Studies.: UNU-IAS. Retrieved 5th
June, 2010, from
http://www.ias.unu.edu/resource_centre/Queensland%20Biodiscovery%20Colla
boration_The%20Griffith%20University%20AstraZeneca%20Partnership%20fo
r%20Natural%20Product%20Discovery.pdf.
Lampronti, I., Martello, D., Bianchi, N., Borgatti, M., Lambertini, E., Piva, R., et al.
(2003). In vitro antiproliferative effects on human tumor cell lines of extracts
from the Bangladeshi medicinal plant Aegle marmelos Correa. Phytomedicine,
10(4), 300-308.
Lang, G., Mayhudin, N. A., Mitova, M. I., Sun, L., van der Sar, S., Blunt, J. W., et al.
(2008). Evolving trends in the dereplication of natural product extracts: new
methodology for rapid, small-scale investigation of natural product extracts.
Journal of Natural Products, 71(9), 1595-1599.
Lassak, E. V., & McCarthy, T. (2001). Australian medicinal plants. Sydney: Reed New
Holland.
Latz, P. K. (1995). Bushfires and bushtucker. Aboriginal plant use in Central Australia.
Alice Springs: IAD Press.
Laurent, E., Talpaz, M., Kantarjian, H., & Kurzrock, R. (2001). The BCR gene and
Philadelphia chromosome-positive leukemogenesis. Cancer Res, 61(6), 2343-
2355.
Le, N. T. V., & Richardson, D. R. (2004). Iron chelators with high antiproliferative
activity up-regulate the expression of a growth inhibitory and metastasis
suppressor gene: a link between iron metabolism and proliferation. Blood,
104(9), 2967-2975.
Leach, A. R., & Hann, M. M. (2000). The in silico world of virtual libraries. Drug
Discovery Today, 5(8), 326-336.
Lee, C.-Y., & Wood, W. A. (1982). Glucose-6-phosphate dehydrogenase from mouse.
Methods in Enzymology, 89, 252-257.
Lee, C. C., & Houghton, P. (2005). Cytotoxicity of plants from Malaysia and Thailand
used traditionally to treat cancer. Journal of Ethnopharmacology, 100(3), 237-
243.
Lee, D., Jang, S., Kim, M., Kim, J., Chung, M., Kim, K., et al. (2008). Anti-
proliferative effects of Bifidobacterium adolescentis SPM0212 extract on human
colon cancer cell lines. BMC Cancer, 8(1), 310.

355
Lee, I. S., Jin, W., Zhang, X., Hung, T. M., Song, K. S., Seong, Y. H., et al. (2006).
Cytotoxic and COX-2 inhibitory constituents from the aerial parts of Aralia
cordata. Archives of Pharmacal Research, 29(7), 548-555.
Lee, K.-C., Chang, H.-T., Chou, K.-J., Tang, K.-Y., Wang, J.-L., Lo, Y.-K., et al.
(2001). Mechanism underlying histamine-induced intracellular Ca2+
movement
in PC3 human prostate cancer cells. Pharmacological Research, 44(6), 547-552.
Lee, M.-Y., & Dordick, J. S. (2006). High-throughput human metabolism and toxicity
analysis. Current Opinion in Biotechnology, 17(6), 619-627.
Lee, M. M., Chang, J. S., Jacobs, B., & Wrensch, M. R. (2002). Complementary and
alternative medicine use among men with prostate cancer in 4 ethnic
populations. American Journal of Public Health, 92(10), 1606-1609.
Lee, M. S., & Kerns, E. H. (1999). LC/MS applications in drug development. Mass
Spectrometry Reviews, 18(3-4), 187-279.
Lee, R. M., Choi, H., Shin, J.-S., Kim, K., & Yoo, K.-H. (2009). Distinguishing
between apoptosis and necrosis using a capacitance sensor. Biosensors and
Bioelectronics, 24(8), 2586-2591.
Lenz, H. J. (2006). Anti-EGFR mechanism of action: antitumor effect and underlying
cause of adverse events. Oncology, 20(5 Suppl 2), 5-13.
Levesque, A. A., & Eastman, A. (2007). p53-based cancer therapies: Is defective p53
the Achilles heel of the tumor? Carcinogenesis, 28(1), 13-20.
Levy, M. Z., Allsopp, R. C., Futcher, A. B., Greider, C. W., & Harley, C. B. (1992).
Telomere end-replication problem and cell aging. Journal of Molecular Biology,
225(4), 951-960.
Lewis, W. H. (2000). Ethnopharmacology and the search for new therapeutics. In
Minnis, P. E. & Elisens, W. J. (Eds.), Biodiversity and Native America (pp. 74-
98). Norman: University of Oklahoma Press.
Lewis, W. H., & Elvin-Lewis, M. P. F. (1977). Medical botany. Plants affecting Man's
health. New York: John Wiley and Sons.
Lewis, W. H., Lamas, G., Vaisberg, A., Corley, D. G., & Sarasara, C. (1999). Peruvian
medicinal plant sources of new pharmaceuticals (International Cooperative
Biodiversity Group-Peru). Pharmaceutical Biology, 37, 69.
Li, C. J., Wang, C., & Pardee, A. B. (1995). Induction of apoptosis by -lapachone in
human prostate cancer cells. Cancer Research, 55(17), 3712-3715.
Li, J., & Song, L. (2007). Applicability of the MTT assay for measuring viability of
cyanobacteria and algae, specifically for Microcystis aeruginosa
(Chroococcales, Cyanobacteria). Phycologia, 46(5), 593-599.
Li, J. W. H., & Vederas, J. C. (2009). Drug discovery and natural products: end of an
era or an endless frontier? Science, 325(5937), 161-165.
Li, J. Y., Strobel, G., Sidhu, R., Hess, W. M., & Ford, E. J. (1996). Endophytic taxol-
producing fungi from bald cypress, Taxodium distichum. Microbiology, 142 ( Pt
8), 2223-2226.
Li, M. O., Sarkisian, M. R., Mehal, W. Z., Rakic, P., & Flavell, R. A. (2003a).
Phosphatidylserine receptor is required for clearance of apoptotic cells. Science,
302(5650), 1560-1563.
Li, R. W., Myers, S. P., Leach, D. N., Lin, G. D., & Leach, G. (2003b). A cross-cultural
study: anti-inflammatory activity of Australian and Chinese plants. Journal of
Ethnopharmacology, 85(1), 25-32.
Li, Z. G., Hong, T., Shimada, Y., Komoto, I., Kawabe, A., Ding, Y., et al. (2002).
Suppression of N-nitrosomethylbenzylamine (NMBA)-induced esophageal
tumorigenesis in F344 rats by resveratrol. Carcinogenesis, 23(9), 1531-1536.
356
Liles, N., & Sailer, B. L. (2002). Morphological assessment of altered apoptosis induced
by caffeine and amiloride in a promyelocytic (HL-60) cell line. Bios, 73(1), 9-
15.
Lin, Y.-L., Liu, C.-C., Lei, H.-Y., Yeh, T.-M., Lin, Y.-S., Chen, R. M.-Y., et al. (2000).
Infection of five human liver cell lines by dengue-2 virus. Journal of Medical
Virology, 60(4), 425-431.
Lin, Y., Shi, R., Wang, X., & Shen, H. M. (2008). Luteolin, a flavonoid with potential
for cancer prevention and therapy. Current Cancer Drug Targets, 8(7), 634-646.
Lindsay, D. G. (2005). Nutrition, hormetic stress and health. Nutrition Research
Reviews, 18(02), 249-258.
Liou, J., Kim, M. L., Heo, W. D., Jones, J. T., Myers, J. W., Ferrell, J. E., Jr., et al.
(2005). STIM is a Ca2+
sensor essential for Ca2+
-store-depletion-triggered Ca2+
influx. Current Biology, 15(13), 1235-1241.
Lipinski, C. A. (2000). Drug-like properties and the causes of poor solubility and poor
permeability. Journal of Pharmacological and Toxicological Methods, 44(1),
235-249.
Lipinski, C. A., Lombardo, F., Dominy, B. W., & Feeney, P. J. (1997). Experimental
and computational approaches to estimate solubility and permeability in drug
discovery and development settings. Advanced Drug Delivery Reviews, 23(1-3),
3-25.
Liu, C., & Hermann, T. E. (1978). Characterization of ionomycin as a calcium
ionophore. Journal of Biological Chemistry, 253(17), 5892-5894.
Liu, L. Z., Fang, J., Zhou, Q., Hu, X., Shi, X., & Jiang, B. H. (2005). Apigenin inhibits
expression of vascular endothelial growth factor and angiogenesis in human
lung cancer cells: implication of chemoprevention of lung cancer. Molecular
Pharmacology, 68(3), 635-643.
Liu, Z., Carpenter, S. B., Bourgeois, W. J., Yu, Y., Constantin, R. J., Falcon, M. J., et
al. (1998). Variations in the secondary metabolite camptothecin in relation to
tissue age and season in Camptotheca acuminata. Tree Physiology, 18(4), 265-
270.
Lobert, S., Vulevic, B., & Correia, J. J. (1996). Interaction of vinca alkaloids with
tubulin: a comparison of vinblastine, vincristine, and vinorelbine. Biochemistry,
35(21), 6806-6814.
Locher, C., & Currie, L. (2010). Revisiting kinos--an Australian perspective. Journal of
Ethnopharmacology, 128(2), 259-267.
Locke, J. M., Stutchbury, T. K., Vine, K. L., Gamble, A. B., Clingan, P. R., Bremner, J.
B., et al. (2009). Development and assessment of novel all-in-one parenteral
formulations with integrated anticoagulant properties for the concomitant
delivery of 5-fluorouracil and calcium folinate. Anti-Cancer Drugs, 20(9), 822-
831.
Loges, S., Schmidt, T., & Carmeliet, P. (2010). Mechanisms of resistance to anti-
angiogenic therapy and development of third-generation anti-angiogenic drug
candidates. Genes and Cancer, 1(1), 12-25.
Longley, D. B., Harkin, D. P., & Johnston, P. G. (2003). 5-Fluorouracil: mechanisms of
action and clinical strategies. Nature Reviews Cancer, 3(5), 330-338.
Lord, J. M. (1987). The use of cytotoxic plant lectins in cancer therapy. Plant
Physiology, 85(1), 1-3.
Lori, F., Foli, A., Groff, A., Lova, L., Whitman, L., Bakare, N., et al. (2005). Optimal
suppression of HIV replication by low-dose hydroxyurea through the
combination of antiviral and cytostatic ('virostatic') mechanisms. AIDS, 19(11),
1173-1181.
357
Lovejoy, D. B., & Richardson, D. R. (2002). Novel "hybrid" iron chelators derived from
aroylhydrazones and thiosemicarbazones demonstrate selective antiproliferative
activity against tumor cells. Blood, 100(2), 666-676.
Low, T. (1990). Bush medicine. A pharmacopoeia of natural remedies. Sydney:
Collins/Angus and Robertson Publishers.
Luqmani, Y. A. (2005). Mechanisms of drug resistance in cancer chemotherapy.
Medical Principles and Practice, 14(Suppl. 1), 35-48.
Macilwain, C. (1998). When rhetoric hits reality in debate on bioprospecting. Nature,
392(6676), 535-537, 539-540.
Maddika, S., Ande, S. R., Panigrahi, S., Paranjothy, T., Weglarczyk, K., Zuse, A., et al.
(2007). Cell survival, cell death and cell cycle pathways are interconnected:
implications for cancer therapy. Drug Resistance Updates, 10(1-2), 13-29.
Madhusudan, S., & Hickson, I. D. (2005). DNA repair inhibition: a selective tumour
targeting strategy. Trends in Molecular Medicine, 11(11), 503-511.
Majno, G., & Joris, I. (1995). Apoptosis, oncosis, and necrosis. An overview of cell
death. American Journal of Pathology, 146(1), 3-15.
Mandal, S., Moudgil, M. n., & Mandal, S. K. (2009). Rational drug design. European
Journal of Pharmacology, 625(1-3), 90-100.
Mans, D. R. A., Grivicich, I., Peters, G. J., & Schwartsmann, G. (1999). Sequence-
dependent growth inhibition and DNA damage formation by the irinotecan-5-
fluorouracil combination in human colon carcinoma cell lines. European
Journal of Cancer, 35(13), 1851-1861.
Mantena, S. K., Sharma, S. D., & Katiyar, S. K. (2006). Berberine inhibits growth,
induces G1 arrest and apoptosis in human epidermoid carcinoma A431 cells by
regulating Cdki-Cdk-cyclin cascade, disruption of mitochondrial membrane
potential and cleavage of caspase 3 and PARP. Carcinogenesis, 27(10), 2018-
2027.
Manthey, J. A., & Guthrie, N. (2002). Antiproliferative activities of citrus flavonoids
against six human cancer cell lines. Journal of Agricultural and Food
Chemistry, 50(21), 5837-5843.
Marcy , J. B., William , P. J., Young-Won, C., Qiuwen, M., Norman , R. F., Djaja , D.
S., et al. (2006). Relationships between inhibitory activity against a cancer cell
line panel, profiles of plants collected, and compound classes isolated in an
anticancer drug discovery project. Chemistry and Biodiversity, 3(8), 897-915.
Mariadason, J. M., Barkla, D. H., & Gibson, P. R. (1997). Effect of short-chain fatty
acids on paracellular permeability in Caco-2 intestinal epithelium model.
American Journal of Physiology. Gastrointestinal and Liver Physiology, 272(4),
G705-712.
Marinova, D., & Raven, M. (2006). Indigenous knowledge and Intellectual Property: A
sustainability agenda. Journal of Economic Surveys, 20(4), 587-605.
Marzano, C., Gandin, V., Folda, A., Scutari, G., Bindoli, A., & Rigobello, M. P. (2007).
Inhibition of thioredoxin reductase by auranofin induces apoptosis in cisplatin-
resistant human ovarian cancer cells. Free Radical Biology and Medicine, 42(6),
872-881.
Matesic, L., Locke, J. M., Bremner, J. B., Pyne, S. G., Skropeta, D., Ranson, M., et al.
(2008). N-Phenethyl and N-naphthylmethyl isatins and analogues as in vitro
cytotoxic agents. Bioorganic and Medicinal Chemistry, 16(6), 3118-3124.
Matsuda, N., Teramae, H., Yamamoto, S., Takano, K.-i., Takano, Y., & Hattori, Y.
(2010). Increased death receptor pathway of apoptotic signaling in septic mouse
aorta: effect of systemic delivery of FADD siRNA. American Journal of
Physiology. Heart and Circulatory Physiology, 298(1), H92-101.
358
Mattson, M. P. (2008). Awareness of hormesis will enhance future research in basic and
applied neuroscience. Critical Reviews in Toxicology, 38(7), 633-639.
Mazzio, E. A., & Soliman, K. F. (2009). In vitro screening for the tumoricidal
properties of international medicinal herbs. Phytotherapy Research, 23(3), 385-
398.
McClatchey, W., & Stevens, J. (2001). An overview of recent developments in
bioprospecting and pharmaceutical development. In Saxena, P. K. (Ed.),
Development of Plant-Based Medicines: Conservation, Efficacy and Safety (pp.
17-46). Dordrecht: Kluwer Academic Publishers.
McFadden, D. W., Riggs, D. R., Jackson, B. J., & Cunningham, C. (2006). Additive
effects of COX-1 and COX-2 inhibition on breast cancer in vitro. International
Journal of Oncology, 29(4), 1019-1023.
McGrath, P., Holewa, H., Ogilvie, K., Rayner, R., & Patton, M.-A. (2006). Insights on
Aboriginal peoples‘ views of cancer in Australia. Contemporary Nurse, 22(2),
240-254.
McGuire, W. P., Rowinsky, E. K., Rosenshein, N. B., Grumbine, F. C., Ettinger, D. S.,
Armstrong, D. K., et al. (1989). Taxol: A unique antineoplastic agent with
significant activity in advanced ovarian epithelial neoplasms. Annals of Internal
Medicine, 111(4), 273-279.
McRae, J., Yang, Q., Crawford, R., & Palombo, E. (2007). Review of the methods used
for isolating pharmaceutical lead compounds from traditional medicinal plants.
The Environmentalist, 27(1), 165-174.
Meldolesi, J., & Pozzan, T. (1998). The endoplasmic reticulum Ca2+
store: a view from
the lumen. Trends in Biochemical Sciences, 23(1), 10-14.
Melnick, S. J. (2006a). Developmental therapeutics: review of biologically based
complementary and alternative medicine (CAM) therapies for potential
application in children with cancer: Part I. Journal of Pediatric
Hematology/Oncology, 28(4), 221-230
Melnick, S. J. (2006b). Developmental therapeutics: review of biologically based
complementary and alternative medicine (CAM) therapies for potential
application in children with cancer: Part II. Journal of Pediatric
Hematology/Oncology, 28(5), 271-285.
Melnick, S. J. (2006a). Developmental therapeutics: review of biologically based CAM
therapies for potential application in children with cancer: part I. Journal of
Pediatric Hematology/Oncology, 28(4), 221-230.
Menard, S., Pupa, S. M., & Campiglio, M. a. T., E. (2003). Biologic and therapeutic
role of HER2 in cancer. Oncogene, 22, 6570-6578.
Mendelsohn, J., & Baselga, J. (2006). Epidermal growth factor receptor targeting in
cancer. Seminars in Oncology, 33(4), 369-385.
Mendelsohn, R., & Balick, M. J. (1995). The value of undiscovered pharmaceuticals in
tropical forests. Economic Botany, 49(2), 223-228.
Mertens-Talcott, S. U., & Percival, S. S. (2005). Ellagic acid and quercetin interact
synergistically with resveratrol in the induction of apoptosis and cause transient
cell cycle arrest in human leukemia cells. Cancer Letters, 218(2), 141-151.
Mertens-Talcott, S. U., Talcott, S. T., & Percival, S. S. (2003). Low concentrations of
quercetin and ellagic acid synergistically influence proliferation, cytotoxicity
and apoptosis in MOLT-4 human leukemia cells. Journal of Nutrition, 133(8),
2669-2674.
Meyer, B. N., Ferrigni, N. R., Putnam, J. E., Jacobsen, L. B., Nichols, D. E., &
McLaughlin, J. L. (1982). Brine shrimp: a convenient general bioassay for active
plant constituents. Planta Medica, 45(1), 31-34.
359
Michael, A. S., Thompson, C. G., & Abramovitz, M. (1956). Artemia salina as a test
organism for a bioassay. Science, 123, 464.
Middleton, E., Jr., Kandaswami, C., & Theoharides, T. C. (2000). The effects of plant
flavonoids on mammalian cells: implications for inflammation, heart disease and
cancer. Pharmacological Reviews, 52(4), 673-751.
Mijajlovic, S., Smith, J., Watson, K., Parsons, P., & Lloyd Jones, G. (2006). Traditional
Australian medicinal plants: screening for activity against human cancer cell
lines. Journal of the Australian Traditional-Medicine Society, 12(3), 129--132.
Mirabell, C. K., Johnson, R. K., Hill, D. T., Faucette, L. F., Girard, G. R., Kuo, G. Y., et
al. (1986). Correlation of the in vitro cytotoxic and in vivo antitumor activities of
gold(I) coordination complexes. Journal of Medicinal Chemistry, 29(2), 218-
223.
Mitsiades, C. S., Mitsiades, N., Hideshima, T., Richardson, P. G., & Anderson, K. C.
(2005). Proteasome inhibitors as therapeutics. Essays in Biochemistry, 41, 205-
218.
Moco, S., Bino, R. J., Vorst, O., Verhoeven, H. A., de Groot, J., van Beek, T. A., et al.
(2006). A liquid chromatography-mass spectrometry-based metabolome
database for tomato. Plant Physiology, 141(4), 1205-1218.
Mohseni, H., Zaslau, S., McFadden, D., Riggs, D. R., Jackson, B. J., & Kandzari, S.
(2004). COX-2 inhibition demonstrates potent anti-proliferative effects on
bladder cancer in vitro. Journal of Surgical Research, 119(2), 138-142.
Monachino, J. (1954). Rauvolfia serpentina—Its history, botany and medical use.
Economic Botany, 8(4), 349-365.
Monks, A., Scudiero, D., Skehan, P., Shoemaker, R., Paull, K., Vistica, D., et al.
(1991). Feasibility of a high-flux anticancer drug screen using a diverse panel of
cultured human tumor cell lines. Journal of the National Cancer Institute,
83(11), 757-766.
Montagut, C., Rovira, A., & Albanell, J. (2006). The proteasome: a novel target for
anticancer therapy. Clinical and Translational Oncology, 8(5), 313-317.
Montero, A., Fossella, F., Hortobagyi, G., & Valero, V. (2005). Docetaxel for treatment
of solid tumours: a systematic review of clinical data. The Lancet Oncology,
6(4), 229-239.
Montero, M., Lobatón, C. D., Gutierrez-Fernández, S., Moreno, A., & Alvarez, J.
(2003). Modulation of histamine-induced Ca2+
release by protein kinase C.
Journal of Biological Chemistry, 278(50), 49972-49979.
Montes, W., Warner, A., & Puig, M. M. (2000). Use of intravenous patient-controlled
analgesia for the documentation of synergy between tramadol and metamizol.
British Journal of Anaesthesia, 85(2), 217-223.
Moore, E. D., Becker, P. L., Fogarty, K. E., Williams, D. A., & Fay, F. S. (1990). Ca2+
imaging in single living cells: theoretical and practical issues. Cell Calcium,
11(2-3), 157-179.
Mori, Y., Wakamori, M., Miyakawa, T., Hermosura, M., Hara, Y., Nishida, M., et al.
(2002). Transient receptor potential 1 regulates capacitative Ca2+
entry and Ca2+
release from endoplasmic reticulum in B lymphocytes. Journal of Experimental
Medicine, 195(6), 673-681.
Mosmann, T. (1983). Rapid colorimetric assay for cellular growth and survival:
application to proliferation and cytotoxicity assays. Journal of Immunological
Methods, 65(1-2), 55-63.
Moss, S. J., Carletti, I., Olano, C., Sheridan, R. M., Ward, M., Math, V., et al. (2006).
Biosynthesis of the angiogenesis inhibitor borrelidin: directed biosynthesis of
novel analogues. Chemical Communications(22), 2341-2343.

360
Mount Romance. (2010). Retrieved 23rd
May, 2010, from
http://www.mtromance.com.au/.
Mukerjee, M. (1994). Little winners. Bioprospectors reap rewards from Third World
microbes. Scientific American, 270(6), 81-82.
Mukherjee, A. K., Basu, S., Sarkar, N., & Ghosh, A. C. (2001). Advances in cancer
therapy with plant based natural products. Current Medicinal Chemistry, 8(12),
1467-1486.
Mushak, P. (2009). Ad hoc and fast forward: the science of hormesis growth and
development. Environmental Health Perspectives, 117(9), 1333-1338.
Nagai, Y., Unsworth, L. D., Koutsopoulos, S., & Zhang, S. (2006). Slow release of
molecules in self-assembling peptide nanofiber scaffold. Journal of Controlled
Release, 115(1), 18-25.
Nagata, S., & Golstein, P. (1995). The Fas death factor. Science, 267(5203), 1449-1456.
Nagle, A., Wooyoung, H., & Gray, N. S. (2006). Antimitotic agents of natural origin.
Current Drug Targets, 7(3), 305-326.
Nahta, R., & Esteva, F. J. (2003). HER-2-targeted therapy: lessons learned and future
directions. Clinical Cancer Research, 9(14), 5078-5084.
Nahta, R., & Esteva, F. J. (2006). Herceptin: mechanisms of action and resistance.
Cancer Letters, 232(2), 123-138.
Nakamura, T. M., Morin, G. B., Chapman, K. B., Weinrich, S. L., Andrews, W. H.,
Lingner, J., et al. (1997). Telomerase catalytic subunit homologs from hission
yeast and human. Science, 277(5328), 955-959.
Nalamachu, S. R., Song, L., & Fricker, L. D. (1994). Regulation of carboxypeptidase E.
Effect of Ca2+
on enzyme activity and stability. Journal of Biological Chemistry,
269(15), 11192-11195.
Nebert, D. W. (2002). Transcription factors and cancer: an overview. Toxicology, 181-
182, 131-141.
Nelson, P. S., & Montgomery, B. (2003). Unconventional therapy for prostate cancer:
good, bad or questionable? Nature Reviews. Cancer, 3(11), 845-858.
Neville, M. E. (1987). 51Cr-uptake assay a sensitive and reliable method to quantitate
cell viability and cell death. Journal of Immunological Methods, 99(1), 77-82.
New drug discovery spin-off from CSIRO. (2002). Retrieved 12th
June, 2010, from
http://www.csiro.edu.au/files/mediaRelease/mr2002/Prdrugbug.htm.
Newman, D. J., & Cragg, G. M. (2005). The discovery of anticancer drugs from natural
sources. In Zhang, L. & Demain, A. L. (Eds.), Natural Products. Drug
Discovery and Therapeutic Medicine (pp. 129-168). Totowa: Humana Press.
Newman, D. J., & Cragg, G. M. (2007). Natural products as sources of new drugs over
the last 25 years. Journal of Natural Products, 70(3), 461-477.
Newman, M. J. (1990). Inhibition of carcinoma and melanoma cell growth by type 1
transforming growth factor beta is dependent on the presence of polyunsaturated
fatty acids. Proceedings of the National Academy of Sciences, 87(14), 5543-
5547.
Nguyen, T. T., Tran, E., Nguyen, T. H., Do, P. T., Huynh, T. H., & Huynh, H. (2004).
The role of activated MEK-ERK pathway in quercetin-induced growth
inhibition and apoptosis in A549 lung cancer cells. Carcinogenesis, 25(5), 647-
659.
Nicolaou, K. C., Yang, Z., Liu, J. J., Ueno, H., Nantermet, P. G., Guy, R. K., et al.
(1994). Total synthesis of taxol. Nature, 367(6464), 630-634.
Nieder, C., Wiedenmann, N., Andratschke, N., & Molls, M. (2006). Current status of
angiogenesis inhibitors combined with radiation therapy. Cancer Treatment
Reviews, 32(5), 348-364.
361
Nishida, N., Yano, H., Nishida, T., Kamura, T., & Kojiro, M. (2006). Angiogenesis in
cancer. Vascular Health and Risk Management, 2(3), 213-219.
Nordling, C. O. (1953). A new theory on cancer-inducing mechanism. British Journal
of Cancer, 7, 68-72.
Northridge, M. E. (2002). Integrating ethnomedicine into public health. American
Journal of Public Health. Complementary and Alternative Medicine., 92(10),
1561.
Norvell, J. C., & Cassman, M. (2003). Structural biology and structural genomics: A
Federal agency perspective. In Chasman, D. I. (Ed.), Protein structure:
determination, analysis and applications for drug discovery (pp. 1-8). New
York: Marcel Dekker.
Nucciarelli, F., Mearini, E., & Minelli, A. (2003). Effects of adenosine on prostate
adenocarcinoma PC-3 and bladder carcinoma J82 cell lines. Drug Development
Research, 58(4), 390-395.
Numata, K., & Kaplan, D. L. (2010). Silk-based delivery systems of bioactive
molecules. Advanced Drug Delivery Reviews, In Press, Corrected Proof,
Nutt, L. K., Chandra, J., Pataer, A., Fang, B., Roth, J. A., Swisher, S. G., et al. (2002).
Bax-mediated Ca2+
mobilization promotes cytochrome c release during
apoptosis. Journal of Biological Chemistry, 277(23), 20301-20308.
O'Connor, O. A., Wright, J., Moskowitz, C., Muzzy, J., MacGregor-Cortelli, B.,
Stubblefield, M., et al. (2005). Phase II clinical experience with the novel
proteasome inhibitor bortezomib in patients with indolent non-Hodgkin's
lymphoma and mantle cell lymphoma. Journal of Clinical Oncology, 23(4), 676-
684.
O'Reilly, M. S., Boehm, T., Shing, Y., Fukai, N., Vasios, G., Lane, W. S., et al. (1997).
Endostatin: an endogenous inhibitor of angiogenesis and tumor growth. Cell,
88(2), 277-285.
O'Reilly, M. S., Holmgren, L., Shing, Y., Chen, C., Rosenthal, R. A., Moses, M., et al.
(1994). Angiostatin: a novel angiogenesis inhibitor that mediates the suppression
of metastases by a Lewis lung carcinoma. Cell, 79(2), 315-328.
O'Reilly, M. S., Pirie-Shepherd, S., Lane, W. S., & Folkman, J. (1999). Antiangiogenic
activity of the cleaved conformation of the serpin antithrombin. Science,
285(5435), 1926-1928.
Obajimi, O., Keen, J. C., & Melera, P. W. (2009). Inhibition of de novo purine synthesis
in human prostate cells results in ATP depletion, AMPK activation and induces
senescence. The Prostate, 69(11), 1206-1221.
Oberlies, N. H., & Kroll, D. J. (2004). Camptothecin and taxol: Historic achievements
in natural products research. Journal of Natural Products, 67(2), 129-135.
Ogbourne, S. M., Hampson, P., Lord, J. M., Parsons, P., De Witte, P. A., & Suhrbier, A.
(2007). Proceedings of the First International Conference on PEP005.
Anticancer Drugs, 18(3), 357-362.
Ogbourne, S. M., Suhrbier, A., Jones, B., Cozzi, S. J., Boyle, G. M., Morris, M., et al.
(2004). Antitumor activity of 3-ingenyl angelate: plasma membrane and
mitochondrial disruption and necrotic cell death. Cancer Research, 64(8), 2833-
2839.
Ohsaki, Y., Gazdar, A., Chen, H., & Johnson, B. (1992). Antitumor activity of magainin
analogues against human lung cancer cell lines. Cancer Research, 52(13), 3534-
3538.
Oliveira, K. A., Zecchin, K. G., Alberici, L. C., Castilho, R. F., & Vercesi, A. E. (2008).
Simvastatin inducing PC3 prostate cancer cell necrosis mediated by calcineurin
and mitochondrial dysfunction. Journal of Bioenergetics and Biomembranes,
40(4), 307-314.

362
Olofsson, M., Havelka, A., Brnjic, S., Shoshan, M., & Linder, S. (2008). Charting
calcium-regulated apoptosis pathways using chemical biology: role of
calmodulin kinase II. BMC Chemical Biology, 8(1), 2.
Olovnikov, A. M. (1996). Telomeres, telomerase, and aging: origin of the theory.
Experimental Gerontology, 31(4), 443-448.
Ono, M., & Kuwano, M. (2006). Molecular mechanisms of epidermal growth factor
receptor (EGFR) activation and response to gefitinib and other EGFR-targeting
drugs. Clinical Cancer Research, 12(24), 7242-7251.
Opoku, A. R., Geheeb-Keller, M., Lin, J., Terblanche, S. E., Hutchings, A.,
Chuturgoon, A., et al. (2000). Preliminary screening of some traditional Zulu
medicinal plants for antineoplastic activities versus the HepG2 cell line.
Phytotherapy Research, 14(7), 534-537.
Orians, C. M., Lower, S., Fritz, R. S., & Roche, B. M. (2003). The effects of plant
genetic variation and soil nutrients on secondary chemistry and growth in a
shrubby willow, Salix sericea: patterns and constraints on the evolution of
resistance traits. Biochemical Systematics and Ecology, 31(3), 233-247.
Orrenius, S., McConkey, D. J., Bellomo, G., & Nicotera, P. (1989). Role of Ca2+
in
toxic cell killing. Trends in Pharmacological Sciences, 10(7), 281-285.
Osborne, C. K., Hobbs, K., & Trent, J. M. (1987). Biological differences among MCF-7
human breast cancer cell lines from different laboratories. Breast Cancer
Research and Treatment, 9(2), 111-121.
Paczkowska, G. (1994). FloraBase, Haemodorum spicatum R.Br. Retrieved 22nd
February, 2010, from http://florabase.dec.wa.gov.au/browse/profile/1475.
Paez, J. G., Janne, P. A., Lee, J. C., Tracy, S., Greulich, H., Gabriel, S., et al. (2004).
EGFR mutations in lung cancer: Correlation with clinical response to gefitinib
therapy. Science, 304(5676), 1497-1500.
Palanee, T., Dutton, M. F., & Chuturgoon, A. A. (2001). Cytotoxicity of aflatoxin B1
and its chemically synthesised epoxide derivative on the A549 human
epithelioid lung cell line. Mycopathologia, 151(3), 155-159.
Palombo, E. A., & Semple, S. J. (2001). Antibacterial activity of traditional Australian
medicinal plants. Journal of Ethnopharmacology, 77(2-3), 151-157.
Panasci, L., Jean-Claude, B. J., Vosilescu, D., Mustafa, A., Damian, S., Damian, Z., et
al. (1996). Sensitization to doxorubicin resistance in breast cancer cell lines by
tamoxifen and megestrol acetate. Biochemical Pharmacology, 52(7), 1097-1102.
Panchagnula, R. (1998). Pharmaceutical aspects of paclitaxel. International Journal of
Pharmaceutics, 172(1-2), 1-15.
Pappa, G., Bartsch, H., & Gerhäuser, C. (2007). Biphasic modulation of cell
proliferation by sulforaphane at physiologically relevant exposure times in a
human colon cancer cell line. Molecular Nutrition and Food Research, 51(8),
977-984.
Park, M. T., & Lee, S. J. (2003). Cell cycle and cancer. Journal of Biochemistry and
Molecular Biology, 36(1), 60-65.
Parker, B. W., Kaur, G., Nieves-Neira, W., Taimi, M., Kohlhagen, G., Shimizu, T., et
al. (1998). Early induction of apoptosis in hematopoietic cell lines after
exposure to flavopiridol. Blood, 91(2), 458-465.
Parker, W. B., Secrist, J. A., 3rd, & Waud, W. R. (2004). Purine nucleoside
antimetabolites in development for the treatment of cancer. Current Opinion in
Investigational Drugs, 5(6), 592-596.
Parris, W. C. V., & Smith, H. S. (2003). Alternative pain medicine. Pain Practice, 3(2),
105-116.
363
Parsons, P. G., & Morrison, L. (1978). Melphalan-induced chromosome damage in
sensitive and resistant human melanoma cell lines. International Journal of
Cancer, 21(4), 438-443.
Parsons, P. G., Moss, D. J., Morris, C., Musk, P., Maynard, K., & Partridge, R. (1985).
Decreased calcium dependence of lymphoblastoid cell lines compared with
burkitt lymphoma cell lines. International Journal of Cancer, 35(6), 743-747.
Parsons, P. G., Musk, P., Goss, P. D., & Leah, J. (1983). Effects of calcium depletion on
human cells in vitro and the anomalous behaviour of the human melanoma cell
line MM170. Cancer Research, 43(5), 2081-2087.
Parsons, P. G., Smellie, S. G., Morrison, L. E., & Hayward, I. P. (1982). Properties of
human melanoma cells resistant to 5-(3',3'-dimethyl-1-triazeno)imidazole-4-
carboxamide and other methylating agents. Cancer Research, 42(4), 1454-1461.
Paschke, D., Abarzua, S., Schlichting, A., Richter, D. U., Leinweber, P., & Briese, V.
(2009). Inhibitory effects of bark extracts from Ulmus laevis on endometrial
carcinoma: an in-vitro study. European Journal of Cancer Prevention, 18(2),
162-168.
Pascutti, M. F., Campodonico, G., García, F., Manarin, R., Bottasso, O., Revelli, S., et
al. (2009). Novel cytostatic activity of the trypanocidal drug Benznidazole.
International Immunopharmacology, 9(6), 739-745.
Pasetto, L. M., D'Andrea, M. R., Brandes, A. A., Rossi, E., & Monfardini, S. (2006).
The development of platinum compounds and their possible combination.
Critical Reviews in Oncology/ Hematology, 60(1), 59-75.
Patwardhan, B., & Patwardhan, A. (2006). Traditional medicine for global health.
Public health and intellectual property aspects. Technology Monitor, Special
Feature : Traditional Medicine: S&T Advancement(Nov-Dec), 17-22.
Patwardhan, B., Warude, D., Pushpangadan, P., & Bhatt, N. (2005). Ayurveda and
traditional Chinese medicine: A comparative overview. Evidence-based
Complementary and Alternative Medicine, 2(4), 465-473.
Pauwels, O., Kiss, R., Pasteels, J. L., & Atassi, G. (1995). Characterization of alkylating
versus intercalating anticancer drug-induced effects on cell survival, cell cycle
kinetic and morphonuclear pattern of three neoplastic cells lines growing in
vitro. Pharmaceutical Research, 12(7), 1011-1018.
Pedro, M., Ferreira, M. M., Cidade, H., Kijjoa, A., Bronze-da-Rocha, E., & Nascimento,
M. S. J. (2005). Artelastin is a cytotoxic prenylated flavone that disturbs
microtubules and interferes with DNA replication in MCF-7 human breast
cancer cells. Life Sciences, 77(3), 293-311.
Pennacchio, M., Kemp, A. S., Taylor, R. P., Wickens, K. M., & Kienow, L. (2005).
Interesting biological activities from plants traditionally used by Native
Australians. Journal of Ethnopharmacology, 96(3), 597-601.
Pennacchio, M., Syah, Y. M., Ghisalberti, E. L., & Alexander, E. (1996). Cardioactive
compounds from Eremophila species. Journal of Ethnopharmacology, 53(1),
21-27.
Perez, E. A., & Buckwalter, C. A. (1998). Sequence-dependent cytotoxicity of
etoposide and paclitaxel in human breast and lung cancer cell lines. Cancer
Chemotherapy and Pharmacology, 41(6), 448-452.
Perrow, K. L., Ranson, M., Locke, J. M., Bremner, J. B., & Pyne, S. G. (2008).
Selectively deliverable isatin-based cytotoxic agents. Australian Patent AU
AU2007/001966. Retrieved May 22nd, 2008, from Patentscope®,
http://www.wipo.int/pctdb/en/wo.jsp?IA=AU2007001966.
Perry, R., Kang, Y., & Greaves, B. (1995). Effects of tamoxifen on growth and
apoptosis of estrogen-dependent and -independent human breast cancer cells.
Annals of Surgical Oncology, 2(3), 238-245.

364
Petsko, G. A. (1996). For medicinal purposes. Nature, 384(6604 Suppl), 7-9.
Philip, K. (2001). Seeds of neo-colonialism? Reflections on ecological politics in the
new world order. Capitalism Nature Socialism, 12(2), 3 - 47.
Pianetti, S., Guo, S., Kavanagh, K. T., & Sonenshein, G. E. (2002). Green tea
polyphenol epigallocatechin-3 gallate inhibits Her-2/neu signaling, proliferation,
and transformed phenotype of breast cancer cells. Cancer Research, 62(3), 652-
655.
Pimm, S. L., & Raven, P. (2000). Biodiversity: Extinction by numbers. Nature,
403(6772), 843-845.
Pimm, S. L., Russell, G.J., Gittleman, J.L. and Brooks, T.M. (1995). The future of
biodiversity. Science, 269(7), 347-350.
Plochmann, K., Korte, G., Koutsilieri, E., Richling, E., Riederer, P., Rethwilm, A., et al.
(2007). Structure-activity relationships of flavonoid-induced cytotoxicity on
human leukemia cells. Archives of Biochemistry and Biophysics, 460(1), 1-9.
Plumb, J. A. (1999). Cell sensitivity assays: the MTT assay. In Brown, R. & U., B.-B.
(Eds.), Cytotoxic Drug Resistance Mechanisms. Totowa: Humana Press.
Poenie, M., Alderton, J., Steinhardt, R., & Tsien, R. (1986). Calcium rises abruptly and
briefly throughout the cell at the onset of anaphase. Science, 233(4766), 886-
889.
Pollack, I. F., Kawecki, S., & Lazo, J. S. (1996). Blocking of glioma proliferation in
vitro and in vivo and potentiating the effects of BCNU and cisplatin: UCN-01, a
selective protein kinase C inhibitor. Journal of Neurosurgery, 84(6), 1024-1032.
Possemato, R., & Hahn, W. (2007). Contributions of telomerase to tumorigenesis. In
Gewirtz, D. A., Holt, S. E. & Grant, S. (Eds.), Apoptosis, senescence, and
cancer (2nd
ed., pp. 159-171). Totowa: Humana Press.
Pradella, M., Dorizzi, R. M., Rigolin, F., & Statland, B. E. (1988). Relative density of
urine: methods and clinical significance. Critical Reviews in Clinical Laboratory
Sciences, 26(3), 195-242.
Prakash, O., Singh, G. N., Singh, R. M., Madan, S., & Mathur, S. C. (2009).
Interactions of herbal extract combinations against free radical scavenging
activity. Pharmaceutical Biology, 47(8), 729-733.
Prassas, I., Paliouras, M., Datti, A., & Diamandis, E. P. (2008). High-throughput
screening identifies cardiac glycosides as potent inhibitors of human tissue
kallikrein expression: implications for cancer therapies. Clinical Cancer
Research, 14(18), 5778-5784.
Price, L. S., Langeslag, M., Klooster, J. P. t., Hordijk, P. L., Jalink, K., & Collard, J. G.
(2003). Calcium signaling regulates translocation and activation of Rac. Journal
of Biological Chemistry, 278(41), 39413-39421.
Putney, J. W. (2006). Methods in signal transduction (2nd
ed., pp. 509). Boca Raton:
CRC Press.
Qi, Q., Peng, J., Liu, W., You, Q., Yang, Y., Lu, N., et al. (2009). Toxicological studies
of wogonin in experimental animals. Phytotherapy Research, 23(3), 417-422.
Quinones, H. I., List, A. F., & Gerner, E. W. (2002). Selective exclusion by the
polyamine transporter as a mechanism for differential radioprotection of
amifostine derivatives. Clinical Cancer Research, 8(5), 1295-1300.
Rago, R., Mitchen, J., & Wilding, G. (1990). DNA fluorometric assay in 96-well tissue
culture plates using Hoechst 33258 after cell lysis by freezing in distilled water.
Analytical Biochemistry, 191(1), 31-34.
Rahman, M. A., & Toi, M. (2003). Anti-angiogenic therapy in breast cancer.
Biomedicine and Pharmacotherapy, 57(10), 463-470.
365
Rahman, R., Smith, S., Rahman, C., & Grundy, R. (2010). Antiangiogenic therapy and
mechanisms of tumor resistance in malignant glioma. Journal of Oncology,
2010, 251231.
Rajpal, S., & Venook, A. P. (2006). Targeted therapy in colorectal cancer. Clinical
Advances in Hematology and Oncology, 4(2), 124-132.
Ralhan, R., & Kaur, J. (2007). Alkylating agents and cancer therapy. Expert Opinion on
Therapeutic Patents, 17(9), 1061-1075.
Randall, W. A., Price, C. W., & Welch, H. (1947). Demonstration of hormesis (increase
in fatality rate) by penicillin. American Journal of Public Health. Nations
Health, 37(4), 421-425.
Rao, P. S., Ramanadham, M., & Prasad, M. N. (2009). Anti-proliferative and cytotoxic
effects of Strychnos nux-vomica root extract on human multiple myeloma cell
line - RPMI 8226. Food and Chemical Toxicology, 47(2), 283-288.
Ravdin, P. M., Cronin, K. A., Howlader, N., Berg, C. D., Chlebowski, R. T., Feuer, E.
J., et al. (2007). The decrease in breast-cancer Incidence in 2003 in the United
States. New England Journal of Medicine, 356(16), 1670-1674.
Raymond, E., Faivre, S., & Armand, J. P. (2000). Epidermal growth factor receptor
tyrosine kinase as a target for anticancer therapy. Drugs, 60 Suppl 1, 15-23;
discussion 41-12.
Rello, S., Stockert, J. C., Moreno, V., Gamez, A., Pacheco, M., Juarranz, A., et al.
(2005). Morphological criteria to distinguish cell death induced by apoptotic and
necrotic treatments. Apoptosis, 10(1), 201-208.
Remote communities benefit through tourism partnerships. (2009). ATE Daily.
Retrieved 2nd
June, 2010, from http://www.media.australia.com/en-
au/documents/ATEDaily_150609.pdf.
Ren, Y., Houghton, P. J., Hider, R. C., & Howes, M. J. (2004). Novel diterpenoid
acetylcholinesterase inhibitors from Salvia miltiorhiza. Planta Medica, 70(3),
201-204.
Ren, Y., Wong, S. M., & Lim, L.-Y. (2007). Folic acid-conjugated protein cages of a
plant virus: a novel delivery platform for doxorubicin. Bioconjugate Chemistry,
18(3), 836-843.
Richardson, D. R., Tran, E. H., & Ponka, P. (1995). The potential of iron chelators of
the pyridoxal isonicotinoyl hydrazone class as effective antiproliferative agents.
Blood, 86(11), 4295-4306.
Riedl, S. J., & Salvesen, G. S. (2007). The apoptosome: signalling platform of cell
death. Nature Reviews. Molecular Cell Biology, 8(5), 405-413.
Riss, T. L., & Moravec, R. A. (2004). Use of multiple assay endpoints to investigate the
effects of incubation time, dose of toxin, and plating density in cell-based
cytotoxicity assays. ASSAY and Drug Development Technologies., 2(1), 51-62.
Riss, T. L., Moravec, R. A., O'Brien, M. A., Hawkins, E. M., & Niles, A. (2006).
Homogeneous multiwell assays for measuring cell viability cytotoxicity and
apoptosis. In Minor, L. K. (Ed.), Handbook of Assay Development in Drug
Discovery (pp. 464). Boca Raton: CRC Press.
Rizwana, J. N., Nazlina, I., Razehar, A. R. M., Noraziah, A. Z. S., Ling, C. Y.,
Muzaimah, S. A. S., et al. (2010). A survey on phytochemical and bioactivity of
plant extracts from Malaysian forest reserves. Journal of Medicinal Plants
Research, 4(3), 203-210.
Rizzuto, R., Pinton, P., Ferrari, D., Chami, M., Szabadkai, G., Magalhaes, P. J., et al.
(2003). Calcium and apoptosis: facts and hypotheses. Oncogene, 22(53), 8619-
8627.

366
Roa-Rodr´ıguez, C., & van Dooren, T. (2008). Shifting common spaces of plant genetic
resources in the international regulation of property. The Journal of World
Intellectual Property, 11(3), 176-202.
Robak, T., Korycka, A., Kasznicki, M., Wrzesien-Kus, A., & Smolewski, P. (2005).
Purine nucleoside analogues for the treatment of hematological malignancies:
pharmacology and clinical applications. Current Cancer Drug Targets, 5(6),
421-444.
Robinson, E., Grau, A., Evans, D., Smid, C., Chiao, P., Abbruzzese, J., et al. (1998).
Cell cycle regulation of human pancreatic cancer by tamoxifen. Annals of
Surgical Oncology, 5(4), 342-349.
Robotic screening. (1996). Nature, 384 2.
Roehrs, P. (2007). NGOs’ perspectives on piracy and protection. Geneva: Centre for
Applied Studies in International Negotiations. Society, P. o. G. I. C.
Rosen, L. S. (2001). Angiogenesis inhibition in solid tumors. Cancer Journal, 7 Suppl
3, S120-128.
Rossi, T., Iannuccelli, V., Coppi, G., Bruni, E., & Baggio, G. (2009). Role of the
pharmaceutical excipients in the tamoxifen activity on MCF-7 and Vero cell
cultures. Anticancer Research, 29(11), 4529-4533.
Rowinsky, E. K., & Donehower, R. C. (1995). Paclitaxel (Taxol). New England Journal
of Medicine, 332(15), 1004-1014.
Roy, M., Chakraborty, S., Siddiqi, M., & Bhattacharya, R. K. (2002). Induction of
apoptosis in tumor cells by natural phenolic compounds. Asian Pacific Journal
of Cancer Prevention, 3(1), 61-67.
Rudall, P. (1995). New records of secondary thickening in monocotyledons AWA
Journal, 16(3), 261- 268.
Russo, A., Cardile, V., Lombardo, L., Vanella, L., Vanella, A., & Garbarino, J. A.
(2005). Antioxidant activity and antiproliferative action of methanolic extract of
Geum quellyon Sweet roots in human tumor cell lines. Journal of
Ethnopharmacology, 100(3), 323-332.
Saklani, A., & Kutty, S. K. (2008). Plant-derived compounds in clinical trials. Drug
Discovery Today, 13(3-4), 161-171.
Saleem, A., Husheem, M., Härkönen, P., & Pihlaja, K. (2002). Inhibition of cancer cell
growth by crude extract and the phenolics of Terminalia chebula retz. fruit.
Journal of Ethnopharmacology, 81(3), 327-336.
Sánchez-Pérez, I. (2006). DNA repair inhibitors in cancer treatment. Clinical and
Translational Oncology, 8(9), 642-646.
Sandal, T. (2002). Molecular aspects of the mammalian cell cycle and cancer.
Oncologist, 7(1), 73-81.
Sankaran, S., & Parvin, J. D. (2006). Centrosome function in normal and tumor cells.
Journal of Cellular Biochemistry, 99(5), 1240-1250.
Saraste, A., & Pulkki, K. (2000). Morphologic and biochemical hallmarks of apoptosis.
Cardiovascular Research, 45(3), 528-537.
Sargent, J. M. (2003). The use of the MTT assay to study drug resistance in fresh
tumour samples. Recent Results Cancer Research, 161, 13-25.
Satchi-Fainaro, R., Mamluk, R., Wang, L., Short, S. M., Nagy, J. A., Feng, D., et al.
(2005). Inhibition of vessel permeability by TNP-470 and its polymer conjugate,
caplostatin. Cancer Cell, 7(3), 251-261.
Savelev, S., Okello, E., Perry, N. S. L., Wilkins, R. M., & Perry, E. K. (2003).
Synergistic and antagonistic interactions of anticholinesterase terpenoids in
Salvia lavandulaefolia essential oil. Pharmacology Biochemistry and Behavior,
75(3), 661-668.
367
Sax, D. F., & Gaines, S. D. (2008). Species invasions and extinction: The future of
native biodiversity on islands. Proceedings of the National Academy of Sciences,
105(Supplement 1), 11490-11497.
Scaglione-Sewell, B. A., Bissonnette, M., Skarosi, S., Abraham, C., & Brasitus, T. A.
(2000). A vitamin D3 analog induces a G1-phase arrest in CaCo-2 cells by
inhibiting Cdk2 and Cdk6: Roles of Cyclin E, p21Waf1, and p27Kip1.
Endocrinology, 141(11), 3931-3939.
Scambia, G., Ranelletti, F. O., Panici, P. B., Vincenzo, R., Bonanno, G., Ferrandina, G.,
et al. (1994). Quercetin potentiates the effect of adriamycin in a multidrug-
resistant MCF-7 human breast-cancer cell line: P-glycoprotein as a possible
target. Cancer Chemotherapy and Pharmacology, 34(6), 459-464.
Scarborough, J. (1978). Theophrastus on herbals and herbal remedies. Journal of the
History of Biology, 11(2), 353-385.
Schabenberger, O., Tharp, B. E., Kells, J. J., & Penner, D. (1999). Statistical tests for
hormesis and effective dosages in herbicide dose response. Agronomy Journal,
91(4), 713-721.
Schiefer, H. B., Irvine, D. G., & Buzik, S. C. (1997). What is toxicology? In
Understanding Toxicology: Chemicals, Their Benefits and Risks. Boca Raton:
CRC Press.
Schiff, P. B., Fant, J., & Horwitz, S. B. (1979). Promotion of microtubule assembly in
vitro by taxol. Nature, 277(5698), 665-667.
Schmelzer, G. H., & Gurib-Fakim, A. (Eds.). (2008). Medicinal plants (Vol. 11).
Wageningen: PROTA Foundation/ Backhuys Publishers.
Schubert, S. (1997). Cytotoxic amyloid peptides inhibit cellular 3-(4,5-dimethylthiazol-
2-yl)-2,5-diphenyltetrazolium bromide (MTT) reduction by enhancing MTT
formazan exocytosis. Journal of Neurochemistry, 69(6), 2285-2293.
Schurz, F., Sabater-Vilar, M., & Fink-Gremmels, J. (2000). Mutagenicity of mercury
chloride and mechanisms of cellular defence: the role of metal-binding proteins.
Mutagenesis, 15(6), 525-530.
Schwartsmann, G., Ratain, M. J., Cragg, G. M., Wong, J. E., Saijo, N., Parkinson, D. R.,
et al. (2002). Anticancer drug discovery and development throughout the world.
Journal of Clinical Oncology, 20(18 Suppl), 47S-59S.
Schweitzer, B. I., Dicker, A. P., & Bertino, J. R. (1990). Dihydrofolate reductase as a
therapeutic target. FASEB Journal, 4(8), 2441-2452.
Scotdesco Aboriginal Community. (2010). Retrieved 23rd
May, 2010, from
http://www.scotdesco.com/scotdesco/about.htm.
Scott, I. U., & Karp, C. L. (1996). Euphorbia sap keratopathy: four cases and a possible
pathogenic mechanism. British Journal of Ophthalmology, 80(9), 823-826.
Segota, E., & Bukowski, R. M. (2004). The promise of targeted therapy: cancer drugs
become more specific. Cleveland Clinic Journal of Medicine, 71(7), 551-560.
Seigler, D. S. (1998). Plant secondary metabolism. Norwell: Kluwer Academic
Publishers.
Selvendiran, K., Koga, H., Ueno, T., Yoshida, T., Maeyama, M., Torimura, T., et al.
(2006). Luteolin promotes degradation in signal transducer and activator of
transcription 3 in human hepatoma cells: An implication for the antitumor
potential of flavonoids. Cancer Research, 66(9), 4826-4834.
Semple, S. J., Reynolds, G. D., O'Leary, M. C., & Flower, R. L. P. (1998). Screening of
Australian medicinal plants for antiviral activity. Journal of
Ethnopharmacology, 60(2), 163-172.
Senthilnathan, P., Padmavathi, R., Banu, S. M., & Sakthisekaran, D. (2006).
Enhancement of antitumor effect of paclitaxel in combination with

368
immunomodulatory Withania somnifera on benzo(a)pyrene induced
experimental lung cancer. Chemico-Biological Interactions, 159(3), 180-185.
Senzer, N., Shen, Y., Hill, C., & Nemunaitis, J. (2005). Individualised cancer
therapeutics: dream or reality? Expert Opinion on Therapeutic Targets, 9(6),
1189-1201.
Sgouras, D., & Duncan, R. (1990). Methods for the evaluation of biocompatibility of
soluble synthetic polymers which have potential for biomedical use: 1. Use of
the tetrazolium-based colorimetric assay (MTT) as a preliminary screen for
evaluation of in vitro cytotoxicity. Journal of Materials Science: Materials in
Medicine, 1, 61-68.
Shalaby, S. W. (2004). Absorbable delivery systems for cancer therapy. In Shalaby
S.W. & Burg, K. J. L. (Eds.), Absorbable and biodegradable polymers (pp.
289). Boca Raton: CRC Press.
Shaman loses its magic. (1999). Economist, 350, 77.
Shang, X. J., Yao, G., Ge, J. P., Sun, Y., Teng, W. H., & Huang, Y. F. (2009).
Procyanidin induces apoptosis and necrosis of prostate cancer cell line PC-3 in a
mitochondrion-dependent manner. Journal of Andrology, 30(2), 122-126.
Shen, F., & Weber, G. (1997). Synergistic action of quercetin and genistein in human
ovarian carcinoma cells. Oncology Research, 9(11-12), 597-602.
Shen, S.-C., Lee, W.-R., Lin, H.-Y., Huang, H.-C., Ko, C.-H., Yang, L.-L., et al. (2002).
In vitro and in vivo inhibitory activities of rutin, wogonin, and quercetin on
lipopolysaccharide-induced nitric oxide and prostaglandin E2 production.
European Journal of Pharmacology, 446(1-3), 187-194.
Shiff, S. J., Koutsos, M. I., Qiao, L., & Rigas, B. (1996). Nonsteroidal antiinflammatory
drugs inhibit the proliferation of colon adenocarcinoma cells: effects on cell
cycle and apoptosis. Experimental Cell Research, 222(1), 179-188.
Shimizu, Y. (1985). Bioactive marine natural products, with emphasis on handling of
water-soluble compounds. Journal of Natural Products, 48(2), 223-235.
Shiva, V. (1997). Biopiracy: The plunder of nature and knowledge. Cambridge: South
End Press.
Shoemaker, M., Hamilton, B., Dairkee, S. H., Cohen, I., & Campbell, M. J. (2005). In
vitro anticancer activity of twelve Chinese medicinal herbs. Phytotherapy
Research, 19, 649-651.
Shoemaker, R. H. (2006). The NCI60 human tumour cell line anticancer drug screen.
Nature Reviews. Cancer, 6(10), 813-823.
Shoichet, B. K. (2006). Interpreting steep dose-response curves in early inhibitor
discovery. Journal of Medicinal Chemistry, 49(25), 7274-7277.
Siavoshian, S., Segain, J. P., Kornprobst, M., Bonnet, C., Cherbut, C., Galmiche, J. P.,
et al. (2000). Butyrate and trichostatin A effects on the
proliferation/differentiation of human intestinal epithelial cells: induction of
cyclin D3 and p21 expression. Gut, 46(4), 507-514.
Sikora, K., Advani, S., Koroltchouk, V., Magrath, I., Levy, L., Pinedo, H., et al. (1999).
Essential drugs for cancer therapy: a World Health Organization consultation.
Annals of Oncology, 10(4), 385-390.
Silenzio, V. M. (2002). What is the role of complementary and alternative medicine in
public health? American Journal of Public Health, 92(10), 1562-1564.
Siller, G., Gebauer, K., Welburn, P., Katsamas, J., & Ogbourne, S. M. (2009). PEP005
(ingenol mebutate) gel, a novel agent for the treatment of actinic keratosis:
Results of a randomized, double-blind, vehicle-controlled, multicentre, phase IIa
study. Australasian Journal of Dermatology, 50(1), 16-22.
Simpson, M. G. (1990). Phylogeny and classification of the Haemodoraceae. Annals of
the Missouri Botanical Garden, 77(4), 722-784.

369
Singla, A. K., Garg, A., & Aggarwal, D. (2002). Paclitaxel and its formulations.
International Journal of Pharmaceutics, 235(1-2), 179-192.
Sipkema, D., Franssen, M., Osinga, R., Tramper, J., & Wijffels, R. (2005). Marine
sponges as pharmacy. Marine Biotechnology, 7(3), 142-162.
Sitte, N., Saretzki, G., & von Zglinicki, T. (1998). Accelerated telomere shortening in
fibroblasts after extended periods of confluency. Free Radical Biology and
Medicine, 24(6), 885-893.
Sledge, G. W., Rugo, H. S., & Burstein, H. J. (2006). The role of angiogenesis
inhibition in the treatment of breast cancer. Clinical Advances in Hematology
and Oncology, 4 Suppl 21(10), 1-12.
Sleet, R. B., & Brendel, K. (1983). Improved methods for harvesting and counting
synchronous populations of Artemia nauplii for use in developmental
toxicology. Ecotoxicology and Environmental Safety, 7(5), 435-446.
Sloan, R. P., Bagiella, E., & Powell, T. (1999). Religion, spirituality, and medicine. The
Lancet, 353(9153), 664-667.
Smith, A. B., Beauchamp, T. J., LaMarche, M. J., Kaufman, M. D., Qiu, Y., Arimoto,
H., et al. (2000). Evolution of a Gram-scale synthesis of (+)-discodermolide.
Journal of the American Chemical Society, 122(36), 8654-8664.
Smith, J. E., Tucker, D., Watson, K., & Jones, G. L. (2007). Identification of
antibacterial constituents from the indigenous Australian medicinal plant
Eremophila duttonii F. Muell. (Myoporaceae). Journal of Ethnopharmacology,
112(2), 386-393.
Smith, L. M., Wise, S. C., Hendricks, D. T., Sabichi, A. L., Bos, T., Reddy, P., et al.
(1999). cJun overexpression in MCF-7 breast cancer cells produces a
tumorigenic, invasive and hormone resistant phenotype. Oncogene, 18(44),
6063-6070.
Smith, P. K., Krohn, R. I., Hermanson, G. T., Mallia, A. K., Gartner, F. H., Provenzano,
M. D., et al. (1985). Measurement of protein using bicinchoninic acid.
Analytical Biochemistry, 150(1), 76-85.
So, F. V., Guthrie, N., Chambers, A. F., & Carroll, K. K. (1997). Inhibition of
proliferation of estrogen receptor-positive MCF-7 human breast cancer cells by
flavonoids in the presence and absence of excess estrogen. Cancer Letters,
112(2), 127-133.
Sobottka, S., & Berger, M. (1992). Assessment of antineoplastic agents by MTT assay:
partial underestimation of antiproliferative properties. Cancer Chemotherapy
and Pharmacology., 30(5), 385-393.
Soejarto, D. D. (1996). Biodiversity prospecting and benefit-sharing: perspectives from
the field. Journal of Ethnopharmacology, 51(1-3), 1-15.
Song, X., Lin, H. P., Johnson, A. J., Tseng, P. H., Yang, Y. T., Kulp, S. K., et al.
(2002). Cyclooxygenase-2, player or spectator in cyclooxygenase-2 inhibitor-
induced apoptosis in prostate cancer cells. Journal of the National Cancer
Institute, 94(8), 585-591.
Sorenson, C. M., & Eastman, A. (1988a). Mechanism of cis-
diamminedichloroplatinum(II)-induced cytotoxicity: role of G2 arrest and DNA
double-strand breaks. Cancer Research, 48(16), 4484-4488.
Sorenson, C. M., & Eastman, A. (1988b). Influence of cis-diamminedichloroplatinum
(II) on DNA synthesis and cell cycle progression in excision repair proficient
and deficient Chinese hamster ovary cells. Cancer Research, 48(23), 6703-6707.
Spink, D. C., Spink, B. C., Cao, J. Q., DePasquale, J. A., Pentecost, B. T., Fasco, M. J.,
et al. (1998). Differential expression of CYP1A1 and CYP1B1 in human breast
epithelial cells and breast tumor cells. Carcinogenesis, 19(2), 291-298.

370
Sramkoski, R., Pretlow, T., Giaconia, J., Pretlow, T., Schwartz, S., Sy, M.-S., et al.
(1999). A new human prostate carcinoma cell line, 22R v1. In Vitro Cellular
and Developmental Biology - Animal, 35(7), 403-409.
Sriram, D., Yogeeswari, P., Thirumurugan, R., & Bal, T. R. (2005). Camptothecin and
its analogues: a review on their chemotherapeutic potential. Natural Product
Research, 19(4), 393-412.
Stack, E. M. (1989). Aboriginal Pharmacopoeia, The Third Eric Johnston Lecture.
Darwin: Northern Territory Library Service.
Stanislav, F., Kás, J., Fini, F., Steinberg, M., & Ruml, T. (1999). The effect of different
solvents on the ATP/ADP content and growth properties of HeLa cells. Journal
of Biochemical and Molecular Toxicology, 13(1), 11-15.
Staunton, M. J., & Gaffney, E. F. (1998). Apoptosis: basic concepts and potential
significance in human cancer. Archives of Patholological and Laboratory
Medicine, 122(4), 310-319.
Stebbing, A. R. (1982). Hormesis--the stimulation of growth by low levels of inhibitors.
The Science of the Total Environment, 22(3), 213-234.
Stebbing, A. R. D. (1998). A theory for growth hormesis. Mutation
Research/Fundamental and Molecular Mechanisms of Mutagenesis, 403(1-2),
249-258.
Stergiopoulou, T., Meletiadis, J., Sein, T., Papaioannidou, P., Tsiouris, I., Roilides, E.,
et al. (2008). Isobolographic analysis of pharmacodynamic interactions between
antifungal agents and ciprofloxacin against Candida albicans and Aspergillus
fumigatus. Antimicrobial Agents and Chemotherapy, 52(6), 2196-2204.
Stierle, A., Strobel, G., & Stierle, D. (1993). Taxol and taxane production by Taxomyces
andreanae, an endophytic fungus of Pacific yew. Science, 260(5105), 214-216.
Stone, R. (2008). Intellectual property: Chinese province crafts pioneering law to thwart
biopiracy. Science, 320(5877), 732-733.
Stormer, E., von Moltke, L. L., Perloff, M. D., & Greenblatt, D. J. (2002). Differential
modulation of P-glycoprotein expression and activity by non-nucleoside HIV-1
reverse transcriptase inhibitors in cell culture. Pharmaceutical Research, 19(7),
1038-1045.
Strebhardt, K., & Ullrich, A. (2008). Paul Ehrlich's magic bullet concept: 100 years of
progress. Nature Reviews. Cancer, 8(6), 473-480.
Striggow, F., & Ehrlich, B. E. (1996). Ligand-gated calcium channels inside and out.
Current Opinion in Cell Biology, 8(4), 490-495.
Strobel, G., & Daisy, B. (2003). Bioprospecting for microbial endophytes and their
natural products. Microbiology and Molecular Biology Reviews, 67(4), 491-502.
Strobel, G., Daisy, B., & Castillo, U. (2005). Novel natural products from rainforest
endophytes. In Zhang, L. & Demain, A. L. (Eds.), Natural Products: Drug
Discovery and Therapeutic Medicine. Totowa, USA: Humana Press.
Strobel, G., Yang, X., Sears, J., Kramer, R., Sidhu, R. S., & Hess, W. M. (1996). Taxol
from Pestalotiopsis microspora, an endophytic fungus of Taxus wallachiana.
Microbiology, 142(2), 435-440.
Strohl, W. R. (2000). The role of natural products in a modern drug discovery program.
Drug Discovery Today, 5(2), 39-41.
Stumpf, W. E. (2006). The dose makes the medicine. Drug Discovery Today, 11(11-12),
550-555.
Suffness, M., & Wall, M. E. (1995). Discovery and development of taxol. In Suffness,
M. (Ed.), Taxol: science and applications (pp. 3-25). Boca Raton: CRC Press.
Sullivan, A., Syed, N., Gasco, M., Bergamaschi, D., Trigiante, G., Attard, M., et al.
(2004). Polymorphism in wild-type p53 modulates response to chemotherapy in
vitro and in vivo. Oncogene, 23(19), 3328-3337.
371
Sun, M. G., Williams, J., Munoz-Pinedo, C., Perkins, G. A., Brown, J. M., Ellisman, M.
H., et al. (2007a). Correlated three-dimensional light and electron microscopy
reveals transformation of mitochondria during apoptosis. Nature Cell Biology,
9(9), 1057-1065.
Sun, M. L., Wei, J. M., Wang, X. W., Li, L., Wang, P., Li, M., et al. (2007b).
Paclitaxel-octreotide conjugates inhibit growth of human non-small cell lung
cancer cells in vitro. Experimental Oncology, 29(3), 186-191.
Sun, Y. (2006). p53 and its downstream proteins as molecular targets of cancer.
Molecular Carcinogenesis, 45(6), 409-415.
Suzuki, K., Morokata, T., Morihira, K., Sato, I., Takizawa, S., Kaneko, M., et al.
(2007). A dual antagonist for chemokine CCR3 receptor and histamine H1
receptor. European Journal of Pharmacology, 563(1-3), 224-232.
Suzuki, Y., Yoshikawa, K., & Yokochi, T. (1991). A new sensitive and rapid automated
fluorometric assay for Detection of natural killer activity using
carboxyfluorescein diacetate. Journal of Immunoassay and Immunochemistry,
12(1), 145 - 157.
Svarstad, H. (2005). A global political ecology of bioprospecting. In Paulson, S. &
Gezon, L. L. (Eds.), Political Ecology Across Spaces, Scales and Social Groups.
New Brunswick Rutgers University Press.
Sweeney, A. P., Wyllie, S. G., Shalliker, R. A., & Markham, J. L. (2001). Xanthine
oxidase inhibitory activity of selected Australian native plants. Journal of
Ethnopharmacology, 75(2-3), 273-277.
Sylvie, M., Luc, L., & Katharina, D. H. (2000). First and second messenger role of
calcium: survival versus apoptosis in serum-free cultured granulosa explants.
Annals of the New York Academy of Sciences, 926 (Mechanisms of Cell Death
II: The Third Annual Conference of the International Cell Death Society), 101-
115.
Szabadi, E. (1977). A model of two functionally antagonistic receptor populations
activated by the same agonist. Journal of Theoretical Biology, 69(1), 101-112.
Szostak, J. W. (1997). Introduction: Combinatorial chemistry. Chemical Reviews, 97(2),
347-348.
Tai, J., Cheung, S., Chan, E., & Hasman, D. (2004). In vitro culture studies of
Sutherlandia frutescens on human tumor cell lines. Journal of
Ethnopharmacology, 93(1), 9-19.
Takasaki, M., Konoshima, T., Tokuda, H., Masuda, K., Arai, Y., Shiojima, K., et al.
(1999). Anti-carcinogenic activity of Taraxacum plant. II. Biological and
Pharmaceutical Bulletin, 22(6), 606-610.
Tallarida, R. J. (2002). The interaction index: a measure of drug synergism. Pain, 98(1-
2), 163-168.
Tan, G., Gyllenhaal, C., & Soejarto, D. D. (2006). Biodiversity as a source of anticancer
drugs. Current Drug Targets, 7(3), 265-277.
Tan, R. X., & Zou, W. X. (2001). Endophytes: a rich source of functional metabolites.
Natural Product Reports, 18(4), 448-459.
Tapatjatjaka Art and Craft Centre. (n.d). Retrieved 26th
May, 2010, from
http://www.tapatjatjakaarts.com.au/.
Tedesco, P., & Cicchetti, J. (2001). Like cures like: homeopathy. The American Journal
of Nursing, 101(9), 43-49.
Tedlock, B. (2006). Indigenous heritage and biopiracy in the age of intellectual property
rights. Explore, 2(3), 256-259.
Thornton, A. D., Ravn, P., Winslet, M., & Chester, K. (2006). Angiogenesis inhibition
with bevacizumab and the surgical management of colorectal cancer. British
Journal of Surgery, 93(12), 1456-1463.

372
Thurmond, R. L., Gelfand, E. W., & Dunford, P. J. (2008). The role of histamine H1 and
H4 receptors in allergic inflammation: the search for new antihistamines. Nature
Reviews. Drug Discovery, 7(1), 41-53.
Tilly, B. C., Tertoolen, L. G., Remorie, R., Ladoux, A., Verlaan, I., de Laat, S. W., et al.
(1990). Histamine as a growth factor and chemoattractant for human carcinoma
and melanoma cells: action through Ca2+
-mobilizing H1 receptors. Journal of
Cell Biology, 110(4), 1211-1215.
Toledo-Pereyra, L. H. (1973). Galen's contribution to surgery. Journal of the History of
Medicine and Allied Sciences, XXVIII(4), 357-375.
Tombal, B., Denmeade, S. R., & Isaacs, J. T. (1999). Assessment and validation of a
microinjection method for kinetic analysis of [Ca2+
]i in individual cells
undergoing apoptosis. Cell Calcium, 25(1), 19-28.
Trachtenberg, D. (2002). Alternative therapies and public health: crisis or opportunity?
American Journal of Public Health, 92(10), 1566-1567.
Tulp, M., & Bohlin, L. (2002). Functional versus chemical diversity: is biodiversity
important for drug discovery? Trends in Pharmacological Sciences, 23(5), 225-
231.
Tulp, M., & Bohlin, L. (2004). Unconventional natural sources for future drug
discovery. Drug Discovery Today, 9(10), 450-458.
Tulp, M. T. M. (1999). The use of receptor binding, a very specific, high capacity
screening method, in the identification of biologically active components from
natural sources. In Bohlin, L. & Bruhn, J. G. (Eds.), Bioassay methods in natural
product research and drug development (Vol. 43, pp. 53-80). Dordrecht: Kluwer
Academic Publishers.
Turker, A. U., & Camper, N. D. (2002). Biological activity of common mullein, a
medicinal plant. Journal of Ethnopharmacology, 82(2-3), 117-125.
Turton, C. L. R. (1997). Ways of knowing about health: an Aboriginal perspective.
Advances in Nursing Science, 19(3), 28-36.
Uchiyama, B., Saijo, Y., Kumano, N., Abe, T., Fujimura, S., Ohkuda, K., et al. (1997).
Expression of nucleolar protein p120 in human lung cancer: difference in
histological types as a marker for proliferation. Clinical Cancer Research, 3(10),
1873-1877.
Ulukaya, E., Colakogullari, M., & Wood, E. J. (2004). Interference by anti-cancer
chemotherapeutic agents in the MTT-tumor chemosensitivity assay.
Chemotherapy, 50(1), 43-50.
Valachis, A., Mauri, D., Polyzos, N. P., Mavroudis, D., Georgoulias, V., & Casazza, G.
(2010). Fulvestrant in the treatment of advanced breast cancer: a systematic
review and meta-analysis of randomized controlled trials. Critical Reviews in
Oncology/Hematology, 73(3), 220-227.
Valeriote, F., & van Putten, L. (1975). Proliferation-dependent cytotoxicity of
anticancer agents: A review. Cancer Research, 35(10), 2619-2630.
Valleley, S. (2006). Finding a cure for cancer: the holy grail of science. Medical News
Today. Retrieved 18th May, from
http://www.medicalnewstoday.com/medicalnews.php?newsid=57239.
van der Woude, H., Alink, G. M., & Rietjens, I. M. (2005). The definition of hormesis
and its implications for in vitro to in vivo extrapolation and risk assessment.
Critical Reviews in Toxicology, 35(6), 603-607.
van Waardenburg, R. C., de Jong, L. A., van Eijndhoven, M. A., Verseyden, C., Pluim,
D., Jansen, L. E., et al. (2004). Platinated DNA adducts enhance poisoning of
DNA topoisomerase I by camptothecin. Journal of Biological Chemistry,
279(52), 54502-54509.

373
Vanewijk, P. H., & Hoekstra, J. A. (1993). Calculation of the EC50 and its confidence
interval when subtoxic stimulus is present. Ecotoxicology and Environmental
Safety, 25(1), 25-32.
Vanhaecke, P., Persoone, G., Claus, C., & Sorgeloos, P. (1981). Proposal for a short-
term toxicity test with Artemia nauplii. Ecotoxicology and Environmental Safety,
5(3), 382-387.
Venter, J. C., Adams, M. D., Myers, E. W., Li, P. W., Mural, R. J., Sutton, G. G., et al.
(2001). The sequence of the human genome. Science, 291(5507), 1304-1351.
Ventura, A., Kirsch, D. G., McLaughlin, M. E., Tuveson, D. A., Grimm, J., Lintault, L.,
et al. (2007). Restoration of p53 function leads to tumour regression in vivo.
Nature, 445(7128), 661-665.
Verdier-Pinard, P., Kepler, J. A., Pettit, G. R., & Hamel, E. (2000). Sustained
intracellular retention of dolastatin 10 causes its potent antimitotic activity.
Molecular Pharmacology, 57(1), 180-187.
Verdine, G. L. (1996). The combinatorial chemistry of nature. Nature, 384(6604
SUPP), 11-13.
Verhoef, C., de Wilt, J. H., & Verheul, H. M. (2006). Angiogenesis inhibitors:
perspectives for medical, surgical and radiation oncology. Current
Pharmaceutical Design, 12(21), 2623-2630.
Verma, I. M. (2002). Biopiracy: distrust widens the rich-poor divide. Molecular
Therapy, 5(2), 95-95.
Vermeulen, K., Van Bockstaele, D. R., & Berneman, Z. N. (2003). The cell cycle: a
review of regulation, deregulation and therapeutic targets in cancer. Cell
Proliferation, 36(3), 131-149.
Vermeulen, K., Van Bockstaele, D. R., & Berneman, Z. N. (2005). Apoptosis:
mechanisms and relevance in cancer. Annals of Hematology, 84(10), 627-639.
Verpoorte, R. (1998). Exploration of nature's chemodiversity: the role of secondary
metabolites as leads in drug development. Drug Discovery Today, 3(5), 232-
238.
Verpoorte, R. (2000). Pharmacognosy in the new millennium: leadfinding and
biotechnology. Journal of Pharmacy and Pharmacology, 52(3), 253-262.
Verpoorte, R. (2005). Editorial. Journal of Ethnopharmacology, 100(1-2), 1-2.
Verpoorte, R., Kim, H. K., & Choi, Y. H. (2006). Plants as sources of medicines. New
perspectives In Bogers, R. J., Craker, L. E. & Lange, D. (Eds.), Medicinal and
aromatic plants: agricultural, commercial, ecological, legal, pharmacological
and social aspects (pp. 261-273). Dordrecht: Springer.
Ververidis, F., Trantas, E., Douglas, C., Vollmer, G., Kretzschmar, G., & Panopoulos,
N. (2007). Biotechnology of flavonoids and other phenylpropanoid-derived
natural products. Part I: Chemical diversity, impacts on plant biology and human
health. Biotechnology Journal, 2(10), 1214-1234.
Vesey, D. A., Cunningham, J. M., Selden, A. C., Woodman, A. C., & Hodgson, H. J.
(1991). Dimethyl sulphoxide induces a reduced growth rate, altered cell
morphology and increased epidermal-growth-factor binding in Hep G2 cells.
Biochemical Journal, 277(3), 773-777.
Viebahn, C. S., Tirnitz-Parker, J. E. E., Olynyk, J. K., & Yeoh, G. C. T. (2006).
Evaluation of the "Cellscreen" system for proliferation studies on liver
progenitor cells. European Journal of Cell Biology, 85(12), 1265-1274.
Vieth, M., Siegel, M. G., Higgs, R. E., Watson, I. A., Robertson, D. H., Savin, K. A., et
al. (2004). Characteristic physical properties and structural fragments of
marketed oral drugs. Journal of Medicinal Chemistry, 47(1), 224-232.

374
Vine, K. L., Locke, J. M., Ranson, M., Pyne, S. G., & Bremner, J. B. (2007). An
investigation into the cytotoxicity and mode of action of some novel N-alkyl-
substituted isatins. Journal of Medicinal Chemistry, 50(21), 5109-5117.
Visanji, J. M., Duthie, S. J., Pirie, L., Thompson, D. G., & Padfield, P. J. (2004).
Dietary isothiocyanates inhibit Caco-2 cell proliferation and induce G2/M phase
cell cycle arrest, DNA damage, and G2/M checkpoint activation. Journal of
Nutrition, 134(11), 3121-3126.
Voinescu, G. C., Shoemaker, M., Moore, H. M., Khanna, R., & Nolph, K. D. (2002).
The relationship between urine osmolality and specific gravity. The American
Journal of the Medical Sciences, 323(1), 39-42.
Vokes, E., Herbst, R., & Sandler, A. (2006). Angiogenesis inhibition in the treatment of
lung cancer. Clinical Advances in Hematology and Oncology, 4(11 Suppl 23), 1-
12.
Vokes, E. E., & Chu, E. (2006). Anti-EGFR therapies: clinical experience in colorectal,
lung, and head and neck cancers. Oncology, 20(5 Suppl 2), 15-25.
Volpi, E. V., Chevret, E., Jones, T., Vatcheva, R., Williamson, J., Beck, S., et al.
(2000). Large-scale chromatin organization of the major histocompatibility
complex and other regions of human chromosome 6 and its response to
interferon in interphase nuclei. Journal of Cell Science, 113(9), 1565-1576.
von Wangenheim, K. H., & Peterson, H. P. (1998). Control of cell proliferation by
progress in differentiation: clues to mechanisms of aging, cancer causation and
therapy. Journal of Theoretical Biology, 193(4), 663-678.
Wagner, H., & Ulrich-Merzenich, G. (2009). Synergy research: approaching a new
generation of phytopharmaceuticals. Phytomedicine, 16(2-3), 97-110.
Wallace, D. J. (1996). The history of antimalarials. Lupus, 5(1_suppl), S2-3.
Walsh, C. T., Schwartz-Bloom, R. D., & Levine, R. R. (2005). General principles of the
quantitative aspects of drug action. 1. Dose-response relationships. In Levine's
Pharmacology: Drug Actions and Reactions (6 ed., pp. 185-220). Boca Raton:
Taylor and Francis.
Walsh, V., & Goodman, J. (2002). From Taxol to Taxol®
: The changing identities and
ownership of an anti-cancer drug. Medical Anthropology, 21(3/4), 307-336.
Walters, W. P., & Namchuk, M. (2003). Designing screens: how to make your hits a hit.
Nature Reviews Drug Discovery, 2(4), 259-266.
Wang, L., Li, Q., Duan, X.-L., & Chang, Y.-Z. (2005). Effects of extracellular iron
concentration on calcium absorption and relationship between Ca2+
and cell
apoptosis in Caco-2 cells. World Journal of Gastroenterology, 11(19), 2916-
2921.
Wang, P., Henning, S. M., & Heber, D. (2010). Limitations of MTT and MTS-based
assays for measurement of antiproliferative activity of green tea polyphenols.
Public Library of Science One, 5(4), e10202.
Wang, W. L., Porter, W., Burghardt, R., & Safe, S. H. (1997). Mechanism of inhibition
of MDA-MB-468 breast cancer cell growth by 2,3,7,8-tetrachlorodibenzo-p-
dioxin. Carcinogenesis, 18(5), 925-933.
Wang, X., Ge, J., Wang, K., Qian, J., & Zou, Y. (2006). Evaluation of MTT assay for
measurement of emodin-induced cytotoxicity. Assay and Drug Development
Technologies, 4(2), 203-207.
Wang, X., Wu, Y. C., Fadok, V. A., Lee, M. C., Gengyo-Ando, K., Cheng, L. C., et al.
(2003). Cell corpse engulfment mediated by C. elegans phosphatidylserine
receptor through CED-5 and CED-12. Science, 302(5650), 1563-1566.
Wani, M. C., Taylor, H. L., Wall, M. E., Coggon, P., & McPhail, A. T. (1971). Plant
antitumor agents. VI. Isolation and structure of taxol, a novel antileukemic and

375
antitumor agent from Taxus brevifolia. Journal of the American Chemical
Society, 93(9), 2325-2327.
Wasilenko, W. J., Cooper, J., Palad, A. J., Somers, K. D., Blackmore, P. F., Rhim, J. S.,
et al. (1997). Calcium signaling in prostate cancer cells: evidence for multiple
receptors and enhanced sensitivity to bombesin/GRP. The Prostate, 30(3), 167-
173.
Watanabe, N., Okochi, E., Mochizuki, M., Sugimura, T., & Ushijima, T. (2001). The
presence of single nucleotide instability in human breast cancer cell lines.
Cancer Research, 61(21), 7739-7742.
Weedon, D., & Chick, J. (1976). Home treatment of basal cell carcinoma. Medical
Journal of Australia, 24(1), 928.
Weiqun, W., Laura, H., Chilly, S. C., Jill, C. P., Kenneth, J. K., & Diane, F. B. (2000).
Cell-cycle arrest at G2/M and growth inhibition by apigenin in human colon
carcinoma cell lines. Molecular Carcinogenesis, 28(2), 102-110.
Wenzel, U., Herzog, A., Kuntz, S., & Hannelore, D. (2004). Protein expression
profiling identifies molecular targets of quercetin as a major dietary flavonoid in
human colon cancer cells. PROTEOMICS, 4(7), 2160-2174.
Wermuth, C. G. (2008). Strategies in the search for new lead compounds or original
working hypotheses. In Wermuth, C. G. (Ed.), The practice of medicinal
chemistry (pp. 125-143). Burlington: Academic Press.
Wermuth, C. G., Ganellin, C. R., Lindberg, P., & Mitscher, L. A. (1998). Glossary of
terms used in medicinal chemistry (IUPAC Recommendations 1998). Pure and
Applied Chemistry, 70(5), 1129-1143.
Weyermann, J., Lochmann, D., & Zimmer, A. (2005). A practical note on the use of
cytotoxicity assays. International Journal of Pharmaceutics, 288(2), 369-376.
Williamson, E. M. (2001). Synergy and other interactions in phytomedicines.
Phytomedicine, 8(5), 401-409.
Wilson, E. O. (1992). The biodiversity of life. Cambridge: Belknap Press of Harvard
University Press.
Wilson, E. O. (2002). The future of life. New York.
Wink, M. (1999). Introduction: Biochemistry, role and biotechnology of secondary
metabolites. In Wink, M. (Ed.), Functions of Plant Secondary Metabolites and
Their Exploitation in Biotechnology (Vol. 3, pp. 1-16). Sheffield: Sheffield
Academic Press.
Wink, M., & Witte, L. (1984). Turnover and transport of quinolizidine alkaloids.
Diurnal fluctuations of lupanine in the phloem sap, leaves and fruits of Lupinus
Mbus L. Planta, 161, 519-524.
Wittstock, U., & Gershenzon, J. (2002). Constitutive plant toxins and their role in
defense against herbivores and pathogens. Current Opinion in Plant Biology,
5(4), 300-307.
Wolter, F., & Stein, J. (2002). Resveratrol enhances the differentiation induced by
butyrate in Caco-2 colon cancer cells. Journal of Nutrition, 132(7), 2082-2086.
Woodall, G. S., Moule, M. L., Eckersley, P., Boxshall, B., & Puglisi, B. (2010). New
root vegetables for the native food industry: Promising selections from south
Western Australia's tuberous flora. In Rural Industries Research and
Development Corporation (Ed.). Canberra: Australian Government.
Wu, B., Zhang, Q., Shen, W., & Zhu, J. (2008a). Anti-proliferative and
chemosensitizing effects of luteolin on human gastric cancer AGS cell line.
Molecular and Cellular Biochemistry, 313(1-2), 125-132.
Wu, B., Zhu, J.-S., Zhang, Y., Shen, W.-M., & Zhang, Q. (2008b). Predictive value of
MTT assay as an in vitro chemosensitivity testing for gastric cancer: One
institution's experience. World Journal of Gastroenterology, 14 (19), 3064-3068.

376
Xavier, C. P., Lima, C. F., Preto, A., Seruca, R., Fernandes-Ferreira, M., & Pereira-
Wilson, C. (2009). Luteolin, quercetin and ursolic acid are potent inhibitors of
proliferation and inducers of apoptosis in both KRAS and BRAF mutated human
colorectal cancer cells. Cancer Letters, 281(2), 162-170.
Xenome. (2009). Retrieved 12th
June, 2010, from
http://www.ausbiotech.org/directory/details.asp?companyid=%7B3E0DA65A-
6870-4C18-94A3-
09C61F823137%7D&returntourl=%2Fdirectory%2Fsearch.asp%3Fpg%3D46.
Xiao, D., & Singh, S. V. (2002). Phenethyl isothiocyanate-induced apoptosis in p53-
deficient PC-3 human prostate cancer cell line is mediated by extracellular
signal-regulated kinases. Cancer Research, 62(13), 3615-3619.
Xu, X., Persson, H. L., & Richardson, D. R. (2005). Molecular pharmacology of the
interaction of anthracyclines with iron. Molecular Pharmacology, 68(2), 261-
271.
Yamamoto, A., Tagawa, Y., Yoshimori, T., Moriyama, Y., Masaki, R., & Tashiro, Y.
(1998). Bafilomycin A1 prevents maturation of autophagic vacuoles by
inhibiting fusion between autophagosomes and lysosomes in rat hepatoma cell
line, H-4-II-E cells. Cell Structure and Function, 23(1), 33-42.
Yang, C.-P. H., Verdier-Pinard, P., Wang, F., Lippaine-Horvath, E., He, L., Li, D., et al.
(2005). A highly epothilone B-resistant A549 cell line with mutations in tubulin
that confer drug dependence. Molecular Cancer Therapeutics, 4(6), 987-995.
Yang, T., Cui, F.-D., Choi, M.-K., Cho, J.-W., Chung, S.-J., Shim, C.-K., et al. (2007).
Enhanced solubility and stability of PEGylated liposomal paclitaxel: in vitro and
in vivo evaluation. International Journal of Pharmaceutics, 338(1-2), 317-326.
Yano, S., Matsumori, Y., Ikuta, K., Ogino, H., Doljinsuren, T., & Sone, S. (2006).
Current status and perspective of angiogenesis and antivascular therapeutic
strategy: non-small cell lung cancer. International Journal of Clinical Oncology,
11(2), 73-81.
Yao, J., Li, Q., Chen, J., & Muallem, S. (2004). Subpopulation of store-operated Ca2+
channels regulate Ca2+
-induced Ca2+
release in non-excitable cells. Journal of
Biological Chemistry, 279(20), 21511-21519.
Yasumoto, H., Akio Matsubara, A., Mutaguchi, K., Tsuguru Usui, T., & McKeehan, W.
L. (2004). Restoration of fibroblast growth factor receptor2 suppresses growth
and tumorigenicity of malignant human prostate carcinoma PC-3 cells. The
Prostate, 61(3), 236-242.
Ye, F., Xui, L., Yi, J., Zhang, W., & Zhang, D. Y. (2002). Anticancer activity of
Scutellaria baicalensis and its potential mechanism. Journal of Alternative and
Complementary Medicine, 8(5), 567-572.
Yeung, T. K., Germond, C., Chen, X., & Wang, Z. (1999). The mode of action of taxol:
apoptosis at low concentration and necrosis at high concentration. Biochemical
and Biophysical Research Communications, 263(2), 398-404.
Yin, F., Giuliano, A. E., Law, R. E., & Van Herle, A. J. (2001). Apigenin inhibits
growth and induces G2/M arrest by modulating cyclin-CDK regulators and ERK
MAP kinase activation in breast carcinoma cells. Anticancer Research, 21(1A),
413-420.
Yin, X., Zhou, J., Jie, C., Xing, D., & Zhang, Y. (2004). Anticancer activity and
mechanism of Scutellaria barbata extract on human lung cancer cell line A549.
Life Sciences, 75(18), 2233-2244.
Yoo, D. R., Jang, Y. H., Jeon, Y. K., Kim, J. Y., Jeon, W., Choi, Y. J., et al. (2009).
Proteomic identification of anti-cancer proteins in luteolin-treated human
hepatoma Huh-7 cells. Cancer Letters, 282(1), 48-54.

377
Yoshida, M., Sakai, T., Hosokawa, N., Marui, N., Matsumoto, K., Fujioka, A., et al.
(1990). The effect of quercetin on cell cycle progression and growth of human
gastric cancer cells. FEBS Letters, 260(1), 10-13.
Yuan, L. M. (2005). Flavonoids: separation by countercurrent chromatography. In
Cazes, J. (Ed.), Encyclopedia of chromatography (2nd
ed., pp. 637-640). Boca
Raton: Taylor and Francis.
Zactima-Tyrosine kinase inhibitor for treatment of lung cancer (2010). Retrieved 26th
May, 2010, from http://www.drugdevelopment-
technology.com/projects/zactima/.
Zamai, L., Falcieri, E., Zauli, G., Cataldi, A., & Vitale, M. (1993). Optimal detection of
apoptosis by flow cytometry depends on cell morphology. Cytometry, 14(8),
891-897.
Zartler, E. R., & Shapiro, M. J. (2005). Fragonomics: fragment-based drug discovery.
Current Opinion in Chemical Biology, 9(4), 366-370.
Zarubin, T., Jing, Q., New, L., & Han, J. (2005). Identification of eight genes that are
potentially involved in tamoxifen sensitivity in breast cancer cells. Cell
Research, 15(6), 439-446.
Zhang, D. Y., Wu, J., Ye, F., Xue, L., Jiang, S., Yi, J., et al. (2003). Inhibition of cancer
cell proliferation and prostaglandin E2 synthesis by Scutellaria baicalensis.
Cancer Research, 63, 4037-4043.
Zhang, W., Gordon, M., & Lenz, H. J. (2006). Novel approaches to treatment of
advanced colorectal cancer with anti-EGFR monoclonal antibodies. Annals of
Medicine, 38(8), 545-551.
Zhang, W. G., Zhao, R., Ren, J., Ren, L. X., Lin, J. G., Liu, D. L., et al. (2007).
Synthesis and anti-proliferative in-vitro activity of two natural dihydrostilbenes
and their analogues. Archiv der Pharmazie, 340(5), 244-250.
Zheng, A., Kallio, A., & Harkonen, P. (2007). Tamoxifen-induced rapid death of MCF-
7 breast cancer cells is mediated via extracellularly signal-regulated kinase
signaling and can be abrogated by estrogen. Endocrinology, 148(6), 2764-2777.
Zhong, H., & Bowen, J. P. (2006). Antiangiogenesis drug design: multiple pathways
targeting tumor vasculature. Current Medicinal Chemistry, 13(8), 849-862.
Zhu, M., David Phillipson, J., Greengrass, P. M., Bowery, N. E., & Cai, Y. (1997).
Plant polyphenols: biologically active compounds or non-selective binders to
protein? Phytochemistry, 44(3), 441-447.
Zhu, W., Shan, X., Wang, T., Shu, Y., & Liu, P. (2010). miR-181b modulates multidrug
resistance by targeting BCL2 in human cancer cell lines. International Journal
of Cancer Retrieved June 6th
, 2010 from
http://www.ncbi.nlm.nih.gov/entrez/query.fcgi?cmd=Retrieve&db=PubMed&do
pt=Citation&list_uids=20162574
Zur, S. S. (2007). Letting go of data in Aboriginal Australia: Ethnography on ―rubber
time‖. The Qualitative Report, 12(4), 583-593.
Zwick, E., Wallasch, C., & Ullrich, A. (2000). HER2/neu: a target for breast cancer
therapy. Breast Disease, 11, 7-18.

378

Ai
APPENDICES
TABLE OF CONTENTS
List of Figures (Appendices) ............................................................................... Aii
List of Tables (Appendices) ................................................................................ Aiii
List of Abbreviations (Appendices) .................................................................... Aiii
Appendix A. Basic Cell Biology ................................................................. A1
A1 The cell cycle ................................................................................................... A1
A2 Cell cycle control ............................................................................................. A5
A3 Apoptosis ....................................................................................................... A12
A4 Ubiquitin-mediated protein ............................................................................ A15
A5 Replicative senescence ................................................................................... A16
A6 What goes wrong in cancer? .......................................................................... A17
Appendix B. Chemotherapeutic Strategies to Combat Cancers .................. A21
B1 Cytotoxic drugs .............................................................................................. A21
B2 Targeted therapies .......................................................................................... A28
Appendix C. MTT-formazan Solubilisation .............................................. A45
Appendix D. Spectra of Selected Plant Extract Solutions ........................... A48
Appendix E. Data for Typical Dose-Response Curves ............................... A53
Appendix F. Nonlinear Regressions of Figure 4.8. ..................................... A57
Appendix G. HPLC-UV Data .................................................................. A62
Appendix H. GC-MS Report ................................................................... A74
Appendix I. Nonlinear regression of Figure 5.3 ........................................ A79
Appendix J. Ca2+
Signalling .................................................................... A84
Appendix K. Flavonoids .......................................................................... A87
Appendix L. Extraction of Sponges .......................................................... A89
Appendix M. Isolation of Paclitaxel .......................................................... A92
Appendix N. Hormesis ............................................................................ A94
Appendix O. Other General Cytotoxicity Assays ..................................... A102
Appendix P. Determination of Compound Interactions ........................... A105

Aii
List of Figures Figure A1.1 The cell cycle A1
Figure A1.2 The phases of the cell cycle A2
Figure A1.3 The events of eukaryotic cell division as seen under a microscope A5
Figure A2.1 The core of the cell-cycle control system A6
Figure A2.2 Some of the many molecules involved in cell cycle control A11
Figure A2.3 An overview of the cell cycle control system A12
Figure A3.1 The proteolytic caspase cascade in initiation and execution of apoptosis A15
Figure B1 Cell cycle specificity of cytotoxic anticancer drugs A25
Figure C1 Effect of different MTT extraction buffers on absorbance. A46
Figure D1 Spectral scan of DDW A48
Figure D2 Spectral scan of DMEM A49
Figure D3 Spectral scan of 1% DMSO A49
Figure D4 Spectral scan of Extract 5 A50
Figure D5 Spectral scan of Extract 6 A50
Figure D6 Spectral scan of Extract 8 A51
Figure D7 Spectral scan of Extract 21 A51
Figure D8 Spectral scan of Extract 27 A52
Figure D9 Spectral scan of Extract 28 A52
Figure E1 Nonlinear regressions of promising Batch 1 extracts A54
Figure E2 Nonlinear regressions of promising Batch 2 extracts A55
Figure E3 Nonlinear regressions of promising Batch 3 extracts A56
Figure F1 Nonlinear regressions of 6 most active extracts using the 4P model A58
Figure F2 Nonlinear regressions of 6 most active extracts using the TB model A59
Figure F3 Nonlinear regressions of 6 most active extracts using the B model A60
Figure F4 Nonlinear regressions of 6 most active extracts using the T model A61
Figure G1 Representative HPLC-UV chromatogram report A63
Figure G2 HPLC-UV chromatograms for methanol samples (254nm) A65
Figure G3 HPLC-UV chromatograms for methanol samples (350nm) A67
Figure G4 HPLC-UV chromatograms for ethyl acetate samples (254nm) A69
Figure G5 HPLC-UV chromatograms for ethyl acetate samples (350nm) A71
Figure I1 Nonlinear regression of the 8 most active extracts using the 4P model A80
Figure I2 Nonlinear regression of the 8 most active extracts using the TB model A81
Figure I3 Nonlinear regression of the 8 most active extracts using the B model A82
Figure I4 Nonlinear regression of the 8 most active extracts using the T model A83
Figure K1 Chemical structures of the six most common flavonoid subclasses A87
Figure K2 Chemical structures of luteolin, quercetin and rutin A88
Figure L1 Flow diagram of separation method A91
Figure N1 Hormetic dose-response relationships A95
Figure P1 Isobols for zero-interaction, synergism and antagonism A106
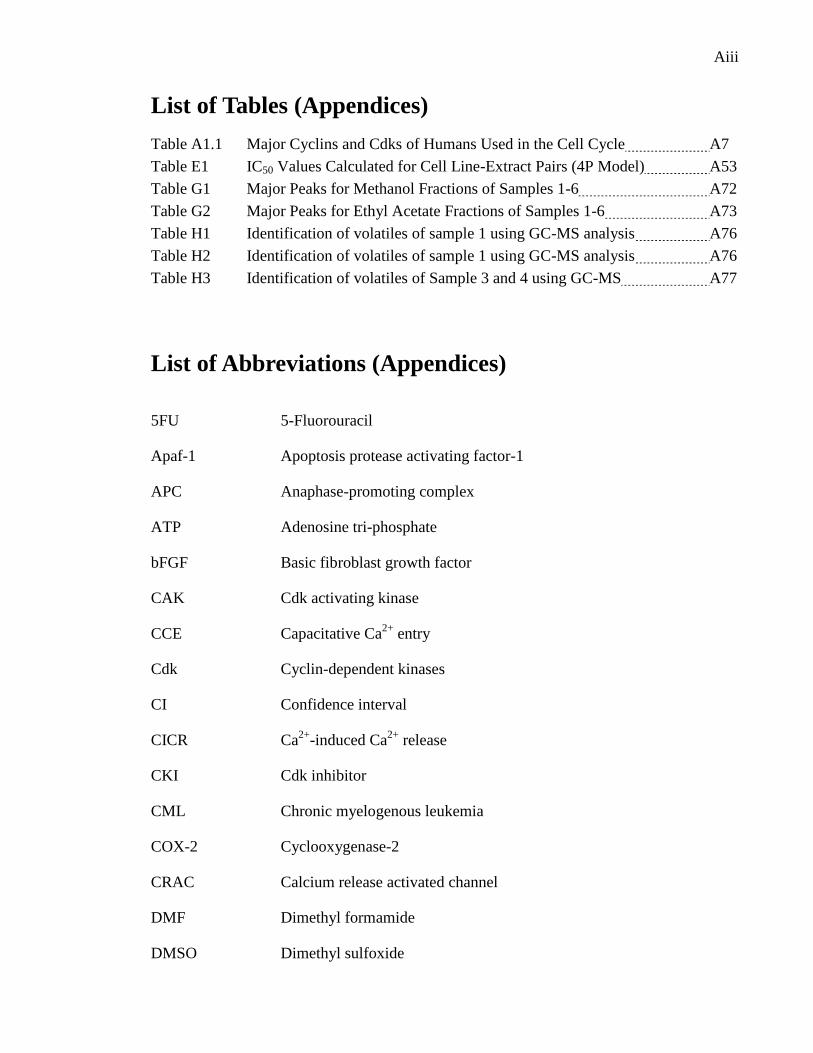
Aiii
List of Tables (Appendices)
Table A1.1 Major Cyclins and Cdks of Humans Used in the Cell Cycle A7
Table E1 IC50 Values Calculated for Cell Line-Extract Pairs (4P Model) A53
Table G1 Major Peaks for Methanol Fractions of Samples 1-6 A72
Table G2 Major Peaks for Ethyl Acetate Fractions of Samples 1-6 A73
Table H1 Identification of volatiles of sample 1 using GC-MS analysis A76
Table H2 Identification of volatiles of sample 1 using GC-MS analysis A76
Table H3 Identification of volatiles of Sample 3 and 4 using GC-MS A77
List of Abbreviations (Appendices)
5FU 5-Fluorouracil
Apaf-1 Apoptosis protease activating factor-1
APC Anaphase-promoting complex
ATP Adenosine tri-phosphate
bFGF Basic fibroblast growth factor
CAK Cdk activating kinase
CCE Capacitative Ca2+
entry
Cdk Cyclin-dependent kinases
CI Confidence interval
CICR Ca2+
-induced Ca2+
release
CKI Cdk inhibitor
CML Chronic myelogenous leukemia
COX-2 Cyclooxygenase-2
CRAC Calcium release activated channel
DMF Dimethyl formamide
DMSO Dimethyl sulfoxide

Aiv
DNA Deoxyribose nucleic acid
EGF Epidermal growth factor
ER Endoplasmic reticulum
FDA Food and Drug Administration
FGF Fibroblast growth factor
GC-MS Gas Chromatography-Mass Spectrometry
HPLC High Performance Liquid Chromatography
HPMA N-(2-Hydroxypropyl) methacrylamide
hTR Human telomerase RNA
IAP Inhibitor of apoptosis
IGF Insulin-like growth factor
InsP3 Inositol 1,4,5-tri-phosphate
mAb Monoclonal antibody
MCU Mitochondrial calcium uniporter
MDR Multidrug resistance
MTT 3-(4,5-Dimethylthiazol-2-yl)-2,5-diphenyl tetrazolium bromide
NCI National Cancer Institute
NCX Sodium calcium exchanger
NF-B Nuclear factor kappa light-chain-enhancer of activated B cells
PAF Platelet-activating factor
PCNA Proliferating cell nuclear antigen
PDGF Platelet-derived growth factor
PFT Pifithrin-
PMCA Plasma membrane Ca2+
-ATPase
PNA Purine nucleoside analogue
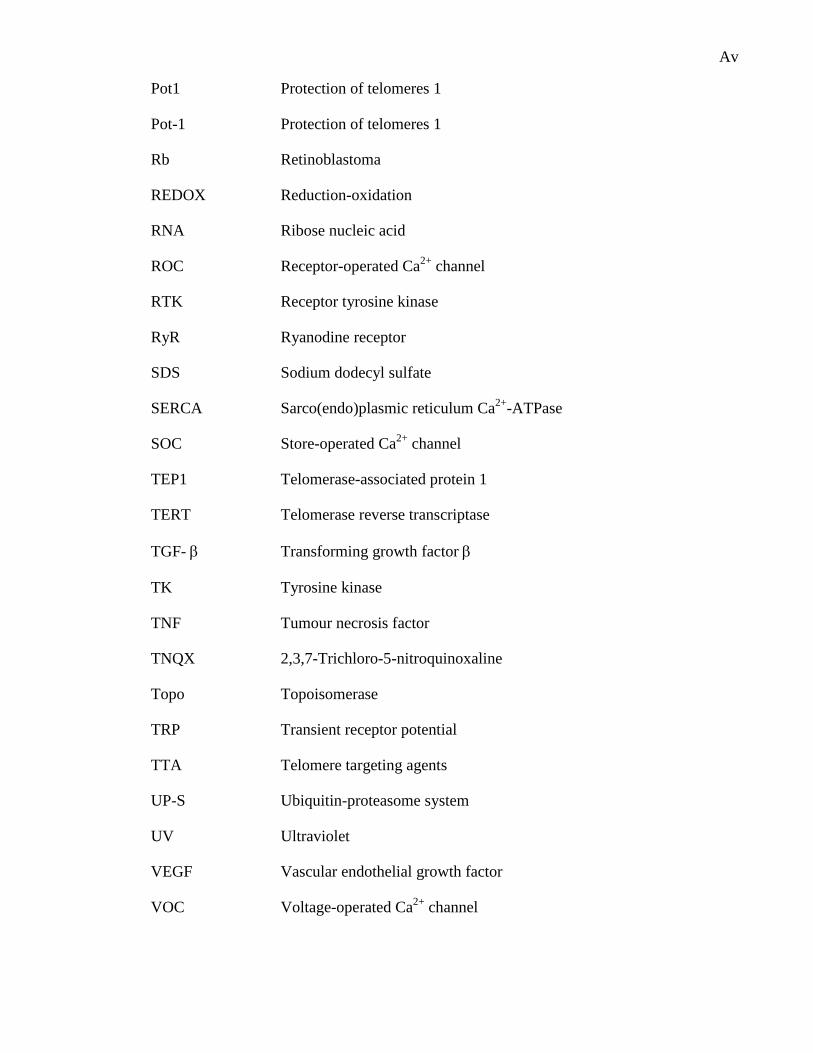
Av
Pot1 Protection of telomeres 1
Pot-1 Protection of telomeres 1
Rb Retinoblastoma
REDOX Reduction-oxidation
RNA Ribose nucleic acid
ROC Receptor-operated Ca2+
channel
RTK Receptor tyrosine kinase
RyR Ryanodine receptor
SDS Sodium dodecyl sulfate
SERCA Sarco(endo)plasmic reticulum Ca2+
-ATPase
SOC Store-operated Ca2+
channel
TEP1 Telomerase-associated protein 1
TERT Telomerase reverse transcriptase
TGF- Transforming growth factor
TK Tyrosine kinase
TNF Tumour necrosis factor
TNQX 2,3,7-Trichloro-5-nitroquinoxaline
Topo Topoisomerase
TRP Transient receptor potential
TTA Telomere targeting agents
UP-S Ubiquitin-proteasome system
UV Ultraviolet
VEGF Vascular endothelial growth factor
VOC Voltage-operated Ca2+
channel


~ Appendix A ~ A1
Appendix A. Basic Cell Biology
A1 The cell cycle
Under normal circumstances, a cell reproduces by duplicating its genome and cytoplasm and
dividing into two daughter cells in a tightly regulated and orderly sequence of events known as
the cell cycle (Alberts et al., 2004). While the details of the cell cycle vary for different
organisms, and even for different cells and at different times in an individual organism‘s life,
certain characteristics are universal. The fundamental task of a cell is to pass on its genetic
information to the next generation. This means the DNA in each chromosome must be
faithfully replicated to produce two complete copies and the duplicated chromosomes must
then be segregated to the two daughter cells so that they both receive an identical copy of the
entire genome (Fig. A1.1).
Figure A1.1 The cell cycle.
Note. From Molecular biology of the cell p.984, by B. Alberts, et al., 2002, New York:
Garland Science.

A2 ~ Appendix A ~
The cell cycle of a eukaryotic cell is traditionally divided into four phases: G1, S, G2 and M
(Fig A1.2). During G1 (Gap 1), the cell prepares for DNA replication, which occurs during S
(synthesis) phase. This is followed by another gap phase (G2), in which the cell checks the
accuracy of DNA replication and prepares for mitosis. After G2, chromosome segregation and
cytokinesis (cytoplasmic division) occur in M (mitosis) phase (Johnson and Walker, 1999; Park
and Lee, 2003; Maddika et al., 2007).
Figure A1.2 The phases of the cell cycle.
Note. From Molecular biology of the cell p.985, by B. Alberts, et al., 2002, New York: Garland
Science.
A1.1 G1 phase
In G1 (Gap 1) phase, the entire mass of proteins and organelles of the cell doubles. This is
important so that each generation of cells does not become progressively smaller with each
division. However, besides serving as a simple time delay to allow cell growth, G1 phase also
provides time for the cell to monitor both the intracellular and extracellular environments to
ensure conditions are suitable and preparations complete before the cell commits to the risks
associated with S phase. The length of G1 can vary greatly depending on extracellular
~ Appendix A ~ A3
conditions. Unfavourable conditions result in extracellular signals being released from other
cells that delay the cell‘s progress through G1. It may enter a specialised resting state, known as
G0 (G zero), and remain there for days or weeks before resuming proliferation. Indeed, in vivo,
most non-growing, non-proliferating mammalian cells are quiescent (in G0) at any one time
(Ford & Pardee, 1999; Vermeulen et al., 2003), and some cells, such as nerve and muscle cells,
even remain arrested in G0 for their entire lives. On the other hand, if extracellular conditions
are favourable, signals are released which tell the cell in early G1 or G0 to progress through a
commitment point known as the restriction (R) point in mammalian cells. If growth factors or
nutrients are insufficient, a cell cannot pass beyond this R point. However, after the R point,
the cell is committed to DNA replication, even if the extracellular signals stimulating growth
and division are no longer present (Alberts et al., 2002; Ford & Pardee, 1999; Vermeulen et al.,
2003; Park & Lee, 2003).
A1.2 S phase
DNA is synthesised during S phase, which accounts for approximately half of the cell cycle
time in a typical mammalian cell. At the beginning of this phase, each chromosome is
composed of one coiled double helix molecule, known as a chromatid. By the end of S phase,
there are two identical ―sister‖ chromatids. The centrosome is also duplicated during S phase.
Centrosomes are large, complex organelles containing two cylindrical centrioles, each
composed of microtubules. Centrosomes are responsible for nucleating microtubules that form
the mitotic spindle and thus control the equal division of chromosomes. Unlike DNA synthesis,
no cell cycle checkpoints exist for centrosome duplication (Sankaran & Parvin, 2006).
A4 ~ Appendix A ~
A1.3 G2 phase
The second gap phase, G2, provides an opportunity for the cell to monitor extracellular
conditions before committing to the radical changes of M phase. During G2, the centrosomes
also elongate and mature, dramatically increasing in size (Sankaran & Parvin, 2006). Together,
G1, S and G2 phase are called interphase and collectively account for approximately 23 hours of
a 24 hour cycle in a typical human cell proliferating in culture (Alberts et al., 2002; Collins et
al., 1997; Sandal, 2002).
A1.4 M phase
M phase involves a series of prominent events, beginning with mitosis, which is simply nuclear
division, and ending in cytokinesis, or cell division. M phase is the shortest phase of the cell
cycle, typically lasting less than an hour in a mammalian cell. During mitosis, duplicated DNA
strands are packaged into elongated chromosomes and condensed into much more compact
chromosomes necessary for segregation. Next, the microtubule network is disassembled and
rearranged into mitotic spindles and the cytoskeleton is reorganised (Ford & Pardee, 1999).
This is followed by the nuclear envelope breaking down and the replicated chromosomes, each
consisting of a pair of sister chromatids, becoming attached to the microtubules of the mitotic
spindle. The cell then pauses briefly in a state known as metaphase, in which the chromosomes
align at the equator of the mitotic spindle, ready for segregation. In anaphase, the sister
chromatids suddenly separate and move to opposite poles of the mitotic spindle, where they
decondense to reform intact nuclei. The cell is then pinched in two by cytokinesis and cell
division is complete. These processes are summarized in Figure A1.3.

~ Appendix A ~ A5
Figure A1.3 The events of eukaryotic cell division as seen under a microscope.
Note. From Molecular biology of the cell p.985, by B. Alberts, et al., 2002, New York: Garland
Science.
A2 Cell cycle control
While some features of the cell cycle vary from organism to organism and even cell type to cell
type, the basic organization of the cell cycle and its control system are consistent for all
eukaryotic cells. In most cells there are several points in the cell cycle, known as checkpoints,
at which the cycle can be halted if previous events are not completed. For example, entry into
mitosis is prevented if DNA replication is not complete and chromosome segregation is
delayed if some chromosomes are not properly attached to the mitotic spindle (Alberts et al.,
2002).
According to Sandal (2002), there are two main classes of regulatory mechanisms driving the
cell cycle: a) the intrinsic mechanisms occurring every cycle, and b) the extrinsic mechanism,
acting only when defects are detected.
A2.1 Cyclin dependent kinases (Cdks)
The basis of the cell cycle control system is a family of protein serine/threonine protein kinases
known as cyclin-dependent kinases (Cdks) (Vermeulen et al., 2003; Maddika et al., 2007). The
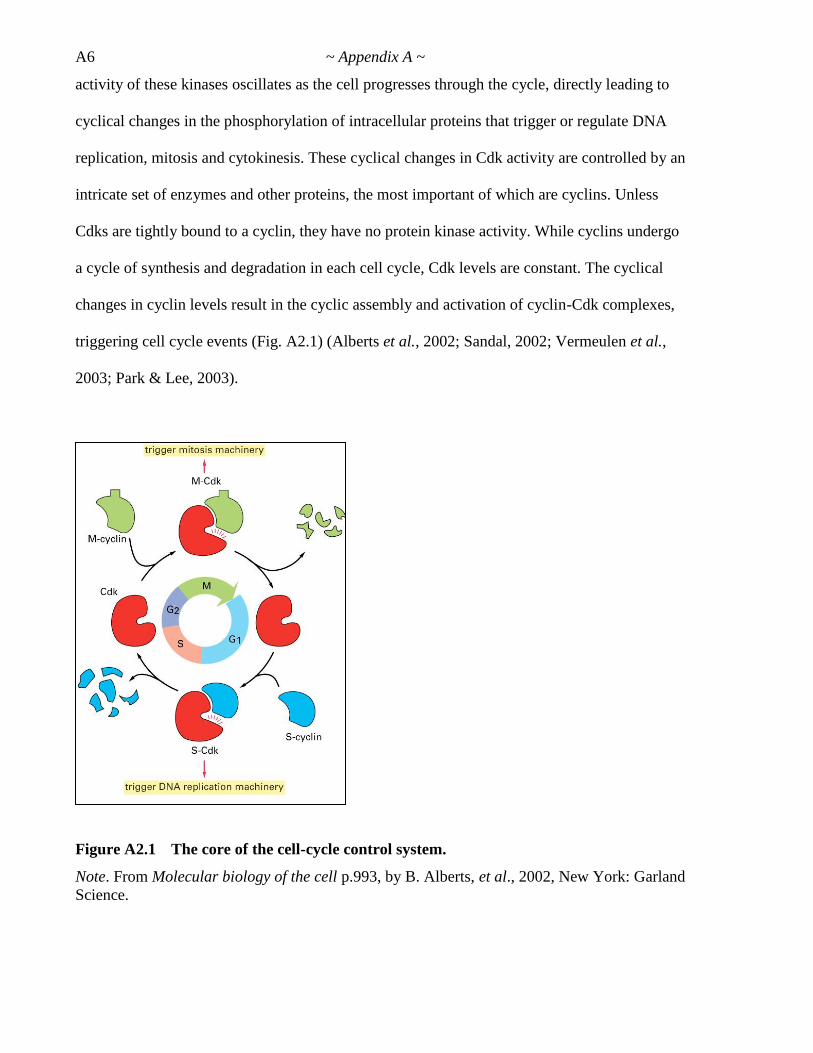
A6 ~ Appendix A ~
activity of these kinases oscillates as the cell progresses through the cycle, directly leading to
cyclical changes in the phosphorylation of intracellular proteins that trigger or regulate DNA
replication, mitosis and cytokinesis. These cyclical changes in Cdk activity are controlled by an
intricate set of enzymes and other proteins, the most important of which are cyclins. Unless
Cdks are tightly bound to a cyclin, they have no protein kinase activity. While cyclins undergo
a cycle of synthesis and degradation in each cell cycle, Cdk levels are constant. The cyclical
changes in cyclin levels result in the cyclic assembly and activation of cyclin-Cdk complexes,
triggering cell cycle events (Fig. A2.1) (Alberts et al., 2002; Sandal, 2002; Vermeulen et al.,
2003; Park & Lee, 2003).
Figure A2.1 The core of the cell-cycle control system.
Note. From Molecular biology of the cell p.993, by B. Alberts, et al., 2002, New York: Garland
Science.

~ Appendix A ~ A7
Although sixteen cyclins have been identified, not all of them are implicated in the cell cycle
(Vermeulen et al., 2003; Johnson & Walker, 1999). There are four classes of cyclins, named
according to the stage of the cell cycle at which they bind Cdks and function:
1. G1/S-cyclins, which bind Cdks at the end of G1 and commit the cell to
replication;
2. S-cyclins, which bind Cdks during S phase and initiate DNA replication;
3. M-cyclins, which promote mitosis; and
4. G1-cyclins, which assist the cell to pass through the R point.
At least nine different Cdks are known, but only five are known to be involved in cell cycle
progression (Johnson and Walker, 1999; Sandal, 2002; Vermeulen et al., 2003). Two Cdks
interact with G1-cyclins, one with G1/S- and S-cyclins, and one with M-cyclins. Cdk7
combines with cyclin H to form Cdk activating kinase (CAK) (Vermeulen et al., 2003). The
names of the individual cyclins and their Cdk partners involved in cell cycle regulation are
given in Table A1.1. Other Cdk/cyclin complexes are involved in regulation of transcription,
DNA repair, differentiation and apoptosis (Johnson & Walker, 1999).
Table A1.1 Major Cyclins and Cdks of Humans Used in the Cell Cycle (adapted from Alberts et al., 2002, p994; Sandal, 2002; Vermeulen et al., 2003).
Cell cycle
phase activity
Cyclin-Cdk
Complex Cyclin Cdk Partner
G1 G1-Cdk cyclin D1, D2, D3 Cdk4 and Cdk6
G1/S G1/S-Cdk cyclin E Cdk2
S S-Cdk cyclin A1, A2 Cdk2
M M-Cdk cyclin B1, B2 Cdk1
All All-Cdk cyclin H Cdk7

A8 ~ Appendix A ~
The activities of cyclin-Cdk complexes are tightly regulated by several mechanisms.
Phosphorylation of the Cdk subunit by a protein kinase (e.g. Wee1 or Myt1) inhibits the
activity of a cyclin-Cdk complex, while dephosphorylation by a phosphatase (e.g. Cdc25)
increases activity. The binding of a Cdk inhibitor (CKI) protein to a Cdk or Cdk-cyclin
complex also inactivates a Cdk, usually in G1 or S phase (Vermeulen et al., 2003). CKIs are
divided into two distinct families according to their substrate specificity, the Cip/Kip family
and the INK4 family (Park & Lee, 2003). The Cip/Kip family includes p21 (Waf1, Cip1), p27
(Cip2) and p57 (Kip2) which inhibit G1-Cdk-cyclin complexes and, to a lesser extent, Cdk1-
cyclin B complexes. The INK4 family of CKIs include p15 (INK4b), p16 (INK4a), p18
(INK4c) and p19 (INK4d), which are potent inhibitors of the Cdk4/Cdk6/cyclin D complex
(Sandal, 2002; Vermeulen et al., 2003; Ford & Pardee, 1999; Park & Lee, 2003). p21 also
inhibits DNA replication by binding to and thereby inhibiting proliferating cell nuclear antigen
(PCNA) (Ford & Pardee, 1999). CKI activities are controlled by internal and external signals.
For example, p21 expression is under transcriptional control of the p53 tumour repressor gene
(see section A6.2.1), while p15 expression increases in response to transforming growth factor
β (TGF- β) (Vermeulen et al., 2003).
In addition, two ubiquitin ligase complexes, SCF and anaphase-promoting complex (APC), are
also critical to cell cycle control. These enzyme complexes add ubiquitin to specific regulators
of the cell cycle, inducing their proteolysis and thereby triggering cell cycle events. In the case
of SCF, G1/S-cyclins and certain CKI proteins controlling the initiation of S-phase are
destroyed, while APC is responsible for the destruction of M-cyclins and other regulators of
mitosis (Alberts et al., 2002).

~ Appendix A ~ A9
The different cyclin-Cdk complexes act as molecular switches for specific cell cycle events
(Fig. A1.4). In early G1 phase most Cdk activity is suppressed to allow the cell time for growth
and regulation by extracellular signals before S phase. Cdk suppression is due to a combination
of APC activation, CKI accumulation and a decrease in production of cyclins (other than D).
Entry into S phase usually occurs through the accumulation of G1-cyclins, leading to an
unopposed increase in G1-Cdk activity. This leads to increased synthesis of G1/S-cyclins,
which in turn leads to increased G1/S-Cdk activity resulting in initiation of the events that
commit the cell to enter S phase. S-Cdks initiate DNA replication, ensuring genes are copied
only once per cell cycle. (Alberts, 2002; Johnson & Walker, 1999).
The activation of M-Cdks, after S phase is complete, triggers a cell‘s preparation for and entry
into mitosis. However, if DNA replication is not complete at the end of S phase, a negative
feedback signal at the DNA replication checkpoint (see section A2.3) results in M-Cdk
activation being blocked, saving the cell from entering into a suicidal mitosis. The ubiquitin
ligase APC launches the separation of sister chromatids by destroying several mitotic
regulatory proteins, provided chromosomes are properly attached to the mitotic spindle at the
spindle-attachment checkpoint (section A2.3). Exit from mitosis occurs by a reversal of the
above processes through inactivation of M-Cdk via ubiquitin-dependent proteolysis of cyclin B
(Ford & Pardee, 1999).
A2.2 Other signal transduction molecules
The signals for a cell to proliferate are generally growth factors, such as epidermal growth
factor (EGF), transforming growth factor α (TGF-α) and insulin-like growth factor (IGF),
which act by binding extracellularly to their specific transmembrane receptor proteins thereby
activating the receptor‘s intracellular kinase and initiating a multistep signal transduction

A10 ~ Appendix A ~
kinase cascade involving the products of many genes (e.g. ras, fos, myc, and the MA and PI-3
kinases) (Ford & Pardee, 1999; Hellawell & Brewster, 2002). The fibroblast growth factor
(FGF) family and the endothelial growth factors, platelet-derived growth factor (PDGF) and
vascular endothelial growth factor (VEGF), are other key stimulatory regulators of
proliferation. However, other growth factors, such as transforming growth factor β (TGF-β)
family have an inhibitory effect on cell growth and proliferation (Hellawell & Brewster, 2002).
Still others, such as tumour necrosis factor (TNF) and the Fas ligand, are used as ―death
signals‖, triggering a cell to undergo apoptosis (Nagata & Golstein, 1995). There are at least 17
known signal transduction pathways, each including some form of receptor, proteins (e.g.
kinases and phosphatases) to convey the signal and downstream transcription factors which up-
or down-regulate expression of specific genes (Nebert, 2002). It is not possible to cover all of
these here, so the reader is directed to an excellent review by Maddika et al., (2007) who
describe the interconnections between these signalling pathways that contribute to regulating
homeostatic circuits. Figure A2.2 summarises the major molecules involved in cell cycle
regulation.
A2.3 Checkpoints
Chromosomes can sustain damage from chemicals or radiation or through spontaneous
mutation. It is essential that any such damage to chromosomes is repaired before the cell
attempts to duplicate or segregate them. Therefore, most cells have at least two DNA damage
checkpoints where DNA damage can be detected and the cell cycle arrested if necessary,
generally via negative intracellular signals. These DNA damage checkpoints exist in late G1
and late G2, controlling entry into S phase and M phase, respectively. However, there also
appear to be DNA damage checkpoints during S and M phases too (Vermeulen et al., 2003).

~ Appendix A ~ A11
Figure A2.2 Some of the many molecules involved in cell cycle control.
Note. From ―The apoptosome: signalling platform of cell death.‖ by H.L. Ford and A.B.
Pardee, 1999, Journal of Cellular Biochemistry, Supplements 32/33, p. 167.
Progression into S phase is blocked at the G1/S checkpoint by inhibiting the activation of G1/S-
Cdk and S-Cdk complexes. One way this can occur is via p53, which stimulates the
transcription of a gene encoding the CKI p21, which binds to G1/S-Cdk and S-Cdk to inhibit
their activities. The mechanisms of the DNA damage checkpoint in S phase are not well
understood, but may involve suppression of both the initiation and elongation phases of DNA
replication.
The G2/M checkpoint operates in a similar manner to the DNA replication checkpoint by
maintaining Cdk1 in its inhibited form via phosphorylation or by sequestering components of
the Cdk1-cyclinB complex outside the nucleus. p53 may also play a role in the regulation of
the G2/M checkpoint through p21, 14-3-3σ and Gadd45, although cells without p53 are also
able to arrest in G2 in response to DNA damage (see Vermeulen et al., 2003; Ford & Pardee,
1999).

A12 ~ Appendix A ~
There is also a ―spindle checkpoint‖ in M phase that detects any improper chromosome
alignments on the mitotic spindle and arrests the cell cycle in metaphase. Examples of spindle
checkpoint-associated proteins include Mad and Bub, which are activated when defects in
microtubule attachment are detected. These proteins inhibit the Cdc20 subunit of APC, thereby
preventing the transition between metaphase and anaphase (Vermeulen et al., 2003; Ford &
Pardee, 1999).
The R point in G1 is regulated by the INK4 proteins, which block cyclin D-dependent kinase
activity, rendering the unphosphorylated Rb protein inactivated (see section A6.2.2). This
prevents the synthesis and activity of cyclin E, meaning the cell cycle cannot progress past the
R point (Ford & Pardee, 1999). An overview of the cell cycle control system is presented in
Figure A.2.3.
Figure A2.3 An overview of the cell cycle control system.
Note. From Molecular biology of the cell p.1009, by B. Alberts, et al., 2002, New York:
Garland Science.
A3 Apoptosis
Sometimes, however, DNA damage is so severe that it simply cannot be repaired. In this case,
permanent cell cycle arrest (senescence) may be triggered by p53 (Levesque & Eastman,
2007). Alternatively, the cell may commit suicide by undergoing apoptosis rather than pass on

~ Appendix A ~ A13
the damaged DNA to its progeny. This is because genetic damage to key cell regulatory
proteins (protooncogenes or tumour repressor genes) can often lead to cancer, and in a
multicellular organism, the life of the whole organism must have priority over an individual
cell.
In contrast to cells that die as a result of acute injury via necrosis, cells that undergo apoptosis
die neatly, without bursting and leaking their potentially inflammatory-inducing cell contents
over neighbouring cells (Kerr et al., 1972). Firstly, the cell shrinks and condenses, then the
cytoskeleton collapses, the nuclear envelope disassembles, and the DNA inside the nucleus
fragments (into 180-200 bp pieces) (Doonan & Cotter, 2008). Importantly, the cell surface
changes so that it can be recognised as dying and quickly engulfed by a phagocytotic cell
before any damaging leakage occurs (Li et al., 2003a; Wang et al., 2003).
Apoptosis is primarily mediated by an intracellular proteolytic cascade involving a family of
proteases known as caspases. Caspases are signalling proteases intended for specific protein
cleavage, not protein degradation (Riedl & Salvesen, 2007). Caspases are synthesised in the
cell as inactive procaspases, which are cleaved and thereby activated by other caspases, which
in turn activate other procaspases in an amplifying proteolytic cascade. Some of the activated
caspases then cleave and activate other intracellular proteins such as nuclear lamins or DNAse,
resulting in the rapid and neat dismantling of the cell. In mammals, the extrinsic death receptor
pathway and the intrinsic mitochondrial pathway are the two main signalling systems that
trigger the activation of caspases and the consequent induction of cell suicide (Fig. A3.1).
However, mounting evidence indicates that these two pathways involve significant cross-talk
(Khosravi-Far & Esposti, 2004). The (extrinsic) death receptor-dependent pathway is mediated
via the TNF-family ligands, while the (intrinsic) mitochondrial pathway is induced by different
A14 ~ Appendix A ~
factors, including UV radiation, free radicals, chemotherapeutics or DNA damage (Maddika et
al., 2007).
It is important to understand that activation of the protease chain reaction is usually irreversible
once the cell reaches a point of no return along the pathway to suicide (Riedl & Salvesen,
2007). Therefore, initiation of the cascade is tightly controlled by intracellular adaptor proteins
(e.g. Apoptosis protease activating factor 1 = Apaf-1), which aggregate and activate
procaspases (intrinsic pathway), or by activation of death receptor proteins (e.g. Fas, TNFα), on
the cell‘s surface (extrinsic pathway). The main regulators of the cell death programme are the
Bcl-2 family of intracellular proteins, members of which either inhibit apoptosis by blocking
(e.g. Bcl-2 and Bcl-XL) or stimulating (e.g. Bax and Bak) the release of the electron carrier
protein cytochrome C from mitochondria into the cytosol where it binds to Apaf-1 to accelerate
and amplify the caspase cascade. Activation of transcription genes that encode proteins
promoting the release of cytochrome C from mitochondria usually requires the gene regulatory
protein p53 (see section A6.2.1). Other members of the Bcl-2 family (e.g. Bad) promote
procaspase activation by binding and inactivating the death-inhibiting members. The inhibitor
of apoptosis (IAP) family of intracellular apoptosis regulators also, as their name suggests,
inhibit apoptosis. They do so either by binding to procaspases to prevent their activation, or
binding to caspases to inhibit their activity (Khosravi-Far & Esposti, 2004; Alberts, 2002).

~ Appendix A ~ A15
Figure A3.1 The proteolytic caspase cascade in the initiation and execution of
apoptosis.
In the intrinsic pathway, an apoptotic stimulus in the cell leads to the assembly of a wheel-
shaped signalling platform, the apoptosome, which activates the initiator caspase-9. In contrast,
an extrinsic apoptotic signal is mediated by binding of an extracellular ligand to a
transmembrane receptor, leading to the formation of the death-inducing signalling complex
(DISC), which is capable of activating the initiator caspase-8. Once activated, either caspase-8
or caspase-9 cleaves executioner caspase-3 and caspase-7, which represents the execution level
of the caspase cascade and leads to apoptosis of the doomed cell. Negative regulators of the
caspase cascade can be found at both levels. Whereas FLIP blocks the activation of the initiator
caspase-8 in the DISC, XIAP blocks both the initiation phase, by inhibiting caspase-9, and the
execution phase, by blocking caspase-3 and caspase-7, of the cascade.
Note. From ―The apoptosome: signalling platform of cell death.‖ by S.J. Riedl and G.S.
Salvesen, 2007, Nature Reviews Molecular Cell Biology, 8(5), p. 406.
A4 Ubiquitin-mediated protein
In mammalian cells, the steady state levels of almost all cellular proteins is the balance
between degradation and de novo synthesis. Degradation is also responsible for eliminating
damaged, mis-folded or mutant proteins, the accumulation of which may harm the cell. In
contrast to cell-surface proteins that are endocytosed and degraded in lysosomes, most cellular
A16 ~ Appendix A ~
proteins (80%) are degraded by the proteasome in the cytoplasm and nucleus after being tagged
with ubiquitin. The destruction of regulatory proteins is irreversible and has an essential role in
the regulation of signal transduction, transcription, cell cycle and antigen processing (Burger &
Seth, 2004). For example, cyclins, Cdks and CKIs, including p21, are degraded during the cell
cycle by the ubiquitin-proteasome pathway. Other important targets of the ubiquitin-
proteasome system (UP-S) are p53 (see section A6.2.1), p27, nuclear factor kappa B (NF-κB,
see Appendix B2.4.2) and Bcl2 (section A3) (O‘Connor et al., 2004). Hence, intracellular
proteolysis is a critical regulator of protein function and aberrations in this pathway cause a
range of pathological phenotypes, including cancer (Burger and Seth, 2004; Chin et al., 2005).
A5 Replicative senescence
Normal human cells in culture have a limited replicative potential, ceasing to grow after
about 50 cycles (Weedon & Chick, 1976; Ford & Pardee, 1999). This ―counting‖
mechanism for cell divisions is known as the Hayflick limit and is generally believed to
happen via telomere attrition (Sitte et al., 1998). Telomeres are specialised, complex
structures that cap the ends of eukaryotic DNA strands, acting as a disposable buffer to
delay what is known as the end-replication problem of linear genes (Levy et al., 1992;
Olovnikov, 1996). They are comprised of a repetitive sequence of DNA, (TTAGGG)n in
vertebrates, and various associated proteins, some of which may be involved in controlling
telomere length. Telomere repeats are synthesised by the enzyme telomerase, a RNA-
protein complex. The activity of this enzyme is tightly controlled by limiting the expression
of the catalytic subunit, telomerase reverse transcriptase (TERT) (Possemato & Hahn,
2007). Besides TERT, five other subunits composing the telomerase complex have been
cloned: hTR (human telomerase RNA), TEP1 (telomerase-associated protein 1), hsp90

~ Appendix A ~ A17
(heat shock protein 90), p23, and dyskerin. However, whereas TERT is regulatable, the
other components are expressed more constantly in cells (Chang et al., 2002).
A guanine-rich telomere extension of a few hundred bases, when exposed, induces cellular
senescence, but usually this region is protected by proteins (e.g. protection of telomeres 1 =
Pot1) and by telomerase and is folded back into the T-loop. Because DNA polymerases
cannot replicate the ends of linear strands, 50-200 bases of telomeric DNA are lost every
cell division, eventually resulting in the loss of vital genetic information required for cell
survival (Feng et al., 1995; Hellawell & Brewster, 2002; Kelland, 2005).
A6 What goes wrong in cancer?
Most cancers arise from a single abnormal somatic cell that has had multiple ―hits‖ to its
genome. There is much evidence to indicate that multiple, independent, random mutations in
many (maybe thousands of) genes must have occurred in the lineage of the cell to cause it to
become cancerous (Sandal, 2002; Nebert, 2002). One telling piece of evidence is that the
incidence of cancer increases sharply as a function of age, suggesting the accumulation of
mutations over time. Moreover, in a human‘s lifetime, every single gene is likely to have
undergone spontaneous mutation over 1010
separate times (due to the inherent limitations on
the accuracy of DNA replication and repair) and many of these mutations are likely to disturb
genes that regulate cell cycling, leading to unrestricted cell proliferation, the major trait of
cancer. Clearly then, as the Knudson hypothesis (Knudson, 1971), first postulated by Nordling
(1953), states, more than a single mutation in a single gene is required for carcinogenesis. The
initial population of slightly abnormal cells, the descendants of a single mutant ancestor, is
conferred a growth advantage but must undergo successive cycles of additional mutation and
natural selection to form a tumour (Alberts et al., 2002). It is important to realise that damage
is caused by mutations to normal protooncogenes (dominant, gain of function) which act as

A18 ~ Appendix A ~
accelerators to activate the cell cycle and/or mutations to tumour suppressor genes (recessive,
loss of function) serving to slow cell proliferation (Nebert, 2002). Generally, mutations in both
types of genes are necessary for cancer to occur as a mutation to a single oncogene would
simply be suppressed by normal cell cycle control and tumour repressor genes. Similarly, a
damaged tumour repressor gene does not lead to cancer unless growth is stimulated by an
activated oncogene. However, regardless of the genetic damage or the type of cancer, the
common feature is frequently the deregulation of the cell cycle (Sandal, 2002; Park & Lee,
2003).
A6.1 Protooncogenes
Protooncogenes are normal cellular genes which promote cell growth, such as those that
produce hormones. Mutations in protooncogenes can modify or amplify their expression,
converting them to oncogenes. Dysfunction of the protein products of protooncogenes causes
abnormal regulation of signalling pathways controlling the cell cycle, apoptosis, genetic
stability, cell differentiation and morphogenetic reactions (e.g. contact inhibition of
proliferation). In addition, expression of oncogenes can result in increased stimulation of
angiogenesis, acquisition of metastasising ability and immortalisation, key features of
neoplasms (see section 1.2.2). Examples of changed protooncogenes found in human tumours
include EGFR and HER2 (see Appendix B2.1.1), Bcl2 (see Appendix B2.4.3), Ras (see
Appendix B2.6.2) and ABL (see Appendix B2.1.2) (Kopnin, 2000).
A6.2 Tumour suppressor genes
Tumour suppressors are also major players in regulation of the cell cycle and other processes
associated with cell growth. Some only act if the cell is damaged. In relation to cancer, the two
most important are the Retinoblastoma (Rb) protein and the transcription factor, p53 (Sandal,
2002; Gali-Muhtasib & Bakkar, 2002). It is thought that tumour suppressor genes have evolved

~ Appendix A ~ A19
to protect multicellular organisms from uncontrolled cell division caused by mutations, a
concept supported by the fact that the corresponding pathways or proteins are mutated or
inactivated in most human cancers (Maddika et al., 2007).
A6.2.1 p53
The gene regulatory protein p53 acts as a negative regulator of cell growth in response to
various stresses, which can be genotoxic (DNA changes induced by irradiation, UV light,
carcinogens or cytotoxic drugs) or not (hypoxia, oncogene activation, microtubule disruption)
(Lacroix et al., 2006). p53 inhibits cell proliferation by inducing reversible or irreversible
(senescence) cell cycle arrest, or apoptosis, and may also enhance DNA repair and inhibit
angiogenesis (section A6.2.2) (Maddika et al., 2007). It does so mainly through its ability to act
as a transcription factor and is required for the transcription of several genes involved in cell
cycle control and DNA synthesis (Lacroix et al., 2006). For example p53 stimulates the
transcription of a gene encoding a CKI protein (p21) which inhibits the activities of G1/S-Cdk
and S-Cdk, blocking a cell‘s entry into S phase (section 1.2.2.2.4). In the case of severely
damaged cells, p53 activates the transcription of genes encoding proteins that promote the
release of cytochrome C from mitochondria into the cytosol, thereby triggering the caspase
cascade involved in apoptotic cell death (section A3) (Vermeulen et al., 2005; Sullivan et al.,
2004). Other genes regulated by p53 include those encoding the cell cycle regulatory proteins
14-3-3σ, TERT, cyclin A2 and cyclin B1 (see section A2.1), proteins involved in apoptosis and
survival, including Apaf-1, Bax, Bac1, Bcl2 and Fas (see section A3) and angiogenesis, such as
endostatin and VEGF (see Appendix B2.6.1 and B2.6.2) (Sullivan et al., 2004; Lacroix et al.,
2006). For a more comprehensive list, see Lacroix et al., 2006.
A6.2.2 Rb
The retinoblastoma protein family (pRb, p107 and p130) are the primary substrates of Cdk2,
Cdk4 and Cdk6 in G1 progression, functioning as negative regulators at the R point. The E2F

A20 ~ Appendix A ~
family of transcription factors are important targets of pRb for regulating early G1 progression.
E2Fs control the expression of many genes that mediate progression through the R point (e.g.
cyclin E) and S phase (e.g. dihydrofolate reductase) (Park & Lee, 2003). E2F functioning as a
transcription factor is prevented by its interaction with Rb, but Rb is only able to bind E2F
when it is unphosphorylated. Some Rb mutants are constitutively phosphorylated so cannot
bind E2F, meaning cell division is uncontrolled at the R point and cells may become cancerous.
A growth advantage is also conferred by direct mutation and/loss of function of Rb in a subset
of human cancers (Sandal, 2002). Phosphorylation of Rb is catalysed by the activity of
Cdk/cyclin complexes. Mitogenic signals generally lead to activation of Cdk/cyclin complexes,
whereas antimitogenic signals inhibit the activation of G1 Cdk/cyclin complexes (Maddika et
al., 2007; Sandal, 2002). Rb is also crucial for stem cell maintenance, tissue regeneration,
differentiation and developmental programmes and it has been shown that the Rb pathway can
affect the activity of the p53 pathway and vice versa (Maddika et al., 2007).

~ Appendix B ~ A21
Appendix B. Chemotherapeutic Strategies to Combat
Cancers
B1 Cytotoxic drugs
B1.1 Drugs that impair DNA synthesis
In cancer cells, the control of G1 progression and the initiation of S phase is often disrupted,
resulting in the premature transition through the R-point, leading to unrestrained cell
proliferation. To this end, drugs that target the synthesis of DNA have been developed.
B1.1.1 Antimetabolites
Antimetabolites are analogues of purines, pyrimidines and folates that prevent cells from
making nucleosides, the building blocks of DNA (Galmarini et al., 2002). Purine nucleoside
analogues (PNAs) are incorporated into DNA during replication instead of adenine and
guanine, preventing extension by DNA polymerase and leading to chain termination. PNAs
have particularly high activity against lymphoid and myeloid cancers and all have similar
chemical structures and mechanisms of action. Several mechanisms could be responsible for
their cytotoxicity, including inhibition of DNA synthesis and repair, and accumulation of DNA
strand breaks (Robak et al., 2005). Antimetabolites are cell cycle specific, primarily acting on
cells undergoing DNA synthesis and so are most useful during S-phase. Purine analogues that
have been Food and Drug Administration (FDA)-approved for the treatment of cancer include
mercaptopurine, thioguanine, fludarabine monophosphate, deoxycoformycin and cladibrine
(Parker et al., 2004), while three other compounds, clofarabine, nelarabine and immucillin-H,
are under clinical evaluation (Robak et al., 2005). Synergistic interactions between PNAs and
other cytotoxic agents have been demonstrated clinically (Robak et al., 2005).

A22 ~ Appendix B ~
Pyrimidine antagonists include 5-flurouracil (5FU), gemcitabine (Gemzar®
) and
arabinosylcytosine which either block pyrimidine nucleotide formation or cause premature
termination by themselves being incorporated into DNA. 5FU also inhibits thymidylate
synthase, the enzyme that catalyses the synthesis of thymine nucleotides from uracil
nucleotides (Longley et al., 2003; Luqmani, 2005).
Another anticancer chemotherapeutic that inhibits the folate pathway is the folate analogue
methotrexate, which inhibits dihydrofolate reductase (Schweitzer et al., 1990).
Methotrexate has been widely used to treat a variety of malignancies including acute
lymphocytic leukaemia, non-Hodgkin‘s lymphomas, squamous cell carcinoma
choriocarcinoma and cancers of the breast, lung, bladder, head and neck and bone (Bleyer,
1978; Luqmani, 2005).
B1.1.2 Camptothecins
Another class of anticancer drugs, the camptothecins (e.g. toptecan), selectively target
topoisomerase (topo) I by reversibly stabilising a covalent DNA-topo I intermediate (van
Waardenburg et al., 2004). Topo I is the enzyme responsible for producing a transient single-
strand break (nick) in DNA, allowing the two sections of the DNA helix on either side of the
nick to rotate freely relative to each other, using the phosphodiester bond in the strand opposite
as a swivel point, until the enzyme leaves and the phosphodiester bond reforms (Alberts, 2002).
Camptothecins prevent DNA strand breaks resealing, resulting in DNA damage and arrest of
the cell cycle between S phase and G2. They do this by forming a reversible complex with
DNA and topo I, which prevents the re-ligation of the topo I-induced transient nick in the DNA
strand, allowing strand passage and thus reducing twists and consequent strain in DNA during
replication and transcription. The persistence of this so-called cleavage complex on DNA
increases the chance that the complex will collide with the DNA fork machinery, leading to a

~ Appendix B ~ A23
lethal double strand break (Adams, 2005). Interestingly, all of the topo I inhibitors clinically
evaluated to date are analogues of camptothecin, an extract of the Chinese tree Camptoheca
acuminata (Sriram et al., 2005).
B1.1.3 Anthracyclines
Anthracycline antibiotics (e.g. doxorubicin and daunorubicin) impair the function of
topoisomerase II, the enzyme responsible for transiently nicking double-strands of DNA. By
reversibly breaking one double helix to create a DNA gate through which the second double
helix can pass, and resealing the break before dissociating from the DNA, topo II can
efficiently separate two interlocked circles of DNA (Alberts, 2002).
Anthracyclines are one of the most utilised anticancer drugs ever developed and are active
against a variety of tumours. However, due to their mechanism of action, they are also toxic
towards normal proliferating cells. Their main serious side effect is cardiotoxicity, which can
lead to arrhythmia and heart failure, so this limits the dosage that can be used (Kwok &
Richardson, 2002; Xu et al., 2005; Barry et al., 2007). Anthracyclines transform topo II into
potent nuclear toxins that lethally damage the DNA double helix. They do so by stabilising the
topo II-DNA covalent complex and preventing the resealing of nicks. It is known that drug
intercalation is necessary, but not sufficient, for topo II inhibition and the removal of certain
substituents greatly increases activity. The action of topo II poisons is generally DNA sequence
specific in that each compound can cleave DNA at only certain sites recognised by the enzyme
and this specificity is dependent upon the 3‘ substituent of the sugar moiety. In addition, some
anthracyclines can also inhibit topo I. This information has been used to help find new
anthracycline drugs with lower side effects and higher activity against resistant cancer cells. In
the search for ―a better doxorubicin‖, more than 2000 analogues have been reported, the most
promising being MEN10755, which is itself the progenitor of a third generation of synthetic

A24 ~ Appendix B ~
anthracycline oligosaccharides with different chemical and biological characteristics (Binaschi
et al., 2001).
B1.2 Drugs that impair DNA integrity
B1.2.1 Platinum compounds
The aforementioned drug classes are all cell cycle specific, i.e. they have activity only in
specific phases of the cell cycle (Fig. B1). Another class of anticancer drugs, the platinum
compounds (e.g. cisplatin), have cytotoxic activity throughout the entire cell cycle. This is
because these compounds cross-link with DNA to form adducts, causing strand breaks which
damage the integrity of the DNA and result in cell cycle arrest at G2 and apoptosis. Toxicity
seems to be more dependent on the inhibition of transcription rather than the inhibition of DNA
synthesis as cells proficient in DNA repair are able to circumvent G2 arrest and transcribe
damaged genes to make mRNA required for passage into mitosis (Sorenson & Eastman, 1988a;
Sorenson & Eastman, 1988b). However, the DNA binding model does not explain all cellular
and molecular events observed in experiments, so a complete understanding of the mechanisms
of action is still to be determined (Bose, 2002). It has been reported that platinum-DNA adducts
also act as topo I poisons to enhance the stability of covalent topo I-DNA complexes,
accounting for an observed synergistic effect of platinum drugs in combination with a
camptothecin (van Waardenburg et al., 2004).
Cisplatin is the treatment of choice for many cancers, including testicular and ovarian cancer,
but is ineffective against some of the most common tumours, including breast and colon
cancer. Other limitations include toxic side effects, such as nausea, hearing loss, kidney toxicity
and loss of sensation in hands, and acquired drug resistance in certain tumours. Efforts to
overcome the shortcomings of cisplatin have led to the development of thousands of platinum

~ Appendix B ~ A25
compounds, only four of which are currently approved in at least one developed nation
(carboplatin, oxaliplatin, nedaplatin and Lobaplatin). Other metal ions such as nickel and
palladium are also being studied for antitumour effects, but they may have different target sites
than DNA (Abu-Surrah & Kettunen, 2006; Pasetto et al., 2006).
Figure B1 Cell cycle specificity of cytotoxic anticancer drugs.
Note. From ."Zactima," 2010 Retrieved 26th
May, 2010, from
http://www.drugdevelopment-technology.com/projects/zactima/.
B1.2.2 Alkylating agents
In contrast to platinum compounds which intercalate with DNA and induce strand breaks,
alkylating agents (e.g. cyclophosphamide) directly damage the 3-dimensional structure of
DNA by covalently binding alkyl groups to DNA, introducing cross-links that inhibit
replication. They can also cause abnormal base pairing of nucleotides or DNA strand
breaks, thus preventing cell division (Ralhan & Kaur, 2007). Although alkylating agents are
active in all stages of the cell cycle, as with most cytotoxic drugs, proliferating cells are

A26 ~ Appendix B ~
more sensitive, especially those in G1 and S phase. However, they are commonly more
effective against slow-growing cancers (Ralhan & Kaur, 2007).
There are six classes of alkylating agents: (i) nitrogen mustards (e.g. mechlorethamine and
melphalan), (ii) nitrosureas (e.g. carmustine, streptozocin), ethylenimes and methylmelamines
(e.g. altretamine), (iii) alkylsulfonates (e.g. busulfan), (v) triazenes (e.g. dacarbazine and
temozolomide) and (vi) piperazines (Pauwels et al., 1995; Ralhan & Kaur, 2007).
B1.3 Drugs that impair mitosis
Some of the most powerful anticancer drugs stop cells from making the components needed for
cell division. Microtubules, long cylindrical polymers consisting of tubulin monomers (α and
β), represent the principal target as cell cycle progression is dependent on microtubule
dynamics. There are two classes of tubulin-interacting antimitotic agents- one that promotes
microtubule polymerisation, thereby stabilising them and another class that inhibits
microtubule polymerisation (Nagle et al., 2006).
B1.3.1 Tubulin destabilising agents
The vinca alkaloids (e.g. vinblastine and vincristine) cause cells to arrest at metaphase by
inhibiting microtubule assembly and inducing the self-association of tubulin into coiled spiral
aggregates (Lobert et al., 1996). Compounds that bind to the ―vinca domain‖ of tubulin
generally function as quick, reversible and temperature-independent inhibitors of tubulin
assembly. Vinblastine and vincristine were the first drugs of this group to be developed, after
being isolated from the periwinkle plant, Catharanthus roseus G. Don (or Vinca rosa Linn) and
immediately had an impact in oncology, vincristine, for example, increasing the survival rate of
childhood leukemia by 80% (Mukherjee et al., 2001; Kong et al., 2003). Derivatives and
relatives include vinflunine, dolastatin-10, rhizoxin and spongiostatins, some of which show

~ Appendix B ~ A27
promising anticancer activity in vivo, but have not yet been approved as drugs (Nagle et al.,
2006).
Other microtubule inhibitors that inhibit tubulin polymerisation bind to a different site on
tubulin, retarding the addition of new tubulin and causing the mitotic spindle to disassemble
during metaphase. This subclass has a colchicine binding site and includes the compounds
colchicine, combrestatin A4, podophyllotoxin, halichondrin B and curacin A and their
respective analogues. While colchicine itself lacks cancer efficacy in vivo, analogues of these
lead compounds have shown clinical promise (Nagle et al., 2006).
B1.3.2 Microtubule stabilising agents
Taxanes (e.g. paclitaxel = Taxol® and docetaxol) inhibit microtubule function by binding to
tubulin, thereby stabilising microtubules and altering the formation of the mitotic spindle. This
induces cell cycle arrest at the metaphase/anaphase transition and subsequent apoptosis. Today,
taxanes are one of the most commonly prescribed classes of cytotoxic agents in the treatment of
a wide variety of cancers. Furthermore, while their mechanism of action and anticancer
activities are very similar, key differences exist which means there is little cross-resistance
between taxanes clinically (Goodin et al., 2004; Montero et al., 2005).
However, they do have their shortcomings, such as susceptibility to resistance via drug efflux
conferred by P-glycoprotein and difficulties with formulation and administration. Furthermore,
the mechanisms underlying cancer cell selectivity are not well understood and not all molecules
that affect microtubule function are useful as anticancer drugs (e.g. colchicine). For this reason,
there has been considerable interest in identifying new, structurally distinct, molecules that
interfere with microtubule function. This has led to the discovery of the epothilones, originally
discovered as cytotoxic metabolites from the myxobacterium Sorangium cellulosum. This class
A28 ~ Appendix B ~
of microtubule-stabilising drugs competitively inhibit binding of paclitaxel to microtubules in
vitro, and preclinical studies indicate a broad-spectrum of action, even in paclitaxel-resistant
models, with tolerable side effects (Goodin et al., 2004). Other drugs, including eleutherobins,
laulimalide, sarcodictycins and discodermolide, bind to different sites on tubulin and at
different positions within the microtubule, meaning they have differing suppressive effects on
microtubule dynamics but still block mitosis and induce cell death (Jordan, 2002).
B2 Targeted therapies
B2.1 Drugs that target molecular abnormalities (oncogenes and tumour suppressors)
B2.1.1 Molecular antibodies
Because cancer arises as a result of a series of genetic changes in a cell, drugs targeting
these molecular abnormalities (oncogenes and tumour repressors) have recently been
developed. For example, trastuzumab, more commonly known as Herceptin®, is a
humanised monoclonal antibody (mAb) that has antitumour activity against HER2-
overexpressing human breast tumour cells. Overexpression of this oncogene occurs in 20-
30% of breast cancer cases (Albanell et al., 2003) and is associated with a more aggressive
course of the disease (Menard et al., 2003; Nahta & Esteva, 2006). HER2, also known as
erbB2, is a member of the epidermal growth factor receptor (EGFR), erbB, or HER,
subfamily of receptor tyrosine kinases (RTKs) (Menard et al., 2003; Zwick et al., 2000).
All these receptors are comprised of an extracellular ligand-binding domain, a
transmembrane lipophilic domain, and an intracellular tyrosine kinase (TK) domain, but
unlike other RTKs in the EGFR family, HER2 does not bind to receptor-specific ligand
(Ono & Kuwano, 2006; Albanell et al., 2003; Zwick et al., 2000; Menard et al., 2003).
Activation of TK enzymes and receptors triggers intracellular signal transduction pathways
that control normal cell proliferation, differentiation, motility and adhesion of epithelial

~ Appendix B ~ A29
cells (Menard et al., 2003). Aberrant expression of RTKs undermines the normal controls
of these signalling pathways, leading to increased cell proliferation, differentiation and
survival, as well as the promotion of cell cycle progression and angiogenesis (Ono &
Kuwano, 2006; Herbst, 2004; Menard et al., 2003). By forming heterodimers, HER2 has a
central, amplifying role in this signalling network and was therefore identified as a potential
target for cancer therapy (Albanell et al., 2003; Zwick et al., 2000). AntiHER2 mAbs were
actively sought (Raymond et al., 2000) and in 1998 FDA approval of trastuzumab, which
induces HER2 receptor downmodulation, was gained (Adams & Weiner, 2005; Albanell et
al., 2003).
Another mAb specifically targeting a different RTK, EGFR (also known as HER1 or
erbB1), is the human-murine chimeric antiEGFR drug, cetuximab (Erbitux®), which is used
clinically for colorectal cancer where EGFR is overexpressed in 70-80% of cases (Herbst,
2004; Adams & Weiner, 2005; Ciardiello et al., 2005; Zhang et al., 2006), non-small cell
lung cancer and head and neck cancer (Mendelsohn & Baselga, 2006; Astsaturov et al.,
2006). Examples of other FDA approved mAbs in cancer therapy targeting different
oncogenes include bevacizumab (Avastin®) used in colorectal and lung cancers, rituximab
(Rituxan®) against lymphoma and alemtuzumab (Campath-1H
®), to combat chronic
lymphocytic leukemia (Adams & Weiner, 2005; Rajpal & Venook, 2006).
B2.1.2 Small molecule inhibitors
At present, the two ways of clinically targeting the EGFR pathway are mAbs against EGFR
and inhibitors of the EGFR TK (Ganti & Potti, 2005; Lenz, 2006; Vokes & Chu, 2006). MAbs,
such as cetuximab, work by blocking ligand binding to the extracellular domains of RTKs.
Small molecule inhibitors of TKs, on the other hand, prevent TK phosphorylation and
subsequent activation of signal transduction pathways by acting on the intracellular portions of

A30 ~ Appendix B ~
RTKs. An example of a small molecule inhibitor of EGFR is imatinib mesylate (Gleevec®
or
Glivec®
), which received FDA approval in 2001. Imatinib has unprecedented efficacy for the
treatment of chronic myelogenous leukemia (CML), the hallmark of which is the Philadelphia
chromosome, or translocation, present in over 90% of cases (Druker & Lydon, 2000). In the
Philadelphia translocation, genes of two chromosomes (BCR on chromosome 22 and ABL on
chromosome 9) swap places. The fused gene (BCR-ABL) results in a chimerical protein (bcr-
abl) expressed by CML cells which has constitutive TK activity. This means several signal
transduction pathways are perpetually activated, leading to increased cell proliferation, reduced
apoptosis and increased tumour migration. As imatinib is an ATP-competitive selective
inhibitor of bcr-abl, TK activity is reduced and hence the pathogenesis of CML is decreased by
treatment with this drug (Deininger & Druker, 2003).
Other small molecule EGFR-specific TK inhibitors include gefitinib (Iressa®) and erlotinib
(Tarceva®) for combination therapies against pancreatic and non-small cell lung cancer
(Herbst, 2004; Paez et al., 2004; Ono & Kuwano, 2006; Mendelsohn & Baselga, 2006;
Ducreux et al., 2007)
B2.3 Drugs that target cell cycle control
B2.3.1 Inhibitors of Cdks
The frequent disruption of cell cycle regulation in cancer has flagged many molecules as
potential therapeutic targets. Indeed, tumourigenesis is often associated with aberrant
expression of various cyclins, Cdks and CKIs. Designing inhibitors of Cdks represents the most
direct and promising strategy and several potent Cdk inhibitors have entered clinical trials,
including flavopiridol and UCN01 (7-hydroxystaurosporine). Cdk inhibitors possess strong

~ Appendix B ~ A31
antiproliferative activity, arresting cells in G1 or G2/M and sometimes promoting cell
differentiation and triggering apoptosis (Park & Lee, 2003; Sandal, 2002).
B2.3.2 Activators of the Rb pathway
The most frequently altered cell cycle regulatory genes occurring in tumours are those
involved in controlling the G1-S transition regulated via the Rb pathway (see Appendix
A6.2.2). Interestingly, other G1-S regulators, such as E2F, cyclin E and the Cip/Kip family
members of CKIs are rarely lost or mutated in human cancers (Sandal, 2002). pRb also has
Cdk-independent functions, suggesting the re-introduction and expression of pRb into
cancer cells may arrest growth by mechanisms that do not depend on the formation of Cdk
complexes (Park & Lee, 2003). Restoring the Rb pathway has potential for efficiently
treating cancer, but due to tumourigenesis being a multistep process and crosstalking
between the components of the different cell cycle phases means that pathways can
sometimes be bypassed. While many agents have shown promise in preclinical studies, no
drugs have yet been developed to target this pathway (Knudsen & Wang, 2010).
B2.4 Drugs that target resistance to apoptosis
Defective apoptosis is one of the characteristics of cancer cells and has been implicated in
various stages of cancer development and progression. Furthermore, it is the ability to evade
apoptosis that appears to provide tumour cells with their capacity to resist conventional
chemotherapy and radiotherapy (Khosravi-Far & Esposti, 2004). However, while cancer cells
inactivate elements of the apoptotic pathway, they never disable the complete signalling
cascade. This implies that at least some molecules share function between cell proliferation and
cell death (Maddika et al., 2007). These authors go on to suggest that since cell survival, cell
death and cell cycle progression pathways are interconnected, it should be possible to develop
pharmacological agents that can selectively harness cell proliferation pathways and redirect

A32 ~ Appendix B ~
them into the apoptotic process. They mention several viral molecules that can selectively kill
cancer cells, but as yet, no drugs have been developed based on this theory. Other strategies
exploiting cancer cells‘ resistance to apoptosis, however, have yielded promising new
chemotherapeutics.
B2.4.1 Activators of the p53 pathway
Normally, stressful stimuli such as DNA damage or hypoxia leads to the activation of the
transcription factor p53. As outlined in Appendix A6.2.1, p53 activates the transcription of
genes encoding proteins involved in the control of cell cycle progression and is important in
DNA damage-induced arrests at both the G1/S and G2/M checkpoints, suggesting cells lacking
p53 may be more susceptible to genetic instability (Ford & Pardee, 1999). In addition, p53 is
involved in the induction of apoptosis (see Appendix A3) (Sullivan et al., 2004). As cancer is
associated with decreased apoptosis, p53 is a noted tumour suppressor (Sun, 2006) and cells
that lack p53 might be expected to be more vulnerable to cancer. Indeed, mutations of the p53
gene are the most common genetic abnormality found in human cancers so far (Greenblatt et
al., 1994; Vermeulen et al., 2005), with mutational inactivation of p53 detected in over 50% of
cases (Sun, 2006; Levesque & Eastman, 2007). Furthermore, almost all p53 mutants associated
with human tumours are defective for apoptosis (Sullivan et al., 2004). Tellingly, the p53
protein is absent in 30-70% of clinical tumour samples and the absence of the wild-type p53
gene in a tumour correlates with increased resistance to chemotherapy because of the
development of apoptosis resistance (Huang & Oliff, 2001a; Koike et al., 2004; Sullivan et al.,
2004; Sun, 2006). Thus, strategies aimed at pharmacologically reactivating p53, preventing p53
degradation or modulating other components in p53 signalling pathways are promising areas of
anticancer research (Sun, 2006). While no clinical drugs have so far been developed, research
so far is encouraging. For example, Ventura et al. (2007) have shown that the restoration of
endogenous p53 function leads to tumour regression in mice in vivo, without affecting normal

~ Appendix B ~ A33
tissues. Interestingly, the mechanism of tumour regression differed between tumour types.
Reactivation of p53 function caused widespread apoptosis in lymphomas, but cell cycle arrest
and senescence was induced in sarcomas. Nevertheless, provided human cancers are also
dependent on sustained p53 inactivation for tumour maintenance, these results add support for
endeavours towards treating cancers by exploiting the prevalence of p53 pathway inactivation
in human cancer cells (Ventura et al., 2007).
Notwithstanding these observations, Levesque and Eastman (2007) point out that p53-defective
cells can undergo apoptosis and the loss of p53 can even sensitise cells to DNA damage.
Furthermore, anticancer drugs and radiotherapy have been used to successfully treat many
patients with p53-defective tumours. For these reasons, an alternative approach to cancer
therapy in which p53 is inhibited has been proposed. Under this strategy, a p53 inhibitor (e.g.
pifithrin- = PFT) is used in combination with a cytotoxic drug or radiotherapy against p53-
defective tumours. This tactic could also be used to protect normal cells from p53-induced
apoptosis and hence, healthy tissues from the adverse effects of the anticancer therapy.
However, if used in combination with DNA damaging agents to treat p53-defective tumours,
PFT might protect some normal tissues from apoptosis, but it would also prevent p53-
dependent cell cycle arrest so that normal cells with damaged DNA might proliferate,
potentially causing more cancer. Also, while PFT suppresses caspase activation and decreases
levels of nuclear p53, it also suppresses apoptosis in p53-defective cell lines and can even
induce apoptosis. A more effective drug strategy may be to develop p53 inhibitors that target
either the p53-dependent apoptotic pathway or the p53-dependent cell cycle arrest separately. A
new small molecule, PFT, fitting these criteria has recently been identified (Levesque and
Eastman, 2007). Actinomycin D, already used as an antibiotic, has been approved for use in
A34 ~ Appendix B ~
activating wild-type p53, while various other small molecules targeting the p53 pathway (e.g.
PRIMA-1, Nutlin, RITA) are still in Phase 1 or pre-clinical trials (Brown et al., 2009).
B2.4.2 Inhibitors of the ubiquitin-proteasome pathway
As outlined in Appendix A4, the proteasome is a ubiquitous enzyme complex that plays a
crucial role in the controlled degradation of many proteins involved in cell cycle regulation and
apoptosis, including p53. Since these pathways are fundamental for cell survival and
proliferation, especially in cancer cells, and because proteasome inhibition has been shown to
sensitise cancer cells to traditional anticancer agents, the ubiquitin-proteasome system (UP-S)
provides a rich source of molecular targets for specific intervention. Therefore, targeting the
UP-S has emerged as a promising approach to developing novel anticancer chemotherapeutics
(Mitsiades et al., 2005; Montagut et al., 2006; Giuliano et al., 2003; Burger and Seth, 2004).
Proteasomes, which account for approximately 1% of the cellular protein content of
eukaryotes, are localised in the cytosol and nucleus. The functional large 26S proteasome is
comprised of ring-shaped 19S and 20S particles, which are composed of numerous polypeptide
subunits, each having distinct enzymatic activities. The level of 20S proteasome core in the
plasma of patients with solid tumours has been shown to be up to 1,000 times higher than in
normal subjects, highlighting the significance of the proteasome to cancer. However, little is
currently understood about the role of the individual components of the UP-S in tumourigenesis
and few ubiquitin-conjugating enzymes and ligases have been evaluated for their expression
patterns in many human tumours (Burger and Seth, 2004).
The UP-S also plays a critical role in regulating the important transcription factor nuclear factor
kappa B (NF-κB), which is responsible for activating several genes that contribute to the
malignant phenotype, including genes that promote cell proliferation, cytokine release,

~ Appendix B ~ A35
antiapoptosis, and changes in cell surface adhesion molecules. The activity of NF-κB is tightly
controlled by the UP-S via the accumulation or degradation of IκB, which binds to and
inactivates NF-κB. Cell adhesion molecules are proteins regulated by NF-κB and are involved
in tumour metastasis and angiogenesis in vivo (O'Connor et al., 2005).
The dipeptide boronic acid analogue, bortezomib (Velcade), an extremely potent, highly
selective and reversible proteasome inhibitor, is the FDA-approved prototype drug of this class
of anticancer agents, showing strong activity in vitro and in vivo against a broad range of
cancer cell types (Montagut et al., 2006; Cardoso et al., 2004). Better still, it has only a few
toxic effects on normal cells, although the few side effects are grade 3/4 (Burger and Seth,
2004). It seems to causes apoptosis either by blocking tumour necrosis factor (TNF) -induced
activation of NF-B (observed in multiple myeloma cells), or G2-M-phase arrest and induction
of p21 (prostate cancer cells), or by stabilisation of p53 (lung cancer cells) (Burger and Seth,
2004).
B2.4.3 Inhibitors of other signalling pathways
Other signalling pathways in apoptosis have also been identified as potential targets for cancer
therapy. These include the antiapoptotic Bcl2 family of proteins (e.g. Bcl-2 and Bcl-xL) and
their upstream regulators or downstream effectors and antagonists of IAPs (e.g. Smac). Agents
that have shown preclinical promise in targeting Bcl-2 include suprafenacine, miR-181b (Choi
et al., 2010; Zhu et al., 2010), while clinical trials are ongoing on several investigational drugs
including AT-101, ABT-263, GX15-070 and oblimersen sodium (Kang & Reynolds, 2009).
However, as yet no anticancer therapies have been developed based on this knowledge (Huang
& Oliff, 2001a).

A36 ~ Appendix B ~
B2.5 Drugs that target tumour cell immortality
A key property of cancer cells is their immortality. In tumours, cell replication is associated
with the maintenance of telomere length and integrity, usually through the reactivation of a
reverse transcriptase mechanism, whereby telomerase adds TTAGGG units to telomeres (see
Appendix A5). Telomerase is constitutively overexpressed in the vast majority of human
cancers and telomeres are critically shorter in most tumours compared to normal tissues. This
makes targeting telomeres, or the telomerase machinery, an attractive, potentially broad-
spectrum, approach to cancer therapy (Kelland, 2005).
The genes encoding six of the subunits comprising human telomerase have been cloned. These
include hTERT (human telomerase reverse transcriptase), hTR (human telomerase RNA),
TEP1 (telomerase-associated protein 1), hsp90 (heat shock protein 90), p23, and dyskerin.
(Feng et al., 1995; Nakamura et al., 1997; Chang et al., 2002). Targeting the active site of
hTERT has been reported using small molecules including AZT (3‘-azido-2‘,3‘-
dideoxythymidine), but this approach has had limited success due to a lack of sensitivity for
telomerase compared to other polymerases (Ji et al., 2005). BIBR1532, a non-competitive
inhibitor of telomerase, is the most extensively studied non-nucleoside molecule (El-Daly et
al., 2005). It has shown potent inhibition of telomerase in vitro, but in vivo studies have
revealed a lag between enzyme inhibition and cellular growth arrest, apoptosis and tumour
growth delay. A second molecule, 2,3,7-trichloro-5-nitroquinoxaline (TNQX), with similar
properties to BIBR1532 also showed growth inhibition and induction of senescence, but only
after extensive periods of exposure (Kelland, 2005).
~ Appendix B ~ A37
Telomerase can also be directly targeted by various antisense molecules to hTERT or hTR. The
most advanced is GRN163L, an oligonucleotide targeted to the template region of hTR. This
molecule has shown promising effects in vitro and in vivo and is currently undergoing late-
stage preclinical development. In addition, it may be possible to induce antitumour effects via
indirect mechanisms that regulate telomerase expression, such as inhibitors of chaperones,
hypoxia-inducible factors 1 or the nuclear factor B pathway (Kelland, 2005).
Targeting the telomeres themselves is another avenue being explored and various telomere
targeting agents (TTAs) have been described. Guanine-rich sequences of DNA, such as
telomeres, tend to fold into quadruplex intramolecular structures. Hence, compounds that
interact with the G-quadruplex, such as trisubstituted acridines (e.g. BRACO19), ethidium
derivatives and the natural product telomestatin (aka SOT-095) can inhibit telomerase activity.
While some first generation G-quadruplex ligands exhibited a lack of selectivity for 4- versus
2-stranded DNA, resulting in non-specific acute cytotoxicity and similar inhibition of
telomerase activity in vitro, improved molecules now exist (e.g. BRACO19) that have shown
encouraging in vivo data. The antitumour effects from G-quadruplex ligands are generally
much more rapid than those observed using direct hTERT inhibitors and there is considerable
potential for broad-spectrum antitumour activity, especially in tumours with short telomeres.
There is also the evidence for synergistic effects when used in combination with radiotherapy
and cytotoxic drugs, particularly those that induce DNA damage (Kelland, 2005). However,
despite the great potential, most molecules that have shown specific telomerase activity have
been too toxic at the doses required. Two telomerase-targeting drugs in clinical development
are telomelysin and imetelstat, which will both begin Phase II clinical trials in 2010 (Brower,
2010).
A38 ~ Appendix B ~
B2.6 Drugs that target angiogenesis
The generation of a lethal tumour requires more than excessive tumour cell proliferation. A
solid tumour must also have an adequate network of blood vessels (vasculature) from normal
tissue to supply nutrients and oxygen and to remove waste products (Nishida et al., 2006; Yano
et al., 2006). However, when a tumour becomes too large (~1-2 mm3) for its own blood supply
to support further expansion, a stressful, hypoxic and acidic microenvironment develops within
the tumour, providing a strong selection pressure for more aggressive cancer cells and the
generation of signals necessary for the growth of new blood vessels (angiogenesis) (Thornton
et al., 2006; Boehm-Viswanathan, 2000; Adams, 2005). In fact, neovasculature is critical to the
growth and spread of malignant tumours (Ferrara, 2004a), the generation of tumour mass
having been shown to be impossible without endothelial cell proliferation (Folkman, 2006a).
Hence, both tumour cell proliferation and angiogenesis together are vital to turn a small solid
tumour into a life-threatening neoplasm (Folkman, 2006a; Rahman & Toi, 2003; Zhong &
Bowen, 2006).
In 1971 Folkman proposed his then provocative hypothesis that arresting the growth of a
tumour may be achieved by attacking its blood supply (Folkman, 1971; Verhoef et al., 2006).
However, it was not until recently with the identification of molecular targets and cellular
pathways of angiogenesis that antiangiogenic chemotherapy came of age as a viable approach
to combating the growth of solid tumours (Thornton et al., 2006). Many angiogenesis inhibitors
have now been approved for clinical use by the FDA in the USA and elsewhere in the world
(Folkman, 2006a; Rosen, 2001; Rahman & Toi, 2003). Antiangiogenic therapy may also be
useful in preventing metastasis or tumour recurrence (Rahman & Toi, 2003) and in the fight
against multi drug resistance (MDR), a common feature of cancers (Rahman et al., 2010).
~ Appendix B ~ A39
Tumour angiogenesis is a multistep cascade that involves secretion or activation of angiogenic
factors by tumour cells, activation of proteases, and proliferation, migration and differentiation
of endothelial cells into new vasculature (Rahman & Toi, 2003). In normal tissues,
angiogenesis is regulated via a complex balance of the actions of endogenous angiogenic
inhibitors (e.g. endostatin) and proangiogenic factors (e.g. VEGF) (Ferrara, 2004b; Zhong &
Bowen, 2006; Nieder et al., 2006). When proangiogenic factors outweigh antiangiogenic
factors, the ―angiogenic switch‖ is turned on and endothelial cells become activated from their
normal dormant state (Thornton et al., 2006). Many factors, including vascular endothelial
growth factor (VEGF) RTKs, p53, tubulin and cyclooxygenase-2 (COX-2), are known to
regulate the equilibrium between angiogenic stimulants and inhibitors, hence these factors are
good targets for antiangiogenesis drug design (Rahman & Toi, 2003; Zhong & Bowen, 2006).
Antiangiogenesis drugs can either inhibit proangiogenic factors or promote or mimic the
actions of antiangiogenic factors. Currently, pharmacologically targeting angiogenesis means
inhibiting growth factors that promote the growth of vascular endothelial cells or blocking their
receptors (Rahman & Toi, 2003).
B2.6.1 Vascular targeting agents
The triggering of the angiogenic switch leads to the breakdown of basement membranes and
the extracellular matrix, mainly because of the increased activity of matrix metalloproteases.
These alterations to the matrix promote endothelial migration into the extravascular space
where they proliferate. The new capillary network is formed as the endothelial cells arrange
themselves into tubes and lumens. Pericytes are then recruited which attach to and stabilise the
new mature vessels. Until this time, VEGF is necessary for the survival and integrity of the
endothelial cells (Thornton et al., 2006). However, although composed of normal endothelial
cells, tumour blood vessels are morphologically very different to blood vessels formed in non-

A40 ~ Appendix B ~
diseased tissues and these differences make the vascular lining a valid target for therapy
(Thornton et al., 2006). For example, by exploiting this knowledge Professor Dharmarajan and
colleagues at the Anatomy and Human Biology Department of UWA have discovered a
compound, ―Ang001‖, that inhibits blood vessel formation in vitro and have applied for a
provisional patent to further develop this compound. The tubulin inhibitors, ANG453 and
combretastatin A4 phosphate, have been shown to induce apoptosis of preexisting tumour-
associated endothelial cells and shut down blood flow leading to tumour necrosis and, in the
case of combretastatin, completely eradicated one tumour (Yano et al., 2006). Other
antivascular agents that show potential in the laboratory include the antibiotic borrelidin, which
works by suppressing new capillary tube formation (Kawamura et al., 2003; Moss et al., 2006)
and inhibitors of bone marrow precursor cells or matrix metalloproteases (Ferrara, 2004b).
B2.6.2 Inhibitors of proangiogenic factors
Neovascularisation is mediated through the secretion of proangiogenic growth factors,
particularly basic fibroblast growth factor (bFGF) and VEGF. Approximately 60% of the 200
different types of human cancers express VEGF (Folkman, 2006a) and, at least in some
tumours, overexpression of VEGF corresponds to a poor prognosis (Ferrara, 2004a). VEGF is
also thought to be responsible for the hyperpermeability of tumour blood vessels to plasma and
plasma proteins that characterises pathological angiogenesis (Satchi-Fainaro et al., 2005). It is
also associated with increased invasiveness and recurrent disease and foetal mice with only a
single allele of VEGF-A die before birth (Thornton et al., 2006). According to Ferrara (2004a;
2004b), tumour-expressed VEGF is a very attractive target for anticancer therapy because of its
central role in promoting many cancers and because its activity is at the endothelial cell level,
meaning tumour penetration is not so important for VEGF inhibitors compared to the
conventional, generally more nonselectively toxic, agents that target the tumour cells
themselves. Penetration is a major problem for conventional anticancer therapies because of the

~ Appendix B ~ A41
elevated interstitial pressure of most tumours due to leakage of plasma proteins from the
vasculature and the convoluted nature of the tumour vasculature itself, which can be difficult
for blood to navigate (Ferrara, 2004a; Thornton et al., 2006). Furthermore, when used in
conjunction with conventional anticancer treatments, agents that inhibit tumour angiogenesis
enhance the efficacy of chemotherapy and radiotherapy. This is partly because, not only does
VEGF exacerbate the high tumour interstitial pressure, but it also protects tumour cells against
the apoptosis that is normally induced by conventional therapies (Ferrara, 2004a). Therefore, it
might be expected that maximal punch could be achieved by combining standard anticancer
treatments with drugs that target VEGF or its receptors (Ferrara, 2004a). Understanding the
role of VEGF in tumour angiogenesis has led to the development of agents that specifically
disrupt angiogenesis. Three antiVEGF inhibitors FDA approved for treatment of solid tumours
are the humanised monoclonal antibody bevacizumab, which binds VEGFR (Avastin®)
(Ferrara, 2004a, 2004b; Thornton et al., 2006), and the small molecule RTK inhibitors sunitinib
and sorafenib (Herbst, 2006; Vokes et al., 2006; Sledge et al., 2006). In addition, according to
Folkman (2006), erlotinib (Tarceva®) may be an EGF-specific RTK, but its main anticancer
activity is to block VEGF and two other angiogenic proteins (bFGF and TGF-α).
Caplostatin, a nontoxic synthetic analogue of fumagillin (derived from the fungus Aspergillus
fumigatus fresnius ) conjugated to a water-soluble N-(2-hydroxypropyl) methacrylamide
(HPMA) copolymer, is the most broad-spectrum angiogenesis inhibitor known (Folkman,
2006a). It has been shown that caplostatin (and also fumagillin and angiostatin) antagonizes
angiogenesis by inhibiting the vascular hyperpermeability effects of VEGF, histamine and
platelet-activating factor (PAF) as well as VEGF-induced endothelial cell migration. It does so
partly by inhibiting VEGF-induced phosphorylation of VEGFR(-2), calcium influx and
activation of the RhoA protein (part of the Ras superfamily of proteins involved in the

A42 ~ Appendix B ~
regulation and timing of cell division) in endothelial cells. Furthermore, while caplostatin
interferes with endothelial function, it does not affect their structure, nor does it inhibit the
proliferation of any other cell type, including tumour cells (Satchi-Fainaro et al., 2005). Such
complete specificity is a useful characteristic for any drug candidate.
B2.6.3 Antiangiogenic factors
It is thought that primary tumours sometimes synthesise and release antiangiogenic proteins
to suppress the growth of remote metastases, resulting in so-called ―tumour dormancy‖.
This might help explain why when certain primary tumours are removed, rapid progression
of metastases often occurs (O'Reilly et al., 1994; Beecken et al., 2006). Endogenous
angiogenesis inhibitors, therefore, act as tumour repressor proteins, much like p53, except
that endogenous angiogenesis inhibitors generally do not affect tumour cell proliferation
(Folkman, 2006a). Such endogenous angiogenesis inhibitors represent a potential new class
of specific anticancer agents, having a lower risk of drug resistance and relatively less
toxicity than conventional chemotherapeutics (Beecken et al., 2006). So far, numerous
endogenous inhibitors of angiogenesis have been identified, including the human plasma
protein β2–glycoprotein-I (β2gpI, apolipoprotein H) (Beecken et al., 2006), the serpin
antithrombin (O'Reilly et al., 1999) and angiostatin (O'Reilly et al., 1994) and endostatin
(O'Reilly et al., 1997). Several of these endogenous angiogenesis inhibitors, including
endostatin, interferon-β, 2-methoxyestradiol, tetrahydrocortisol and thrombospondin-1 (and
-2) have made it to Phase II or III clinical trials, but none have been FDA-approved for
public use although endostatin has been approved for use in China since 2005 (Folkman,
2006a; Folkman, 2006b; Hee Sun et al., 2010).
However, the consequences of antiangiogenic therapy seem to be short-lived, as withdrawal
from the treatment induces rapid regrowth of tumour vessels and a subsequent relapse of

~ Appendix B ~ A43
tumour growth (Loges et al., 2010). Hence, antiangiogenesis therapy is currently very
fashionable, but due to the complex mechanisms that regulate tumour angiogenesis,
monotherapy with most antivascular agents will probably not be enough to control cancer long-
term. However, when combined with another anticancer strategy, such as targeting the tumour
with other drugs or surgery, preventing angiogenesis or attacking the existing blood supply of a
tumour represents a powerful new weapon against cancer (Yano et al., 2006) that has now
become routine oncological practice (Nieder et al., 2006).
B2.7 Drugs that target DNA repair mechanisms
A major problem with cytotoxic drugs that target DNA synthesis (see section B1.1) or integrity
(see section B1.2) (as well as ionising radiotherapy) is that they have been shown to induce
secondary cancers several years after initial exposure. This is due to their potential to induce
DNA damage in normal cells, which do not have the same ability to recognise damage and
initiate DNA repair that cancer cells generally have. Research into the possibility of using
inhibitors of DNA repair mechanisms in combination with chemotherapy to selectively target
tumours and enhance the efficacy of current therapies is consequently undermined by the
enhanced risk of inducing secondary cancers. While convincing evidence exists supporting the
validity of DNA repair proteins as viable drug targets, as yet no anticancer drugs have been
developed using this idea (Madhusudan & Hickson, 2005; Sánchez-Pérez, 2006).
As many mutations are necessary to give rise to a tumour, it is probably not surprising that
almost all cancer cells are abnormally mutable, having acquired one or more defects in their
metabolism of DNA. This genetic instability means the cell acquires the complex set of
changes necessary to become cancerous more quickly than it would otherwise do so. Besides
its action promoting cell proliferation, differentiation and survival, the bcr-abl fused protein of

A44 ~ Appendix B ~
the Philadelphia chromosome also inhibits DNA repair, leading to genomic instability (Laurent
et al., 2001). Therefore, it might be expected that imatinib could help manage this potential for
additional carcinogenesis. However, patients who had already progressed into acute myeloid
leukemia (where genetic instability had already set in) showed a response, but then relapsed-
the cancer cells were able to evolve a resistance to the drug (Alberts, 2002).

~ Appendix C ~ A45
Appendix C. MTT-formazan Solubilisation
The solubilisation of MTT-formazan crystals is a key step contributing to the efficiency of
the MTT assay. Thus, it was important to ensure solubilisation was complete. Others (e.g.
Abe & Matsuki, 2000; Wang et al., 2006) have used different extraction buffers and this
was the first parameter to be studied, albeit only in MDA-MB-468 and MCF7 cells. The
extraction buffers tested were:
A. 10% SDS, 50% isobutanol in 0.01M HCl;
B. 10% SDS, 50% isobutanol in 0.1M HCl;
C. 12% SDS, 40% DMF (dimethyl formamide), pH 4.7;
D. 100% DMSO (dimethyl sulfoxide);
E. 90% DMSO, 10% glycine buffer (0.1M glycine, 0.1M NaCl, pH 10.5); and
F. 0.1M HCl in anhydrous isopropanol.
After incubation with MTT, 200 L of one of these buffers was added and plates incubated
for 1 h and 2 h before absorbances were read at 595nm. From these data an extraction
buffer was chosen for use in subsequent experiments. The effectiveness of various
extraction buffers in solubilising formazan crystals was compared for MDA-MB-468 cells
and MCF7 cells after 1 h and 2 h incubation. Qualitative assessment was combined with
OD595 readings to ascertain successful extraction of formazan. Figure C1 depicts the
absorbance levels obtained after formazan crystals were solubilised with various extraction
buffers.

A46 ~ Appendix C ~
Figure C1 Effect of different MTT extraction buffers on absorbance.
Breast cancer cells were seeded at various densities and incubated under standard
conditions for 72 h. After 2 h incubation with 10 L of a 5 mg/mL MTT solution, 200 L
of an extraction buffer A (■), B (▲), C (●), D (■), E (▲) or F (●) was added. Cells were
further incubated for 1 or 2 h before the absorbance at 595nm was read. The results
represent the means (± SE where applicable) of 2 or 3 separate experiments, each
containing quadruplicate wells.
As can be seen from Figure C.1, for both cell lines tested, the highest absorbance values
were constantly obtained by using extraction buffer B (10% SDS, 50% isobutanol in 0.1M
HCl). Based on a seeding density of 10,000 cells per well, there was no significant
difference between absorbance values obtained using this extraction buffer to solubilise the
formazan product when incubated for 1 h compared to 2 h for either cell line tested. Using
this extraction buffer, a seeding density of 10,000 cells per well was shown to result in
absorbance values of around 1.0 after 72 h incubation for both cell lines.

~ Appendix C ~ A47
Various extraction buffers were compared for their effectiveness to solubilise formazan
crystals (Fig. C.1). It was found that the original extraction buffer used in this laboratory,
B: 10% SDS, 50% isobutanol in 0.1M HCl, (Kicic et al., 2002) was the best under the
conditions used, as determined by the least turbidity, the ―neatest‖ curves and the highest
absorbance values. Extraction buffer B was also initially chosen as it was cheaper than
DMSO.
However, when the MTT assay was re-examined later in the project, it was found that the
method of Fox et al. (2005) was more efficient than that of Kicic et al. (2002) (see Section
3.2.2). One of the changes involved in the improved method was a switch from extraction
buffer B to DMSO. Significantly, after assessment of many formazan solvent systems, DMSO
was also the solubilising agent adopted by the NCI anticancer drug screening programme
(Alley et al., 1988) and others after optimisation experiments showed formazan crystals were
completely dissolved in DMSO within 2 min (Li & Song, 2007).
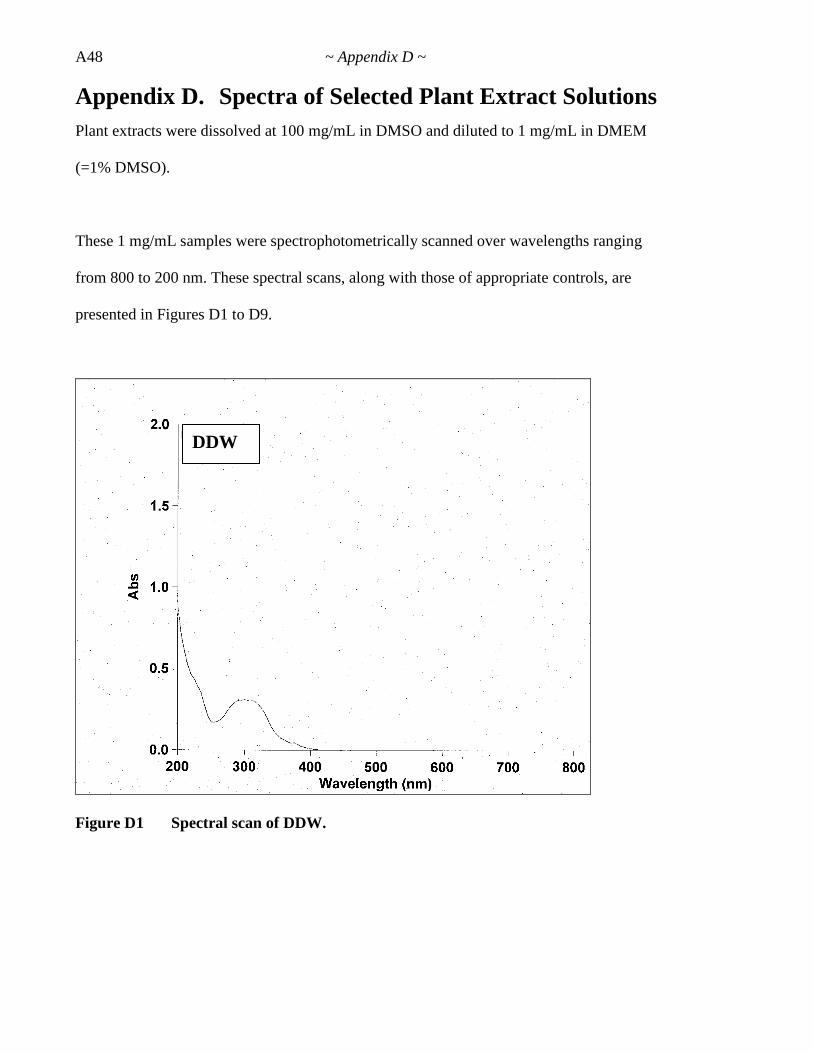
A48 ~ Appendix D ~
Appendix D. Spectra of Selected Plant Extract Solutions
Plant extracts were dissolved at 100 mg/mL in DMSO and diluted to 1 mg/mL in DMEM
(=1% DMSO).
These 1 mg/mL samples were spectrophotometrically scanned over wavelengths ranging
from 800 to 200 nm. These spectral scans, along with those of appropriate controls, are
presented in Figures D1 to D9.
Figure D1 Spectral scan of DDW.
DDW

~ Appendix D ~ A49
Figure D2 Spectral scan of DMEM.
Figure D3 Spectral scan of 1% DMSO.
DMEM
1% DMSO
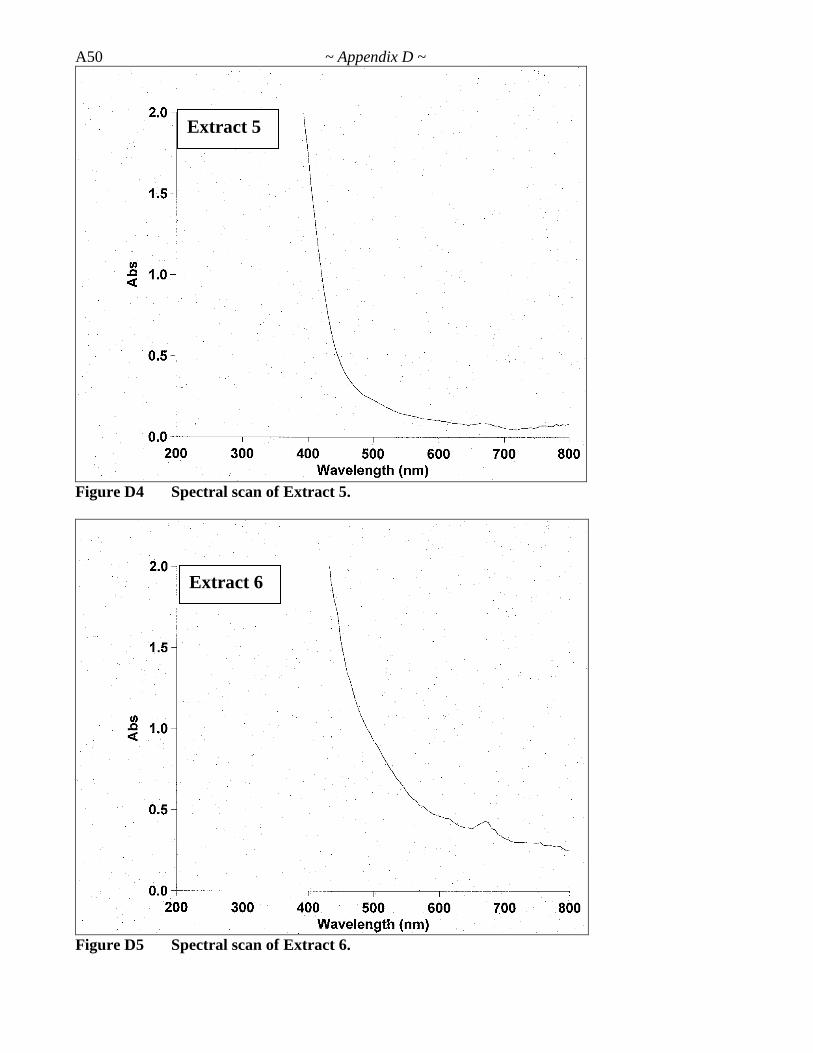
A50 ~ Appendix D ~
Figure D4 Spectral scan of Extract 5.
Figure D5 Spectral scan of Extract 6.
Extract 5
Extract 6

~ Appendix D ~ A51
Figure D6 Spectral scan of Extract 8.
Figure D7 Spectral scan of Extract 21.
Extract 21
Extract 8

A52 ~ Appendix D ~
Figure D8 Spectral scan of Extract 27.
Figure D9 Spectral scan of Extract 28.
Extract 28
Extract 27

~ Appendix E ~ A53
Appendix E. Data for Typical Dose-Response Curves
Figures E1-E3 are the nonlinear regression curves fitted to dose-response data of the most
promising crude methanolic plant extracts as described in Chapter 4 (Figs. 4.5-4.7). The
associated IC50 and r2 values are presented in Table E1.
Table E1 IC50 Values Calculated for Cell Line-Extract Pairs (4P Model).
Caco-2
Extract Code
IC50
(g/mL)
IC50 Range (95% CI)
(g/mL)
Hillslope r2
1 489.7 6.29 - 38129 -7.65 0.972
2 622.1 - -9.36 0.977
3 201.1 137.2 - 294.8 -3.34 0.984
5 218.1 10-9 - 1012 -12.0 1.000
6 465.8 235.2 - 922.2 -9.17 0.981
8 482.3 - -13.8 0.994
11 1166 - -1.83 0.700
12 48.3 1.04 to 225 -0.985 0.776
19 168.1 158.0 -178.7 -7.79 0.995
21 131.5 122.6 - 141.1 -8.48 0.990
27 353.1 282.2 - 441.8 -5.01 0.986
28 106 - -0.326 0.998
A 550.0 359.5 - 841.5 -8.53 0.955
B 153758 153758 -1.00 0.863
C 1962 0.027 -108 -0.718 0.987
D 646.4 296.3 to 1411 -2.29 0.998
MM253
Extract Code
IC50
(g/mL)
IC50 Range (95% CI)
(g/mL)
Hillslope r2
1 901.8 - 35.0 0.910
2 398.1 53.9 - 2939 4.68 0.994
3 45.4 41.9 - 49.2 -3.84 0.999
5 435.7 - -13.3 0.987
6 168.8 80.6 - 353.3 -1.84 0.978
8 565.0 1.09 - 292824 -2.73 0.983
11 548.1 - -10.5 0.960
12 612.5 398.5 - 941.5 -4.70 0.980
19 210.7 177.0 - 250.8 -3.86 0.992
21 2042 105 – 1011 -0.763 0.970
27 263.5 162.9 - 426.1 -4.11 0.970
28 125.4 97.3 -161.7 -3.88 0.956
A 265.8 121.6 - 581.0 -4.90 0.979
B 325.9 325.9 -4.90 0.988
C 94373 - -1.01 0.984
D 515.3 0.05 - 106 -24.0 0.932

A54 ~ Appendix E ~
1.0 1.5 2.0 2.5 3.00
25
50
75
100
125
150Extract 1
Log of Concentration (g/mL)
% C
on
tro
l
1.0 1.5 2.0 2.5 3.00
25
50
75
100
125
150
Extract 2
Log of Concentration (g/mL)
% C
on
tro
l
1.0 1.5 2.0 2.5 3.00
25
50
75
100
125
150
Extract 3
Log of Concentration (g/mL)
% C
on
tro
l
1.0 1.5 2.0 2.5 3.00
25
50
75
100
125
150Extract 5
Log of Concentration (g/mL)
% C
on
tro
l
1.0 1.5 2.0 2.5 3.00
25
50
75
100
125
150Extract 6
Log of Concentration (g/mL)
% C
on
tro
l
1.0 1.5 2.0 2.5 3.00
25
50
75
100
125
150 Extract 8
Log of Concentration (g/mL)
% C
on
tro
l
1.0 1.5 2.0 2.5 3.00
25
50
75
100
125
150 Extract 11
Log of Concentration (g/mL)
% C
on
tro
l
1.0 1.5 2.0 2.5 3.00
25
50
75
100
125
150 Extract 12
Log of Concentration (g/mL)
% C
on
tro
l
Figure E1 Nonlinear regressions of promising Batch 1 extracts.
Caco-2 (●) and MM253 (▲) cells were exposed to extracts over a range of concentrations
for 48 h before being subjected to the MTT assay. Dose values of representative curves
(Fig. 4.5) were transformed into log10 values and curves were fitted using GraphPad Prism
nonlinear regression dose-response (variable slope) according to the 4P method for each
extract-cell line combination.

~ Appendix E ~ A55
1.0 1.5 2.0 2.5 3.00
25
50
75
100
125
150 Extract 19
Log of Concentration (g/mL)
% C
on
tro
l
1.0 1.5 2.0 2.5 3.00
25
50
75
100
125
150 Extract 21
Log of Concentration (g/mL)
% C
on
tro
l
1.0 1.5 2.0 2.5 3.00
25
50
75
100
125
150 Extract 27
Log of Concentration (g/mL)
% C
on
tro
l
1.0 1.5 2.0 2.5 3.00
25
50
75
100
125
150 Extract 28
Log of Concentration (g/mL)
% C
on
tro
lFigure E2 Nonlinear regressions of promising Batch 2 extracts.
Caco-2 (●) and MM253 (▲) cells were exposed to extracts over a range of concentrations
for 48 h before being subjected to the MTT assay. Dose values of representative curves
(Fig. 4.6) were transformed into log10 values and curves were fitted using GraphPad Prism
nonlinear regression dose-response (variable slope) according to the 4P method for each
extract-cell line combination.

A56 ~ Appendix E ~
1.0 1.5 2.0 2.5 3.00
25
50
75
100
125
150 Extract A
Log of Concentration (g/mL)
% C
on
tro
l
1.0 1.5 2.0 2.5 3.00
25
50
75
100
125
150 Extract B
Log of Concentration (g/mL)
% C
on
tro
l
1.0 1.5 2.0 2.5 3.00
25
50
75
100
125
150 Extract C
Log of Concentration (g/mL)
% C
on
tro
l
1.0 1.5 2.0 2.5 3.00
25
50
75
100
125
150 Extract D
Log of Concentration (g/mL)
% C
on
tro
l
Figure E3 Nonlinear regressions of promising Batch 3 extracts.
Caco-2 (●) and MM253 (▲) cells were exposed to extracts over a range of concentrations
for 48 h before being subjected to the MTT assay. Dose values of representative curves
(Fig. 4.7) were transformed into log10 values and curves were fitted using GraphPad Prism
nonlinear regression dose-response (variable slope) according to the 4P method for each
extract-cell line combination.

~ Appendix F ~ A57
Appendix F. Nonlinear Regressions of Figure 4.8.
Figures F1-4 are the nonlinear regression curves fitted to dose-response data of the six
most active crude methanolic plant extracts as described in Chapter 4 (Fig. 4.8). The
curve fits of the presented figures are dependent upon which model was used to set the
top and bottom parameters.

A58 ~ Appendix F ~
0.0 0.5 1.0 1.5 2.0 2.5 3.00
25
50
75
100
125
MDA-MB-468
Log of Concentration (g/mL)
% C
on
tro
l
0.0 0.5 1.0 1.5 2.0 2.5 3.00
25
50
75
100
125MCF7
Log of Concentration (g/mL)
% C
on
tro
l
0.0 0.5 1.0 1.5 2.0 2.5 3.00
25
50
75
100
125Caco-2
Log of Concentration (g/mL)
% C
on
tro
l
0.0 0.5 1.0 1.5 2.0 2.5 3.00
25
50
75
100
125
MM253
Log of Concentration (g/mL)
% C
on
tro
l
0.0 0.5 1.0 1.5 2.0 2.5 3.00
25
50
75
100
125
A549
Log of Concentration (g/mL)
% C
on
tro
l
0.0 0.5 1.0 1.5 2.0 2.5 3.00
25
50
75
100
125
PC3
Log of Concentration (g/mL)
% C
on
tro
l
0.0 0.5 1.0 1.5 2.0 2.5 3.00
25
50
75
100
125
DU 145
Log of Concentration (g/mL)
% C
on
tro
l
0.0 0.5 1.0 1.5 2.0 2.5 3.00
25
50
75
100
125MRC5
Log of Concentration (g/mL)
% C
on
tro
l
Figure F1 Nonlinear regressions of 6 most active extracts using the 4Parameter
(4P) model.
Cell lines were exposed to 6 different extracts, 5 (▲), 6 (▲), 8 (▲), 21 (■), 27 (■), 28
(■), over a range of concentrations for 48 h before being subjected to the MTT assay.
Dose values (Fig 4.8) were transformed into log10 values and curves were fitted using
GraphPad Prism nonlinear regression dose-response (variable slope) with no constraints
set.

~ Appendix F ~ A59
0.0 0.5 1.0 1.5 2.0 2.5 3.00
25
50
75
100
125
MDA-MB-468
Log of Concentration (g/mL)
% C
on
tro
l
0.0 0.5 1.0 1.5 2.0 2.5 3.00
25
50
75
100
125MCF7
Log of Concentration (g/mL)
% C
on
tro
l0.0 0.5 1.0 1.5 2.0 2.5 3.0
0
25
50
75
100
125Caco-2
Log of Concentration (g/mL)
% C
on
tro
l
0.0 0.5 1.0 1.5 2.0 2.5 3.00
25
50
75
100
125
MM253
Log of Concentration (g/mL)%
Co
ntr
ol
0.0 0.5 1.0 1.5 2.0 2.5 3.00
25
50
75
100
125
A549
Log of Concentration (g/mL)
% C
on
tro
l
0.0 0.5 1.0 1.5 2.0 2.5 3.00
25
50
75
100
125
PC3
Log of Concentration (g/mL)
% C
on
tro
l
0.0 0.5 1.0 1.5 2.0 2.5 3.00
25
50
75
100
125
DU 145
Log of Concentration (g/mL)
% C
on
tro
l
0.0 0.5 1.0 1.5 2.0 2.5 3.00
25
50
75
100
125MRC5
Log of Concentration (g/mL)
% C
on
tro
l
Figure F2 Nonlinear regressions of 6 most active extracts using the Top- and
Bottom-fixed (TB) model.
Cell lines were exposed to 6 different extracts, 5 (▲), 6 (▲), 8 (▲), 21 (■), 27 (■), 28
(■), over a range of concentrations for 48 h before being subjected to the MTT assay.
Dose values (Fig 4.8) were transformed into log10 values and curves were fitted using
GraphPad Prism nonlinear regression dose-response (variable slope) with the top
parameter set at 100% and the bottom parameter fixed at 0%.
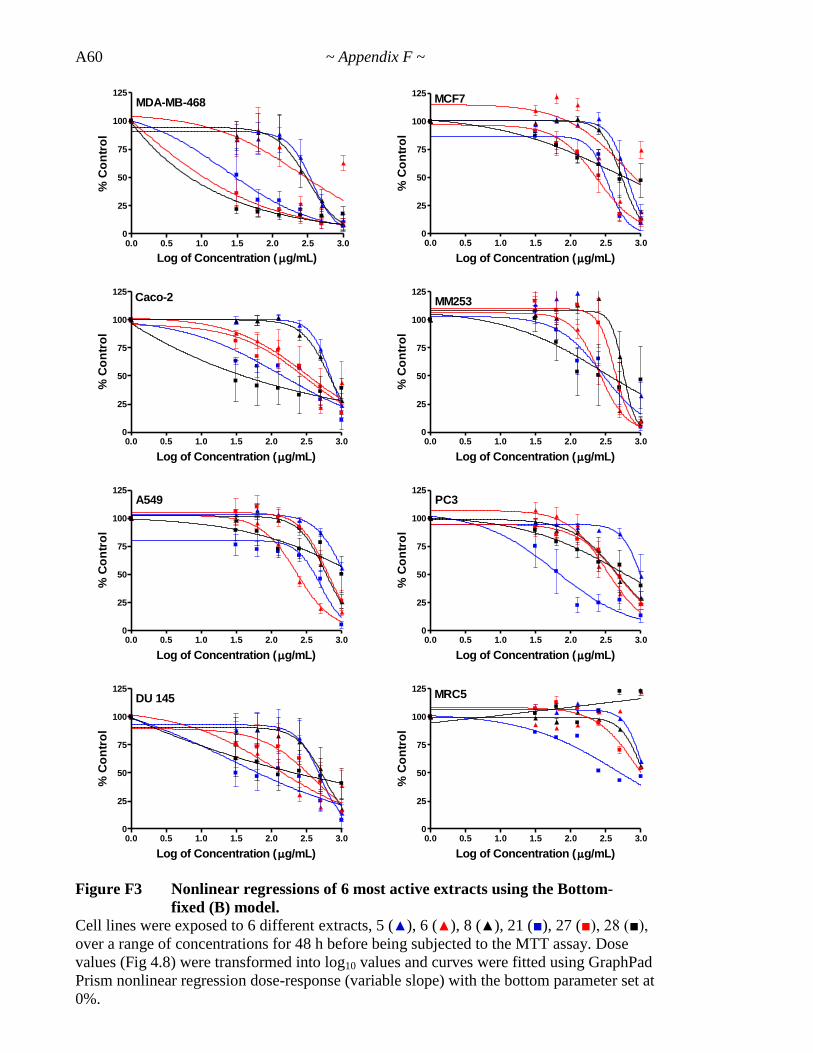
A60 ~ Appendix F ~
0.0 0.5 1.0 1.5 2.0 2.5 3.00
25
50
75
100
125
MDA-MB-468
Log of Concentration ( g/mL)
% C
on
tro
l
0.0 0.5 1.0 1.5 2.0 2.5 3.00
25
50
75
100
125MCF7
Log of Concentration (g/mL)
% C
on
tro
l
0.0 0.5 1.0 1.5 2.0 2.5 3.00
25
50
75
100
125Caco-2
Log of Concentration (g/mL)
% C
on
tro
l
0.0 0.5 1.0 1.5 2.0 2.5 3.00
25
50
75
100
125
MM253
Log of Concentration (g/mL)
% C
on
tro
l
0.0 0.5 1.0 1.5 2.0 2.5 3.00
25
50
75
100
125
A549
Log of Concentration (g/mL)
% C
on
tro
l
0.0 0.5 1.0 1.5 2.0 2.5 3.00
25
50
75
100
125
PC3
Log of Concentration (g/mL)
% C
on
tro
l
0.0 0.5 1.0 1.5 2.0 2.5 3.00
25
50
75
100
125
DU 145
Log of Concentration (g/mL)
% C
on
tro
l
0.0 0.5 1.0 1.5 2.0 2.5 3.00
25
50
75
100
125MRC5
Log of Concentration (g/mL)
% C
on
tro
l
Figure F3 Nonlinear regressions of 6 most active extracts using the Bottom-
fixed (B) model.
Cell lines were exposed to 6 different extracts, 5 (▲), 6 (▲), 8 (▲), 21 (■), 27 (■), 28 (■),
over a range of concentrations for 48 h before being subjected to the MTT assay. Dose
values (Fig 4.8) were transformed into log10 values and curves were fitted using GraphPad
Prism nonlinear regression dose-response (variable slope) with the bottom parameter set at
0%.

~ Appendix F ~ A61
0.0 0.5 1.0 1.5 2.0 2.5 3.00
25
50
75
100
125
MDA-MB-468
Log of Concentration ( g/mL)
% C
on
tro
l
0.0 0.5 1.0 1.5 2.0 2.5 3.00
25
50
75
100
125MCF7
Log of Concentration (g/mL)
% C
on
tro
l
0.0 0.5 1.0 1.5 2.0 2.5 3.00
25
50
75
100
125Caco-2
Log of Concentration (g/mL)
% C
on
tro
l
0.0 0.5 1.0 1.5 2.0 2.5 3.00
25
50
75
100
125
MM253
Log of Concentration (g/mL)%
Co
ntr
ol
0.0 0.5 1.0 1.5 2.0 2.5 3.00
25
50
75
100
125
A549
Log of Concentration (g/mL)
% C
on
tro
l
0.0 0.5 1.0 1.5 2.0 2.5 3.00
25
50
75
100
125
PC3
Log of Concentration (g/mL)
% C
on
tro
l
0.0 0.5 1.0 1.5 2.0 2.5 3.00
25
50
75
100
125
DU 145
Log of Concentration (g/mL)
% C
on
tro
l
0.0 0.5 1.0 1.5 2.0 2.5 3.00
25
50
75
100
125MRC5
Log of Concentration (g/mL)
% C
on
tro
l
Figure F4 Nonlinear regressions of 6 most active extracts using the Top-
fixed (T) model. Cell lines were exposed to 6 different extracts, 5 (▲), 6 (▲), 8 (▲), 21 (■), 27 (■), 28 (■),
over a range of concentrations for 48 h before being subjected to the MTT assay. Dose
values (Fig 4.8) were transformed into log10 values and curves were fitted using GraphPad
Prism nonlinear regression dose-response (variable slope) with the top parameter set at
100%.

A62 ~ Appendix F ~
Appendix G. HPLC-UV Data
HPLC-UV chromatograms are provided for each methanol and ethyl acetate sample. The
first page of a representative report (for EA3 at 350 nm) is presented as Figure G1. For
brevity‘s sake, the remainder of the table listing the retention times, heights and areas of
major chromatographic peaks are not presented. To keep it simple, the UV spectra are not
shown either. It must be noted that the named compounds are incorrect for every
chromatogram, due to an operator error.
To facilitate comparisons between samples, the chromatograms for the methanol fractions
of each sample are presented in Figures G2 (254 nm) and G3 (350 nm). Similarly,
chromatograms for ethyl acetate fractions of each sample are shown in Figures G4
(254 nm) and G5 (350 nm). UV detection at a wavelength of 254 nm was used for all
phenolic compounds, while 350 nm was used for flavonoids.
To highlight the main differences between samples, the major peaks for these
chromatograms are summarised in Tables G1 (methanol) and G2 (ethyl acetate). Values are
colour-coded as in Chapter 5 to indicate samples that are from the same plant species.
Thus,
Sample 1 is from Euphorbia drummondii;
Sample 2 is from Eremophila sturtii;
Samples 3 and 4 are from Eremophila duttonii; and
Samples 5 and 6 are from Acacia tetragonophylla.

~ Appendix G ~ A63
Figure G1 Representative HPLC-UV chromatogram report.
The first page of the HPLC-UV chromatogram report for Sample 3 (EA3) at 350 nm.

A64 ~ Appendix G ~

~ Appendix G ~ A65
Figure G2 HPLC-UV chromatograms for methanol samples (254 nm).

A66 ~ Appendix G ~
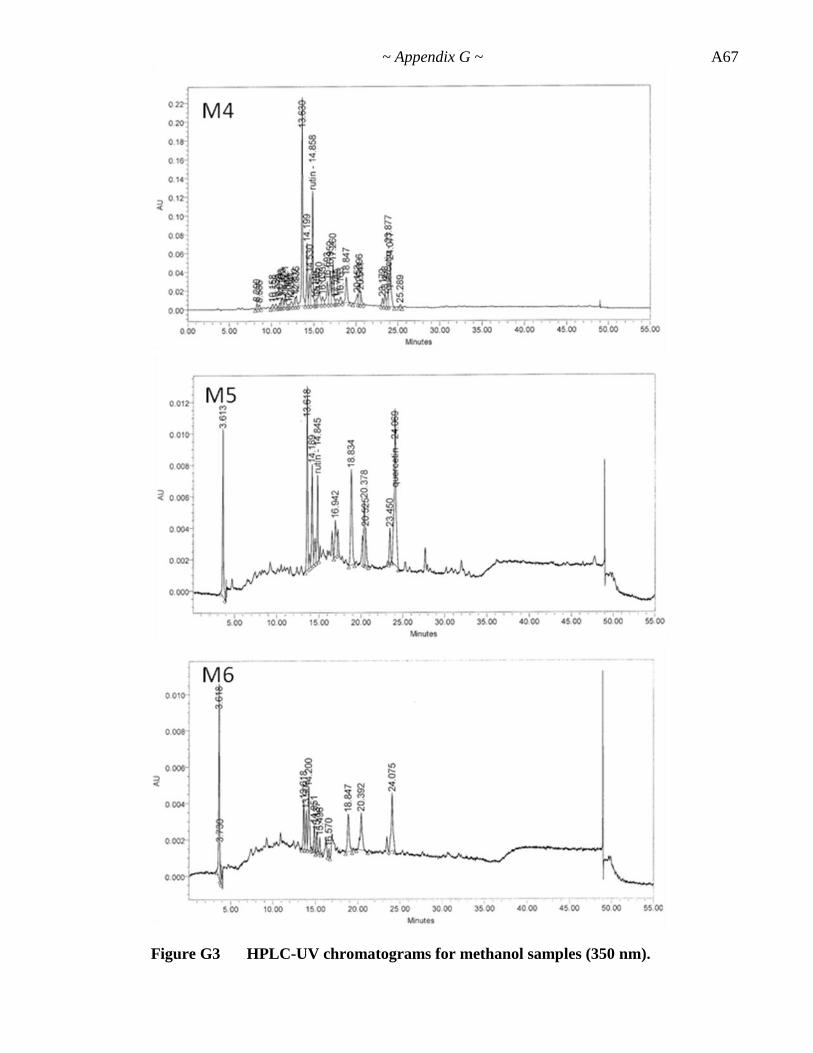
~ Appendix G ~ A67
Figure G3 HPLC-UV chromatograms for methanol samples (350 nm).
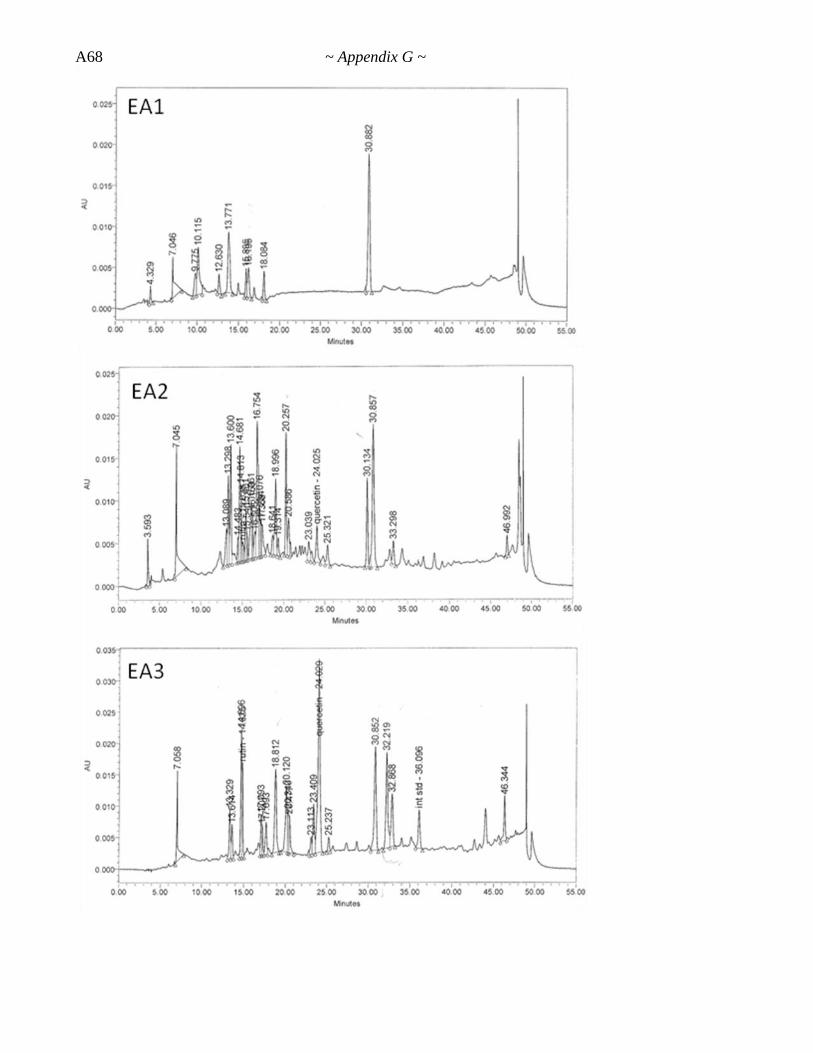
A68 ~ Appendix G ~

~ Appendix G ~ A69
Figure G4 HPLC-UV chromatograms for ethyl acetate samples (254 nm).

A70 ~ Appendix G ~

~ Appendix G ~
A71
Figure G5 HPLC-UV chromatograms for ethyl acetate samples (350 nm).

A72
Table G1 Major Peaks for Methanol Fractions of Samples 1-6.
MeOH at 254 nm
RT (min) 3.62 10.2 12.4 12.7 13.6 13.9 14.2 14.9 16 16.2 16.9 16.9 18.1 18.8 19.1 20.3 24.1 32.3 32.9
% area
S1
20
6.91
15.1
0.69
S2
4.79
3.58 4.15
5.35
1.23
S3
12.9
5.07 10.6
3.39
4.88 3.05 1.87 2.71
S4
14.7
6.32 10.9
3.95
5.24 3.33 2.97 3
S5 14.5
1.94
S6 13.5
1.94
correction for standard S1
20.14
6.96
15.20
S2
4.85
3.62 4.20
5.42 S3
13.21
5.21 10.85
3.48
5.02 3.13 1.92
S4
15.12
6.52 11.28
4.07
5.40 3.43 3.06 S5 14.79
S6 13.75
MeOH at 350 nm S1
18.1 4.98
11.2 11.8
9.79
S2
18.4
30.2
14.8
7.04
3.4 5.55 S3
22.7
2.92 14.2
3.8
6.43
10
S4
21.6
6.94 12.9
4.59
4.34
7.58 S5
14.9
9.42 7.65
5.03
13.2
24.5
S6
7.21
12.4 3.11
10.3
16.2

A73
A73
Table G2 Major Peaks for Ethyl Acetate Fractions of Samples 1-6.
EtOAc at 254 nm
RT (min) 7.05 9.78 10.1 13.3 13.6 14.7 14.8 15.9 16.2 18.1 16.8 17.4 19 20.1 20.5 20.3 23.4 24 30.1 32.2 36.1
% area
S1 10.9 5.38 14.4 4.79 16.2
4.04 6.57 4.73 10
5.03
5.83
2.71 4.94
32.2
S2 6.91
4.79 6.07 5.81 2.8
10
5.03
5.83
2.71 4.94
11.7
S3 4.26
3 2.04 6.68 4
7.44
19.4
9.09 3.32 10.1
S4 6.32
3.21 2.21 6.82 4.03
6.28
19.8
9.23 2.89 10.9
S5 27.5
7.06
5.49
16.2
5.29
41.2
S6 30.6
2.23
18.9 6.28
60.9
correction for standard S1 16.03 7.93 21.23 7.06 23.87
5.96 9.69 6.97 14.77
7.42
8.60
4.00 7.28
S2 7.82
5.42 6.87 6.58 3.17
11.35
5.70
6.60
3.07 5.59 S3 4.74
3.34 2.27 7.43 4.45
8.28
21.61
10.11 3.69
S4 7.10
3.60 2.48 7.66 4.53
7.05
22.19
10.36 3.25 S5 46.73
12.01
9.34
27.57
9.00
S6 78.26
5.71
48.44 16.08
EtOAc at 350 nm S1
19
9.09 21.9 28.7 21.3
S2
7.27 8.72 6.34
13.4 3.71 6.77
8.03 1.16 3.38 5.43 S3
4.58 2.94 8.57 5.11
16.8 4.76 6.87
8.36 30.7
S4
5.47 3.73 9.56 5.77
14.7 4.08 8.13
5.44 32.9 S5
5.57
21.4
17.6 7.82 47.7
S6*
24.1
18.9
57 *: Ethyl acetate of S6 contains very low flavonoids. The peaks recorded here are very small.
A74 ~ Appendix H ~
Appendix H. GC-MS Report
07D450
S Wang
(08) 9222 3040
4th
Sept. 2008
Faculty of Physics and Life Science
The University of WA
Nedlands, WA 6009
Attention to Ms Donna Savigni
REPORT ON THE ANALYSIS OF FOUR PLANT SAMPLES
RECEIVED ON JUNE 2008.
Sample History:
Four plant samples of plant were received for preparation of extract, GC-MS analysis for
volatiles, HPLC for chemical profilic analysis and LC-MS for identification of non-
volatiles.
Test Method:
In house GC-MS method
Result of Examination:
Samples were extracted with a solvent mixture (hexane: ether 1:1). After filtration of
samples, organic solution was concentrated under nitrogen to a small volume of solution.
Hexane was added to dissolve residue and the solution was analysed using GC-MS.
Volatiles were identified based on their mass spectrometry comparison to standard
compounds in GC-MS library.
The results were shown in Table 1, 2 and 3. There are a few points to be noted.
1) The further confirmation for big peaks will be done by co-injections of standards
with samples once the standards have been purchased.
2) The percentages of sample 4 are expressed as area percentage. The area percent for
other samples were accidentally deleted during processing of gc-ms computer.
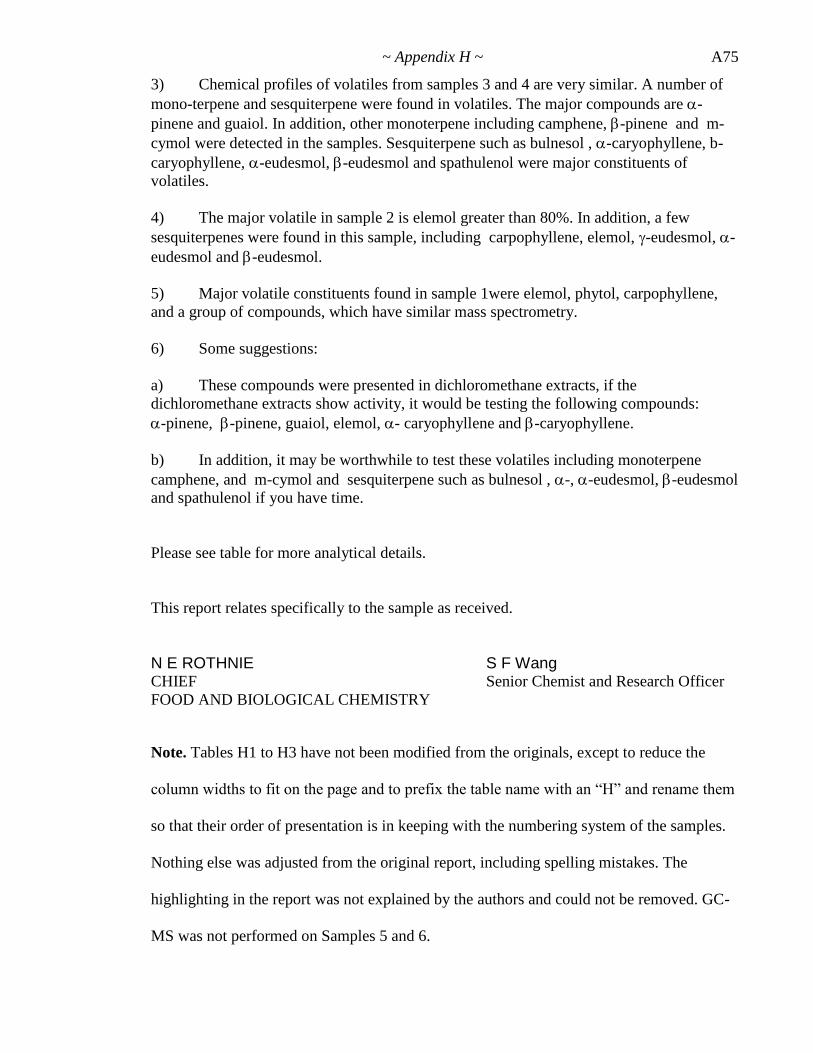
~ Appendix H ~
A75
3) Chemical profiles of volatiles from samples 3 and 4 are very similar. A number of
mono-terpene and sesquiterpene were found in volatiles. The major compounds are -
pinene and guaiol. In addition, other monoterpene including camphene, -pinene and m-
cymol were detected in the samples. Sesquiterpene such as bulnesol , -caryophyllene, b-
caryophyllene, -eudesmol, -eudesmol and spathulenol were major constituents of
volatiles.
4) The major volatile in sample 2 is elemol greater than 80%. In addition, a few
sesquiterpenes were found in this sample, including carpophyllene, elemol, -eudesmol, -
eudesmol and -eudesmol.
5) Major volatile constituents found in sample 1were elemol, phytol, carpophyllene,
and a group of compounds, which have similar mass spectrometry.
6) Some suggestions:
a) These compounds were presented in dichloromethane extracts, if the
dichloromethane extracts show activity, it would be testing the following compounds:
-pinene, -pinene, guaiol, elemol, - caryophyllene and -caryophyllene.
b) In addition, it may be worthwhile to test these volatiles including monoterpene
camphene, and m-cymol and sesquiterpene such as bulnesol , -, -eudesmol, -eudesmol
and spathulenol if you have time.
Please see table for more analytical details.
This report relates specifically to the sample as received.
N E ROTHNIE S F Wang CHIEF Senior Chemist and Research Officer
FOOD AND BIOLOGICAL CHEMISTRY
Note. Tables H1 to H3 have not been modified from the originals, except to reduce the
column widths to fit on the page and to prefix the table name with an ―H‖ and rename them
so that their order of presentation is in keeping with the numbering system of the samples.
Nothing else was adjusted from the original report, including spelling mistakes. The
highlighting in the report was not explained by the authors and could not be removed. GC-
MS was not performed on Samples 5 and 6.
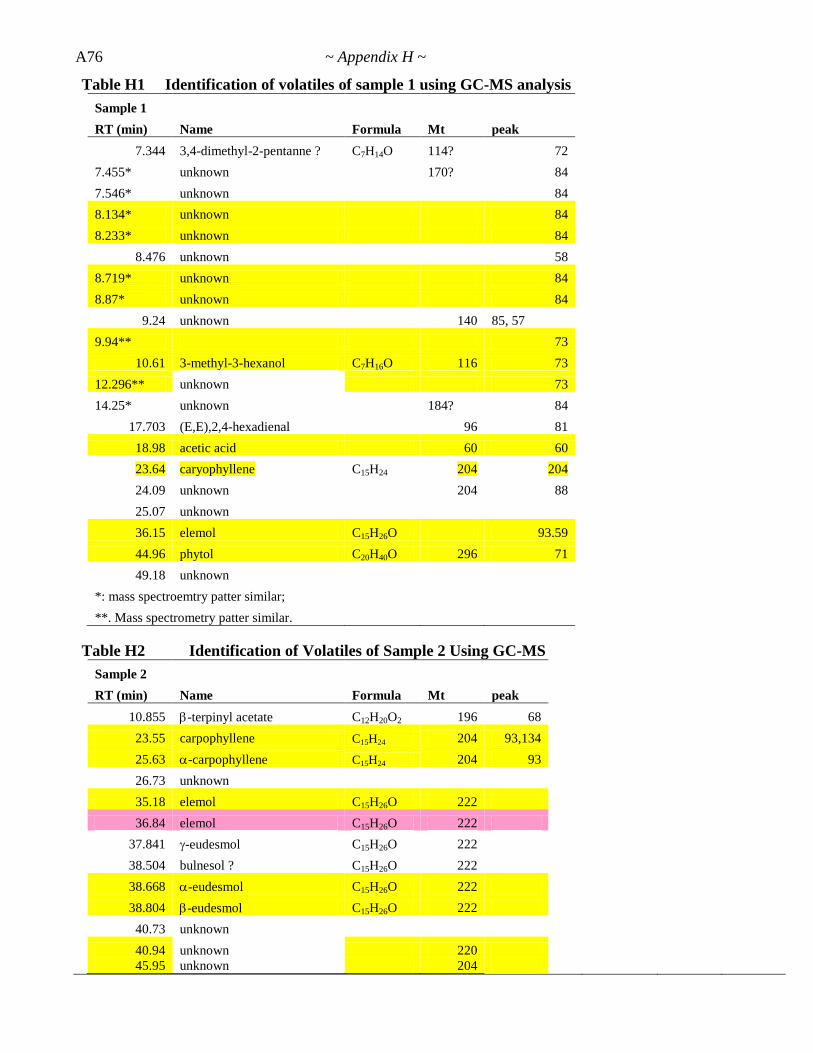
A76 ~ Appendix H ~
Table H1 Identification of volatiles of sample 1 using GC-MS analysis
Sample 1
RT (min) Name Formula Mt peak
7.344 3,4-dimethyl-2-pentanne ? C7H14O 114? 72
7.455* unknown 170? 84
7.546* unknown 84
8.134* unknown 84
8.233* unknown 84
8.476 unknown 58
8.719* unknown 84
8.87* unknown 84
9.24 unknown 140 85, 57
9.94** 73
10.61 3-methyl-3-hexanol C7H16O 116 73
12.296** unknown 73
14.25* unknown 184? 84
17.703 (E,E),2,4-hexadienal 96 81
18.98 acetic acid 60 60
23.64 caryophyllene C15H24 204 204
24.09 unknown 204 88
25.07 unknown
36.15 elemol C15H26O 93.59
44.96 phytol C20H40O 296 71
49.18 unknown
*: mass spectroemtry patter similar;
**. Mass spectrometry patter similar.
Table H2 Identification of Volatiles of Sample 2 Using GC-MS
Sample 2
RT (min) Name Formula Mt peak
10.855 -terpinyl acetate C12H20O2 196 68
23.55 carpophyllene C15H24 204 93,134
25.63 -carpophyllene C15H24 204 93
26.73 unknown
35.18 elemol C15H26O 222
36.84 elemol C15H26O 222
37.841 -eudesmol C15H26O 222
38.504 bulnesol ? C15H26O 222
38.668 -eudesmol C15H26O 222
38.804 -eudesmol C15H26O 222
40.73 unknown
40.94 unknown 220
45.95 unknown 204

~ Appendix H ~
A77
Table H3 Identification of volatiles of Sample 3 and 4 using GC-MS.
Sample 3
Sample
4
RT
(min) Name Formula Mt peak % %
5.4 unnown C10H16 136 93 1.02
5.8 -pinene C10H16 136 93 14.2
6.6 C10H16 136 57 <0.1
6.8 camphene C10H16 136 93 0.3
7.35 3-methyl,2-hexanone C7H14O 114 43 0.2
7.497* unknown 84 <0.1
7.57* unknown 84 <0.1
7.95 -pinene C10H16 136 93 <0.1
8.53 cis-verbenol C10H16O 152 0.1
9.275 -carene C10H16 136 <0.1
9.789 unknown C10H14 136 73 0.1
10.855 -terpinyl acetate C12H20O2 196 68 0.5
12.168 unknown 73 2.1
12.765 cis-ocimene C10H16 136 93 0.1
13.28 m-cymol C10H14 134 119 0.3
18.778 isopropenyl toluene C10H12 132 117 <0.1
19.17 acetic acid 2.4
20.305 copaene C15H24 204 <0.1
21.28 unknown 204 162 0.1
21.473 -gurijunene C15H24 204 204 <0.1
22.375 unknown <0.1
22.638 unknown 204 105, 56 <0.1
23.39 unknown 204 93 <0.1
23.51 caryophyllene C15H24 204 133, 93 0.7
23.67 1H-cyclopropa[a]naphthalene C15H24 204 161, <0.1
23.89 valencene C15H24 204 107 <0.1
24.03 eremophilene C15H24 204 161, <0.1
24.461 C15H24 204 73 <0.1
25.573 -caryophyllene C15H24 204 93 0.8
25.76 -caryophyllene C15H24 204 93 0.4
26.005 related to m-cymol 152 119 0.3
26.35 C15H26O2 238 <0.1
26.466 unknown 0.1
26.721 unknown C15H24 204 161, <0.1
27.06 unknown C15H24O 220 149 0.3
27.41 -elemene C15H24 204 121 0.06
28.145 -cadinene C15H24 204 161 0.08

A78 ~ Appendix H ~
Table H3 (continued) Identification of volatiles of sample 3 and 4 using GC-MS.
Sample
3 sample 4
RT
(min) Name Formula Mt peak % %
28.383 0.1
29.342 unknown 220 94 0.1
29.914 unknown 222 189, 207 <0.1
30.124 calamenene 202 159 0.07
31.075
ethanone,1-(5,6,7,8-tetrahydro-
2,8,9-trimethyl-4H-
cyclohepta[b]furan-5-yl C14H20O2 220 205 <0.1
32.97 dendrolasin C15H22O 218 69,81
33.86 -caryophyllene C15H24O 220 79 0.3
34.199 unknown C15H24O 220 93
34.466 unknown 0.3
35.112
12-oxabicyclo[9.1.0]dodeca-3,7-
dine,1,5,5,8-tetramethyl-[1R-
(1R*,3E,7E,11R*)] C15H24O 109 <0.1
36.1 unknown C15H24 204 93 0.1
36.39 Guaiol C15H26O 222 161 2.1
36.97 spathulenol C15H24O 220 205 0.16
38.088 tau-muurorol C15H26O 222 161,95 0.1
38.446 bulnesol C15H26O 222 107 1
38.668 -eudesmol C15H26O 222 59 0.4
38.751 -eudesmol C15H26O 222 149, 59 0.63
42.179 bohlmann k3089 C15H20O3 248 83 1.5
42.4 unknown C15H20O3 248 83 2
44.28
Long chain
carbohydratetetratetracontane C44H90 620 57 44.8
46.61 Unknown 282 151 2.6
46.31 unknown 282 151 2.41
48.295 unknown 3.9
49.01 unknown 8.65

~ Appendix I ~
A79
Appendix I. Nonlinear regression of Figure 5.3
Figures G1-4 are the nonlinear regression curves fitted to dose-response data of the
eight most active plant extracts as described in Chapter 5 (Fig. 5.3). The curve fits of the
presented figures are dependent upon which model was used to set the top and bottom
parameters.

A80 ~ Appendix I ~
0.0 0.5 1.0 1.5 2.0 2.5 3.00
25
50
75
100
125
150
MDA-MB-468
Log of Concentration (g/mL)
% C
on
tro
l
0.0 0.5 1.0 1.5 2.0 2.5 3.00
25
50
75
100
125
150
MCF7
Log of Concentration (g/mL)
% C
on
tro
l
0.0 0.5 1.0 1.5 2.0 2.5 3.00
25
50
75
100
125
150
Caco-2
Log of Concentration (g/mL)
% C
on
tro
l
0.0 0.5 1.0 1.5 2.0 2.5 3.00
25
50
75
100
125
150
MM253
Log of Concentration (g/mL)
% C
on
tro
l
0.0 0.5 1.0 1.5 2.0 2.5 3.00
25
50
75
100
125
150
A549
Log of Concentration (g/mL)
% C
on
tro
l
0.0 0.5 1.0 1.5 2.0 2.5 3.00
25
50
75
100
125
150
PC3
Log of Concentration (g/mL)
% C
on
tro
l
0.0 0.5 1.0 1.5 2.0 2.5 3.00
25
50
75
100
125
150
DU 145
Log of Concentration (g/mL)
% C
on
tro
l
0.0 0.5 1.0 1.5 2.0 2.5 3.00
25
50
75
100
125
150
MRC5
Log of Concentration (g/mL)
% C
on
tro
l
Figure I1 Nonlinear regression of the 8 most active extracts using the 4
Parameter (4P) model.
Cell lines were exposed to 8 different extracts, EA3 (■), EA4 (▼), EA5 (●), EA6 (▲),
A5 (●), M1 (♦), M5 (●), M6 (▲), over a range of concentrations for 48 h before being
subjected to the MTT assay. Dose values (Fig 5.3) were transformed into log10 values
and curves were fitted using GraphPad Prism nonlinear regression dose-response
(variable slope) with no constraints set.

~ Appendix I ~
A81
0.0 0.5 1.0 1.5 2.0 2.5 3.00
25
50
75
100
125
150
MDA-MB-468
Log of Concentration (g/mL)
% C
on
tro
l
0.0 0.5 1.0 1.5 2.0 2.5 3.00
25
50
75
100
125
150
MCF7
Log of Concentration (g/mL)
% C
on
tro
l
0.0 0.5 1.0 1.5 2.0 2.5 3.00
25
50
75
100
125
150
Caco-2
Log of Concentration (g/mL)
% C
on
tro
l
0.0 0.5 1.0 1.5 2.0 2.5 3.00
25
50
75
100
125
150
MM253
Log of Concentration (g/mL)%
Co
ntr
ol
0.0 0.5 1.0 1.5 2.0 2.5 3.00
25
50
75
100
125
150
A549
Log of Concentration (g/mL)
% C
on
tro
l
0.0 0.5 1.0 1.5 2.0 2.5 3.00
25
50
75
100
125
150
PC3
Log of Concentration (g/mL)
% C
on
tro
l
0.0 0.5 1.0 1.5 2.0 2.5 3.00
25
50
75
100
125
150
DU 145
Log of Concentration (g/mL)
% C
on
tro
l
0.0 0.5 1.0 1.5 2.0 2.5 3.00
25
50
75
100
125
150
MRC5
Log of Concentration (g/mL)
% C
on
tro
l
Figure I2 Nonlinear regression of the 8 most active extracts using the Top-
and Bottom-fixed (TB) model.
Cell lines were exposed to 8 different extracts, EA3 (■), EA4 (▼), EA5 (●), EA6 (▲),
A5 (●), M1 (♦), M5 (●), M6 (▲), over a range of concentrations for 48 h before being
subjected to the MTT assay. Dose values (Fig 5.3) were transformed into log10 values
and curves were fitted using GraphPad Prism nonlinear regression dose-response
(variable slope) with the top parameter set at 100% and the bottom parameter fixed at
0%.
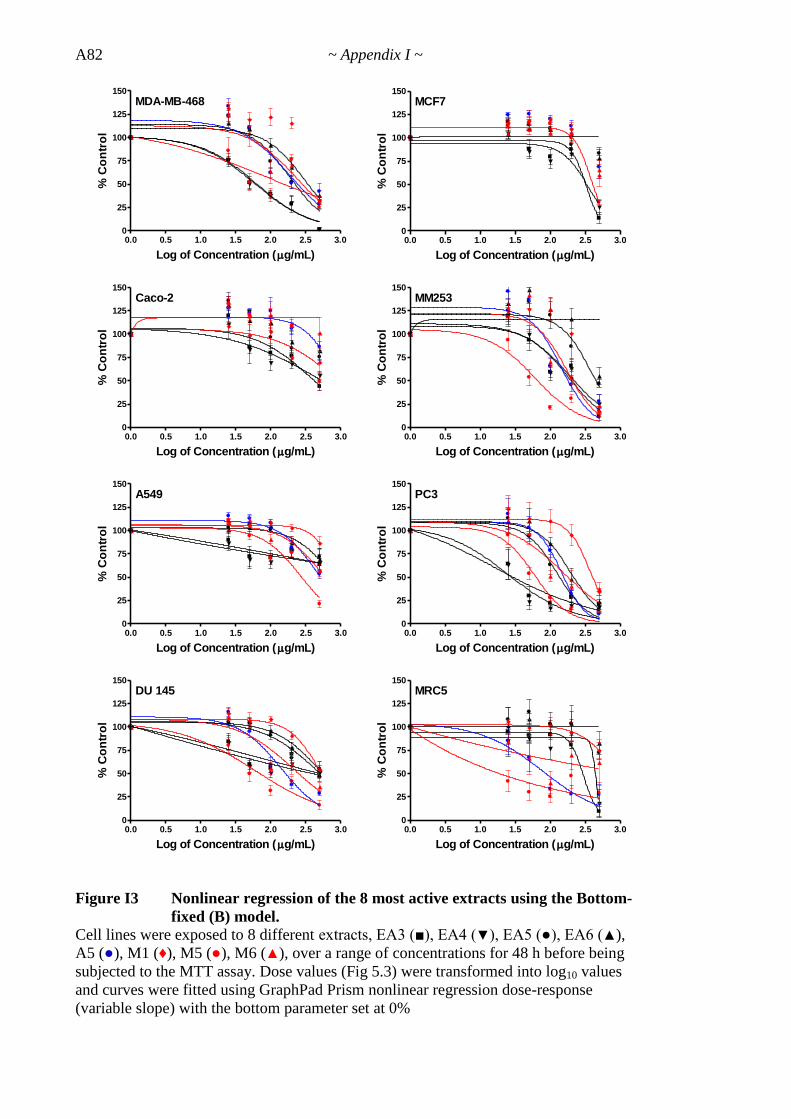
A82 ~ Appendix I ~
0.0 0.5 1.0 1.5 2.0 2.5 3.00
25
50
75
100
125
150
MDA-MB-468
Log of Concentration (g/mL)
% C
on
tro
l
0.0 0.5 1.0 1.5 2.0 2.5 3.00
25
50
75
100
125
150
MCF7
Log of Concentration (g/mL)
% C
on
tro
l
0.0 0.5 1.0 1.5 2.0 2.5 3.00
25
50
75
100
125
150
Caco-2
Log of Concentration (g/mL)
% C
on
tro
l
0.0 0.5 1.0 1.5 2.0 2.5 3.00
25
50
75
100
125
150
MM253
Log of Concentration (g/mL)
% C
on
tro
l
0.0 0.5 1.0 1.5 2.0 2.5 3.00
25
50
75
100
125
150
A549
Log of Concentration (g/mL)
% C
on
tro
l
0.0 0.5 1.0 1.5 2.0 2.5 3.00
25
50
75
100
125
150
PC3
Log of Concentration (g/mL)
% C
on
tro
l
0.0 0.5 1.0 1.5 2.0 2.5 3.00
25
50
75
100
125
150
DU 145
Log of Concentration (g/mL)
% C
on
tro
l
0.0 0.5 1.0 1.5 2.0 2.5 3.00
25
50
75
100
125
150
MRC5
Log of Concentration (g/mL)
% C
on
tro
l
Figure I3 Nonlinear regression of the 8 most active extracts using the Bottom-
fixed (B) model.
Cell lines were exposed to 8 different extracts, EA3 (■), EA4 (▼), EA5 (●), EA6 (▲),
A5 (●), M1 (♦), M5 (●), M6 (▲), over a range of concentrations for 48 h before being
subjected to the MTT assay. Dose values (Fig 5.3) were transformed into log10 values
and curves were fitted using GraphPad Prism nonlinear regression dose-response
(variable slope) with the bottom parameter set at 0%

~ Appendix I ~
A83
0.0 0.5 1.0 1.5 2.0 2.5 3.00
25
50
75
100
125
150
MDA-MB-468
Log of Concentration (g/mL)
% C
on
tro
l
0.0 0.5 1.0 1.5 2.0 2.5 3.00
25
50
75
100
125
150
MCF7
Log of Concentration (g/mL)
% C
on
tro
l
0.0 0.5 1.0 1.5 2.0 2.5 3.00
25
50
75
100
125
150
Caco-2
Log of Concentration (g/mL)
% C
on
tro
l
0.0 0.5 1.0 1.5 2.0 2.5 3.00
25
50
75
100
125
150
MM253
Log of Concentration (g/mL)
% C
on
tro
l
0.0 0.5 1.0 1.5 2.0 2.5 3.00
25
50
75
100
125
150
A549
Log of Concentration (g/mL)
% C
on
tro
l
0.0 0.5 1.0 1.5 2.0 2.5 3.00
25
50
75
100
125
150
PC3
Log of Concentration (g/mL)
% C
on
tro
l
0.0 0.5 1.0 1.5 2.0 2.5 3.00
25
50
75
100
125
150
DU 145
Log of Concentration (g/mL)
% C
on
tro
l
0.0 0.5 1.0 1.5 2.0 2.5 3.00
25
50
75
100
125
150
MRC5
Log of Concentration (g/mL)
% C
on
tro
l
Figure I4 Nonlinear regression of the 8 most active extracts using the Top-
fixed (T) model.
Cell lines were exposed to 8 different extracts, EA3 (■), EA4 (▼), EA5 (●), EA6 (▲), A5
(●), M1 (♦), M5 (●), M6 (▲), over a range of concentrations for 48 h before being
subjected to the MTT assay. Dose values (Fig 5.3) were transformed into log10 values and
curves were fitted using GraphPad Prism nonlinear regression dose-response (variable
slope) with the top parameter set at 100%.

A84 ~ Appendix I ~
Appendix J. Ca2+
Signalling
Underlying the speed and effectiveness of Ca2+
signalling is the more than 20,000-fold
difference in concentration between intracellular Ca2+
(~100 nm) and extracellular Ca2+
(2 mM) levels (Clapham, 2007). The concentration of Ca2+
inside the ER can be up to
10 mM (Meldolesi & Pozzan, 1998), while mitochondria can contain up to 0.5 mM
(Clapham, 2007). Cells maintain this steep Ca2+
gradient by actively pumping any excess
Ca2+
out of the cell or into the intracellular storage organelles (Campbell, 1990). Thus, even
a minor increase in the permeability of the plasma membrane or a small release of Ca2+
from an intracellular store will cause a very large rise in [Ca2+
]i and either activate
signalling processes within the cell or injure it if [Ca2+
]i remains too high for too long
(Campbell, 1990). Cytosolic Ca2+
buffering also significantly impacts on Ca2+
signalling,
but this is not discussed here as Ca2+
bound to proteins is not detectable using the Fura-2
ratiometric method employed.
Several mechanisms exist by which small transient increases in Ca2+
are introduced into the
cytosol for signal transduction purposes. Ca2+
enters the cell from the two largest sinks, the
extracellular space and the ER, via specialised ion channels (Clapham, 2007). The two
primary types of channels involved are voltage-operated Ca2+
channels (VOCs), in which
the gating depends on voltage, and ligand-gated, or receptor-operated Ca2+
channels
(ROCs) (Carafoli et al., 2001). When a cell is activated, these channels open and
approximately106 ions/s/channel flow down the intracellular Ca
2+ gradient into the cytosol
(Clapham, 2007). Ca2+
release from intracellular stores occurs primarily via two ROCs, the
ryanodine receptor (RyR) and the inositol 1,4,5-triphosphate (InsP3) receptor (Striggow &
Ehrlich, 1996). These two channels are responsible for the initial rise in [Ca2+
]i that occurs

~ Appendix J ~
A85
following cell stimulation (Striggow & Ehrlich, 1996). In nonexcitable cells, such as
epithelia like the PC3 cells used in these experiments, the slower InsP3-mediated pathway is
the most common (Clapham, 2007). RyRs are also sensitive to Ca2+
itself, causing Ca2+
-
induced Ca2+
release (CICR) in excitable cells, but this mechanism has not yet been shown
for the InsP3 receptor (Yao et al., 2004).
In nonexcitable cells, Ca2+
influx from the extracellular fluid is via hyperpolarisation. Open
K+ channels force the membrane potential to more negative potentials, which draws Ca
2+
across the plasma membrane more rapidly (Clapham, 2007). Among the ROCs associated
with the plasma membrane are the store-operated Ca2+
channels (SOCs), the best studied of
which are the calcium release activated channels (CRACs) (Mori et al., 2002). This type of
entry is often termed capacitative Ca2+
entry (CCE) as these channels are activated only
after Ca2+
has been discharged from intracellular stores (Berridge, 1995; Mori et al., 2002).
In order to refill the internal stores, SOCs maintain prolonged elevations in [Ca2+
]i
(Striggow & Ehrlich, 1996). CICR has also been shown to be associated with some SOCs
in nonexcitable cells (Yao et al., 2004). Other ways Ca2+
can enter the cytosol include via
the transient receptor potential (TRP) family of non-selective monovalent cation channels
that mediate capacitative entry (Mori et al., 2002; Birnbaumer, 2009) and the sodium
calcium exchanger (NCX) working in reverse mode (Blaustein & Lederer, 1999).
Excess intracellular Ca2+
is mainly extruded from the cytoplasm into the extracellular fluid
or into the internal storage organelles via the NCX in forward mode (Blaustein & Lederer,
1999) and/or actively pumped into the extracellular fluid via the plasma membrane Ca2+
-
ATPase (PMCA) (Carafoli, 1992). There is also a Ca2+
pump in the ER membrane, known
as the sarco(endo)plasmic reticulum Ca2+
-ATPase (SERCA), which is responsible for Ca2+

A86 ~ Appendix I ~
re-sequestration by the ER (Clapham, 2007). Mitochondria are take up Ca2+
via the
mitochondrial calcium uniporter (MCU), a high affinity Ca2+
-selective ion channel located
in the organelle‘s inner membrane that is driven by an electrochemical gradient rather than
ATP hydrolysis (Kirichok et al., 2004).

~ Appendix K ~
A87
Appendix K. Flavonoids
Flavonoids can be categorised according to the presence of an oxygen group at position 4, a
double bond between carbon atoms 2 and 3, or a hydroxyl group in position 3 of the C
(middle) ring (Middleton et al., 2000). Six subclasses of flavonoids are commonly
recognised: the flavones, flavonols, flavanones, flavanols (or catechins), anthocyanidins
and isoflavones (Beecher, 2003; Hirpara et al., 2009). The general structures of these most
common subclasses are shown in Figure K1.
Figure K1 Chemical structures of the six most common flavonoid subclasses.
Note. From ―Quercetin and its derivatives: synthesis, pharmacological uses with special
emphasis on anti-tumor properties and prodrug with enhanced bio-availability.‖ by K.V.
Hirpara, P. Aggarwal, A.J. Mukherjee, N. Joshi and A.C. Burman, 2009, Anticancer Agents
in Medicinal Chemistry, 9(2), p. 138.
Slight structural differences, including distinct patterns of hydroxylation, methylation, and
conjugation with various mono- and disaccharides distinguish individual flavonoids (Graf
et al., 2005). Luteolin and apigenin are both examples of prominent flavones, naringenin is
a flavanone and quercetin is the main representative of the flavonol subclass (Beecher,
2003; Jeong et al., 2009). Rutin (or quercetin-3-rutinoside) is the glycoside of quercetin, the
form that quercetin occurs most frequently as in plants (Erlund et al., 2000). The close
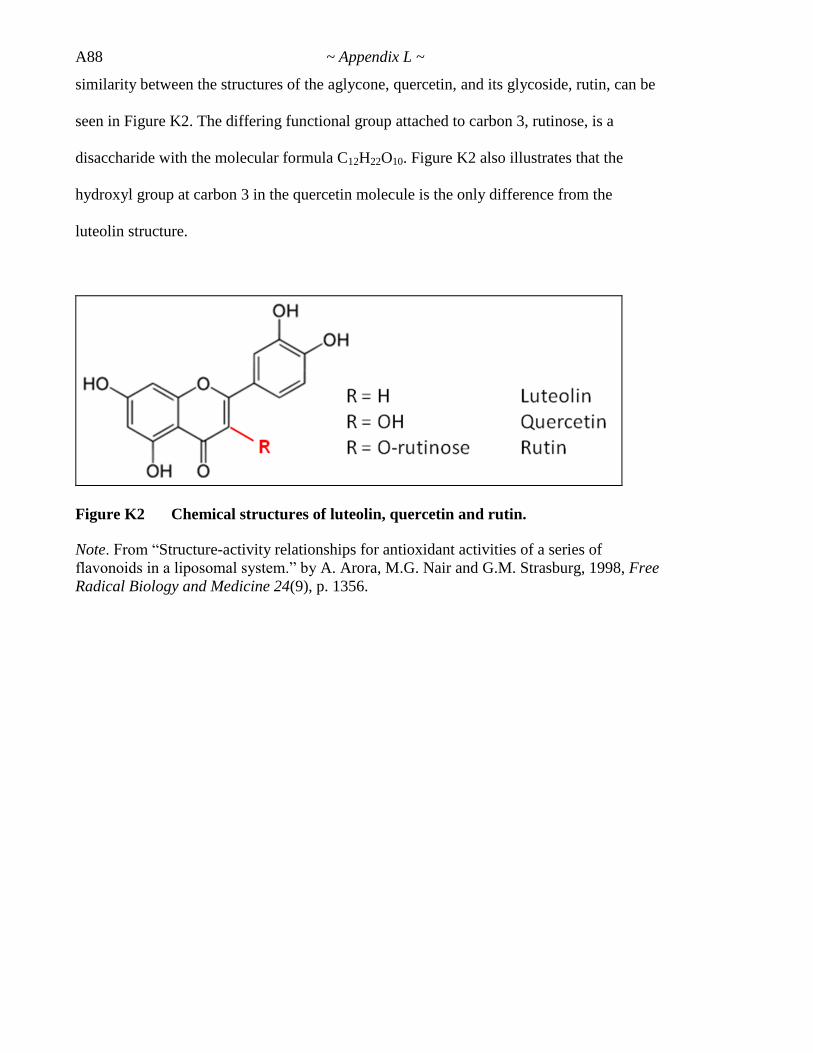
A88 ~ Appendix L ~
similarity between the structures of the aglycone, quercetin, and its glycoside, rutin, can be
seen in Figure K2. The differing functional group attached to carbon 3, rutinose, is a
disaccharide with the molecular formula C12H22O10. Figure K2 also illustrates that the
hydroxyl group at carbon 3 in the quercetin molecule is the only difference from the
luteolin structure.
Figure K2 Chemical structures of luteolin, quercetin and rutin.
Note. From ―Structure-activity relationships for antioxidant activities of a series of
flavonoids in a liposomal system.‖ by A. Arora, M.G. Nair and G.M. Strasburg, 1998, Free
Radical Biology and Medicine 24(9), p. 1356.

~ Appendix L ~
A89
Appendix L. Extraction of Sponges
The following procedures were performed by Ms Jessie Moniodis, an Honours student
within the Discipline of Pharmacy (UWA). The methods described herein were taken from
her thesis with permission.
Freeze-dried sponge material was manually divided into small pieces and extracted (3X)
with methanol at room temperature for 24 h. The methanol solutions were combined and
filtered to remove insoluble particles, after which the samples were dried under reduced
vacuum. The sponge sample afforded a dark brown precipitate.
The crude extract was prefractionated on a Diaion HP20ss resin (45 g; Sigma Aldrich). The
resin was prepared by sequential rinsing with 30 mL of acetone, methanol followed by a
1:1 methanol:water solution, water and lastly, methanol. The washed resin was then stored
under methanol until required.
A portion of the resin slurry was transferred into a 50 mL polypropylene syringe column
(125 mm length x 28 mm diameter; Grace Discovery) ensuring that 2 to 3 cm of solvent
remained above the resin to prevent drying and allow easier application of the crude
extract. The dried crude extracts (3.05 g) was redissolved in 80 mL of 1:3 methanol/water
solution. A small volume (0.5 mL) was withdrawn and labelled crude sample (1-28Crude).
The remainder was carefully applied to the column in order to minimize disruption of the
resin surface. The sample and mobile phase were allowed to run through the column at one
drop per second and the eluent was collected in a pre-weighed round bottomed flask
labelled A (Fraction 1-28A). A stepwise gradient elution from water to acetone was then

A90 ~ Appendix L ~
performed (25% steps, 10 mL), followed by final rinsing with 40 mL of acetone and 50 mL
of ethyl acetate. The eluent from each step was collected individually resulting in 6
additional fractions: 1-28B (1:3 v/v acetone:water); 1-28C (1:1 v/v acetone: water); 1-28D
(3:1 v/v acetone:water); 1-28E (acetone); 1-28F (acetone); 1-28G (ethyl acetate). Fractions
A to G and the crude sample were dried under reduced vacuum and masses recorded before
submission for bioassay.
A common way of dealing with such samples is to chromatograph an unknown extract
using a mobile phase of wide ranging polarity i.e. using a default gradient elution,
adequately separating the mixture and eluting all components. Following prefractionation,
samples were further separated using reversed phase HPLC (detection at 254 nm).
Fractions were selected as a result of their bioactivity towards the brine shrimp.
Each sample was dissolved in a suitable solvent and filtered (Acrodisc® Syringe Filter
0.2 µm) before application to a C18 column (Apollo; 5 µm; 250 x 10 mm; Grace
Discovery). The sample was subjected to a gradient using a water:acetonitrile mobile phase
(95:5 H2O:CH3CN to 100:CH3CN over 60 min; flow rate 2.5 mL/min) and fractions were
collected at 10 min intervals. The column was then washed with 100% acetonitrile for an
additional 10 min and this eluate was collected separately. All prefractions were dried
under reduced vacuum and submitted for bioassay in the brine shrimp and MTT assays.
A summary of the separation procedures is provided in the following flowchart (Fig. L1).

~ Appendix L ~
A91
Figure L1 Flow diagram of separation method.
For simplicity, these identifier codes were modified for my experiments such that:
1 = 2F
2 = 2CA
3 = 2ED
4 = 2EE
5 = 2EF
6 = 2EG
7 = 2E
8 = 2EA
X1-28E = 2E
X1-65A = 2EA
X1-65D = 2ED X1-65E = 2EE
X1-65F = 2EF
X1-65G = 2EG
X1-28F = 2F
X2-27A = 2CA
A92 ~ Appendix M ~
Appendix M. Isolation of Paclitaxel
Although first collected as part of the NCI anticancer drug screen from the bark of the
Pacific yew tree (Taxus brevifolia) in 1962, it was not until two years later that the crude
extract was processed and shown to have modest anticancer activity (Goodman & Walsh,
2001). Initially named taxol, the pure compound was isolated in 1966 and its structure
finally published four years later (Wani et al., 1971; Goodman & Walsh, 2001). However,
the Pacific yew tree is very rare and slow growing and harvesting the bark is fatal to the
tree. Moreover, paclitaxel is only present in miniscule quantities in T. brevifolia so it was
imperative that an alternative source be found if paclitaxel was ever to become a useful
anticancer drug. Hence, the presence of the active compound was investigated in other
Taxus species.
While all Taxus species contain paclitaxel or related taxanes (Jennewein & Croteau, 2001),
initial relatively low and highly variable yields meant it was not until the mid 1990s that
clinically useful quantities were finally isolated from these sources. Concurrently, methods
to chemically synthesise paclitaxel were proving difficult and there were solubility issues.
However, the unique mode of action of paclitaxel (Schiff et al., 1979) provided a
motivating force to overcome these serious impediments to drug development (Jennewein
& Croteau, 2001). In 1988 Potier and colleagues published a semi-synthetic route to
paclitaxel via other more accessible precursors, baccatin molecules, taxanes present in a
related species, the European yew, Taxus baccata (Denis et al., 1988). T. baccata is not
only a more common species, being widely planted as an ornamental tree, but baccatin
molecules are present in the needles (leaves) and twigs of the yews, meaning the source is
renewable (Dewick, 2009). A year later, Holton patented a more practical approach with

~ Appendix M ~
A93
twice the yield of the Potier process via structurally related baccatin molecules (Holton et
al., 1995).
While total synthesis of paclitaxel has been achieved (Holton et al., 1994; Nicolaou et al.,
1994), these methods have proven economically non-viable (Jennewein & Croteau, 2001).
After many variations and improvements on the protocols involving intermediary pathways
funded by Bristol-Myers Squibbs, the drug company that commercialised Taxol®, most of
today‘s paclitaxel is produced via plant cell fermentation technology. This involves
propagating a specific Taxus cell line in aqueous medium in large fermentation tanks and
directly extracting the paclitaxel, purifying it by chromatography and isolating it by
crystallisation. Not only does this method save trees, but it requires less hazardous
chemicals and considerably less energy than the semi-synthetic route (Suffness & Wall,
1995; Kingston, 2001; Dewick, 2009).

A94
Appendix N. Hormesis
Traditionally, the fundamental nature of the dose-response has been universally
recognised as being sigmoidal in shape and displaying a threshold response in the
low-dose zone (Calabrese et al., 2006a). This sigmoidally-based threshold model has
been the overwhelmingly dominant paradigm in essentially all disciplines dealing
with dose-response relationships (Calabrese & Baldwin, 2003b). It has been applied
to essentially all biological models, all endpoints measured and all chemical
substances tested, regardless of chemical class (Calabrese et al., 2006a). In this
conventional model, toxicologists assume a linear relationship between dose and
effect, which holds true up (or down) to a certain threshold, beyond which no more
effects are observed. In this monotonic dose-response relationship, as the dose
increases, so does the effect and vice versa. A variation of this model is the more
cautious linear non-threshold (LNT) model used for carcinogens (Hadley, 2003).
However, substantial evidence indicates that the threshold model is not as universal
as believed and is, in fact, less commonly observed than the hormetic model
(Calabrese et al., 2006a). The hormetic model, rejects the standard assumption that
effects at low doses can be extrapolated from data obtained from high doses, and
instead describes the relationship as a U- or an inverted U- (or J-) shaped curve,
depending on whether the substance causes an increased (Fig. N1a) or decreased
(Fig. N1b) effect (Calabrese & Baldwin, 2003a; Hadley, 2003).
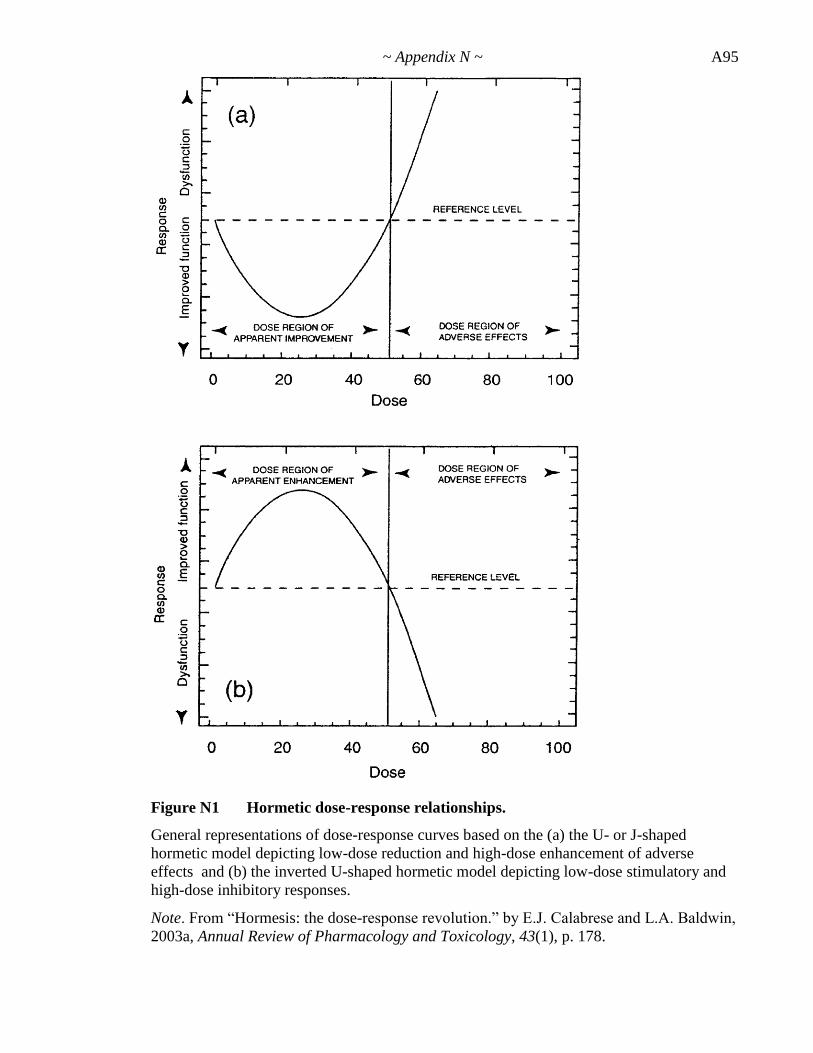
~ Appendix N ~
A95
Figure N1 Hormetic dose-response relationships.
General representations of dose-response curves based on the (a) the U- or J-shaped
hormetic model depicting low-dose reduction and high-dose enhancement of adverse
effects and (b) the inverted U-shaped hormetic model depicting low-dose stimulatory and
high-dose inhibitory responses.
Note. From ―Hormesis: the dose-response revolution.‖ by E.J. Calabrese and L.A. Baldwin,
2003a, Annual Review of Pharmacology and Toxicology, 43(1), p. 178.

A96 ~ Appendix N ~
More than 15% of the 400-plus papers with hormesis in the title that appear on the PubMed
list are by the same author, Edward Calabrese. While not the first modern scientist to
propose hormesis as a valid biological hypothesis, Calabrese and his group have almost
single-handedly revived the debate concerning the existence of hormesis (Stebbing, 1982;
Calabrese & Baldwin, 1998). They have shown that the hormetic model is actually the most
fundamental dose response, significantly outcompeting other leading dose-response models
in large-scale, head-to-head evaluations with a frequency of at least 40% in the toxicology
literature (Calabrese & Baldwin, 2003b; Calabrese et al., 2006b; Calabrese et al., 2008;
Calabrese, 2005a, 2005c, 2005d, 2008b). These authors contend that early key leaders of
the biomedical sciences made a profound error when deciding on the fundamental nature of
the dose-response. This conceptual misunderstanding was consolidated by the scientific
community in the 1930s when they adopted the threshold model as the default dose-
response paradigm (Calabrese, 2009a). This has meant that, historically, hormesis has been
a little discussed phenomenon, and although evident in many published articles on dose-
response studies, it is rarely acknowledged by the authors. If not completely ignored, it is
usually dismissed by the investigators as an artefact (Calabrese et al., 1999; Hadley, 2003).
The extreme marginalisation of the hormetic theory was due to many contributing factors
which have been extensively reviewed (Calabrese & Baldwin, 1999; Calabrese, 2005d,
2009a). What follows is a brief history summarising just how and why the toxicological
community missed what Calabrese (2004, p127) called ―the basic reality of the hormetic
dose response‖ in favour of the conventional threshold model.
The term hormesis was not coined until 1943 when Southam and Ehrlich noted an
antibiotic they were working with apparently stimulated growth of otherwise sensitive
organisms at certain concentrations (Randall et al., 1947). However, the concept of

~ Appendix N ~
A97
hormesis has been around since at least the 1500s when Paracelsus, regarded as the father
of toxicology, famously observed ―all things are poison and nothing is without poison, only
the dose permits something not to be poisonous‖ (Goldstein & Gallo, 2001; Mattson,
2008). This is often paraphrased to the dictum ―only the dose makes the poison‖ (Bagchi,
2006; Stumpf, 2006; Jonas & Ives, 2008). In 1854 Virchow described how low
concentrations of NaOH and KOH caused an increase in the beating activity of the ciliae of
tracheal epithelia mucosa, but a concentration-dependent decrease to arrest at higher
concentrations (Henschler, 2006). The notion gained momentum in the late 1800s when
Hugo Schulz reported the occurrence of stimulation from very low concentrations of toxic
substances based on his research on various disinfectants on yeast metabolism (Calabrese &
Baldwin, 2000a). Collaborations with the practising homeopath, Rudolph Arndt, eventually
led to the Arndt-Schulz Law which stated ―for every substance, small doses stimulate,
moderate doses inhibit, large doses kill‖ (Calabrese & Baldwin, 2000a; Calabrese, 2009a).
Independent research on chemical stimulation of bacterial growth by a contemporary,
Ferdendane Hueppe, the protégé of Robert Koch and himself one of the founders of
bacteriology, supported the perceived truism which became better known as Hueppe‘s Rule
due to his distinguished reputation (Calabrese & Baldwin, 2000a, 2000b; Calabrese,
2009a). Despite being widely referred to in the pharmacological literature for over 30 years,
it fell into disuse because there was no explanation to account for it (Stebbing, 1998;
Calabrese et al., 1999; Lindsay, 2005). Instead, the principle was adopted by the
homeopathy community in support of their ideas (Calabrese, 2009a; Kendig et al., 2010).
The defining principle of the highly controversial medical practice of homeopathy is the
―law of similars‖ or ―like cures like‖ (Ernst, 2005). It holds that ultra-low dilutions of a
substance that causes a particular adverse effect in a healthy person can be used to treat a
patient suffering from those same symptoms (Ernst & Pittler, 1998; Jonas et al., 2003).

A98 ~ Appendix N ~
Examples include the use of Apis mellifera, the common honey bee, to treat symptoms of
localized swelling, soreness, and inflammation, the same symptoms caused by bee stings
and using onions to cure the attendant symptoms of colds and allergies (Tedesco &
Cicchetti, 2001). In layman‘s terms, it is the notion that you can be cured by ―the hair of the
dog that bit you‖ or that a little poison can be good for you (Jonas & Ives, 2008). The close
and unfortunate association with homeopathy appears to be the principal reason why
hormesis as a concept was rejected by the wider scientific community of the day
(Calabrese, 2005c, 2005d, 2009a).
In addition to having no strong advocates for hormesis, toxicologists have been
traditionally more interested in the upper end of the dose-response curves, where dose and
risk are at their highest. As hormetic effects are characteristically modest and are therefore
difficult to measure and quantify without extensive studies using many animals, they were
not often seen in experiments primarily designed to assess high-dose inhibition (Hadley,
2003; Calabrese, 2005b). This only reinforced the initial bias against hormesis as a concept
(Calabrese & Baldwin, 2003a).
On the other hand, unlike the toxicology community, molecular pharmacologists have
studied various dose responses and identified over 30 receptor systems that show hormesis
(Calabrese & Baldwin, 2003a). The difference between the two fields was explained by
Hadley (2003), who noted their differing approaches to dose-response relationships: while
toxicology is concerned with the toxic effects of substances, which are commonly
displayed at high doses, pharmacology is more interested in the therapeutic value of
substances which are frequently seen at low doses. According to the same author,
molecular biologists generally go another step further than both toxicologists and

~ Appendix N ~
A99
pharmacologists, not only identifying a biological effect, but also investigating its
fundamental causes. However, because hormesis has been observed for so many different
species, substances and endpoints, it has been proposed that there is a generalised
mechanistic strategy, but no single molecular mechanism to explain its existence. This high
generalizability suggests that the hormetic dose-response strategy has been selected for and
is adaptive in nature (Stebbing, 1998). It is seen, for example, in the context of
adaptive/preconditioning responses where a prior exposure to a low dose of a toxic agent
up-regulates adaptive mechanisms that protect against subsequent exposures to similar
toxic agents (Calabrese, 2008a). Thus, hormesis represents an overcompensation to an
alteration in homeostasis. When the dose progressively increases, the system‘s capacity to
compensate becomes overwhelmed, the toxicity threshold is exceeded, and toxic effects are
seen (Calabrese et al., 1999). In other words, the mechanism is perceived to be a disruption
of cellular homeostasis, followed by a modest overcompensation by the cell, and the re-
establishment of homeostasis, but in an adapted state (Lindsay, 2005). The first adaptive
response, was for E. coli, where a reduced mutagenic effect of the alkylating agent N-
methyl-N‘-nitro-N-nitrosoguanidine (MNNG) was seen if the bacteria had previously been
exposed to a low dose of the same compound (Jeggo et al., 1977). Since then, many other
adaptive responses have been characterized for various agents in both bacteria and
mammalian cells (Hoffmann, 2009).
Calabrese (2008a) believes the theories of Szabadi (1977) on agonists and opposing
receptor subtypes, which are supported by experimental examples, may help account for
numerous cases of hormetic-like biphasic dose-responses. In this model, a single agonist
may bind to two receptor subtypes, one activating a stimulatory pathway and the other an
inhibitory one. The receptor subtype with greatest agonist affinity would typically have

A100 ~ Appendix N ~
fewer receptors, hence a lower capacity, and its pathway activation effects would dominate
at lower doses. Conversely, the other receptor subtype would have lower agonist affinity,
more receptors and greater capacity, becoming dominant at higher concentrations
(Calabrese, 2008a). In summary, ―the hormetic process represents a common strategy for
resource allocation when systems need to respond to low-level metabolic perturbations‖
(Calabrese & Baldwin, 2003a, p183).
However, other authors are not so convinced of the prevalence of hormesis, although they
acknowledge its existence (Crump, 2007; Douglas, 2008; Mushak, 2009). Additionally,
several authors have expressed concern that in vitro hormetic effects may not correlate with
the in vivo situation (Anderson, 2005; van der Woude et al., 2005), but many studies have
confirmed in vivo hormesis (Lindsay, 2005; Ergüven et al., 2007; Bruchey & Gonzalez-
Lima, 2008; Gocke & Wall, 2009; Fosslien, 2009). Most authors agree further debate is
required before hormesis becomes the default model of dose-response as advocated by
Calabrese (Hadley, 2003; Callahan, 2005; Calabrese et al., 2006b). Questions to resolve
include whether all biphasic dose-response curves should be considered representative for
hormesis and just what might be clinical significance of hormetic effects or their
consequences for risk assessment or (Anderson, 2005; van der Woude et al., 2005). It is
also desirable to design future experiments to describe hormetic phenomena with respect to
a time factor, allowing for detection of the specific type of hormesis (Calabrese & Baldwin,
2002; Carelli & Iavicoli, 2002). As the meaning of the operational term hormesis and its
close synonyms have been obscured by inconsistent and confusing usage, an
interdisciplinary team has proposed new definitions that distinguish between direct
stimulus and overcompensation stimulus (Calabrese et al., 2007). Thus, conditioning
hormesis, in which prior exposure to a low dose of a substance protects against a larger
~ Appendix N ~
A101
dose of the same (or similar) stressor substance, and postexposure conditioning hormesis,
which denotes phenomena in which the toxicity of a high stressor dose is ameliorated by
subsequent exposure to a low dose of the same stressor (Calabrese et al., 2007; Agutter,
2008). Regardless, the concept of hormesis is now becoming increasingly recognised by the
scientific community as evidenced by the meteoric rise in journal articles from 15 citations
per year in the 1980s to more than 2,400 in 2009 alone (Calabrese, 2010). Moreover, all
recent textbooks on toxicology now contain sections on hormesis, giving it a clear standing
in the field (Calabrese, 2009b). Additionally, as hormesis provides a framework for the
study and assessment of chemical mixtures, incorporating the concept of additivity and
synergism (see section 8.2.8), it is expected that it will become even more significant
within toxicological evaluation in the future (Calabrese, 2008b).

A102 ~ Appendix O ~
Appendix O. Other General Cytotoxicity Assays
Alternative methods of determining any losses in membrane integrity include measuring
the release of enzymes from cells in culture into the incubation media and assessing the
cells‘ abilities to take up or release a radioisotope tracer. However, neither of these methods
were suitable for the conditions of the current study as outlined below.
Many unsuccessful attempts were made to assess compromised membrane integrity of all
plant extracts using a commercially available kit (Sigma DG158K) to measure the activity
of aspartate aminotransferase (AST). This enzyme is found in large quantities in
pulmonary, cardiac and hepatic cells, and so the measurement of serum AST activity has
long been used in the differential diagnosis of diseases of these organs (Amador & Wacker,
1962). However, AST is actually present in all cells. The AST colourimetric assay is based
on a coupled REDOX reaction such that the rate of decrease in absorbance at 340 nm is
directly proportional to AST activity. However, as this assay was time-dependent and the
spectrophotometer available to measure samples in cuvettes drifted over the course of the
assay, the data (not shown) were possibly invalid. Furthermore, most of the extracts
themselves absorbed at the wavelength used (see Appendix D), so little confidence was
placed on resultant data and these experiments were eventually abandoned.
Another way of identifying cell damage is to measure the amount of leakage of another
ubiquitous cytosolic enzyme, such as lactate dehydrogenase (LDH), adenylate kinase (AK),
or glyceraldehyde-3-phosphate dehydrogenase (GAPDH). However, as all these enzymatic
release assays have several practical limitations, including multiple reagent additions,
scalability, low sensitivity, poor linearity, or wash steps and medium exchanges (Cho et al.,

~ Appendix O ~
A103
2008), it was decided not to attempt to measure the activity of any of these enzymes.
Additionally, the LDH assay is also performed at 340 nm and, as with the AST assay,
samples are run serially (Korzeniewski & Callewaert, 1983), hence, it was thought similar
problems to the AST assay would ensue. Moreover, while LDH is considered relatively
stable in culture with a half-life of approximately 9-10 h (Riss et al., 2006), it is less stable
than AST, which has a half-life of 12.5-22 h (Lin et al., 2000). Thus, the changing levels of
LDH over time must be taken into account when interpreting results from experiments
where cells are exposed to damaging agents for longer periods of time. For example, in this
study, if all the cells were killed at the beginning of the 48 h exposure period, there would
be little activity remaining at the end-point of the experiment when the measurements were
made. Not only that, but endogenous LDH present in the serum of the growth media can
cause high background absorbance levels, limiting the sensitivity of this assay (Riss et al.,
2006).
Compromised cell membrane integrity can also be detected by measuring another cytosolic
enzyme, glucose-6-phosphate dehydrogenase (G6PD). While the original method described
by Lee and Wood (1982) entailed following G6PD activity at the same unsuitable
wavelength of 340 nm, Batchelor and Zhou (2004) recently updated the procedure. In the
modified assay, the activity of extracellular G6PD is correlated to the reduction of resazurin
(Alamar blue) to resorufin, via a coupled-enzyme reaction. An advantage over the LDH
assay is that background noise from endogenous G6PD is minimal as serum contains 5-fold
less G6PD than LDH (Batchelor & Zhou, 2004). However, at only 2 h, the half-life of
G6PD in culture medium following cell lysis (Riss & Moravec, 2004) is much lower than
that of LDH, meaning that measuring G6PD activity would be even less useful for the
longer (48 h) exposure periods of these experiments. However, the main problem with the

A104 ~ Appendix O ~
G6PD assay is that the end-product of the coupled reaction is the highly fluorescent dye,
resorufin (Batchelor & Zhou, 2004), and at the time of these experiments a fluorescence
spectrophotometer was not available for use. For the same reason it was not possible to
prelabel cells with carboxyfluorescein diacetate and measure its release fluorometrically
(Suzuki et al., 1991). Similarly, the use of bioluminescent cytotoxicity assays in which
released intracellular markers (e.g. proteases) are measured (Cho et al., 2008), was not
feasible as access to the required instrument was not available.
It was also not possible to determine the viability of cells by assessing their uptake or
release of a radioisotope tracer, such as 51
Cr (Brunner et al., 1968; Neville, 1987) or 125
I-
iododeoxyuridine (Cohen et al., 1971), because of a lack of facilities, funding and time
required for authorisation. Simpler methods of determining cell viability by measuring cell
membrane impairment, such as through the use of vital dyes (e.g. trypan blue and neutral
red) or fluorescent compounds (e.g. propidium iodide), were not contemplated due to their
labour intensiveness restricting their utility for high-throughput screening.

~ Appendix P ~
A105
Appendix P. Determination of Compound
Interactions
Individual constituents of mixtures, such as plant extracts, may interact in the
combination to produce greater than or less than responses than would be expected from
their individual dose-response curves (Savelev et al., 2003). Most often, the assessment
of these synergistic or antagonistic interactions is made from experiments in which an
effect level is chosen and doses (concentrations) of drug A alone, drug B alone and the
combination (a, b) that give this effect are determined. Doses that produce the same
effect are called isobols (Tallarida, 2002; Prakash et al., 2009).
The interaction index is denoted by and calculated using the isobolar equation (1):
= a/A + b/B (1)
where
A is the dose of one drug alone,
B is the dose of another drug alone,
a is the dose of drug A in combination,
b is the dose of drug B in combination.
The quantities in Eq. (1) are obtained from the dose response curves of drugs A, B, and
the combination. If = 1, the interaction is additive; if < 1 it is super-additive
(synergistic), and if > 1 it is sub-additive (antagonistic) (Montes et al., 2000; Tallarida,
2002).
The same approach can be used for any number of compounds in combination such
that:
= Ʃ (i/I) (2) i=1
n

A106 ~ Appendix P ~
where
n = a number of agents in a combination, with i = 1,2,3,. . .,n (Savelev et al., 2003).
The results of isobolographic analysis can be easily visualized using isobolograms (Fig.
P1). An isobologram is a two-dimensional plot in which the concentrations of the two
drugs (on an arithmetic scale) are the coordinates. An isobol is a curve that starts from a
concentration of drug A on the x axis and ends at an isoeffective concentration of drug
B on the y axis, connecting the concentrations of all combinations showing the same
effect. An additive isobol, the graphical representation of Eq. 1, is a straight line from
the x axis to the y axis, connecting the isoeffective concentrations of drugs A and B
alone. When only one drug is active, the additive isobol (known as an indifferent isobol
in this case) is parallel to the axis along which the concentrations of the inactive drug
are plotted, starting from the concentration of the active drug that produces an effect.
An isobol that deviates to the left or right from the indifferent isobol indicates synergy
or antagonism, respectively (Stergiopoulou et al., 2008).
Figure P1 Isobols for zero-interaction, synergism and antagonism.
Note. From ―Synergy research: approaching a new generation of
phytopharmaceuticals.‖ by H. Wagner and G. Ulrich-Merzenich, 2009, Phytomedicine,
16(2-3), p. 98.
~ Appendix P ~
A107
Thus, for a particular growth level (e.g., 15%, 50%, or 85% of the growth of the drug-
free control), the total concentration of both drugs for a fixed ratio of each combination
is compared with the isoeffective theoretical additive total concentration (Stergiopoulou
et al., 2008).
Others have used different cut-offs to define synergy, reasoning that the observed effect
must deviate significantly from 1 to be meaningful. It has been recommended that
synergy occurs when the is ≤ 0.5, while antagonism is defined by a > 4
("Antimicrobial Agents and Chemotherapy," 2007). The logic behind these definitions,
based on inherent inaccuracies and biological relevance, was succinctly described by
Johnson et al. (2004). Stergiopoulou et al. (2008) defined the interaction between two
compounds as synergistic or antagonistic when two or more sequential fixed ratios of
each growth level had significantly (P<0.05) lower or higher interaction.