evaluation of the anti-diabetic potentials of some african
TRANSCRIPT
Evaluation of the anti-diabetic potentials
of some African medicinal plants: A
multimode study
By
Olajumoke Arinola Oyebode
Student number: 216068797
December 2018

ii
Evaluation of the anti-diabetic potentials
of some African medicinal plants: A
multimode study
By
Olajumoke Arinola Oyebode
Student number: 216068797
Submitted in fulfilment of the academic requirements for the degree of
Doctor of Philosophy in Biochemistry, School of Life Sciences, University
of KwaZulu-Natal (Westville campus), Durban 4000, South Africa
Supervisor: Professor MS Islam, PhD

iii
ABSTRACT
The present study investigated the effects of five African medicinal plants (Alstonia boonei, Acalypha
wilkesiana, Boerhaavia diffusa, Bridelia ferruginea, and Crassocephalum rubens) for their
antioxidative and antidiabetic potentials by using several experimental protocols. The crude extracts
(ethyl acetate, ethanol and aqueous) of the different parts (leaves, stem bark, root bark or aerial parts
when applicable) were initially investigated for their detailed antioxidant and antidiabetic activity
using in vitro, ex vivo and in silico experimental models. Then the most active crude extract from
each plant was chosen for further fractionation with the solvents of increasing polarity. The solvent
obtained fractions were then subjected to screening in terms of their antioxidant, -glucosidase, -
amylase and lipase inhibitory activity in vitro and intestinal glucose absorption and muscle glucose
uptake ex vivo. Results from these assays revealed that the butanol and aqueous fractions of A. boonei,
butanol fraction of B. ferruginea, ethanol extract of A. wilkesiana and B. diffusa and the aqueous
extracts of C. rubens showed the best activities in terms of all the tested models. The most active
crude extracts and fractions were consequently subjected to GC-MS and LC-MS analyses in order to
identify their bioactive components. Then the structures of the most bioactive components were
docked with the tested enzymes using in silico modelling. The anti-diabetic effect of the butanol
fractions of A. boonei and B. ferruginea together with the aqueous extract of C. rubens were
investigated in an in vivo intervention trial using a type 2 diabetes rat model. The in vivo experiment
revealed that the fractions and extract exhibited potent in vivo hypoglycaemic activity. Interestingly,
these fractions were also able to alleviate T2D-associated complications involving oxidative stress.
Analysis of in vivo oxidative stress markers such as superoxide dismutase, catalase, glutathione and
thiobarbituric acid reactive substances, in the serum, liver, kidney, heart and pancreas of the animals
also suggested their strong antioxidative effects. The results of this study suggest that the different
extracts/fractions of the above-mentioned plants have promising anti-diabetic potentials; however
further clinical trials are required in order to justify the usefulness of these plants for the development
of potent and cost effective anti-diabetic drugs.
iv
PREFACE
The information presented in this thesis is an original work by the candidate. It was carried out
in the Department of Biochemistry, School of Life Sciences, College of Agriculture, Engineering
and Science, University of KwaZulu-Natal, Westville Campus, Durban, South Africa from
January 2016 to December 2018 under the supervision of Prof. MS Islam and has not otherwise
been submitted in any form for any degree or diploma to any other University. Where use has
been made of the work of others, it has been duly acknowledged in the text in the form of
reference.
Candidate: Olajumoke Arinola Oyebode
Supervisor: Prof. MS Islam
v
DECLARATION 1 – PLAGIARISM
I, Olajumoke Arinola Oyebode, declare that
1. The research reported in this thesis, except where otherwise indicated, is my original research.
2. This thesis has not been submitted for any degree or examination at any other university.
3. This thesis does not contain other persons’ data, pictures, graphs or other information, unless
specifically acknowledged as being sourced from other persons.
4. This thesis does not contain other persons' writing, unless specifically acknowledged as being
sourced from other researchers. Where other written sources have been quoted, then:
a. their words have been re-written, but the general information attributed to them has been
referenced.
b. where their exact words have been used, then their writing has been placed in italics and
inside quotation marks and referenced.
5. This thesis does not contain text, graphics or tables copied and pasted from the Internet, unless
specifically acknowledged, and the source being detailed in the thesis and in the References
sections.
Signed
…………………………………

vi
DECLARATION 2 - PUBLICATIONS AND PRESENTATIONS
Details of contribution to publications that make up part of the research presented in this thesis
(include publications in preparation, submitted, in press and published and give details of the
contributions of each author to the experimental work and writing of each publication).
In all the publications included in this thesis, I (with guidance from my supervisor) designed the work,
performed all the experiments and wrote all the publications. The co-authors contributed by
conducting an editorial work, checking the scientific content of the work and my correct interpretation
of the findings.
Already published papers from this thesis:
Publication 1
Olajumoke A. Oyebode, Ochuko L. Erukainure, Neil A. Koorbanally, Md. Shahidul Islam (2018).
Acalypha wilkesiana ‘Java white’: Identification of some bioactive compounds by GC-MS and effects
on key enzymes linked to type 2 diabetes. Acta Pharmaceutica. 68: 425-439
https://doi.org/10.2478/acph-2018-0037
Publication 2
Olajumoke A. Oyebode, Ochuko L. Erukainure, Chika I. Chukwuma, Collins U. Ibeji, Neil A.
Koorbanally, Md. Shahidul Islam (2018). Boerhaavia diffusa inhibits key enzymes linked to type 2
diabetes in vitro and in silico; and modulates abdominal glucose absorption and muscle glucose
uptake ex vivo. Biomedicine and Pharmacotherapy 106: 1116-1125
https://doi.org/10.1016/j.biopha.2018.07.053
Pending and prospective publications:
Publication 3
Olajumoke Oyebode, Ochuko Erukainure, Collins Ibeji, Neil Koorbanally, Md. Shahidul Islam
(2018). Phytochemical constituents, antioxidant and antidiabetic activities of different extracts of the
leaves, stem and root barks of Alstonia boonei: An in vitro and in silico study. Journal of Natural
Product Research. Under review.
Publication 4
Olajumoke A. Oyebode, Ochuko L. Erukainure, Olakunle Sanni and Md. Shahidul Islam (2018).
Effects of the butanol fraction of Alstonia boonei leaves on pancreatic histology, glucose homeostasis
and insulin secretion in diabetic rats. Submitted to Journal of Ethnopharmacology. Under review.
vii
Publication 5
Olajumoke A. Oyebode, Ochuko L. Erukainure, Neil A. Koorbanally, Md. Shahidul Islam (2018).
Crassocephalum rubens, a leafy vegetable Suppresses Oxidative Pancreatic and Hepatic Injury, and
Inhibits Key Enzymes linked to Type 2 Diabetes Ex vivo. Submitted to Journal of Food
Biochemistry. Under review.
Publication 6
Olajumoke A. Oyebode, Ochuko L. Erukainure, Olakunle Sanni, Neil A. Koorbanally, Md. Shahidul
Islam (2018). Fractions of Alstonia boonei leaves ameliorate oxidative stress and modulates key
hypoglycemic processes. Submitted to Indian Journal of Experimental Biology. Under review.
Publication 7
Olajumoke A. Oyebode, Ochuko L. Erukainure, and Md. Shahidul Islam. Butanol fraction of Alstonia
boonei leaves ameliorates oxidative stress in a type 2 diabetes model of rats. (In preparation).
Publication 8
Olajumoke A. Oyebode, Ramgopal Mopuri, Ochuko. L. Erukainure, Md. Shahidul Islam, Acalypha
Wilkesiana ‘Java white’ scavenges free radicals in vitro and abates Fe2+ - induced oxidative stress in
rat pancreatic homogenates. (in preparation).
Publication 9
Olajumoke A. Oyebode, Ochuko L. Erukainure, Olakunle Sanni, Md. Shahidul Islam.
Crassocephalum rubens improves pancreatic histology, insulin section, liver and kidney function
parameters in a type 2 diabetic model of rats (in preparation).
Publication 10
Olajumoke A. Oyebode, Ochuko L. Erukainure, Neil A. Koorbanally, Md. Shahidul Islam. Aqueous
extract of Crassocephalum rubens aerial parts ameliorates oxidative stress in a type 2 diabetes model
of rats (in preparation).
Publication 11
Olajumoke Oyebode, Ochuko Erukainure, Collins Ibeji, Neil Koorbanally, Md. Shahidul Islam.
Extracts of Bridelia ferruginea scavenges free radicals and modulates key anti-diabetic enzymes (in
preparation).

viii
Publication 12
Olajumoke A. Oyebode, Ochuko L. Erukainure, Neil A. Koorbanally, Md. Shahidul Islam. Fractions
from Bridelia ferruginea leaves attenuates oxidative stress, inhibits key carbohydrate digesting
enzyme and intestinal glucose absorption but enhances muscle glucose uptake (in preparation).
Publication 13
Olajumoke A. Oyebode, Olakunle Sanni, Md. Shahidul Islam. Butanol fraction of Bridelia ferruginea
leaves regulates pancreatic β-cell functions, stimulates insulin secretion and ameliorates diabetic
complications in a type 2 diabetes model of rats (in preparation).
Other significant research output
Publication 14
Olakunle Sanni, Ochuko L. Erukainure, Olajumoke A. Oyebode, Neil A. Koorbanally, Md. Shahidul
Islam (2018). Phragmanthera incana Concentrated Hot water -Infusion Improves Glucose Uptake;
Inhibits Key Enzymes linked to Type 2 Diabetes and Abates Fe2+-induced Oxidative Stress in
Hepatic Tissues. Biomedicine and Pharmacotherapy. 108:417-423.
https://doi.org/10.1016/j.biopha.2018.09.014
Publication 15
Ochuko L. Erukainure, Ramgopal Mopuri, Olajumoke A. Oyebode, Neil A. Koorbanally, Md.
Shahidul Islam (2017). Dacryodes edulis enhances antioxidant activities, suppresses DNA
fragmentation in oxidative pancreatic and hepatic injuries; and inhibits carbohydrate digestive
enzymes linked to type 2 diabetes. Biomedicine and Pharmacotherapy. 96:37-47.
https://doi.org/10.1016/j.biopha.2017.09.106
Publication 16
Ochuko L. Erukainure, Olajumoke A. Oyebode, Mxolisi K. Sokhela, Neil A. Koorbanally, Md.
Shahidul Islam (2017). Caffeine – rich infusion from Cola nitida (kola nut) inhibits major
carbohydrate catabolic enzymes; abates redox imbalance; and modulates oxidative dysregulated
metabolic pathways and metabolites in Fe2+- induced hepatic toxicity. Biomedicine and
Pharmacotherapy. 96: 1065-1074. https://doi.org/10.1016/j.biopha.2017.11.120
ix
Presentations
Presentation 1
Olajumoke A. Oyebode, Ochuko L. Erukainure, Collins Ibeji, Neil A. Koorbanally, Md. Shahidul
Islam. Effects of extracts from Boerhaavia diffusa aerial parts on key carbohydrate digesting enzymes
activity in vitro and intestinal glucose absorption and muscle glucose uptake ex vivo. 18th
International Congress of Endocrinology, Cape Town, South Africa. 1st- 4th December 2018.
Presentation 2
Olajumoke A. Oyebode, Ochuko L. Erukainure, Neil A. Koorbanally, Md. Shahidul Islam (2018).
Crassocephalum rubens Suppresses Oxidative Pancreatic Injury, and Inhibits Key Enzymes linked
to Type 2 Diabetes Ex vivo. SASBMB-FASBMB Conference, North-West University
Potchefstroom, South Africa. 8-11th July 2018.
Presentation 3
Olajumoke A. Oyebode, Ochuko L. Erukainure, Neil A. Koorbanally, Md. Shahidul Islam (2017).
Boerhaavia diffusa suppresses oxidative pancreatic injury, and inhibits key enzymes linked to Type
2 Diabetes. 2017 School of Life Sciences Annual Postgraduate Research Day, University of
KwaZulu-Natal, South Africa.
Signed:
Date:…………………………

x
DEDICATION
To God Almighty
The Everlasting Father
The one who knows the end even before the beginning
The Ultimate Teacher
And above all, the Fountain of Knowledge
xi
ACKNOWLEDGEMENTS
I would like to express my sincere gratitude to my supervisor Prof. Md. Shahidul Islam for the
continuous support of my Ph.D. study and research, for his patience, motivation, enthusiasm, and
immense knowledge. His guidance helped me all through my research and writing of this thesis. I
could not have imagined having a better advisor and mentor for my Ph.D. study. My sincere thanks
also go to Prof. Neil Koobanally, Prof. Mogie Singh, Mrs Soohana and Dr. Linda Bester, for guiding
and directing me all through the diverse and exciting complexities of my Ph.D. research.
I thank my fellow lab mates in the biomedical research unit: Ochuko, Sanni, Xin Xiao, Rebecca,
Shazia, Kovania, Lindiwe, Veronica, Brian, and Nonto, for the stimulating discussions and
constructive criticisms in our seminars, as well as laborious efforts put in during our lab work in
particular animal study. All the fun times we had together in the course of my study will always be
cherished. Hope to do more of the fun part! Also, I will like to appreciate my friends Jude, Olakunle,
Jeremiah, Olayide, Nneka, Olayemi, Olamide, Nokhu, and Mr and Mrs Babatunde, as well as my
senior colleagues Dr. Chika, Dr. Mopuri, Dr. Collins and a host of others for their encouragement and
unfailing support.
How can I fail to mention the prayers and support of my spiritual family: Pastor and Mrs Adejimi
who with the members of the RCCG Durban stood in the gap for me in prayers for successful
completion of my degree? May God reward you immensely.
Utmost thanks go to my husband and my lead cheerleader Engr. Oluwaseun Oyebode (Ph.D), who
put up with my aloofness and unavailability which I exhibited sometimes because of my research,
and to my Son Master David Oyebode, your entrance into this world encouraged me to finish this
program in giant strides, I will be forever grateful to you both.
I cannot fail to mention the endearing support of my in-laws, colleagues and friends in the University
of Ibadan. Thanks for your encouragement.
Last but not the least, I would like to thank my parents – Lt. Col. (Rtd.) and Chief Mrs Daramola, for
encouraging me to pursue my dreams and supporting me spiritually and financially all throughout my
academic pursuit. I am forever grateful. To my siblings, Arch. Ayotilerewa Daramola, the Olokobas
and Tinuola Adegbemile, many thanks for your continuous advice and prayers.
A very special gratitude goes out to the National Research Foundation-The world academy of science
(NRF-TWAS) and the UKZN postgraduate office for providing the funding necessary for this work.
xii
TABLE OF CONTENTS
Page Number
ABSTRACT iii
PREFACE iv
DECLARATION 1 – PLAGIARISM v
DECLARATION 2 - PUBLICATIONS AND PRESENTATIONS vi
DEDICATION x
ACKNOWLEDGEMENTS xi
TABLE OF CONTENTS xii
LIST OF TABLES xx
LIST OF FIGURES xxiii
LIST OF ACRONYMS xxxii
1
1.1 Background of study 1
1.2 Prevalence of diabetes 2
1.3 Etiologic categories of diabetes mellitus 3
1.3.1 Type 1 diabetes (T1D) or insulin dependent diabetes mellitus (IDDM) 4
1.3.2 Type 2 diabetes (T2D) or non-insulin dependent diabetes mellitus (NIDDM) 4
1.3.3 Gestational diabetes mellitus (GDM) 5
1.4 The role of insulin in the pathogenesis of T2D 5
1.4.1 Insulin resistance 6
1.4.2 Mechanisms behind insulin resistance 7
1.5 Complications of diabetes 10
1.5.1 Inflammation 10
1.5.2 Endothelial/mitochondrial dysfunction 11
xiii
1.5.3 ROS formation and oxidative stress in the complication of T2D 11
1.6 Short-term complications of T2D 15
1.6.1 Hypoglycaemia 15
1.6.2 Hyperosmolar Hyperglycaemic Nonketotic Syndrome (HHNS) 15
1.6.3 Diabetic ketoacidosis (DKA) 15
1.7 Long-term complications of T2D 15
1.7.1 Microvascular complications 16
1.7.2 Macrovascular complications 17
1.8 Management of T2D 17
1.8.1 Exercise and physical activity 17
1.8.2 Dietary modifications 18
1.8.3 Pharmacologic management of T2D 18
1.8.4 The importance of medicinal plants in drug discovery 20
1.9 African medicinal plants in the treatment of T2D 21
1.10 Justification of the research 22
1.11 Scope and Limitations of the study 22
1.12 Aims and objectives 22
1.13 Thesis overview 23
25
2.1 Experimental design 25
2.1.1 Chemicals and reagents 26
2.1.2 Equipment 26
2.1.3 Collection and preparation of plant materials 27
2.1.4 Preparation of the crude extracts 27
2.2 Analytical methods 28
xiv
2.2.1 In vitro antioxidant activities of the isolated crude extracts 28
2.2.2 In vitro key anti-diabetic and anti-obesogenic enzymes inhibitory assays 30
2.2.3 Ex vivo antioxidant assays 31
2.2.4 Gas chromatography-mass spectrometric (GC-MS) analysis of most effective extracts and
fraction 34
2.2.5 Liquid Chromatography-Mass Spectroscopy (LC-MS) profiling 34
2.2.6 Fourier transform Infrared spectroscopy (FT-IR) analysis 35
2.2.7 Molecular Docking 35
2.3 In vitro and ex vivo antioxidant and anti-diabetic activities of solvent fractions derived from
the crude extracts 35
2.3.1 Solvent fractionation of the most active crude extracts from each plant 35
2.4 Ex vivo glucose absorption and glucose uptake study 36
2.5 In vivo antidiabetic activity of the most active fractions in a type 2 diabetes rats model 38
2.6 Serum analysis 42
2.7 Hepatic glycogen content 42
2.8 Histopathology analysis of the excised pancreas 43
2.9 In vivo antioxidant studies 43
44
3.1 Background 44
3.1.1 Ethnobotanical uses 45
3.1.2 Biological activities 45
3.2 Phytochemical constituents, antioxidant and antidiabetic activities of different extracts of the
leaves, stem and root barks of Alstonia boonei: An in vitro and in silico study 46
3.2.1 Abstract 46
3.2.2 Introduction 47
xv
3.2.3 Materials and methods 48
3.2.4 Results 48
3.2.5 Discussion 60
3.3 Fractions of Alstonia boonei leaves ameliorate oxidative stress and modulates key
hypoglycemic processes 63
3.3.1 Abstract 63
3.3.2 Introduction 63
3.3.3 Materials and methods 65
3.3.4 Results 65
3.3.5 Discussion 73
3.4 Effects of the butanol fraction of Alstonia boonei leaves on pancreatic histology, glucose
homeostasis and insulin secretion in diabetic rats 76
3.4.1 Abstract 76
3.4.2 Introduction 76
3.4.3 Materials and methods 77
3.4.4 Results 77
3.4.5 Discussion 84
3.5 Butanol fraction of Alstonia boonei leaves ameliorates oxidative stress in a type 2 diabetes
model of rats 87
3.5.1 Abstract 87
3.5.2 Introduction 87
3.5.3 Materials and methods 88
3.5.4 Results 88
3.5.5 Discussion 92
95
xvi
4.1 Background 95
4.1.1 Ethnomedical uses 96
4.1.2 Biological activities 96
4.1.3 Phytochemistry 96
4.2 Acalypha Wilkesiana ‘Java white’ scavenges free radicals in vitro and abates Fe2+ - induced
oxidative stress in rat pancreatic homogenates 97
4.2.1 Abstract 97
4.2.2 Introduction 97
4.2.3 Materials and methods 99
4.2.4 Results 99
4.2.5 Discussion 106
4.2.6 Conclusion 108
4.3 Acalypha wilkesiana ‘Java white’: Identification of some bioactive compounds by GC-MS
and effects on key enzymes linked to type 2 diabetes 109
4.3.1 Abstract 109
4.3.2 Introduction 109
4.3.3 Materials and methods 111
4.3.4 Results and Discussion 111
4.3.5 Conclusions 121
122
5.1 Background 122
5.1.1 Ethnobotanical uses 123
5.1.2 Biological activities 123
5.2 Crassocephalum rubens, a leafy vegetable suppresses oxidative pancreatic and hepatic injury,
and inhibits key enzymes linked to type 2 diabetes; in vitro, ex vivo and in silico 124
xvii
5.2.1 Abstract 124
5.2.2 Introduction 125
5.2.3 Materials and methods 126
5.2.4 Results 126
5.2.5 Discussion 135
5.2.6 Conclusions 137
5.3 Crassocephalum rubens improves pancreatic histology, insulin section, liver and kidney
function parameters in a type 2 diabetic model of rats 138
5.3.1 Abstract 138
5.3.2 Introduction 138
5.3.3 Materials and methods 139
5.3.4 Results 140
5.3.5 Discussion 147
5.3.6 Conclusions 149
5.4 Aqueous extract of Crassocephalum rubens aerial parts ameliorates oxidative stress in a type
2 diabetes model of rats 150
5.4.1 Abstract 150
5.4.2 Introduction 151
5.4.3 Materials and methods 152
5.4.4 Results 152
5.4.5 Discussion 158
5.4.6 Conclusions 159
160
6.1 Background 160
xviii
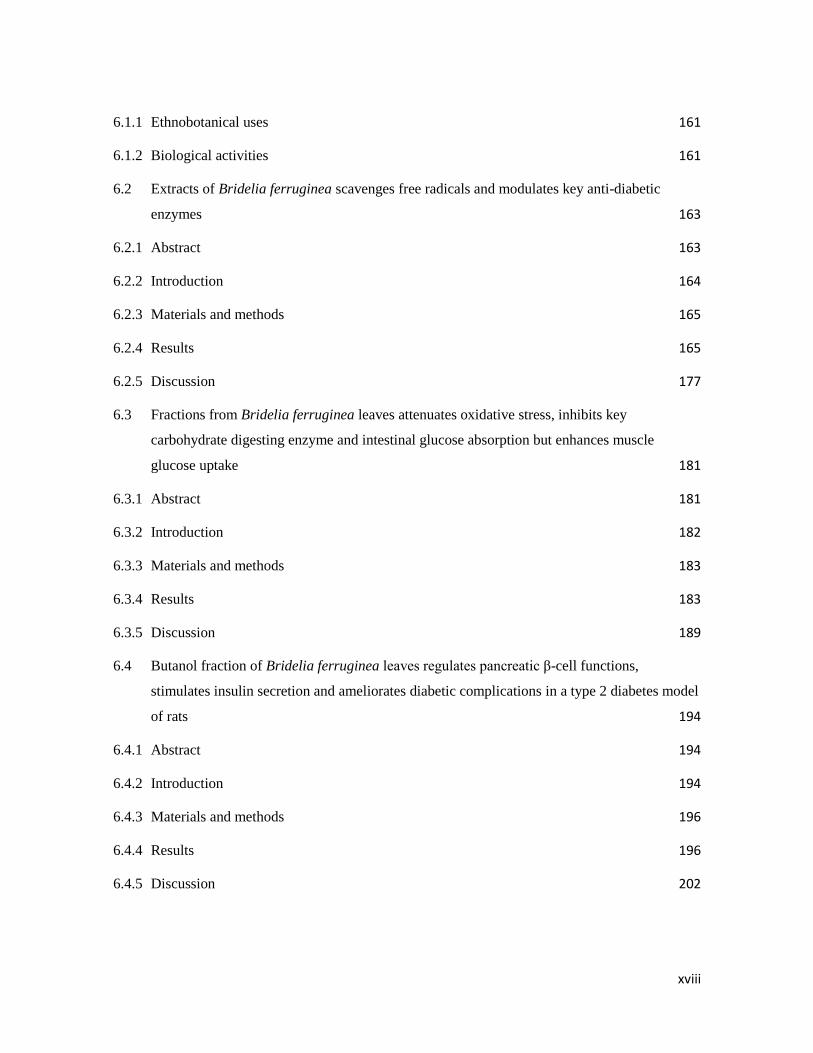
6.1.1 Ethnobotanical uses 161
6.1.2 Biological activities 161
6.2 Extracts of Bridelia ferruginea scavenges free radicals and modulates key anti-diabetic
enzymes 163
6.2.1 Abstract 163
6.2.2 Introduction 164
6.2.3 Materials and methods 165
6.2.4 Results 165
6.2.5 Discussion 177
6.3 Fractions from Bridelia ferruginea leaves attenuates oxidative stress, inhibits key
carbohydrate digesting enzyme and intestinal glucose absorption but enhances muscle
glucose uptake 181
6.3.1 Abstract 181
6.3.2 Introduction 182
6.3.3 Materials and methods 183
6.3.4 Results 183
6.3.5 Discussion 189
6.4 Butanol fraction of Bridelia ferruginea leaves regulates pancreatic β-cell functions,
stimulates insulin secretion and ameliorates diabetic complications in a type 2 diabetes model
of rats 194
6.4.1 Abstract 194
6.4.2 Introduction 194
6.4.3 Materials and methods 196
6.4.4 Results 196
6.4.5 Discussion 202

xix
206
7.1 Background 206
7.1.1 Ethnobotanical uses 206
7.1.2 Biological activities 207
7.2 Boerhaavia diffusa inhibits key enzymes linked to type 2 diabetes in vitro and in silico; and
modulates abdominal glucose absorption and muscle glucose uptake ex vivo 208
7.2.1 Abstract 208
7.2.2 Introduction 209
7.2.3 Results 210
7.2.4 Discussion 219
7.2.5 Conclusions 223
224
8.1 General discussion 224
8.2 General conclusions 228
8.3 Recommendations 228
REFERENCES 229
APPENDIX A 272
APPENDIX B 273
APPENDIX C 275
xx
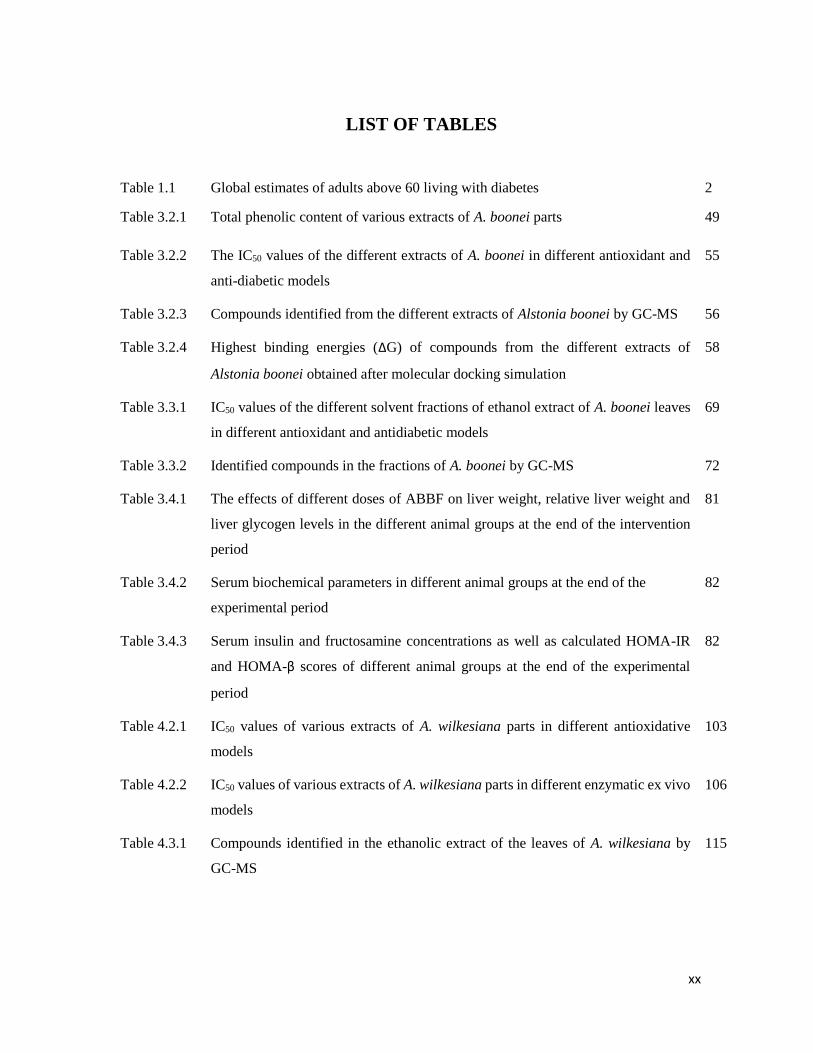
LIST OF TABLES
Table 1.1 Global estimates of adults above 60 living with diabetes 2
Table 3.2.1 Total phenolic content of various extracts of A. boonei parts 49
Table 3.2.2 The IC50 values of the different extracts of A. boonei in different antioxidant and
anti-diabetic models
55
Table 3.2.3 Compounds identified from the different extracts of Alstonia boonei by GC-MS 56
Table 3.2.4 Highest binding energies (∆G) of compounds from the different extracts of
Alstonia boonei obtained after molecular docking simulation
58
Table 3.3.1 IC50 values of the different solvent fractions of ethanol extract of A. boonei leaves
in different antioxidant and antidiabetic models
69
Table 3.3.2 Identified compounds in the fractions of A. boonei by GC-MS 72
Table 3.4.1 The effects of different doses of ABBF on liver weight, relative liver weight and
liver glycogen levels in the different animal groups at the end of the intervention
period
81
Table 3.4.2 Serum biochemical parameters in different animal groups at the end of the
experimental period
82
Table 3.4.3 Serum insulin and fructosamine concentrations as well as calculated HOMA-IR
and HOMA-β scores of different animal groups at the end of the experimental
period
82
Table 4.2.1 IC50 values of various extracts of A. wilkesiana parts in different antioxidative
models
103
Table 4.2.2 IC50 values of various extracts of A. wilkesiana parts in different enzymatic ex vivo
models
106
Table 4.3.1 Compounds identified in the ethanolic extract of the leaves of A. wilkesiana by
GC-MS
115
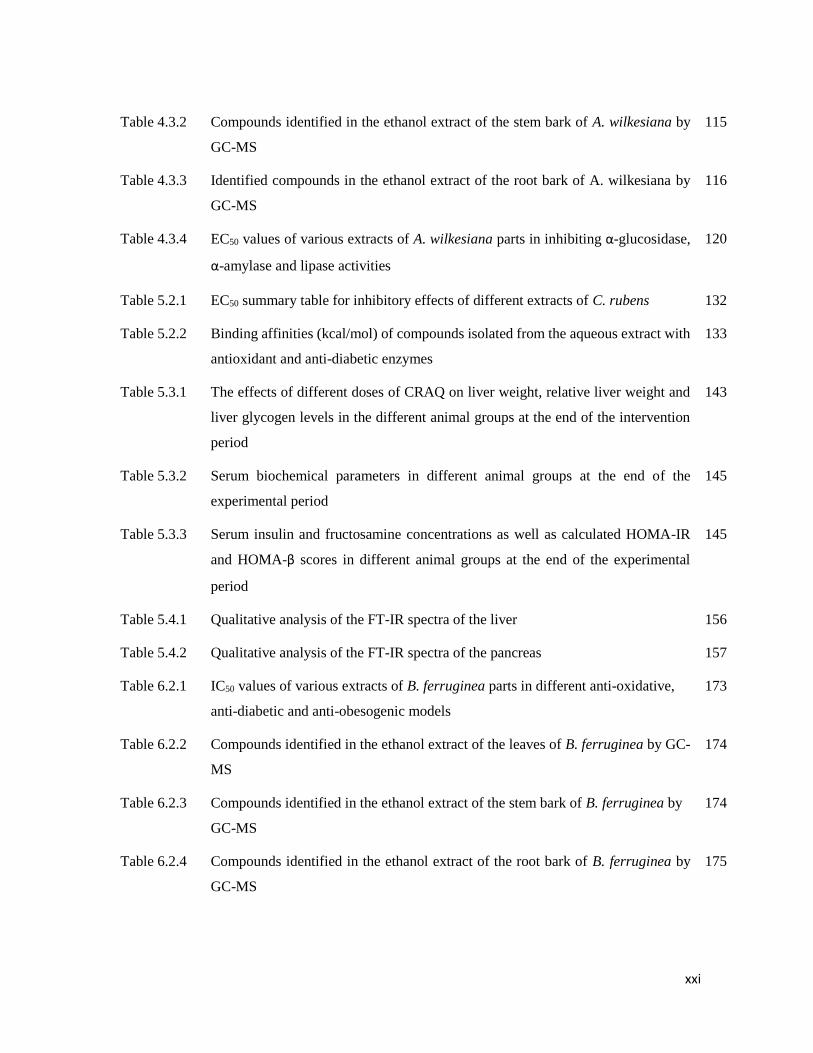
xxi
Table 4.3.2 Compounds identified in the ethanol extract of the stem bark of A. wilkesiana by
GC-MS
115
Table 4.3.3 Identified compounds in the ethanol extract of the root bark of A. wilkesiana by
GC-MS
116
Table 4.3.4 EC50 values of various extracts of A. wilkesiana parts in inhibiting α-glucosidase,
α-amylase and lipase activities
120
Table 5.2.1 EC50 summary table for inhibitory effects of different extracts of C. rubens 132
Table 5.2.2 Binding affinities (kcal/mol) of compounds isolated from the aqueous extract with
antioxidant and anti-diabetic enzymes
133
Table 5.3.1 The effects of different doses of CRAQ on liver weight, relative liver weight and
liver glycogen levels in the different animal groups at the end of the intervention
period
143
Table 5.3.2 Serum biochemical parameters in different animal groups at the end of the
experimental period
145
Table 5.3.3 Serum insulin and fructosamine concentrations as well as calculated HOMA-IR
and HOMA-β scores in different animal groups at the end of the experimental
period
145
Table 5.4.1 Qualitative analysis of the FT-IR spectra of the liver 156
Table 5.4.2 Qualitative analysis of the FT-IR spectra of the pancreas 157
Table 6.2.1 IC50 values of various extracts of B. ferruginea parts in different anti-oxidative,
anti-diabetic and anti-obesogenic models
173
Table 6.2.2 Compounds identified in the ethanol extract of the leaves of B. ferruginea by GC-
MS
174
Table 6.2.3 Compounds identified in the ethanol extract of the stem bark of B. ferruginea by
GC-MS
174
Table 6.2.4 Compounds identified in the ethanol extract of the root bark of B. ferruginea by
GC-MS
175
xxii
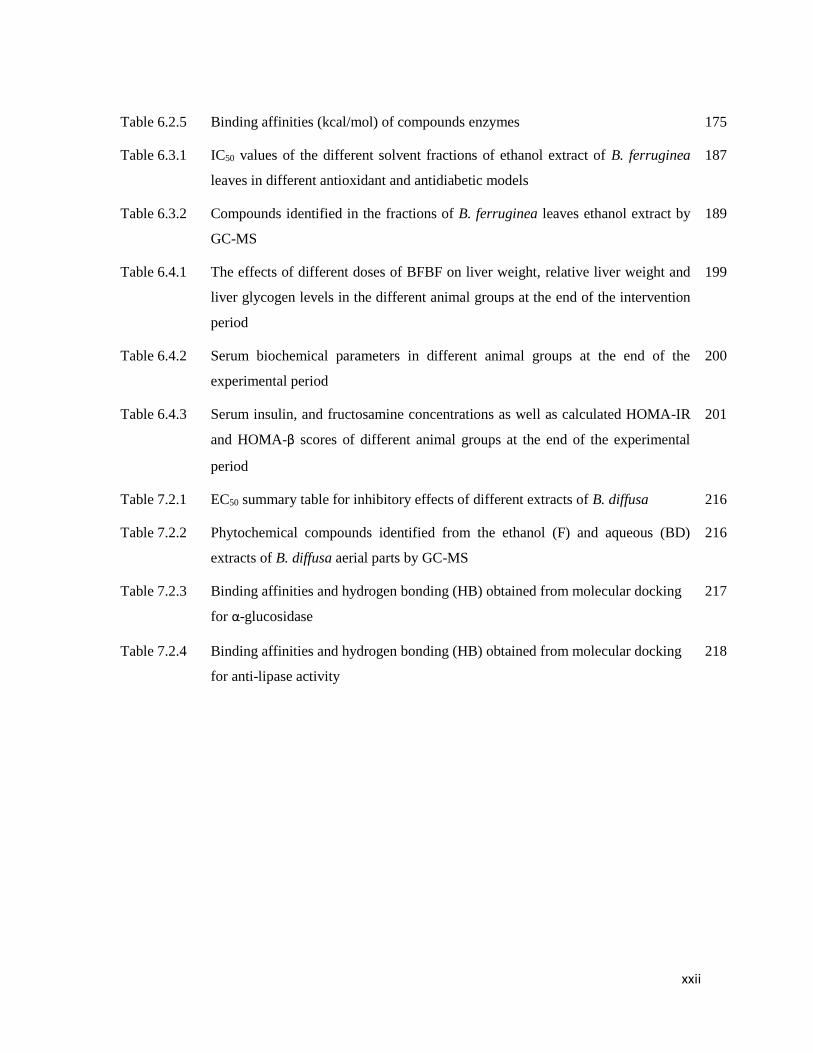
Table 6.2.5 Binding affinities (kcal/mol) of compounds enzymes 175
Table 6.3.1 IC50 values of the different solvent fractions of ethanol extract of B. ferruginea
leaves in different antioxidant and antidiabetic models
187
Table 6.3.2 Compounds identified in the fractions of B. ferruginea leaves ethanol extract by
GC-MS
189
Table 6.4.1 The effects of different doses of BFBF on liver weight, relative liver weight and
liver glycogen levels in the different animal groups at the end of the intervention
period
199
Table 6.4.2 Serum biochemical parameters in different animal groups at the end of the
experimental period
200
Table 6.4.3 Serum insulin, and fructosamine concentrations as well as calculated HOMA-IR
and HOMA-β scores of different animal groups at the end of the experimental
period
201
Table 7.2.1 EC50 summary table for inhibitory effects of different extracts of B. diffusa 216
Table 7.2.2 Phytochemical compounds identified from the ethanol (F) and aqueous (BD)
extracts of B. diffusa aerial parts by GC-MS
216
Table 7.2.3 Binding affinities and hydrogen bonding (HB) obtained from molecular docking
for α-glucosidase
217
Table 7.2.4 Binding affinities and hydrogen bonding (HB) obtained from molecular docking
for anti-lipase activity
218
xxiii
LIST OF FIGURES
Figure 1.1 Estimate number of diabetes cases globally in 2017 and projected increase by 2045 2
Figure 1.2 The Endocrine System 6
Figure 1.3 Insulin receptor and glucose transport 8
Figure 1.4 The insulin signalling pathway 9
Figure 1.5 Pathways necessary for production of reactive oxygen species (ROS) 12
Figure 1.6 ROS production by the Electron transport chain 14
Figure 2.1 Flowchart showing the entire experimental approach 25
Figure 2.2 Flowchart to describe the sequential extraction of plant samples 28
Figure 2.3 Flowchart showing the step by step fractionation of the crude extracts 36
Figure 2.4 Flow diagram describing comprehensive in vivo experiment 40
Figure 3.1 Alstonia boonei (Apocynaceae) 44
Figure 3.2.1 Total reducing power (relative to gallic acid) of leaves, stem bark and root bark
extracts of A. boonei
50
Figure 3.2.2 DPPH radical scavenging activity of leaves, stem bark and root bark extracts of A.
boonei
51
Figure 3.2.3 Percentage of nitric oxide scavenging activities of extracts from leaves, stem bark
and root bark of A. boonei
52
Figure 3.2.4 The α-glucosidase inhibitory effects of a) leaves, b) stem bark and c) root bark
extracts of A. boonei
53
Figure 3.2.5 The α-amylase inhibitory effects of leaves, stem bark and root bark extracts of A.
boonei
54

xxiv
Figure 3.2.6 Aliphatic acids and esters isolated from Alstonia boonei 57
Figure 3.2.7 Sterols, sterol precursors and aromatics from Alstonia boonei 57
Figure 3.2.8 The 3D representation of (a) hydrogen bonding interaction and (b) complex with
active site residues of α- Glucosidase complexed with Vitamin E (highest binding
energy)
59
Figure 3.2.9 The 3D representation of (a) hydrogen bonding interaction and (b) complex with
active site residues of α-amylase complexed with Stigmasterol (highest binding
energy)
59
Figure 3.3.1 DPPH radical scavenging activities of different solvent fractions of ethanol extract
of A. boonei leaves
66
Figure 3.3.2 Total reducing power (relative to gallic acid) of different solvent fractions of ethanol
extract of A. boonei leaves
66
Figure 3.3.3 Effect of fractions of A. boonei leaves on a) catalase activity, b) SOD activity, c)
GSH level and d) lipid peroxidation in oxidative hepatic injury
67
Figure 3.3.4 The α-glucosidase inhibitory effects of the fractions from ethanol extract of A.
boonei leaves
68
Figure 3.3.5 Effect of the fractions from the ethanol extract of A. boonei leaves on (a) glucose
absorption in isolated rat jejunum and (b) glucose uptake in rat psoas muscle
70
Figure 3.3.6 Long chain hydrocarbons, alkyl esters and alcohols from fractions of A. boonei
leaves
71
Figure 3.3.7 Sterols and aromatics from fractions of A. boonei leaves 71
Figure 3.4.1 The effects of oral treatment of butanol fraction of A. boonei leaves on
food and fluid intake in different animal groups during the experimental period
78
Figure 3.4.2 The effects of oral treatment of butanol fraction of A. boonei leaves on mean body
weight gain for all groups of experimental animals over the seven weeks
experimental period
78
xxv
Figure 3.4.3 The effects of oral treatment of butanol fraction of A. boonei leaves on weekly blood
glucose concentrations in different animal groups during the intervention period
79
Figure 3.4.4 The effects of oral treatment of butanol fraction of A. boonei leaves on oral glucose
tolerance test (OGTT) and corresponding area under the curve (AUC) of different
animal groups in the last week of the intervention period
80
Figure 3.4.5 The effects of oral treatment of butanol fraction of A. boonei leaves on serum lipid
profile of different animal groups at the end of the intervention period
81
Figure 3.4.6 Histopathological images of the pancreas of different animal groups at the end of
the experiment
83
Figure 3.5.1 The effects of oral treatment of ABBF on thiobarbituric acid reactive substances
(MDA equivalent) in the serum, liver, pancreas, heart and kidneys of all animal
groups at the end of the intervention period
89
Figure 3.5.2 The effects of oral treatment of ABBF on reduced glutathione (GSH) levels in the
serum, liver, pancreas, heart and kidneys of all animal groups at the end of the
intervention period
90
Figure 3.5.3 The effects of oral treatment of ABBF on catalase activity in the serum, liver,
pancreas, heart and kidneys of all animal groups at the end of the intervention period
90
Figure 3.5.4 The effects of oral treatment of ABBF on SOD activity in the serum, liver, pancreas,
heart and kidney of all animal groups at the end of the intervention period
91
Figure 3.5.5 The effects of oral treatment of ABBF on glutathione reductase (GR) activity in the
serum, liver, pancreas, heart and kidney of all animal groups at the end of the
intervention period
91
Figure 3.5.6 The effects of oral treatment of ABBF on glutathione peroxidase (GPx) activity in
the serum, liver, pancreas, heart and kidney of all animal groups at the end of the
intervention period
92
Figure 4.1 Acalypha wilkesiana ‘Java white’ 95
xxvi
Figure 4.2.1 Total phenolic contents of the A. wilkesiana extracts 99
Figure 4.2.2 DPPH scavenging activities of A. wilkesiana extracts 100
Figure 4.2.3 Nitric oxide scavenging activities of A. wilkesiana extracts 101
Figure 4.2.4 Total reducing power of a) leaves, b) stem bark and c) root bark extracts and
hydroxyl oxide scavenging activities of A. wilkesiana d) leaves, e) stem bark and f)
root bark extracts respectively
102
Figure 4.2.5 Catalase activities of a) leaves, b) stem bark and c) root bark extracts and SOD
activities of d) leaves, e) stem bark and f) root bark extracts of A. wilkesiana in
oxidative pancreatic injury
104
Figure 4.2.6 Effect of A. wilkesiana a) leaves, b) stem bark and c) root bark extracts on reduced
glutathione (GSH) level in oxidative pancreatic injury
105
Figure 4.3.1 Long chain alkyl acids, esters, ketones and alcohols identified from the ethanolic
extract of the leaves, stem bark and root bark of A. wilkesiana
112
Figure 4.3.2 Aromatics, sterols and triterpenes identified in the ethanolic extract of leaves, stem
and root bark of A. wilkesiana
113
Figure 4.3.3 GC-MS chromatogram of ethanol extract of A. wilkesiana leaves a), stem bark b)
and root bark c)
114
Figure 4.3.4 The α-glucosidase and α-amylase inhibitory activities of leaves (a & b), stem bark
(c & d) and root bark (e & f) extracts of A. wilkesiana
118
Figure 4.3.5 Anti-lipase activities of: a) leaves, b) stem bark and c) root bark extracts of A.
wilkesiana
119
Figure 5.1 Crassocephalum rubens 122
Figure 5.2.1 Total phenolic contents of C. rubens extracts 126
Figure 5.2.2 DPPH scavenging activity of C. rubens extracts 127
Figure 5.2.3 Ferric reducing antioxidant power (FRAP) activity of C. rubens extracts 127
xxvii
Figure 5.2.4 Nitric oxide scavenging activities of C. rubens extracts 128
Figure 5.2.5 Effect of extracts of C. rubens on (A) catalase activity, (B) Superoxide dismutase
(SOD) activity, (C) Reduced glutathione (GSH) level and (D) lipid peroxidation in
oxidative pancreatic injury
129
Figure 5.2.6 (A) α-glucosidase, (B) Lipase inhibitory activity of extracts of C. rubens 130
Figure 5.2.7 Effect of the ethanol extract of C. rubens on (A) glucose absorption in isolated rat
jejunum and (B) glucose uptake in rat psoas muscle
131
Figure 5.2.8 Structures of the compounds isolated from the aqueous extract of C. rubens through
LC-MS analysis
131
Figure 5.2.9 Illustration of 3-D (a) and 2-D (b) interactions with amino acid residues of docked
complex (Sanguisorbic acid dilactone-catalase) isolated from the aqueous extract
with the highest binding affinity -10.5 kcal/mol (Highest binding affinity compared
to all antioxidant enzyme considered)
134
Figure 5.2.10 Illustration of 3-D (a) and 2-D (b) interactions with amino acid residues of docked
complex (Sanguisorbic acid dilactone-lipase) isolated from the aqueous extract with
the highest binding affinity -10.4 kcal/mol (Highest binding affinity compared to α-
glucosidase; anti-diabetic)
134
Figure 5.3.1 Mean feed and fluid intake in different animal groups during the experimental
period
140
Figure 5.3.2 Mean body weight change in all groups over the seven weeks experimental period 141
Figure 5.3.3 Weekly blood glucose concentrations in different animal groups during the
intervention period
142
Figure 5.3.4 Oral glucose tolerance test (OGTT) and corresponding area under the curve (AUC)
of different animal groups in the last week of the intervention period
143
Figure 5.3.5 Serum lipid profile of different animal groups at the end of the intervention period 144

xxviii
Figure 5.3.6 Histopathological images of the pancreas of different animal groups at the end of
the experiment
146
Figure 5.4.1 Thiobarbituric acid reactive substances (MDA equivalent) in the serum, liver,
pancreas, heart and kidneys of all animal groups at the end of the intervention period
152
Figure 5.4.2 Reduced glutathione (GSH) levels in the serum, liver, pancreas, heart and kidneys
of all animal groups at the end of the intervention period
153
Figure 5.4.3 Catalase activity in the serum, liver, pancreas, heart and kidneys of all animal groups
at the end of the intervention period
153
Figure 5.4.4 SOD activity in the serum, liver, pancreas, heart and kidney of all animal groups at
the end of the intervention period
154
Figure 5.4.5 Glutathione reductase (GR) activity in the serum, liver, pancreas, heart and kidney
of all animal groups at the end of the intervention period
155
Figure 5.4.6 Glutathione peroxidase (GPx) activity in the serum, liver, pancreas, heart and
kidney of all animal groups at the end of the intervention period
155
Figure 5.4.7 FT-IR absorption spectra of the liver in the regions of 4000-400 cm-1 from different
experimental groups
156
Figure 5.4.8 FT-IR absorption spectra of the pancreas in the regions of 4000-400 cm-1 from
different experimental groups
157
Figure 6.1 Bridelia ferruginea Benth (Euphorbiaceae) 160
Figure 6.2.1 Total phenolic contents of B. ferruginea extracts 165
Figure 6.2.2 (a-c) Ferric reducing antioxidant power (FRAP) and (d-f) DPPH scavenging
activity of extracts from leaves, stem bark and root barks of B. ferruginea
166
Figure 6.2.3 (a-c) Nitric oxide and (d-f) Hydroxyl radical scavenging activity of extracts from
leaves, stem bark and root barks of B. ferruginea
167
xxix
Figure 6.2.4 (a-c) -glucosidase and (d-f) -amylase inhibiting activity of extracts from leaves,
stem bark and root barks of B. ferruginea
169
Figure 6.2.5 (a-c) Lipase inhibiting activity of extracts from leaves, stem bark and root barks of
B. ferruginea
170
Figure 6.2.6 Sterols and other terpenoids from Bridelia ferruginea 171
Figure 6.2.7 Aromatic and aliphatic compounds from Bridelia ferruginea 172
Figure 6.2.8 Illustration of 3-D (a) and 2-D (b) interactions with amino acid residues of docked
β-amyrin-α-glucosidase complex with the highest binding affinity
176
Figure 6.2.9 Illustration of 3-D (a) and 2-D (b) interactions with amino acid residues of docked
4-Phenylbenzophenone -Lipase complex with the highest binding affinity
176
Figure 6.2.10 Illustration of 3-D (a) and 2-D (b) interactions with amino acid residues of docked
4-Phenylbenzophenone – amylase complex with the highest binding affinity
177
Figure 6.3.1 DPPH inhibiting activity of B. ferruginea fractions 183
Figure 6.3.2 Ferric reducing antioxidant power (FRAP) activity of fractions of B. ferruginea
leaves
184
Figure 6.3.3 Effect of fractions of B. ferruginea leaves on a) Reduced glutathione, b) catalase, c)
Superoxide dismutase (SOD) and d) Lipid peroxidation in oxidative pancreatic
injury
185
Figure 6.3.4 The -glucosidase inhibitory activity of B. ferruginea leaves fractions 186
Figure 6.3.5 Effect of the butanol and aqueous fractions of the leaves of B. ferruginea on glucose
absorption in isolated rat jejunum
186
Figure 6.3.6 Effect of the a) butanol and b) aqueous fraction of the leaves of B. ferruginea on
glucose uptake in isolated rat psoas muscle
187
Figure 6.3.7 Identified bioactive components in the DCM, butanol, aqueous and ethyl acetate
fractions of the B. ferruginea
188
xxx
Figure 6.4.1 Mean feed and fluid intakes of different groups during the entire experimental
period
196
Figure 6.4.2 Mean body weight change for all groups of experimental animals over the seven
weeks experimental period
197
Figure 6.4.3 Weekly blood glucose concentrations in different animal groups during the
intervention period
197
Figure 6.4.4 Oral glucose tolerance test (OGTT) and corresponding area under the curve (AUC)
of different animal groups in the last week of the intervention period
198
Figure 6.4.5 Serum lipid profile of different animal groups at the end of the intervention period 199
Figure 6.4.6 Histopathological images of the pancreas of different animal groups at the end of
the experiment
202
Figure 7.1 Boerhaavia diffusa Linn (Nyctaginaceae) 206
Figure 7.2.1 Total phenolic contents of B. diffusa extracts 211
Figure 7.2.2 Ferric reducing antioxidant power (FRAP) of B. diffusa aerial part extracts 211
Figure 7.2.3 DPPH scavenging activity of B. diffusa aerial part extracts 212
Figure 7.2.4 Effect of extracts of B. diffusa aerial parts on (A) catalase activity, (B) SOD activity,
(C) GSH level and (D) lipid peroxidation in oxidative pancreatic injury
213
Figure 7.2.5 (A) α-glucosidase, (B) Lipase inhibitory activity of aerial part extracts of B. diffusa 214
Figure 7.2.6 Effect of the ethanol extract of the aerial part of B. diffusa on (A) glucose absorption
in isolated rat jejunum and (B) glucose uptake in rat psoas muscle
215
Figure 7.2.7 Structures of the compounds isolated from the ethanol (F) and aqueous (BD)
extracts of B. diffusa aerial parts
217
Figure 7.2.8 3D structure of showing the interacting residues (hydrogen bonding and
hydrophobic) of extracts with highest binding affinities around binding pocket of
219
xxxi
(A) and (D) Xanthone (B) and (E) 9-(4-Methoxyphenyl) xanthene and (C) and (F)
Stigmasterol to complexed α-glucosidase and Lipase respectively
Figure 8.1 Pictures of the plants used in this study. a) Alstonia boonei, b) Acalypha wilkesiana
c) Crassocephalum rubens, d) Bridelia ferruginea, e) Boerhaavia diffusa
227
Figure 8.2 Schematic diagram showing the possible mechanisms of action of the investigated
plants and their phytochemicals
228

xxxii
LIST OF ACRONYMS
6-HD 6-hydroxydopamine
ACE associated chemical enterprise
ADA American diabetes association
AGE advanced glycation end products
ATP adenosine triphosphate
AUC area under the curve
BC Before Christ
CRP c-reactive proteins
CVD cardiovascular disease
DABH diabetic animals treated with high dose of A. boonei
DABL diabetic animals treated with low dose of A. boonei
DAG Diacylglycerol
DBFL diabetic animals treated with low dose of B. ferruginea
DCRH diabetic animals treated with high dose of C. rubens
DCRL diabetic animals treated with low dose of C. rubens
DETAPAC diethylenetriaminepentaacetic acid
DKA diabetic ketoacidosis
DN diabetic nephropathy
DNS dinitrosalicylic acid
DNS Dinitrosalicylate
DPP-4 dipeptidyl peptidase-4
DPPH 1,1-diphenyl-2-picrylhydrazyl radical
DR diabetic retinopathy
DTNB 5,5′-dithiobisnitrobenzoic
EDTA ethylenediaminetetraacetic acid
eNOS endothelial nitric oxide synthase

xxxiii
ETC electron transport chain
FADH2 flavin adenine dinucleotide
FRAP ferric (Fe3+) reducing antioxidant power
G6P glucose-6-phospahtase
GAD glutamic acid decarboxylase
GAE gallic acid equivalent
GC-MS gas chromatography-mass spectrometry
GDM gestational diabetes
GDP gross domestic product
GFAT glutamine fructose 6-phosphate amidotransferase
GIP glucose-dependent insulinotropic peptide
GLP-1 glucagon like peptide-1
GLUT4 glucose transporter 4
GSH reduced glutathione
GSSG oxidized glutathione
H2O2 hydrogen peroxide
HDL high density lipoprotein
HHNS hyperosmolar hyperglycemic nonketotic syndrome
HOMA-IR homeostatic model assessment-insulin resistance
HOMA-β homeostatic model assessment-beta cell
IDDM Insulin dependent diabetes mellitus
IDF international diabetes federation
IGF-IR insulin growth factor-insulin receptor
IL-1 interleukin-1
IL-2 interleukin-2
IRS insulin receptor substrate
K+-ATP potassium adenosine triphosphate
LDL low density lipoprotein
xxxiv
MAPK mitogen-activated protein kinase
MCP-1 monocytes chemoattractant protein-1
MDA Malondialdehyde
MOPS 3-(N-morpholino) propanesulfonic acid
mRNA mitochondrial RNA
NAB group of normal animals treated with high dose of A. boonei
NADH nicotinamide adenine dinucleotide
NADPH nicotinamide adenosine dinucleotide
NBF group of normal animals treated with high dose of B. ferruginea
NCR group of normal animals treated with high dose of C. rubens
NEFAs non-esterified fatty acids
NIDDM non-insulin dependent diabetes mellitus
NO nitric oxide
OGTT oral glucose tolerance test
OXPHOS oxidative phosphorylation
PI3K phosphoinositide 3-kinase
PIP2 phosphatidylinositol 4,5-bisphosphate
PKA protein kinase-A
PKB protein kinase B
PKC protein kinase-C
pNPG p-nitrophenyl-α-D-glucopyranoside
PPARγ Peroxisome proliferator-activated receptor gamma
ROS reactive oxygen species
SGL2 Sodium-glucose co-transporter-2
SHP-1 Src homology-2 domian-containing phosphatase-1
SOD superoxide dismutase
T1D type 1 diabetes
T2D type 2 diabetes
xxxv
TCA trichloroacetic acid
TGF-β transforming growth factor beta
TNB thio-2-nitrobenzoic acid
TNF-α tumor necrosis factor-alpha
TNF-α tumor necrosis factor
UDP-GlcNAc uridine diphosphate n-acetylglucosamine
USF upstream stimulatory factors
WHO world health organisation
1
INTRODUCTION AND LITERATURE REVIEW
1.1 Background of study
The word Diabetes was derived from a Greek word around 1500 BC and means to siphon since it was
earlier associated with excessive wasting of essential minerals of the body through urination
(Lakhtakia, 2013). This urine was discovered to have a sweet taste which then led to the Latin name
diabetes which means honey sweet (Zajac et al., 2010). Diabetes mellitus is a complicated metabolic
disease which is brought about by high blood glucose levels (hyperglycaemia) due to defective insulin
signalling and function (De Felice and Ferreira, 2014). Hyperglycaemia produces symptoms such as
excessive thirst (polydipsia), habitual urination (polyuria), unexplained weight loss and frequent
eating (polyphagia). Insulin is a hormone synthesized in the pancreatic β-cells and is required to
effectively use glucose from digested food as an energy source (Chase et al., 1989). A spike in glucose
levels due to postprandial digestion of food triggers insulin to transport the glucose to the needed
peripheral organs for utilization (Geijselaers et al., 2017; Nolan et al., 2015). Insulin functions
effectively by increasing glycogenesis and transport of glucose to the liver, muscle and adipose
tissues. Insulin resistance leads to chronic hyperglycaemia generating anomalies in complex sugars,
protein and fatty acid metabolism (Nolan et al., 2015).
Diabetes can be controlled by different types of treatment modalities the most common of which is
the use of synthetic drugs. These drugs though sometimes effective when used singly or in
combination with other drugs, are not without side effects. Examples of these drugs are: metformin
(a biguanide), insulin, rosiglitazone (a thiazolidinedione) with side effects such as nausea, weight
gain/lost, high cost and lactic acidosis amongst others (Chaudhury et al., 2017). Interestingly
traditional medicine could be effective in the treatment and control of diverse diseases. This is because
plants contain phytochemicals which could render synergistic functions in the treatment of diseases
such as diabetes. Several researches have mentioned the efficacy of medicinal plants in the
management of diabetes (Choudhury et al., 2017; Mohammed et al., 2014). The vast array of
medicinal plants gives more opportunities for researchers to carry out more studies with a view to
harness the spread of diseases using medicinal plants. Many of these medicinal plants are currently
being used by traditional healers for the treatment of diabetes but scientific evidence behind the use
2
of many of these medicinal plants is still unknown despite the rapidly growing prevalence of diabetes
globally.
1.2 Prevalence of diabetes
Presently, over 422 million cases of diabetes have been recorded, which means 1 in 11 people in the
world has diabetes and there will be an estimated increase by 2030 to 640 million cases i.e. 1 in 10
people will have diabetes (Conway et al., 2018; WHO, 2016). This increase can be linked to factors
such as change in diet, urbanization, sedentary lifestyles, aging and increasing population. There has
been a global rise of diabetic cases as compared to the year 1980 where only 108 million cases were
recorded as diabetic (IDF, 2015). This increase can be noticeable mostly in those in the age range of
20-65 years (Conway et al., 2018).
An increase in the number of deaths due to complications of diabetes has also been recorded: 3.96
million deaths were recorded amongst adults aged 20 - 79 years in 2010. This number has risen to 5
million in 2015; signifying a 26 % increase within the 5-year period (Zheng et al., 2018). Statistics
also show that, as at 2017, 3.2 million deaths have been recorded for the age range of 60 - 99 years
(Cho et al., 2018) (Table 1.1). The rise in diabetes has a high impact on the economy globally. Factors
like high cost of drugs, loss of productivity and premature deaths negatively impacts on a nation’s
Gross Domestic Product (GDP) (Bouguerra et al., 2007; Edelman and Polonsky, 2017).
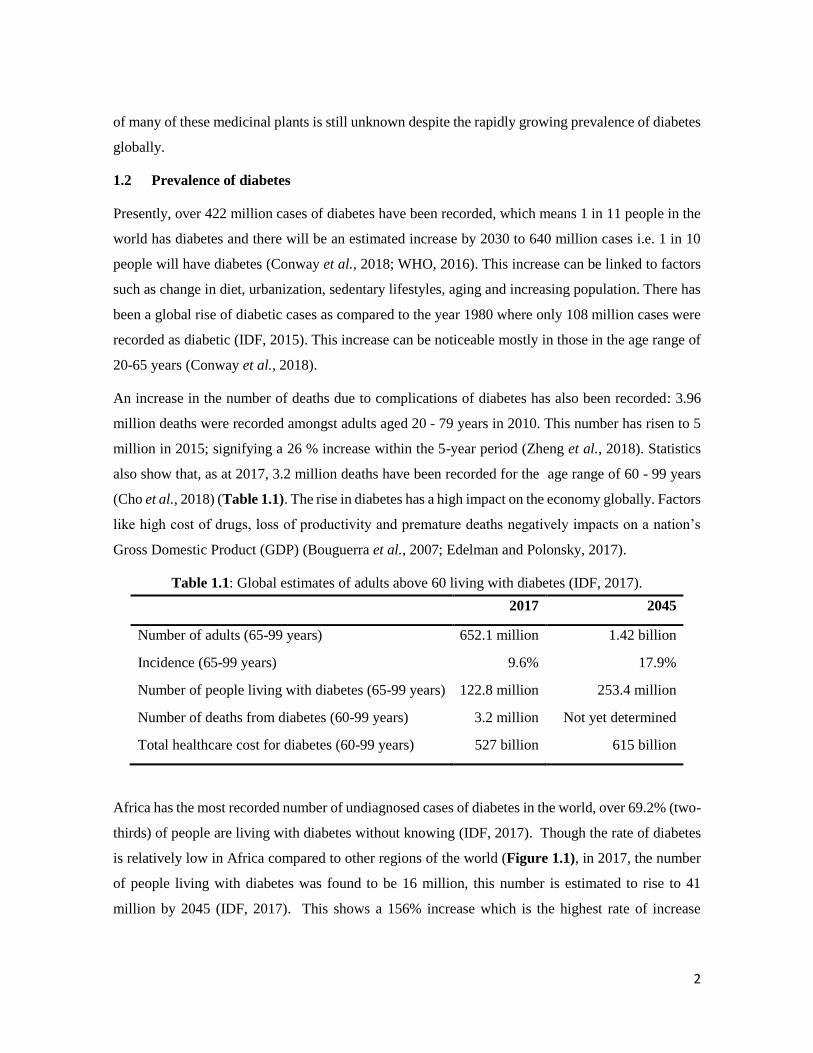
Table 1.1: Global estimates of adults above 60 living with diabetes (IDF, 2017).
2017 2045
Number of adults (65-99 years) 652.1 million 1.42 billion
Incidence (65-99 years) 9.6% 17.9%
Number of people living with diabetes (65-99 years) 122.8 million 253.4 million
Number of deaths from diabetes (60-99 years) 3.2 million Not yet determined
Total healthcare cost for diabetes (60-99 years) 527 billion 615 billion
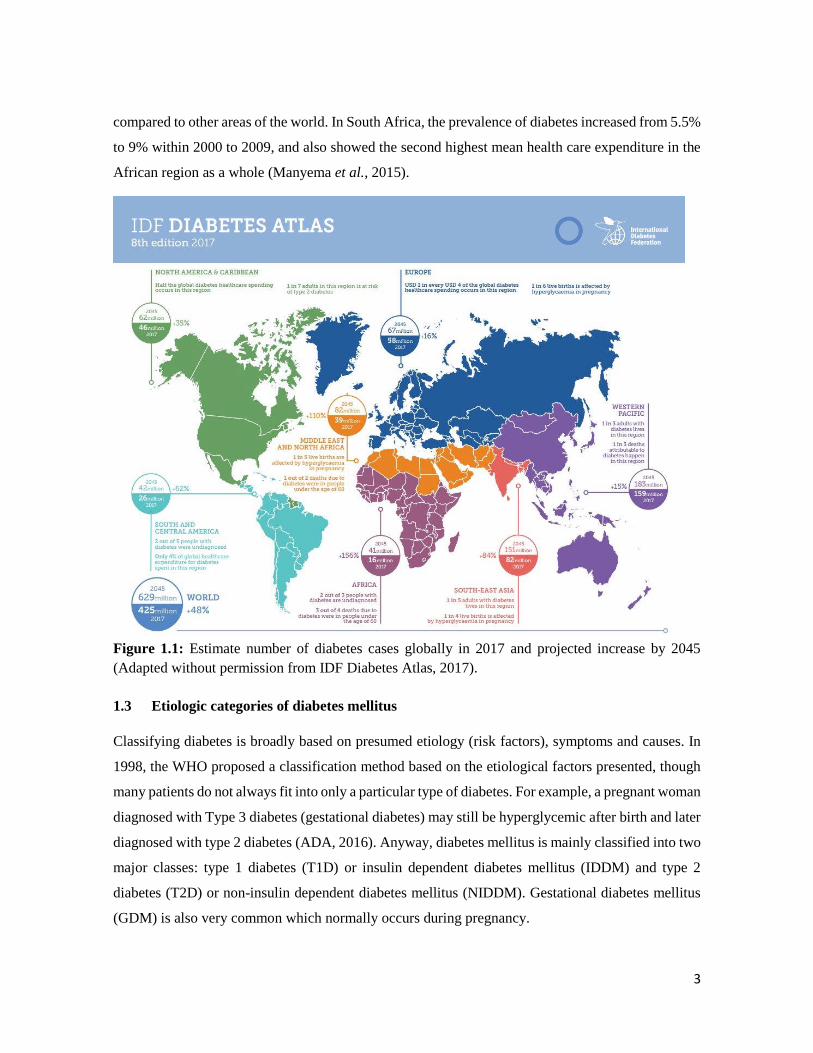
Africa has the most recorded number of undiagnosed cases of diabetes in the world, over 69.2% (two-
thirds) of people are living with diabetes without knowing (IDF, 2017). Though the rate of diabetes
is relatively low in Africa compared to other regions of the world (Figure 1.1), in 2017, the number
of people living with diabetes was found to be 16 million, this number is estimated to rise to 41
million by 2045 (IDF, 2017). This shows a 156% increase which is the highest rate of increase
3
compared to other areas of the world. In South Africa, the prevalence of diabetes increased from 5.5%
to 9% within 2000 to 2009, and also showed the second highest mean health care expenditure in the
African region as a whole (Manyema et al., 2015).
Figure 1.1: Estimate number of diabetes cases globally in 2017 and projected increase by 2045
(Adapted without permission from IDF Diabetes Atlas, 2017).
1.3 Etiologic categories of diabetes mellitus
Classifying diabetes is broadly based on presumed etiology (risk factors), symptoms and causes. In
1998, the WHO proposed a classification method based on the etiological factors presented, though
many patients do not always fit into only a particular type of diabetes. For example, a pregnant woman
diagnosed with Type 3 diabetes (gestational diabetes) may still be hyperglycemic after birth and later
diagnosed with type 2 diabetes (ADA, 2016). Anyway, diabetes mellitus is mainly classified into two
major classes: type 1 diabetes (T1D) or insulin dependent diabetes mellitus (IDDM) and type 2
diabetes (T2D) or non-insulin dependent diabetes mellitus (NIDDM). Gestational diabetes mellitus
(GDM) is also very common which normally occurs during pregnancy.
4
1.3.1 Type 1 diabetes (T1D) or insulin dependent diabetes mellitus (IDDM)
Formally known as juvenile onset diabetes, this type of diabetes is a self-destroying (autoimmune)
condition, whereby the body’s immune system attacks the pancreatic β-cells initiating insulin
deficiency (Loghmani, 2005; Motala et al., 2003). Islet cell autoantibodies, autoantibodies to insulin
and GAD (GAD65) and autoantibodies to the tyrosine phosphatases (1A-2 and 1A-2β) are identified
as the markers for autoimmune destruction of the pancreatic β-cells (ADA, 2010). Most cases of T1D
have exhibited presence of islet cells antibodies in the blood. These antibodies can be detected in
human blood for several years before the onset of T1D. Children and babies are more prone to this
disease because β-cell dysfunction occurs faster young age compared to adults. Additionally, it is
also suggested that environmental factors such as toxins, diets and enteroviruses can induce the
generation of T-cell dependent autoimmunity in genetically susceptible individuals leading to T1D
(Devendra et al., 2004). T1D holds the lowest prevalence (about 5%) of all diabetic cases (Fonseca,
2009).
Symptoms of T1D include polydipsia (excessive thirst), polyuria (increased urination), polyphagia
(unexplained hunger) and persistent hyperglycaemia. The treatment for T1D usually involves the
injection of insulin before complications of ketoacidosis and coma occurs and this usually spans
through a lifetime (Atkinson, 2012). Unfortunately, no treatment to date has been able to prevent the
onset or progression of T1D in those at risk (Siddiqui et al., 2013).
1.3.2 Type 2 diabetes (T2D) or non-insulin dependent diabetes mellitus (NIDDM)
This category of diabetes accounts for 90-95% of all diabetic cases. It presents in individuals with
sustained insulin resistance followed by moderate insulin deficiency. T2D has recently been classified
as a progressive disease since the function of pancreatic 𝛽-cells reduces over time (Fonseca, 2009).
Conditions like increased serum low density lipoprotein (LDL), low serum high density lipoprotein
(HDL) concentrations, hypertension and increased risk of cardiovascular diseases usually follow the
detection of T2D if left unmanaged (Costacou et al., 2011; Stamler et al., 1993; Van Linthout et al.,
2010; von Eckardstein and Widmann, 2014). All of these diseases are defined together as metabolic
syndrome (Alshehri, 2010; Ford, 2005). Diet, sedentary life style and urbanization are the main
factors that lead to the progression of T2D.

5
1.3.3 Gestational diabetes mellitus (GDM)
This type of diabetes describes the signs of hyperglycemia experienced during pregnancy which
disappear immediately after the termination of pregnancy (Bortolon et al., 2016; Qazi et al., 2016).
In GDM, progesterone, chorionic somatomammotropin, stress and growth hormones induce insulin
resistance which leads to maternal hyperglycemia and hyperinsulinemia in neonates (Kampmann et
al., 2015). The existence of GDM during pregnancy is considered as one of the major risk factors of
T2D in later life and about 90% of all pregnancies with GDM are complicated compared to non-
diabetic pregnancy (Leon et al., 2016). According to the International Diabetes Federation (IDF),
16% of children born during 2013 had complications due to high blood glucose of their pregnant
mothers (IDF, 2017). This number has been proposed to be increased due to the rise of obesity and
sedentary lifestyle among adults (Kelley et al., 2015). The risk factors of GDM include, increased
mothers’ age, visceral adiposity, polycystic ovarian syndrome, hereditary, hypertension and finally
the delivery of larger babies.
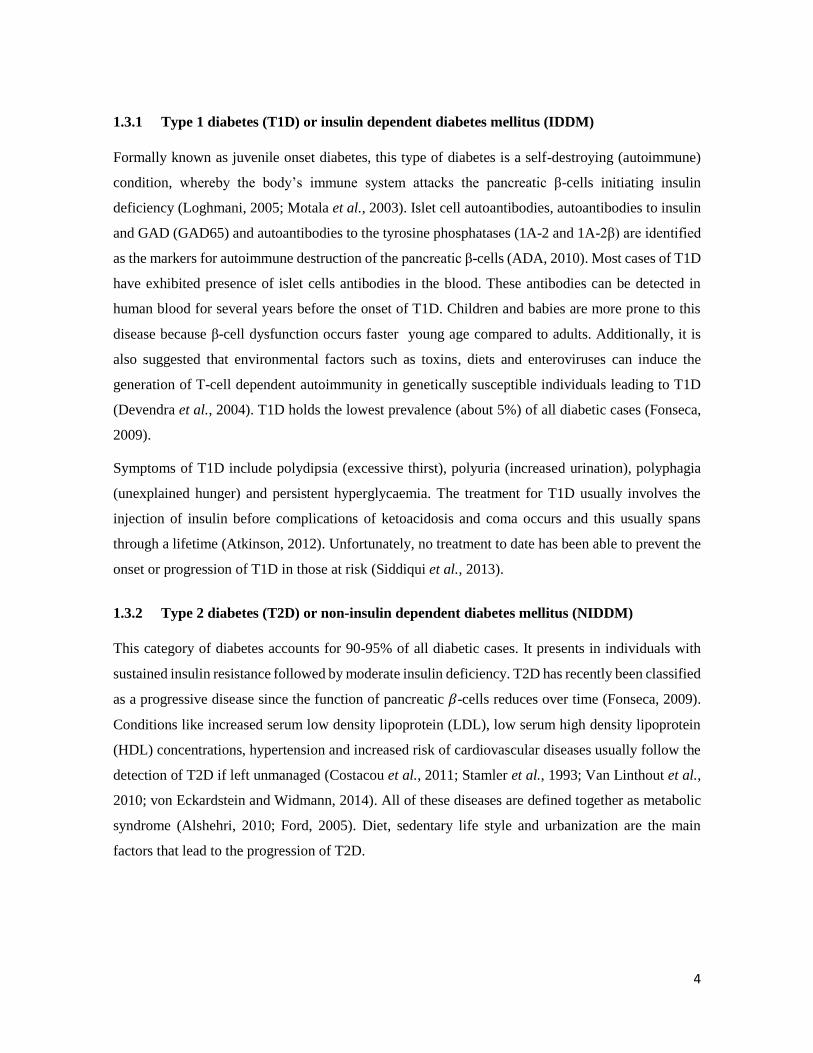
1.4 The role of insulin in the pathogenesis of T2D
After food is ingested, carbohydrate in the food is broken down to glucose, when the insulin is
responsible for carbohydrate homeostasis by inducing glucose transport to the muscle and adipose
tissue for energy production and reducing the production of more glucose by the liver (Figure 1.2)
(Porte, 2006). Insulin is produced in the β-cells of the pancreas and an anomaly in the secretion and
action of this hormone has been implicated in the generation of diabetes (Cerf, 2013).
High levels of glucose in the blood is the first trigger of insulin production. When glucose enters the
cell, it is phosphorylated by glucokinase to glucose-6-phospahtase (G6P) to release energy in the form
of ATP thereby closing the K+-ATP channel (McTaggart et al., 2010).
6
Figure 1.2: The Endocrine System. Source: Barnes (2015)
When the channel is closed, it causes a depolarization and stretching of the cell membrane which
leads to an influx of calcium ions. Fusion of the insulin vesicles cell membrane on the outer β-cell
membrane thus causes the entry of insulin into the blood stream. Additionally, glucagon like peptide-
1 (GLP-1), glucose-dependent insulinotropic peptide (GIP) might be able to activate protein kinase-
C and phospholipase through activation of adenyl cyclase activity and stimulation of β-cell protein
kinase A which could account for the second phase synthesis of insulin (Wilcox, 2005).
1.4.1 Insulin resistance
This is a complex metabolic condition that occurs when the organs in the body becomes numb to the
action of insulin. Prevailing insulin resistance happens when high blood glucose level does nothing
to trigger insulin action. It is one of the two major reasons for the development of T2D (Taylor, 2012;
Weyer et al., 2001). Normally, β-cells of the pancreas act on insulin resistance by intensifying the
synthesis of insulin to act on the need of glucose by the tissues (Halban et al., 2014).
The rise in blood glucose leads to induction of insulin secretion at the same time reducing the
secretion of glucagon. This shows that low levels of blood glucose lead to reduction of insulin
secretion and increase in glucagon synthesis. Which indicates that these actions are all dependent on
glucose and necessary to sustain glucose homeostasis (Guo, 2014). A number of conditions have been
postulated as responsible for insulin resistance as discussed below.

7
1.4.2 Mechanisms behind insulin resistance
a. Dysfunction of pancreatic β-cell and insulin resistance
The combinatorial action of β-cell dysfunction and insulin resistance results in persistent high glucose
level, particularly in type 2 diabetic condition (Lorenzo et al., 2010). The pancreatic β-cell
dysfunction causes more problems than insulin resistance due to the lack of insulin for glucose
metabolism (Cerf, 2013). The β-cell must be in a healthy state in order to meet the metabolic demand
for the production of insulin, when decrease β-cell mass has been reported in T2D (Butler et al.,
2003). However, hyperglycaemia has been attributed to the function but not the quantity of the β-
cells (Ashcroft and Rorsman, 2012).
b. Impaired insulin-dependent PI3K activation
In a high blood glucose state, the skeletal muscle is the main site for disposal of glucose by insulin
hence resistance to the action of insulin in muscle is a key feature of either type 1 or T2D (DeFronzo,
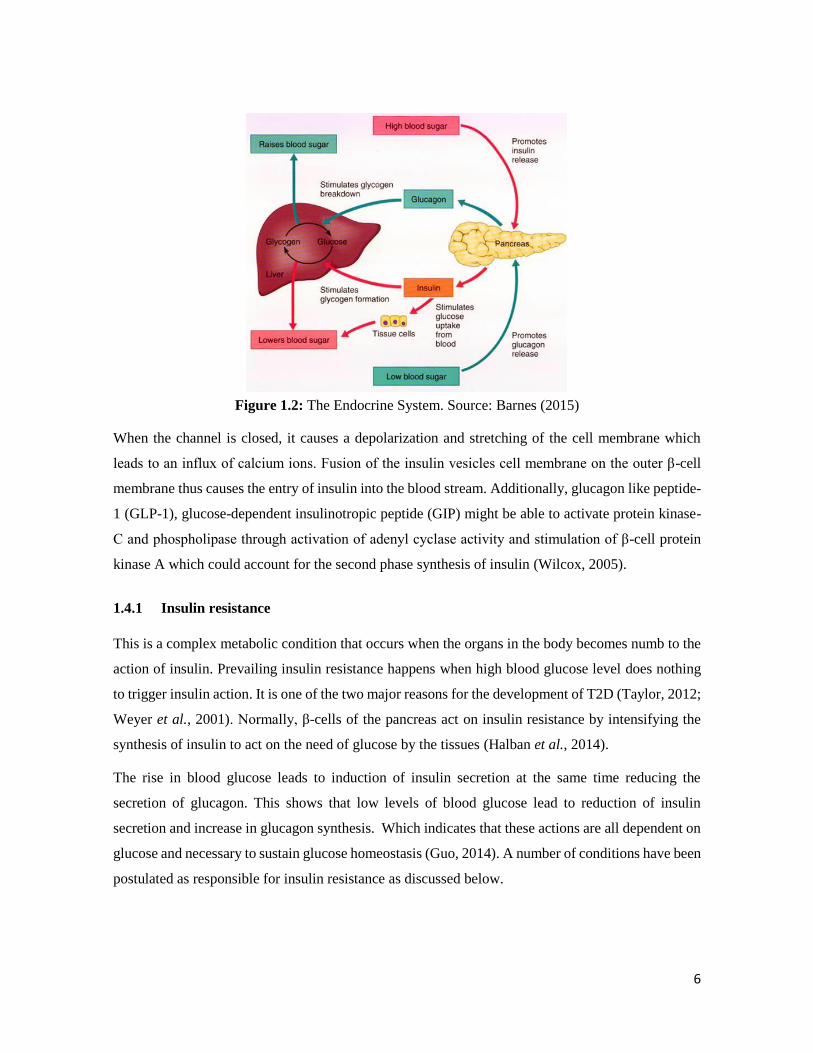
2015; Yki-Järvinen et al., 1990). The glucose transporter 4 (Glut 4) stimulates insulin action to
effectively transport excess glucose to the skeletal muscle. There is normal occurrence of the Glut 4
gene (Figure 1.3) in the skeletal muscle of normal subjects and an impairment of glucose uptake
might occur as a result of impaired Glut 4 gene expression or impaired insulin signalling pathway
(Choi and Kim, 2010; Garvey et al., 1988; Kim et al., 1999,).
The signalling of insulin involves the binding of insulin to its required cell surface receptor through
self-phosphorylation and induction of receptor tyrosine kinases which in turn results in tyrosine
phosphorylation of insulin receptor substrate (IRS) (1-4), Gab1 and Shc (Choi and Kim, 2010).
8
Figure 1.3: Insulin receptor and glucose transport (Adapted without permission from Nath, 2015).
Phosphoinositide 3-kinase (PI3K) becomes activated through the binding to the IRS which in turn
phosphorylates membranous phospholipids and phosphatidylinositol 4,5-bisphosphate (PIP2). This
formed complex activates Akt/protein kinase B (PKB) and serine/threonine kinases C λ and ζ (PKC
λ/ζ) through the activation of 3-phosphoinositide dependent protein kinase (Figure 1.3). Movement
of insulin-activated GLUT 4 from the intracellular vesicles into the plasma membrane is favoured by
the activated Akt phosphorylation (Farese et al., 2005; Sale and Sale, 2008).
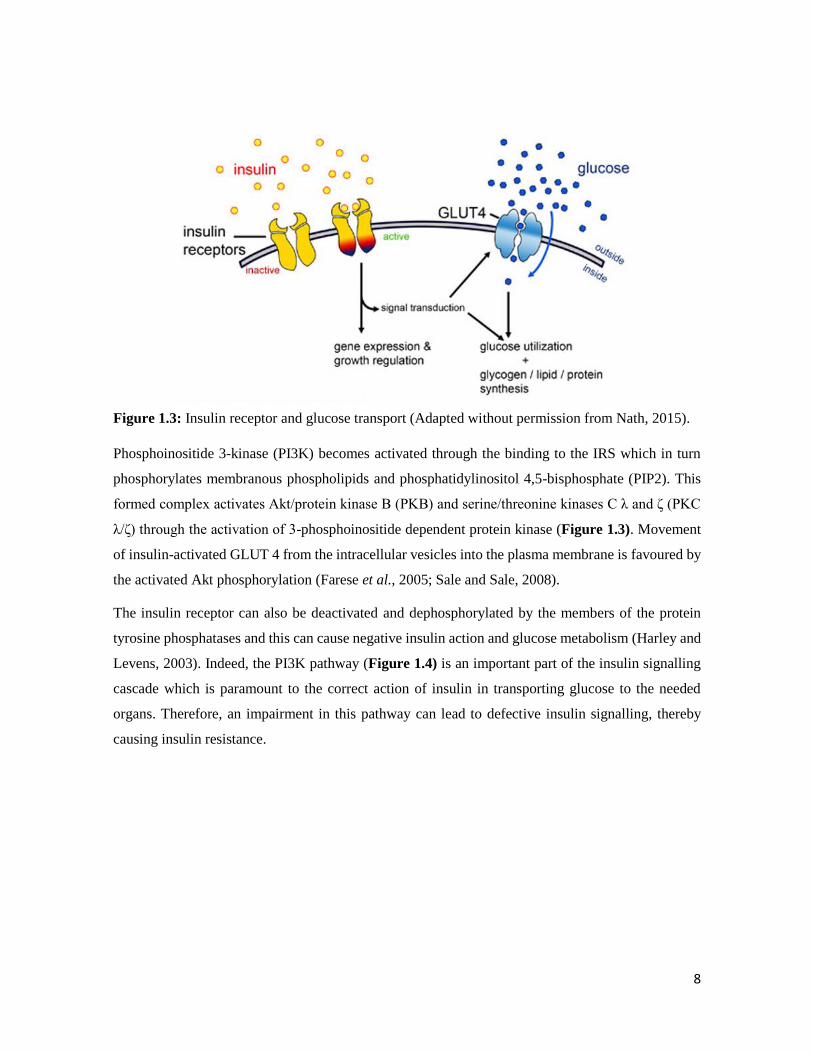
The insulin receptor can also be deactivated and dephosphorylated by the members of the protein
tyrosine phosphatases and this can cause negative insulin action and glucose metabolism (Harley and
Levens, 2003). Indeed, the PI3K pathway (Figure 1.4) is an important part of the insulin signalling
cascade which is paramount to the correct action of insulin in transporting glucose to the needed
organs. Therefore, an impairment in this pathway can lead to defective insulin signalling, thereby
causing insulin resistance.
9
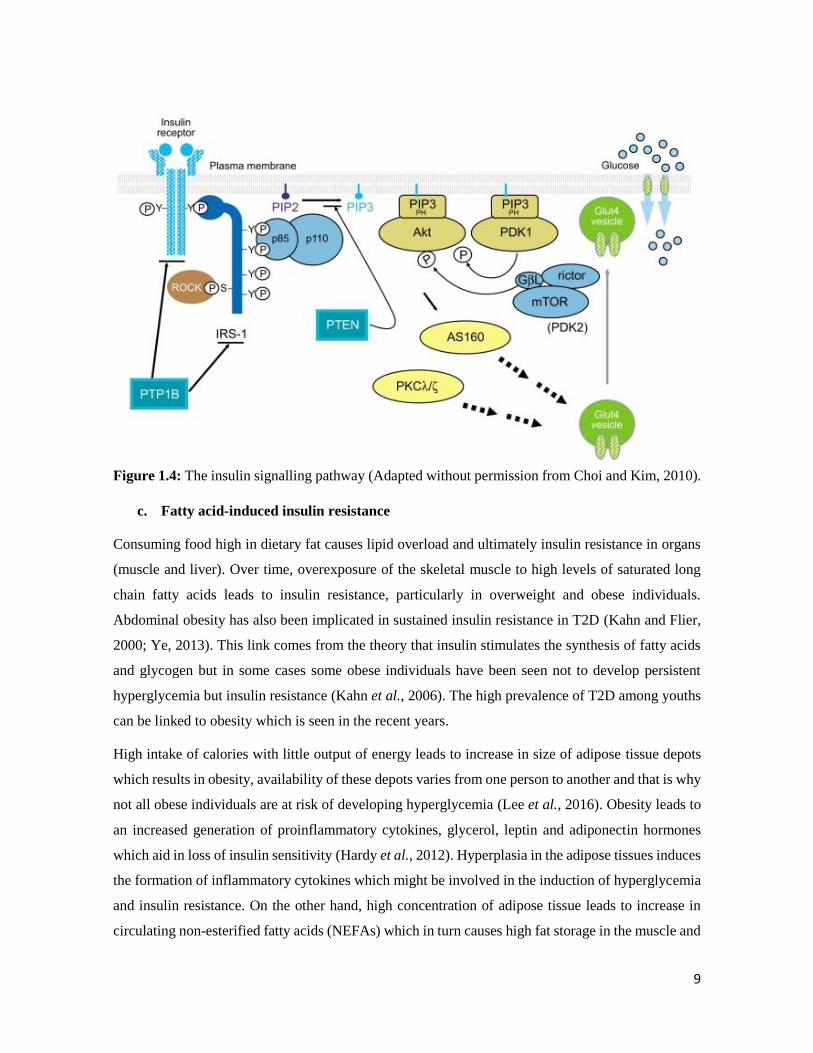
Figure 1.4: The insulin signalling pathway (Adapted without permission from Choi and Kim, 2010).
c. Fatty acid-induced insulin resistance
Consuming food high in dietary fat causes lipid overload and ultimately insulin resistance in organs
(muscle and liver). Over time, overexposure of the skeletal muscle to high levels of saturated long
chain fatty acids leads to insulin resistance, particularly in overweight and obese individuals.
Abdominal obesity has also been implicated in sustained insulin resistance in T2D (Kahn and Flier,
2000; Ye, 2013). This link comes from the theory that insulin stimulates the synthesis of fatty acids
and glycogen but in some cases some obese individuals have been seen not to develop persistent
hyperglycemia but insulin resistance (Kahn et al., 2006). The high prevalence of T2D among youths
can be linked to obesity which is seen in the recent years.
High intake of calories with little output of energy leads to increase in size of adipose tissue depots
which results in obesity, availability of these depots varies from one person to another and that is why
not all obese individuals are at risk of developing hyperglycemia (Lee et al., 2016). Obesity leads to
an increased generation of proinflammatory cytokines, glycerol, leptin and adiponectin hormones
which aid in loss of insulin sensitivity (Hardy et al., 2012). Hyperplasia in the adipose tissues induces
the formation of inflammatory cytokines which might be involved in the induction of hyperglycemia
and insulin resistance. On the other hand, high concentration of adipose tissue leads to increase in
circulating non-esterified fatty acids (NEFAs) which in turn causes high fat storage in the muscle and

10
liver (Al-Goblan et al., 2014). The increase of NEFAs in the serum leads to a associated increase in
insulin resistance. Interestingly, the use of antilipolytic agents leads to improved insulin function and
glucose homeostasis.
The function of insulin is not only limited to blood glucose regulation, storage and optimum utility,
fat metabolism is also taken care of by insulin. This occurs by the inhibition of lipolysis through
increased lipogenesis and induction of fatty acid uptake which leads to an abundance of energy in the
fasting state (Poloz and Stambolic, 2015).
Insulin exerts its aforementioned functions through the family of tyrosine kinase receptors and insulin
growth factor-insulin receptor (IGF-IR). Insulin improves glucose homeostasis by increasing the
levels of GLUT4 proteins in the plasma membrane (Furtado et al., 2002). Without the action of
insulin, GLUT4 reclines within the plasma membrane and vesicular compartments of the cell. Insulin
stimulates the movement of GLUT4 through exocytosis consequently reducing the endocytosis of
GLUT4 (Jhun et al., 1992; Rea and James, 1997).
1.5 Complications of diabetes
1.5.1 Inflammation
In 1998, a research proposed that inflammation as a result of persistent immune system activation
could aggravate instead of attenuate complications of diseases such as T2D (Pickup and Crook, 1998).
Over the years some study has backed up this assertion (Cefalu, 2009; Crook, 2004). Inflammation
as a result of insulin resistance and impaired glucose tolerance can be said to be the first pathological
feature in complications associated with T2D (King, 2008). The exact mechanism by which
inflammation can evoke T2D is still not clear (Navarro and Mora, 2005). Inflammatory markers, pro-
inflammatory cytokines, tumour necrosis factor-alpha (TNF-α), interleukin-1 and interleukin-6 (IL-1
and IL-6), immune cells (monocytes chemoattractant protein-1: MCP-1) produced by the adipose
tissues are linked to the accumulation of body fat (Mahmoud and Al-Ozairi, 2013; Navarro and Mora,
2005). The pro-inflammatory cytokines are associated with multiple pathways linked to insulin
resistance and adipocyte function. The increase of these cytokines in the cell leads to the production
of C-reactive proteins (CRP) which are acute phase proteins. Hyperglycemia and high fatty acids can
also trigger inflammation by increasing glucose utilization and alterations in oxidative
phosphorylation concomitantly (Zhou et al., 2010). Oxidative stress and inflammation can lead to β-
cell death (apoptosis) and this will aid in loss of β-cell action and insulin sensitivity (Pollack et al.,
2016).
11
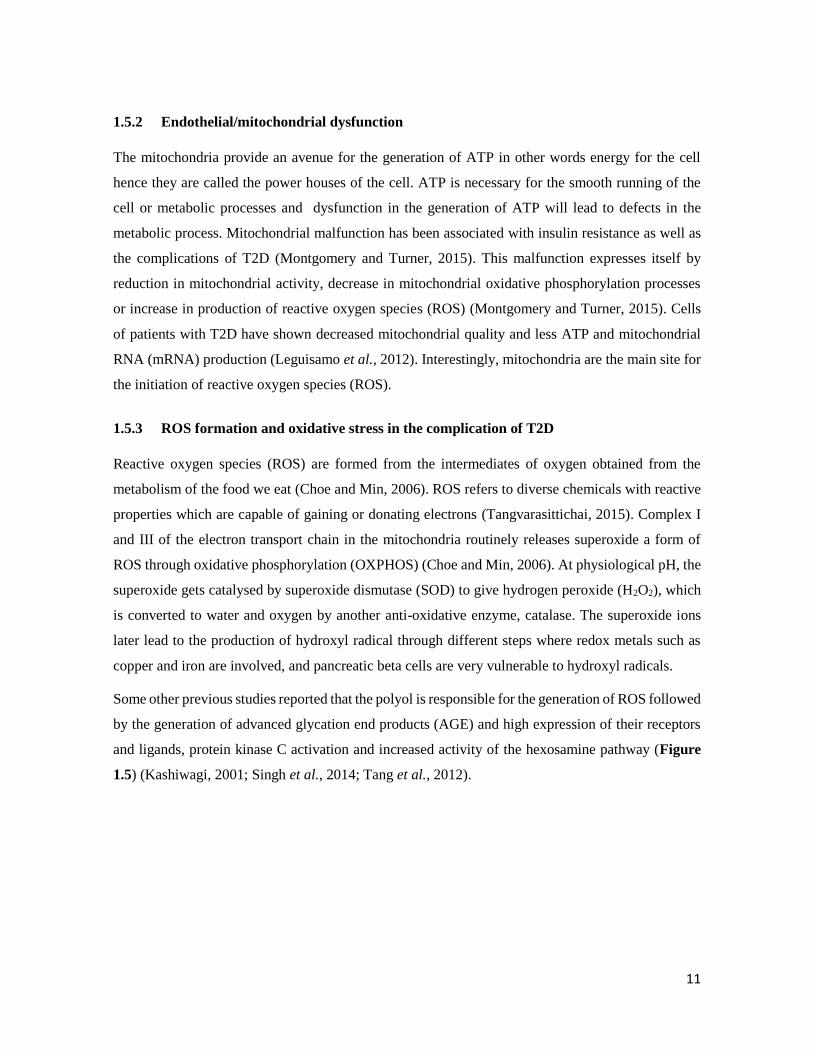
1.5.2 Endothelial/mitochondrial dysfunction
The mitochondria provide an avenue for the generation of ATP in other words energy for the cell
hence they are called the power houses of the cell. ATP is necessary for the smooth running of the
cell or metabolic processes and dysfunction in the generation of ATP will lead to defects in the
metabolic process. Mitochondrial malfunction has been associated with insulin resistance as well as
the complications of T2D (Montgomery and Turner, 2015). This malfunction expresses itself by
reduction in mitochondrial activity, decrease in mitochondrial oxidative phosphorylation processes
or increase in production of reactive oxygen species (ROS) (Montgomery and Turner, 2015). Cells
of patients with T2D have shown decreased mitochondrial quality and less ATP and mitochondrial
RNA (mRNA) production (Leguisamo et al., 2012). Interestingly, mitochondria are the main site for
the initiation of reactive oxygen species (ROS).
1.5.3 ROS formation and oxidative stress in the complication of T2D
Reactive oxygen species (ROS) are formed from the intermediates of oxygen obtained from the
metabolism of the food we eat (Choe and Min, 2006). ROS refers to diverse chemicals with reactive
properties which are capable of gaining or donating electrons (Tangvarasittichai, 2015). Complex I
and III of the electron transport chain in the mitochondria routinely releases superoxide a form of
ROS through oxidative phosphorylation (OXPHOS) (Choe and Min, 2006). At physiological pH, the
superoxide gets catalysed by superoxide dismutase (SOD) to give hydrogen peroxide (H2O2), which
is converted to water and oxygen by another anti-oxidative enzyme, catalase. The superoxide ions
later lead to the production of hydroxyl radical through different steps where redox metals such as
copper and iron are involved, and pancreatic beta cells are very vulnerable to hydroxyl radicals.
Some other previous studies reported that the polyol is responsible for the generation of ROS followed
by the generation of advanced glycation end products (AGE) and high expression of their receptors
and ligands, protein kinase C activation and increased activity of the hexosamine pathway (Figure
1.5) (Kashiwagi, 2001; Singh et al., 2014; Tang et al., 2012).

12
Figure 1.5: Pathways necessary for production of reactive oxygen species (ROS) (Adapted without
permission from Tang et al., 2012).
The increased production of ROS through these pathways leads to insulin resistance and β-cell
dysfunction.
a. The polyol pathway
Under normal conditions in the cell, the glycolytic pathway is activated by the phosphorylation of
glucose to glucose 6-phosphate by hexokinase and a small amount of the un-phosphorylated glucose
enters into the polyol pathway (Tang et al., 2012). However, hyperglycemic conditions present with
an increased influx of sugars through the polyol pathway of which rate limiting step is the
transformation of glucose to sorbitol through the aldose reductase enzyme with reduced nicotinamide
adenosine dinucleotide (NADPH) as a cofactor (González et al., 1984). The increased utilization of
NADPH then leads to an increased redox stress since NADPH is required to also generate GSH, a
potent antioxidant. Studies have shown that increased expression of aldose reductase in diabetic mice
influenced a higher risk of complications of diabetes by reducing the necessary genes which are
responsible for the production of GSH (Chung et al., 2003; Lee and Chung; 1999, Ii et al., 2004).
13
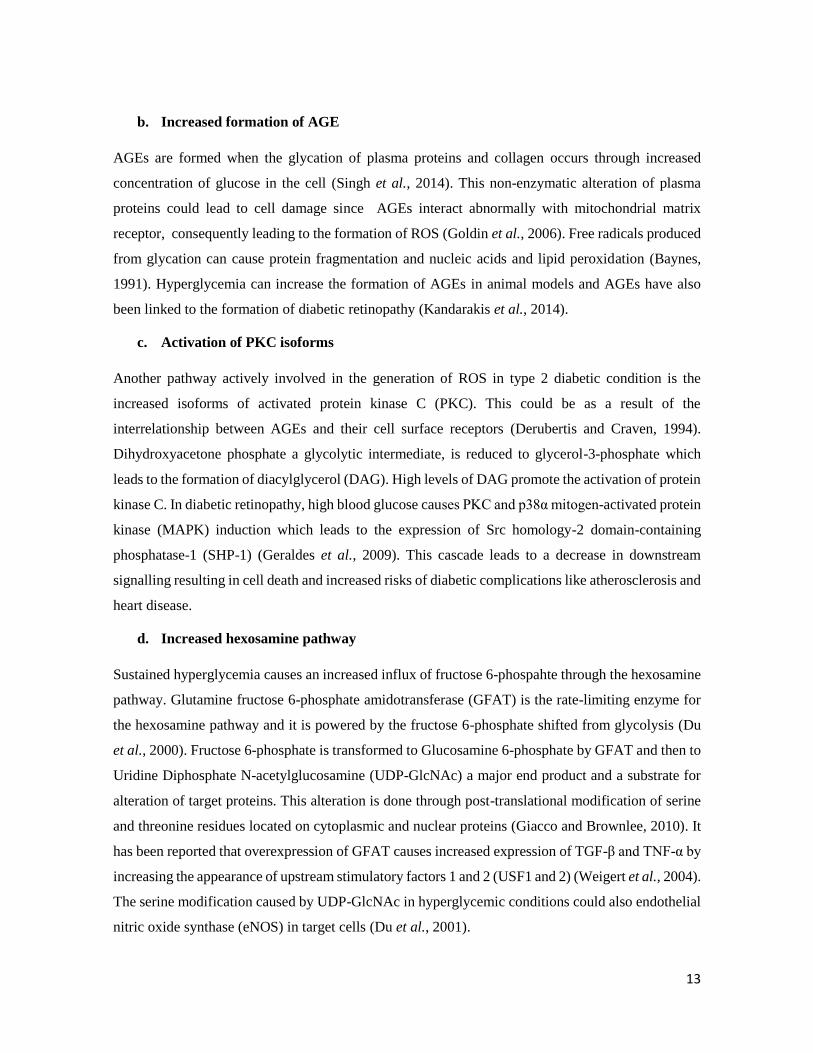
b. Increased formation of AGE
AGEs are formed when the glycation of plasma proteins and collagen occurs through increased
concentration of glucose in the cell (Singh et al., 2014). This non-enzymatic alteration of plasma
proteins could lead to cell damage since AGEs interact abnormally with mitochondrial matrix
receptor, consequently leading to the formation of ROS (Goldin et al., 2006). Free radicals produced
from glycation can cause protein fragmentation and nucleic acids and lipid peroxidation (Baynes,
1991). Hyperglycemia can increase the formation of AGEs in animal models and AGEs have also
been linked to the formation of diabetic retinopathy (Kandarakis et al., 2014).
c. Activation of PKC isoforms
Another pathway actively involved in the generation of ROS in type 2 diabetic condition is the
increased isoforms of activated protein kinase C (PKC). This could be as a result of the
interrelationship between AGEs and their cell surface receptors (Derubertis and Craven, 1994).
Dihydroxyacetone phosphate a glycolytic intermediate, is reduced to glycerol-3-phosphate which
leads to the formation of diacylglycerol (DAG). High levels of DAG promote the activation of protein
kinase C. In diabetic retinopathy, high blood glucose causes PKC and p38α mitogen-activated protein
kinase (MAPK) induction which leads to the expression of Src homology-2 domain-containing
phosphatase-1 (SHP-1) (Geraldes et al., 2009). This cascade leads to a decrease in downstream
signalling resulting in cell death and increased risks of diabetic complications like atherosclerosis and
heart disease.
d. Increased hexosamine pathway
Sustained hyperglycemia causes an increased influx of fructose 6-phospahte through the hexosamine
pathway. Glutamine fructose 6-phosphate amidotransferase (GFAT) is the rate-limiting enzyme for
the hexosamine pathway and it is powered by the fructose 6-phosphate shifted from glycolysis (Du
et al., 2000). Fructose 6-phosphate is transformed to Glucosamine 6-phosphate by GFAT and then to
Uridine Diphosphate N-acetylglucosamine (UDP-GlcNAc) a major end product and a substrate for
alteration of target proteins. This alteration is done through post-translational modification of serine
and threonine residues located on cytoplasmic and nuclear proteins (Giacco and Brownlee, 2010). It
has been reported that overexpression of GFAT causes increased expression of TGF-β and TNF-α by
increasing the appearance of upstream stimulatory factors 1 and 2 (USF1 and 2) (Weigert et al., 2004).
The serine modification caused by UDP-GlcNAc in hyperglycemic conditions could also endothelial
nitric oxide synthase (eNOS) in target cells (Du et al., 2001).
14
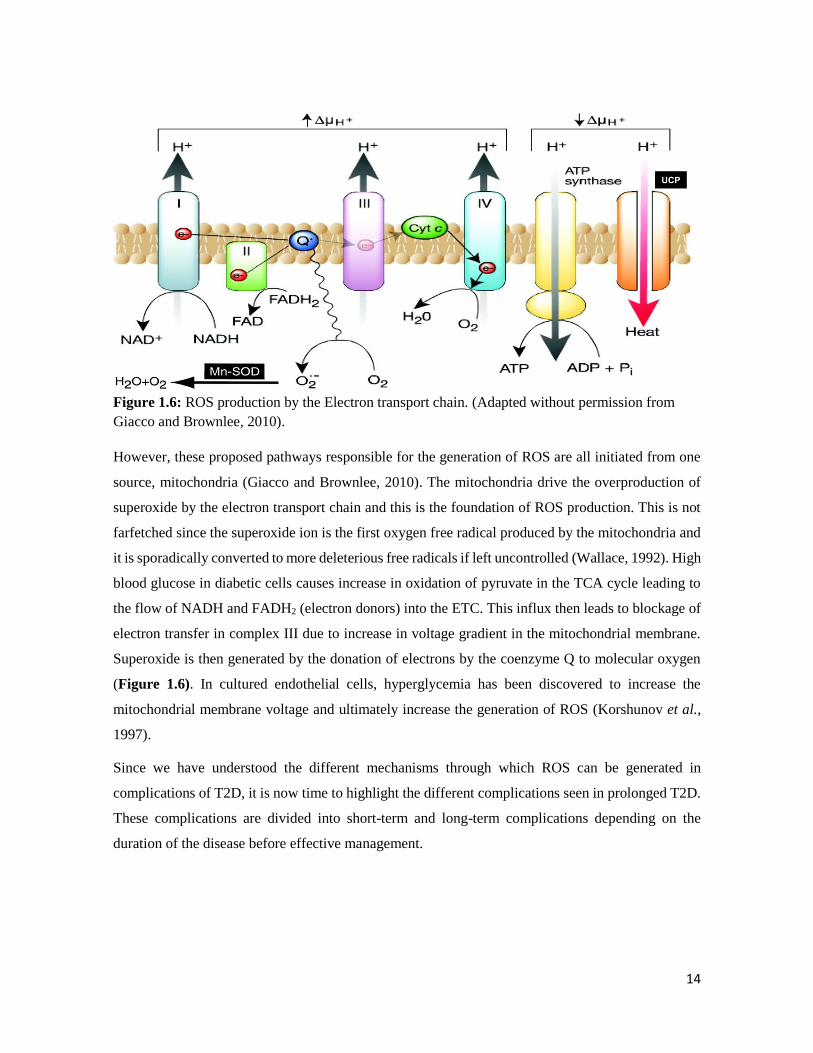
Figure 1.6: ROS production by the Electron transport chain. (Adapted without permission from
Giacco and Brownlee, 2010).
However, these proposed pathways responsible for the generation of ROS are all initiated from one
source, mitochondria (Giacco and Brownlee, 2010). The mitochondria drive the overproduction of
superoxide by the electron transport chain and this is the foundation of ROS production. This is not
farfetched since the superoxide ion is the first oxygen free radical produced by the mitochondria and
it is sporadically converted to more deleterious free radicals if left uncontrolled (Wallace, 1992). High
blood glucose in diabetic cells causes increase in oxidation of pyruvate in the TCA cycle leading to
the flow of NADH and FADH2 (electron donors) into the ETC. This influx then leads to blockage of
electron transfer in complex III due to increase in voltage gradient in the mitochondrial membrane.
Superoxide is then generated by the donation of electrons by the coenzyme Q to molecular oxygen
(Figure 1.6). In cultured endothelial cells, hyperglycemia has been discovered to increase the
mitochondrial membrane voltage and ultimately increase the generation of ROS (Korshunov et al.,
1997).
Since we have understood the different mechanisms through which ROS can be generated in
complications of T2D, it is now time to highlight the different complications seen in prolonged T2D.
These complications are divided into short-term and long-term complications depending on the
duration of the disease before effective management.
15
1.6 Short-term complications of T2D
Upon immediate diagnosis of T2D, the complications of diabetes are still mild and can be reversed
to normal if managed effectively. These short-term complications are:
1.6.1 Hypoglycemia
This occurs as a result of the blood sugar becoming too low (≤ 63 mg/dL or 3.5 mmol/L), which
usually happens after the treatment of T2D with oral hypoglycemic drugs or insulin (Pober, 2010).
The physical presentation of hypoglycemia includes sweating, fast heartbeat, anxiety, lack of feelings
in fingers, toes and lips, sleepiness, confusion, headaches and babbled speech. Drinking orange juice
and eating sugar can be used to manage hypoglycemia. It is usually associated with ‘dead in bed
syndrome’.
1.6.2 Hyperosmolar Hyperglycaemic Nonketotic Syndrome (HHNS)
Hyperosmolar hyperglycaemic nonketotic syndrome is a very rare (< 1% of hospital admitted diabetic
cases) short-term complication of T2D which occurs as a result of very high blood glucose levels (>
600 mg/dL) and glucosuria (Pasquel and Umpierrez, 2014). In HHNS, there is little or no production
of ketone bodies unlike ketoacidosis. If HHNS is left unmanaged it can result in hyperosmolar
nonketotic coma in old aged patients.
1.6.3 Diabetic ketoacidosis (DKA)
This occurs due to unmanaged high blood glucose and is also very rare among patients with T2D (Lin
et al., 2010). Insulin deficiency is a lead cause of DKA. In the absence of insulin, the body will use
energy from ketones produced by breakdown of fats. However, a high level of ketones in the body
will lead to DKA which will become a complication of T2D. The outward signs of DKA include
vomiting, dehydration and can even lead to coma if left untreated (Welch and Zib, 2004).
1.7 Long-term complications of T2D
These long-term complications last a lifetime in patients with T2D. Those diabetic patients who do
not manage their blood glucose level effectively are at high risk of developing long-term diabetic
complications (Stratton et al., 2000). These occur due to persistent hyperglycemia which results in
thickening of the blood vessels. They are broadly classified into two types: damage to small blood
16
vessels (microvascular complications) and damage to large blood vessels (macrovascular
complications).
1.7.1 Microvascular complications
a. Diabetic retinopathy (DR)
This is possibly the most prevalent microvascular complication of T2D, and in combination with
diabetic muscular edema are the prime cause of blindness among working-class populace in the world
(López et al., 2017). In South Africa, the prevalence of DR is between 5 to 10% and it is the fourth
leading cause of blindness (Thomas et al., 2015). It occurs by the blockage of the small blood vessels
of the eye by high blood glucose levels. The damage by diabetic retinopathy can be prevented by
early detection and effective management. Albuminuria, obesity and duration of diabetes have been
considered as risk factors for DR. Oxidative stress and growth factors have been postulated to play a
major role in this regard as well. DR can be characterized by proliferative retinopathy which leads to
the formation of thick blood vessels on the retina. If left untreated blindness occurs through separation
of traction retina as well as haemorrhage.
b. Diabetic nephropathy
Diabetic nephropathy accounts for more than half of all cases of kidney failure (Gheith et al., 2016).
The kidney is a major organ responsible for filtering and removal of waste products from the body
and also for maintaining the levels of water and salt in the blood (UKPDS, 1998). In T2D, excess
glucose in the blood causes a lot of stress on the kidneys which leads to organ damage. The symptoms
of DN include persistent proteinuria (proteins in the urine i.e. > 500 mg in 24 hours). In DN, the
kidneys experience changes such as thickness of the glomerular basement membrane, formation of
micro aneurysm and Kimmelsteil-Wilson bodies (Gheith et al., 2016).
c. Diabetic neuropathy
Neuropathy is the disease of the nerve (nerve damage) and it occurs in long-term conditions of T2D
(Jaiswal et al., 2017). This damage can cause loss of feeling or movement in the legs, feet, hands,
arms, chest and stomach. This nerve damage can also make it difficult for a man to sustain an erection.
The most common manifestation of diabetic neuropathy in T2D is chronic sensorimotor distal
symmetric polyneuropathy (Tesfaye et al., 2013). In this case, patients notice numbness with burning
and tingling pain. In the feet this can cause sores and if left untreated can lead to amputation of the
feet. A high number of amputations have been done so far as a result of T2D (Rodrigues et al., 2016).
17
1.7.2 Macrovascular complications
These types of complications affect the large blood vessels and they are:
a. Atherosclerosis
Atherosclerosis occurs from inflammation and damage to the arterial wall in the peripheral or
coronary vascular system (Pithová et al., 2016). In response to this, oxidized lipids from low density
lipoproteins (LDL) gather in the endothelial wall of the arteries. These accumulated lipids form foam
cells through the infiltration of the arterial wall by monocytes. Foam cells stimulate the proliferation
of macrophage and T-lymphocyte attraction. Collagen accumulation and proliferation of smooth
muscle in the arterial wall is induced by the T-lymphocyte, the result of all these processes is the
production of a lipid-rich atherosclerotic region which then leads to complications such as
atherosclerosis in T2D (Kalofoutis et al., 2007).
b. Cardiovascular disease (CVD)
CVD is the main cause of death of patients with T2D, accounting for the largest part of health care
expenditure in people living with T2D (Ahmed et al., 2010). Obesity is associated with an increased
risk of CVD in T2D patients. As explained earlier, a possible link between obesity and the
complications of diabetes could be low grade inflammation. Patients with diabetes have greater
cardiac mass compared to those without diabetes, which might be as a result of raised release of
adipocytes (resistin and leptin) leading to hypertrophic effects on the heart cells (Barouch et al., 2003;
Leon and Maddox, 2015).
Africa is suffering from the burden of diabetes due to huge cost and expenditure spent of treating and
managing diabetes (Mutyambizi et al., 2018). Thus, the management and control of T2D is of
paramount importance to the population at large.
1.8 Management of T2D
Different measures and modalities have been proposed to manage diabetes. These measures aim to
control blood glucose levels to tolerable points.
1.8.1 Exercise and physical activity
Exercise is the first advice a physician will give to a diabetic patient. Staying fit is a good way to keep
blood glucose level at tolerable levels. During exercise the muscle cells becomes more sensitive to
18
insulin, and the contraction of the muscles leads to increase uptake of glucose even in the absence of
insulin (Riddell and Perkins, 2009). Exercise helps T2D patients avoid the long-term complications
of T2D.
1.8.2 Dietary modifications
The power of food over diabetes is amazing; a healthy diet can help normalize blood sugar levels,
weight and blood pressure and reduce risks of complications of T2D. Foods such as white flour, table
sugar and fruit juice are termed high-glycemic foods as they stimulate increase in blood sugar
(Inzucchi et al., 2015). Low glycemic foods such as whole grains, nuts and legumes are high in fibre
which helps control appetite (Chiu and Taylor, 2011). Counting carbs and eating a balanced diet are
effective ways of reducing blood sugar levels to normoglycemic level.
1.8.3 Pharmacologic management of T2D
Therapeutic drugs are usually employed with the action of exercise and diet to help control high blood
sugar levels. The need for better treatment modalities of T2D has led to the discovery and manufacture
of different types of anti-diabetic drugs. These drugs target what is known as the ‘ominous octet’ that
causes T2D. This section will shed more light on the mechanism of action of anti-diabetic drugs and
possible side effects.
a. Insulin secretagogues
Impaired insulin secretion in T2D can be tackled using insulin secretagogues. These drugs trigger the
release of insulin by blocking the KATP channel in the pancreatic β-cell which leads to depolarization
of the membrane, increase in intracellular Ca2+ and insulin granule exocytosis (Cobb and Dukes,
1998). Examples of this class of drugs includes sulfonylureas which bind to plasma proteins and
cannot be used by type 1 diabetic patients or pregnant women. Another class of secretagogue is non-
sulfonylurea secretagogue, an example of which is meglitinides (also known as short acting insulin
secretagogue). They act on the same channels as sulfonylureas but on different binding sites. The side
effects of insulin secretagogues include hypoglycemia and weight gain.
b. GLP-1 receptor agonists
Glucagon like polypeptide-1 (GLP-1), DPP-4 (dipeptidyl peptidase-4) inhibitors and amylin agonist
pramlintide are the classes of drugs available for addressing abnormalities in glucagon secretion
(Godoy-Matos, 2014). The currently used GLP-1 agonists used are exenatide and liraglutide which
19
help improve weight loss and metabolic dysfunction. Their adverse effects include gastrointestinal
disturbances, nausea and mild hypoglycemia.
c. Drugs that increase glucose uptake
Biguanides such as metformin help to reduce hyperglycemia by inhibiting hepatic glucose output and
increasing the uptake of glucose by the muscle. Amongst the common antidiabetic drugs, metformin
remains the only drug that does not encourage weight gain and it is used as a first line treatment in
managing T2D. Thiazolidinediones also improve better use of glucose in the cells by binding to
PPARγ (a nuclear protein responsible for transcription of genes involved in glucose and fat
utilization) (Jerry and Chisholm, 2004). Insulin injections are also prescribed for the better utilization
of glucose in the cells. Apart from cost, the side effects of these classes of drugs include
hypoglycemia, and pain associated with needle prick (in the case of insulin injections).
d. Incretin therapies
Enhancing insulin action in response to oral glucose overload compared to intravenous glucose level
is known as the ‘incretin effect’. Incretin is a hormone that has been proposed to be responsible for
satiety (i.e. not feeling hungry). The GLP-1 and glucose-dependent insulinotropic polypeptide (GIP)
are the peptide hormones in charge of the incretin effect (Pratley, 2010, Cernea, 2011). They act by
stimulating the release of insulin from pancreatic β-cells, suppressing glucagon secretion, reducing
gastric emptying and regulating appetite (Pratley, 2010). These incretin memetics are widely used in
addition to metformin to aid efficient glycemic control and their side effects include nausea and
weight loss.
e. Alpha glucosidase inhibitors
Alpha glucosidase inhibitors such as acarbose act on hyperglycemia by inhibiting the digestion of
carbohydrates in food to glucose by inhibiting carbohydrate digesting enzymes such as alpha-amylase
and alpha-glucosidase (McCulloch, 2007). The limitations associated with the use of this drug
includes cost, gastrointestinal problems, less effective in reducing the amount of glycated hemoglobin
in the blood. Most commonly used alpha-glucosidase inhibitors are acarbose, miglitol etc.
f. Sodium glucose transporters
These transporters are located in the kidney and they help to tackle the reabsorption of glucose by the
kidney (Kalra, 2013). SGL2 inhibitors such as dapaglifoxin, empaglifoxin and canaglifoxin aid in
reducing reabsorption of glucose though this causes glucosuria it reduces hyperglycemia in T2D

20
patients. The mechanism of action of these drugs highlight their side effects (ketoacidosis, urinary
tract infections and hypoglycemia).
g. Drugs that improve neurotransmitter dysfunction
Dopamine is a neurotransmitter in the brain which has been shown to be affected by hyperglycemia.
The administration of bromocriptine (a systemic and intracerebral dopamine agonist) to insulin
resistant animals caused a reduction in increased ventromedial hypothalamus noradrenergic and
serotonergic levels through a reduction in gluconeogenesis, adipose tissue lipolysis and improved
insulin sensitivity (DeFronzo, 2011).
Considering the numerous side effects of the different classes of conventional antidiabetic drugs,
there is a need to develop alternative therapies for the treatment of T2D, particularly from natural
products, which are widely available, low cost and with no or less side effects.
1.8.4 The importance of medicinal plants in drug discovery
Plants have since been successfully used in the treatment of diseases such as diabetes. Over 5000
years ago, Sumerian clay tablets were engraved with herbal prescriptions for diseases (Petrovska,
2012). Traditional healers have found the use of dietary modifications with medicinal plants and
minerals to be an effective approach for the management of diseases such as T2D, cancer and others
(Farag et al., 2016). In 2600 BC, in the area of Mesopotamia, traditional approach has been employed
in the treatment and cure of diseases (Choudhury et al., 2017). The use of medicinal plants is even
more common in different low-income areas of Africa. Some patients prefer the use of traditional
medicine over synthetic drugs because of the cost, numerous side effects and frequent unavailability
of synthetic drugs. The WHO has encouraged African countries to embrace the practice of traditional
medicine since Africa is filled with an abundance of different varieties of medicinal plants
(Mahomoodally, 2013).
Interestingly, the use of traditional medicine is on the rise even in developed countries like America,
Australia, Netherlands and France. Factors responsible for this could be linked to curiosity,
prevention of sickness, inability to get well with conventional drugs, and believing that a combination
of herbs and conventional drugs will bring about faster healing (van Andel and Carvalheiro, 2013).
In this present era, the use of medicinal plants still prevails as 11% of 252 basic prescription drugs
are derived from plant sources (Veeresham, 2012), making plants effective in drug delivery and
production. The availability of compounds of natural origin in different stages of clinical development

21
emphasizes the value of natural products as basis for novel drugs. Apart from natural products in
direct use as drugs, some products can be used to model and manufacture new drugs for treating
diverse diseases.
A recent study showed that about 50% of cancer drugs approved within 30 years (1981 to
2010) are from plant sources either directly or indirectly (Newman and Cragg, 2012). The
world’s first anti-malarial drug quinine was derived from the bark of the native cinchona tree
(Achan et al., 2011). The drug aspirin used in the treatment of fever and headaches was discovered
from Salix alba known as the willow plant (Mahdi, 2010). Quinine, morphine, digoxin, ergomentrine
and reserpine are examples of popular orthodox drugs with plant sources (Ulrich-Merzenich, 2014).
Metformin, a widely used anti-diabetic drug originates from the plant Galega officinalis commonly
known as French lilac (Bailey and Day, 2004). The potential of drugs from natural origin has
generated the motive to further identify and investigate novel phytochemicals from plant sources with
the sole aim of drug discovery for the management of diseases.
1.9 African medicinal plants in the treatment of T2D
Africa is blessed with a rich diversity of medicinal plants, and this marks our socio-economic and
cultural heritage. Africa contains over 45,000 unexploited plant species. In East and Central African
region, the use of plants is widespread in the treatment of diseases and the common plants include
Azadirachta indica, Morinda citrifolia, Zanthoxylum zanthoxyloides and different species of Cactus
(EL-Kamali, 2009).
Research carried out in 2013 explained the medicinal value and distribution of 10 commonly used
African medicinal plants. These plants include Momordica charantia, Aloe ferox, Catharanthus
roseus, Acacia Senegal, Cyclopia genistoides, Pelargonium sidoides, Artemisia herba-alba,
Harpagophytum procumbens, Centella asiatica and Aspalathus linearis. The plants were selected
because they have their origin from African roots and are widely used in the management and
development of drugs for curing diseases (Mahomoodally, 2013).
Over 400 plants and compounds have been discovered to show antidiabetic activities both in vitro
and ex vivo and research is still on going in this regard (Chang et al., 2013). Cinammon (Cinnamomum
verum and C. zeylanicum) commonly used as spice and flavorings in food is traditionally being used
in treatments of diarrhea, colds and headaches (Khan et al., 2003). Studies have shown the efficacy
of cinnamon as an antidiabetic agent. The blood glucose reducing ability of this plant was reported
22
and was achieved through lowering insulin resistance and increasing liver glycogenesis (Rao and
Gan, 2014, Ulbricht et al., 2011).
1.10 Justification of the research
Discussions above show the importance of medicinal plants in the treatment of different diseases,
especially T2D. With the staggering need for the discovery of alternate therapies due to the
deficiencies found in synthetic drugs, there is need to conduct more research with plants with the
hope of drug discovery, since these plants are widely available.
1.11 Scope and limitations of the study
The focus of this study was to screen some African medicinal plants with a view to identify the anti-
diabetic potential of the plant parts.
This study extensively covered the antioxidant and anti-diabetic screening of Alstonia boonei,
Bridelia ferruginea and Crassocephalens rubens using various in vitro, ex vivo, in silico and
ultimately in vivo experiments. Some bioactive components were also identified from the above-
mentioned plants and also from Boerhaavia diffusa and Acalypha wilkesiana using GC-MS and LC-
MS analysis.
This study did not investigate the in vivo antidiabetic potential of Boerhaavia diffusa and Acalypha
wilkesiana due to unavailability of plant samples. It also did not exhaustively screen the bioactive
components from all the plants using HPLC, or HPLC coupled with nuclear magnetic resonance
(LC/NMR) techniques.
1.12 Aims and objectives
This study aims to conduct a detailed investigation on the antioxidant, anti-diabetic and anti-
obesogenic potentials with possible toxicological effects of five African medicinal plants namely;
Alstonia boonei, Acalypha wilkesiana, Bridelia ferruginea, Boerhaavia diffusa and Crassocephalens
rubens employing different in vitro, ex vivo and in vivo models with the identification of the possible
bioactive anti-T2D agents as well as detecting their mechanism of action.
The specific objectives of this research are:
1. To assess the in vitro and ex vivo antioxidant activities of the aqueous, ethanol and ethyl
acetate crude extracts of various parts (stem barks, roots and leaves) of the plants.

23
2. To examine the abilities of the extracts of these plant parts to inhibit key carbohydrate (α-
glucosidase and α-amylase) and lipid (lipase) digesting enzymes in vitro.
3. Based on the above results, the best extract from the plant parts was subjected to solvent
based fractionation to yield the fractions. The obtained fractions were further examined for
their antidiabetic potentials via using in vitro and ex vivo experimental models.
4. The best fractions from the plants were subjected to study of the in vivo anti-diabetic abilities
using a T2D model. The molecular mechanism behind insulin-mediated muscle glucose
uptake potential of the most effective plant was also investigated.
5. Possible bioactive agents in the extracts and fractions were identified from each plant using
Gas chromatography-mass spectrometry (GC-MS).
1.13 Thesis overview
This thesis is organized into 8 chapters. The general structure of the thesis and the focal point of each
chapter is described as follows:
CHAPTER 1: Introduction
A general background of the entire study is given in this chapter. It explains the problem (type 2
diabetes), the prevalence, pathological features, and different treatment modalities of this disease.
This chapter also pinpoints the rationale, objectives of the study and structure of the thesis.
CHAPTER 2: Materials and methods
This chapter provides a detailed explanation of all the materials and methods used during the entire
study.
CHAPTER 3: Alstonia boonei
This chapter provides a compact background, ethnopharmacological and biological importance of A.
boonei. The chapter outlines the in vitro, ex vivo, in silico and in vivo antioxidant and anti-diabetic
screening of the different parts of this plant with their extracts or fractions. It also explains the
identified bioactive constituents present in the plant extract/fraction using different solvents.
CHAPTER 4: Acalypha wilkesiana
This chapter explains the in vitro anti-oxidant activity of the plant. The effect of extracts from the
plant parts on ameliorating iron-induced oxidative pancreatic injury was also investigated ex vivo.
This chapter also went further to identify the present bioactive components in the plant parts using
GC-MS analysis.
24
CHAPTER 5: Crassocephalum rubens
The in vitro, ex vivo and in silico antioxidant and anti-diabetic screening of C. rubens was explained
in this chapter. The chapter also went further to explain the effect of the aqueous the plant on type 2
diabetes using a potent animal model of type 2 diabetes. The identified phytochemicals mainly
phenols, might render synergistic effects to the observable promising anti-diabetic activity.
CHAPTER 6: Bridelia ferruginea
This chapter reports the detailed in vitro antioxidant and anti-diabetic of the leaves, stem and rootbark
extracts of B. ferruginea. The effect of the most active fraction on inhibition of glucose absorption in
small intestinal tissues were examined ex vivo together with the induction of muscle glucose uptake
by the muscle tissue. The most active fraction was then used for in vivo animal study where the
fraction was able to reduce blood sugar levels. The identified bioactive constituents from the extracts
and fractions might be responsible for the promising antioxidant and anti-diabetic activity of this
plant.
CHAPTER 7: Boerhavia diffusa
This chapter reports the in vitro, ex vivo and in silico antioxidant and anti-diabetic activity of solvent
extracts from the aerial parts of B. diffusa.
CHAPTER 8: General conclusions and recommendation
This chapter presents a general summary based on the results of the previous chapters. It also provides
suggestions and recommendations for future research. This thesis represents a compilation of
manuscripts where each chapter is an individual entity and therefore some repetitions between
chapters are unavoidable. The last part of the thesis contains a detailed bibliography of all the cited
works in the thesis.
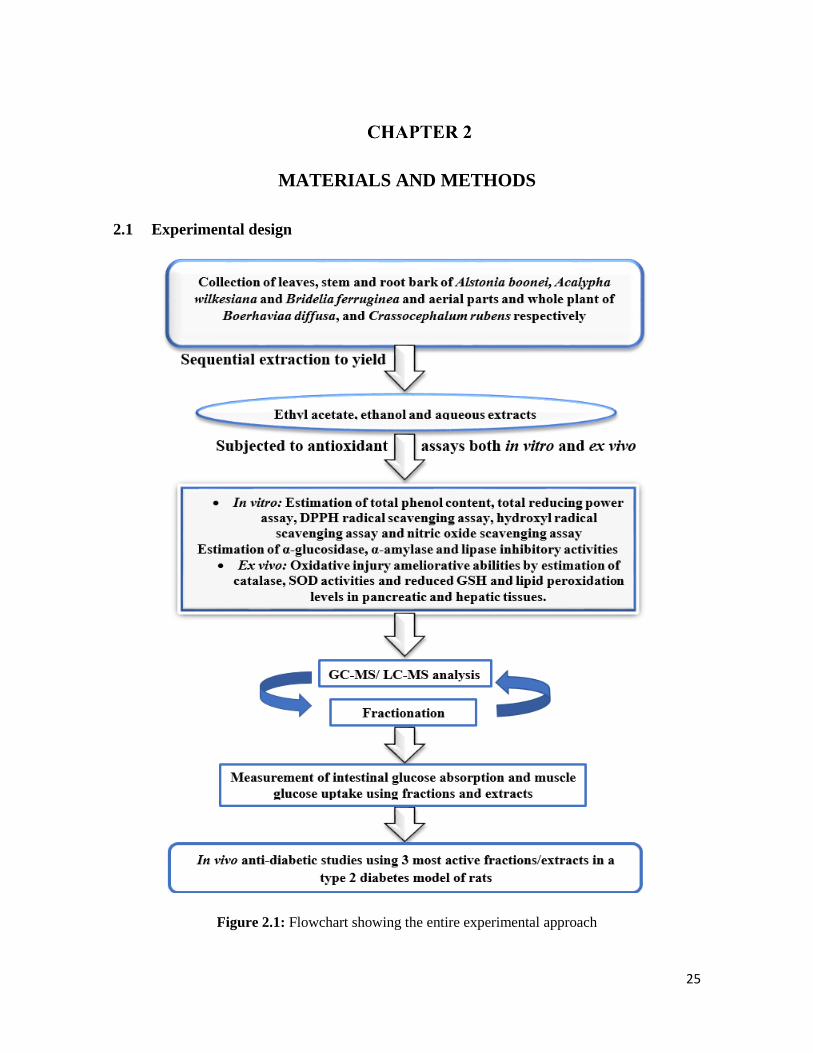
25
MATERIALS AND METHODS
2.1 Experimental design
Figure 2.1: Flowchart showing the entire experimental approach

26
2.1.1 Chemicals and reagents
Absolute ethanol, ascorbic acid, calcium chloride di-hydrate, chloroform, dinitrosalicylic acid (DNS),
disodium EDTA, ethyl acetate, ferric chloride, ferrous sulphate heptahydrate, Folin ciocalteau
reagent, glucose-6-phosphate dehydrogenase, D-glucose 6-phosphate sodium salt, Griess reagent,
hydrogen peroxide, isopropanol, maltose, magnesium chloride, magnesium sulphate, mono-basic
potassium phosphate, phenol red, sodium chloride, sodium bicarbonate, sodium citrate, sodium
hydroxide, sodium hydrogen carbonate, sodium phosphate, sodium nitroprusside, starch, sulphuric
acid, trichloroacetic acid, reduced glutathione, thiobarbituric acid, deuterated chloroform and
deuterated methanol were purchased from Merck Chemical Company, Durban, South Africa.
Acarbose, ammonium molybdate tetrahydrate, citric acid, 2 deoxy-D-ribose, di-basic sodium
phosphate, diethylenetriaminepentaacetic acid (DETAPAC), 5,5′-dithiobisnitrobenzoic acid
(DTNB), 1,1-diphenyl-2-picrylhydrazyl radical (DPPH), gallic acid, 6-hydroxy-2,5,7,8-
tetramethylchroman-2-carboxylic acid (trolox), 6-hydroxydopamine, p-nitrophenyl-α-D-
glucopyranoside (pNPG), 3-(N-morpholino) propanesulfonic acid (MOPS)p-nitrophenol, porcine
pancreatic amylase, potassium ferricyanide, sodium acetate, streptozotocin and yeast α-glucosidase,
were obtained from Sigma-Aldrich through Capital Lab Supplies, New Germany, South Africa.
Glucose and fructose were bought from Associated Chemical Enterprise (ACE), South Africa, while
metformin and Novo rapid insulin were bought from a local pharmacy (Pharmed) in Durban, South
Africa.
A specific ultra-sensitive rat insulin ELISA kit was procured from Mercodia AB, Uppsala, Sweden.
Other reagents used for investigating the remaining serum parameters were purchased from Labtest
Diagnostics (Lagoa Santa, Brazil) purchased through Replamed Company Ltd., Centurion, located in
South Africa.
2.1.2 Equipment
Buchi Rotavapor II, Buchi, Germany, Shimadzu UV mini 1240 spectrophotometer (Shimadzu
Corporation, Kyoto, Japan), Steri-Cult CO2 incubator (Labotec, South Africa), An Automated
Chemistry Analyzer (Labmax Plenno, Labtest Inc., Lagoa Santa, Brazil), Glucometer (Glucoplus
Inc., Saint-Laurent, Quebec, Canada), Ultra Turrax Tube Drive Work Station Homogenizer (IKA-
Works, Staufenim Breisgau, Germany), Hettich Mikro 200 Microcentrifuge (Hettich Lab
Technology, Tuttlingen, Germany), Synergy HTX Multi-mode Reader (BioTek Instruments Inc,

27
Winooski, USA), Microfuge 20R Centrifuge (Beckman Coulter, Inc., Germany), Eppendorf™ 5810R
Centrifuge (Fisher Scientific, UK).
2.1.3 Collection and preparation of plant materials
The leaf, stem and root bark samples of Alstonia boonei, Acalypha wilkesiana, Bridelia ferruginea,
aerial parts of Boerhavia diffusa, and Crassocephalum rubens were collected in November 2015 from
the city of Ibadan, Oyo state, Nigeria. The plant materials of A. boonei, B. ferruginea and B. diffusa
were validated at the herbarium unit of the Department of Pharmacognosy, University of Ibadan,
Nigeria where their designated voucher specimen numbers DPHI Nos. 1379, 1380 and 1650 were
deposited respectively. The authenticity of C. rubens and A. wilkesiana plant samples were verified
at the herbarium section of the Forest Research Institute of Nigeria (FRIN), where a voucher specimen
number FHI. 110605 and FHI. 110606 was preserved, respectively.
Dirt and sand stains were promptly removed from the plant materials followed by shade drying for 3-
4 weeks till they reached constant weights. When dried, the samples were then ground to powdery
form with a mill blender and packaged as a unit in air-tight bags for transportation to the University
of KwaZulu-Natal, Durban, South Africa for further analysis.
2.1.4 Preparation of the crude extracts
Individually, 100 g of the samples from each part of plant was defatted with hexane. Defatted samples
were soaked with 200 mL of ethyl acetate, ethanol and water for 48 hours respectively followed by
consistent shaking for 2 h at 200 rpm. The samples were then sieved using a Whatmann filter paper
(No. 1) and the filtrates were dried in vacuum using a rotary evaporator at 40°C with reduced pressure
to acquire the crude extracts. The aqueous extracts were dried at 50°C overnight by using a water
bath (Figure 2.2). The weights of the resulting extracts in all cases were determined, then they were
preserved in glass vials and stored at 4°C until further analysis.

28
Figure 2.2: Flowchart to describe the sequential extraction of plant samples
2.2 Analytical methods
2.2.1 In vitro antioxidant activities of the isolated crude extracts
i. Evaluation of total phenol content (TPC)
The estimation of TPC (as equivalent of gallic acid) of the extracts were determined using a
previously described method (McDonald et al., 2001) with little modifications. Concisely, a volume
of 200 μL of the extract (at a concentration of 240 μg/mL) was mixed with 1000 μL of Folin ciocalteau
reagent (diluted 10 times) and 800 μL of 0.7 M Na2CO3 and incubated at 25°C for 30 min. A
Shimadzu UV mini 1240 spectrophotometer set at 765 nm was used to determine their absorbance.
All measurements were reproduced 3 times.
ii. Determination of Ferric (Fe3+) reducing antioxidant power (FRAP)
The reducing capacity of these extracts was determined by potassium ferricyanide method. Briefly,
50 µL of extract in increasing concentrations (50-250 µg/mL) was incubated with a 50 µL of 0.2 M
sodium phosphate buffer (pH 6.6) with 50 µL of 1% potassium ferricyanide for 30 min at 50°C.
Acidification of the reaction was achieved using 50 µL of 10% TCA. Then 50 µL of the acidified
mixture was added to 50 µL of distilled water (d.H2O) and 40 μL of FeCl3 (0.1%) and its absorbance
was recorded at 700 nm in a 96 well plate reader in triplicates. High reducing activity of the extracts
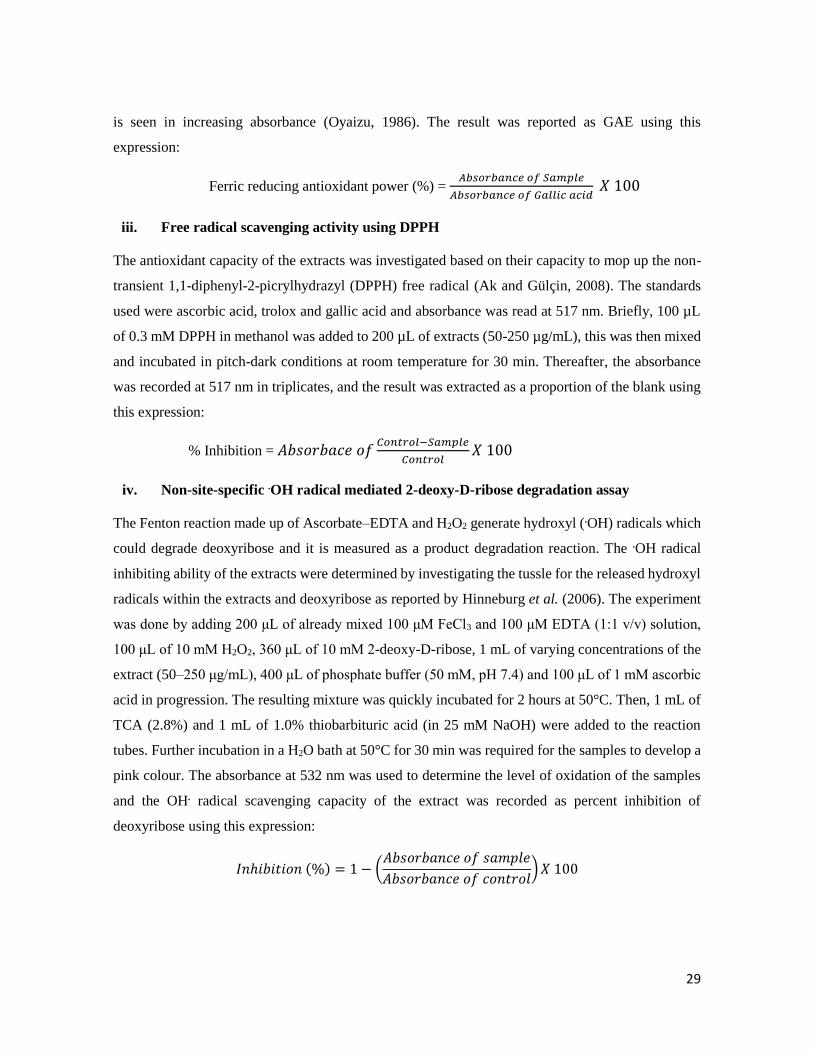
29
is seen in increasing absorbance (Oyaizu, 1986). The result was reported as GAE using this
expression:
Ferric reducing antioxidant power (%) = 𝐴𝑏𝑠𝑜𝑟𝑏𝑎𝑛𝑐𝑒 𝑜𝑓 𝑆𝑎𝑚𝑝𝑙𝑒
𝐴𝑏𝑠𝑜𝑟𝑏𝑎𝑛𝑐𝑒 𝑜𝑓 𝐺𝑎𝑙𝑙𝑖𝑐 𝑎𝑐𝑖𝑑 𝑋 100
iii. Free radical scavenging activity using DPPH
The antioxidant capacity of the extracts was investigated based on their capacity to mop up the non-
transient 1,1-diphenyl-2-picrylhydrazyl (DPPH) free radical (Ak and Gülçin, 2008). The standards
used were ascorbic acid, trolox and gallic acid and absorbance was read at 517 nm. Briefly, 100 µL
of 0.3 mM DPPH in methanol was added to 200 µL of extracts (50-250 µg/mL), this was then mixed
and incubated in pitch-dark conditions at room temperature for 30 min. Thereafter, the absorbance
was recorded at 517 nm in triplicates, and the result was extracted as a proportion of the blank using
this expression:
% Inhibition = 𝐴𝑏𝑠𝑜𝑟𝑏𝑎𝑐𝑒 𝑜𝑓𝐶𝑜𝑛𝑡𝑟𝑜𝑙−𝑆𝑎𝑚𝑝𝑙𝑒
𝐶𝑜𝑛𝑡𝑟𝑜𝑙𝑋 100
iv. Non-site-specific .OH radical mediated 2-deoxy-D-ribose degradation assay
The Fenton reaction made up of Ascorbate–EDTA and H2O2 generate hydroxyl (.OH) radicals which
could degrade deoxyribose and it is measured as a product degradation reaction. The .OH radical
inhibiting ability of the extracts were determined by investigating the tussle for the released hydroxyl
radicals within the extracts and deoxyribose as reported by Hinneburg et al. (2006). The experiment
was done by adding 200 μL of already mixed 100 μM FeCl3 and 100 μM EDTA (1:1 v/v) solution,
100 μL of 10 mM H2O2, 360 μL of 10 mM 2-deoxy-D-ribose, 1 mL of varying concentrations of the
extract (50–250 μg/mL), 400 μL of phosphate buffer (50 mM, pH 7.4) and 100 μL of 1 mM ascorbic
acid in progression. The resulting mixture was quickly incubated for 2 hours at 50°C. Then, 1 mL of
TCA (2.8%) and 1 mL of 1.0% thiobarbituric acid (in 25 mM NaOH) were added to the reaction
tubes. Further incubation in a H2O bath at 50°C for 30 min was required for the samples to develop a
pink colour. The absorbance at 532 nm was used to determine the level of oxidation of the samples
and the OH. radical scavenging capacity of the extract was recorded as percent inhibition of
deoxyribose using this expression:
𝐼𝑛ℎ𝑖𝑏𝑖𝑡𝑖𝑜𝑛 (%) = 1 − (𝐴𝑏𝑠𝑜𝑟𝑏𝑎𝑛𝑐𝑒 𝑜𝑓 𝑠𝑎𝑚𝑝𝑙𝑒
𝐴𝑏𝑠𝑜𝑟𝑏𝑎𝑛𝑐𝑒 𝑜𝑓 𝑐𝑜𝑛𝑡𝑟𝑜𝑙) 𝑋 100
30
v. Nitric oxide (NO) radical inhibition assay
The ability of aqueous solution of sodium nitroprusside at physiologic pH to aggressively emit nitric
oxide (NO) that might interact with oxygen to generate nitrite ions forms the basis of this assay
(Kurian et al., 2010). These nitrite ions could be determined using Griess reagent. The experiment
was done by briefly incubating 500 μL of 10 mM sodium nitroprusside in sodium phosphate buffer
(pH 7.4) and 500 μL of the extract at different concentrations (50-250 μg/mL) for 2 h at 37°C. A 500
μL of Griess reagent was then added to the reaction mixture. A chromophore produced by the
coupling of nitrite with sulphanilamide was determined at 546 nm. The percentage inhibition of the
NO emitted was calculated by comparison with the absorbance of a prepared control (10 mM sodium
nitroprusside in phosphate buffer). The assay was done three times and the scavenging capacities of
the plant was estimated using the expression below:
𝑆𝑐𝑎𝑣𝑒𝑛𝑔𝑖𝑛𝑔 𝑎𝑐𝑡𝑖𝑣𝑖𝑡𝑦 (%) = 1 − (𝐴𝑏𝑠𝑜𝑟𝑏𝑎𝑛𝑐𝑒 𝑜𝑓 𝑠𝑎𝑚𝑝𝑙𝑒
𝐴𝑏𝑠𝑜𝑟𝑏𝑎𝑛𝑐𝑒 𝑜𝑓 𝑐𝑜𝑛𝑡𝑟𝑜𝑙) 𝑋 100
2.2.2 In vitro key anti-diabetic and anti-obesogenic enzymes inhibitory assays
a) Inhibitory of -glucosidase activity
The α-glucosidase inhibitory potential of the extracts was determined based on a slightly modified
version of a previously published method (Ademiluyi and Oboh, 2013). Briefly, a 250 µL of acarbose
(standard) or extract at varying concentrations (50-250 µg/mL) was incubated with 500 µL of -
glucosidase (1.0 U/mL) in phosphate buffer (with a concentration of 100 mM, pH 6.8) for 15 min at
37°C. Then, a 250 µL of 5 mM p-Nitrophenyl-α-D-glucopyranoside (pNPG) solution mixed in the
phosphate buffer was added to the mixture and further incubated for 20 min at 37°C. The substrate
was pNPG and the absorbance of the released p-nitrophenol was noted at 405 nm. The inhibitory
activity was reported as a proportion of the control devoid of inhibitors using this expression:
𝐼𝑛ℎ𝑖𝑏𝑖𝑡𝑖𝑜𝑛 (%) = 1 − (𝐴𝑏𝑠𝑜𝑟𝑏𝑎𝑛𝑐𝑒 𝑜𝑓𝑠𝑎𝑚𝑝𝑙𝑒
𝑐𝑜𝑛𝑡𝑟𝑜𝑙 ) X 100
b) -amylase inhibitory activity
The -amylase inhibitory potential of the extracts were investigated using a previously reported
procedure (Shai et al., 2010) with moderate modifications. Briefly, 250 μL of each extract or standard
(acarbose) at varying doses (50-250 μg/mL) was incubated with a 500 μL of porcine pancreatic
amylase (2 U/mL) in phosphate buffer (100 mM, pH 6.8) for 20 min at 37°C. Then, a 250 μL of starch
31
(1%) was suspended in 100 mM phosphate buffer (pH 6.8) and was subsequently added to the reaction
and incubated for 1 h at 37°C. A dinitrosalicylate (DNS) colour reagent (1 mL) was thereafter added
and boiling was initiated for 10 min. The absorbance of the resulting mixture was recorded at 540 nm
and the inhibitory activity was expressed as proportion of a control lacking inhibitors.
𝐼𝑛ℎ𝑖𝑏𝑖𝑡𝑖𝑜𝑛 (%) = 1 − (𝐴𝑏𝑠𝑜𝑟𝑏𝑎𝑛𝑐𝑒 𝑜𝑓𝑠𝑎𝑚𝑝𝑙𝑒
𝑐𝑜𝑛𝑡𝑟𝑜𝑙 ) 𝑋 100
c) Estimation of pancreatic lipase inhibitory activity
Pancreatic lipase inhibitory potential of plant extracts was determined using a slightly modified
procedure from its originally published form (Kim et al., 2010), here, the substrate used was p-NPB
(p-nitrophenyl butyrate) in dimethyl formamide. The lipase inhibitory activity was extrapolated by
recording the hydrolysis of p-NPB to p-nitrophenol by measuring absorbance at a wavelength of 405
nm. The inhibition rate of lipase by the plant extract was calculated using the following expression:
% Inhibition = (1 −𝐴𝑠
𝐴𝑐) 𝑋 100
As: absorbance in the presence of the sample and Ac: absorbance of the control.
2.2.3 Ex vivo antioxidant assays
A 100 µL of pancreatic and hepatic tissue homogenates from rats was pipetted into a reaction mixture
containing 100 µL of each extract with 30 µL of pro-oxidant (0.1 mM FeSO4). This was then
incubated in 5% CO2 for 30 min, a reaction containing no extract served as negative control i.e.
untreated.
This sample was then immediately assayed for Catalase (Chance and Maehly, 1955), Superoxide
Dismutase (SOD) (Kakkar et al., 1984), reduced glutathione (GSH) level (Ellman, 1959), and lipid
peroxidation (LPO) level (Chowdhury and Soulsby, 2002). The Folin–phenol method was used in
estimating the total protein content of the tissue homogenates (Lowry et al., 1951).
i. Catalase activity
The catalase activity was estimated by a spectrophotometric molybdate procedure (Hadwan and
Abed, 2016). Concisely, 100 µL of the incubated homogenate was added to 1 mL of H2O2 (65 µM)
in sodium phosphate buffer (6.0 mM, pH 7.4) for 3 min. The reaction was ended by adding 4 mL of
ammonium molybdate (32.4 mM) and the alterations in the yellow-coloured molybdate/H2O2
32
complex was recorded at a wavelength of 347 nm compared to the blank containing H2O2 alone. The
catalase activity was estimated using this expression:
CAT(kU) = 2.303
𝑡∗ [log
𝑆°
𝑆−𝑀] ∗
𝑉𝑡
𝑉𝑠
t = time; S° = Abs. of standard tube (containing all reagents except tissue sample); S = Abs. of test
samples; M = Abs. of control test sample (contains all reagents except H2O2); Vt = summation of
volume of total reagents in test tube; Vs = test sample volume; Abs. = Absorbance at 340 nm
ii. Superoxide dismutase (SOD) enzyme activity
This assay was performed according the procedure of Kakkar et al. (1984) with slight modifications.
Concisely, 170 μL of a 0.1 mM diethylenetriaminepentaacetic acid (DETAPAC) and 15 μL of the
incubated homogenate were platted in a 96-well plate. Immediately, 15 μL of a 1.6 mM 6-
hydroxydopamine (6-HD) was put in the mixture followed by gentle mixing by carefully patting the
sides of the 96-well plates. Absorbance was measured at 492 nm for 3 minutes at 1 min interval. The
activity of the present SOD enzyme was determined by exploiting this formula:
𝐴𝑐𝑡𝑖𝑣𝑖𝑡𝑦 =(𝐴1 − 𝐴𝑏)𝑋 𝑅𝑣 𝑋 𝐷𝑓
490 𝑋 𝑆𝑣
ε490 is the standard molar absorptivity at 490 nm wavelength given as 1.742/mM/cm, A1 and Ab
are rates of reaction rate for sample and blank. Rv is the volume of the entire reaction, Df is the used
dilution factor and Sv is the volume of the sample.
iii. Reduced glutathione (GSH) assay
This assay relies on the rapid oxidation of GSH by 5,5’-dithio-bis (2-nitrobenzoic acid) to generate
5’-thio-2-nitrobenzoic acid (TNB) a yellow formation measurable at 415 nm. The formed oxidised
glutathione (GSSG) can be converted to GSH by glutathione reductase in a reaction containing the
cofactor NADPH (Rahman et al., 2006). Briefly, 150 µL of incubated sample was precipitated with
equal volume of TCA (10%) and then centrifuged at 2000 rpm for 10 min at 25°C. A 80 µL of the
supernatant, with 40 µL of 0.5 mM DTNB and a 200 µL of sodium phosphate buffer (0.2 M, pH 7.8)
was plated in a 96-well plate. The mixture was then incubated at 25°C for 15 min and its absorbance
measured at 415 nm. A standard curve was plotted using varying GSH concentrations as standard and
the GSH concentration of each sample was extrapolated from the standard curve.

33
iv. Determination of lipid peroxidation
This was carried out using a slightly modified previously reported method (Oboh et al., 2012). Lipid
peroxidation was initiated by incubating 30 μL of ferrous sulphate (15mM) with 100 μL of varying
concentration of the extract (50-250 μg/mL) in water and the pancreatic homogenate for 30 min at
37°C. Then, 200 μL of SDS (8.1%) solution, 750 μL of acetic acid (20%), 2 ml of TBA (0.25%)
solution and 850 μL of miliQ H2O and further boiled with the 200 μL of the incubated samples for
one hour. After cooling, the absorbance was recorded at 532nm. The MDA concentrations of the
tested samples were extrapolated from the MDA standard curve.
v. Determination of glutathione reductase activity
This assay relies on measuring the glutathione reductase activity spectrophotometrically by recording
reduction in absorbance of the NADPH at 340 nm (Smith et al., 1988). Briefly, 10 µL of sample or
glutathione reductase buffer (at a concentration of 50 mM Tris.HCl and 1 mM EDTA solution, pH
8.0) for blank was mixed in a 96-well plate and a 221 µL of the assay buffer with 38 µL of GSSG
solution (8 mM) was added consecutively. Thereafter, 10 µL of NADPH was put in the reaction
followed by immediate mixing by gently patting the four sides of the 96-well plate. The linear
decrease in absorbance at 340 nm was quickly noted for 8 min at a 2 min interval using a multi-plate
reader. The activity of the glutathione reductase enzyme was calculated using this expression:
Activity = 1000 𝑋 [𝐴1−𝐴𝑏
340] 𝑋 0.5 µmol/min/µg of protein
Where: 340 is the molar absorptivity at 340 nm which is 6.22 mM/cm, A1 and Ab represents rate of
the sample and blank reactions.
vi. Estimation of glutathione peroxidase activity
This reaction is based on the oxidation of GSH to GSSG through the glutathione peroxidase enzyme
in the presence of H2O2:an antioxidant. Briefly, sample homogenates and serum samples were diluted
to a concentration range of 5-10 mg/mL (based on their protein concentration) using the assay buffer.
A 5 µL of the diluted sample or homogenization buffer (blank) was platted in a UV disposable 96-
well plate, then a 210 µL of assay buffer, 2.5 µL of GSH solution (100 mM), 2.5 µL of glutathione
reductase (0.1 U/mL), 2.5 µL of sodium azide solution (100 mM) (added to diluted hepatic
homogenates to inhibit catalase activity) or 5 µL of distilled H2O (to other samples or blank).
Thereafter, 2.5 µL of NADPH (15 mM) was added and the t-BHP-independent NADPH oxidation
was recorded at 340 nm (reaction 1) for 8 min at 2-min intervals for both the sample (A1) and blank

34
(A1b) using a multi-plate reader. The reaction was initiated by adding 25 μL of either 12 mM t-BHP
or 1.5 mM H2O2 solution (for liver sample homogenates) and the hydroperoxide-dependent linear
NADPH oxidation at absorbance of 340 nm (reaction 2) was recorded for 6 min at 2 min intervals for
both the samples (A1) and the blank (A2) using a multi-plate reader.
The following expression was used to calculate the activity of glutathione peroxidase enzyme:
Activity = 1000 × ((A2 -A1) - (A2b-A1b))/ є340 × 𝟎. 𝟓 μmol/min/μg of protein
є340 is the Molar absorptivity at 340 nm which is 6.22/mM/cm, A1 and A2 is the rate of reaction 1
and 2 for the samples, A1b and A2b is the rate of reaction for blank reaction 1 and 2.
2.2.4 Gas chromatography-mass spectrometric (GC-MS) analysis of most effective extracts
and fractions
Based on the results of the experiments carried out so far, the most active extracts from the plant were
put through GC-MS analysis. GC-MS analysis was carried out on an Agilent Technologies 6890
Series GC coupled with an Agilent 5973 mass selective detector equipped with Agilent Chemstation
software. A HP-5MS capillary column was used (30 m × 0.25 mm ID, 0.25 μm film thickness, 5%
phenylmethylsiloxane). Helium was used as the carrier gas at a flow rate of 1.0 mL min-1 and linear
velocity of 37 cm/s. The injector temperature was set at 250°C. The oven temperature was
programmed to reach 280C from initial 60°C at a rate of 10°C/min. A 1 μL injection was made in
the split mode with a split ratio of 20:1. The MS was operated in the electron ionization mode at 70
eV and electron multiplier voltage at 1859 V. The operating parameters for the instrument were: ion
source temp. 230°C, quadrupole temp. 150°C, solvent delay 4 min and scan range 50-70 amu.
Compounds were identified using the NIST library by direct comparison to the mass spectral data of
known compounds.
2.2.5 Liquid Chromatography-Mass Spectroscopy (LC-MS) profiling
The aqueous extract and fractions were subjected to LC-MS analysis (Shimadzu LCMS-2020 Single
Quadrupole) by direct injection into the machine via a loop, with the stop time set at 4 mins. The
operating parameters were:
Photodiode Array (PDA) sampling frequency: 1.5625 Hz; Operating mode: low pressure
gradient; Pump A: LC-2030 Pump; Mobile Phase A and B: water and methanol respectively; Flow
rate: 0.200 ml/min; Start and End wavelengths: 190 and 800 nm respectively; Cell Temp.:
35
40°C; Start and End time: 0.00 and 4.00 mins respectively; Acquisition mode: Scan; Scan Speed:
1667 u/s; Polarity: Positive; Event Time: 1.00 s; Detector Voltage: +1.00 kV; Threshold: 0; Start
and End m/z: 50.00 and 1700.00 respectively. Compounds were identified directly by comparing
their mass spectral data with those in the NIST library online and Food Database [FooDB
Version 1.0] (FoodDB, 2017).
2.2.6 Fourier transform infrared spectroscopy (FT-IR) analysis
The chemical functional groups of the extracts and fractions were determined by direct scanning at a
spectral range of 380 – 4000 cm–1 on a FT infrared spectrophotometer. The functional groups were
determined by comparing the peak frequencies to an IR spectroscopy correlation table.
2.2.7 Molecular docking
The docking studies for antioxidant and anti-diabetic enzymes were performed using AutoDock Vina
software (Trott and Olson, 2010). The crystal structure of the antioxidant enzymes was downloaded
from the protein data bank (PDB). The human SOD (PDB ID: 2C9V, resolution 1.07 Å) (Strange et
al., 2006), human erythrocyte catalase (PDB ID: 1QQW, resolution 2.75 Å) (Ko et al., 2000) and
human glutathione reductase (PDB ID: 1XAN, resolution 2 Å) (Savvides and Karplus, 1996) were
selected as suitable structures for docking of catalase, SOD and glutathione reductase respectively.
PDB structures with access code: 1UOK (Watanabe et al., 1997) (resolution 2.4 Å), 1LPB (Egloff et
al., 1995) (resolution 2.46 Å) was used for α-glucosidase and lipase respectively. The active binding
site of catalase, SOD and glutathione reductase was defined using AutoDock tools (Sanner, 1999)
within the grid size of (54x48x46), (64x62x60), (28x26x24) respectively while 44x42x40 dimensions
was used for α-glucosidase and lipase with 1.00 Å as the grid spacing. AutoDock tools graphical user
interface by MGL Tools (Morris et al., 2009) was applied to add Gasteiger charges. All the ligand
structures were retrieved from PubChem compound database and optimized using Gaussian 09, prior
to docking to obtain the global minimal structures (Makatini et al., 2013, Oyebode et al., 2018).
2.3 In vitro and ex vivo antioxidant and anti-diabetic activities of solvent fractions derived
from the crude extracts
2.3.1 Solvent fractionation of the most active crude extracts from each plant
From the results of the preliminary antioxidant assays (earlier described), the most promising crude
extract from each plant was picked for further fractionation (Figure 2.3). The selection was made
within crude extracts obtained from the same plant.

36
The preferred extracts for fractionation were the ethanol extract of leaves (A. boonei and B.
ferruginea). Ten g of these crude extracts was dissolved totally in 100 mL of distilled water: methanol
(1:9) and then partitioned successively with hexane (200 mL twice), dichloromethane (200 mL twice),
ethyl acetate (200 mL twice) and n-butanol (200 mL twice) (Figure 2.3). All the resulting fractions
were evaporated to dryness at 40°C under reduced pressure and the remaining aqueous fraction was
dried on a water bath. The fractions were then weighed, put in glass vials and refrigerated at 4°C until
needed.
Figure 2.3: Flowchart showing the step by step fractionation of the crude extracts
All the fractions were investigated for in vitro, ex vivo antioxidant and anti-diabetic activities using
the procedures earlier described.
2.4 Ex vivo glucose absorption and glucose uptake study
a. Animals
Five male Sprague-Dawley rats weighing 180 ± 10.12 g (average body weight) were received from
the Biomedical Resource Unit (BRU) located in the Westville Campus of the University of KwaZulu-
Natal, Durban, South Africa. The animals were momentarily (12 h) denied food but not water and
37
euthanized using isofor anaesthesia. Then the entire gastrointestinal tract (GIT) and parts of the psoas
muscle were harvested after dissection and instantly used for small intestinal glucose absorption and
muscle glucose uptake study, respectively. The animals were handled in cognisance to the rules and
regulations of the Animal Research Ethics Committee of the University of KwaZulu-Natal, Durban,
South Africa (Ethical approval number: AREC/003/017D).
b. Determination of glucose absorption in isolated rat small intestine
The effects of the varying concentrations (100-250 mg/dL) of extracts/fractions on small intestinal
glucose absorption was measured in harvested rat jejunum. In this regard, the concentrations of
glucose level in an incubation mixture consisting the pre-cut rat jejunum and test samples was
recorded according to a previously published method (Hassan et al., 2010) as modified by Chukwuma
et al. (2017). Briefly, jejunal segments of the harvested small intestine were sliced into smaller pieces
of 5 cm and the inner jejunal lumen was cleaned with 2 mL of Krebs buffer (118 mM NaCl, 5 mM
KCl, 1.328 mM CaCl2·2H2O, 1.2 mM KH2PO4, 1.2 mM MgSO4 and 25 mM NaHCO3) by an
antiseptic syringe. The pieces were initially inverted to show the villi, and then placed in an incubation
tube with 8 mL of Krebs buffer and 11.1 mM glucose and varying concentrations of extract when
glucose with Krebs buffer was used as a control. Then 1 mL mixture was taken from each incubation
tube before and after the 2 h incubation time in a Steri-Cult CO2 incubator (Labotec, South Africa)
with 5% CO2, 95% oxygen and 37°C settings. The amount of glucose in the samples was determined
using an Automated Chemistry Analyzer (Labmax Plenno, Labtest Inc., Costa Brava, Brazil). The
small intestinal absorption of glucose was extrapolated as the quantity of glucose absorbed per
centimetre of rat jejunum using following formula:
Abdominal glucose absorption = 𝐺𝐶1− 𝐺𝐶2
𝑙𝑒𝑛𝑔𝑡ℎ 𝑜𝑓 𝑗𝑒𝑗𝑢𝑛𝑢𝑚 (𝑐𝑚)
Where GC1 & GC2 are the glucose concentrations (mg/dL) before and after the incubation
respectively.
Percentage inhibition of glucose intake from the jejunum of small intestine was recorded as per
following expression:
%Inhibition = Δ𝐺𝐶 𝑐𝑜𝑛𝑡𝑟𝑜𝑙− ΔGC sample)
ΔGC control X 100
Where ΔGC = Change in glucose concentration before and after incubation
38
c. Determination of glucose uptake in harvested rat psoas muscle
The effect of the different concentrations (100-250 mg/dL) of the plant extracts/fractions on muscle
glucose uptake was measured in harvested rat psoas muscle according to the procedure explained in
a previous study (Hassan et al., 2010) as modified by Chukwuma et al. (2017). The harvested psoas
muscle was briefly cleaned with Krebs buffer and diced into small chunks of the same weight (500
mg). Each chunk was then incubated in 8 ml of Krebs buffer, pre-mixed with 11.1 mM glucose
(control) and varying concentration of the extract. A 0.5 mg/mL metformin solution was used as a
positive control. The incubation time lasted for an hour in a CO2 incubator (as mentioned earlier) with
5% CO2, 95% oxygen and 37°C temperature settings. Before and after the incubation period, 1 mL
sample was collected from each incubation tube and the glucose concentration was measured using a
Chemistry Analyzer as mentioned earlier. The uptake of glucose by the muscle was extrapolated as
the quantity of glucose (mg) used up by each gram of muscle tissue using following formula:
Muscle glucose = (𝐺𝐶1−𝐺𝐶2)
𝑊𝑒𝑖𝑔ℎ𝑡 𝑜𝑓 𝑚𝑢𝑠𝑐𝑙𝑒 𝑡𝑖𝑠𝑠𝑢𝑒 (𝑔)
Where GC1 and GC2 are glucose concentrations before and after incubation respectively.
2.5 In vivo antidiabetic activity of the most active fractions in a type 2 diabetes rat model
From the results of all the experiments carried out, the best fraction/extract from each plant was chosen
for the in vivo studies. The aqueous fraction of B. ferruginea leaves, the butanol fraction of A. boonei
leaves and the aqueous crude extract of C. rubens were selected for in vivo study since they showed the
best activities in the antioxidant and antidiabetic models used during in vitro and ex vivo studies.
a. Animals
Seven-week-old male Sprague-Dawley rats were procured from the Biomedical Resource Centre located
at the Westville Campus of the University of KwaZulu-Natal, Durban, South Africa. Animals were
randomly grouped into seven (7) groups as follows, with five (5) rats each in the normal or non-diabetic
groups and seven (7) rats each in the diabetic groups:
Normal Control (NC) = Normal male SD rats (non-diabetic/not treated)
Non-diabetic fraction control (NFC) = non-diabetic rats administered 300 mg/kg body weight fraction
Diabetic Control (DC) = diabetic and untreated rats
Diabetic & fraction Low dose (DFL) = diabetic rats administered 150 mg/kg body weight fraction
39
Diabetic & fraction High dose (DFH) = diabetic rats administered 300 mg/kg body weight fraction
Diabetic & Standard drug; Metformin and glibenclamide (DBM & DBG) = diabetic rats administered 300
mg/kg body weight metformin and 5 mg/kg body weight glibenclamide.
The same arrangement was used for the other two fraction and extract used for the in vivo studies (Figure
2.4).

40
Figure 2.4: Flow diagram describing comprehensive in vivo experiment
The animals were bred in a maximum of seven-in-one large poly carbonate cages and in a temperature
and humidity-controlled room with a 12-hour light-dark cycle. The entire animals were fed with a
commercial rat pellet diet ad libitum all through the experimental period. Animals were maintained
according to the rules and regulations of the Experimental Animal Ethics Committee of the University of
KwaZulu-Natal, South Africa (Animal ethics approval number: AREC/003/017D).

41
b. Induction of diabetes
The animals were left to acclimatize for one week. During the first 2 weeks of the experiment, the animals
in the diabetic groups were supplied with a 10% fructose solution to induce insulin resistance (Wilson
and Islam, 2012) while the animals in the normal or non-diabetic groups were supplied with normal
drinking water. Thereafter, animals in the diabetic groups were intraperitoneally injected with a low dose
of streptozotocin (40 mg/kg body weight)dissolved in a citrate buffer (pH 4.5) to induce partial pancreatic
β-cell dysfunction, while animals in the normal or non-diabetic groups were injected with the same
volume of citrate buffer alone. A week after the streptozotocin injection, the Non-fasting blood glucose
levels of all animals were measured using the whole blood extracted from the tail vein tested with a handy
glucometer, and animals with a NFBG level > 200 mg/dL were considered as diabetic. However, animals
with a NFBG level < 200 mg/dL were removed from the experiment.
c. Intervention trial
After induction of diabetes, all animals had unlimited access to drinking water and commercial rat chow
and the animals in plant fraction/extract groups were given a single oral dose of respective plant
fraction/extract (150 or 300 mg/kg body weight) then the animals in the DBM and DBG groups were
administered with a single oral dose of metformin (300 mg/kg body weight), glibenclamide (5 mg/kg
body weight), respectively. The animals in the NC and DBC groups were supplied with equivalent volume
of normal drinking water via the same route.
d. Oral Glucose Tolerance Test (OGTT)
The OGTT was done in the last week of the 5-week intervention period. This was done after an overnight
fast, then glucose was orally administered to each animal at a dose of 2.0 g/kg body weight and blood
samples were collected from the tail vein at 0 (just before glucose ingestion), 30, 60, 90 and 120 min.
Glucose levels were estimated by using a portable Glucometer (Glucoplus, Quebec, Canada).
e. Determination of food and fluid intake, body weight and sampling
All through the study, the body weights of rats were measured weekly and the food and fluid intake was
measured daily. The study was concluded with an overnight fasting (12 h) of all animals and consequently
anesthetizing using isofor. The blood was collected via cardiac puncture and organs (liver, kidney, heart,
muscle and pancreas) were collected, rinsed, weighed and preserved at a temperature of -30°C for
subsequent analysis. Sterile centrifuge tubes were used for blood collection and the samples were stored
on ice for 2-3 h. Separation of the serum was done by centrifugation at 3000 rpm for 15 min and stored at
42
-30°C for further usage. A small part of the pancreas from each rat was cut and submerged into a 10%
neutral buffered formalin and then stored at room temperature for histopathological analysis.
2.6 Serum analysis
Serum insulin concentration was measured using an enzyme-linked immunosorbent assay (ELISA)
procedure done with an ultrasensitive rat insulin ELISA kit (purchased through Mercodia, Uppsala,
Sweden) with absorbance read in a multi-plate reader. The total cholesterol, HDL- and LDL-
cholesterols, with triglycerides, fructosamine, urea, and uric acid concentrations including liver
function enzymes; aspartate and alanine aminotransferases (AST and ALT) and alkaline phosphatase
(ALP) were determined with an Automated Chemistry Analyzer (Labmax Plenno, Labtest Co. Ltd.,
Lagoa Santa, Brazil) using standard assay kits for these analyses purchased from the same production
company. Homeostatic model assessment (HOMA-IR and HOMA-β) were estimated using serum
insulin levels and FBG concentrations taken at the end of the experiment using the following
expression:
HOMA – IR = Serum insulin (U/L) X Blood glucose (mg/dL)
22.5
HOMA – β cell function = 20 X Serum insulin in U/L
Blood glucose in mg/dL− 3.5
The conversion factor for insulin = 1 U/L = 7.174 pmol/L
2.7 Hepatic glycogen content
Estimation of the levels of hepatic glycogen concentrations was done by using a phenol-sulfuric acid
method (Lo et al., 1970). One gram of the excised liver was digested with 1.5 mL of 30% KOH
saturated in Na2SO4. This was put in a test tube completely immersed in ice, later it was boiled for 30
mins. Then 2 mL of 95% ethanol was added to the sample followed by cold centrifugation for 30
mins at 840 g twice to properly precipitate the glycogen content. Thereafter the supernatant was
aspirated, and the precipitate dissolved in 3 mL of distilled water. A 1 mL of 5% phenol was added
to the dissolved glycogen and 5 mL of concentrated H2SO4 was rapidly and carefully added. The
mixture was mixed thoroughly and boiled for 20 mins, followed by cooling and the absorbance was
read using a 96-well plate at 600 nm. The glycogen content of the samples was extrapolated from a
standard glycogen curve and reported in mg/g glycogen.
43
2.8 Histopathology analysis of the excised pancreas
The formalin-preserved pancreatic tissue was subjected to standard laboratory procedures for paraffin
fixing/embedding. Tiny sections were cut to a size of approximately 4 μm, followed by deparaffination
of the slides using p-xylene. This was consequently rehydrated using ethanol at different concentrations
(100%, 80%, 70%, 50%) and cleansed with running water. Subsequently, the hematoxylin was used to
stain the slides for 5 mins and then cleansed with running water. Next was counterstaining using eosin,
Finally, the stained slides were arranged and mounted in DPX, with a sterile cover-slip and viewed with
Leica slide scanner (SCN 4000, Leica Bio-systems, Germany).
2.9 In vivo antioxidant studies
To fully understand the likely role of antioxidant activity in combination to the observed anti-diabetic
activity, the in vivo antioxidant potentials of the fractions/extract were investigated in the serum and
tissues of the animals using six in vivo oxidative stress markers namely; reduced glutathione (GSH),
thiobarbituric acid reactive substances (TBARS) levels, catalase, superoxide dismutase (SOD),
glutathione reductase (GR) and glutathione peroxidase (GPx) assays.
To perform these assays, centrifuged homogenates of the excised tissues (liver, kidney, heart and
pancreas) were initially prepared by homogenising 0.5 g of the organ tissue sample in 4000 µL of
homogenization buffer (50 mM sodium phosphate buffer with triton X-100, pH 7.5) with an Ultra
Turrax Tube Drive Work Station Homogenizer (IKA-Works, Staufenim Breisgau, Germany). Soon
after, the solution was transferred to a microtube and centrifuged for 15 min at 15000 rpm in a Hettich
Mikro 200 Microcentrifuge (Hettich Lab Technology, Tuttlingen, Germany). The supernatant was
then poured in another micro tube and kept at -20°C for subsequent analysis.
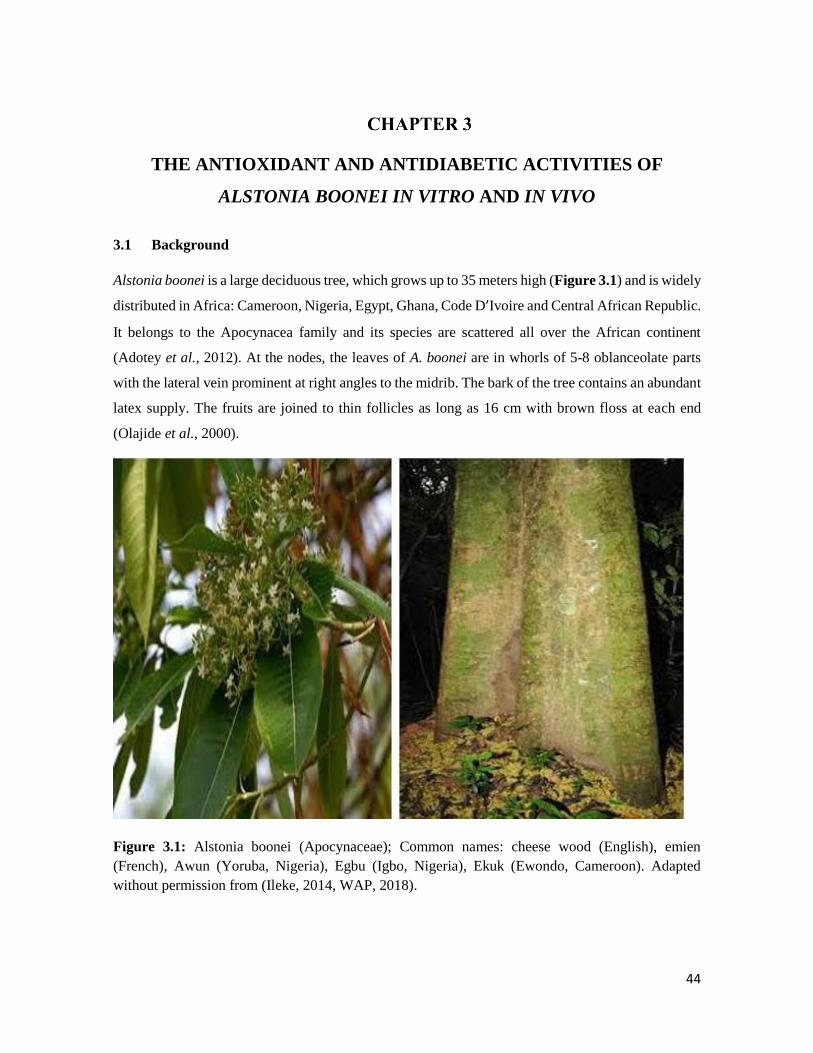
44
THE ANTIOXIDANT AND ANTIDIABETIC ACTIVITIES OF
ALSTONIA BOONEI IN VITRO AND IN VIVO
3.1 Background
Alstonia boonei is a large deciduous tree, which grows up to 35 meters high (Figure 3.1) and is widely
distributed in Africa: Cameroon, Nigeria, Egypt, Ghana, Code D’Ivoire and Central African Republic.
It belongs to the Apocynacea family and its species are scattered all over the African continent
(Adotey et al., 2012). At the nodes, the leaves of A. boonei are in whorls of 5-8 oblanceolate parts
with the lateral vein prominent at right angles to the midrib. The bark of the tree contains an abundant
latex supply. The fruits are joined to thin follicles as long as 16 cm with brown floss at each end
(Olajide et al., 2000).
Figure 3.1: Alstonia boonei (Apocynaceae); Common names: cheese wood (English), emien
(French), Awun (Yoruba, Nigeria), Egbu (Igbo, Nigeria), Ekuk (Ewondo, Cameroon). Adapted
without permission from (Ileke, 2014, WAP, 2018).
45
3.1.1 Ethnobotanical uses
The stem bark remains the most commonly used part for therapeutic purposes; though more effective
when used fresh, the dried part is also frequently used (Olajide et al., 2000). The bark has been found
to contain anti-inflammatory, analgesic, antipyretic, antidiabetic, anti-helminthic and antimicrobial
activities (Akinmoladun et al., 2007; Gupta et al., 2005; Okoye et al., 2014; Opoku and Akoto, 2015).
A decoction of the stem bark is usually mixed in honey and taken four times a day as painkiller for
dysmenorrhea, lower abdominal pain and pains as a result of malaria (Majekodunmi et al., 2008).
Cold infusion from the stem bark (fresh or dry) is effective as a hypoglycaemic agent. This is also
effective as a good deworming liquid (Adotey et al., 2012; Olajide et al., 2000). A mixture of the
decoction of the stem bark of A. boonei with other plants can be used in treatment of asthma, fractures,
jaundice and breastmilk induction. The leaves and latex are also used in the treatment of rheumatism,
hypertension and muscular pain (Iniaghe et al., 2012).
3.1.2 Biological activities
Much attention has been given to the analgesic and anti-malaria effect of A. boonei and until recently
little has been known on its anti-diabetic effects.
The analgesic property of the methanol leaf extract was investigated, and it was discovered that the
analgesic effects of A. boonei could be mediated through both central and peripheral mechanisms
(Iniaghe et al., 2012). In order to validate the anti-microbial activity of A. boonei, the ethanol and
aqueous extract of the root was assayed for microbial susceptibility using the agar well diffusion
procedure (Opoku and Akoto, 2015). Some gram-positive and gram-negative bacteria such as
Staphylococcus aureus, Bacillus subtilis, Escherichia coli and Pseudomonas aeruginosa and a fungus
(Candida albicans) were used for this study and the result revealed that the ethanol extract exhibited
better antimicrobial ability than the aqueous counterpart. An isolate obtained from the petroleum ether
fraction of A. boonei lupeol acetate was investigated for its anti-arthritic activity in an arthritic animal
model. Lupeol acetate reversed the increase in spleen weight and serum alkaline phosphatase which
were comparable to nonarthritic control values (Kweifio‐Okai and Carroll, 1993).
46
3.2 Phytochemical constituents, antioxidant and antidiabetic activities of different
extracts of the leaves, stem and root barks of Alstonia boonei: An in vitro and in
silico study
1Olajumoke A. Oyebode, 1Ochuko L. Erukainure, 2Collins U. Ibeji, 3Neil A. Koorbanally, 1Md.
Shahidul Islam*
1 Department of Biochemistry, School of Life Sciences, University of KwaZulu-Natal, (Westville
Campus), Durban 4000, South Africa
2 Department of Pure and Industrial Chemistry, Faculty of Physical Sciences, University of Nigeria,
Nsukka 410001, Enugu State, Nigeria.
3 School of Chemistry and Physics, University of KwaZulu-Natal, (Westville Campus), Durban
4000, South Africa
*Corresponding author: [email protected]; Tel: +27 (0)31-260-8717; Fax: +27 (0)31-260-7942
Preface: This article reports in detail the in vitro antioxidant and anti-diabetic studies of the crude
extracts from A. boonei;, it is currently under review in Journal of Natural Products Research.
3.2.1 Abstract
This study investigated the antioxidant activities of extracts from three parts of Alstonia boonei.
Sequential extraction was done on the leaves, stem and root bark samples with solvents of increasing
polarity and these extracts were assayed for total phenolic content and in vitro antioxidant and
antidiabetic activities using different experimental models. The electron donating, 1,1-diphenyl-2-
picryl-hydrazyl (DPPH) and nitric oxide radical scavenging capacity of all the extracts was
investigated in this study. The ability of these extracts to inhibit α-glucosidase and α-amylase were
also examined in vitro. The ethanol extract of the leaves showed the highest total phenolic content
compared to other extracts. All extracts showed free radical scavenging abilities in the different
models. The ethanol and aqueous extracts significantly (p < 0.05) inhibited the key anti-diabetic
enzymes tested. GC-MS analysis of the different plant parts revealed the presence of sterols,
aromatics, aliphatic acids and esters, which when docked with α-glucosidase and α-amylase enzymes
revealed a high binding affinity. Data from this study suggest that the different parts of A. boonei,
especially the ethanol and aqueous extracts, possess potent anti-oxidant activities that points to further
studies to identify the active agents.
Key words: Medicinal plant, oxidative stress, hyperglycaemia, A. boonei
47
3.2.2 Introduction
Medicinal plants have been widely accepted in Africa in the treatment and management of diverse
ailments. Fortunately, Africa is a land flourishing with a diversity of plant species. According to
World Health Organization (WHO), between 65% and 80% of the population of developing countries
depend on medicinal plants (Palhares et al., 2015). Development of drugs from natural sources is well
encouraged because only 15% of this has been fully exploited to determine their therapeutic potentials
out of over 300 000 species of plants in the world (De Luca et al., 2012). Since the last century, the
sporadic change in life styles and eating habits of the humans has led to unfolding of different types
of chronic diseases such as diabetes (Eddouks et al., 2012).
Diabetes is characterized under the category of non-communicable diseases (NCD) and is rapidly
emerging as a global health challenge (Arredondo et al., 2018). The global prevalence of adults over
18 years with diabetes has doubled over the past 20 years (Cho et al., 2018). Data from the
International Diabetes Federation (IDF) suggest that over 425 million people are currently diagnosed
to be living with diabetes and this number has been proposed to increase by over 50% in 2040 (IDF,
2017). Among all cases of diabetes, the most prevalent of all still remains type 2 diabetes (T2D)
which is predominant in 95% of all diabetic cases (Fuchsberger et al., 2016).
T2D is characterised by insulin resistance, partial β-cell dysfunction, which leads to and consequently
if left unmanaged hyperglycaemia (Fuchsberger et al., 2016). Persistent hyperglycaemia has been
implicated in the generation of free radicals through diverse pathways caused by auto-oxidation of
the excess glucose in the blood stream (Asmat et al., 2016). The continuous build-up of free radicals
which limits the antioxidant supply in the body leads to a condition known as oxidative stress (Asmat
et al., 2016). Oxidative stress has been linked to T2D-associated macro- and micro-vascular
complications (Matough et al., 2012).
The available synthetic drugs (such as metformin, glibenclamide, thiazolidinedione and others) have
not been able to fully manage these T2D associated complications since their efficacy reduces slowly
while they have some short- and long-term side effects. These side effects range from nausea,
hypoglycaemia, heart problems, and body weight gain. Apart from these, the high cost and availability
of these drugs also pose some drawbacks which leads to the need for alternate therapies from
medicinal plants among which is Alstonia boonei.
Alstonia boonei De Wild (family: Apocynaceae) is a towering tree which has species scattered all
over Africa. In some parts of Africa, it is referred to as “sacred tree” and is worshiped in these areas.

48
Traditionally, decoctions from the stem bark is used to treat ailments such as fever, inflammations
and joint pains (Akinnawo et al., 2017; Majekodunmi et al., 2008). The latex obtained from the stem
bark is also used as an analgesic in some parts of Africa (Adotey et al., 2012). Formulations from the
stem bark is currently being used in some parts of Nigeria in the effective treatment of malaria (Chime
et al., 2013). The crude ethanol leaves extract of A. boonei has been shown to have potent high blood
glucose reducing activity in an alloxan-induced rabbit model of diabetes (Akinloye et al., 2013;
Osadolor et al., 2015). However, the detailed antidiabetic activity of the various parts of this plant are
investigated yet and the mechanisms behind its antidiabetic activity are still unknown.
This study was conducted to examine the detailed antidiabetic activity as well as mechanisms behind
the antidiabetic effects of the different parts of this plant and thereafter, identify potential bioactive
compounds which could render synergistic effects to its activity. In silico molecular docking was also
performed with the compounds to estimate binding affinities of the identified compounds to α-
glucosidase and α-amylase which are potent carbohydrate hydrolyzing enzymes.
3.2.3 Materials and methods
Please refer to Chapter 2 for the detailed methods used for A. boonei.
3.2.4 Results
The ethanol extract of the leaves of A. boonei contained a significantly (p < 0.05) greater amount of
total phenol compared to all the other extracts from the different parts of this plant.
The total reducing power (reported as percentage gallic acid equivalent) of the different extracts of
A. boonei in comparison to ascorbic acid and Trolox is shown in Figure 3.2.1. The result showed that
the total reducing power of all extracts was increased with increasing concentrations. However, the
ethanol and aqueous extracts of the leaves, stem- and root barks showed significantly (p < 0.05) higher
Fe3+ to Fe2+ reducing capacity than the other extracts.

49
Table 3.2.1: Total phenolic content of various extracts of A. boonei parts
A. boonei parts Total polyphenols
(mg/g GAE)
Leaves
Ethyl acetate 50.04 ± 0.54d
Ethanol 58.14 ± 1.66d
Aqueous 26.71 ± 1.51a
Stem bark
Ethyl acetate 42.79 ± 0.057c
Ethanol 31.9 ± 0.384ᵇ
Aqueous 30.82 ± 0.85ab
Root bark
Ethyl acetate 33.00 ± 0.86ab
Ethanol 34.09 ± 1.02ab
Aqueous 34.82 ± 0.73ᵇ
Results are reported as mean ± SD of three replicas. a-dDifferent superscripts alphabets within a column are significantly
different from one another (Tukey’s-HSD multiple range post hoc test, p < 0.05).
Figure 3.2.2 shows the DPPH radical scavenging activities of A. boonei leaves, stem bark and root
bark extracts. All extracts were able to scavenge the DPPH free radical in a dose-dependent manner
however, the ethanol extract of the leaves and the aqueous extract of the stem- and root barks
demonstrated a more potent DPPH inhibiting activity which was almost similar to the standard
antioxidants (Trolox and Ascorbic acid) used. The IC50 values on Table 3.2.2 also for the ethanol
extract of the leaves and stem bark and the aqueous extract of the root bark.
The nitric oxide (NO) radical scavenging activities of the different extracts of A. boonei is shown in
Figure 3.2.3. Compared to other parts, only the stem bark extracts showed a concentration-dependent
inhibition of nitric oxide. The aqueous extract of the stem bark showed the lowest IC50 values (Table
3.2.1) even lower than the IC50 values of the tested standard antioxidants.

50
Figure 3.2.1: Total reducing power (relative to gallic acid) of leaves, stem bark and root bark extracts
of A. boonei. Results are reported as mean ± SD of three replicas. a-dDifferent alphabets presented for a given
concentration for each extract indicate significant difference (Tukey’s-HSD multiple range post hoc test, p < 0.05) EtAc:
Ethyl acetate, EtOH: Ethanol, AA: Ascorbic acid.
c cd d
cc
cb b b b baa a a
a
0
40
80
120
50 100 150 200 250
Tota
l red
uci
ng
po
wer
(%
)
Concentration (µg/mL)
Leaves
EtAc
EtOH
Aqueous
Trolox
AA
c c cd
dd
c c cbb b b baa a a
a
0
40
80
120
50 100 150 200 250Tota
l red
uci
ng
po
wer
(%
)
Concentration (µg/mL)
Stem bark
EtAc
EtOH
Aqueous
Trolox
AA
c c cdc
cbb b
b baa a a
a
0
40
80
120
50 100 150 200 250Tota
l red
uci
ng
po
wer
(%
)
Concentration (µg/mL)
Root bark
EtAc
EtOH
Aqueous
Trolox
AA
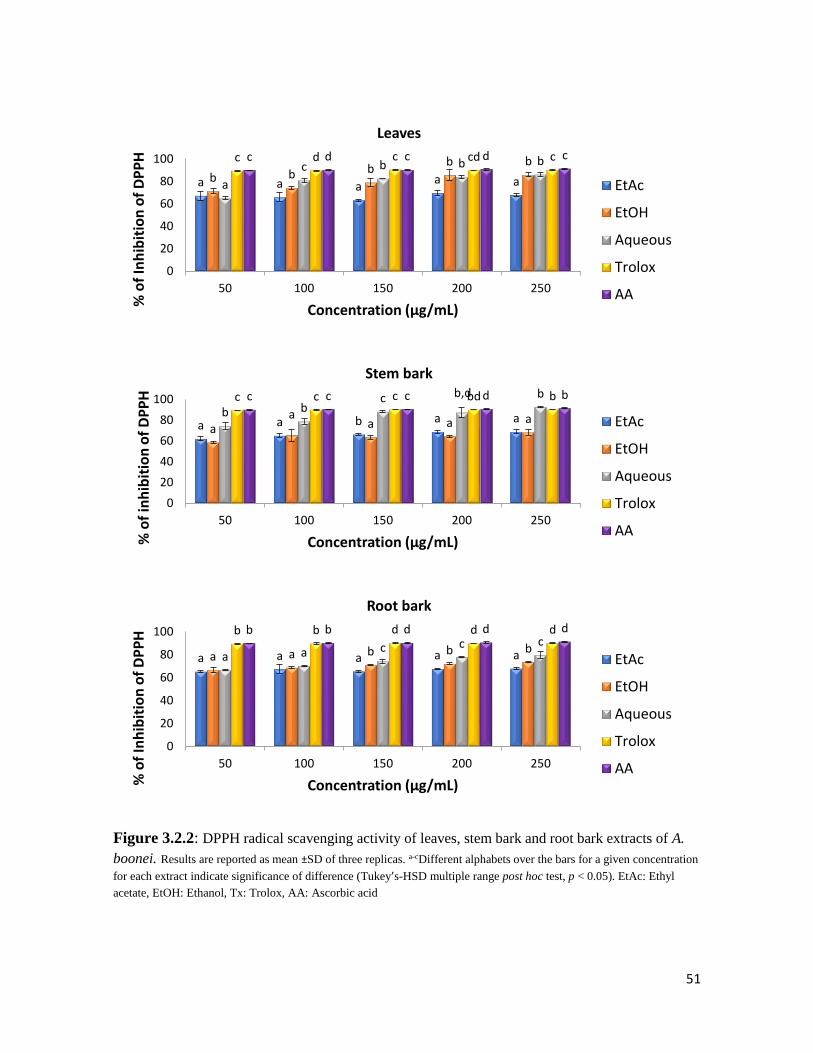
51
Figure 3.2.2: DPPH radical scavenging activity of leaves, stem bark and root bark extracts of A.
boonei. Results are reported as mean ±SD of three replicas. a-cDifferent alphabets over the bars for a given concentration
for each extract indicate significance of difference (Tukey’s-HSD multiple range post hoc test, p < 0.05). EtAc: Ethyl
acetate, EtOH: Ethanol, Tx: Trolox, AA: Ascorbic acid
a a aa ab b b
b b
a
c b b bc d c cd cc d c d c
0
20
40
60
80
100
50 100 150 200 250
% o
f In
hib
itio
n o
f D
PP
H
Concentration (µg/mL)
Leaves
EtAc
EtOH
Aqueous
Trolox
AA
a a b a aa
aa a ab b
c b,d bc c c bd bc c c d b
0
20
40
60
80
100
50 100 150 200 250
% o
f in
hib
itio
n o
f D
PP
H
Concentration (µg/mL)
Stem bark
EtAc
EtOH
Aqueous
Trolox
AA
a a a a aa a b b ba a c c c
b b d d db b d d d
0
20
40
60
80
100
50 100 150 200 250
% o
f In
hib
itio
n o
f D
PP
H
Concentration (µg/mL)
Root bark
EtAc
EtOH
Aqueous
Trolox
AA

52
Figure 3.2.3: Percentage of nitric oxide scavenging activities of extracts from leaves, stem bark and
root bark of A. boonei. Results are reported as mean ±SD of three replicas. a-dDifferent alphabets over the bars for a
given concentration for each extract indicate significance of difference (Tukey’s-HSD multiple range post hoc test, p <
0.05). EtAc: Ethyl acetate, EtOH: Ethanol, GA: Gallic acid, AA: Ascorbic acid.
The α-glucosidase and α-amylase inhibitory activities of the extracts are shown in Figures 3.2.4 and
3.2.5 when their respective IC50 values are represented in Table 3.2.2. The ethanol extracts
demonstrated significantly higher (p < 0.05) α-glucosidase inhibitory activity than the other extracts
bb
aa
ab b
aa aa
ab a
aba
a aa
a
ac c b bb
cc c c b
0
20
40
60
80
50 100 150 200 250
% In
hib
itio
n o
f N
O
Concentration (µg/mL)
Leaves
EtAc
EtOH
Aqueous
GA
AA
Trolox
bb
a aa
d
bb
b
aa a
b a bc bc
bcd c d c
dd
c d c d
0
20
40
60
80
50 100 150 200 250
% In
hib
itio
n o
f N
O
Concentration (µg/mL)
Root barkEtAc
EtOH
Aqueous
GA
AA
Trolox
a a a a a
b b cd c
aa
c c b
a ab
bbb b d d
cb
b d d c
0
20
40
60
80
50 100 150 200 250
% In
hib
itio
n o
f N
O
Concentration (µg/mL)
Stem barkEtAc
EtOH
Aqueous
GA
AA
Trolox
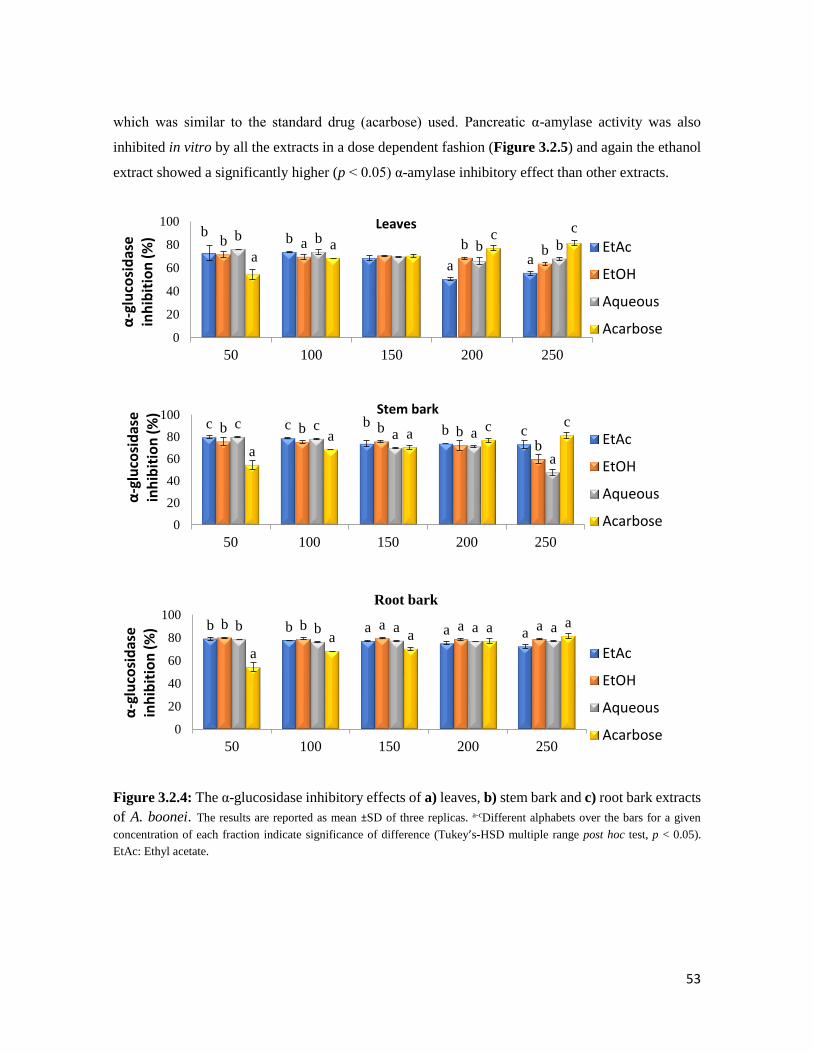
53
which was similar to the standard drug (acarbose) used. Pancreatic α-amylase activity was also
inhibited in vitro by all the extracts in a dose dependent fashion (Figure 3.2.5) and again the ethanol
extract showed a significantly higher (p < 0.05) α-amylase inhibitory effect than other extracts.
Figure 3.2.4: The α-glucosidase inhibitory effects of a) leaves, b) stem bark and c) root bark extracts
of A. boonei. The results are reported as mean ±SD of three replicas. a-cDifferent alphabets over the bars for a given
concentration of each fraction indicate significance of difference (Tukey’s-HSD multiple range post hoc test, p < 0.05).
EtAc: Ethyl acetate.
bb
a a
b a b bb b
b ba
ac
c
0
20
40
60
80
100
50 100 150 200 250
α-g
luco
sid
ase
in
hib
itio
n (
%)
…
Leaves
EtAc
EtOH
Aqueous
Acarbose
c c bb cb b b b
b
c ca a
aa
a ac c
0
20
40
60
80
100
50 100 150 200 250
α-g
luco
sid
ase
in
hib
itio
n (
%)
…
Stem bark
EtAc
EtOH
Aqueous
Acarbose
b b a a ab b a a ab b a a a
aa a
a a
0
20
40
60
80
100
50 100 150 200 250
α-g
luco
sid
ase
in
hib
itio
n (
%)
…
Root bark
EtAc
EtOH
Aqueous
Acarbose

54
Figure 3.2.5: α-amylase inhibitory effects of leaves, stem bark and root bark extracts of A. boonei.
The results are reported as mean ±SD of three replicas. a-dDifferent alphabets over the bars for a given concentration of each
fraction indicate significance of difference (Tukey’s-HSD multiple range post hoc test, p < 0.05). EtAc: Ethyl acetate, EtOH:
Ethanol.
aa
a a
ab b b
b
baa a a
cbc c c
d
0
20
40
60
80
50 100 150 200 250α-a
myl
ase
inh
ibit
ion
(%
)
Concentration (µg/mL)
Leaves
EtAc
EtOH
Aqueous
Acarbose
a a a a ab b ab
aa a a a abb b a b
0
20
40
60
80
50 100 150 200 250α-a
myl
ase
inh
ibit
ion
(%
)
Concentration (µg/mL)
Stem bark
EtAc
EtOH
Aqueous
Acarbose
a aa a ab b a
baa a a a ab
b b ab
0
20
40
60
80
50 100 150 200 250α-a
myl
ase
inh
ibit
ion
(%
)
Concentration (µg/mL)
Root bark
EtAc
EtOH
Aqueous
Acarbose
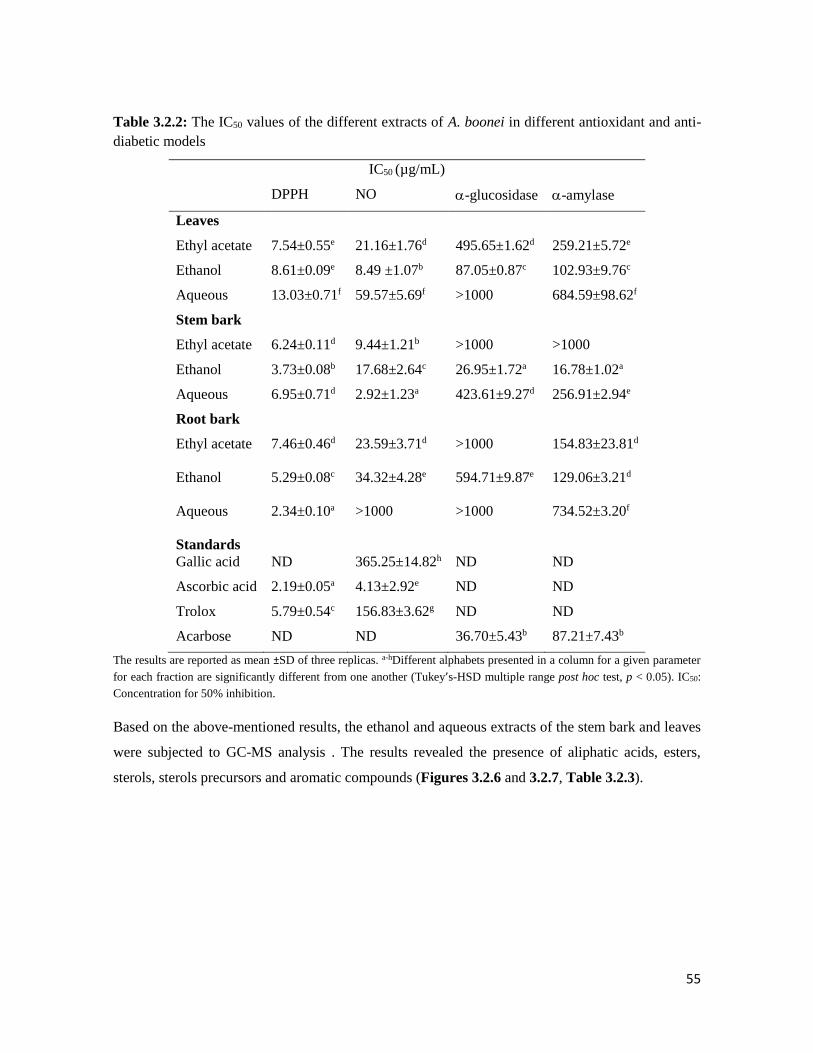
55
Table 3.2.2: The IC50 values of the different extracts of A. boonei in different antioxidant and anti-
diabetic models
IC50 (µg/mL)
DPPH NO -glucosidase -amylase
Leaves
Ethyl acetate 7.54±0.55e 21.16±1.76d 495.65±1.62d 259.21±5.72e
Ethanol 8.61±0.09e 8.49 ±1.07b 87.05±0.87c 102.93±9.76c
Aqueous 13.03±0.71f 59.57±5.69f >1000 684.59±98.62f
Stem bark
Ethyl acetate 6.24±0.11d 9.44±1.21b >1000 >1000
Ethanol 3.73±0.08b 17.68±2.64c 26.95±1.72a 16.78±1.02a
Aqueous 6.95±0.71d 2.92±1.23a 423.61±9.27d 256.91±2.94e
Root bark
Ethyl acetate 7.46±0.46d 23.59±3.71d >1000 154.83±23.81d
Ethanol 5.29±0.08c 34.32±4.28e 594.71±9.87e 129.06±3.21d
Aqueous 2.34±0.10a >1000 >1000 734.52±3.20f
Standards
Gallic acid ND 365.25±14.82h ND ND
Ascorbic acid 2.19±0.05a 4.13±2.92e ND ND
Trolox 5.79±0.54c 156.83±3.62g ND ND
Acarbose ND ND 36.70±5.43b 87.21±7.43b
The results are reported as mean ±SD of three replicas. a-hDifferent alphabets presented in a column for a given parameter
for each fraction are significantly different from one another (Tukey’s-HSD multiple range post hoc test, p < 0.05). IC50:
Concentration for 50% inhibition.
Based on the above-mentioned results, the ethanol and aqueous extracts of the stem bark and leaves
were subjected to GC-MS analysis . The results revealed the presence of aliphatic acids, esters,
sterols, sterols precursors and aromatic compounds (Figures 3.2.6 and 3.2.7, Table 3.2.3).

56
Table 3.2.3: Compounds identified from the different extracts of Alstonia boonei by GC-MS Compounds Molecular formula RT (min) Molecular mass Relative abundance (%)
Ethanol extract of the leaves
Megastigmatrienone C13H18O 13.65 190 0.41
Tetradecanoic acid C14H28O2 15.58 228 0.41
Phytol acetate C22H42O2 16.43 338 2.96
Phytol C20H40O 19.11 296 2.00
Octadecanoic acid C18H36O2 19.56 284 2.56
4-Phenylbenzophenone C19H14O 20.07 258 1.09
Stigmasterol-3,4-dedihydro-3-acetate C31H48O2 20.63 452 0.40
9-(4-Methoxyphenyl) xanthene C20H16O2 22.40 288 2.89
Acridin-9-yl-(4-methoxy-phenyl)-amine C20H16N2O 24.33 300 0.38
Squalene C30H50 24.75 410 0.47
Oleana-11,13(18)-diene C30H48 27.22 408 1.48
Vitamin E C29H50O2 27.38 430 1.16
Stigmasterol C29H48O 28.97 412 2.32
Sitosterol C29H50O 29.77 414 1.81
Aqueous extract of the leaves
Xanthone C13H8O2 16.87 196 1.23
Hexadecanoic acid methyl ester C17H34O2 17.25 270 3.27
Octadecanoic acid methyl ester C19H38O2 19.18 298 2.08
Octadecanoic acid C18H36O2 19.54 284 7.37
Stigmasta-3,5-diene C29H48 26.83 396 4.78
Ethanol extract of the stem bark
Phytol acetate C22H42O2 16.41 338 0.43
Xanthone C13H8O2 16.98 196 0.33
Hexadecanoic acid methyl ester C17H34O2 17.30 270 0.41
n-Hexadecanoic acid C16H32O2 17.65 256 4.85
Hexadecanoic acid ethyl ester C18H36O2 17.98 284 2.85
4-Phenylbenzophenone C19H14O 20.06 258 0.51
9-(4-Methoxyphenyl) xanthene C20H16O2 22.40 288 3.56
Stigmast-4-en-3-one C29H48O 23.25 412 0.85
Squalene C30H50 24.75 410 0.48
Ergost-5-en-3β-ol C28H48O 28.65 400 2.30
Stigmasterol C29H48O 28.96 412 3.43
Sitosterol C29H50O 29.77 414 2.67
The compounds presented in the table are those which matched similar compounds in the NIST library software.

57
Figure 3.2.6: Aliphatic acids and esters isolated from Alstonia boonei
Figure 3.2.7: Sterols, sterol precursors and aromatics from Alstonia boonei
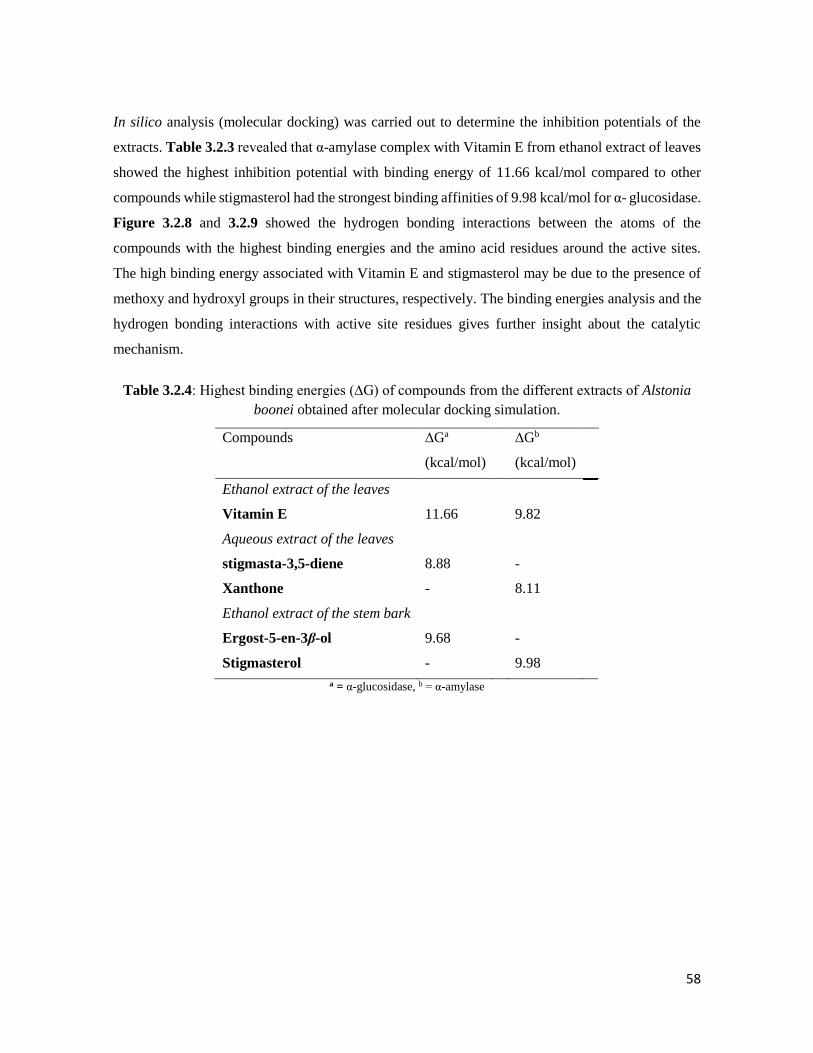
58
In silico analysis (molecular docking) was carried out to determine the inhibition potentials of the
extracts. Table 3.2.3 revealed that α-amylase complex with Vitamin E from ethanol extract of leaves
showed the highest inhibition potential with binding energy of 11.66 kcal/mol compared to other
compounds while stigmasterol had the strongest binding affinities of 9.98 kcal/mol for α- glucosidase.
Figure 3.2.8 and 3.2.9 showed the hydrogen bonding interactions between the atoms of the
compounds with the highest binding energies and the amino acid residues around the active sites.
The high binding energy associated with Vitamin E and stigmasterol may be due to the presence of
methoxy and hydroxyl groups in their structures, respectively. The binding energies analysis and the
hydrogen bonding interactions with active site residues gives further insight about the catalytic
mechanism.
Table 3.2.4: Highest binding energies (∆G) of compounds from the different extracts of Alstonia
boonei obtained after molecular docking simulation.
Compounds ∆Ga
(kcal/mol)
∆Gb
(kcal/mol)
Ethanol extract of the leaves
Vitamin E 11.66 9.82
Aqueous extract of the leaves
stigmasta-3,5-diene 8.88 -
Xanthone - 8.11
Ethanol extract of the stem bark
Ergost-5-en-3β-ol 9.68 -
Stigmasterol - 9.98
a = α-glucosidase, b = α-amylase
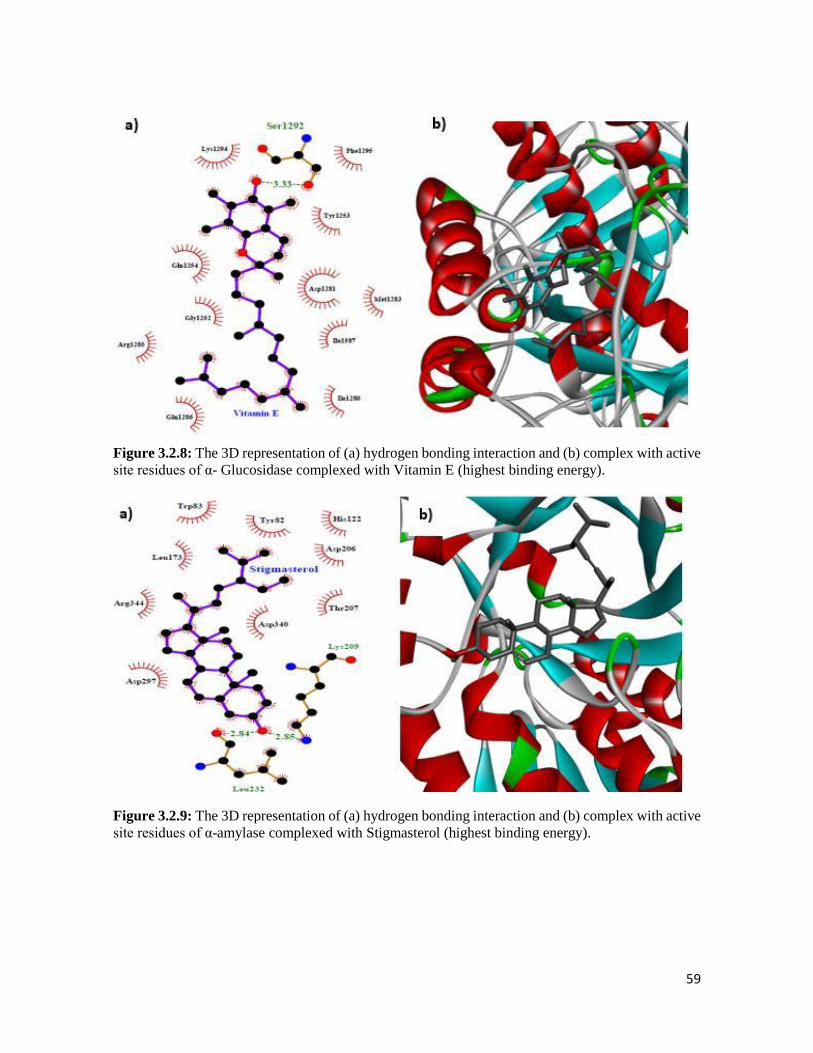
59
Figure 3.2.8: The 3D representation of (a) hydrogen bonding interaction and (b) complex with active
site residues of α- Glucosidase complexed with Vitamin E (highest binding energy).
Figure 3.2.9: The 3D representation of (a) hydrogen bonding interaction and (b) complex with active
site residues of α-amylase complexed with Stigmasterol (highest binding energy).
60
3.2.5 Discussion
Oxidative stress still remains a deleterious process for the generation of maladies such as T2D
(Francisqueti et al., 2017). The antioxidant properties of medicinal plants can be measured through
their reducing capacity, free radical scavenging ability, hydrogen ion donating and singlet oxygen
quenching powers (Kasote et al., 2015, Seifu et al., 2012). The presence of total phenols in all
investigated plant parts of A. boonei as shown in Figure 3.2.1 were mainly concentrated in the leaves
which showed the antioxidant potential of A. boonei. The method used to determine the total phenol
content is based on reducing capacity of A. boonei relative to gallic acid as compared to just reporting
the amount of phenols present (Singleton et al., 1999). Compounds of phenolic derivatives are key
antioxidants which exhibit free radical scavenging abilities and are interestingly widely distributed in
plants (Maqsood et al., 2014). Some studies have reported that plants with an abundance of
polyphenols can act as good antioxidants (Hossain and Shah; 2015; Noreen et al., 2017). The
effectiveness of plant phenolics as antioxidants is also backed up by the ability of the different extracts
to reduce Fe3+ to Fe2+ (Figure 3.2.2) and to inhibit the free radical DPPH (Figure 3.2.3). From our
results, the ethanol extract of the leaves especially showed higher total phenol content and better
reducing capacities which may suggest that the antioxidant capacity of A. boonei is mainly due to its
more polar constituents as reported previously for the root bark of A. boonei (Obiagwu et al., 2014).
Nitric oxide (NO) (low levels) under normal physiological conditions, acts as a regulator in
physiological functions such as immune response, blood pressure and neural communication
(Moncada et al., 1991). However, an overabundance of NO can lead to tissue damage and it is also
associated with the cardiovascular complications of T2D (atherosclerosis and hypertension) (Adela
et al., 2015; Pacher et al., 2007). Therefore, there has been focus on discovering antioxidants which
may act as potential inhibitors of NO production (Chen et al., 2017). Our results showed that only
ethanol and aqueous extracts of the stem bark were able to inhibit NO in a dose- dependent manner
(Figure 3.2.3) which could be linked to the ability of A. boonei to inhibit inducible nitic oxide
synthase (iNOS) as reported in a previous anti-diabetic study (Kehinde et al., 2016).
Inhibition of -glucosidase and -amylase still remains a potent strategy in the development of
antidiabetic drugs (Khan et al., 2016). These two enzymes present in the digestive tract or pancreas
are responsible for the hydrolysis of disaccharides and starch to glucose and breakdown of long chain
carbohydrates to smaller carbohydrate moieties (Kawamura-Konishi et al., 2012). Natural products
which arephenolic in nature have been reported to inhibit the activity of these enzymes (Ramkumar
61
et al., 2010). In this study, the different extracts from the parts of A. boonei showed potent -
glucosidase (Figure 3.2.4) and -amylase (Figure 3.2.5) inhibitory activities. The in-silico results
obtained from this study also suggest the ability of some compounds identified in A. boonei to bind
effectively to the active and allosteric sites of the target enzymes, -glucosidase and -amylase
(Figure 3.2.8 and 3.2.9). These findings further suggest that the plant extracts might reduce the
hydrolysis of disaccharides and polysaccharides as well as aid small intestinal absorption of glucose
and thereby reduce blood glucose levels.
GC-MS analysis of the leaves, stem bark and root bark revealed the presence of various bioactive
compounds (Figures 3.2.6 and 3.2.7). Studies have investigated the characteristics of phenols in
relation to their roles as antioxidants and it has been shown that this role can be due to their high
capacity of hydrogen atom or single electron transfer potential to a free radical (Craft et al., 2012;
Espinosa et al., 2015). Compounds which act best as phenolics have an electron donor group attached
to an aromatic ring (antioxidant activity increases with a high number of rings) (Cheng et al., 2003).
A total of 14 compounds (most of the phenols) were identified from the ethanol extract of the leaves
alone (Table 3.2.2). Phenolics have also been proposed to be responsible for -glucosidase and -
amylase inhibitory activities (Ali Asgar, 2013) and this occurs through hydrogen bond formation in
the active site of the enzyme between the -COO groups of Asp 197 and Glu233 with the hydroxyl
groups in the phenols.
Phytol and phytol acetate were also identified by GC-MS in the ethanol extract of the leaves and stem
bark respectively. Some studies have proven the antioxidant and anti-diabetic effects of phytol and
its derivatives (Ali Asgar, 2013; Santos et al., 2013). Our study showed a relative abundance (%) of
phytol and phytol acetate in the ethanol extract of the leaves to be 2.00 and 2.96, respectively (Table
3.2.2). Phytosterols are bioactive natural products present in plants with similar structure to
cholesterol but have no effect on human cholesterol (Wang et al., 2017). Our study revealed the
presence of stigmasterol, a member of the phytosterol family in the ethanol extract of the leaves and
stem bark. Interestingly, phytosterols have gained recent attention in their role as antioxidants by
preventing angiogenesis through inhibition of reactive oxygen species production and oxidative
stress. The antioxidant activities of the plant earlier explained could be due to the synergistic effects
of the identified phytosterols. Antidiabetic effects of phytosterols have also been demonstrated in a
recent study (Kushwaha et al., 2015), which further gives credence to the efficacy of A. boonei as an
antidiabetic agent. However, the observed antioxidant and antidiabetic effects of the different parts,
especially the ethanol extract of the leaves and stem bark could be due to the synergistic effects of

62
the identified bioactive compounds. This assumption was further explored by using in silico
molecular docking simulation to investigate the binding affinity of some of the compounds to the
active site of the -glucosidase and -amylase enzymes. The highest binding energy of the
compounds was exhibited by a phytol precursor (vitamin E) and stigmasterol from the ethanol extract
of the leaves and stem bark, respectively (Table 3.2.3).
In conclusion, this study suggests that the ethanol extract of the leaves and stem bark of A. boonei
contains potent antioxidant agents coupled with -glucosidase and -amylase inhibitors which could
be further exploited for the development of a therapeutic strategy for the management and control of
post meal blood glucose levels, T2D and its macrovascular complications. Future work will entail
solvent based fractionation of the crude extracts and a detailed study of the active fraction in a T2D
model of rats.
Postscript: From the above studies, the ethanol extract of the leaves showed the best antioxidant and
antidiabetic activity and will therefore be selected for solvent based fractionation.
63
3.3 Fractions of Alstonia boonei leaves ameliorate oxidative stress and modulate key
hypoglycemic processes
1Olajumoke A. Oyebode, 1Ochuko L. Erukainure, 1Olakunle Sanni, 2Neil A. Koorbanally, 1md.
Shahidul Islam*
1 Department of Biochemistry, 2 School of Chemistry and Physics University of KwaZulu-Natal,
(Westville Campus), Durban 4000, South Africa.
*Corresponding author: [email protected]; Tel: +27 (0)31-260-8717; Fax: +27 (0)31-260-7942
Preface: This chapter reports the detailed in vitro and ex vivo anti-diabetic effects of the fractions
obtained from the ethanol extract of the leaves. It is currently under review in Indian Journal of
Experimental Biology.
3.3.1 Abstract
The in vitro and ex vivo antioxidant, inhibitory effect on α-glucosidase and α-amylase activities as
well as glucose absorption in rat jejunum, with concomitant enhanced glucose uptake in rat psoas
muscle by different solvent fractions derived from the crude ethanol extract of the leaves of Alstonia
boonei were investigated. There was marked increase in catalase, SOD activities and GSH levels, as
well as reduced MDA levels which signified an improved pancreatic endogenous antioxidant activity.
The butanol and aqueous fractions showed a high (p < 0.05) inhibitory activity on α-glucosidase (IC50
= 26.98 and 6.49 µg/mL respectively) even higher than that of the standard drug, acarbose. The
aqueous fraction caused a significant (p < 0.05) reduction in glucose absorption in isolated rat jejunum
and enhanced glucose uptake in isolated rat psoas muscle. GC-MS analysis on the fractions revealed
the presence of alkyl esters and alcohols which may be responsible for the antidiabetic potentials of
the plant. Data from this study suggest that the butanol and aqueous fractions could possess potent
antioxidant agents and inhibitors of conditions linked to sustained hyperglycaemia. This can further
be exploited for developing alternate treatments for type 2 diabetes and its accompanying
complications.
Keywords: Alstonia boonei, oxidative stress, type 2 diabetes, glucose absorption, glucose uptake.
3.3.2 Introduction
Globally, diabetes is on the rise with over 451 million people currently living with the disease (IDF,
2017). This number is a lot more than that of the year 1980 (IDF, 2015) and is projected to increase
64
to 693 million by the year 2045 (IDF, 2017). Shockingly, about 49.7% of people living with diabetes
remain undiagnosed and Africa seems to hold the largest population of undiagnosed cases (Cho et
al., 2018).
The three common types of diabetes are type 1 diabetes (T1D), type 2 diabetes (T2D) and gestational
diabetes (Baynest, 2015). T2D holds the largest percentage (90%) of all the diabetic cases seen in the
world today (Baynest, 2015).
The prevalence of T2D is rapidly increasing due to changes in diet and sedentary lifestyle noticeable
amongst the population today. Sadly this also arises due to an increase in the number of obese
individuals (Kahn et al., 2014). This disease presents with persistent hyperglycaemia which occurs
when there is a malfunction in the action of the hormone insulin responsible for transport of glucose
to peripheral tissue and this phenomenon is call insulin resistance ((Halban et al., 2014). This
hormone is produced in the pancreatic β-cells of the islet of Langerhans (Fu et al., 2013) and insulin
resistance encourages continuous build-up of glucose in the blood stream which leads to major
complications of T2D (Soumya and Srilatha, 2011). These complications include nephropathy,
cardiomyopathy, neuropathy, retinopathy, skin and limbs problems (Soumya and Srilatha, 2011).
Complications arising from the deleterious effects of hyperglycaemia could also be pronounced by
the actions of reactive oxygen species (ROS) (Kaneto et al., 2010; Volpe et al., 2018). The destructive
effects of ROS are usually controlled by the action of the natural endogenous antioxidants present in
the body (Sarangarajan et al., 2017). However, in conditions such as oxidative stress, the effect of the
ROS overwhelms the action of the antioxidant defence systems. Oxidative stress has been implicated
to play a part in the progression of the above-mentioned complications of T2D (Asmat et al., 2016).
Different treatment modalities are currently in place for the management of T2D and their
mechanisms of action ranges from inhibition of hepatic glucose output, improvement and secretion
of insulin (Meneses et al., 2015). Unfortunately, the affordability, availability and undesirable side
effects of these drugs warrant the development of an alternative therapy (Pandey et al., 2011). Since
plants are natural carriers of antioxidants, so it is wise for them to be exploited. They are widely
available and can be used to boost socio-economic status of humans. Fortunately, Africa has a diverse
flora of plants which offers opportunities in the discovery of medicinal plant rich in nutrients and
bioactive compounds that can prevent and treat diseases such as T2D.
Alstonia boonei is a large deciduous tree towering up to 45 m in height, which belongs to the dogbane
family (Apocynaceae) and is native to tropical West Africa (Okoye et al., 2014). The shape of the

65
leaves is oblanceolate, with the prominent lateral veins almost at right angles to the midrib.
Traditionally, the plant parts of A. boonei are used for its aphrodisiac, antimalarial, antipyretic and
antimicrobial activities (Adotey et al., 2012). The antioxidant properties of the fractions from the
roots of this plant has been demonstrated (Obiagwu et al., 2014). Few research groups have
investigated the antidiabetic effects of the plant parts of A. boonei (Akinloye et al., 2013; Enechi et
al., 2014; Kehinde et al., 2016; Nkono et al., 2014; Zajac et al., 2010), most of these researchers have
worked on the stem bark extract, but the other parts of the plant have been neglected. The possible
mechanisms behind the antidiabetic effects have also not been investigated. Based on the diverse
medicinal values of A. boonei, this study was carried out not only to understand the antidiabetic effects
of all parts of the plants but also to understand the mechanisms behind its antidiabetic effects.
3.3.3 Materials and methods
Please refer to Chapter 2 for the detailed materials and methods used for A. boonei.
3.3.4 Results
Table 3.3.1 shows the total phenolic contents of the different fractions obtained from the ethanol
extract of A. boonei leaves by solvent-based fractionation. The aqueous and butanol fractions showed
the highest total phenol content compared to the remaining fractions.
All fractions obtained from the ethanol extract of the leaves were found to inhibit the DPPH radical
in a dose-dependent manner (Figure 3.3.1) but lowest IC50 value was exhibited by the aqueous
fraction (Table 3.3.1), which was even lower than the IC50 of ascorbic acid (standard).

66
Figure 3.3.1: DPPH radical scavenging activities of different solvent fractions of ethanol extract of
A. boonei leaves. The results are reported as mean ± SD of three replicas. a-dDifferent alphabets over the bars for a given
concentration indicate significant difference (Tukey’s-HSD multiple range post hoc test, p < 0.05). DCM: Dichloromethane,
EtAc: Ethyl acetate, AA: Ascorbic acid.
All fractions demonstrated impressive ferric reducing potential. However, the total reducing power
of the aqueous fraction was significantly (p < 0.05) higher than that of the other fractions and even
than that of the standard antioxidant (Trolox) used (Figure 3.3.2).
Figure 3.3.2: Total reducing power (relative to gallic acid) of different solvent fractions of ethanol
extract of A. boonei leaves. The results are reported as mean ± SD of three replicas. a-dDifferent alphabets presented
over the bars for a given concentration indicate significance of difference (Tukey’s-HSD multiple range post hoc test, p <
0.05). DCM: Dichloromethane, EtAc: Ethyl acetate.
Upon induction of oxidative stress with Fe2+ in the liver homogenate, there was a reduction in the
levels of the catalase, SOD activity and GSH level when the MDA level was increased in the untreated
a a b a aa
ba
bb
bc c
c c
cc
dd dd d e d dd d e d d
0
20
40
60
80
100
50 100 150 200 250
% In
hib
itio
n o
f D
PP
H
Concentration (µg/mL)
DCM
EtAcButanol
Aqueous
TroloxAA
a aa a a
b a
bb
c
c
bb
bc
c
b
d
c
d
d c c b b
0
20
40
60
80
100
120
50 100 150 200 250
Tota
l red
uci
ng
po
wer
(G
AE)
Concentration (µg/mL)
DCMEtAcButanolAqueousTrolox

67
groups (Figure 3.3.3 a & b) however; treatment with different concentrations of the fractions
significantly (p < 0.05) increased the endogenous antioxidant enzyme activity and GSH level and
deceased MDA levels almost back to normal levels. The butanol and DCM fractions showed highest
ability to induce catalase activities (Figure 3.3.3 a) in the treated cells. The aqueous fraction showed
the highest SOD-activity inducing ability compared to other fractions (Figure 3.3.3 b). The butanol
and aqueous fractions showed highest GSH level (Figure 3.3.3 c) inducing activities with
concomitant reduction in MDA levels (Figure 3.3.3 d) .
Figure 3.3.3: Effect of fractions of A. boonei leaves on a) catalase activity, b) SOD activity, c) GSH
level and d) lipid peroxidation in oxidative hepatic injury. Data are presented as mean ± SD of three replicas. *Significantly different from untreated sample and #Significantly different from normal sample (p < 0.05, Tukey’s-HSD-
multiple range post-hoc test, IBM SPSS for Windows). Normal = normal tissues, Untreated = oxidative stress injured tissues
but not treated. DCM: Dichloromethane, AA: Ascorbic acid, U/L: Unit/Litre.
# ##
* *
*
## #
# ##
#
#
#
#
*
#
##
# ##
* * * *
0
100
200
300
400
U/µ
g p
rote
in
a. DCM Ethyl acetate Butanol Aqueous AA
# # # # #
*
#
#
# ##
#
# ## # *
# # ##
*
## #
#
*
0
100
200
300
400
U/m
g p
rote
in
b.DCM Ethyl acetate Butanol Aqueous AA
## #
#*
*
## #
## #
#
*
*
*
*
# #
#
*
#
* * * * *
0
100
200
300
400
500
600
700
U/L
c.DCM Ethyl acetate Butanol Aqueous AA
** * * *
*
##
* * * *
*
* * * **
* * * *
** * * *
0
100
200
300
400
500
600
MD
A le
vels
d.DCM Ethyl acetate Butanol Aqueous AA
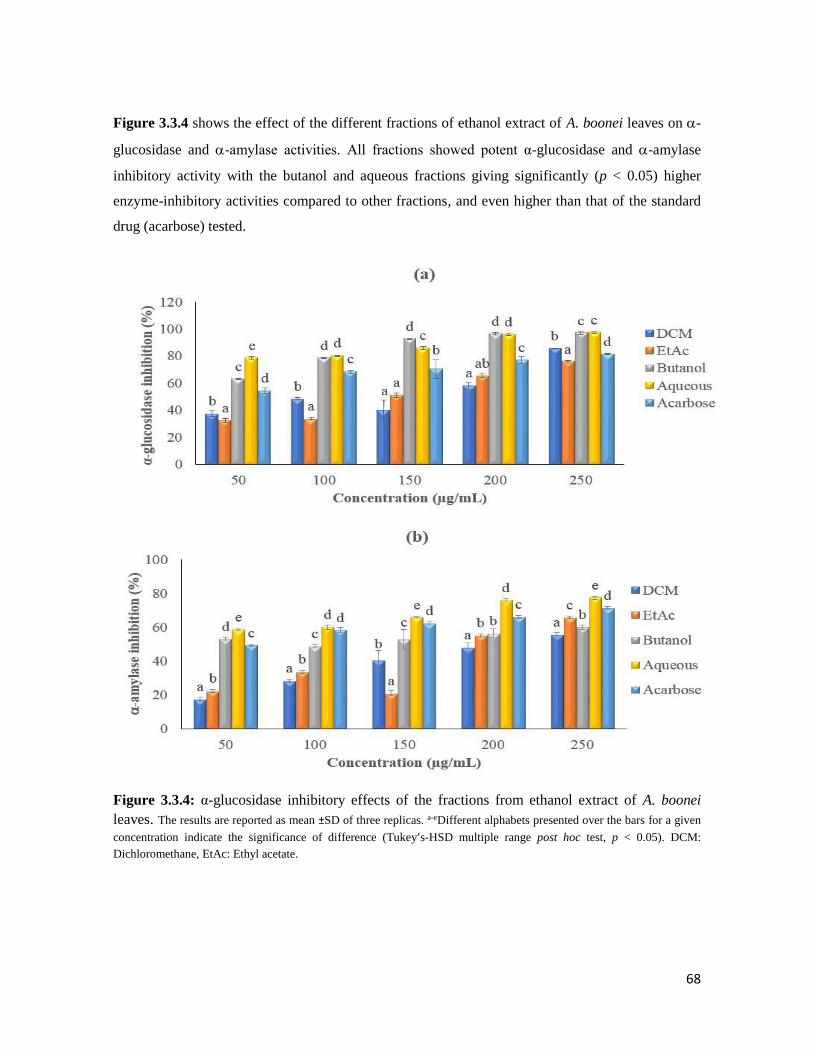
68
Figure 3.3.4 shows the effect of the different fractions of ethanol extract of A. boonei leaves on -
glucosidase and -amylase activities. All fractions showed potent α-glucosidase and -amylase
inhibitory activity with the butanol and aqueous fractions giving significantly (p < 0.05) higher
enzyme-inhibitory activities compared to other fractions, and even higher than that of the standard
drug (acarbose) tested.
Figure 3.3.4: α-glucosidase inhibitory effects of the fractions from ethanol extract of A. boonei
leaves. The results are reported as mean ±SD of three replicas. a-eDifferent alphabets presented over the bars for a given
concentration indicate the significance of difference (Tukey’s-HSD multiple range post hoc test, p < 0.05). DCM:
Dichloromethane, EtAc: Ethyl acetate.
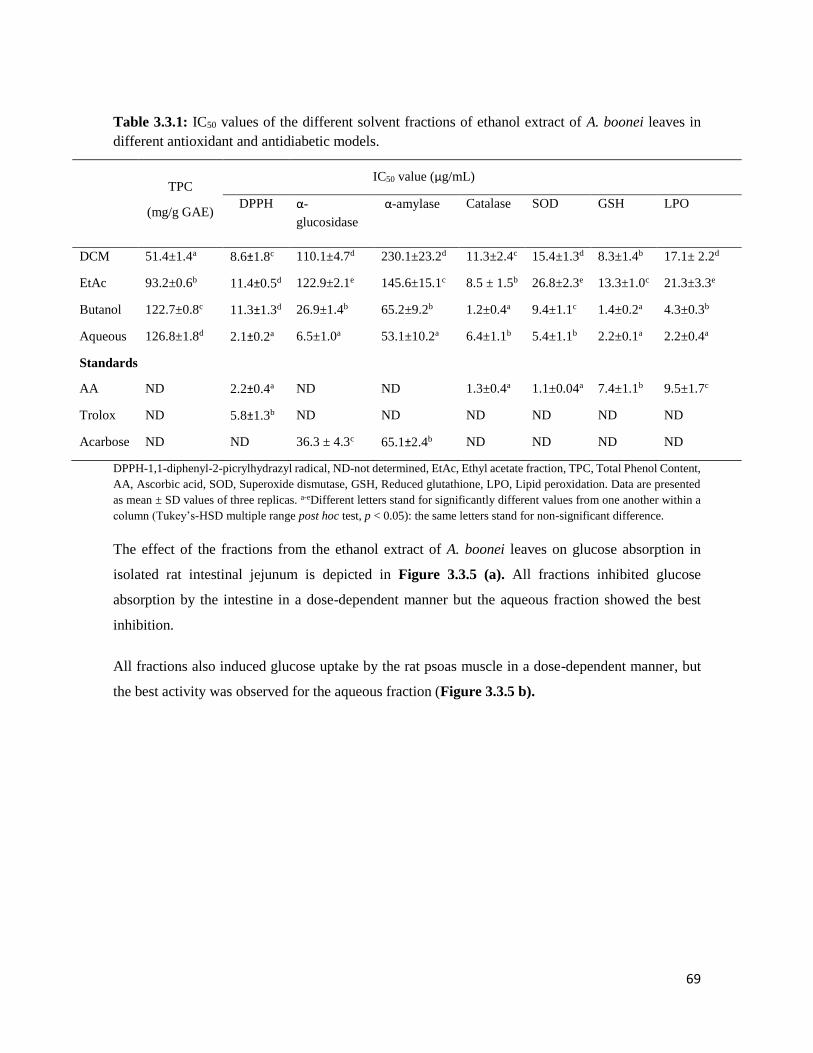
69
Table 3.3.1: IC50 values of the different solvent fractions of ethanol extract of A. boonei leaves in
different antioxidant and antidiabetic models.
TPC
(mg/g GAE)
IC50 value (µg/mL)
DPPH
α-
glucosidase
α-amylase
Catalase SOD GSH LPO
DCM 51.4±1.4a 8.6±1.8c 110.1±4.7d 230.1±23.2d 11.3±2.4c 15.4±1.3d 8.3±1.4b 17.1± 2.2d
EtAc 93.2±0.6b 11.4±0.5d 122.9±2.1e 145.6±15.1c 8.5 ± 1.5b 26.8±2.3e 13.3±1.0c 21.3±3.3e
Butanol 122.7±0.8c 11.3±1.3d 26.9±1.4b 65.2±9.2b 1.2±0.4a 9.4±1.1c 1.4±0.2a 4.3±0.3b
Aqueous 126.8±1.8d 2.1±0.2a 6.5±1.0a 53.1±10.2a 6.4±1.1b 5.4±1.1b 2.2±0.1a 2.2±0.4a
Standards
AA ND 2.2±0.4a ND ND 1.3±0.4a 1.1±0.04a 7.4±1.1b 9.5±1.7c
Trolox ND 5.8±1.3b ND ND ND ND ND ND
Acarbose ND ND 36.3 ± 4.3c 65.1±2.4b ND ND ND ND
DPPH-1,1-diphenyl-2-picrylhydrazyl radical, ND-not determined, EtAc, Ethyl acetate fraction, TPC, Total Phenol Content,
AA, Ascorbic acid, SOD, Superoxide dismutase, GSH, Reduced glutathione, LPO, Lipid peroxidation. Data are presented
as mean ± SD values of three replicas. a-eDifferent letters stand for significantly different values from one another within a
column (Tukey’s-HSD multiple range post hoc test, p < 0.05): the same letters stand for non-significant difference.
The effect of the fractions from the ethanol extract of A. boonei leaves on glucose absorption in
isolated rat intestinal jejunum is depicted in Figure 3.3.5 (a). All fractions inhibited glucose
absorption by the intestine in a dose-dependent manner but the aqueous fraction showed the best
inhibition.
All fractions also induced glucose uptake by the rat psoas muscle in a dose-dependent manner, but
the best activity was observed for the aqueous fraction (Figure 3.3.5 b).
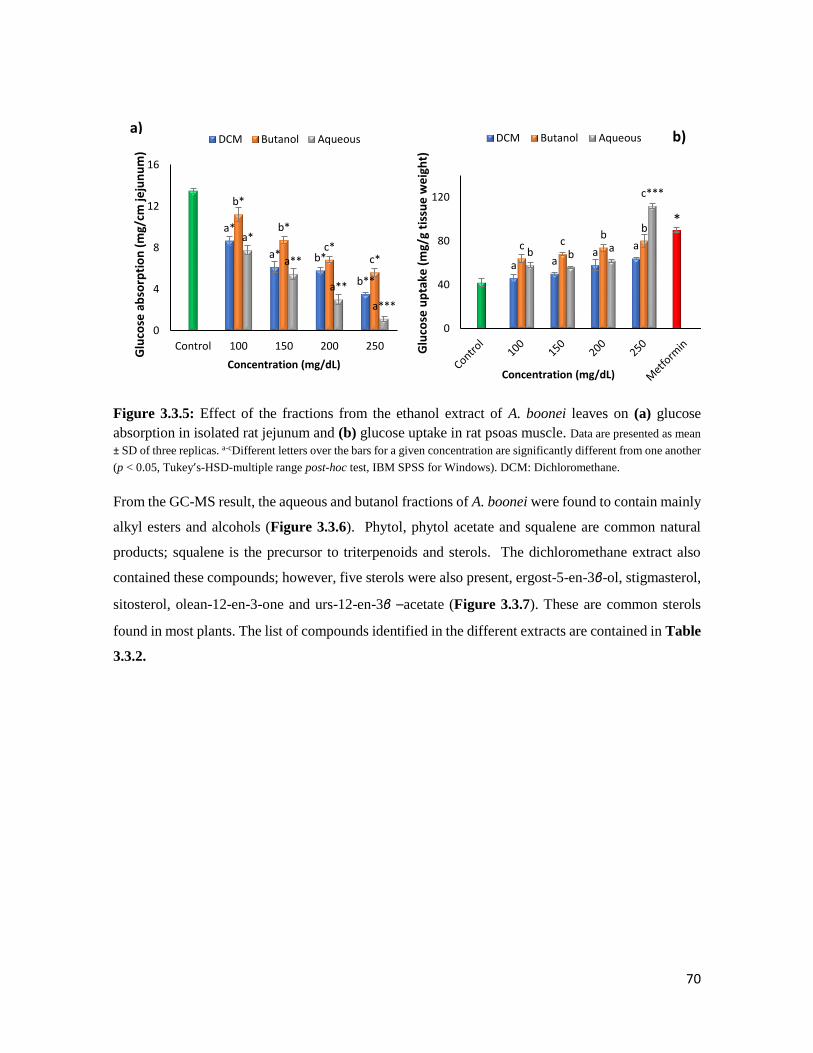
70
Figure 3.3.5: Effect of the fractions from the ethanol extract of A. boonei leaves on (a) glucose
absorption in isolated rat jejunum and (b) glucose uptake in rat psoas muscle. Data are presented as mean
± SD of three replicas. a-cDifferent letters over the bars for a given concentration are significantly different from one another
(p < 0.05, Tukey’s-HSD-multiple range post-hoc test, IBM SPSS for Windows). DCM: Dichloromethane.
From the GC-MS result, the aqueous and butanol fractions of A. boonei were found to contain mainly
alkyl esters and alcohols (Figure 3.3.6). Phytol, phytol acetate and squalene are common natural
products; squalene is the precursor to triterpenoids and sterols. The dichloromethane extract also
contained these compounds; however, five sterols were also present, ergost-5-en-3β-ol, stigmasterol,
sitosterol, olean-12-en-3-one and urs-12-en-3β –acetate (Figure 3.3.7). These are common sterols
found in most plants. The list of compounds identified in the different extracts are contained in Table
3.3.2.
a*
a* b*
b**
b*
b*
c*c*
a*
a**
a**
a***
0
4
8
12
16
Control 100 150 200 250
Glu
cose
ab
sorp
tio
n (
mg/
cm je
jun
um
)
Concentration (mg/dL)
DCM Butanol Aqueousa)
a aa
ac cb
b
b ba
c***
0
40
80
120
Glu
cose
up
take
(m
g/g
tiss
ue
we
igh
t)
Concentration (mg/dL)
DCM Butanol Aqueous
*
b)
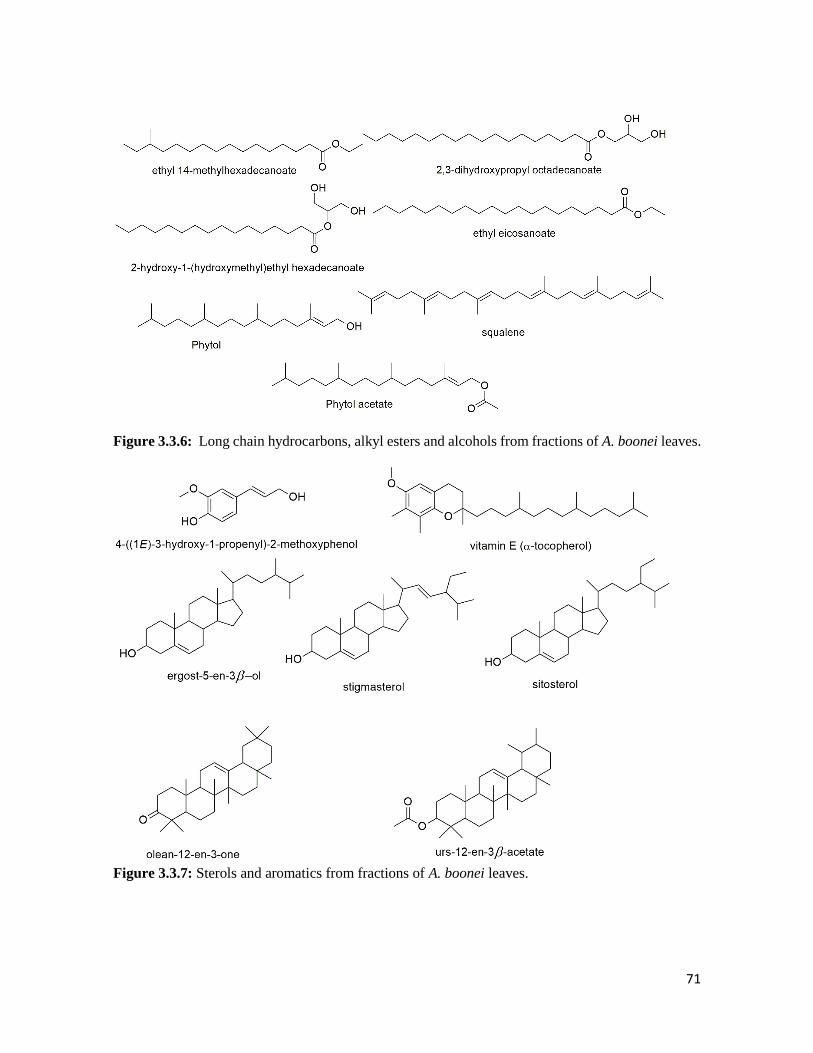
71
Figure 3.3.6: Long chain hydrocarbons, alkyl esters and alcohols from fractions of A. boonei leaves.
Figure 3.3.7: Sterols and aromatics from fractions of A. boonei leaves.

72
Table 3.3.2: Identified compounds in the fractions of A. boonei by GC-MS
Compounds Molecular
formula
RT
(min)
Molecular
mass
Relative
abundance (%)
Aqueous fraction
2-hydroxy-1-(hydroxymethyl ) ethyl
hexadecanoate
C19H38O4 23.58 330.50 41.67
2,3-dihydroxypropyl octadecanoate C21H42O4 25.14 358.56 22.47
Squalene C30H50 25.77 410.72 1.25
Butanol fraction
4-((1E)-3-hydroxy-1-propenyl)-2-
methoxyphenol
C10H12O3 16.55 180.20 0.27
Phytol acetate C22H42O2 17.42 338.57 0.54
2-hydroxy-1-(hydroxymethyl) ethyl
hexadecanoate
C19H38O4 23.60 330.50 31.36
2,3-dihydroxypropyl octadecanoate C21H42O4 25.15 358.56 17.37
Squalene C30H50 25.76 410.72 0.38
Dichloromethane fraction
Phytol acetate C22H42O2 17.42 338.57 2.04
Ethyl eicosanoate C22H44O2 18.98 340.58 0.82
Phytol C20H40O 20.12 296.31 2.19
Ethyl 14-methylhexadecanoate C19H38O2 20.85 298.50 0.51
2-hydroxy-1-(hydroxymethyl) ethyl
hexadecanoate
C19H38O4 23.57 330.50 13.18
2,3-dihydroxypropyl octadecanoate C21H42O4 25.13 358.56 5.78
Vitamin E C29H50O2 28.04 430.70 0.88
Ergost-5-en-3β-ol C28H48O 29.06 400.68 0.70
Stigmasterol C29H48O 28.30 412.69 0.72
Sitosterol C29H50O 29.91 414.71 0.97
Olean-12-en-3-one C30H48O 31.42 424.70 2.96
Urs-12-en-3β-acetate C32H52O2 32.05 468.40 13.76
The compounds presented in the table are those which matched similar compounds in the NIST library
software.

73
3.3.5 Discussion
Antioxidants of natural origin are being used successfully to combat oxidative stress which aids in
curbing the alarming increase of complications associated with diseases such as diabetes, cancer and
others (Vijay and Vimukta, 2014). This study demonstrated that the fractions of the ethanol extract
of A. boonei leaves possess significant antioxidant and anti-diabetic activity. The presence of
polyphenols in the fractions could suggest the antioxidant activity of this plant. The total phenol
content was determined by Folin-Ciocalteu method which gives an estimation of the total phenolic
compounds present in a sample (Kopjar et al., 2009). Polyphenols have been reported to be
responsible for the antioxidant activity of some medicinal plants due to their free radical scavenging
activity (Kopjar et al., 2009). The phenolics present in this plant may delay the onset of lipid oxidation
and decomposition of hydroperoxides in tissues by neutralizing free radicals, quenching singlet
oxygen through redox reactions. This could make the plant useful in ameliorating oxidative stress in
T2D.
DPPH is a free radical that becomes a stable diamagnetic molecule by attracting electrons (hydrogen)
from stable molecules (Kedare and Singh, 2011). The odd nitrogen atom in DPPH (violet colour) is
reduced to yellow colour by receiving a hydrogen atom from antioxidants to generate a stable
hydrazine complex. The observed DPPH radical scavenging activity of fractions of A. boonei may be
linked to the presence of polyphenols in the plant. Table 3.3.1 shows that the aqueous fraction gave
the lowest IC50 value and also the highest total phenol content. It was reported that plants with DPPH
scavenging activity portray antioxidant activity by transferring hydrogen to free radicals, specifically
hydroperoxide radicals which are major initiators of lipid autooxidation (Bamforth et al., 1993;
Sowndhararajan and Kang, 2013). Interestingly, our results also reported the ability of these fractions
to inhibit lipid peroxidation Figure 3.3.3 d.
FRAP assay is widely used in the evaluation of antioxidant potentials of medicinal plants (Gil et al.,
2002). Iron is actively involved in the propagation of free radicals through the Fenton reaction by
gaining or loosing electrons (Sudan et al., 2014). The aqueous fraction in this study showed a
significant (p < 0.05) ferric reducing capacity which serves as an indicator of antioxidant ability
Figure 3.3.2. This activity was also seen to be dose-dependent which indicates that with increasing
doses there was an elevated activity. Although iron is an important trace element needed for sustaining
physiological homeostasis, an overload of this element can lead to toxicity and cell death through
formation of free radicals and lipid peroxidation (Imam et al., 2017) therefore, FeSO4 was used to
induce oxidative stress in this study.
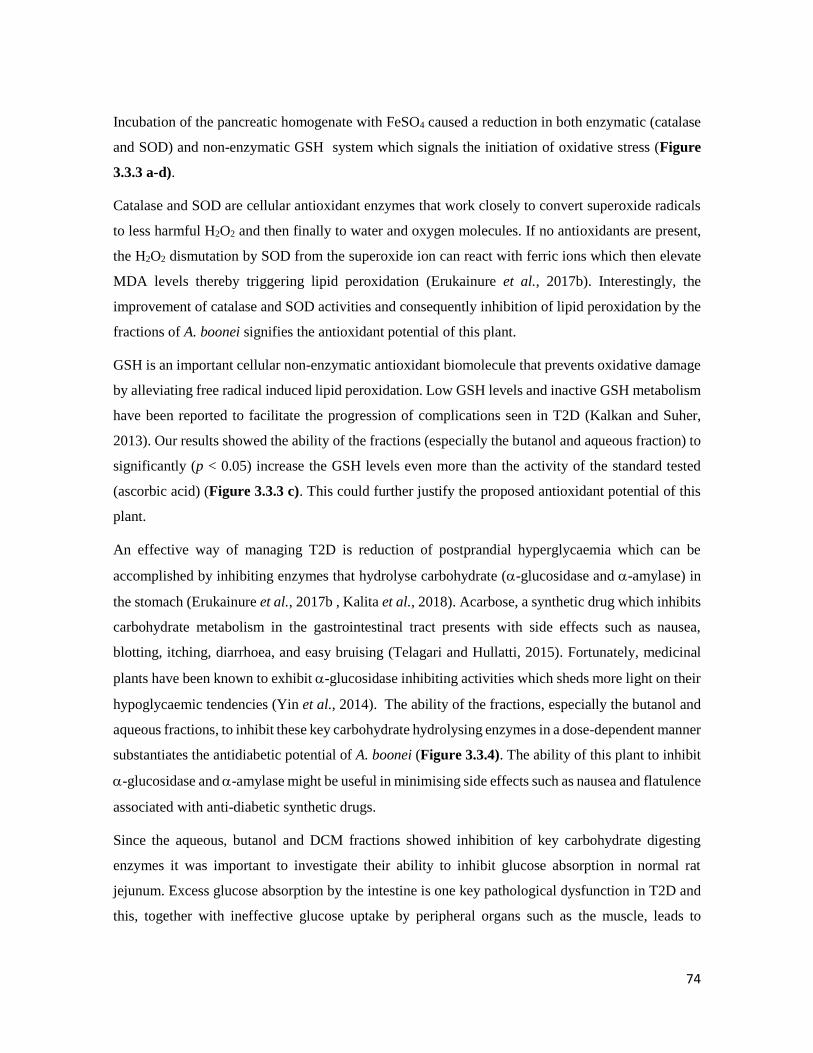
74
Incubation of the pancreatic homogenate with FeSO4 caused a reduction in both enzymatic (catalase
and SOD) and non-enzymatic GSH system which signals the initiation of oxidative stress (Figure
3.3.3 a-d).
Catalase and SOD are cellular antioxidant enzymes that work closely to convert superoxide radicals
to less harmful H2O2 and then finally to water and oxygen molecules. If no antioxidants are present,
the H2O2 dismutation by SOD from the superoxide ion can react with ferric ions which then elevate
MDA levels thereby triggering lipid peroxidation (Erukainure et al., 2017b). Interestingly, the
improvement of catalase and SOD activities and consequently inhibition of lipid peroxidation by the
fractions of A. boonei signifies the antioxidant potential of this plant.
GSH is an important cellular non-enzymatic antioxidant biomolecule that prevents oxidative damage
by alleviating free radical induced lipid peroxidation. Low GSH levels and inactive GSH metabolism
have been reported to facilitate the progression of complications seen in T2D (Kalkan and Suher,
2013). Our results showed the ability of the fractions (especially the butanol and aqueous fraction) to
significantly (p < 0.05) increase the GSH levels even more than the activity of the standard tested
(ascorbic acid) (Figure 3.3.3 c). This could further justify the proposed antioxidant potential of this
plant.
An effective way of managing T2D is reduction of postprandial hyperglycaemia which can be
accomplished by inhibiting enzymes that hydrolyse carbohydrate (-glucosidase and -amylase) in
the stomach (Erukainure et al., 2017b , Kalita et al., 2018). Acarbose, a synthetic drug which inhibits
carbohydrate metabolism in the gastrointestinal tract presents with side effects such as nausea,
blotting, itching, diarrhoea, and easy bruising (Telagari and Hullatti, 2015). Fortunately, medicinal
plants have been known to exhibit -glucosidase inhibiting activities which sheds more light on their
hypoglycaemic tendencies (Yin et al., 2014). The ability of the fractions, especially the butanol and
aqueous fractions, to inhibit these key carbohydrate hydrolysing enzymes in a dose-dependent manner
substantiates the antidiabetic potential of A. boonei (Figure 3.3.4). The ability of this plant to inhibit
-glucosidase and -amylase might be useful in minimising side effects such as nausea and flatulence
associated with anti-diabetic synthetic drugs.
Since the aqueous, butanol and DCM fractions showed inhibition of key carbohydrate digesting
enzymes it was important to investigate their ability to inhibit glucose absorption in normal rat
jejunum. Excess glucose absorption by the intestine is one key pathological dysfunction in T2D and
this, together with ineffective glucose uptake by peripheral organs such as the muscle, leads to

75
sustained hyperglycaemia (Szablewski, 2011). The rate of absorption of glucose varies from one
intestinal segment to the other with highest absorption seen at the joining of the duodenum to the
jejunum (proximal to mid small intestine) (Oyebode et al., 2018; Rider et al., 1967). This justified
the use of this part of the intestine for our ex vivo study. From our result (Figure 3.3.5 a), without the
fractions there was a high peak value absorption of glucose at 13.5±1.02 mg/cm jejunum which was
seen to reduce with increasing doses of the different fractions. However, this value was significantly
(p < 0.05) reduced to 1.13±0.24 mg/cm jejunum in the presence of the highest dose of the aqueous
fraction, which suggests the inhibitory effect of the fraction on intestinal glucose absorption. In
normal conditions, glucose homeostasis is regulated by insulin through glucose transporters (GLUT4)
in effectively transporting excess glucose to peripheral organs where it is needed (Alvim et al., 2015).
Insulin resistance in the skeletal muscle occurs as a precursor to beta cell failure and persistent
hyperglycaemia (DeFronzo and Tripathy, 2009). In our study, the fractions at increasing doses were
able to stimulate induction of glucose uptake in the rat psoas muscle with the highest induction
exhibited by the aqueous fraction. This results in collaboration with the -glucosidase and -amylase
inhibitory potential further justifies the anti-diabetic activity of A. boonei.
Possible bioactive compounds in the aqueous, butanol and DCM fractions of A. boonei were detected
using GC-MS analysis. The aqueous fraction showed a high relative abundance of 2-hydroxy-1-
(hydroxymethyl) ethyl hexadecanoate (41.67%); this compound has been reported to possess
antioxidant and hypocholesterolemic activities (Jegadeeswari et al., 2012; Tyagia and Argawak,
2017). The high abundance of this compound in the aqueous and butanol fractions (Table 3.3.2) could
be responsible for the observed antioxidant and anti-diabetic activities of the fractions. Furthermore,
the high presence of total phenols in this plant could also account for the presence of the sterols
identified in the fractions. Interestingly, the observed anti-diabetic activity of this plant could be due
to the likely synergistic actions of the compounds detected through GC-MS analysis.
In summary, this study showed that the fractions of A. boonei leaves (especially the aqueous fraction)
contains polyphenolic compounds with free radical scavenging ability and also key anti-diabetic
enzymes (-glucosidase and -amylase) inhibitory potential. Furthermore, the identified bioactive
agents in this study might be responsible for its antioxidant and anti-diabetic ability which can be
further exploited in future studies.
Postscript: The butanol fraction was picked for in vivo experiment since it had high antioxidant and
antidiabetic activity in the tested models.
76
3.4 Effects of the butanol fraction of Alstonia boonei leaves on pancreatic histology,
glucose homeostasis and insulin secretion in diabetic rats
O.A Oyebode, O.L Erukainure, O. Sanni, M.S. Islam*
Department of Biochemistry, School of Life Sciences, University of KwaZulu-Natal, (Westville
Campus), Durban 4000, South Africa
*Corresponding author: [email protected]; Tel: +27 (0)31-260-8717; Fax: +27 (0)31-260-7942
Preface: This article reports the detailed in vivo anti-diabetic studies of the butanol fraction and it is
currently under revision in the Journal of Ethnopharmacology.
3.4.1 Abstract
The potential use of Alstonia boonei for the management of symptoms related to type 2 diabetes
(T2D) has gained more attention in recent times. However, only a few published evidences explained
the roles of A. boonei in protecting pancreatic β-cells. This study was conducted to assess changes in
polyphagia, polydipsia, body weight, glucose level, insulin secretion, β-cell function (HOMA-β),
insulin resistance (HOMA-IR), serum fructosamine, liver glycogen, serum lipids, biomarkers of
hepatic and renal function and histological changes in the pancreas of streptozotocin (STZ)-induced
diabetic rats following treatment with butanol fraction of A. boonei leaves (ABBF). ABBF was given
to six-weeks old STZ-induced diabetic rats for a 5-week intervention period. The glucose tolerance
was assessed by oral glucose (2 g/kg) tolerance test (OGTT) and subsequently, insulin resistance and
pancreatic β-cell function was assessed by calculating homeostatic model assessment (HOMA-IR and
HOMA-β). The histological changes in the pancreas were then observed by hematoxylin-eosin
(H&E) staining. ABBF treatment at 150 mg/kg bw, significantly (p < 0.05) lowered blood glucose
level, improved oral glucose tolerance ability, stimulated insulin secretion and hepatic glycogen
synthesis and promoted islet regeneration. These results suggest that ABBF could be exploited as a
therapeutic agent for treating T2D.
Keywords: Type 2 diabetes, Alstonia boonei, pancreatic β-cells, histopathology, serum insulin
3.4.2 Introduction
The prevalence of diabetes has seen a steep rise, the IDF reported that in 2017 over 451 million (age
18-99 years) people are living with diabetes and this figure is expected to increase to 693 million by
the year 2045 (IDF, 2017). This staggering statistic is being further aggravated as almost half of the
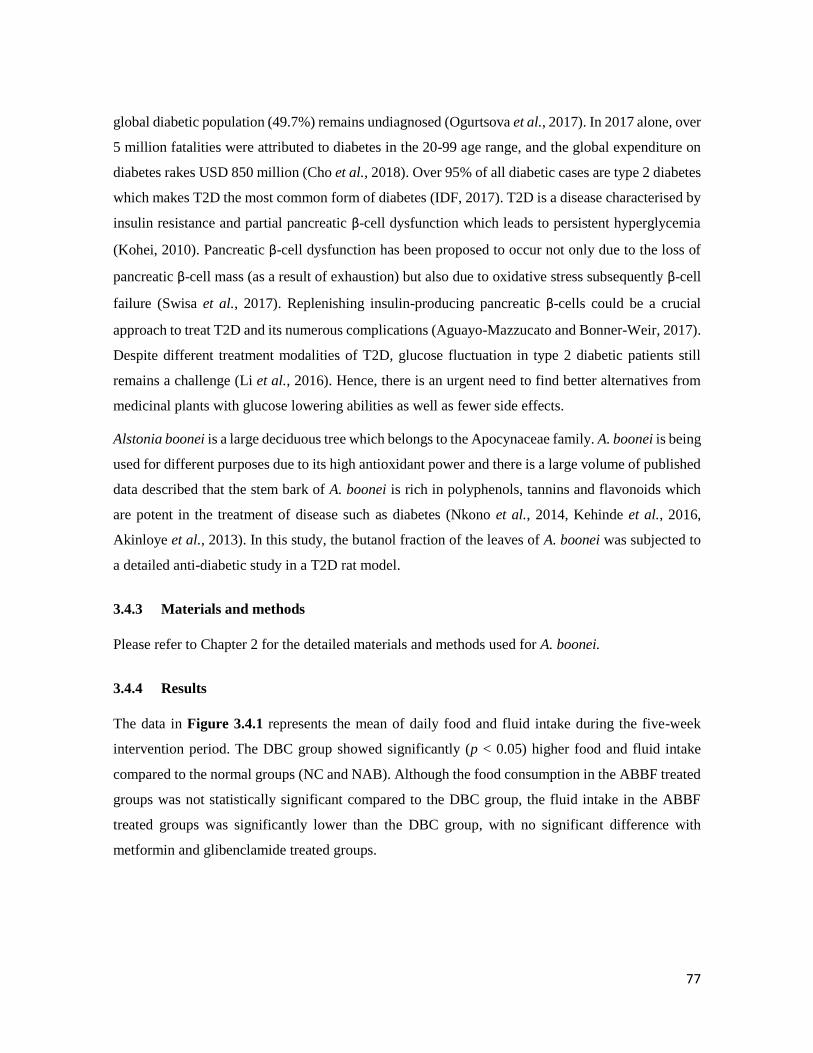
77
global diabetic population (49.7%) remains undiagnosed (Ogurtsova et al., 2017). In 2017 alone, over
5 million fatalities were attributed to diabetes in the 20-99 age range, and the global expenditure on
diabetes rakes USD 850 million (Cho et al., 2018). Over 95% of all diabetic cases are type 2 diabetes
which makes T2D the most common form of diabetes (IDF, 2017). T2D is a disease characterised by
insulin resistance and partial pancreatic β-cell dysfunction which leads to persistent hyperglycemia
(Kohei, 2010). Pancreatic β-cell dysfunction has been proposed to occur not only due to the loss of
pancreatic β-cell mass (as a result of exhaustion) but also due to oxidative stress subsequently β-cell
failure (Swisa et al., 2017). Replenishing insulin-producing pancreatic β-cells could be a crucial
approach to treat T2D and its numerous complications (Aguayo-Mazzucato and Bonner-Weir, 2017).
Despite different treatment modalities of T2D, glucose fluctuation in type 2 diabetic patients still
remains a challenge (Li et al., 2016). Hence, there is an urgent need to find better alternatives from
medicinal plants with glucose lowering abilities as well as fewer side effects.
Alstonia boonei is a large deciduous tree which belongs to the Apocynaceae family. A. boonei is being
used for different purposes due to its high antioxidant power and there is a large volume of published
data described that the stem bark of A. boonei is rich in polyphenols, tannins and flavonoids which
are potent in the treatment of disease such as diabetes (Nkono et al., 2014, Kehinde et al., 2016,
Akinloye et al., 2013). In this study, the butanol fraction of the leaves of A. boonei was subjected to
a detailed anti-diabetic study in a T2D rat model.
3.4.3 Materials and methods
Please refer to Chapter 2 for the detailed materials and methods used for A. boonei.
3.4.4 Results
The data in Figure 3.4.1 represents the mean of daily food and fluid intake during the five-week
intervention period. The DBC group showed significantly (p < 0.05) higher food and fluid intake
compared to the normal groups (NC and NAB). Although the food consumption in the ABBF treated
groups was not statistically significant compared to the DBC group, the fluid intake in the ABBF
treated groups was significantly lower than the DBC group, with no significant difference with
metformin and glibenclamide treated groups.

78
Figure 3.4.1: The effects of oral treatment of butanol fraction of A. boonei leaves on food and fluid
intake in different animal groups during the experimental period. Data are presented as mean ± SD of seven
animals. a-cValues with different letters over the bars for a given parameter are significantly different from one another
(Tukey’s-HSD multiple range post hoc test, p < 0.05). NC, Normal control, DBC, Diabetic control, DABL, Diabetic A.
boonei low dose, DABH, Diabetic A. boonei high dose, DBM, Diabetic metformin, DBG, Diabetic glibenclamide, NAB,
Normal A. boonei high dose (toxicological control).
The data of weekly body weight changes are presented in Figure 3.4.2. In the initial 2 weeks of the
experiment, there was no significant difference in the body weight amongst the different animal
groups. However, the diabetic groups showed lower body weight gain compared to the normal groups
during the rest of the period of the study (Figure 3.4.2).
Figure 3.4.2: The effects of oral treatment of butanol fraction of A. boonei leaves on mean body
weight gain for all groups of experimental animals over the seven weeks experimental period. Data are
presented as the mean ± SD of seven animals. a-cValues with different letters for a given week are significantly different
from one another (Tukey’s-HSD multiple range post hoc test, p < 0.05). NC, Normal control, DBC, Diabetic control, DABL,
Diabetic A. boonei low dose, DABH, Diabetic A. boonei high dose, DBM, Diabetic metformin, DBG, Diabetic
glibenclamide, NAB, Normal A. boonei high dose (toxicological control), STZ, Streptozotocin.
a
ab
c
ab
b
b
b
ab
ab
b
b
aa
0
50
100
150
200
250
300
Feed intake (g/rat/day) Fluid intake (ml/rat/day)Feed
an
d f
luid
inta
ke (
un
its)
NC DBC DABL DABH DBM DBG NAB
b b bc
c c c
a
c
b
a aa a
a
a
b b bb
a
0
100
200
300
400
500
0 1 2 3 4 5 6 7
Mea
n b
od
y w
eigh
t (g
)
NC DBC DABL DABH DBM DBG NAB
T2D induction Intervention weeksT2D confirmation
STZ injection
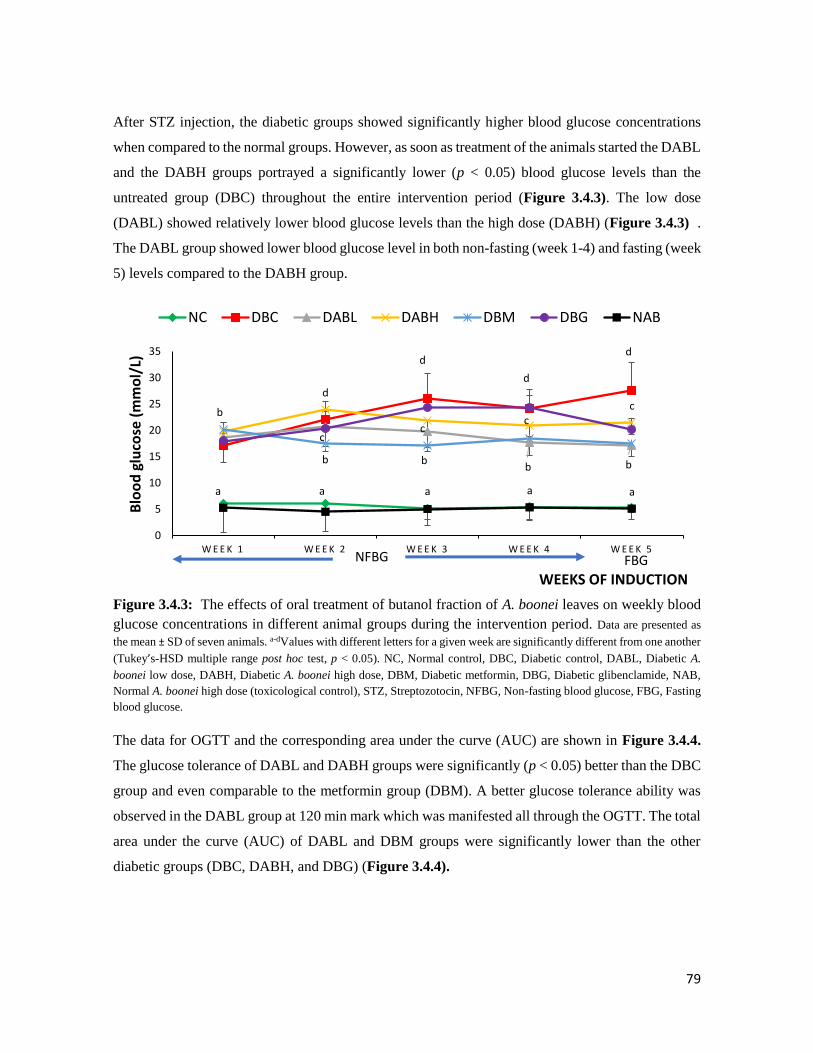
79
After STZ injection, the diabetic groups showed significantly higher blood glucose concentrations
when compared to the normal groups. However, as soon as treatment of the animals started the DABL
and the DABH groups portrayed a significantly lower (p < 0.05) blood glucose levels than the
untreated group (DBC) throughout the entire intervention period (Figure 3.4.3). The low dose
(DABL) showed relatively lower blood glucose levels than the high dose (DABH) (Figure 3.4.3) .
The DABL group showed lower blood glucose level in both non-fasting (week 1-4) and fasting (week
5) levels compared to the DABH group.
Figure 3.4.3: The effects of oral treatment of butanol fraction of A. boonei leaves on weekly blood
glucose concentrations in different animal groups during the intervention period. Data are presented as
the mean ± SD of seven animals. a-dValues with different letters for a given week are significantly different from one another
(Tukey’s-HSD multiple range post hoc test, p < 0.05). NC, Normal control, DBC, Diabetic control, DABL, Diabetic A.
boonei low dose, DABH, Diabetic A. boonei high dose, DBM, Diabetic metformin, DBG, Diabetic glibenclamide, NAB,
Normal A. boonei high dose (toxicological control), STZ, Streptozotocin, NFBG, Non-fasting blood glucose, FBG, Fasting
blood glucose.
The data for OGTT and the corresponding area under the curve (AUC) are shown in Figure 3.4.4.
The glucose tolerance of DABL and DABH groups were significantly (p < 0.05) better than the DBC
group and even comparable to the metformin group (DBM). A better glucose tolerance ability was
observed in the DABL group at 120 min mark which was manifested all through the OGTT. The total
area under the curve (AUC) of DABL and DBM groups were significantly lower than the other
diabetic groups (DBC, DABH, and DBG) (Figure 3.4.4).
a a a
b
d
d
d
d
cc
c
b bb b
c
a a
0
5
10
15
20
25
30
35
W E E K 1 W E E K 2 W E E K 3 W E E K 4 W E E K 5
Blo
od
glu
cose
(m
mo
l/L)
WEEKS OF INDUCTION
NC DBC DABL DABH DBM DBG NAB
NFBG FBG
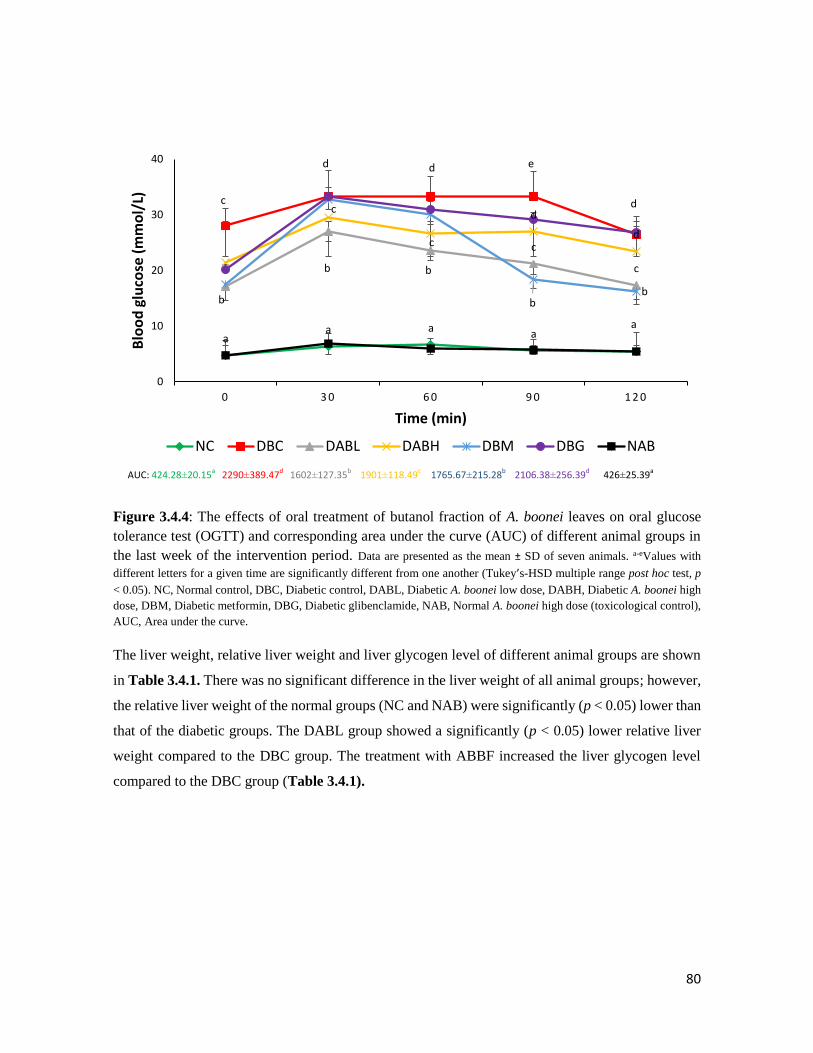
80
Figure 3.4.4: The effects of oral treatment of butanol fraction of A. boonei leaves on oral glucose
tolerance test (OGTT) and corresponding area under the curve (AUC) of different animal groups in
the last week of the intervention period. Data are presented as the mean ± SD of seven animals. a-eValues with
different letters for a given time are significantly different from one another (Tukey’s-HSD multiple range post hoc test, p
< 0.05). NC, Normal control, DBC, Diabetic control, DABL, Diabetic A. boonei low dose, DABH, Diabetic A. boonei high
dose, DBM, Diabetic metformin, DBG, Diabetic glibenclamide, NAB, Normal A. boonei high dose (toxicological control),
AUC, Area under the curve.
The liver weight, relative liver weight and liver glycogen level of different animal groups are shown
in Table 3.4.1. There was no significant difference in the liver weight of all animal groups; however,
the relative liver weight of the normal groups (NC and NAB) were significantly (p < 0.05) lower than
that of the diabetic groups. The DABL group showed a significantly (p < 0.05) lower relative liver
weight compared to the DBC group. The treatment with ABBF increased the liver glycogen level
compared to the DBC group (Table 3.4.1).
aa a a
a
c
d e
dc
b
c
cb
c
d
d
bb
b
d
0
10
20
30
40
0 3 0 6 0 9 0 1 2 0
Blo
od
glu
cose
(m
mo
l/L)
Time (min)
NC DBC DABL DABH DBM DBG NAB
AUC: 424.28±20.15a 2290±389.47d 1602±127.35b 1901±118.49c 1765.67±215.28b 2106.38±256.39d 426±25.39a
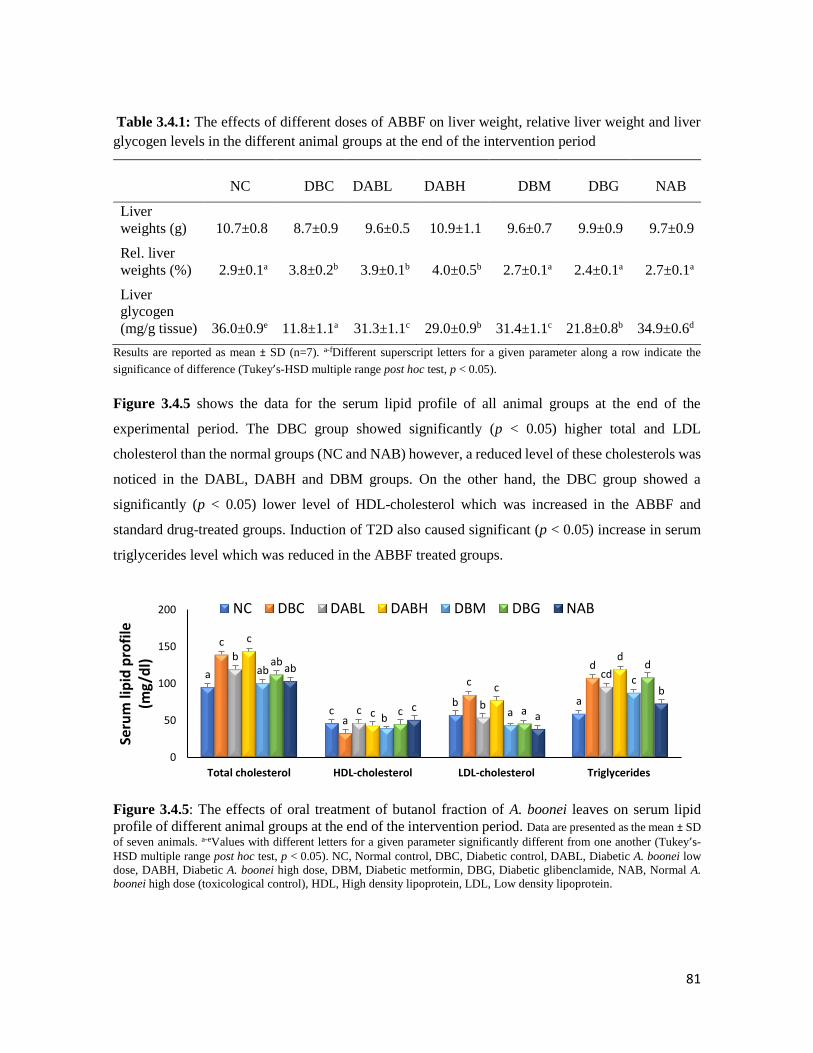
81
Table 3.4.1: The effects of different doses of ABBF on liver weight, relative liver weight and liver
glycogen levels in the different animal groups at the end of the intervention period
NC DBC
DABL
DABH DBM DBG NAB
Liver
weights (g) 10.7±0.8 8.7±0.9 9.6±0.5 10.9±1.1 9.6±0.7 9.9±0.9 9.7±0.9
Rel. liver
weights (%) 2.9±0.1a 3.8±0.2b 3.9±0.1b 4.0±0.5b 2.7±0.1a 2.4±0.1a 2.7±0.1a
Liver
glycogen
(mg/g tissue) 36.0±0.9e 11.8±1.1a 31.3±1.1c 29.0±0.9b 31.4±1.1c 21.8±0.8b 34.9±0.6d
Results are reported as mean ± SD (n=7). a-fDifferent superscript letters for a given parameter along a row indicate the
significance of difference (Tukey’s-HSD multiple range post hoc test, p < 0.05).
Figure 3.4.5 shows the data for the serum lipid profile of all animal groups at the end of the
experimental period. The DBC group showed significantly (p < 0.05) higher total and LDL
cholesterol than the normal groups (NC and NAB) however, a reduced level of these cholesterols was
noticed in the DABL, DABH and DBM groups. On the other hand, the DBC group showed a
significantly (p < 0.05) lower level of HDL-cholesterol which was increased in the ABBF and
standard drug-treated groups. Induction of T2D also caused significant (p < 0.05) increase in serum
triglycerides level which was reduced in the ABBF treated groups.
Figure 3.4.5: The effects of oral treatment of butanol fraction of A. boonei leaves on serum lipid
profile of different animal groups at the end of the intervention period. Data are presented as the mean ± SD
of seven animals. a-eValues with different letters for a given parameter significantly different from one another (Tukey’s-
HSD multiple range post hoc test, p < 0.05). NC, Normal control, DBC, Diabetic control, DABL, Diabetic A. boonei low
dose, DABH, Diabetic A. boonei high dose, DBM, Diabetic metformin, DBG, Diabetic glibenclamide, NAB, Normal A.
boonei high dose (toxicological control), HDL, High density lipoprotein, LDL, Low density lipoprotein.
a
cb a
c
a
c
db
c b
cd
c
c
c
dab
b a
c
ab
c a
dab
ca
b
0
50
100
150
200
Total cholesterol HDL-cholesterol LDL-cholesterol Triglycerides
Seru
m li
pid
pro
file
(m
g/d
l)
NC DBC DABL DABH DBM DBG NAB
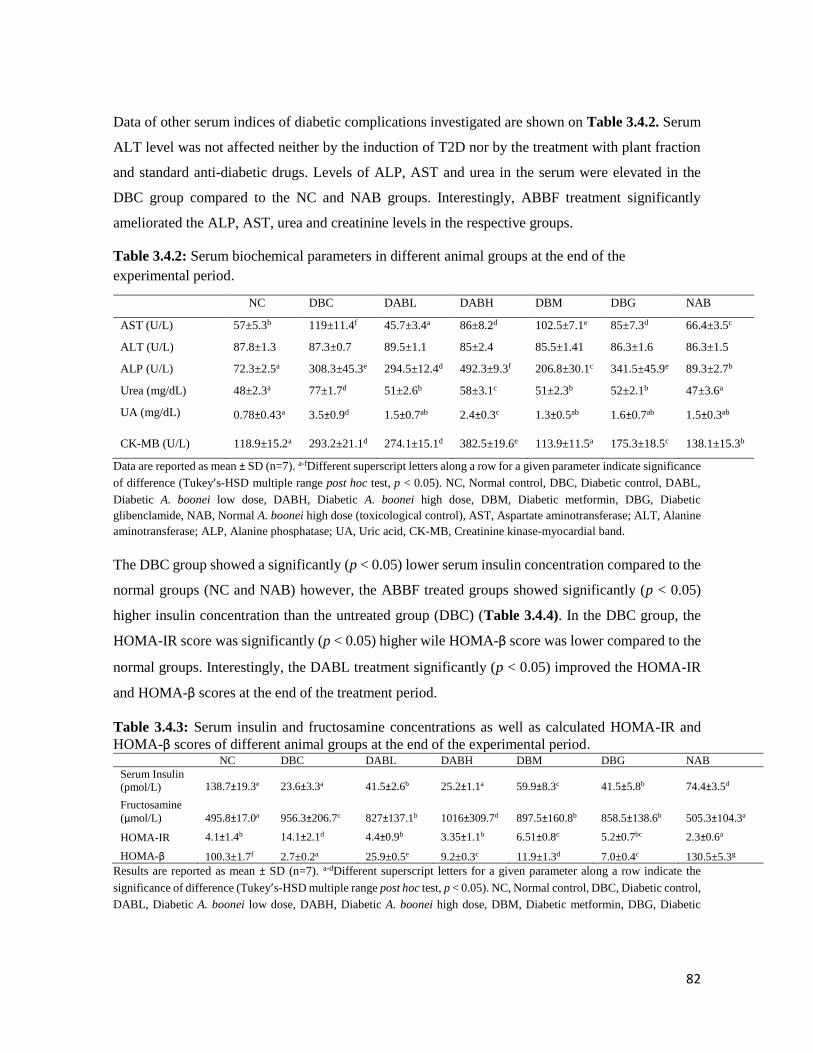
82
Data of other serum indices of diabetic complications investigated are shown on Table 3.4.2. Serum
ALT level was not affected neither by the induction of T2D nor by the treatment with plant fraction
and standard anti-diabetic drugs. Levels of ALP, AST and urea in the serum were elevated in the
DBC group compared to the NC and NAB groups. Interestingly, ABBF treatment significantly
ameliorated the ALP, AST, urea and creatinine levels in the respective groups.
Table 3.4.2: Serum biochemical parameters in different animal groups at the end of the
experimental period.
NC DBC DABL DABH DBM DBG NAB
AST (U/L) 57±5.3b 119±11.4f 45.7±3.4a 86±8.2d 102.5±7.1e 85±7.3d 66.4±3.5c
ALT (U/L) 87.8±1.3 87.3±0.7 89.5±1.1 85±2.4 85.5±1.41 86.3±1.6 86.3±1.5
ALP (U/L) 72.3±2.5a 308.3±45.3e 294.5±12.4d 492.3±9.3f 206.8±30.1c 341.5±45.9e 89.3±2.7b
Urea (mg/dL) 48±2.3a 77±1.7d 51±2.6b 58±3.1c 51±2.3b 52±2.1b 47±3.6a
UA (mg/dL) 0.78±0.43a 3.5±0.9d 1.5±0.7ab 2.4±0.3c 1.3±0.5ab 1.6±0.7ab 1.5±0.3ab
CK-MB (U/L) 118.9±15.2a 293.2±21.1d 274.1±15.1d 382.5±19.6e 113.9±11.5a 175.3±18.5c 138.1±15.3b
Data are reported as mean ± SD (n=7). a-fDifferent superscript letters along a row for a given parameter indicate significance
of difference (Tukey’s-HSD multiple range post hoc test, p < 0.05). NC, Normal control, DBC, Diabetic control, DABL,
Diabetic A. boonei low dose, DABH, Diabetic A. boonei high dose, DBM, Diabetic metformin, DBG, Diabetic
glibenclamide, NAB, Normal A. boonei high dose (toxicological control), AST, Aspartate aminotransferase; ALT, Alanine
aminotransferase; ALP, Alanine phosphatase; UA, Uric acid, CK-MB, Creatinine kinase-myocardial band.
The DBC group showed a significantly (p < 0.05) lower serum insulin concentration compared to the
normal groups (NC and NAB) however, the ABBF treated groups showed significantly (p < 0.05)
higher insulin concentration than the untreated group (DBC) (Table 3.4.4). In the DBC group, the
HOMA-IR score was significantly (p < 0.05) higher wile HOMA-β score was lower compared to the
normal groups. Interestingly, the DABL treatment significantly (p < 0.05) improved the HOMA-IR
and HOMA-β scores at the end of the treatment period.
Table 3.4.3: Serum insulin and fructosamine concentrations as well as calculated HOMA-IR and
HOMA-β scores of different animal groups at the end of the experimental period. NC DBC DABL DABH DBM DBG NAB
Serum Insulin
(pmol/L) 138.7±19.3e 23.6±3.3a 41.5±2.6b 25.2±1.1a 59.9±8.3c 41.5±5.8b 74.4±3.5d
Fructosamine
(µmol/L) 495.8±17.0a 956.3±206.7c 827±137.1b 1016±309.7d 897.5±160.8b 858.5±138.6b 505.3±104.3a
HOMA-IR 4.1±1.4b 14.1±2.1d 4.4±0.9b 3.35±1.1b 6.51±0.8c 5.2±0.7bc 2.3±0.6a
HOMA-β 100.3±1.7f 2.7±0.2a 25.9±0.5e 9.2±0.3c 11.9±1.3d 7.0±0.4c 130.5±5.3g
Results are reported as mean ± SD (n=7). a-dDifferent superscript letters for a given parameter along a row indicate the
significance of difference (Tukey’s-HSD multiple range post hoc test, p < 0.05). NC, Normal control, DBC, Diabetic control,
DABL, Diabetic A. boonei low dose, DABH, Diabetic A. boonei high dose, DBM, Diabetic metformin, DBG, Diabetic
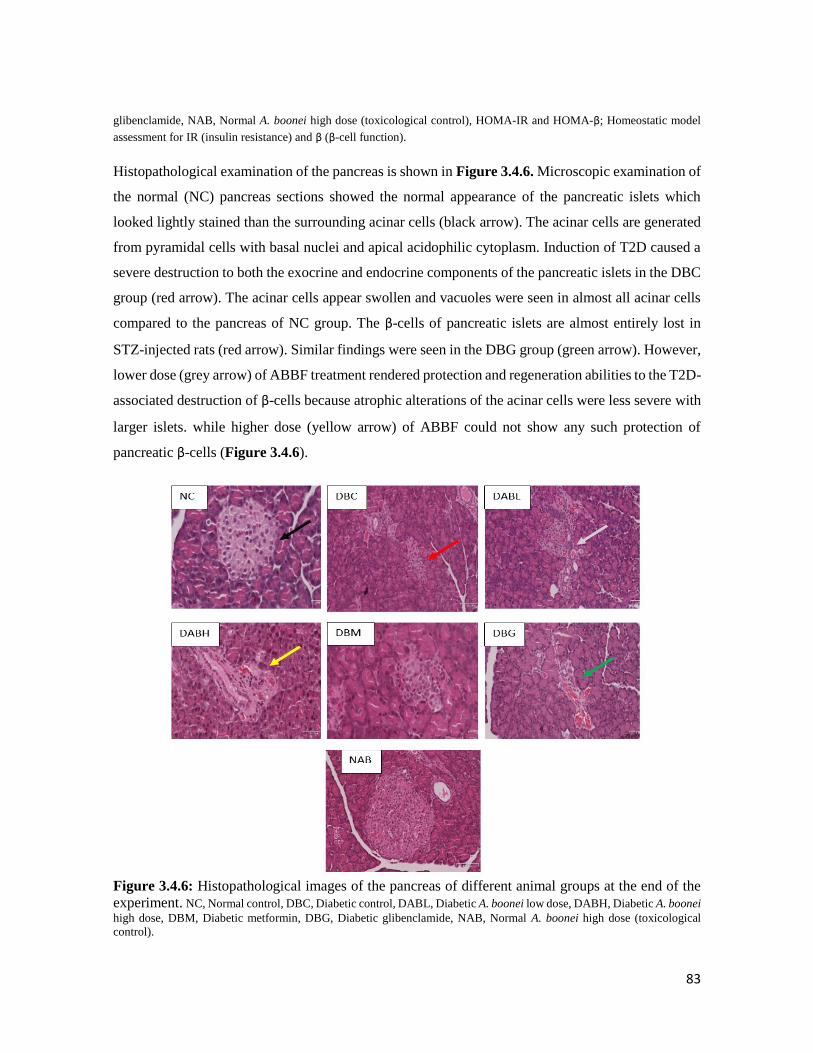
83
glibenclamide, NAB, Normal A. boonei high dose (toxicological control), HOMA-IR and HOMA-β; Homeostatic model
assessment for IR (insulin resistance) and β (β-cell function).
Histopathological examination of the pancreas is shown in Figure 3.4.6. Microscopic examination of
the normal (NC) pancreas sections showed the normal appearance of the pancreatic islets which
looked lightly stained than the surrounding acinar cells (black arrow). The acinar cells are generated
from pyramidal cells with basal nuclei and apical acidophilic cytoplasm. Induction of T2D caused a
severe destruction to both the exocrine and endocrine components of the pancreatic islets in the DBC
group (red arrow). The acinar cells appear swollen and vacuoles were seen in almost all acinar cells
compared to the pancreas of NC group. The β-cells of pancreatic islets are almost entirely lost in
STZ-injected rats (red arrow). Similar findings were seen in the DBG group (green arrow). However,
lower dose (grey arrow) of ABBF treatment rendered protection and regeneration abilities to the T2D-
associated destruction of β-cells because atrophic alterations of the acinar cells were less severe with
larger islets. while higher dose (yellow arrow) of ABBF could not show any such protection of
pancreatic β-cells (Figure 3.4.6).
Figure 3.4.6: Histopathological images of the pancreas of different animal groups at the end of the
experiment. NC, Normal control, DBC, Diabetic control, DABL, Diabetic A. boonei low dose, DABH, Diabetic A. boonei
high dose, DBM, Diabetic metformin, DBG, Diabetic glibenclamide, NAB, Normal A. boonei high dose (toxicological
control).
84
3.4.5 Discussion
Medicinal plants have been used for many years for the treatment of diseases such as type 2 diabetes
(T2D). The goal of most treatment modalities of T2D is to maintain near normal levels of blood
glucose both in the fasting and non-fasting states. Although extensive researches have been done on
the efficacy of medicinal plants as a source of anti-diabetic agents, some plants are yet to be explored
and Alstonia boonei is one of them.
Frequent thirst (polydipsia) and constant hunger (polyphagia) with subsequent weight loss are major
symptoms of T2D (Pan et al., 2017). The ability of ABBF to ameliorate these symptoms particularly
fluid intake is noteworthy (Figure 3.4.1). The short time frame for the intervention period (5 weeks)
might be responsible for the insignificant alteration of food intake and body weight gain of the
experimental animals as shown in Figure 3.4.2.
A common pathogenesis of T2D is sustained hyperglycemia, shown by high fasting (> 7 mmol/L) or
non-fasting (> 8.5 mmol/L) blood glucose levels. Insulin resistance together with partial pancreatic
β-cell dysfunction has been implicated in favouring the progression of hyperglycemia (Cerf, 2013).
Maintaining normal blood glucose levels in diabetic patients is a key factor in eliminating the various
subsequent complications associated with this disease (Asif, 2014). Some medicinal plants have been
reported to show their anti-diabetic activities through stimulating glucose uptake in peripheral tissues
(Oyebode et al., 2018), insulin release (Islam and Choi, 2008; Patel et al., 2012), or β-cell protecting
activities (Oh, 2015). In this study, the low dose of the fraction of A. boonei (150 mg/kg body weight)
showed better anti-hyperglycemic ability than the high dose (300 mg/kg body weight). It has been
noticed from other serum parameters and histopathological study of pancreas that the higher dose
(300 mg/kg body weight) of ABBF was more detrimental or toxic rather than hypoglycemic and anti-
diabetic in this study. However, ABBF did not show any hypoglycemic tendencies since the normal
toxicological group (NAB) remained normal all through the experimental period (Figure 3.4.3),
however the effects of the higher dose of ABBF in normal and diabetic animals may not be the same.
Additionally, treatment with ABBF led to improved glucose intolerance (Figure 3.4.4), which might
be due to increased secretion of insulin or reduced insulin resistance that increased the uptake of
glucose in peripheral tissues. In addition to the glucose tolerance improving activity, the lower dose
of the fraction reduced HOMA-IR score (insulin resistance) and improved HOMA-β scores (β-cell
functions) (Table 3.4.3) and pancreatic β-cell regeneration (Figure 3.4.6). These results suggest the
hypoglycemic activity of A. boonei may not only be via reducing insulin resistance (HOMA-IR) but
85
also by improving pancreatic β–cell dysfunction (HOMA-β). In addition to these two mechanisms,
ABBF also increased glucose mobilization by stimulating the synthesis of hepatic glycogen as shown
by the increased liver glycogen content (Table 3.4.1).
Reduction of liver glycogen levels as a result of sporadic glycogen phosphorylation or reduced
glycogen synthesis is another pathogenic feature of STZ-induced T2D (Islam, 2011). Medicinal
plants have been reported to possess hepatic glycogen synthetic abilities and this has been suggested
to be responsible for their anti-diabetic activity (Ezeani et al., 2017; Patel et al., 2012). The observed
hepatic glycogen stimulatory activity of the fraction could suggest that the fraction might enhance
glucose uptake by the liver and skeletal muscles.
Lipids are the key players in the pathogenesis of many complications of T2D. Elevated serum total
cholesterol and depletion of serum HDL-cholesterol in diabetes can lead to atherosclerosis and
coronary heart diseases, which are some of the fatal macrovascular complications of T2D if left
untreated (Farook et al., 2011). In this study, the significant reduction of serum total cholesterol,
triglycerides and LDL-cholesterol with concomitant increase of serum HDL-cholesterol after
treatment with the lower dose of A. boonei fraction render cardiac protective effect A. boonei in type
2 diabetic condition (Figure 3.4.5). Plants elicit harmful cholesterol reduction and high HDL/LDL
ratio by the activation of LDL receptors in liver cells to encourage effective LDL-cholesterol
excretion (Kapur et al., 2008).
Other markers of diabetic complications, ALT, AST for hepatocellular injury and ALP for cholestasis
were also explored in this study. Induction of T2D caused significant increase in serum levels of AST
and ALP suggesting impaired liver function, while increased serum urea levels denotes impaired
kidney function (Table 3.4.2). However, treatment of diabetic rats with low dose of ABBF reduced
the levels of these enzymes indicating the amelioration of T2D-related liver and kidney damages.
Elevated serum uric acid levels and CK-MB (creatinine kinase-myocardial band) causes an
accumulation of uric acid in the joints and soft tissues triggering arthritis, gout, insulin resistance,
hypertension, cardiovascular and renal diseases (Jalal et al., 2011; Momeni, 2012). The ability of the
fractions of A. boonei to reduce serum uric acid levels (Table 3.4.2) could suggest the potency of the
fractions in ameliorating insulin resistance and also render cardio and renal protection in type 2
diabetic patients, thereby limiting the risks of diabetic complications.
It is interesting to note that an earlier research reported the toxicity of fractions/extracts of A. boonei
at a dose of 200-400 mg/kg bw (Olanlokun and Olorunsogo, 2018). This might be responsible for the

86
observed low antidiabetic activities and eminent β-cell toxicity as observed in our study with the high
dose of ABBF (Figure 3.4.6). From the data of our study, it is clear that the low dose (150 mg/kg
bw) of ABBF is a better choice for controlling hyperglycemia while >200 mg/kg bw may be toxic,
as observed in a previous study (Olanlokun and Olorunsogo, 2018). However, our data clearly
demonstrated the toxicity of 300 mg/kg bw dose in diabetic condition.
In conclusion, this study shows that the butanol fraction of Alstonia boonei leaves (at a dose of 150
mg/kg BW) is hypoglycemic which might be mediated by the modulation of pancreatic β-cell
function, stimulation of insulin sensitivity and hepatic glycogen synthesis. In addition, the fraction
was also able to ameliorate some T2D-related complications via ameliorating organ-function related
parameters.

87
3.5 Butanol fraction of Alstonia boonei leaves ameliorates oxidative stress in a type 2
diabetes model of rats
Olajumoke A. Oyebode, Ochuko L. Erukainure, and Md. Islam*
Department of Biochemistry, School of Life Sciences, University of KwaZulu-Natal, (Westville
Campus), Durban 4000, South Africa
*Corresponding author: [email protected]; Tel: +27 (0)31-260-8717; Fax: +27 (0)31-260-7942
Preface: This article reports the detailed in vivo antioxidant status of the serum and organs collected
from the rats in the above experiment and it is currently awaiting revision before submission to a
journal for publication.
3.5.1 Abstract
The effects of oral administration of the butanol fraction of Alstonia boonei (ABBF) on antioxidative
status in the serum, pancreas, liver, kidney and heart of type 2 diabetic rats was examined. The
markers of oxidative stress measured in vivo were TBARS (thiobarbituric acid reactive substances),
catalase, super oxide dismutase (SOD), reduced glutathione, glutathione reductase and peroxidase.
Induction of type 2 diabetes (T2D) using 40 mg/kg BW caused a noticeable reduction of endogenous
antioxidant enzymes as well as an increment in MDA levels (a marker of lipid peroxidation) in
diabetic rats. However, treatment with ABBF (especially the low dose) significantly (p < 0.05)
increased reduced glutathione levels and other endogenous antioxidant enzymes in the serum and
other organs compared to diabetic controls. Results of this study indicate that ABBF has a strong
antioxidant effect in a type 2 diabetic rat model.
Keywords: A. boonei, oxidative stress, antioxidants, lipid peroxidation, type 2 diabetes
3.5.2 Introduction
In type 2 diabetes (T2D), macro and micro vascular complications arise as a result of persistent
hyperglycemia (Stolar, 2010). This sustained hyperglycemia tends to favor the production of free
radicals through different pathways such as: glucose autooxidation, advanced glycation end products,
polyol pathway, protein kinase C activation, and increased flux of the hexosamine pathway
(Ahmadinejad et al., 2017). When an imbalance in the ratio of free radicals to antioxidant enzymes
favors free radicals it leads to a condition known as oxidative stress (Kurutas, 2015). The duo of
oxidative stress and hyperglycemia have combinatorial roles in the generation of multiple
complications of T2D (Matough et al., 2012). Therefore, amelioration of in vivo oxidative stress is

88
an important therapeutic mechanism that could be beneficial to people suffering from T2D and its
complications.
The deleterious effects of oxidative stress in normal body function is curbed by the action of both
enzymatic and non-enzymatic antioxidant defence mechanism (Birben et al., 2012). Enzymatic
antioxidants comprise of superoxide dismutase, catalase and glutathione peroxidase while the non-
enzymatic antioxidants comprise of glutathione, vitamin C and E (Birben et al., 2012, Nita and
Grzybowski, 2016). However, there are significant alterations in the levels and activities of these
antioxidants in diabetic condition (Dal and Sigrist, 2016; Asmat et al., 2016). Oxidative stress can
cause low grade inflammation which can lead to the alterations in cardiovascular structure and activity
promoting cardiac complications during T2D (Valko et al., 2007). Apart from the heart, many organs
are also affected by oxidative stress such as nerves, eyes, kidneys and these promote macro- and
micro-vascular complications during T2D (Dal and Sigrist, 2016). Fortunately, antioxidants from
plant sources have been found to render protection against the different complications of T2D.
Medicinal plants have been credited for their role as antioxidants with blood glucose lowering abilities
from time immemorial and an example of such a plant is Alstonia boonei.
Alstonia boonei belongs to the Apocynaceae family and is currently used in the management of
diabetes mellitus in some parts of Africa (Akinloye et al., 2013; Osadolor et al., 2015). Various
preliminary in vitro and ex vivo studies have been done in our lab in order to verify the antidiabetic
and antioxidative activity related claims of this plant. The butanol fraction of the leaves of A. boonei
was found to show promising antidiabetic activity when subjected to in vivo antidiabetic study in a
T2D rat model (see section 3.4 above). The present study was performed in a bid to examine if the
observed antidiabetic activity can be credited to the role of the antioxidant defence mechanism.
3.5.3 Materials and methods
Please refer to the Chapter 2 for the detailed materials and methods used for A. boonei.
3.5.4 Results
The extent of lipid peroxidation in the pancreas was lower than the other organs. The DBC group
showed a significantly (p < 0.05) higher level of MDA compared to the normal and treated groups
(Figure 3.5.1). This was also replicated in the serum, liver, heart and kidneys of the animals. The
MDA levels was seen to reduce upon treatment with the ABBF, which shows the lipid peroxidation
alleviating property of the fraction.
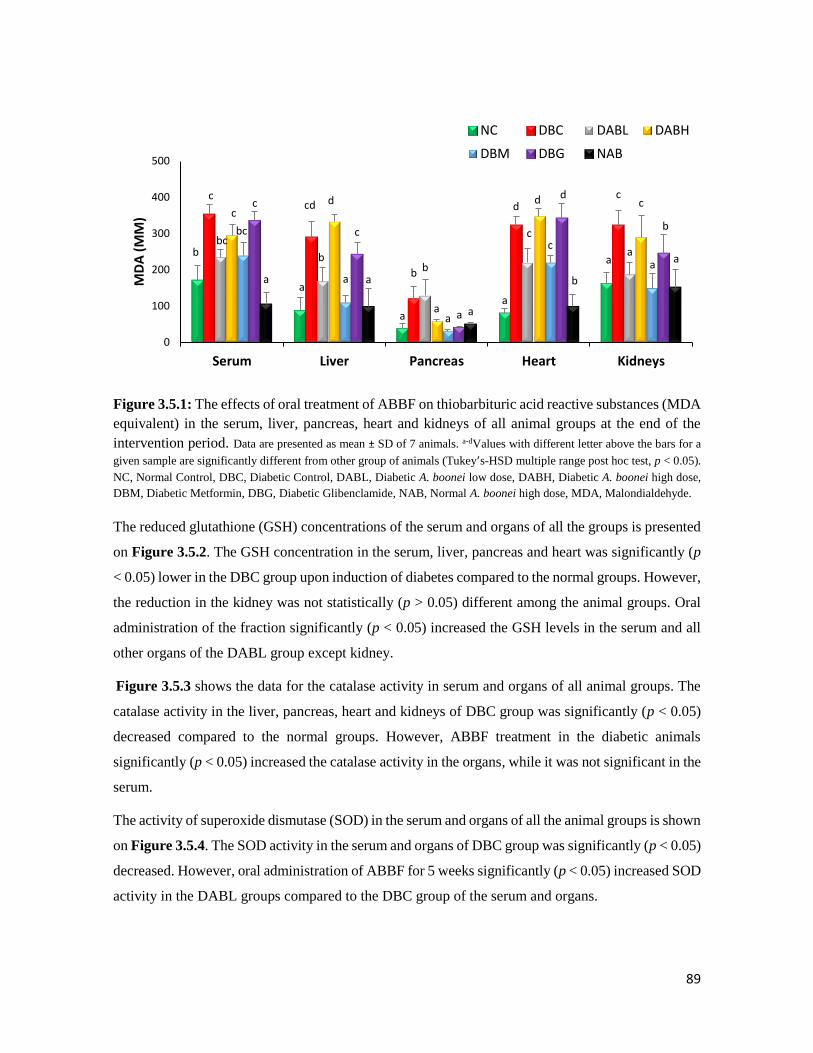
89
Figure 3.5.1: The effects of oral treatment of ABBF on thiobarbituric acid reactive substances (MDA
equivalent) in the serum, liver, pancreas, heart and kidneys of all animal groups at the end of the
intervention period. Data are presented as mean ± SD of 7 animals. a-dValues with different letter above the bars for a
given sample are significantly different from other group of animals (Tukey’s-HSD multiple range post hoc test, p < 0.05).
NC, Normal Control, DBC, Diabetic Control, DABL, Diabetic A. boonei low dose, DABH, Diabetic A. boonei high dose,
DBM, Diabetic Metformin, DBG, Diabetic Glibenclamide, NAB, Normal A. boonei high dose, MDA, Malondialdehyde.
The reduced glutathione (GSH) concentrations of the serum and organs of all the groups is presented
on Figure 3.5.2. The GSH concentration in the serum, liver, pancreas and heart was significantly (p
< 0.05) lower in the DBC group upon induction of diabetes compared to the normal groups. However,
the reduction in the kidney was not statistically (p > 0.05) different among the animal groups. Oral
administration of the fraction significantly (p < 0.05) increased the GSH levels in the serum and all
other organs of the DABL group except kidney.
Figure 3.5.3 shows the data for the catalase activity in serum and organs of all animal groups. The
catalase activity in the liver, pancreas, heart and kidneys of DBC group was significantly (p < 0.05)
decreased compared to the normal groups. However, ABBF treatment in the diabetic animals
significantly (p < 0.05) increased the catalase activity in the organs, while it was not significant in the
serum.
The activity of superoxide dismutase (SOD) in the serum and organs of all the animal groups is shown
on Figure 3.5.4. The SOD activity in the serum and organs of DBC group was significantly (p < 0.05)
decreased. However, oral administration of ABBF for 5 weeks significantly (p < 0.05) increased SOD
activity in the DABL groups compared to the DBC group of the serum and organs.
b
a
a
a
a
ccd
b
dc
bc
bb
c
a
cd
a
d c
bc
a
a
c
a
c
c
a
d
b
a a
a
b
a
0
100
200
300
400
500
Serum Liver Pancreas Heart Kidneys
MD
A (
ΜM
)NC DBC DABL DABH
DBM DBG NAB
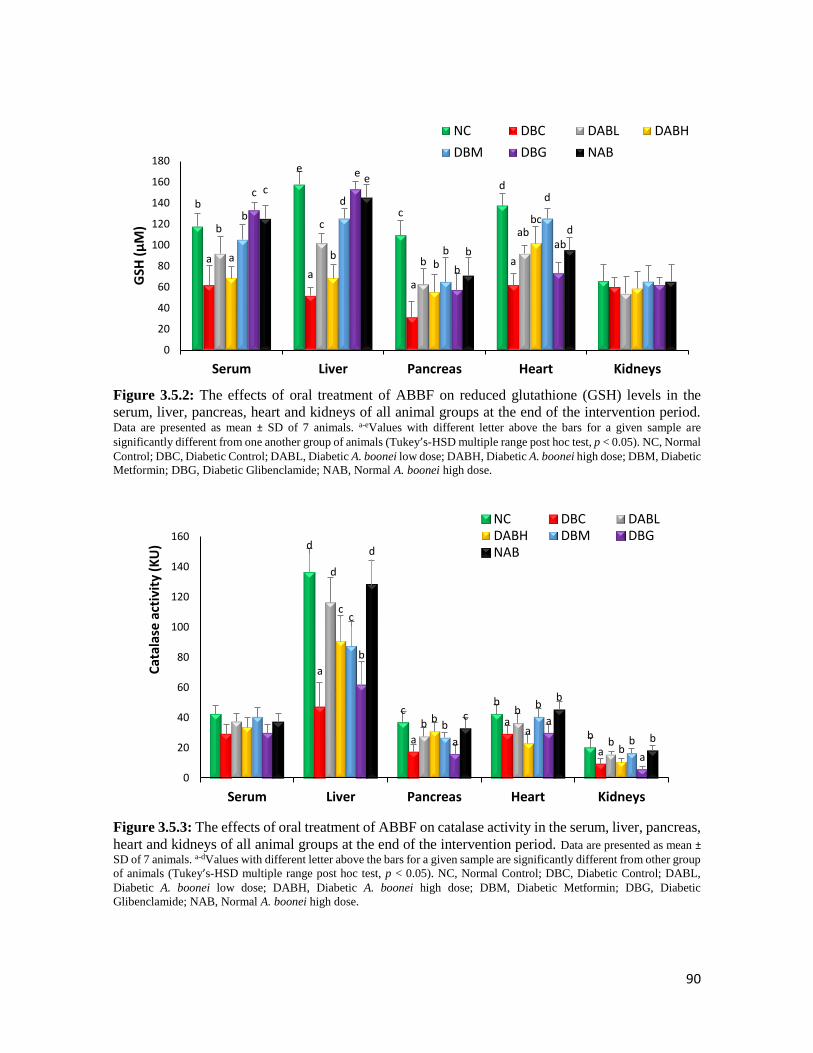
90
Figure 3.5.2: The effects of oral treatment of ABBF on reduced glutathione (GSH) levels in the
serum, liver, pancreas, heart and kidneys of all animal groups at the end of the intervention period. Data are presented as mean ± SD of 7 animals. a-eValues with different letter above the bars for a given sample are
significantly different from one another group of animals (Tukey’s-HSD multiple range post hoc test, p < 0.05). NC, Normal
Control; DBC, Diabetic Control; DABL, Diabetic A. boonei low dose; DABH, Diabetic A. boonei high dose; DBM, Diabetic
Metformin; DBG, Diabetic Glibenclamide; NAB, Normal A. boonei high dose.
Figure 3.5.3: The effects of oral treatment of ABBF on catalase activity in the serum, liver, pancreas,
heart and kidneys of all animal groups at the end of the intervention period. Data are presented as mean ±
SD of 7 animals. a-dValues with different letter above the bars for a given sample are significantly different from other group
of animals (Tukey’s-HSD multiple range post hoc test, p < 0.05). NC, Normal Control; DBC, Diabetic Control; DABL,
Diabetic A. boonei low dose; DABH, Diabetic A. boonei high dose; DBM, Diabetic Metformin; DBG, Diabetic
Glibenclamide; NAB, Normal A. boonei high dose.
b
e
c
d
a
aa
a
b c
b
ab
a bb
bcbd
b
dc
e
b
ab
ce
b
d
0
20
40
60
80
100
120
140
160
180
Serum Liver Pancreas Heart Kidneys
GSH
(µ
M)
NC DBC DABL DABH
DBM DBG NAB
d
cb
b
a
a
a
a
d
bb
b
c
ba
b
c
b
b
b
b
a
a
a
d
c
b
b
0
20
40
60
80
100
120
140
160
Serum Liver Pancreas Heart Kidneys
Cat
alas
e a
ctiv
ity
(KU
)
NC DBC DABLDABH DBM DBGNAB
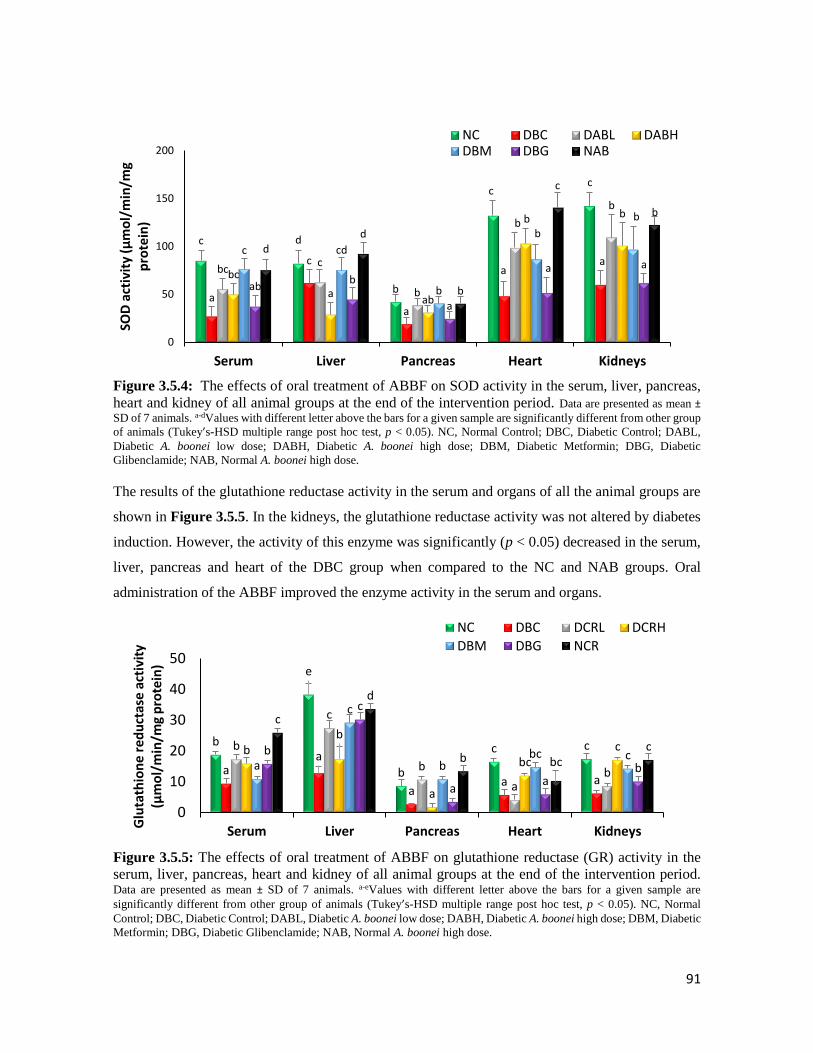
91
Figure 3.5.4: The effects of oral treatment of ABBF on SOD activity in the serum, liver, pancreas,
heart and kidney of all animal groups at the end of the intervention period. Data are presented as mean ±
SD of 7 animals. a-dValues with different letter above the bars for a given sample are significantly different from other group
of animals (Tukey’s-HSD multiple range post hoc test, p < 0.05). NC, Normal Control; DBC, Diabetic Control; DABL,
Diabetic A. boonei low dose; DABH, Diabetic A. boonei high dose; DBM, Diabetic Metformin; DBG, Diabetic
Glibenclamide; NAB, Normal A. boonei high dose.
The results of the glutathione reductase activity in the serum and organs of all the animal groups are
shown in Figure 3.5.5. In the kidneys, the glutathione reductase activity was not altered by diabetes
induction. However, the activity of this enzyme was significantly (p < 0.05) decreased in the serum,
liver, pancreas and heart of the DBC group when compared to the NC and NAB groups. Oral
administration of the ABBF improved the enzyme activity in the serum and organs.
Figure 3.5.5: The effects of oral treatment of ABBF on glutathione reductase (GR) activity in the
serum, liver, pancreas, heart and kidney of all animal groups at the end of the intervention period. Data are presented as mean ± SD of 7 animals. a-eValues with different letter above the bars for a given sample are
significantly different from other group of animals (Tukey’s-HSD multiple range post hoc test, p < 0.05). NC, Normal
Control; DBC, Diabetic Control; DABL, Diabetic A. boonei low dose; DABH, Diabetic A. boonei high dose; DBM, Diabetic
Metformin; DBG, Diabetic Glibenclamide; NAB, Normal A. boonei high dose.
c d
b
cc
a
c
a
aa
bcc
b
b
b
bc
aab
b b
c cd
b
b
b
abb
a
a a
d
d
b
c
b
0
50
100
150
200
Serum Liver Pancreas Heart Kidneys
SOD
act
ivit
y (µ
mo
l/m
in/m
g p
rote
in)
NC DBC DABL DABHDBM DBG NAB
b
e
b
c c
aa
aa a
b
c
b
ab
bb
a
bcc
a
c
bbc cb
c
aa
b
c
d
b bcc
0
10
20
30
40
50
Serum Liver Pancreas Heart KidneysGlu
tath
ion
e re
du
ctas
e ac
tivi
ty
(µm
ol/
min
/mg
pro
tein
)
NC DBC DCRL DCRH
DBM DBG NCR

92
Figure 3.5.6 shows the glutathione peroxidase (GPx) activity in the serum and organs. The GPx
activity was significantly (p < 0.05) decreased in the serum and organs of DBC group compared to
the NC and NAB groups. However, treatment with ABBF significantly (p < 0.05) increased the GPx
activity in the diabetic treated groups which was comparable to the DBM and DBG groups.
Figure 3.5.6: The effects of oral treatment of ABBF on glutathione peroxidase (GPx) activity in the
serum, liver, pancreas, heart and kidney of all animal groups at the end of the intervention period. Data are presented as mean ± SD of 7 animals. a-eValues with different letter above the bars for a given sample are
significantly different from other group of animals (Tukey’s-HSD multiple range post hoc test, p < 0.05). NC, Normal
Control; DBC, Diabetic Control; DABL, Diabetic A. boonei low dose; DABH, Diabetic A. boonei high dose; DBM, Diabetic
Metformin; DBG, Diabetic Glibenclamide; NAB, Normal A. boonei high dose.
3.5.5 Discussion
The role of plants in the treatment of diseases such as T2D which arises as a result of the impact of
oxidative stress is very important. Medicinal plants contain numerous antioxidants which are able to
lend a helping hand in scavenging free radicals that are formed due to autooxidation of glucose in the
severe cases of hyperglycemia.
In our previously reported data (Section 3.3), we have shown that the fractions of Alstonia boonei
leaves contain high total phenol content, which might be responsible for their observed antioxidant
activity. The present study went a step further by investigating the ability of the butanol fraction of
A. boonei to upregulate the endogenous antioxidant system in the blood and various organs of a T2D
model of rats. The serum and some major organs (liver, heart, pancreas and kidneys) of the type 2
c
c
c
cb
ab
a
a
aa
bc
a b
bc
b
a
ab
ba
b
c
b
b
bcbbc
abb b
a
c
bcc
bc b
0
10
20
30
40
50
60
Serum Liver Pancreas Heart Kidneys
Glu
tath
ion
e p
ero
xid
ase
acti
vity
(µ
mo
l/m
in/m
g p
rote
in)
NC DBC DABL DABH
DBM DBG NAB
93
diabetic rats were examined for both enzymatic (Catalase, SOD, GPx, GR) and non-enzymatic
(MDA, GSH) after the treatment with ABBF.
Increased oxidative stress or free radicals in T2D leads to a concomitant increase in MDA levels
which is a key index in determining the initiation of lipid peroxidation in the cell membrane (Nita
and Grzybowski, 2016). Lipid peroxidation as a result of unmanaged hyperglycemia and
hyperlipidemia causes damages to the cell membrane favouring the progression of T2D and its
complications. In this study, the DBC groups of the serum and organs showed an elevation of MDA
levels compared to the NC group which signified the initiation of lipid peroxidation. Our previous
findings showed that (Section 3.4) the increase in cardiac and liver function biomarkers in the diabetic
animals could also be related for the observed increase of MDA levels in this study. However,
administration of ABBF led to the reduction of MDA levels in the serum and organs with even more
promising activity than glibenclamide (Figure 3.5.1). This result confirms the free radical scavenging
and lipid peroxidation reducing ability of ABBF. The increase of levels of GSH (Figure 3.5.2) in the
serum and organs of the treated diabetic rats was also in line with the MDA results.
In T2D, increased free radical production reduces the activities of endogenous antioxidant enzymes,
this was proven in our result (Figure 3.5.2) where the diabetic groups showed a reduction in GSH
level compared to the NC group. GSH is an intracellular thiol that promotes free radical eradication
process in oxidative stress. Reduced GSH levels in diabetes occurs as a result of the competition
between glutathione reductase and aldose reductase for NADPH (a cofactor) (Kalkan and Suher,
2013). Figure 3.5.2 showed the ability of the plant fraction (especially the low dose) to improve GSH
levels in the serum and organs (except the kidneys where no GSH activity was noticed). The results
of our study showed the higher concentration of reduced glutathione in the serum and organs of the
DABL and DABH groups when compared to the DBC group. This result is in line with the reduced
MDA levels as recorded earlier.
Catalase and SOD are important endogenous antioxidant enzymes that are capable of transforming
harmful superoxide radicals to H2O2 and then to harmless water and oxygen. Figure 3.5.3 showed a
reduction of catalase activity in the diabetic control group which might have occurred due to the
induction of T2D by a low dose of streptozotocin. The increase of catalase and SOD levels noticed
in the DABL and DABH groups highlights the potency of ABBF as an antioxidant agent in managing
the complications linked to T2D. The ability of ABBF to reduce lipid peroxidation and increase
antioxidant enzymes correlates with an earlier reported study where the ethanol extract of the leaves
of A. boonei were used (Enechi et al., 2014). Similar results were obtained from both studies.
94
GPx and GR are glutathione dependent enzymes and a reduction in their activities can be linked to
the reduction of GSH level. GPx catalyses the reduction of lipid peroxides at the expense of GSH,
which also favours H2O2 inactivation and encourages the higher consumption of GSH (Kumawat et
al., 2013). Thus, lower level of GSH reduces the activity of these antioxidant enzymes and contributes
to worsening oxidative stress. However, treatment with ABBF showed an increase in GPx and GR
activities in the treated groups even up to normal levels. This shows that the butanol fraction of A.
boonei (especially the low dose) has the potentialto improve the antioxidant status as well as reduce
the complications of T2D.
Studies have shown the presence of potent phytochemicals such as alkaloids, tannins, saponins,
flavonoids and cardiac glycosides (Akinmoladun et al., 2007) and bioactive constituents such as 2-
hydroxy-1-(hydroxymethyl) ethyl, eugenol, benzenedicarboxylic acid and alpha-amyrin in A. boonei
(Babatunde, 2017). These bioactive compounds may be responsible for the antioxidant activities of
ABBF.
From the results of this study, we have seen so far, the low dose of the fraction has shown better
antioxidant activity than the high dose, this can be related to a previously reported work that showed
the toxicity of a high dose (200-400 mg/kg body weight) of A. boonei fractions and also reported a
longer time in recovery of subjects from the toxic effects of high dose of the plant (Olanlokun and
Olorunsogo, 2018). We have also noticed the similar toxicological effects of the high dose (300 mg/kg
bw) which have been evident by increment of several biochemical parameters and pancreatic
histopathology in our study.
In conclusion, oral administration of ABBF especially low dose (150 mg/kg bw) showed potent
antioxidant activity through the reduction of lipid peroxidation, upregulation of glutathione levels and
endogenous antioxidant enzymes in the serum and organs of type 2 diabetic animals. Therefore,
ABBF could serve as a good antioxidant agent and could be used in controlling oxidative stress in
T2D. Further studies are required to confirm its efficacy in human type 2 diabetic patients.

95
THE ANTIOXIDANT AND ANTIDIABETIC ACTIVITIES OF
ACALYPHA WILKESIANA IN VITRO AND IN VIVO
4.1 Background
Acalypha wilkesiana ‘Java white’ is a member of the family Euphorbiaceae and sub family
Acalyphoideae (Figure 4.1), it has great decorative value due to its lovely coloured foliage. It is
cultivated widely in tropical and subtropical countries (Bailey and Day, 2004). The Java white variant
which is our plant of interest, has leaves with colour ranging from greenish yellow to ivory. Although
it is native to the Pacific Islands (Tahiti, Fiji, New Zealand and Australia), it also widely seen in some
Asian and African countries. The leaves are oval shaped with toothed and lightly coloured edges.
They have tiny flowers which are reddish in colour and are formed in thin hanging spikes known as
catkins (Bailey and Day, 2004).
Figure 4.1: Acalypha wilkesiana ‘Java white’ also known as Java white copperleaf (English), Mirror
bush, Jacob’s coat (English). Photo credit: Oluwaseun Oyebode (2018) Durban, South Africa

96
4.1.1 Ethnomedical uses
The leaves of this plant are eaten as a vegetable in treatment of hypertension in the southern part of
Nigeria (Bailey and Day, 2004). Most Acalypha species are widely exploited for their role in
traditional medicine in diverse parts of Africa and some parts of Asia (Duraipandiyan et al., 2006;
Sofowora, 1982). A. wilkesiana is used in parts of Nigeria in the treatment of body aches and common
cold; and the boiled leaves are also used in bathing babies with skin infection (Adesina et al., 2000).
4.1.2 Biological activities
Research carried out on the leaf extract of A. wilkesiana, showed a high activity against the
propagation of gram-positive bacteria while extracts obtained from the seeds showed
immunomodulating activities that were able to reduce tumours in inflammatory cells (Büssing et al.,
1999). Recently, ethyl acetate extract of A. wilkesiana in direct use with β-, γ- and δ-tocotrienols has
been shown to possess potent anticancer activities where it was able to reduce the proliferation of
cancer cells in the lungs (A549) and brain (U87MG) cells (Abubakar et al., 2018). The antioxidant
activity of isolates from the butanol fraction of the leaves of A. wilkesiana was investigated recently
and it was discovered that the isolates possess potent free radical scavenging activity (Oladipo et al.,
2016). The antioxidant capacity of this plant cannot be farfetched since phytochemical screening from
the crude extract of the plant has indicated the presence of tannins and terpenes (Akinloye et al., 2016;
Oladimeji et al., 2012), which have been earlier reported to exhibit antioxidant activities (Amarowicz,
2007, Gonzalez-Burgos and Gomez-Serranillos, 2012).
4.1.3 Phytochemistry
To validate the antidiabetic traditional use of this plant (mentioned earlier), a comprehensive in vitro
investigation of the antioxidant activity of this plant was tested. The different solvent crude extracts
of this plant were subjected to a systematic and detailed investigation on its antioxidant capacities
using different in vitro and ex vivo studies.
97
4.2 Acalypha Wilkesiana ‘Java white’ scavenges free radicals in vitro and abates Fe2+
- induced oxidative stress in rat pancreatic homogenates
Olajumoke A. Oyebode, Ramgopal Mopuri, Ochuko. L. Erukainure, Md. Shahidul Islam*
Department of Biochemistry, School of Life Sciences, University of KwaZulu-Natal, (Westville
Campus), Durban 4000, South Africa
*Correspondence to: [email protected]
Preface: This article reports the detailed in vitro and ex vivo antioxidant studies on A. wilkesiana.
The article is currently awaiting revision before submission to a suitable journal for publication.
4.2.1 Abstract
The in vitro antioxidant potentials of extracts from the leaves, stem and root bark of Acalypha
wilkesiana were investigated. The plant parts were extracted sequentially with solvents of increasing
polarity where aqueous and ethanol extracts showed higher polyphenol content compared to the ethyl
acetate extract. However, the ethanol extract of the root bark showed significantly (p < 0.05) higher
DPPH (1,1-diphenyl-2-picryl-hydrazyl), hydroxyl radical (OH.) and nitric oxide (NO) scavenging
abilities, as well as ferric reducing antioxidant power (FRAP) when compared to other extracts. This
was confirmed by lower IC50 values and comparable with the activity of positive controls (ascorbic
or gallic acid and trolox). Their abilities to activate antioxidant enzymes in Fe2+-induced pancreatic
oxidative injuries was also investigated in rat pancreatic homogenates. Catalase, SOD and reduced
glutathione levels were significantly (p < 0.05) increased by the extracts as compared to low levels
seen in untreated groups. Data from this study suggest that the different parts of A. wilkesiana,
especially the ethanol and aqueous extracts possesses potent anti-oxidant potentials that could be
further investigated for medicinal benefits.
Key words: antioxidants; medicinal plants; A. wilkesiana; oxidative stress
4.2.2 Introduction
Medicinal plants have long been regarded as better alternatives to pharmaceutical drugs and have
gained much interest in the area of drug discovery. This can be attributed to the fact that they contain
necessary and substantial level of antioxidants and bioactive agents that have been reported in the
management and treatment of diseases such as diabetes (Dewanjee et al., 2011).

98
A host of plant sources are found to be rich in polyphenols such as herbs, fruits, flowers and these
plants are found in abundance everywhere in the world especially in Africa where there is high
reliance on medicinal plants for the treatment of diverse ailments (Hamzah et al., 2013).
Plants are rich in polyphenolic agents which are highly beneficial as they can react with reactive
oxygen species/reactive nitrogen species (ROS/RNS) to bring about reduction in deleterious effects
to cell biomolecules (Gach et al., 2015). Plant antioxidants are capable of attenuating damages to
biomolecules (lipids, proteins and DNA), with damage ranging from lipid peroxidation to cell
membrane damage through oxidation (Hossain and Shah, 2015).
Oxidative stress occurs as a result of imbalance between free radical-generating enzymes (reactive
oxygen species [ROS]) and free radical-scavenging enzymes (antioxidant enzymes) and plays a key
role in the progression of diseases (Asmat et al., 2016). This triggers an increased level of free radicals
which initiates cellular damage and has been recognized as the main contributing factor to late
complications of ailments such as diabetes and cancer (Son, 2012).
Acalypha wilkesiana ‘Java white’ belongs to the genus Acalypha of the family Euphorbiaceae (spurge
family). It has over 570 variants which include A. amentacea and A. tricolor (Sule et al., 2012). Its
common names include copperleaf, fire dragon and java white due to the green and white coloured
variant. They are found all over the world most especially in the tropics of Africa and its native to
Fiji and nearby islands in the South Pacific. It is also widely spread in the southern part of Nigeria
and many parts of South Africa (Ikewuchi, 2013).
In some parts of Africa, A. wilkesiana is used in the treatment of bacterial and fungal infections, and
the leaves and root bark are used as antidiuretics (Alade and Irobi, 1993; Ikewuchi, 2013). Plants
from the Acalypha genus are exploited traditionally for the treatment of diseases such as jaundice,
diabetes, hypertension, skin and respiratory problems (Seebaluck et al., 2015). Although, a number
of studies have been conducted with this plant, the detailed antioxidant and antidiabetic potential of
the green leafed species i.e. java white (A. wilkesiana ‘godseffiana’) will be explored.
Hence, apart from illustrating a detailed comparison of the in vitro antioxidant abilities of the extracts
from the different parts of the plant, this study also aims to further examine the antioxidant effects of
this plant on some endogenous antioxidant enzymes in rat pancreatic homogenate under conditions
of oxidative stress.

99
4.2.3 Materials and methods
Please refer to Chapter 2 for details of the methods used for A. wilkesiana.
4.2.4 Results
Both the ethanol and aqueous extracts from the different parts of the plant were found to contain
significant (p < 0.05) higher amount of total phenol reported as gallic acid equivalent as seen in
Figure 4.2.1, with highest concentration observed in the ethanol extract of stem and root bark
followed by the aqueous extract of leaves and root bark.
Figure 4.2.1: Total phenolic contents of the A. wilkesiana extracts. Data are reported as mean ± SD. a-cValues
with different letter above the bars for a given extract are significantly different from one another (p < 0.05, Tukey’s-HSD-
multiple range post-hoc test, IBM SPSS for Windows).
The results of the DPPH radical scavenging activity of A. wilkesiana leaves, stem and root bark are
depicted in Figure 4.2.2 and Table 4.2.1.
The results obtained from the different antioxidant models (DPPH, HRS and NO) for the plants parts
of A. wilkesiana are summarized in Table 4.2.1. They all showed scavenging activity against DPPH
radicals. The ethanol extracts of both the leaves and root bark showed significantly (p < 0.05) higher
activity as well as lower IC50 values than the others even when compared to the standards ascorbic
acid and trolox. In addition, all the extracts significantly (p < 0.05) scavenged nitric oxide (NO)
radicals (Figure 4.2.3). The ethanol extracts of the root bark showed significantly (p < 0.05) higher
NO scavenging activity (IC50 value of 14.23±0.68 µg/mL) compared to the standards used in this
experiment.
a
b
ab
c
c
a
b
0
40
80
120
160
Leaves Stem Bark Root bark
mg/
g G
allic
Aci
d E
qu
ival
ent
EthylAcetate
Ethanol
Aqueous
c

100
Total reducing power analysis showed the extracts could reduce Fe3+ to Fe2+ in a dose-dependent
manner as depicted in Figure 4.2.4 (a-c). The highest level of reduction was exhibited by the ethanol
extract of the root bark (Figure 4.2.4 c).
The highest hydroxyl radical scavenging activity (Figure 4.2.4 d-f) was exhibited by the ethanol
extract of the root bark (Figure 4.2.4 f). This was justified with a significantly (p < 0.05) lower IC50
value of 7.25±1.28 µg/mL as compared to the other crude extracts from the different parts of the plant.
Figure 4.2.2: DPPH scavenging activities of A. wilkesiana extracts. Data are reported as mean ± SD. a-
dValues with different letter above the bars for a given extract are significantly different from one another (p < 0.05, Tukey’s-
HSD-multiple range post-hoc test, IBM SPSS for Windows) EtAc: Ethyl acetate, EtOH: ethanol, AA: ascorbic acid.
a a a a abd d d c
ab
b b bc c c c c
c c bd c
0
20
40
60
80
100
50 100 150 200 250
Inh
ibit
ion
of
DP
PH
(%
)
Concentration (µg/mL)
Leaves
EtAcEtOHAqueousTroloxAA
a a a a aa
b c c c
a a a a ab b b b bb b b
c b
0
20
40
60
80
100
50 100 150 200 250
Inh
ibit
ion
of
DP
PH
(%
)
Concentration (µg/mL)
Stem bark
EtAcEtOHAqueousTroloxAA
a
b b b b
b
b b c c
c a a a a
d c b c dd c b
d d
0
20
40
60
80
100
50 100 150 200 250
Inh
ibit
ion
of
DP
PH
(%
)
Concentration (µg/mL)
Root bark
EtAcEtOHAqueousTroloxAA

101
Figure 4.2.3: Nitric oxide scavenging activities of A. wilkesiana extracts. Data are reported as mean ± SD. a-fValues with different letter above the bars for a given extract are significantly different from one another (p < 0.05,
Tukey’s-HSD-multiple range post-hoc test, IBM SPSS for Windows) EtAc: Ethyl acetate, EtOH: ethanol, GA; Gallic acid,
AA; Ascorbic acid.
a aa
a ab b bb c
a aa
ab
d
cc
cd
c d c ced
e d d f
0
20
40
60
80
50 100 150 200 250Nit
ric
oxi
de
inh
ibit
ion
(%
)
Concentration (µg/mL)
Leaves
EtAcEtOHAqueousGAAATrolox
bb
a aa
a a
bc b
b bc b bb
d
bcc
cbc
c c c cbcd
d d d c
0
20
40
60
80
50 100 150 200 250
Nit
ric
oxi
de
inh
ibit
ion
(%
)
Concentration (µg/mL)
Stem bark
EtAc
EtOH
Aqueous
GA
AA
Trolox
a
a aa
a
ab bc
c
c
ab c
b bb
c
cd
dc
b d d dcc
e e e d
0
20
40
60
80
50 100 150 200 250
Nit
ric
oxi
de
inh
ibit
ion
(%
)
Concentration (µg/mL)
Root bark
EtAc
EtOH
Aqueous
GA
AA
Trolox

102
Figure 4.2.4: Total reducing power of a) leaves, b) stem bark and c) root bark extracts and hydroxyl
oxide scavenging activities of A. wilkesiana d) leaves, e) stem bark and f) root bark extracts
respectively. Data are reported as mean ± SD. a-fValues with different letter above the bars for a given extract significantly
different from one another (p < 0.05, Tukey’s-HSD-multiple range post-hoc test, IBM SPSS for Windows). EtAc: Ethyl
acetate, EtOH: Ethanol, Ascorbic Ac, Ascorbic acid, OH: Hydroxyl.
b bbb
cc
aa
aa
a
bc c
d dc
d de e
0
20
40
60
80
100
50 100 150 200 250
To
tal re
du
cin
g p
ow
er
(%)
Concentration (µg/mL)
a)
EtAc
EtOH
Aqueous
Trolox
Ascorbic Acid
a
a aa
abb
b bb
bb
bcb bc c c c
c
0
20
40
60
80
100
50 100 150 200 250OH
rad
ical
inh
ibit
ion
(%
)
Concentration (µg/mL)
d)EtAc EtOH Aqueous Trolox
b b bb
b
cc
a a a aa
cc
c ddd
d d e
e
0
20
40
60
80
100
50 100 150 200 250
To
tal re
du
cin
g p
ow
er
(%)
Concentration (µg/mL)
b)
EtAc
EtOH
Aqueous
Trolox
Ascorbic Acid
a a aa
aa
bc
cc
a
b b bbb c d c
c
0
20
40
60
80
100
50 100 150 200 250
OH
rad
ical
inh
ibit
ion
(%
)
Concentration (µg/mL)
e)EtAc EtOH Aqueous Trolox
b bbb
b
d
a aa a a
c
c cc c
d
d d d
0
20
40
60
80
100
50 100 150 200 250
To
tal re
du
cin
g p
ow
er
(%)
Concentration (µg/mL)
c)
EtAc
EtOH
Aqueous
Trolox
Ascorbic Acid
aa
aa
a
c
c cc b
b b
b a ad c c bb
0
20
40
60
80
100
50 100 150 200 250
OH
rad
ical
inh
ibit
ion
(%
)
Concentration (µg/mL)
f)EtAc EtOH Aqueous Trolox

103
Table 4.2.1: IC50 values of various extracts of A. wilkesiana parts in different antioxidative models
Sample
IC50 Value (µg/mL)
DPPH NO Hydroxyl
Leaves
Ethyl acetate 2.88±0.33b >1000j 335.46±23.84f
Ethanol 1.63±0.39a >1000j 82.44±27.12d
Aqueous 2.14±0.10a 32.41±7.94d 87.34±35.91d
Stem bark
Ethyl acetate 7.78±0.06d 18.12±3.23a 156.21±48.26e
Ethanol 5.96±0.29c 269.73±52.1h 19.67±2.03c
Aqueous 9.63±0.31e 53.22±12.39e 58.78±8.62d
Root bark
Ethyl acetate 3.73±0.69b 50.52±3.65e 98.47±21.69de
Ethanol 1.83±0.69a 14.23±0.68b 7.25±1.28b
Aqueous 282±35.38f 304.23±14.83i 47.79±5.73d
Standard
Gallic acid ND 108.72±23.05f ND
Ascorbic acid 2.19±0.05a 19.40±1.45c ND
Trolox 5.79±0.43c 196.7±27.03g 3.54±0.91a
DPPH-1,1-diphenyl-2-picrylhydrazyl radical, HRS-hydroxyl radical scavenging, NO-nitric oxide radical, ND-not
determined. Data are reported as mean ± SD values of three replicas. a-j Different letters stand for significantly different
values from one another within a column (Tukey’s-HSD multiple range post hoc test, p < 0.05): the same letters stand for
non-significant difference.
The ability of the extracts, especially the ethanol extract to increase catalase activity in Fe2+-induced
oxidative pancreatic injury is shown in Figure 4.2.5 with the ethanol extract of the root bark (Figure
4.2.5 c) and aqueous extract of the leaves (Figure 4.2.5 a) showing the highest activity. This was also
reflected in their lower IC50 values (Table 4.2.2).
There was a significant (p < 0.05) reduction in SOD activity upon induction of oxidative injury by
Fe2+ (Figure 4.2.5 d-f). However, treatment with different doses of the extracts led to remarkably
increased SOD activities. The ethanol extracts of the stem and root bark, and the aqueous extract of
the root bark showed the highest activities.

104
Figure 4.2.5: Catalase activities of a) leaves, b) stem bark and c) root bark extracts and SOD activities
of d) leaves, e) stem bark and f) root bark extracts of A. wilkesiana in oxidative pancreatic injury. Data are reported as mean ± SD of three replicas. *Significantly different from untreated sample and #Significantly different
from normal sample (p < 0.05, Tukey’s-HSD-multiple range post-hoc test, IBM SPSS for Windows). AA: Ascorbic acid
(Standard).
# # ## #
*
#*
* ** *
* ** *
*
# ## #
#
0
200
400
600
U/m
g p
rote
ina)
Ethyl Acetate Ethanol
Aqueous AA
# #
# ##
*
#
* ** * *
** *
* ** * * *
*
0
20
40
60
80
U/m
g p
rote
in
d)Ethyl Acetate Ethanol
Aqueous AA
# ## # *
*
# # # ## *
# # #* *
# ## #
*
0
200
400
600
U/m
g p
rote
in
b) Ethyl Acetate Ethanol
Aqueous AA
#
*#*# *#
*
*
#
*#*#
*
*
*
*# *#*
* ** *
* *
*
0
20
40
60
80
U/m
g p
rote
in
e)Ethyl Acetate Ethanol
Aqueous AA
# ## # #
*
## #
#*
*
# # #*
*
# ## #
#
0
200
400
600
U/m
g p
rote
in
c)Ethyl Acetate Ethanol
Aqueous AA
* **
* *
*
#
* * **
*
* * **
*
* ** *
*
0
20
40
60
80
U/m
g p
rote
in
f)Ethyl Acetate
Ethanol

105
The effect of Fe2+-induction of oxidative pancreatic injury on GSH level is depicted in Figure 4.2.6
(a-c). A noticeable increase in GSH levels was observed on treatment with the extracts as evident by
the low IC50 values (Table 4.2.2), the ethanol extract of the leaves showed the lowest IC50 values
compared to its counterparts and even lower than that of the standard, Ascorbic acid.
Figure 4.2.6: Effect of A. wilkesiana a) leaves, b) stem bark and c) root bark extracts on reduced
glutathione (GSH) level in oxidative pancreatic injury. Data are reported as mean ± SD of three replicas. *Significantly different from untreated sample and #Significantly different from normal sample (p < 0.05, Tukey’s-HSD-
multiple range post-hoc test, IBM SPSS for Windows). AA: ascorbic acid.

106
Table 4.2.2: IC50 values of various extracts of A. wilkesiana parts in different enzymatic ex vivo
models
Sample
IC50 Values (µg/ml)
Catalase SOD GSH
Leaves
Ethyl acetate 5.25±1.09d 17.96±9.83b 7.24±1.87d
Ethanol 2.28±0.03b 28.86±2.03d 1.72±4.93a
Aqueous 1.09±0.07a 23.91±0.89c 2.26±0.05a
Stem bark
Ethyl acetate 4.99±0.85cd 28.96±7.65cd 3.15.11±0.82b
Ethanol 1.61±0.14a 15.94±1.75b 9.36±3.86d
Aqueous 3.66±0.27c 11.98±3.9a 4.75±1.28c
Root bark
Ethyl acetate 17.25±5.83e 33.83±8.60d 5.95±1.13c
Ethanol 1.61±0.17a 14.86±1.52b 4.411±0.41a
Aqueous 5.09±0.04d 16.51±5.82b 2.03±1.05a
Standard
Ascorbic acid 19.71±8.76e 23.04±5.91c 3.05±1.06b
Data are reported as mean ± SD values of three replicas. a-e Different letters stand for significantly different values from one
another within a column (Tukey’s-HSD multiple range post hoc test, p < 0.05): the same letters stand for non-significant
difference. SOD: superoxide dismutase, GSH: reduced glutathione.
4.2.5 Discussion
The role and influence of oxidative stress in the pathogenesis and complications of diseases such as
cancer and diabetes has long been validated as essential to understand the impact, trend and possible
ways of alleviating their prevalence (Matough et al., 2012). The complications of these diseases arise
because of poor handling of free radicals by the body’s natural defence mechanism (Bajaj and Khan,
2012). Plants have been reported to have antioxidant activities, with polyphenolics playing a major
role in this regard (Sowndhararajan and Kang, 2013).
Figure 4.2.1 demonstrates the presence of total phenols in all extracts of the three parts of A.
wilkesiana (leaves, stem and root bark) which may be responsible for its potency and continuous use
in traditional medicine as an antibacterial, antidiuretic and anti-diabetic agent (Ikewuchi et al., 2010).

107
The mechanism of action of polyphenols can be attributed mainly to their structure which comprises
a hydroxyl group on an aromatic ring, a key factor to its radical scavenging and metal chelating
activities (Scherer and Godoy, 2014).
DPPH is a transient free radical which absorbs light maximally at 517 nm and can become stable by
accepting an electron. This odd electron on nitrogen can be reduced by a donation of a hydrogen atom
from an antioxidant to form a hydrazine complex. The DPPH assay is a quick and inexpensive method
to determine the ability of compounds to act as free radical scavengers or hydrogen donors (Kedare
and Singh, 2011). Using this model, the ethanol extracts of A. wilkesiana demonstrated valuable
DPPH scavenging abilities, as expressed by their low IC50 values shown in Table 4.2.1.
The hydroxyl radical is the second most deleterious and most biologically free radical. It is formed
because of continuous reduction of oxygen to water. The first step in its formation is the reduction of
Fe3+ to Fe2+ which is then closely followed by the Fenton reaction (Lipinski, 2011). This makes it
easy to understand that an accumulation of iron in the body can lead to excessive generation of free
radicals and ultimately progressive complications of diseases such as atherosclerosis, age related
diseases and diabetes (Altamura and Muckenthaler, 2009; Brewer, 2007; Ramakrishna et al., 2003).
Widely known polyphenols such as curcumin, resveratrol and ferulic acid have been shown to have
hydroxyl radical scavenging activity and this action is executed through oxidation of aromatic
compounds (Kulling and Rawel, 2008; Lipinski, 2011).
The observed potent hydroxyl radical scavenging activities of A. wilkesiana (Figure 4.2.4 d-f) can
be attributed to the high phenolic content Figure 4.2.1. This may also be responsible for the observed
high reducing power of the extracts (Figure 4.2.4). This corresponds to reports on the positive
correlation of high total phenolic content and high reducing power activities by plant extracts (Anahita
et al., 2015; Hossain and Shah, 2015). The highest reducing power of Fe3+ was demonstrated by the
ethanol extracts and this shows the capability of ethanol in extracting potent free radical scavengers.
NO is a relatively small and lipophilic molecule which acts continuously with superoxide anion
radical (O2.-) to produce peroxynitrite (ONOO-) a very strong oxidant capable of attacking a wide
range of biological molecules (Nimse and Pal, 2015). When the amount of NO exceeds that of the
superoxide anion, it can act as an effector molecule in the defence against cancer cells and bacteria
and inhibit lipid peroxidation by the formation of nitrated lipid radical inhibitors thereby protecting
the lipid bilayer from peroxides (Rapozzi et al., 2015). However, oxidant metabolites of NO. such as
ONOO- are capable of deleterious actions by depleting enzymatic antioxidants such as glutathione
108
and ascorbic acid (Bloodsworth et al., 2000). Interestingly, extracts of A. wilkesiana showed
significant inhibition of nitric oxide (Table 4.2.1). The ethanol extract of the root bark had the lowest
IC50 values and showed the highest inhibition. This indicates potent antioxidant and free radical
scavenging activity.
The pancreas, liver and other organs play major roles in the activities of some endogenous antioxidant
enzymes such as catalase, superoxide dismutase (SOD) and glutathione peroxidase (GPx), which
converts the tripeptide glutathione (GSH) into oxidized glutathione (GSSG) and in the process,
reduces H2O2 to H2O and lipid hydroperoxides (Bhattacharyya et al., 2014). Catalase converts
hydrogen peroxide (H2O2); a major precursor in the formation of free radicals into water and oxygen.
SOD is a first line action against free radicals and catalyses the breakdown of superoxide into oxygen
and peroxide (Asmat et al., 2016). GSH catalyses the conversion of peroxides to water thereby
converting glutathione disulphide back into glutathione (Githens, 1991). Oxidative stress occurs due
to the insensitivity or reduced quantity of these enzymes in the organs particularly in the pancreas
since it is a major site for metabolism and insulin production. High intracellular levels of these
enzymes cushion the effect of oxidative stress (Githens, 1991; Yeh and Yen, 2006). From the results,
there was reduction in catalase and SOD activities indicating an occurrence of oxidative stress in the
untreated groups (refer to Figure 4.2.5). Treatment with the extracts, especially the ethanol and
aqueous extracts of both the leaves and the root bark led to remarkable increase in catalase activity
(Figure 4.2.5 a-c), thus indicating the antioxidant potential of this plant. SOD activities were also
found to increase upon treatment with different doses of the extracts with the ethanol extracts of both
the stem and root barks showing high potentials (Figure 5 d-f). The ethanol extract of the root bark
increased the GSH levels as compared with the depleted levels of the untreated groups (Figure 4.2.6).
This can be attributed to the high phenolic content and high ferric reducing ability of the ethanol root
bark of this plant as seen in Figure 4.2.1 and 4.2.4 (a-c).
4.2.6 Conclusion
The existence of free radical scavenging and oxidative stress ameliorating compounds in A.
wilkesiana has been established in this study. These results indicate that no part of A. wilkesiana is a
waste as all its parts have been demonstrated to possess rich antioxidant activities which gives
antecedence to its use in folk medicine. These findings specifically portray the ethanol extract of the
root bark as the most capable of modulating oxidative stress. Further research will entail bioassay
guided fractionation and in vivo experiments to further establish the potentials of this plant in drug
discovery.
109
4.3 Acalypha wilkesiana ‘Java white’: Identification of some bioactive compounds by
GC-MS and effects on key enzymes linked to type 2 diabetes
1Olajumoke A. Oyebode, 1Ochuko L. Erukainure, 2Neil A. Koorbanally, 1Md. Shahidul Islam*
1 Department of Biochemistry, 2 School of Chemistry and Physics, University of KwaZulu-Natal,
(Westville Campus), Durban 4000, South Africa
*Correspondence; [email protected]
Preface: This article has been published in Acta Pharmaceutica journal.
4.3.1 Abstract
In this study, we identified bioactive compounds from the ethanol extracts of the leaves, stem and
root bark of Acalypha wilkesiana through GC-MS analysis and investigated the effects of these
extracts on some of the enzymes linked to type 2 diabetes. Plant parts were extracted sequentially
with ethyl acetate, ethanol and water. GC-MS analysis revealed the presence of long chain alkyl acids,
esters, ketones and alcohols including phytol and phytol acetate along with some secondary
metabolites such as xanthone, vitamin E and various types of sterols including stigmasterol,
campesterol and sitosterol. Ethanolic extracts of all the parts showed a dose-dependent inhibition of
-glucosidase and -amylase activity. The extracts also demonstrated anti-lipase activity. The
ethanolic extract of the root bark showed the highest inhibition of enzymes compared to other extracts.
The EC50 values (concentration for 50% inhibition) of α-glucosidase, α-amylase and lipase inhibition
were 35.75±1.95, 6.25±1.05 and 101.33±5.21 µg/mL, respectively. This study suggests that A.
wilkesiana ethanolic extracts have the ability to inhibit the activity of enzymes linked to type 2
diabetes. Further studies are needed to confirm the responsible bioactive compounds in this regard.
Keywords: Acalypha wilkesiana, α-glucosidase, α-amylase, lipase, type 2 diabetes, ethanolic extract
4.3.2 Introduction
Diabetes has gradually become a major health concern in both developed and developing countries,
while controlling hyperglycaemia is one of the major challenges in the management of this disease
(IDF, 2017). Apart from hyperglycaemia, almost 50% of diabetic patients suffer from at least one or
two diabetic complications such as diabetic retinopathy, cardiomyopathy, nephropathy, neuropathy
and lower limb amputations, which are more noticeable in elderly patients (Roglic, 2016).

110
Approximately 108 million people were diagnosed with diabetes in 1980, which has increased to 422
million in 2014, with a projected increase to 642 million by the year of 2030 (Roglic, 2016).
Diabetes is a metabolic disorder caused by deficiency of insulin secretion by the pancreatic beta-cells
(type 1), insulin insensitivity, and partial pancreatic beta-cell malfunction (type 2) (Lakshmi et al.,
2012). Type 2 diabetes (T2D) is the most prevalent form of diabetes and occurs due to the insensitivity
of insulin to postprandial glucose overload which causes persistent hyperglycaemia (Al-Goblan et al.,
2014). The spread of this disease has been linked to societal and cultural changes in diet and lifestyle
which could lead to obesity, a major risk factor for the rapidly rising prevalence of T2D (Tobias et
al., 2014). Obesity as a result of abdominal fat deposit may lead to sustained insulin resistance in
obesity related T2D (Levelt et al., 2016). Controlling hyperglycaemia is a major challenge in the
management of T2D.
A number of conventional drugs such as sulfonylureas, biguanides and α-glucosidase inhibitors are
currently being used for the management of hyperglycaemia as well as T2D. α-glucosidase is linked
to the breakdown of disaccharides and starch into glucose and α-amylase breakdowns long-chain
carbohydrates into glucose (Kumar et al., 2011). Inhibition of α-glucosidase and α-amylase is one of
the key targets in the discovery of potential drugs for the treatment of T2D via reducing small
intestinal glucose absorption (Yilmazer-Musa et al., 2012). However, high cost and numerous side-
effects of these synthetic drugs has led to the exploration of some alternative therapies in alleviating
T2D (Safavi et al., 2013). Additionally, the side-effects including nausea, diarrhoea (commonly seen
in patients on metformin), hypoglycaemia, weight gain (sulfonylureas), increased risk of heart failures
and bone fractures (thiazolidinediones) (Wu et al., 2016) led to the search for alternative therapies,
particularly from medicinal plants. Medicinal plants are found in abundance in all over the world
including Africa and have been reported to be rich in bioactive phenolics which can be used to treat
diverse diseases (Bahadoran et al., 2013) including T2D.
Acalypha wilkesiana ‘Java white’ is a member of the spurge family (Euphorbiaceae). It is a tropical
and subtropical evergreen shrub with greenish yellow to white dotted green leaves mottled with
irregular green spots. It grows in various parts of Africa but native to South Pacific islands. In western
Nigeria, a boiled decoction of the leaves of A. wilkesiana Müll. Arg. is used in the treatment of fungal
infections seen in new-borns, and also against hypertension and diabetes mellitus in adults (Olukunle
et al., 2016). The leaves of this plant also possess anti-inflammatory, anti-microbial and anti-pyretic
activities (Ikewuchi et al., 2011). Although some hypoglycaemic, anti-diabetic and hypolipidemic
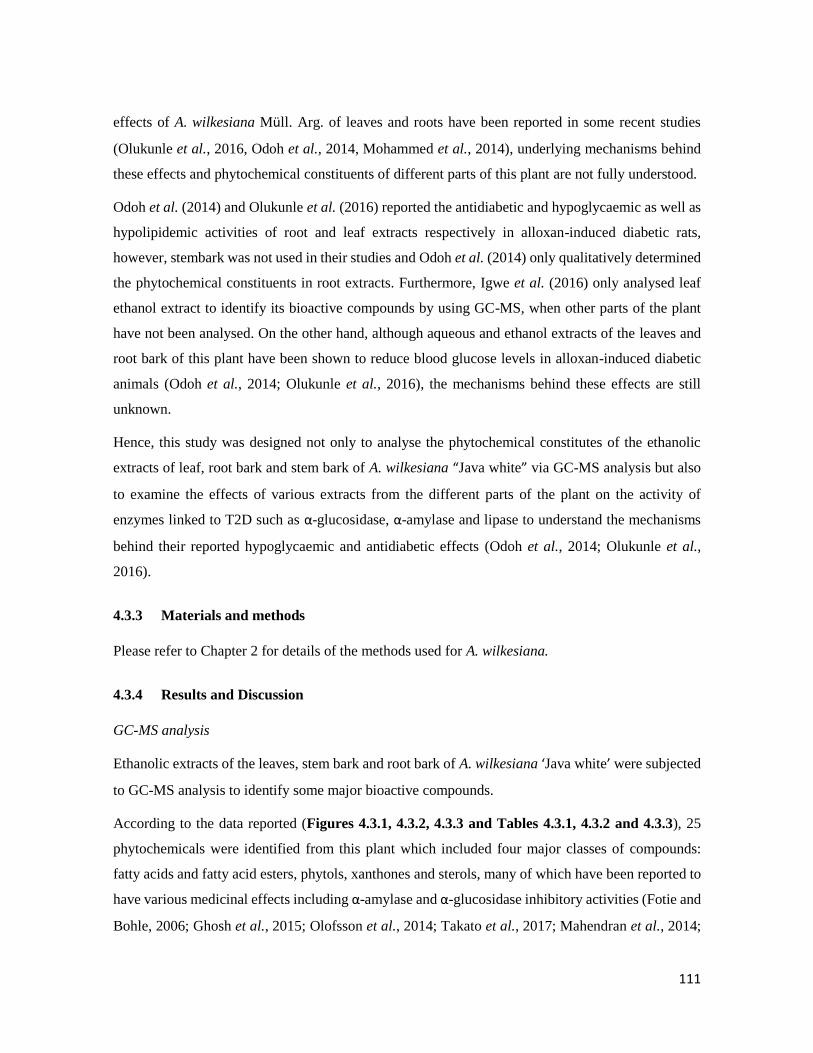
111
effects of A. wilkesiana Müll. Arg. of leaves and roots have been reported in some recent studies
(Olukunle et al., 2016, Odoh et al., 2014, Mohammed et al., 2014), underlying mechanisms behind
these effects and phytochemical constituents of different parts of this plant are not fully understood.
Odoh et al. (2014) and Olukunle et al. (2016) reported the antidiabetic and hypoglycaemic as well as
hypolipidemic activities of root and leaf extracts respectively in alloxan-induced diabetic rats,
however, stembark was not used in their studies and Odoh et al. (2014) only qualitatively determined
the phytochemical constituents in root extracts. Furthermore, Igwe et al. (2016) only analysed leaf
ethanol extract to identify its bioactive compounds by using GC-MS, when other parts of the plant
have not been analysed. On the other hand, although aqueous and ethanol extracts of the leaves and
root bark of this plant have been shown to reduce blood glucose levels in alloxan-induced diabetic
animals (Odoh et al., 2014; Olukunle et al., 2016), the mechanisms behind these effects are still
unknown.
Hence, this study was designed not only to analyse the phytochemical constitutes of the ethanolic
extracts of leaf, root bark and stem bark of A. wilkesiana “Java white” via GC-MS analysis but also
to examine the effects of various extracts from the different parts of the plant on the activity of
enzymes linked to T2D such as α-glucosidase, α-amylase and lipase to understand the mechanisms
behind their reported hypoglycaemic and antidiabetic effects (Odoh et al., 2014; Olukunle et al.,
2016).
4.3.3 Materials and methods
Please refer to Chapter 2 for details of the methods used for A. wilkesiana.
4.3.4 Results and Discussion
GC-MS analysis
Ethanolic extracts of the leaves, stem bark and root bark of A. wilkesiana ‘Java white’ were subjected
to GC-MS analysis to identify some major bioactive compounds.
According to the data reported (Figures 4.3.1, 4.3.2, 4.3.3 and Tables 4.3.1, 4.3.2 and 4.3.3), 25
phytochemicals were identified from this plant which included four major classes of compounds:
fatty acids and fatty acid esters, phytols, xanthones and sterols, many of which have been reported to
have various medicinal effects including α-amylase and α-glucosidase inhibitory activities (Fotie and
Bohle, 2006; Ghosh et al., 2015; Olofsson et al., 2014; Takato et al., 2017; Mahendran et al., 2014;

112
Mahammed et al., 2015; Luo et al., 2014). Additionally, EC50 or the maximum concentration required
for 50% inhibition of enzyme activity was also calculated for different extracts from each part of the
plant for different enzymes and reported in Table 4.3.4.
Figure 4.3.1: Long chain alkyl acids, esters, ketones and alcohols identified from the ethanolic
extract of the leaves, stem bark and root bark of A. wilkesiana.

113
Figure 4.3.2: Aromatics, sterols and triterpenes identified in the ethanolic extract of leaves, stem and
root bark of A. wilkesiana.
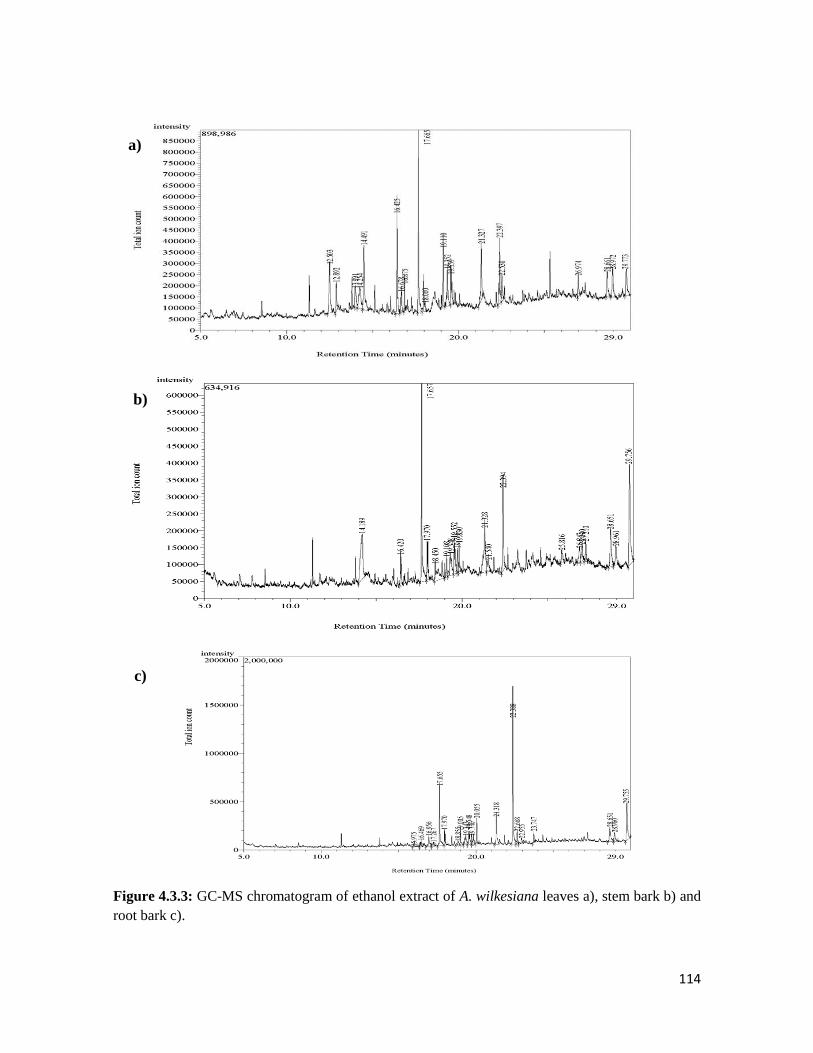
114
Figure 4.3.3: GC-MS chromatogram of ethanol extract of A. wilkesiana leaves a), stem bark b) and
root bark c).
a)
b)
c)
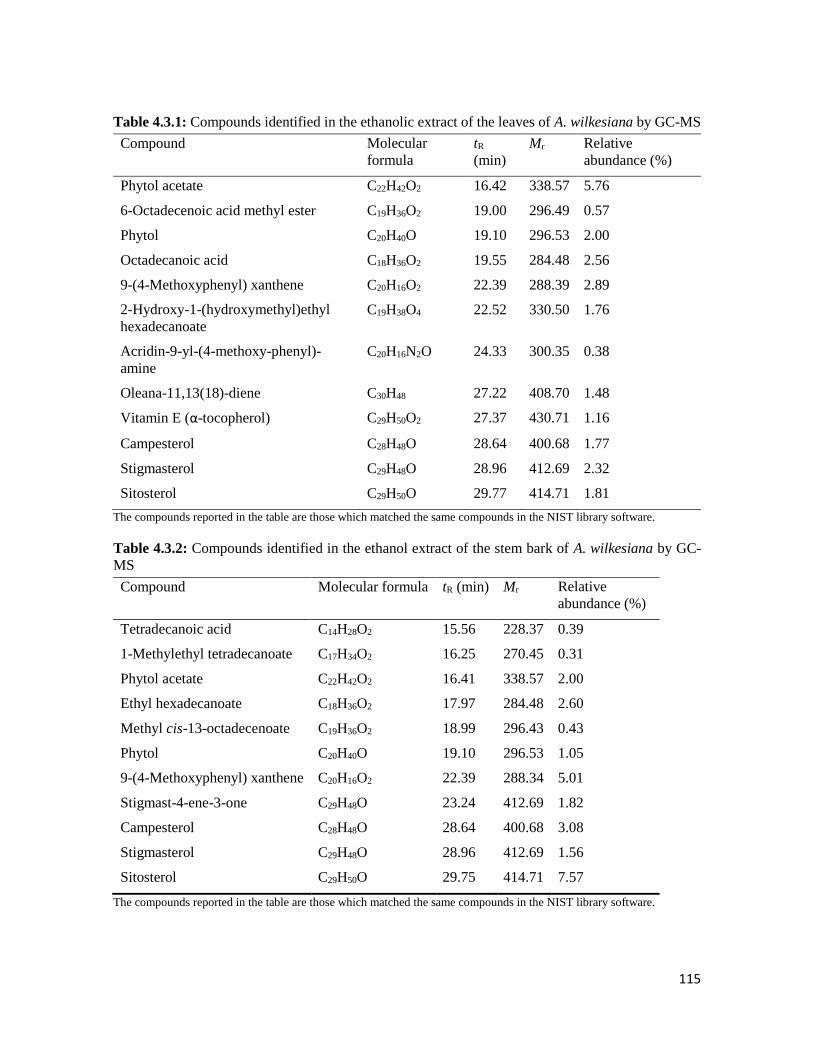
115
Table 4.3.1: Compounds identified in the ethanolic extract of the leaves of A. wilkesiana by GC-MS
Compound Molecular
formula
tR
(min)
Mr Relative
abundance (%)
Phytol acetate C22H42O2 16.42 338.57 5.76
6-Octadecenoic acid methyl ester C19H36O2 19.00 296.49 0.57
Phytol C20H40O 19.10 296.53 2.00
Octadecanoic acid C18H36O2 19.55 284.48 2.56
9-(4-Methoxyphenyl) xanthene C20H16O2 22.39 288.39 2.89
2-Hydroxy-1-(hydroxymethyl)ethyl
hexadecanoate
C19H38O4 22.52 330.50 1.76
Acridin-9-yl-(4-methoxy-phenyl)-
amine
C20H16N2O 24.33 300.35 0.38
Oleana-11,13(18)-diene C30H48 27.22 408.70 1.48
Vitamin E (α-tocopherol) C29H50O2 27.37 430.71 1.16
Campesterol C28H48O 28.64 400.68 1.77
Stigmasterol C29H48O 28.96 412.69 2.32
Sitosterol C29H50O 29.77 414.71 1.81
The compounds reported in the table are those which matched the same compounds in the NIST library software.
Table 4.3.2: Compounds identified in the ethanol extract of the stem bark of A. wilkesiana by GC-
MS
Compound Molecular formula tR (min) Mr Relative
abundance (%)
Tetradecanoic acid C14H28O2 15.56 228.37 0.39
1-Methylethyl tetradecanoate C17H34O2 16.25 270.45 0.31
Phytol acetate C22H42O2 16.41 338.57 2.00
Ethyl hexadecanoate C18H36O2 17.97 284.48 2.60
Methyl cis-13-octadecenoate C19H36O2 18.99 296.43 0.43
Phytol C20H40O 19.10 296.53 1.05
9-(4-Methoxyphenyl) xanthene C20H16O2 22.39 288.34 5.01
Stigmast-4-ene-3-one C29H48O 23.24 412.69 1.82
Campesterol C28H48O 28.64 400.68 3.08
Stigmasterol C29H48O 28.96 412.69 1.56
Sitosterol C29H50O 29.75 414.71 7.57
The compounds reported in the table are those which matched the same compounds in the NIST library software.
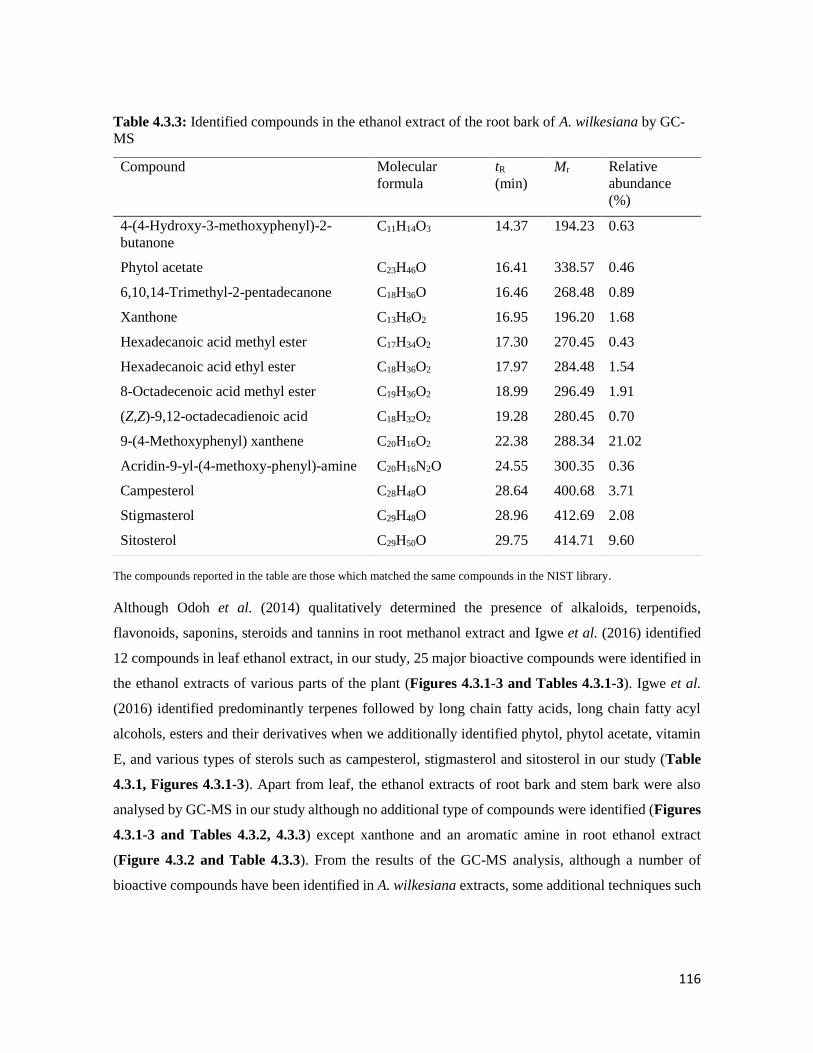
116
Table 4.3.3: Identified compounds in the ethanol extract of the root bark of A. wilkesiana by GC-
MS
The compounds reported in the table are those which matched the same compounds in the NIST library.
Although Odoh et al. (2014) qualitatively determined the presence of alkaloids, terpenoids,
flavonoids, saponins, steroids and tannins in root methanol extract and Igwe et al. (2016) identified
12 compounds in leaf ethanol extract, in our study, 25 major bioactive compounds were identified in
the ethanol extracts of various parts of the plant (Figures 4.3.1-3 and Tables 4.3.1-3). Igwe et al.
(2016) identified predominantly terpenes followed by long chain fatty acids, long chain fatty acyl
alcohols, esters and their derivatives when we additionally identified phytol, phytol acetate, vitamin
E, and various types of sterols such as campesterol, stigmasterol and sitosterol in our study (Table
4.3.1, Figures 4.3.1-3). Apart from leaf, the ethanol extracts of root bark and stem bark were also
analysed by GC-MS in our study although no additional type of compounds were identified (Figures
4.3.1-3 and Tables 4.3.2, 4.3.3) except xanthone and an aromatic amine in root ethanol extract
(Figure 4.3.2 and Table 4.3.3). From the results of the GC-MS analysis, although a number of
bioactive compounds have been identified in A. wilkesiana extracts, some additional techniques such
Compound Molecular
formula
tR
(min)
Mr Relative
abundance
(%)
4-(4-Hydroxy-3-methoxyphenyl)-2-
butanone
C11H14O3 14.37 194.23 0.63
Phytol acetate C23H46O 16.41 338.57 0.46
6,10,14-Trimethyl-2-pentadecanone C18H36O 16.46 268.48 0.89
Xanthone C13H8O2 16.95 196.20 1.68
Hexadecanoic acid methyl ester C17H34O2 17.30 270.45 0.43
Hexadecanoic acid ethyl ester C18H36O2 17.97 284.48 1.54
8-Octadecenoic acid methyl ester C19H36O2 18.99 296.49 1.91
(Z,Z)-9,12-octadecadienoic acid C18H32O2 19.28 280.45 0.70
9-(4-Methoxyphenyl) xanthene C20H16O2 22.38 288.34 21.02
Acridin-9-yl-(4-methoxy-phenyl)-amine C20H16N2O 24.55 300.35 0.36
Campesterol C28H48O 28.64 400.68 3.71
Stigmasterol C29H48O 28.96 412.69 2.08
Sitosterol C29H50O 29.75 414.71 9.60
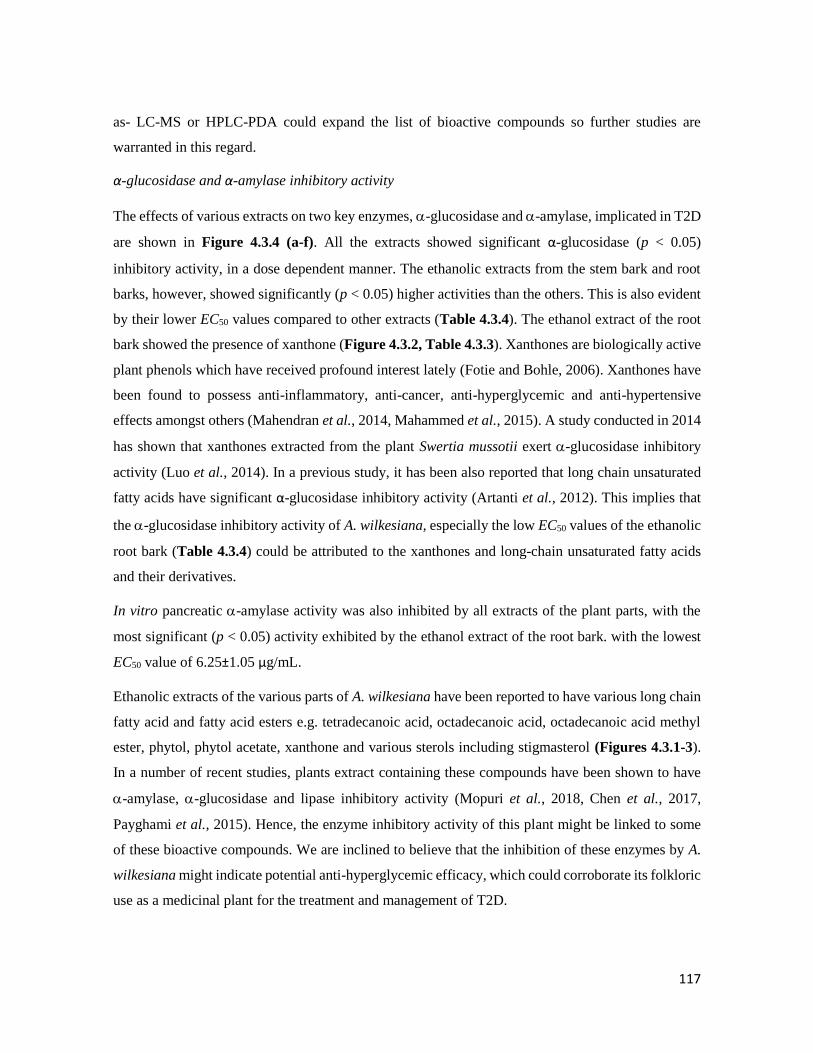
117
as- LC-MS or HPLC-PDA could expand the list of bioactive compounds so further studies are
warranted in this regard.
α-glucosidase and α-amylase inhibitory activity
The effects of various extracts on two key enzymes, -glucosidase and -amylase, implicated in T2D
are shown in Figure 4.3.4 (a-f). All the extracts showed significant α-glucosidase (p < 0.05)
inhibitory activity, in a dose dependent manner. The ethanolic extracts from the stem bark and root
barks, however, showed significantly (p < 0.05) higher activities than the others. This is also evident
by their lower EC50 values compared to other extracts (Table 4.3.4). The ethanol extract of the root
bark showed the presence of xanthone (Figure 4.3.2, Table 4.3.3). Xanthones are biologically active
plant phenols which have received profound interest lately (Fotie and Bohle, 2006). Xanthones have
been found to possess anti-inflammatory, anti-cancer, anti-hyperglycemic and anti-hypertensive
effects amongst others (Mahendran et al., 2014, Mahammed et al., 2015). A study conducted in 2014
has shown that xanthones extracted from the plant Swertia mussotii exert -glucosidase inhibitory
activity (Luo et al., 2014). In a previous study, it has been also reported that long chain unsaturated
fatty acids have significant α-glucosidase inhibitory activity (Artanti et al., 2012). This implies that
the -glucosidase inhibitory activity of A. wilkesiana, especially the low EC50 values of the ethanolic
root bark (Table 4.3.4) could be attributed to the xanthones and long-chain unsaturated fatty acids
and their derivatives.
In vitro pancreatic -amylase activity was also inhibited by all extracts of the plant parts, with the
most significant (p < 0.05) activity exhibited by the ethanol extract of the root bark. with the lowest
EC50 value of 6.25±1.05 µg/mL.
Ethanolic extracts of the various parts of A. wilkesiana have been reported to have various long chain
fatty acid and fatty acid esters e.g. tetradecanoic acid, octadecanoic acid, octadecanoic acid methyl
ester, phytol, phytol acetate, xanthone and various sterols including stigmasterol (Figures 4.3.1-3).
In a number of recent studies, plants extract containing these compounds have been shown to have
-amylase, -glucosidase and lipase inhibitory activity (Mopuri et al., 2018, Chen et al., 2017,
Payghami et al., 2015). Hence, the enzyme inhibitory activity of this plant might be linked to some
of these bioactive compounds. We are inclined to believe that the inhibition of these enzymes by A.
wilkesiana might indicate potential anti-hyperglycemic efficacy, which could corroborate its folkloric
use as a medicinal plant for the treatment and management of T2D.
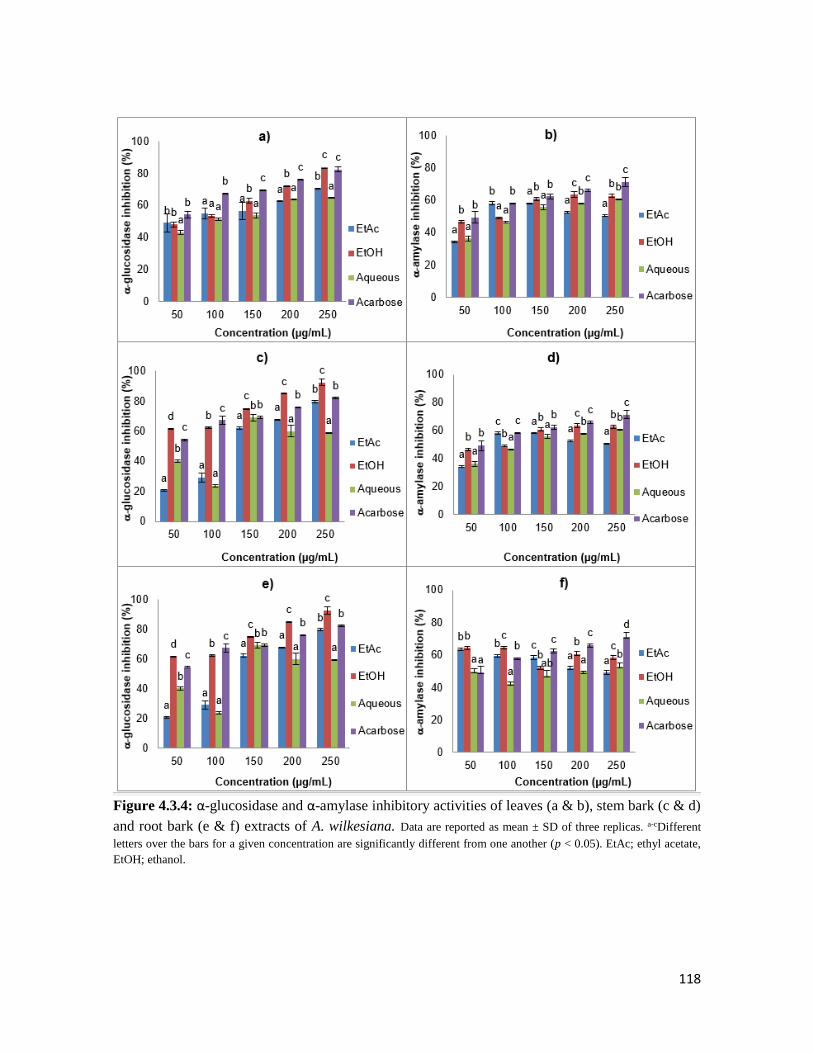
118
Figure 4.3.4: α-glucosidase and α-amylase inhibitory activities of leaves (a & b), stem bark (c & d)
and root bark (e & f) extracts of A. wilkesiana. Data are reported as mean ± SD of three replicas. a-cDifferent
letters over the bars for a given concentration are significantly different from one another (p < 0.05). EtAc; ethyl acetate,
EtOH; ethanol.
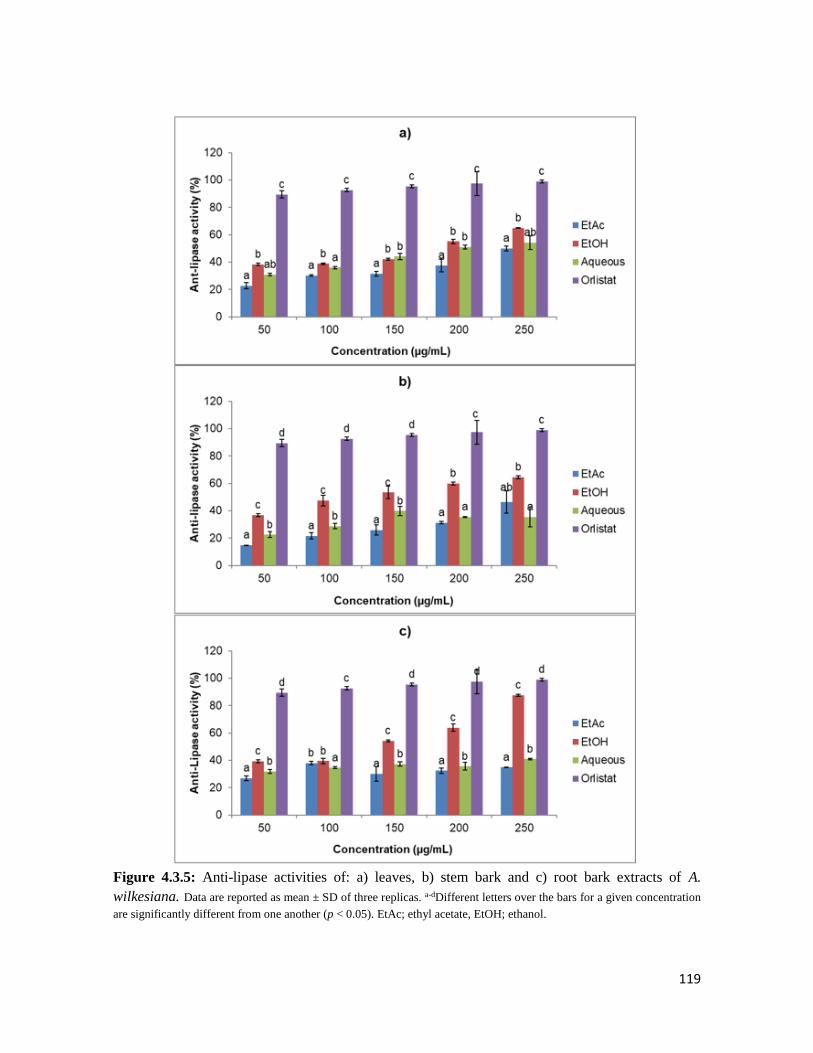
119
Figure 4.3.5: Anti-lipase activities of: a) leaves, b) stem bark and c) root bark extracts of A.
wilkesiana. Data are reported as mean ± SD of three replicas. a-dDifferent letters over the bars for a given concentration
are significantly different from one another (p < 0.05). EtAc; ethyl acetate, EtOH; ethanol.
120
Table 4.3.4: EC50 values of various extracts of A. wilkesiana parts in inhibiting α-
glucosidase, α-amylase and lipase activities
Sample
EC50 (µg/mL)
α-glucosidase α-amylase Lipase
Leaves
Ethyl acetate 74.63±2.87b 296.18±37.18f 384.55±23.84e
Ethanol 67.18±7.65b 75.35±8.25c 149.70±8.34c
Aqueous 88.35±15.37c 118.9±19.3de 203.71±1.82d
Stem bark
Ethyl acetate 242.99±41.83e 274.55±31.09f 146.88±19.84c
Ethanol 37.10±2.71a >1000g 113.38±18.23b
Aqueous 267.94±24.90e >1000g 894.61±36.28f
Root bark
Ethyl acetate 124.04±16.72d 98.65±15.11d >1000f
Ethanol 35.75±1.95a 6.25±1.05a 101.33±5.21b
Aqueous 127.25±23.60d 151.04±12.59e >1000e
Standard
Acarbose 36.27±1.84 53.77±3.95 ND
Orlistat ND ND 0.03
Data are reported as mean ± SD values of three replicas. a-gDifferent superscripts in a column for a given parameter denote
significant difference from one another; p < 0.05. EC50 - the minimum extract concentration required for 50 % inhibition,
ND - not determined. Due to the difference between the extracts (mixture of many compounds) and standard (pure
compound) their values cannot be compared with one another.
Pancreatic lipase inhibitory activity
Results given in Figure 4.3.5 (a-c) show the inhibitory potential of the extracts of all parts for
pancreatic lipase activity, thus demonstrating potential anti-obesogenic activity, with the best activity
exhibited by the ethanol extract of the root bark (EC50: 101.33±5.21 µg mL-1).
Overweight and obesity are responsible for causing insulin resistance, one of the two major
pathogenesis ways of T2D (Wing et al., 2011). On the other hand, the most popular screening method
in the discovery of anti-obesogenic drugs is to identify potent lipase inhibitors (Ado et al., 2013).
121
Hence, one of our objectives was to examine the ability of the plant extracts to inhibit lipase. Ethanolic
and aqueous extracts of the leaves have been reported to have serum triglycerides lowering abilities
(Omage et al., 2018). This might be due to their reducing small intestinal absorption of dietary lipids
via inhibiting lipase activity. The pancreatic lipase inhibitory activity displayed by the ethanolic
extract of the root bark (Figure 4.3.5 c) with considerably low EC50 values (Table IV) could further
support the potential of A. wilkesiana for the management of T2D and its associated risk factors such
as overweight and obesity.
4.3.5 Conclusions
The presence of potentially bioactive compounds in A. wilkesiana exerting carbohydrates and lipids
digesting enzymes inhibitory effects is suggested in this study. These results indicate that no part of
A. wilkesiana is a waste since it could contain potent inhibitory activities against some key enzymes
linked to diabetes and obesity, which also gives antecedence to its use in folk medicine. These
findings specifically point out the ethanolic extract of the stem bark and root bark as the more active
extracts compared to the leaf extracts. Although a number of bioactive compounds have been
identified in A. wilkesiana extracts by GC-MS analysis, some additional techniques such as LC-MS
or HPLC-PDA could expand the list of bioactive compounds, so further studies are warranted in this
regard.

122
THE ANTIOXIDANT AND ANTIDIABETIC ACTIVITIES OF
CRASSOCEPHALUM RUBENS IN VITRO AND IN VIVO
5.1 Background
Crassocephalum rubens Juss. ex Jacq. is an erect annual aromatic shrub (traditional leafy vegetable)
growing up to 1 m in height, it belongs to the family Asteraceae. The plant is cultivated in western
tropical Africa as a vegetable it is commonly eaten in parts of Africa like Nigeria and Benin republic
and falls under the under-utilized and neglected plants (Dansi et al., 2012). It is usually found in areas
with an annual rainfall of 1000-1600 mm and openly distributed in lowlands. The leaves are
mucilaginous in nature and they are eaten raw or cooked in some parts of Africa (Cameroon and
Nigeria) (Dansi et al., 2008, Yehouenou et al., 2010).
Figure 5.1: Crassocephalum rubens English name: Ragweed, Nigerian names: Ebire, Ebolo, Gbolo
Photo credit: Adjatin et al. (2013b).

123
5.1.1 Ethnobotanical uses
The leaves can be used to treat liver problems as a laxative and provided to women before or during
childbirth to ease labour pains (Burkill and Dalziel, 1985). Skin burns can be treated using a poultice
made from the leaves. The sap from the leaves has anti-parasitic and analgesic properties. A trace
presence of alkaloids has been discovered in the leaves. The powdered root has been used for the
treatment of breast cancer externally. It is also used as a nutraceutical as it is believed to have
antibiotic, anti-inflammatory, anthelminthic, anti-diabetic, antimalaria and blood purifying
properties. The leaves are eaten to manage indigestion, colds and intestinal worms (Dansi et al.,
2012).
5.1.2 Biological activities
The fresh leaves of C. rubens has been reported to contain essential oils which have antimicrobial
properties and inhibitory effects on food borne pathogenic microorganisms (Yehouenou et al., 2010).
The phytochemical analysis of the leaves of C. rubens showed the presence of coumarins, tannins,
mucilage, flavonoids and other reducing compounds (Adjatin et al., 2012). The aqueous extract of
the leaves of this plant has also been shown to possess hepatoprotective abilities in a study where co-
administration of rifampicin with 300 mg/kg body weight of the extract alleviated oxidative stress in
the liver considerably (Omoregie et al., 2015). Another study also reported the hepatoprotective effect
of C. rubens in carbon tetrachloride-induced hepatic damage (Olusola et al., 2015). The β-cell
protective and antidiabetic activity of C. crepidioides (also a member of the Asteraceae family) has
been reported (Bahar et al., 2017) but there is a dearth of information on the antidiabetic activity of
C. rubens.
124
5.2 Crassocephalum rubens, a leafy vegetable suppresses oxidative pancreatic and
hepatic injury, and inhibits key enzymes linked to type 2 diabetes in vitro, ex vivo
and in silico
1Olajumoke A. Oyebode, 1Ochuko L. Erukainure, 2Neil A. Koorbanally, 1Md. Shahidul Islam*
1 Department of Biochemistry, 2 School of Chemistry and Physics University of KwaZulu-Natal,
(Westville Campus), Durban 4000, South Africa.
*Corresponding author: [email protected]; Tel: +27 (0)31-260-8717; Fax: +27 (0)31-260-7942
Preface: This article reports the detailed in vitro antioxidant and anti-diabetic effects of the crude
extracts from C. rubens, which is currently under review in the Journal of Food Biochemistry.
5.2.1 Abstract
Crassocephalum rubens is a shrub that falls under the wild, underutilized and under cultivated
traditional leafy vegetables (TLV) in Africa. It is eaten by few (old aged people) in the management
of symptoms of diabetes mellitus. This study was undertaken to examine the in vitro, ex vivo
antioxidant and antidiabetic potential of different extracts of C. rubens. The ferric reducing
antioxidant power (FRAP), DPPH and NO (nitric oxide) scavenging activity as well as α-glucosidase
and pancreatic lipase inhibitory potentials of the extracts were examined in vitro. Also, the
ameliorative effects of the extracts on Fe2+-induced oxidative injury was investigated ex vivo together
with the effects of the aqueous extract on intestinal glucose absorption and muscle glucose uptake in
freshly harvested tissues from normal rats. The aqueous extract was further subjected to Liquid
Chromatography-Mass Spectrometry (LC-MS) analysis to identify the possible bioactive compounds.
The extracts showed potent free radical scavenging and antioxidant activities, while ethanol and
aqueous extracts showed better effects compared to others. The aqueous extract also significantly (p
< 0.05) inhibited α-glucosidase and lipase enzymes activity, intestinal glucose absorption and
enhanced muscle glucose uptake when compared to controls. The extract significantly (p < 0.05)
improved the activity of catalase, superoxide dismutase (SOD) and GSH levels in Fe2+-induced
oxidative injury as evident in concomitant reduction of lipid peroxidation ex vivo. The results of this
study suggest that the aqueous extract of C. rubens possess better antioxidant and anti-diabetic
potentials compared to other extracts which could be associated to some of its identified bioactive
compounds.
125
Keywords: Crassocephalum rubens, antioxidant, glucose absorption, glucose uptake, enzyme
inhibition
5.2.2 Introduction
Globally, the spread of diabetes mellitus cannot be underestimated; it currently affects over 425
million people and this number will experience an increase to over 600 million by the year 2045 (IDF,
2017). More than 16 million from this number are located in the African region (Roglic, 2016). This
increase has largely occurred due to a rapid increase in sedentary lifestyle and increased consumption
of junk foods which are responsible for the increase of central or visceral obesity, one of the major
risk factors of type 2 diabetes (Forouhi and Wareham, 2010).
Diabetes mellitus is a disease which occurs due to prolonged impaired insulin secretion (type 1) or
action (type 2) which then leads to hyperglycaemic (Kerner and Brückel, 2014). Type 2 diabetes
(T2D) is the most prevalent form (95%) of all diabetes types and is characterized mainly by loss of
insulin sensitivity (WHO, 2016), while partial pancreatic beta-cells dysfunction as well as lower
insulin secretion is the another major pathogenesis of T2D. These all lead to sustained
hyperglycaemic. Sustained hyperglycaemic leads to the generation of reactive oxygen species which
overburdens the antioxidant defence mechanism present in the body, resulting in oxidative stress
(Yan, 2014). Oxidative stress leads to deleterious consequences which affects the cell
macromolecules such as DNA, proteins and lipids. It has long been implicated in the development of
multiple complications such as diabetic nephropathy, retinopathy, neuropathy, and cardiomyopathy
(Asmat et al., 2016; Vikram et al., 2014).
Different treatment modalities are currently available for the management of T2D, but the
shortcomings and limitations of this approach has led to the search for alternative therapies with the
aim of reducing hyperglycemia (Kokil et al., 2015, Pandey et al., 2011). Traditional leafy vegetables
(TLV) are strongly consumed due to their high nutritional value and are mostly grown in the rural
areas. TLVs have recently started gaining recognition for the management and control of various
noncommunicable diseases including diabetes. These plants are rich in fibres, micronutrients such as
minerals and vitamins which can act as antioxidants (Adjatin et al., 2012; Wais et al., 2012; Yuan et
al., 2016). An example of such plant is Crassocephalum rubens.
C. rubens is an erect herb 30-70 cm in height. It belongs to the family Asteraceae and its common
English names include thickhead, fireweed, or regleaf while its local names are ebolo (Yoruba,
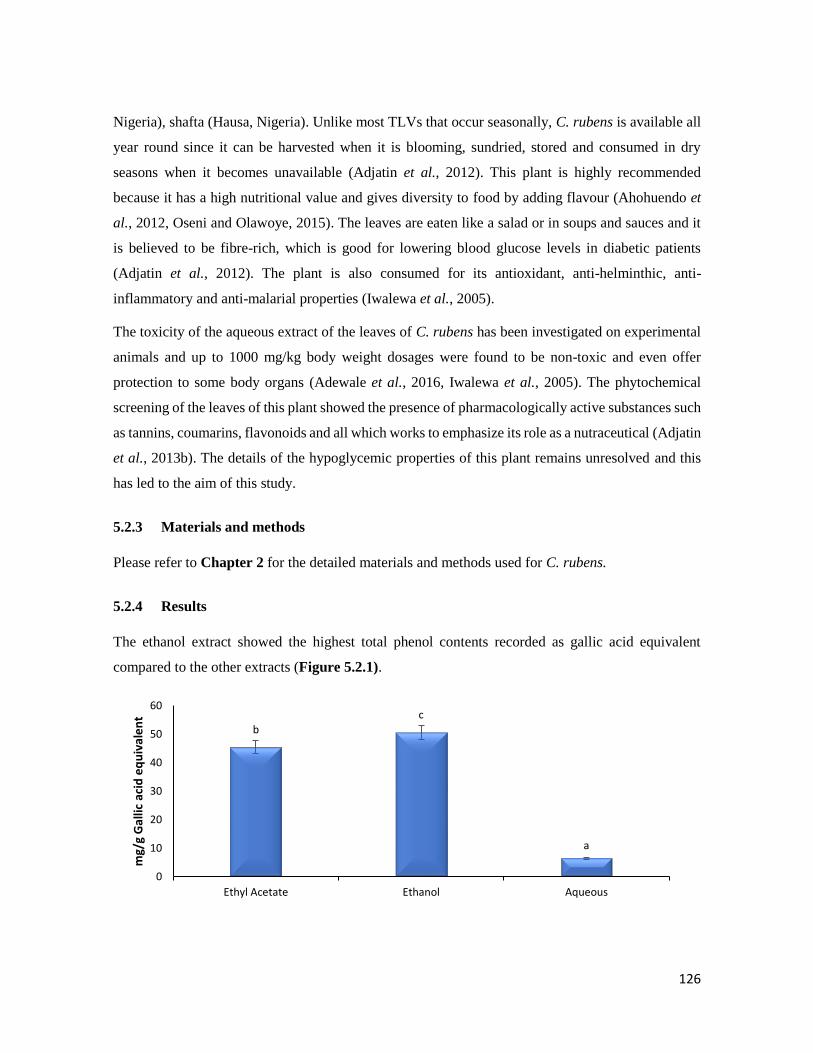
126
Nigeria), shafta (Hausa, Nigeria). Unlike most TLVs that occur seasonally, C. rubens is available all
year round since it can be harvested when it is blooming, sundried, stored and consumed in dry
seasons when it becomes unavailable (Adjatin et al., 2012). This plant is highly recommended
because it has a high nutritional value and gives diversity to food by adding flavour (Ahohuendo et
al., 2012, Oseni and Olawoye, 2015). The leaves are eaten like a salad or in soups and sauces and it
is believed to be fibre-rich, which is good for lowering blood glucose levels in diabetic patients
(Adjatin et al., 2012). The plant is also consumed for its antioxidant, anti-helminthic, anti-
inflammatory and anti-malarial properties (Iwalewa et al., 2005).
The toxicity of the aqueous extract of the leaves of C. rubens has been investigated on experimental
animals and up to 1000 mg/kg body weight dosages were found to be non-toxic and even offer
protection to some body organs (Adewale et al., 2016, Iwalewa et al., 2005). The phytochemical
screening of the leaves of this plant showed the presence of pharmacologically active substances such
as tannins, coumarins, flavonoids and all which works to emphasize its role as a nutraceutical (Adjatin
et al., 2013b). The details of the hypoglycemic properties of this plant remains unresolved and this
has led to the aim of this study.
5.2.3 Materials and methods
Please refer to Chapter 2 for the detailed materials and methods used for C. rubens.
5.2.4 Results
The ethanol extract showed the highest total phenol contents recorded as gallic acid equivalent
compared to the other extracts (Figure 5.2.1).
bc
a
0
10
20
30
40
50
60
Ethyl Acetate Ethanol Aqueous
mg/
g G
allic
aci
d e
qu
ival
en
t
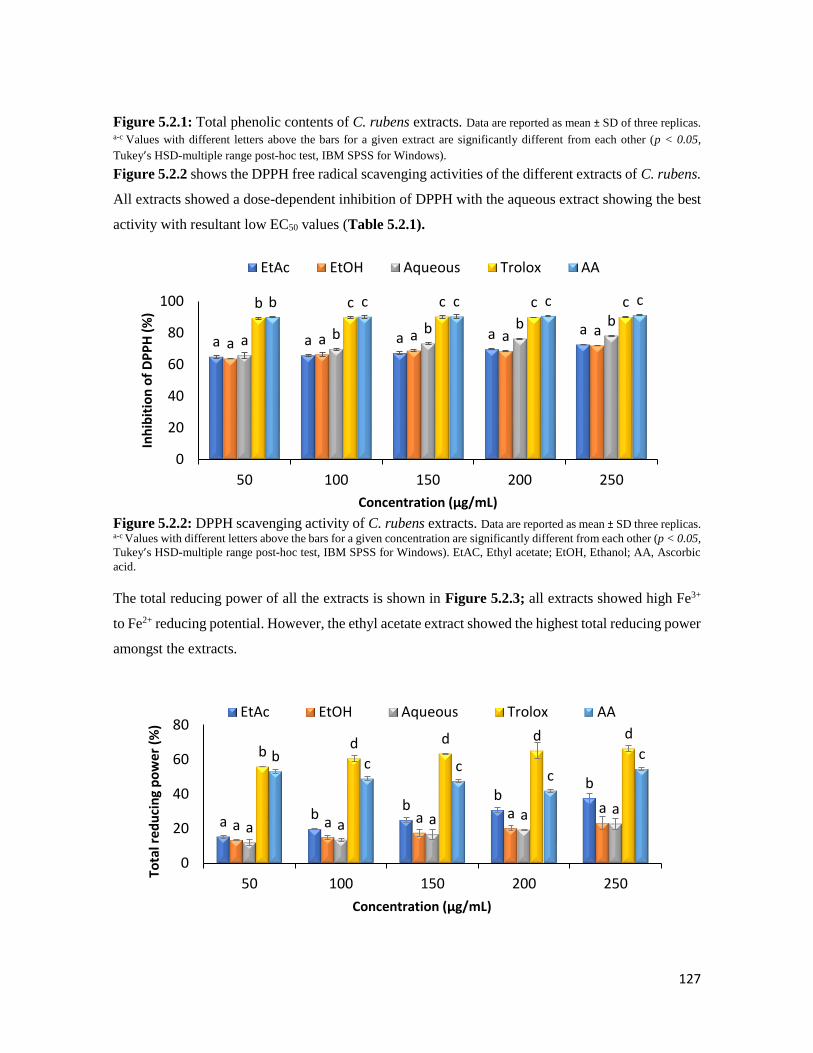
127
Figure 5.2.1: Total phenolic contents of C. rubens extracts. Data are reported as mean ± SD of three replicas. a-c Values with different letters above the bars for a given extract are significantly different from each other (p < 0.05,
Tukey’s HSD-multiple range post-hoc test, IBM SPSS for Windows).
Figure 5.2.2 shows the DPPH free radical scavenging activities of the different extracts of C. rubens.
All extracts showed a dose-dependent inhibition of DPPH with the aqueous extract showing the best
activity with resultant low EC50 values (Table 5.2.1).
Figure 5.2.2: DPPH scavenging activity of C. rubens extracts. Data are reported as mean ± SD three replicas. a-c Values with different letters above the bars for a given concentration are significantly different from each other (p < 0.05,
Tukey’s HSD-multiple range post-hoc test, IBM SPSS for Windows). EtAC, Ethyl acetate; EtOH, Ethanol; AA, Ascorbic
acid.
The total reducing power of all the extracts is shown in Figure 5.2.3; all extracts showed high Fe3+
to Fe2+ reducing potential. However, the ethyl acetate extract showed the highest total reducing power
amongst the extracts.
a a a a aa a a a a
a b b b bb c c c cb c c c c
0
20
40
60
80
100
50 100 150 200 250
Inh
ibit
ion
of
DP
PH
(%
)
Concentration (µg/mL)
EtAc EtOH Aqueous Trolox AA
a bb
bb
a a a a aa a a a a
bd d d d
b c cc
c
0
20
40
60
80
50 100 150 200 250
Tota
l red
uci
ng
po
wer
(%
)
Concentration (µg/mL)
EtAc EtOH Aqueous Trolox AA
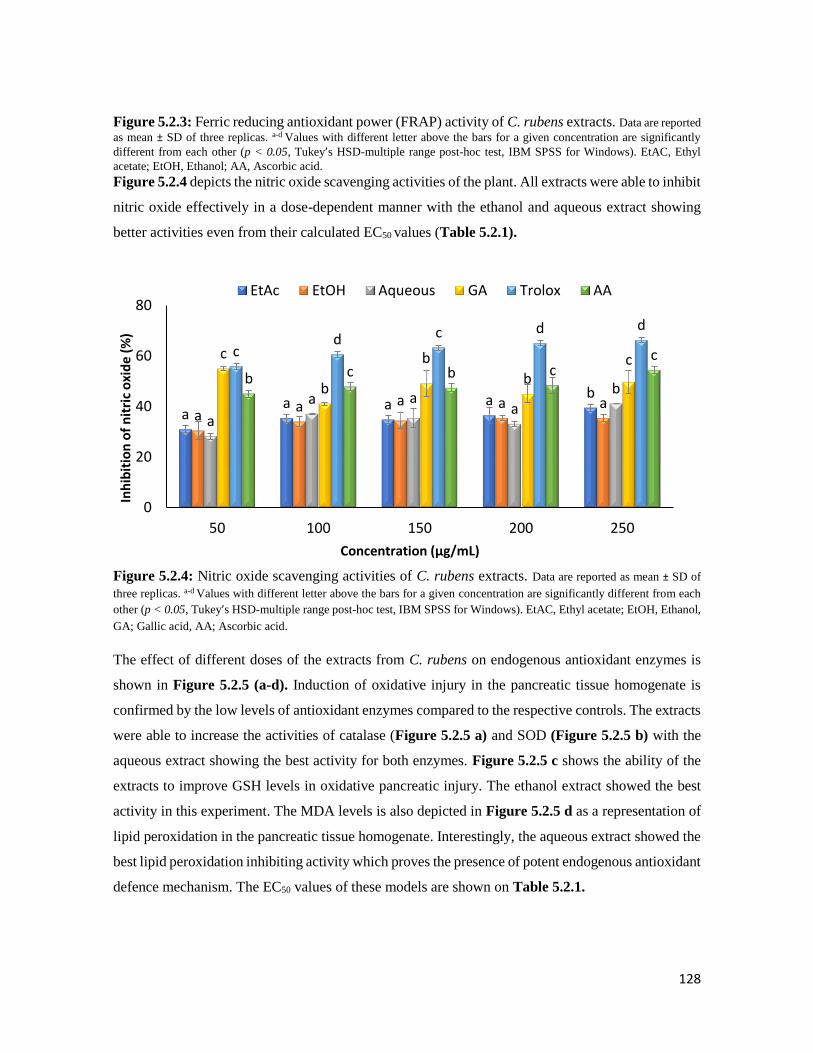
128
Figure 5.2.3: Ferric reducing antioxidant power (FRAP) activity of C. rubens extracts. Data are reported
as mean ± SD of three replicas. a-d Values with different letter above the bars for a given concentration are significantly
different from each other (p < 0.05, Tukey’s HSD-multiple range post-hoc test, IBM SPSS for Windows). EtAC, Ethyl
acetate; EtOH, Ethanol; AA, Ascorbic acid.
Figure 5.2.4 depicts the nitric oxide scavenging activities of the plant. All extracts were able to inhibit
nitric oxide effectively in a dose-dependent manner with the ethanol and aqueous extract showing
better activities even from their calculated EC50 values (Table 5.2.1).
Figure 5.2.4: Nitric oxide scavenging activities of C. rubens extracts. Data are reported as mean ± SD of
three replicas. a-d Values with different letter above the bars for a given concentration are significantly different from each
other (p < 0.05, Tukey’s HSD-multiple range post-hoc test, IBM SPSS for Windows). EtAC, Ethyl acetate; EtOH, Ethanol,
GA; Gallic acid, AA; Ascorbic acid.
The effect of different doses of the extracts from C. rubens on endogenous antioxidant enzymes is
shown in Figure 5.2.5 (a-d). Induction of oxidative injury in the pancreatic tissue homogenate is
confirmed by the low levels of antioxidant enzymes compared to the respective controls. The extracts
were able to increase the activities of catalase (Figure 5.2.5 a) and SOD (Figure 5.2.5 b) with the
aqueous extract showing the best activity for both enzymes. Figure 5.2.5 c shows the ability of the
extracts to improve GSH levels in oxidative pancreatic injury. The ethanol extract showed the best
activity in this experiment. The MDA levels is also depicted in Figure 5.2.5 d as a representation of
lipid peroxidation in the pancreatic tissue homogenate. Interestingly, the aqueous extract showed the
best lipid peroxidation inhibiting activity which proves the presence of potent endogenous antioxidant
defence mechanism. The EC50 values of these models are shown on Table 5.2.1.
aa a a b
aa a a a
a
a aa
b
c
b
b
bc
cd c d d
b c b cc
0
20
40
60
80
50 100 150 200 250
Inh
ibit
ion
of
nit
ric
oxi
de
(%)
Concentration (µg/mL)
EtAc EtOH Aqueous GA Trolox AA
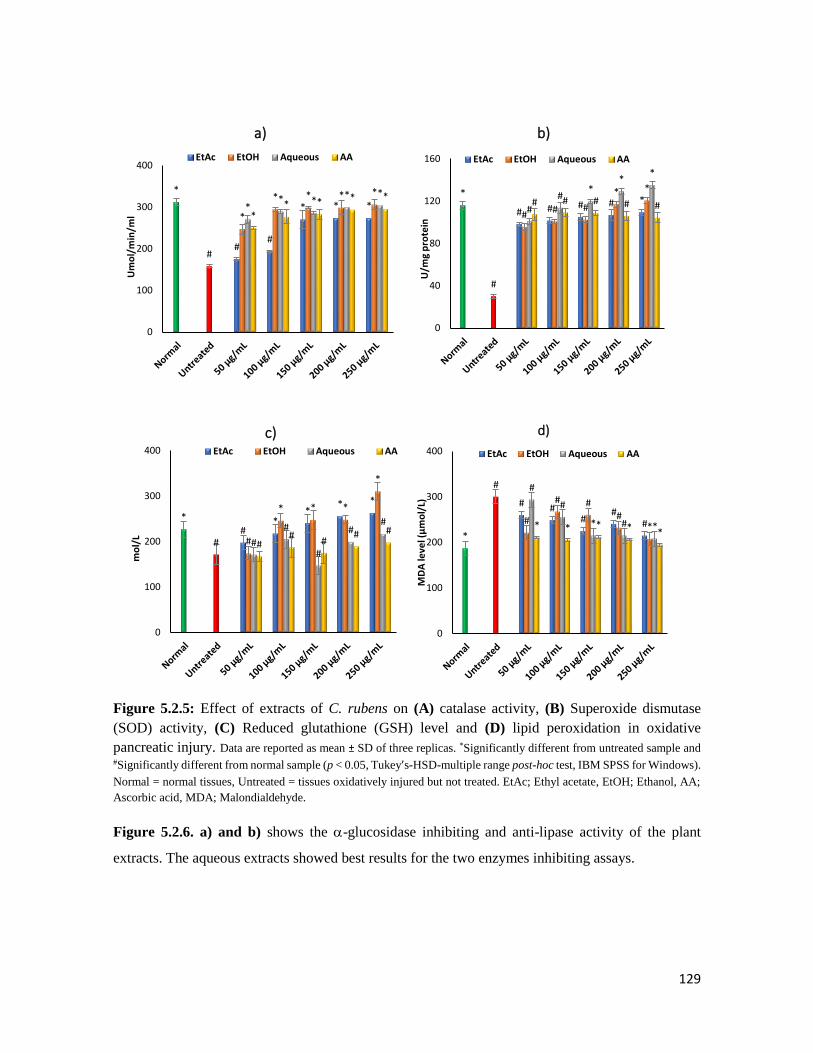
129
Figure 5.2.5: Effect of extracts of C. rubens on (A) catalase activity, (B) Superoxide dismutase
(SOD) activity, (C) Reduced glutathione (GSH) level and (D) lipid peroxidation in oxidative
pancreatic injury. Data are reported as mean ± SD of three replicas. *Significantly different from untreated sample and #Significantly different from normal sample (p < 0.05, Tukey’s-HSD-multiple range post-hoc test, IBM SPSS for Windows).
Normal = normal tissues, Untreated = tissues oxidatively injured but not treated. EtAc; Ethyl acetate, EtOH; Ethanol, AA;
Ascorbic acid, MDA; Malondialdehyde.
Figure 5.2.6. a) and b) shows the -glucosidase inhibiting and anti-lipase activity of the plant
extracts. The aqueous extracts showed best results for the two enzymes inhibiting assays.
##
* * *
*
#
*
* * * *
** *
* *
** * * *
0
100
200
300
400
Um
ol/
min
/ml
a)
EtAc EtOH Aqueous AA
# # # # **
#
## #
* *
#
#*
**
# # # # #
0
40
80
120
160
U/m
g p
rote
in
b)
EtAc EtOH Aqueous AA
#*
** *
*
# #
* * *
*
#
#
#
##
##
## #
0
100
200
300
400
mo
l/L
c)EtAc EtOH Aqueous AA
# ##
##
*
#
#
# ##
*
#
#
* # ** * * * *
0
100
200
300
400
MD
A le
vel (
µm
ol/
L)d)
EtAc EtOH Aqueous AA
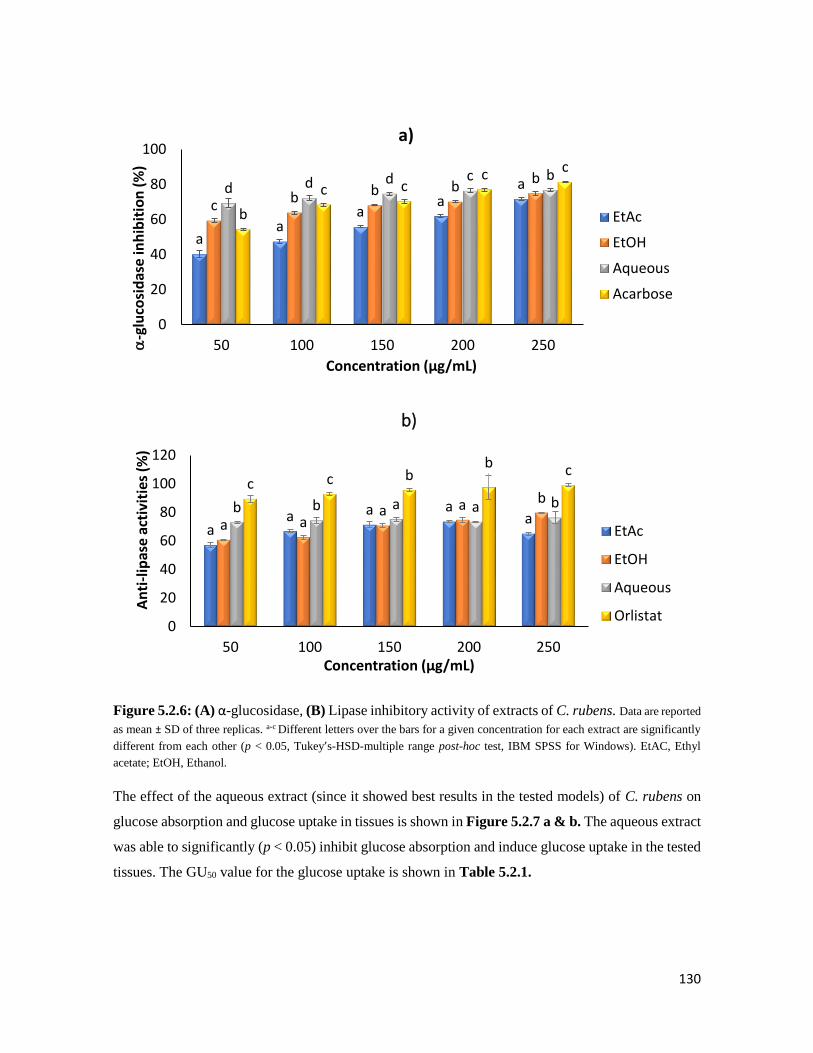
130
Figure 5.2.6: (A) α-glucosidase, (B) Lipase inhibitory activity of extracts of C. rubens. Data are reported
as mean ± SD of three replicas. a-c Different letters over the bars for a given concentration for each extract are significantly
different from each other (p < 0.05, Tukey’s-HSD-multiple range post-hoc test, IBM SPSS for Windows). EtAC, Ethyl
acetate; EtOH, Ethanol.
The effect of the aqueous extract (since it showed best results in the tested models) of C. rubens on
glucose absorption and glucose uptake in tissues is shown in Figure 5.2.7 a & b. The aqueous extract
was able to significantly (p < 0.05) inhibit glucose absorption and induce glucose uptake in the tested
tissues. The GU50 value for the glucose uptake is shown in Table 5.2.1.
aa
aa
a
c b b bb
d d d c b
b
c cc c
0
20
40
60
80
100
50 100 150 200 250-g
luco
sid
ase
inh
ibit
ion
(%
)
Concentration (µg/mL)
a)
EtAc
EtOH
Aqueous
Acarbose
aa a a
a a a a a b
b b a a bc c b
b c
0
20
40
60
80
100
120
50 100 150 200 250
An
ti-l
ipas
e a
ctiv
itie
s (%
)
Concentration (µg/mL)
b)
EtAc
EtOH
Aqueous
Orlistat

131
Figure 5.2.7: Effect of the ethanol extract of C. rubens on (A) glucose absorption in isolated rat
jejunum and (B) glucose uptake in rat psoas muscle. Data are reported as mean ± SD of three replicas. a-c
Different letters over the bars for a given concentration are significantly different from each other (p < 0.05, Tukey’s-HSD-
multiple range post-hoc test, IBM SPSS for Windows). Metformin: 2 mg/dL.
dc c
b a
0
1
2
3
4
5
6
7
Control 100 150 200 250
Glu
cose
ab
sorp
tio
n (
mg/
cm je
jun
um
)
Concentration (mg/dL)
a)
ba
bc
c
d
0
20
40
60
80
100
Control 100 150 200 250 Metformin
Glu
cose
up
take
(m
g/g
tiss
ue
wei
ght)
Concentration (mg/dL)
b)

132
Table 5.2.1: EC50 summary table for inhibitory effects of different extracts of C. rubens
Sample
Lipid
peroxidation
(µg/mL)
DPPH
NO (µg/mL) Catalase
(µg/mL)
SOD
(µg/mL)
GSH
(µg/mL)
α-
glucosidase
(µg/mL)
Anti-lipase
(µg/mL)
GU50
(mg/dL)
Aerial parts
Ethyl acetate 2.08±0.71a >1000d 35.03±2.53c 25.82±3.61a 12.51±2.04d 52.68±9.34b 2.26±1.08a 1.69±1.03b ND
Ethanol 2.97±0.23a 14.46±3.24a 15.72±1.04a 42.85±5.64c 1.95±0.83a 64.28±7.51b 19.66±3.84b 13.12±6.23c 4.35±0.74
Aqueous 6.73±0.16b 20.86±2.81b 13.51±1.26a 33.32±4.62b 5.21±1.17c 31.27±3.62a 2.16±1.12a 2.84±1.01b ND
Standard
Ascorbic
acid
2.19±0.05a 196.71±27.4
5c
19.71±3.91b 32.01±5.27b 3.05±0.58b 35.15±7.24a ND ND ND
Gallic acid ND 191.12±23.0
5c
ND ND ND ND ND ND ND
Trolox 5.79±0.4b 19.4±1.06b ND ND ND ND ND ND ND
Acarbose ND ND ND ND ND ND 36.27±1.84c ND ND
Orlistat ND ND ND ND ND ND ND 0.03±0.12a ND
DPPH-1,1-diphenyl-2-picrylhydrazyl radical, NO-nitric oxide radical, ND-not determined. Data are reported as mean ± SD values of three replicas. a-d Different letters stand
for significantly different values from each other within a column (Tukey’s-HSD multiple range post hoc test, p < 0.05): the same letters stand for non-significant difference.

133
Figure 5.2.8. shows the structures of the compounds identified by Liquid Chromatography-Mass
Spectrometry.
Figure 5.2.8: Structures of the compounds isolated from the aqueous extract of C. rubens by LC-MS
analysis.
Table 5.2.2 shows the binding affinities (kcal/mol) of compounds isolated from the extract with
Sanguisorbic acid dilactone showing the highest binding affinity for catalase (-10.5 kcal/mol) and
lipase (-10.4 kcal/mol) enzymes.
Table 5.2.2: Binding affinities (kcal/mol) of compounds isolated from the aqueous extract with
antioxidant and anti-diabetic enzymes.
Antioxidants Anti-diabetic
Compounds Superoxide
dismutase Catalase
Glutathione
reductase
α-glucosidase lipase
6-hydroxy-2-cyclohexen-
one-carboxylate
-4.8 -6.9 -6.4 -5.4 -6.1
3,4-
Methylenedioxybenzoic
acid
-5.0 -7.3 -6.5 -5.5 -6.4
8-Methoxy-6,7-
methylenedioxycoumarin
-5.1 -8.3 -7.0 -5.5 7.5
Sanguisorbic acid dilactone -7.9 -10.5 -8.7 -7.9 -10.4

134
Figure 5.2.9 shows images of 3-D (a) and 2-D (b) interactions of Sanguisorbic acid dilactone isolated
from the aqueous extract (the highest binding affinity -10.5 kcal/mol) with amino acid residues of
docked complex of catalase enzyme.
Figure 5.2.9: Illustration of 3-D (a) and 2-D (b) interactions with amino acid residues of docked
complex (Sanguisorbic acid dilactone-catalase) isolated from the aqueous extract with the highest
binding affinity -10.5 kcal/mol (Highest binding affinity compared to all antioxidant enzyme
considered).
Figure 5.2.10 shows images of 3-D (a) and 2-D (b) interactions of Sanguisorbic acid dilactone with
amino acid residues of docked complex of lipase. When compared to the binding energy of this
compound with the α-glucosidase enzyme, lipase had the highest binding energy.
Figure 5.2.10: Illustration of 3-D (a) and 2-D (b) interactions with amino acid residues of docked
complex (Sanguisorbic acid dilactone-lipase) isolated from the aqueous extract with the highest
binding affinity -10.4 kcal/mol (Highest binding affinity compared to α-glucosidase; anti-diabetic).

135
5.2.5 Discussion
The antioxidant activities of traditional leafy vegetables have recently been exploited. These plants
contain a wide array of phytochemicals (Kinyi et al., 2016), so it is not surprising tha they are
enjoyed as a delicacy and used by the locals in the treatment of diseases like T2D (Chauhan et al.,
2014). Out of the complex multiple pathogenesis of T2D, oxidative stress remains the precursor of
the diverse complications associated with this disease (Folli et al., 2011). Fortunately, alternate
therapies can be produced from plants rich in antioxidants, which can serve as free radical scavengers
(Heravi et al., 2015).
The presence of total phenols in the different extracts of C. rubens in this study shows its strong
antioxidant potentials (Figure 5.2.1). Polyphenols in food and vegetables are antioxidant
phytochemicals that contribute to free radical scavenging activities (Zhang et al., 2015).
DPPH assay is a fast and reliable method to estimate free radical scavenging activity (Pavithra and
Vadivukkarasi, 2015). DPPH, a stable free radical, which accepts an electron of hydrogen radical
from an antioxidant to form a diamagnetic molecule (Jadid et al., 2017). An antioxidant can donate
an electron to DPPH, thereby reducing the violet color of DPPH to orange. The DPPH scavenging
activity demonstrated by the different extracts of C. rubens especially the aqueous extract (Figure
5.2.2 & Table 5.2.1) suggests that this plant has constituents with hydrogen-donating ability.
Iron has been reported to play a major role in the generation of free radicals through its enzymatic or
non-enzymatic reaction with superoxide ion (Haber Weiss reaction) or hydrogen peroxide (Fenton
reaction). The reducing power of plants has been linked to their antioxidant capacity (Apak et al.,
2016). The reduction of Fe3+ is often used as a marker for electron donating ability which signals
potent antioxidants (Nabavi et al., 2009). Antioxidants perform their roles by donating a hydrogen
atom with the sole intention of breaking a free radical chain (Meir et al., 1995). The extracts showed
good reducing power in a dose dependent manner (Figure 5.2.3). The polyphenols present in the
extracts of C. rubens caused the reduction of Fe3+ to the ferrous form (Fe2+) thereby proving its
antioxidant potential.
Nitric oxide is a free radical normally produced in mammalian cells and is involved in the regulation
of various physiological processes. Unfortunately, high generation of nitric oxide radicals has been
linked to the progression of several diseases (Ohkawa et al., 1979). Substances which prevent the
production of NO radicals have become an interesting material of research for targeting chronic
inflammatory diseases (Phaniendra et al., 2015). This study investigated the inhibitory effects of the
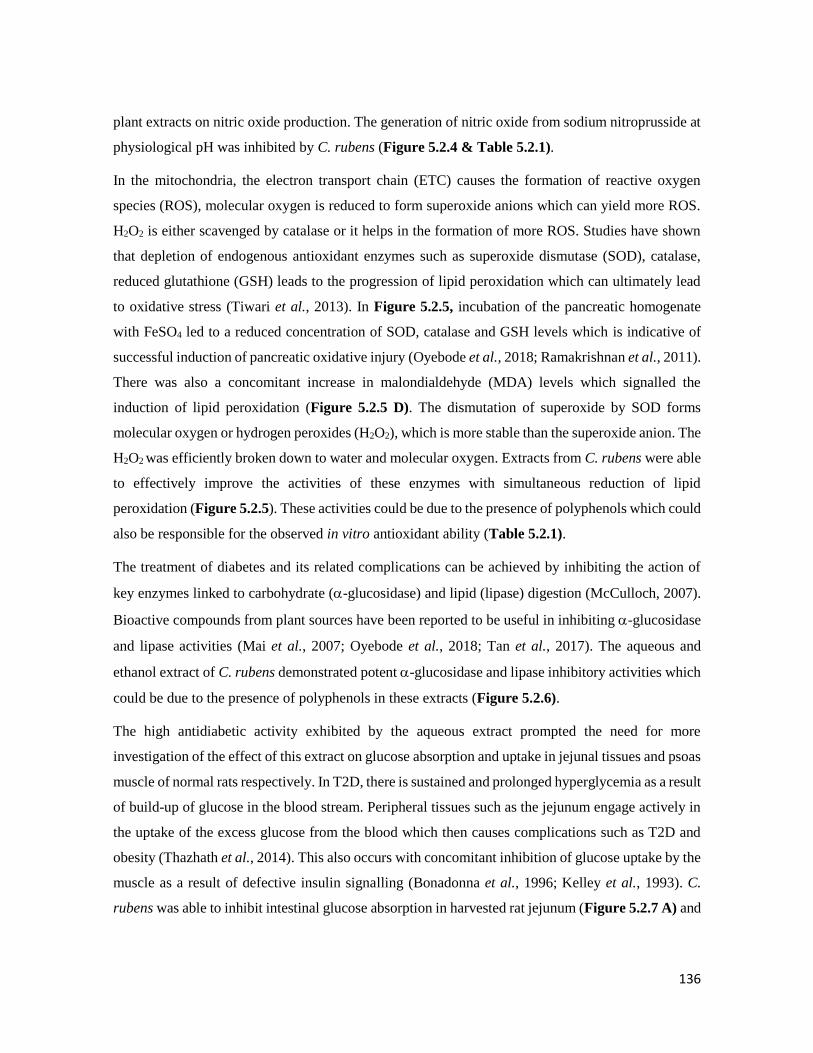
136
plant extracts on nitric oxide production. The generation of nitric oxide from sodium nitroprusside at
physiological pH was inhibited by C. rubens (Figure 5.2.4 & Table 5.2.1).
In the mitochondria, the electron transport chain (ETC) causes the formation of reactive oxygen
species (ROS), molecular oxygen is reduced to form superoxide anions which can yield more ROS.
H2O2 is either scavenged by catalase or it helps in the formation of more ROS. Studies have shown
that depletion of endogenous antioxidant enzymes such as superoxide dismutase (SOD), catalase,
reduced glutathione (GSH) leads to the progression of lipid peroxidation which can ultimately lead
to oxidative stress (Tiwari et al., 2013). In Figure 5.2.5, incubation of the pancreatic homogenate
with FeSO4 led to a reduced concentration of SOD, catalase and GSH levels which is indicative of
successful induction of pancreatic oxidative injury (Oyebode et al., 2018; Ramakrishnan et al., 2011).
There was also a concomitant increase in malondialdehyde (MDA) levels which signalled the
induction of lipid peroxidation (Figure 5.2.5 D). The dismutation of superoxide by SOD forms
molecular oxygen or hydrogen peroxides (H2O2), which is more stable than the superoxide anion. The
H2O2 was efficiently broken down to water and molecular oxygen. Extracts from C. rubens were able
to effectively improve the activities of these enzymes with simultaneous reduction of lipid
peroxidation (Figure 5.2.5). These activities could be due to the presence of polyphenols which could
also be responsible for the observed in vitro antioxidant ability (Table 5.2.1).
The treatment of diabetes and its related complications can be achieved by inhibiting the action of
key enzymes linked to carbohydrate (-glucosidase) and lipid (lipase) digestion (McCulloch, 2007).
Bioactive compounds from plant sources have been reported to be useful in inhibiting -glucosidase
and lipase activities (Mai et al., 2007; Oyebode et al., 2018; Tan et al., 2017). The aqueous and
ethanol extract of C. rubens demonstrated potent -glucosidase and lipase inhibitory activities which
could be due to the presence of polyphenols in these extracts (Figure 5.2.6).
The high antidiabetic activity exhibited by the aqueous extract prompted the need for more
investigation of the effect of this extract on glucose absorption and uptake in jejunal tissues and psoas
muscle of normal rats respectively. In T2D, there is sustained and prolonged hyperglycemia as a result
of build-up of glucose in the blood stream. Peripheral tissues such as the jejunum engage actively in
the uptake of the excess glucose from the blood which then causes complications such as T2D and
obesity (Thazhath et al., 2014). This also occurs with concomitant inhibition of glucose uptake by the
muscle as a result of defective insulin signalling (Bonadonna et al., 1996; Kelley et al., 1993). C.
rubens was able to inhibit intestinal glucose absorption in harvested rat jejunum (Figure 5.2.7 A) and
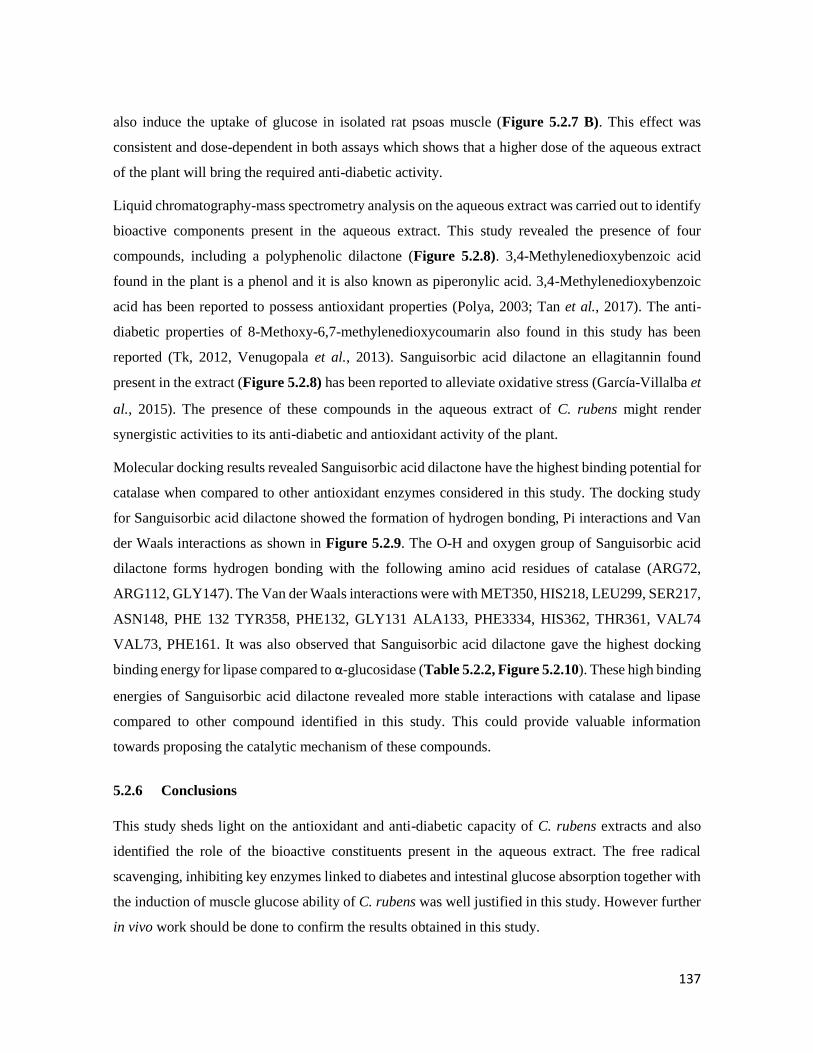
137
also induce the uptake of glucose in isolated rat psoas muscle (Figure 5.2.7 B). This effect was
consistent and dose-dependent in both assays which shows that a higher dose of the aqueous extract
of the plant will bring the required anti-diabetic activity.
Liquid chromatography-mass spectrometry analysis on the aqueous extract was carried out to identify
bioactive components present in the aqueous extract. This study revealed the presence of four
compounds, including a polyphenolic dilactone (Figure 5.2.8). 3,4-Methylenedioxybenzoic acid
found in the plant is a phenol and it is also known as piperonylic acid. 3,4-Methylenedioxybenzoic
acid has been reported to possess antioxidant properties (Polya, 2003; Tan et al., 2017). The anti-
diabetic properties of 8-Methoxy-6,7-methylenedioxycoumarin also found in this study has been
reported (Tk, 2012, Venugopala et al., 2013). Sanguisorbic acid dilactone an ellagitannin found
present in the extract (Figure 5.2.8) has been reported to alleviate oxidative stress (García-Villalba et
al., 2015). The presence of these compounds in the aqueous extract of C. rubens might render
synergistic activities to its anti-diabetic and antioxidant activity of the plant.
Molecular docking results revealed Sanguisorbic acid dilactone have the highest binding potential for
catalase when compared to other antioxidant enzymes considered in this study. The docking study
for Sanguisorbic acid dilactone showed the formation of hydrogen bonding, Pi interactions and Van
der Waals interactions as shown in Figure 5.2.9. The O-H and oxygen group of Sanguisorbic acid
dilactone forms hydrogen bonding with the following amino acid residues of catalase (ARG72,
ARG112, GLY147). The Van der Waals interactions were with MET350, HIS218, LEU299, SER217,
ASN148, PHE 132 TYR358, PHE132, GLY131 ALA133, PHE3334, HIS362, THR361, VAL74
VAL73, PHE161. It was also observed that Sanguisorbic acid dilactone gave the highest docking
binding energy for lipase compared to α-glucosidase (Table 5.2.2, Figure 5.2.10). These high binding
energies of Sanguisorbic acid dilactone revealed more stable interactions with catalase and lipase
compared to other compound identified in this study. This could provide valuable information
towards proposing the catalytic mechanism of these compounds.
5.2.6 Conclusions
This study sheds light on the antioxidant and anti-diabetic capacity of C. rubens extracts and also
identified the role of the bioactive constituents present in the aqueous extract. The free radical
scavenging, inhibiting key enzymes linked to diabetes and intestinal glucose absorption together with
the induction of muscle glucose ability of C. rubens was well justified in this study. However further
in vivo work should be done to confirm the results obtained in this study.

138
5.3 Crassocephalum rubens improves pancreatic histology, insulin secretion, liver
and kidney function parameters in a type 2 diabetic rat model
Olajumoke A. Oyebode, Ochuko L. Erukainure, Olakunle Sanni, Md. Shahidul Islam*
Department of Biochemistry, School of Life Sciences, University of KwaZulu-Natal, (Westville
Campus), Durban 4000, South Africa
*Corresponding author: [email protected]; Tel: +27 (0)31-260-8717; Fax: +27 (0)31-260-7942
Preface: This article reports the detailed in vivo anti-diabetic effects of the crude extracts from C.
rubens, it is currently awaiting revision before submission to a journal for publication.
5.3.1 Abstract
Crassocephalum rubens is a traditional leafy vegetable (TLV) eaten in parts of Africa for the
management of diabetes mellitus. This study was conducted to investigate the in vivo anti-diabetic
activity of aqueous extract of C. rubens aerial parts (CRAQ) in a type 2 diabetes model of rats. In this
study, type 2 diabetes (T2D) was induced in male Sprague dawley (SD) rats by feeding 10% fructose
solution for two weeks followed by a single intraperitoneal injection of streptozotocin (40 mg/kg bw).
After confirmation of T2D, animals were treated with a low (150 mg/kg bw) and a high dose (300
mg/kg bw) of the extract for five weeks. During this period, food and fluid intake was measured daily
and body weight and blood glucose were measured weekly when oral glucose tolerance test was
conducted in the last week of the intervention period. Treatment with the high dose of extract
significantly (p < 0.05) reduced blood glucose level, improved oral glucose tolerance level and
pancreatic β-cell function and histology compared to diabetic control group. The high dose also
increased the serum insulin, liver glycogen, and improved cardiac, liver and renal damages
significantly compared to the untreated diabetic group. Data from this study suggest that C. rubens
possesses anti-diabetic activity and could be useful in ameliorating some macrovascular
complications associated with T2D, therefore this plant can be exploited in finding new alternate
therapies for the treatment of T2D.
Key words: Crassocephalum rubens, type 2 diabetes, histopathology, liver glycogen, rats.
5.3.2 Introduction
Diabetes mellitus is a global world health problem, the prevalence is on the rise and in 2017 over 427
million people were considered diabetic (IDF, 2017). This number represents only the people who

139
were tested as a large number of people are presently living with diabetes undiagnosed (WHO, 2016).
Diabetes is a complex metabolic disease characterised by hyperglycaemia, pancreatic β-cell
dysfunction and insulin resistance (Arredondo et al., 2018). Type 2 diabetes (T2D) accounts for over
90% of all recorded diabetic cases and unhealthy eating habits, lack of exercise, urbanisation favours
the prevalence of T2D. Hyperglycaemic-induced oxidative stress is responsible for the multiple
complications associated with T2D. These complications grouped into microvascular (affecting the
small blood vessels) and macrovascular (affecting the large blood vessels) complications range from
retinopathy, nephropathy, neuropathy, and cardiovascular problems (Forbes and Cooper, 2013). The
effective control of high blood glucose levels is very important for curbing the complications
associated with T2D.
Presently, different drugs are available for the treatment and management of T2D. These drugs
include but are not limited to sulfonylureas, biguanides, thiazolidinediones, glucagon-like peptide
(GLP-1 analogues), incretin memetics and so on. These drugs although quite effective when used
alone or in combination with other drugs, possess some unwanted short and long-term side effects
such as nausea (biguanides such as metformin), increased risk of heart problems (thiazolidinediones),
weight gain (metformin, insulin secretagogues), weight loss (glibenclamide) (Chaudhury et al.,
2017).
Despite different treatment modalities currently used for T2D, getting a diabetic patient to normal
glucose levels still remains a challenge. Fortunately, nature has provided mankind with medicinal
plants which holds the key to wellness and longevity. These plants have since time immemorial been
exploited for treating diverse diseases since they are loaded with antioxidants and blood lowering
nutrients in abundant supply (Rani and Maheshwari, 2014).
An example of such potent medicinal plant is Crassocephalum rubens which is a traditional leafy
vegetable (Figure 5.1) and is used in various parts of Africa for the treatment of diseases such as
T2D. In previous sections of this chapter, the in vitro, ex vivo antioxidant and antidiabetic activities
of this plant has been reported in detail. This section serves to outline the effect of aqueous extract of
aerial parts of Crassocephalum rubens (CRAQ) in a type 2 diabetes rat model.
5.3.3 Materials and methods
Please refer to Chapter 2 for the detailed materials and methods used for C. rubens.

140
5.3.4 Results
The data for mean daily food and fluid intake during the five-week intervention period are shown in
Figure 5.3.1. The normal groups (NC and NCR) showed significantly (p < 0.05) lower food and fluid
intake compared to the diabetic untreated group (DBC). Although, the food intake of the CRAQ
groups showed no statistically significant difference compared to the standard drugs (DBM and
DBG), it was relatively lower compared to the DBC group. However, there was significantly (p <
0.05) lower fluid consumption seen in the DCRH group compared to the DBC and DCRL group
although not as low as the standard drug metformin but statistically the same as glibenclamide.
Figure 5.3.1: Mean feed and fluid intake in different animal groups during the experimental period. Data are reported as mean ± SD of seven animals. a-cValues with different letters over the bars for a given parameter are
significantly different from each other (Tukey’s-HSD multiple range post hoc test, p < 0.05). NC, Normal control, DBC,
Diabetic control, DCRL, Diabetic C. rubens low dose, DCRH, Diabetic C. rubens high dose, DBM, Diabetic metformin,
DBG, Diabetic glibenclamide, NCR, Normal C. rubensi high dose (toxicological control).
Figure 5.3.2 shows the mean weekly body weight change over the seven-weeks experimental period.
No significant difference was observed in the body weight of all animal groups (both normal and
diabetic) before the induction of T2D. However, there was a reduction in the body weight of the
animals in the diabetic groups which is very common after streptozotocin injection. Interestingly, in
the last 2 weeks of the experiment (weeks 6 and 7), there was a steady increase in the body weight of
animals treated with a higher dose of the extract (DCRH group) compared to the DBC group.
a
ab
d
ab
c
ab
bc
ab
b
ab
bc
aa
0
50
100
150
200
250
300
Feed intake (g/rat/day) Fluid intake (mL/rat/day)
Feed
an
d f
luid
inta
ke (
un
its)
NC DBC DCRL DCRH DBM DBG NCR
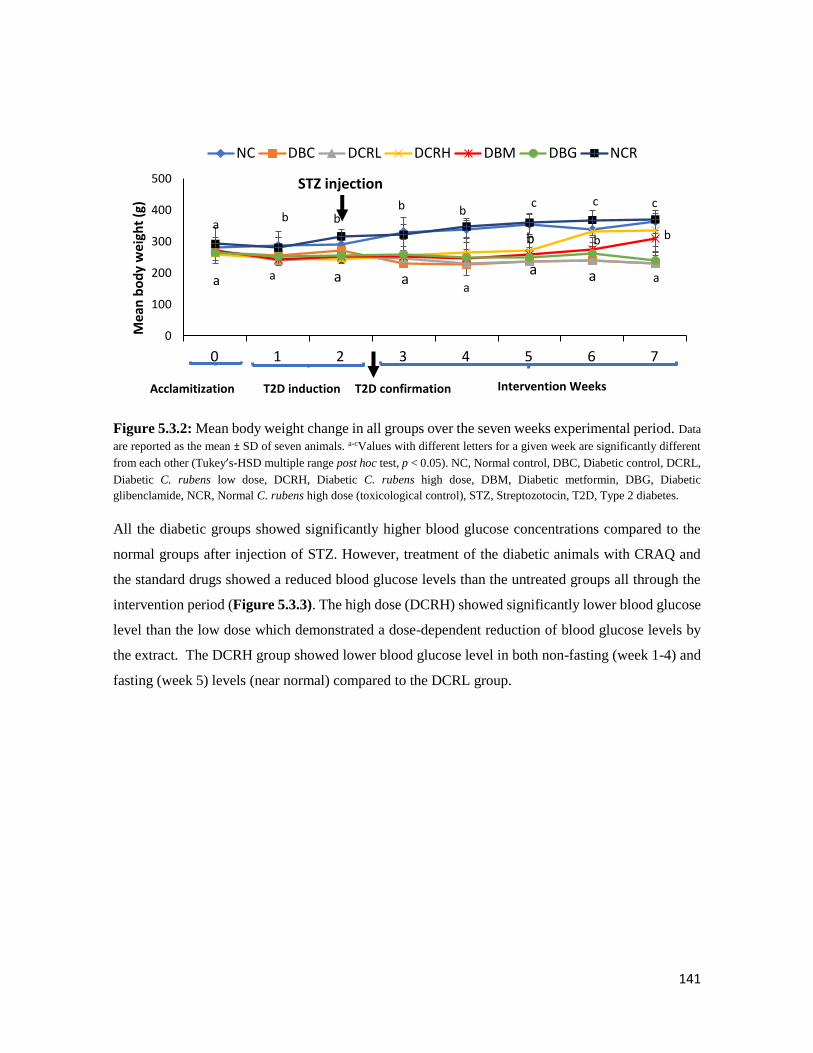
141
Figure 5.3.2: Mean body weight change in all groups over the seven weeks experimental period. Data
are reported as the mean ± SD of seven animals. a-cValues with different letters for a given week are significantly different
from each other (Tukey’s-HSD multiple range post hoc test, p < 0.05). NC, Normal control, DBC, Diabetic control, DCRL,
Diabetic C. rubens low dose, DCRH, Diabetic C. rubens high dose, DBM, Diabetic metformin, DBG, Diabetic
glibenclamide, NCR, Normal C. rubens high dose (toxicological control), STZ, Streptozotocin, T2D, Type 2 diabetes.
All the diabetic groups showed significantly higher blood glucose concentrations compared to the
normal groups after injection of STZ. However, treatment of the diabetic animals with CRAQ and
the standard drugs showed a reduced blood glucose levels than the untreated groups all through the
intervention period (Figure 5.3.3). The high dose (DCRH) showed significantly lower blood glucose
level than the low dose which demonstrated a dose-dependent reduction of blood glucose levels by
the extract. The DCRH group showed lower blood glucose level in both non-fasting (week 1-4) and
fasting (week 5) levels (near normal) compared to the DCRL group.
bc c
b bb
b b
aa aa
b
a aa
c
0
100
200
300
400
500
0 1 2 3 4 5 6 7
Mea
n b
od
y w
eigh
t (g
)NC DBC DCRL DCRH DBM DBG NCR
T2D induction Intervention Weeks
STZ injection
a
a
T2D confirmationAcclamitization

142
Figure 5.3.3: Weekly blood glucose concentrations in different animal groups during the intervention
period. Data are reported as the mean ± SD of seven animals. a-dValues with different letters for a given week are
significantly different from each other (Tukey’s-HSD multiple range post hoc test, p < 0.05). NC, Normal control, DBC,
Diabetic control, DCRL, Diabetic C. rubens low dose, DCRH, Diabetic C. rubens high dose, DBM, Diabetic metformin,
DBG, Diabetic glibenclamide, NCR, Normal C. rubens high dose (toxicological control), STZ, Streptozotocin, NFBG, Non-
fasting blood glucose, FBG, Fasting blood glucose.
The data for OGTT and the corresponding area under the curve (AUC) are shown in Figure 5.3.4
The glucose tolerance of the CRAQ-treated groups was significantly (p < 0.05) better than the DBC
group. A better glucose tolerance ability was observed in the DCRH group at the 60 min mark which
was manifested all through the OGTT period. The total area under the curve (AUC) of DCRH group
was significantly lower than the other diabetic groups (DBC, DCRL, DBM and DBG), which again
confirms its better glucose tolerance ability compared to other diabetic groups (Figure 5.3.4).
a a
b c
d
c
bb
bb
cc
dd
c
a a a
0
5
10
15
20
25
30
35
WEEK 1 WEEK 2 WEEK 3 WEEK 4 WEEK 5Blo
od
glu
cose
leve
l (m
mo
l/L)
WEEKS OF INTERVENTION
NC DBC DCRL DCRH DBM DBG NCR
NFBG FBG
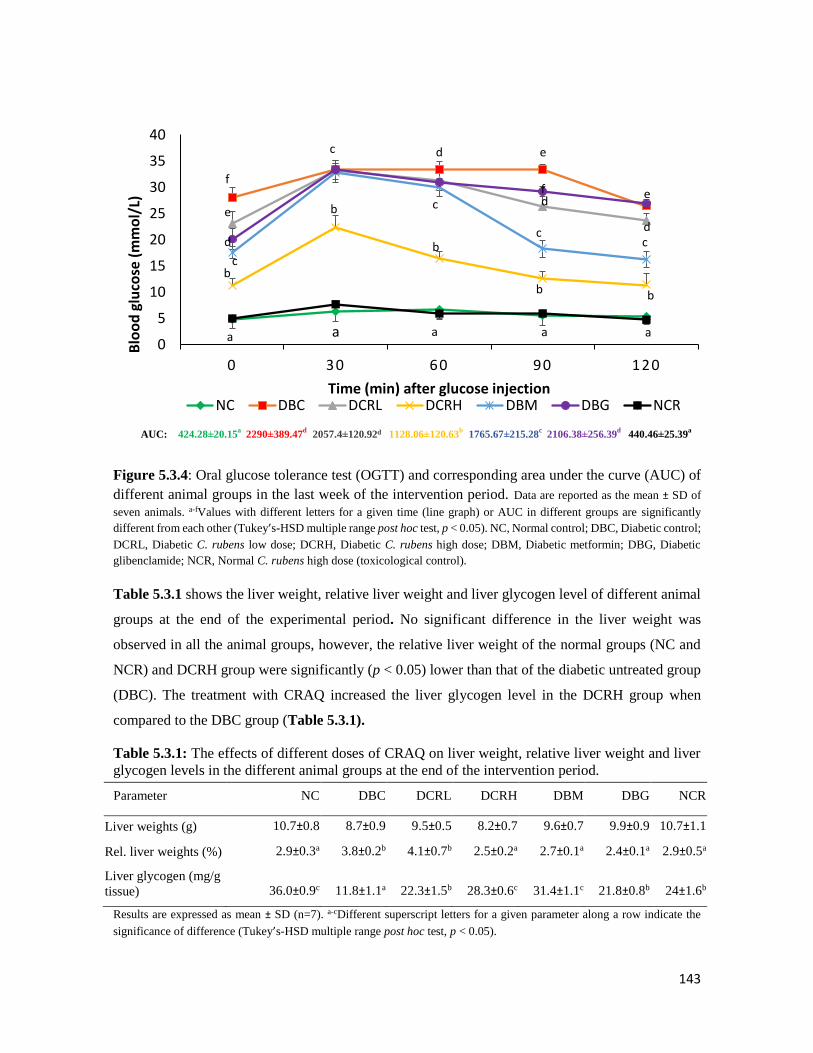
143
Figure 5.3.4: Oral glucose tolerance test (OGTT) and corresponding area under the curve (AUC) of
different animal groups in the last week of the intervention period. Data are reported as the mean ± SD of
seven animals. a-fValues with different letters for a given time (line graph) or AUC in different groups are significantly
different from each other (Tukey’s-HSD multiple range post hoc test, p < 0.05). NC, Normal control; DBC, Diabetic control;
DCRL, Diabetic C. rubens low dose; DCRH, Diabetic C. rubens high dose; DBM, Diabetic metformin; DBG, Diabetic
glibenclamide; NCR, Normal C. rubens high dose (toxicological control).
Table 5.3.1 shows the liver weight, relative liver weight and liver glycogen level of different animal
groups at the end of the experimental period. No significant difference in the liver weight was
observed in all the animal groups, however, the relative liver weight of the normal groups (NC and
NCR) and DCRH group were significantly (p < 0.05) lower than that of the diabetic untreated group
(DBC). The treatment with CRAQ increased the liver glycogen level in the DCRH group when
compared to the DBC group (Table 5.3.1).
Table 5.3.1: The effects of different doses of CRAQ on liver weight, relative liver weight and liver
glycogen levels in the different animal groups at the end of the intervention period.
Parameter NC DBC DCRL DCRH DBM DBG NCR
Liver weights (g) 10.7±0.8 8.7±0.9 9.5±0.5 8.2±0.7 9.6±0.7 9.9±0.9 10.7±1.1
Rel. liver weights (%) 2.9±0.3a 3.8±0.2b 4.1±0.7b 2.5±0.2a 2.7±0.1a 2.4±0.1a 2.9±0.5a
Liver glycogen (mg/g
tissue) 36.0±0.9c 11.8±1.1a 22.3±1.5b 28.3±0.6c 31.4±1.1c 21.8±0.8b 24±1.6b
Results are expressed as mean ± SD (n=7). a-cDifferent superscript letters for a given parameter along a row indicate the
significance of difference (Tukey’s-HSD multiple range post hoc test, p < 0.05).
a
e
d e
dd
c
cf e
bb
a
f
b
bc
b
c
d
c
a a a0
5
10
15
20
25
30
35
40
0 30 60 90 120
Blo
od
glu
cose
(m
mo
l/L)
Time (min) after glucose injection NC DBC DCRL DCRH DBM DBG NCR
AUC: 424.28±20.15a
2290±389.47d
2057.4±120.92d 1128.06±120.63b
1765.67±215.28c
2106.38±256.39d
440.46±25.39a
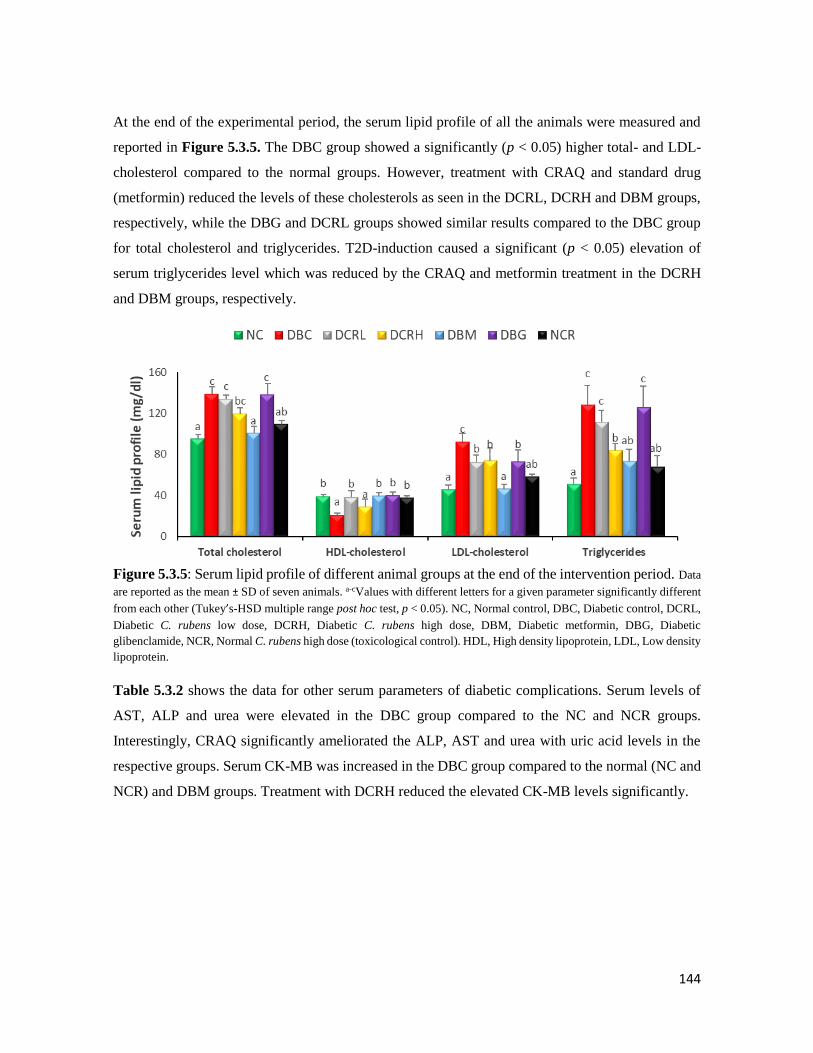
144
At the end of the experimental period, the serum lipid profile of all the animals were measured and
reported in Figure 5.3.5. The DBC group showed a significantly (p < 0.05) higher total- and LDL-
cholesterol compared to the normal groups. However, treatment with CRAQ and standard drug
(metformin) reduced the levels of these cholesterols as seen in the DCRL, DCRH and DBM groups,
respectively, while the DBG and DCRL groups showed similar results compared to the DBC group
for total cholesterol and triglycerides. T2D-induction caused a significant (p < 0.05) elevation of
serum triglycerides level which was reduced by the CRAQ and metformin treatment in the DCRH
and DBM groups, respectively.
Figure 5.3.5: Serum lipid profile of different animal groups at the end of the intervention period. Data
are reported as the mean ± SD of seven animals. a-cValues with different letters for a given parameter significantly different
from each other (Tukey’s-HSD multiple range post hoc test, p < 0.05). NC, Normal control, DBC, Diabetic control, DCRL,
Diabetic C. rubens low dose, DCRH, Diabetic C. rubens high dose, DBM, Diabetic metformin, DBG, Diabetic
glibenclamide, NCR, Normal C. rubens high dose (toxicological control). HDL, High density lipoprotein, LDL, Low density
lipoprotein.
Table 5.3.2 shows the data for other serum parameters of diabetic complications. Serum levels of
AST, ALP and urea were elevated in the DBC group compared to the NC and NCR groups.
Interestingly, CRAQ significantly ameliorated the ALP, AST and urea with uric acid levels in the
respective groups. Serum CK-MB was increased in the DBC group compared to the normal (NC and
NCR) and DBM groups. Treatment with DCRH reduced the elevated CK-MB levels significantly.
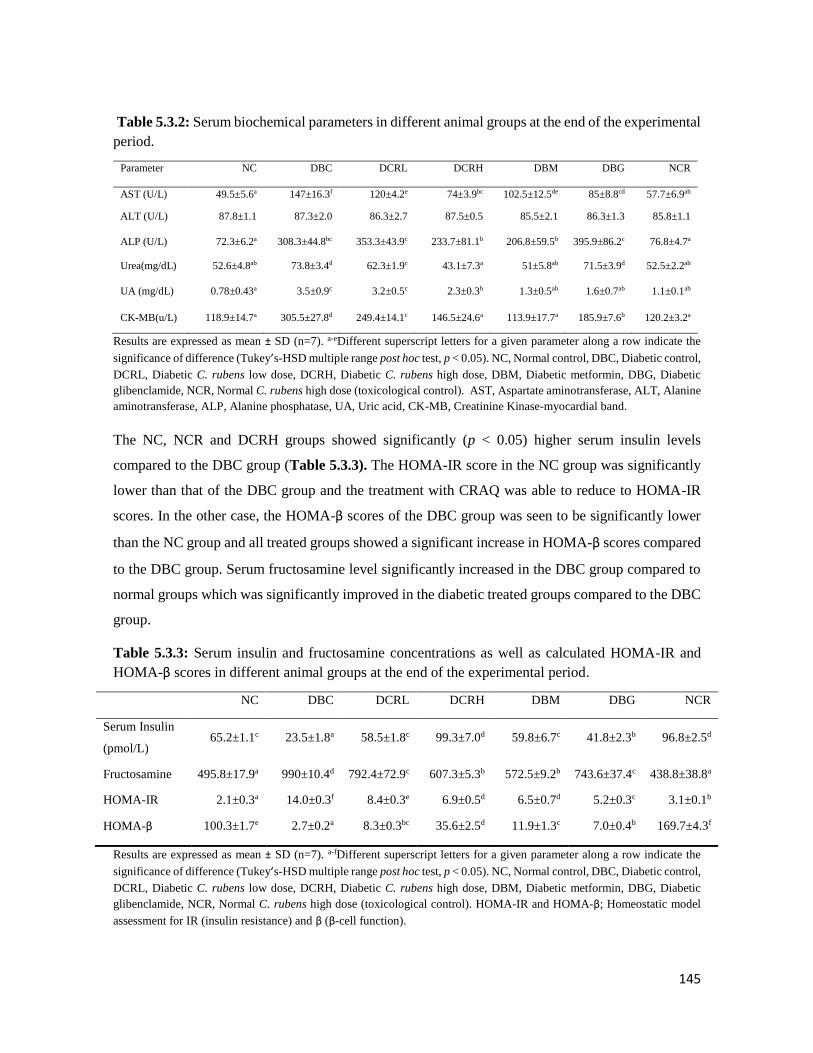
145
Table 5.3.2: Serum biochemical parameters in different animal groups at the end of the experimental
period.
Parameter NC DBC DCRL DCRH DBM DBG NCR
AST (U/L) 49.5±5.6a 147±16.3f 120±4.2e 74±3.9bc 102.5±12.5de 85±8.8cd 57.7±6.9ab
ALT (U/L) 87.8±1.1 87.3±2.0 86.3±2.7 87.5±0.5 85.5±2.1 86.3±1.3 85.8±1.1
ALP (U/L) 72.3±6.2a 308.3±44.8bc 353.3±43.9c 233.7±81.1b 206.8±59.5b 395.9±86.2c 76.8±4.7a
Urea(mg/dL) 52.6±4.8ab 73.8±3.4d 62.3±1.9c 43.1±7.3a 51±5.8ab 71.5±3.9d 52.5±2.2ab
UA (mg/dL) 0.78±0.43a 3.5±0.9c 3.2±0.5c 2.3±0.3b 1.3±0.5ab 1.6±0.7ab 1.1±0.1ab
CK-MB(u/L) 118.9±14.7a 305.5±27.8d 249.4±14.1c 146.5±24.6a 113.9±17.7a 185.9±7.6b 120.2±3.2a
Results are expressed as mean ± SD (n=7). a-eDifferent superscript letters for a given parameter along a row indicate the
significance of difference (Tukey’s-HSD multiple range post hoc test, p < 0.05). NC, Normal control, DBC, Diabetic control,
DCRL, Diabetic C. rubens low dose, DCRH, Diabetic C. rubens high dose, DBM, Diabetic metformin, DBG, Diabetic
glibenclamide, NCR, Normal C. rubens high dose (toxicological control). AST, Aspartate aminotransferase, ALT, Alanine
aminotransferase, ALP, Alanine phosphatase, UA, Uric acid, CK-MB, Creatinine Kinase-myocardial band.
The NC, NCR and DCRH groups showed significantly (p < 0.05) higher serum insulin levels
compared to the DBC group (Table 5.3.3). The HOMA-IR score in the NC group was significantly
lower than that of the DBC group and the treatment with CRAQ was able to reduce to HOMA-IR
scores. In the other case, the HOMA-β scores of the DBC group was seen to be significantly lower
than the NC group and all treated groups showed a significant increase in HOMA-β scores compared
to the DBC group. Serum fructosamine level significantly increased in the DBC group compared to
normal groups which was significantly improved in the diabetic treated groups compared to the DBC
group.
Table 5.3.3: Serum insulin and fructosamine concentrations as well as calculated HOMA-IR and
HOMA-β scores in different animal groups at the end of the experimental period.
NC DBC DCRL DCRH DBM DBG NCR
Serum Insulin
(pmol/L) 65.2±1.1c 23.5±1.8a 58.5±1.8c 99.3±7.0d 59.8±6.7c 41.8±2.3b 96.8±2.5d
Fructosamine 495.8±17.9a 990±10.4d 792.4±72.9c 607.3±5.3b 572.5±9.2b 743.6±37.4c 438.8±38.8a
HOMA-IR 2.1±0.3a 14.0±0.3f 8.4±0.3e 6.9±0.5d 6.5±0.7d 5.2±0.3c 3.1±0.1b
HOMA-β 100.3±1.7e 2.7±0.2a 8.3±0.3bc 35.6±2.5d 11.9±1.3c 7.0±0.4b 169.7±4.3f
Results are expressed as mean ± SD (n=7). a-fDifferent superscript letters for a given parameter along a row indicate the
significance of difference (Tukey’s-HSD multiple range post hoc test, p < 0.05). NC, Normal control, DBC, Diabetic control,
DCRL, Diabetic C. rubens low dose, DCRH, Diabetic C. rubens high dose, DBM, Diabetic metformin, DBG, Diabetic
glibenclamide, NCR, Normal C. rubens high dose (toxicological control). HOMA-IR and HOMA-β; Homeostatic model
assessment for IR (insulin resistance) and β (β-cell function).
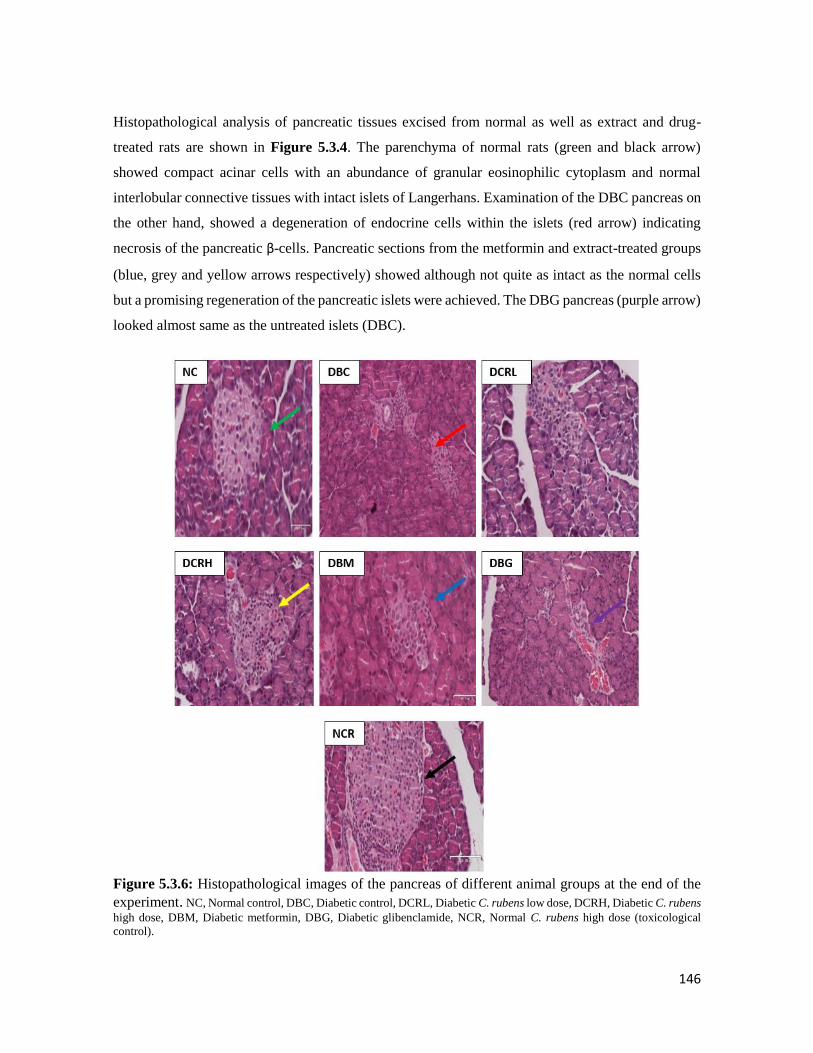
146
Histopathological analysis of pancreatic tissues excised from normal as well as extract and drug-
treated rats are shown in Figure 5.3.4. The parenchyma of normal rats (green and black arrow)
showed compact acinar cells with an abundance of granular eosinophilic cytoplasm and normal
interlobular connective tissues with intact islets of Langerhans. Examination of the DBC pancreas on
the other hand, showed a degeneration of endocrine cells within the islets (red arrow) indicating
necrosis of the pancreatic β-cells. Pancreatic sections from the metformin and extract-treated groups
(blue, grey and yellow arrows respectively) showed although not quite as intact as the normal cells
but a promising regeneration of the pancreatic islets were achieved. The DBG pancreas (purple arrow)
looked almost same as the untreated islets (DBC).
Figure 5.3.6: Histopathological images of the pancreas of different animal groups at the end of the
experiment. NC, Normal control, DBC, Diabetic control, DCRL, Diabetic C. rubens low dose, DCRH, Diabetic C. rubens
high dose, DBM, Diabetic metformin, DBG, Diabetic glibenclamide, NCR, Normal C. rubens high dose (toxicological
control).
147
5.3.5 Discussion
The T2D animal model used in this study successfully mimicked the two main pathological features
of T2D which are insulin resistance and partial pancreatic β-cell dysfunction. Normal rats were first
given a 10% fructose solution for two weeks to induce insulin resistance and then an intraperitoneal
injection of streptozotocin (40 mg/kg bw) to induce partial pancreatic β-cell dysfunction (Wilson and
Islam, 2012).
Severe complications of T2D include hyperosmolar and hyperglycaemic non-ketotic syndrome
(Knentz et al., 1991) while more common symptoms of T2D include polydipsia, polyphagia, lethargy,
visual blurriness and weight loss (Afolayan and Sunmonu, 2010). In this study, the increased fluid
intake seen in the diabetic groups reflected successful T2D-induction (Figure 5.3.1). Although
CRAQ-treatment reduced the fluid intake of the animals, it was not as low as the fluid intake of the
normal group which could be as a result of a short intervention time (5 weeks). Body weight loss is
another physical symptom of T2D which occurs due to increased protein glycation which is a
consequence of persistent hyperglycaemic and leads to the loss of muscle and tissue protein (Mbaka
et al., 2014). There was a decrease in body weight of all diabetic animals after STZ injection which
again confirmed the induction of T2D. Interestingly, the high dose of CRAQ was able to increase and
sustain the body weight of the diabetic animals all through the intervention period. This may be
related to the high nutrient level of C. rubens (Adjatin et al., 2013b).
The non-fasting and fasting (at the last week) blood glucose levels were measured during the 5-week
intervention period, this is because NFBG is a key parameter in understanding the severity of T2D
(Group, 1998). From our result (Figure 5.3.3), CRAQ showed potent blood glucose lowering activity.
Right from the second week and all through the intervention period, the DCRH group displayed low
blood glucose levels. Some processes might be responsible for the observed blood glucose lowering
activity of CRAQ, such as improvement of insulin action (Islam and Choi, 2008), pancreatic β-cell
stimulation (Remedi and Emfinger, 2016) or improved uptake of glucose by the peripheral tissues
(Oyebode et al., 2018). There are reports that plants have β-cell protecting and regenerating abilities
(Oh, 2015). Since the DCRH group showed reduced blood glucose level from as early as the second
week of intervention, it might be due to CRAQ stimulated the survival of pancreatic β-cells as well
as induced insulin production after the oxidative damage caused by STZ. This could also be explained
by Figure 5.3.6 where marked regeneration of the damaged pancreatic islets in the DCRH group
was observed compared to the DBC group.
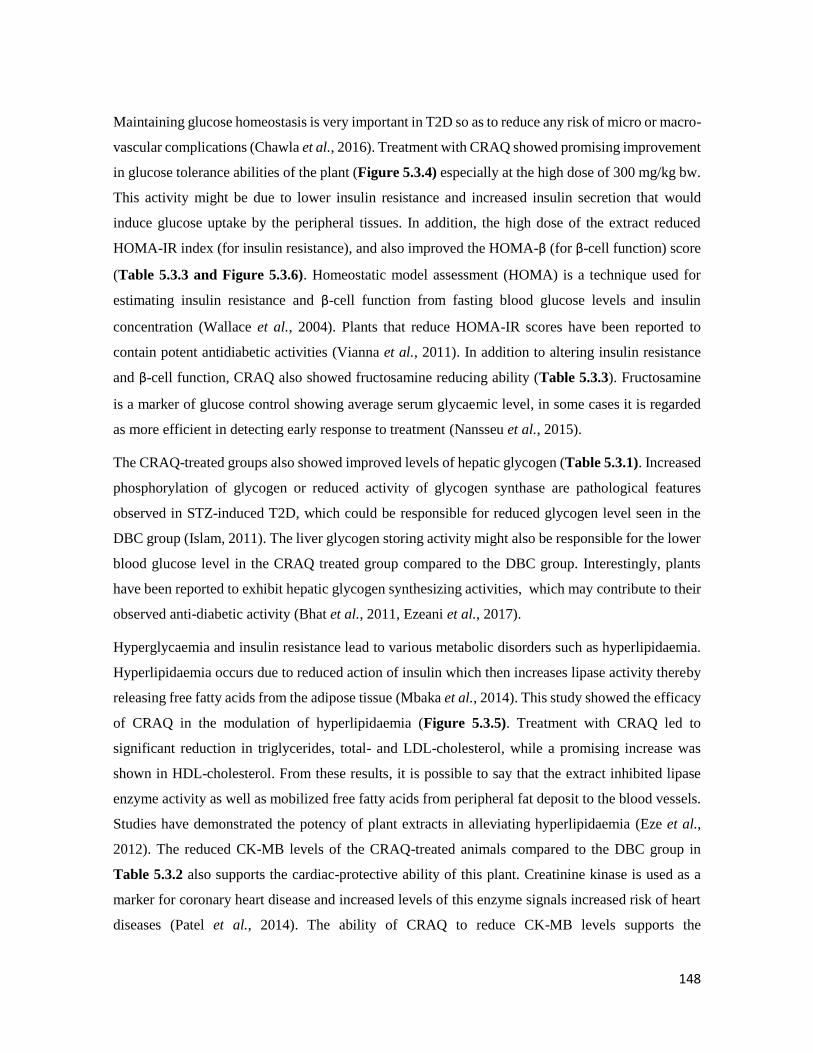
148
Maintaining glucose homeostasis is very important in T2D so as to reduce any risk of micro or macro-
vascular complications (Chawla et al., 2016). Treatment with CRAQ showed promising improvement
in glucose tolerance abilities of the plant (Figure 5.3.4) especially at the high dose of 300 mg/kg bw.
This activity might be due to lower insulin resistance and increased insulin secretion that would
induce glucose uptake by the peripheral tissues. In addition, the high dose of the extract reduced
HOMA-IR index (for insulin resistance), and also improved the HOMA-β (for β-cell function) score
(Table 5.3.3 and Figure 5.3.6). Homeostatic model assessment (HOMA) is a technique used for
estimating insulin resistance and β-cell function from fasting blood glucose levels and insulin
concentration (Wallace et al., 2004). Plants that reduce HOMA-IR scores have been reported to
contain potent antidiabetic activities (Vianna et al., 2011). In addition to altering insulin resistance
and β-cell function, CRAQ also showed fructosamine reducing ability (Table 5.3.3). Fructosamine
is a marker of glucose control showing average serum glycaemic level, in some cases it is regarded
as more efficient in detecting early response to treatment (Nansseu et al., 2015).
The CRAQ-treated groups also showed improved levels of hepatic glycogen (Table 5.3.1). Increased
phosphorylation of glycogen or reduced activity of glycogen synthase are pathological features
observed in STZ-induced T2D, which could be responsible for reduced glycogen level seen in the
DBC group (Islam, 2011). The liver glycogen storing activity might also be responsible for the lower
blood glucose level in the CRAQ treated group compared to the DBC group. Interestingly, plants
have been reported to exhibit hepatic glycogen synthesizing activities, which may contribute to their
observed anti-diabetic activity (Bhat et al., 2011, Ezeani et al., 2017).
Hyperglycaemia and insulin resistance lead to various metabolic disorders such as hyperlipidaemia.
Hyperlipidaemia occurs due to reduced action of insulin which then increases lipase activity thereby
releasing free fatty acids from the adipose tissue (Mbaka et al., 2014). This study showed the efficacy
of CRAQ in the modulation of hyperlipidaemia (Figure 5.3.5). Treatment with CRAQ led to
significant reduction in triglycerides, total- and LDL-cholesterol, while a promising increase was
shown in HDL-cholesterol. From these results, it is possible to say that the extract inhibited lipase
enzyme activity as well as mobilized free fatty acids from peripheral fat deposit to the blood vessels.
Studies have demonstrated the potency of plant extracts in alleviating hyperlipidaemia (Eze et al.,
2012). The reduced CK-MB levels of the CRAQ-treated animals compared to the DBC group in
Table 5.3.2 also supports the cardiac-protective ability of this plant. Creatinine kinase is used as a
marker for coronary heart disease and increased levels of this enzyme signals increased risk of heart
diseases (Patel et al., 2014). The ability of CRAQ to reduce CK-MB levels supports the
149
hyperlipidaemia-alleviating properties of this plant (Table 5.3.3) which together renders cardio-
protective ability in T2D patients.
Core markers of liver injury are alanine aminotransferase (ALT) and aspartate aminotransferase
(AST) while alkaline phosphatase (ALP) is a marker for cholestasis (liver disease which causes
itching) (Malakouti et al., 2017). Although T2D-induction did not show any impact on serum ALT
levels (Table 5.3.2), increased ALP and AST levels were observed in the DBC group compared to
the NC group; however treatment with CRAQ showed reduced levels of these enzymes which shows
the hepatoprotective ability of the extract.
Serum urea and uric acid are markers of kidney failure. Studies have shown that in T2D, serum urea
and uric acid is usually elevated (Kushiyama et al., 2014). In Table 5.3.2 the DBC groups showed
elevated urea and uric acid levels compared to the normal groups. Treatment with CRAQ alleviated
the effect of these enzymes, which shows the ability of this extract to limit the risk of kidney problems.
5.3.6 Conclusions
In conclusion, the results of this study suggest that the aqueous extract of Crassocephalum rubens
aerial parts dose-dependently portrays anti-diabetic activity, mechanisms may include improving
pancreatic β-cell function, stimulating insulin secretion, improving glucose tolerance, reducing
hyperlipidemia and increasing hepatic glycogen. The extract also ameliorated some T2D-induced
complications. Hence, it can be used for the traditional management of T2D.

150
5.4 Aqueous extract of Crassocephalum rubens aerial parts ameliorates oxidative
stress in a type 2 diabetes model of rats
1Olajumoke A. Oyebode, 1Ochuko L. Erukainure, 2Neil A. Koorbanally, 1Md. Shahidul Islam*
1 Department of Biochemistry, 2 School of Chemistry and Physics University of KwaZulu-Natal,
(Westville Campus), Durban 4000, South Africa.
*Corresponding author: [email protected]; Tel: +27 (0)31-260-8717; Fax: +27 (0)31-260-7942
Preface: This article reports the detailed in vivo antioxidant status of the serum and organs collected
from the rats in the above experiment and it is currently awaiting revision before submission to a
journal for publication.
5.4.1 Abstract
The effects of oral administration of the Crassocephalum rubens aqueous extract (CRAQ) on
antioxidant status in the serum, pancreas, liver, kidney and heart of type 2 diabetic rats was examined.
Alterations in important functional groups in the liver and pancreas were also monitored using Fourier
Transform Infrared (FT-IR) spectroscopy. The male SD rats were induced with type 2 diabetes (T2D)
and treated with 150 or 300 mg/kg bw of CRAQ. Levels of TBARS (thiobarbituric acid reactive
substances), catalase, super oxide dismutase (SOD), reduced glutathione, glutathione reductase and
glutathione peroxidase were measured in selected organs and serum were investigated at the end of
the intervention period. Induction of type 2 diabetes (T2D) caused a significant (p < 0.05) decrease
of endogenous antioxidant enzymes, as well as an increment in MDA levels (a marker of lipid
peroxidation) in the diabetic rats. However, treatment with CRAQ caused a dose-dependent and
significant (p < 0.05) increase in reduced glutathione levels and other endogenous antioxidant
enzymes in the serum and other organs compared to diabetic control group. The FT-IR analysis
showed a reduction of fasting blood glucose levels after the treatment with the high dose of CRAQ
which is consistent with reduced FT-IR peaks at 1200-900 cm-1. Results of this study indicate that
high dose (300 mg/kg bw) of CRAQ possess strong antioxidant effect in a type 2 diabetic model of
rats.
Keywords: Crassocephalum rubens, oxidative stress, antioxidants, FT-IR, rats

151
5.4.2 Introduction
Under normal physiological conditions, a complex system of endogenous enzymatic and non-
enzymatic antioxidant defences work to combat the deleterious effects of free radicals generated from
normal metabolic processes (Kurutas, 2015). These free radicals are implicated in the generation of
complications linked to diseases such as diabetes (Asmat et al., 2016). Diabetes mellitus is a complex
disease that has quickly become a problem to global public health (Roglic, 2016). Out of the three
main types of diabetes, type 2 diabetes (T2D) remains the most prevalent form with 95% of all
diabetic cases being type 2 diabetic (IDF, 2017). Persistent hyperglycemia, insulin resistance and
partial pancreatic β-cell dysfunction are the main pathogenesis of T2D. Autooxidation of excess
glucose in the blood stream as a result of insulin resistance has been linked to the generation of free
radicals in T2D (Lyons et al., 1992). These free radicals overwhelm the concentration of antioxidant
enzymes in the body thereby leading to the progression of oxidative stress. Oxidative stress causes a
host of complications affecting various organs such as heart, liver, kidney, eyes, arteries of patients
suffering from T2D. Fortunately, plants have been used successfully as a source of potent antioxidants
in curbing the effects of free radicals in oxidative stress conditions. Medicinal plants contain potent
hydrogen donating, oxygen quenching, free radical scavenging activities that are beneficial in
managing complications of T2D (Garhwal, 2010). The effect of this plants can be due to the presence
of potent bioactive components such as tannins, polyphenols, saponins, and others. An example of a
medicinal plant with antidiabetic activity is Crasssocephalum rubens.
Crassocephalum rubens belongs to the family Asteraceae; and is a perennial shrub that is mostly
eaten and enjoyed as a vegetable in salads and sauces in various parts of Africa. It is successfully
used in the treatment and management of diseases such as diabetes. Preliminary in vitro α-glucosidase
and lipase inhibitory potential of different solvent extracts of aerial parts of C. rubens has been
reported in Section 5.2. In a previous study, the crude ethanol, ethyl acetate and aqueous extracts of
the plant was subjected to different in vitro, ex vivo and in silico antioxidant and anti-diabetic assays
from which the aqueous extract was chosen as the most active compared to all other solvent extracts
(see section 5.2 above). This also led to investigate the anti-diabetic effect of CRAQ in a type 2
diabetes rat model (Section 5.3). Our results showed that CRAQ has glucose lowering, insulin
resistance alleviating and β-cell protective abilities as well as cardiac, hepatic and renal protective
abilities in diabetic conditions.
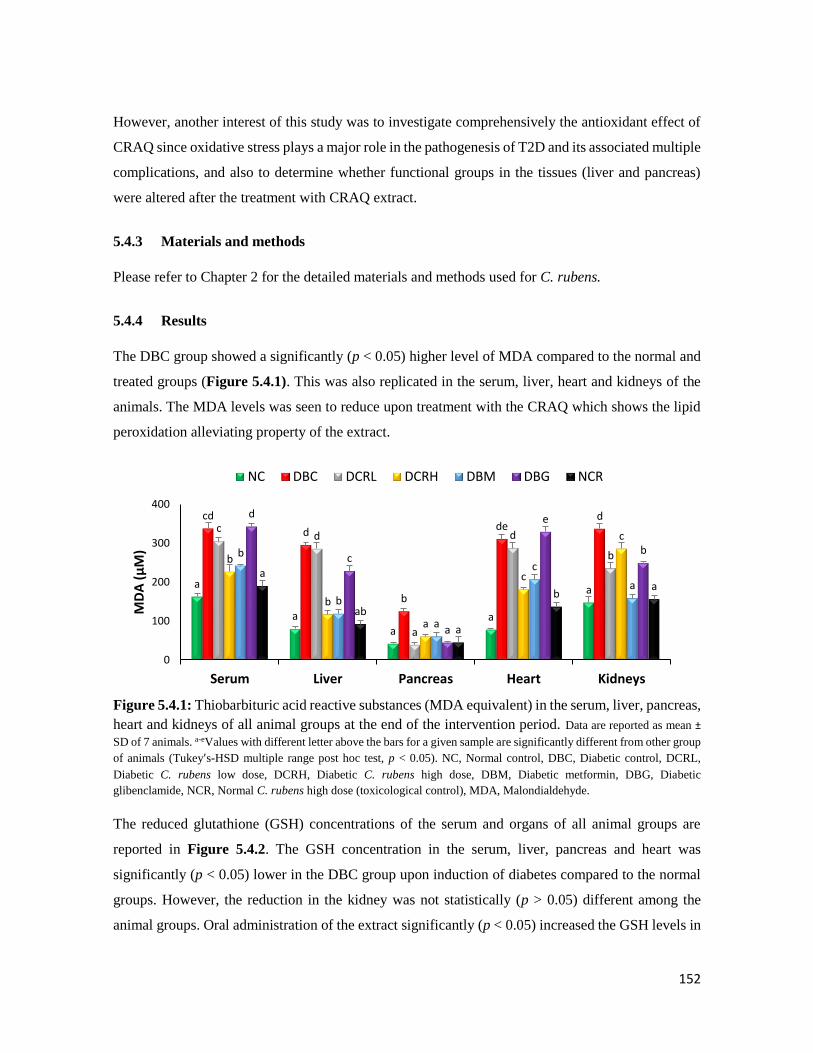
152
However, another interest of this study was to investigate comprehensively the antioxidant effect of
CRAQ since oxidative stress plays a major role in the pathogenesis of T2D and its associated multiple
complications, and also to determine whether functional groups in the tissues (liver and pancreas)
were altered after the treatment with CRAQ extract.
5.4.3 Materials and methods
Please refer to Chapter 2 for the detailed materials and methods used for C. rubens.
5.4.4 Results
The DBC group showed a significantly (p < 0.05) higher level of MDA compared to the normal and
treated groups (Figure 5.4.1). This was also replicated in the serum, liver, heart and kidneys of the
animals. The MDA levels was seen to reduce upon treatment with the CRAQ which shows the lipid
peroxidation alleviating property of the extract.
Figure 5.4.1: Thiobarbituric acid reactive substances (MDA equivalent) in the serum, liver, pancreas,
heart and kidneys of all animal groups at the end of the intervention period. Data are reported as mean ±
SD of 7 animals. a-eValues with different letter above the bars for a given sample are significantly different from other group
of animals (Tukey’s-HSD multiple range post hoc test, p < 0.05). NC, Normal control, DBC, Diabetic control, DCRL,
Diabetic C. rubens low dose, DCRH, Diabetic C. rubens high dose, DBM, Diabetic metformin, DBG, Diabetic
glibenclamide, NCR, Normal C. rubens high dose (toxicological control), MDA, Malondialdehyde.
The reduced glutathione (GSH) concentrations of the serum and organs of all animal groups are
reported in Figure 5.4.2. The GSH concentration in the serum, liver, pancreas and heart was
significantly (p < 0.05) lower in the DBC group upon induction of diabetes compared to the normal
groups. However, the reduction in the kidney was not statistically (p > 0.05) different among the
animal groups. Oral administration of the extract significantly (p < 0.05) increased the GSH levels in
a
a
aa
a
cd
d
b
ded
cd
a
d
bb
b
a
c
c
b
b
a
c
a
d
c
a
e
b
a
ab
a
ba
0
100
200
300
400
Serum Liver Pancreas Heart Kidneys
MD
A (
µM
)
NC DBC DCRL DCRH DBM DBG NCR

153
the liver of the DCRH group. There was no significant difference between the induction of GSH
levels by the DCRL and DCRH groups in the serum and pancreas, while in the heart, the DCRL group
showed significantly higher GSH level than the high dose of the extract.
Figure 5.4.2: Reduced glutathione (GSH) levels in the serum, liver, pancreas, heart and kidneys of
all animal groups at the end of the intervention period. Data are reported as mean ± SD of 7 animals. a-cValues
with different letter above the bars for a given sample are significantly different from each other group of animals (Tukey’s-
HSD multiple range post hoc test, p < 0.05). NC, Normal control, DBC, Diabetic control, DCRL, Diabetic C. rubens low
dose, DCRH, Diabetic C. rubens high dose, DBM, Diabetic metformin, DBG, Diabetic glibenclamide, NCR, Normal C.
rubens high dose (toxicological control).
Figure 5.4.3 shows the data for the catalase activity in serum and organs of all animal groups. The
catalase activity in the liver, pancreas, heart and kidneys of DBC group was significantly (p < 0.05)
lower compared to the normal groups. The liver showed the highest catalase activity amongst the
serum and organs. However, CRAQ treatment significantly (p < 0.05) increased the catalase activity
in the organs of diabetic animals with DCRH group showing the better activity than the low dose in
the serum and organs.
Figure 5.4.3: Catalase activity in the serum, liver, pancreas, heart and kidneys of all animal groups
at the end of the intervention period. Data are reported as mean ± SD of 7 animals. a-eValues with different letter
above the bars for a given sample are significantly different from other group of animals (Tukey’s-HSD multiple range post
hoc test, p < 0.05). NC, Normal control; DBC, Diabetic control; DCRL, Diabetic C. rubens low dose; DCRH, Diabetic C.
rubens high dose; DBM, Diabetic metformin; DBG, Diabetic glibenclamide; NCR, Normal C. rubens high dose
(toxicological control).
c
c
d
bc
a
a a
aab
a ab
c
ab
b
ab
abb
b
bc
cc
b
aba
cbc
cdbc
0
50
100
150
200
Serum Liver Pancreas Heart Kidneys
GSH
(µ
M)
NC DBC DCRL DCRH DBM DBG NCR
bc
e
d cda
a
a ab
a
c
bc ab
b
d
cd bc
bc
c
bc
ca
b
aa
a
c
e
d c
cd
0
40
80
120
160
Serum Liver Pancreas Heart Kidneys
Cat
alas
e ac
tivi
ty (
KU
)
NC DBC DCRL DCRH DBM DBG NCR
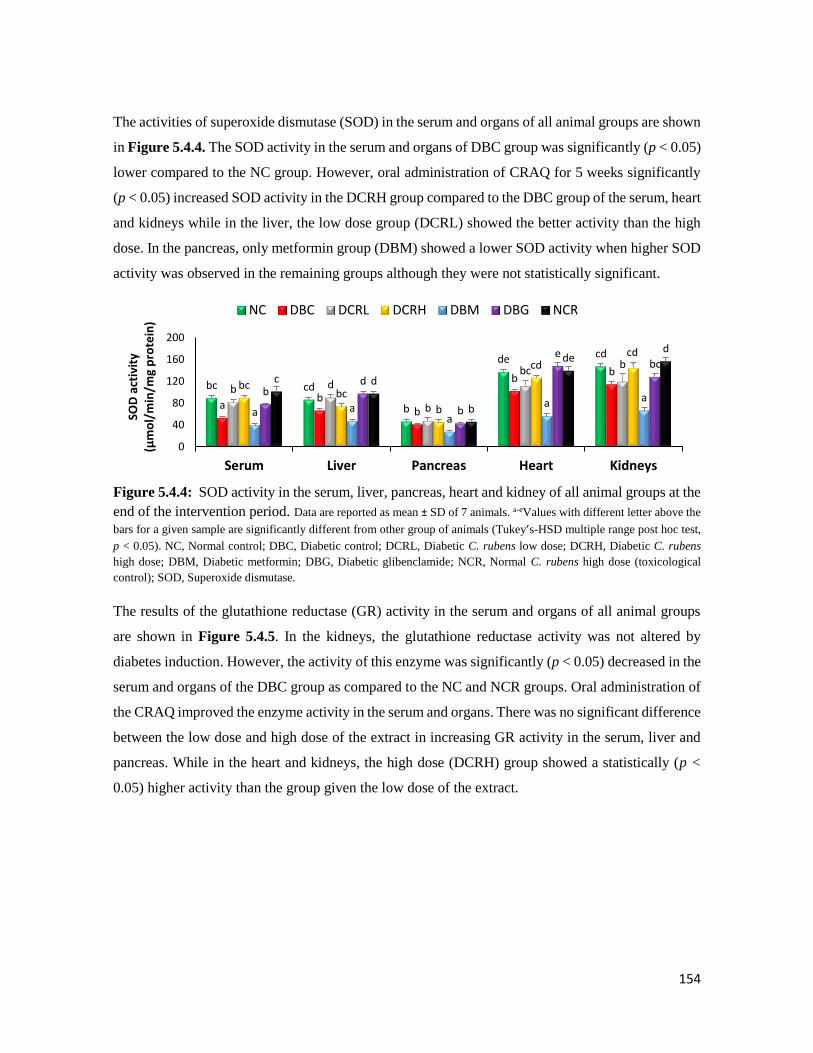
154
The activities of superoxide dismutase (SOD) in the serum and organs of all animal groups are shown
in Figure 5.4.4. The SOD activity in the serum and organs of DBC group was significantly (p < 0.05)
lower compared to the NC group. However, oral administration of CRAQ for 5 weeks significantly
(p < 0.05) increased SOD activity in the DCRH group compared to the DBC group of the serum, heart
and kidneys while in the liver, the low dose group (DCRL) showed the better activity than the high
dose. In the pancreas, only metformin group (DBM) showed a lower SOD activity when higher SOD
activity was observed in the remaining groups although they were not statistically significant.
Figure 5.4.4: SOD activity in the serum, liver, pancreas, heart and kidney of all animal groups at the
end of the intervention period. Data are reported as mean ± SD of 7 animals. a-eValues with different letter above the
bars for a given sample are significantly different from other group of animals (Tukey’s-HSD multiple range post hoc test,
p < 0.05). NC, Normal control; DBC, Diabetic control; DCRL, Diabetic C. rubens low dose; DCRH, Diabetic C. rubens
high dose; DBM, Diabetic metformin; DBG, Diabetic glibenclamide; NCR, Normal C. rubens high dose (toxicological
control); SOD, Superoxide dismutase.
The results of the glutathione reductase (GR) activity in the serum and organs of all animal groups
are shown in Figure 5.4.5. In the kidneys, the glutathione reductase activity was not altered by
diabetes induction. However, the activity of this enzyme was significantly (p < 0.05) decreased in the
serum and organs of the DBC group as compared to the NC and NCR groups. Oral administration of
the CRAQ improved the enzyme activity in the serum and organs. There was no significant difference
between the low dose and high dose of the extract in increasing GR activity in the serum, liver and
pancreas. While in the heart and kidneys, the high dose (DCRH) group showed a statistically (p <
0.05) higher activity than the group given the low dose of the extract.
bc cd
b
de cd
ab
b
bb
b d
b
bcb
bcbc
b
cdcd
a aa
a ab
d
b
ebc
c d
b
ded
0
40
80
120
160
200
Serum Liver Pancreas Heart Kidneys
SOD
act
ivit
y (µ
mo
l/m
in/m
g p
rote
in)
NC DBC DCRL DCRH DBM DBG NCR
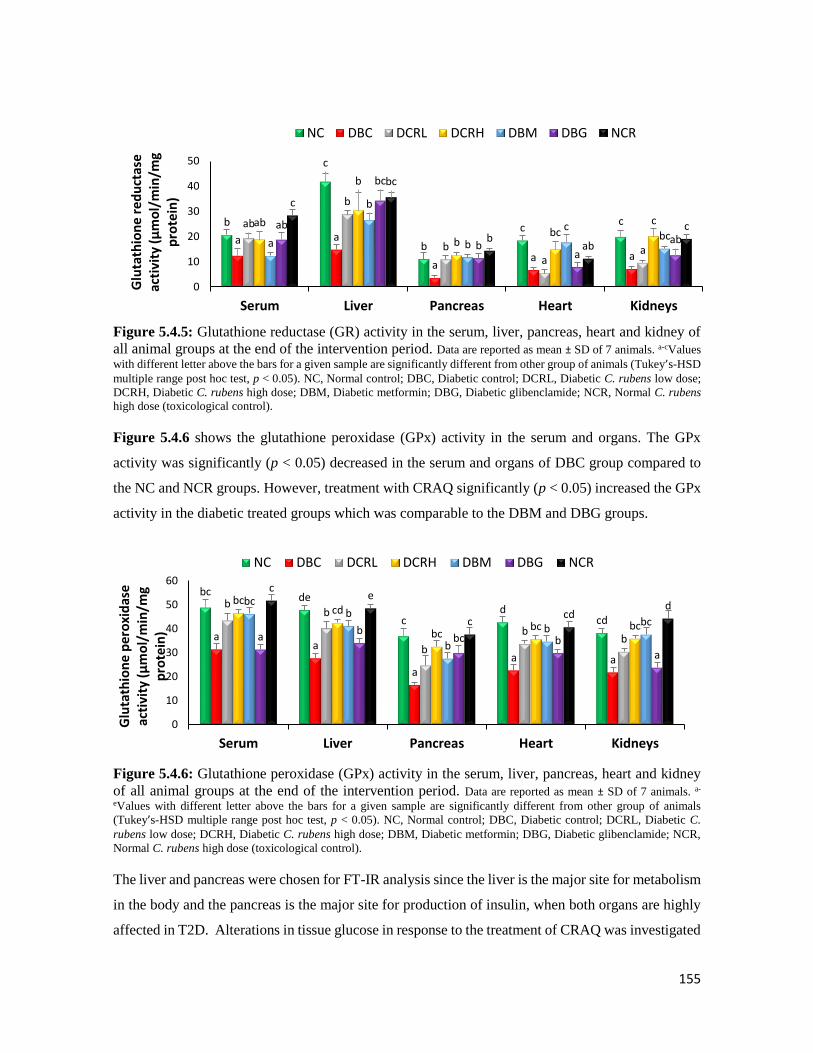
155
Figure 5.4.5: Glutathione reductase (GR) activity in the serum, liver, pancreas, heart and kidney of
all animal groups at the end of the intervention period. Data are reported as mean ± SD of 7 animals. a-cValues
with different letter above the bars for a given sample are significantly different from other group of animals (Tukey’s-HSD
multiple range post hoc test, p < 0.05). NC, Normal control; DBC, Diabetic control; DCRL, Diabetic C. rubens low dose;
DCRH, Diabetic C. rubens high dose; DBM, Diabetic metformin; DBG, Diabetic glibenclamide; NCR, Normal C. rubens
high dose (toxicological control).
Figure 5.4.6 shows the glutathione peroxidase (GPx) activity in the serum and organs. The GPx
activity was significantly (p < 0.05) decreased in the serum and organs of DBC group compared to
the NC and NCR groups. However, treatment with CRAQ significantly (p < 0.05) increased the GPx
activity in the diabetic treated groups which was comparable to the DBM and DBG groups.
Figure 5.4.6: Glutathione peroxidase (GPx) activity in the serum, liver, pancreas, heart and kidney
of all animal groups at the end of the intervention period. Data are reported as mean ± SD of 7 animals. a-
eValues with different letter above the bars for a given sample are significantly different from other group of animals
(Tukey’s-HSD multiple range post hoc test, p < 0.05). NC, Normal control; DBC, Diabetic control; DCRL, Diabetic C.
rubens low dose; DCRH, Diabetic C. rubens high dose; DBM, Diabetic metformin; DBG, Diabetic glibenclamide; NCR,
Normal C. rubens high dose (toxicological control).
The liver and pancreas were chosen for FT-IR analysis since the liver is the major site for metabolism
in the body and the pancreas is the major site for production of insulin, when both organs are highly
affected in T2D. Alterations in tissue glucose in response to the treatment of CRAQ was investigated
b
c
b
cc
a a
aa a
ab
b
ba
a
ab
b
bbc
c
a
b
b
cbc
ab
bc
ba
ab
c
bc
bab
c
0
10
20
30
40
50
Serum Liver Pancreas Heart Kidneys
Glu
tath
ion
e re
du
ctas
e ac
tivi
ty (
µm
ol/
min
/mg
pro
tein
)
NC DBC DCRL DCRH DBM DBG NCR
bc de
cd
cd
aa
aa a
bb
b
bb
bccd
bcbc bc
bcb
b
bbc
ab
bc ba
ce
ccd
d
0
10
20
30
40
50
60
Serum Liver Pancreas Heart Kidneys
Glu
tath
ion
e p
ero
xid
ase
ac
tivi
ty (
µm
ol/
min
/mg
pro
tein
)
NC DBC DCRL DCRH DBM DBG NCR
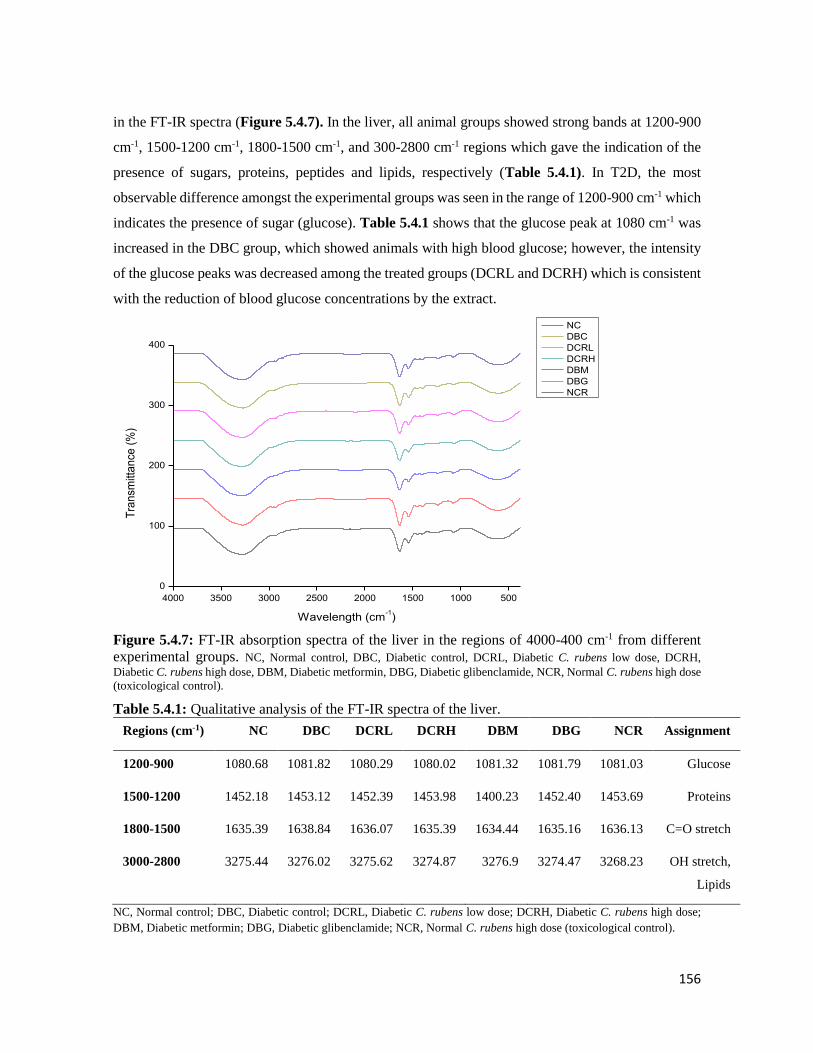
156
in the FT-IR spectra (Figure 5.4.7). In the liver, all animal groups showed strong bands at 1200-900
cm-1, 1500-1200 cm-1, 1800-1500 cm-1, and 300-2800 cm-1 regions which gave the indication of the
presence of sugars, proteins, peptides and lipids, respectively (Table 5.4.1). In T2D, the most
observable difference amongst the experimental groups was seen in the range of 1200-900 cm-1 which
indicates the presence of sugar (glucose). Table 5.4.1 shows that the glucose peak at 1080 cm-1 was
increased in the DBC group, which showed animals with high blood glucose; however, the intensity
of the glucose peaks was decreased among the treated groups (DCRL and DCRH) which is consistent
with the reduction of blood glucose concentrations by the extract.
4000 3500 3000 2500 2000 1500 1000 500
0
100
200
300
400
Tra
nsm
itta
nce
(%
)
Wavelength (cm-1)
NC
DBC
DCRL
DCRH
DBM
DBG
NCR
Figure 5.4.7: FT-IR absorption spectra of the liver in the regions of 4000-400 cm-1 from different
experimental groups. NC, Normal control, DBC, Diabetic control, DCRL, Diabetic C. rubens low dose, DCRH,
Diabetic C. rubens high dose, DBM, Diabetic metformin, DBG, Diabetic glibenclamide, NCR, Normal C. rubens high dose
(toxicological control).
Table 5.4.1: Qualitative analysis of the FT-IR spectra of the liver.
Regions (cm-1) NC DBC DCRL DCRH DBM DBG NCR Assignment
1200-900 1080.68 1081.82 1080.29 1080.02 1081.32 1081.79 1081.03 Glucose
1500-1200 1452.18 1453.12 1452.39 1453.98 1400.23 1452.40 1453.69 Proteins
1800-1500 1635.39 1638.84 1636.07 1635.39 1634.44 1635.16 1636.13 C=O stretch
3000-2800 3275.44 3276.02 3275.62 3274.87 3276.9 3274.47 3268.23 OH stretch,
Lipids
NC, Normal control; DBC, Diabetic control; DCRL, Diabetic C. rubens low dose; DCRH, Diabetic C. rubens high dose;
DBM, Diabetic metformin; DBG, Diabetic glibenclamide; NCR, Normal C. rubens high dose (toxicological control).
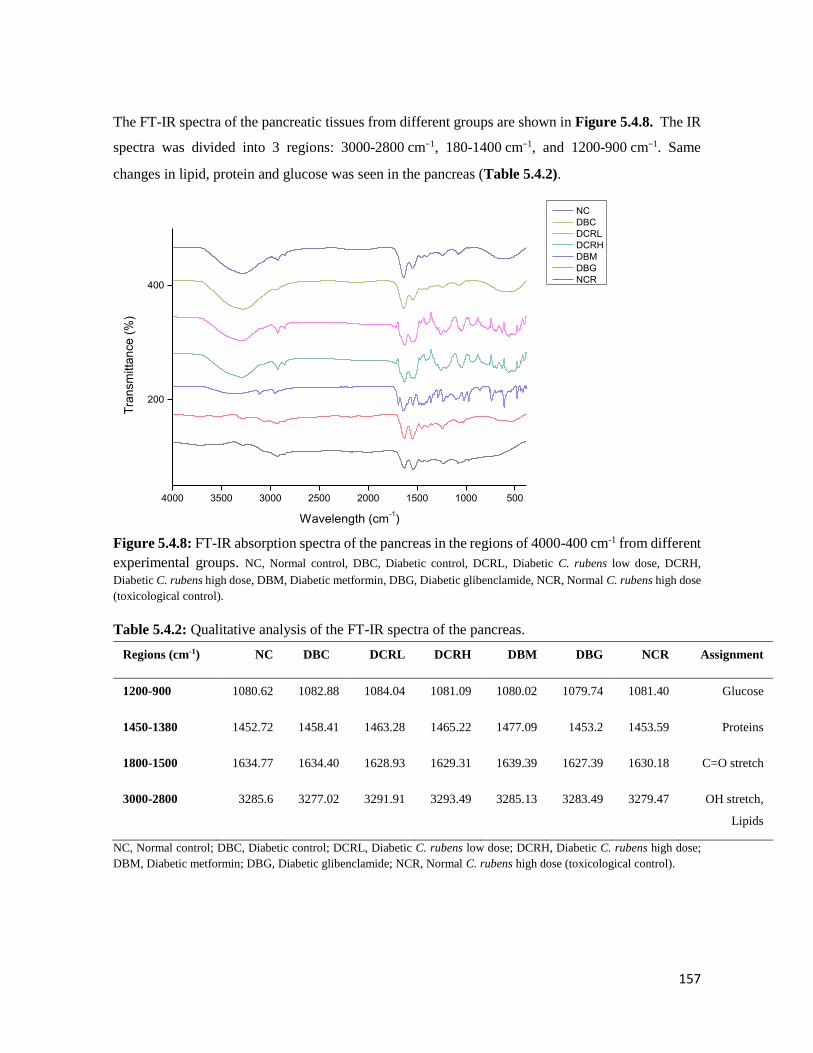
157
The FT-IR spectra of the pancreatic tissues from different groups are shown in Figure 5.4.8. The IR
spectra was divided into 3 regions: 3000-2800 cm−1, 180-1400 cm−1, and 1200-900 cm−1. Same
changes in lipid, protein and glucose was seen in the pancreas (Table 5.4.2).
4000 3500 3000 2500 2000 1500 1000 500
200
400
Tra
nsm
itta
nce
(%
)
Wavelength (cm-1)
NC
DBC
DCRL
DCRH
DBM
DBG
NCR
Figure 5.4.8: FT-IR absorption spectra of the pancreas in the regions of 4000-400 cm-1 from different
experimental groups. NC, Normal control, DBC, Diabetic control, DCRL, Diabetic C. rubens low dose, DCRH,
Diabetic C. rubens high dose, DBM, Diabetic metformin, DBG, Diabetic glibenclamide, NCR, Normal C. rubens high dose
(toxicological control).
Table 5.4.2: Qualitative analysis of the FT-IR spectra of the pancreas.
Regions (cm-1) NC DBC DCRL DCRH DBM DBG NCR Assignment
1200-900 1080.62 1082.88 1084.04 1081.09 1080.02 1079.74 1081.40 Glucose
1450-1380 1452.72 1458.41 1463.28 1465.22 1477.09 1453.2 1453.59 Proteins
1800-1500 1634.77 1634.40 1628.93 1629.31 1639.39 1627.39 1630.18 C=O stretch
3000-2800 3285.6 3277.02 3291.91 3293.49 3285.13 3283.49 3279.47 OH stretch,
Lipids
NC, Normal control; DBC, Diabetic control; DCRL, Diabetic C. rubens low dose; DCRH, Diabetic C. rubens high dose;
DBM, Diabetic metformin; DBG, Diabetic glibenclamide; NCR, Normal C. rubens high dose (toxicological control).
158
5.4.5 Discussion
Reducing the prevalence of obesity, which is closely linked to increased risk of T2D and
cardiovascular diseases, needs a dietary focus (Asif, 2014). Higher consumption of whole grains,
fruits and vegetables reduces the risk of T2D and its related complications. Plant based
phytochemicals provide much of the nutrients, taste and colour in fresh vegetables, therefore it is is
highly favoured by locals in parts of western Nigeria for its rich taste in making various delicacies.
C. rubens contains potent free radical and lipid peroxidation inhibiting phytochemicals (Adjatin et
al., 2012).
The lipid bilayer of the cell membrane is mostly affected by peroxidation of free radicals, and lipid
peroxidation plays a huge role in the initiation of damages to the cell in T2D (Farzaei et al., 2017).
Induction of T2D with elevated MDA levels in the diabetic untreated group (DBC) compared to the
normal groups. Previous research has demonstrated that pancreatic β-cell damage, increased renal,
cardiac and liver function parameters might consequently lead to increase in MDA levels in diabetic
rats (Ali et al., 2017). Interestingly, data from this study (Figure 5.4.1) showed lipid peroxidation-
ameliorating potential of CRAQ. Inhibition of lipid peroxidation (through reduction of MDA levels)
in the serum and organs of the diabetic rats further highlights the oxygen quenching effect of CRAQ.
Reduced glutathione is an effective extracellular compound which scavenges hydrogen peroxide and
hydroperoxide and donates protons to membrane lipids and protects them from oxidant damages
(Nurdiana et al., 2017). The ability of CRAQ to increase the levels of GSH (Figure 5.4.2) and activity
of glutathione reductase (Figure 5.4.5) supports the antioxidant benefit of the plant.
Three first line defence systems were investigated in this study including superoxide dismutase
(SOD), catalase and glutathione peroxidase (Ighodaro and Akinloye, 2017). These enzymes, in the
same order, dismutates superoxide free radical, transform hydrogen peroxides and hydroperoxides to
relatively harmless molecules such as H2O/alcohol and oxygen. The superoxide dismutase (SOD)
catalyses the conversion of superoxide radical generated in tissue to hydrogen peroxide (H2O2) and
oxygen (Fukai and Ushio-Fukai, 2011). Accumulation of H2O2 causes toxicity to the cells and tissues.
In the presence of iron (Fe2+), H2O2 is converted to hydroxyl radical through the Fenton reaction
(Birben et al., 2012). Catalase breaks down H2O2 into water and molecular oxygen consequently
reducing free radical damage. However, the absence of catalase in the mitochondria makes
glutathione peroxidase responsible for breaking-down the H2O2 to water (Ighodaro and Akinloye,
2017). Our study showed the ability of CRAQ to increase the activity of these first line defence

159
enzymes (Figure 5.4.4, 5.4.3 and 5.4.6) in the serum and organs of type 2 diabetic animals which
again confirm its antioxidative potential.
An important finding of the present work is the changes in liver and pancreas which are supported by
the FT-IR peaks. Previous studies have shown that the alterations in the IR spectra is related to the
subsequent changes in structure and function of the liver (Baker et al., 2014, Nurdiana et al., 2017).
Most importantly, reduction of FBG is suspected by reduced FT-IR peaks at 1200-900 cm-1, while
induction of T2D with STZ increased the intensity of glucose peak in the pancreas (Figure 5.4.8 and
Table 5.4.2) of diabetic animals is indicative of insulin deprivation in the cells.
5.4.6 Conclusions
In conclusion, the high dose of CRAQ was found to provide better antioxidant effect than the low
dose; this result is comparable to a recent study where the protective effect of 300 mg/kg bw of
aqueous extract of C. rubens was tested in rats with rifampicin-induced oxidative damage (Omoregie
et al., 2015). From overall findings of that study, it was suggested that the presence of flavonoids and
proanthocyanins might be responsible for the observed free radical scavenging activity of the plant
which protected hepatic cells from oxidative damage.
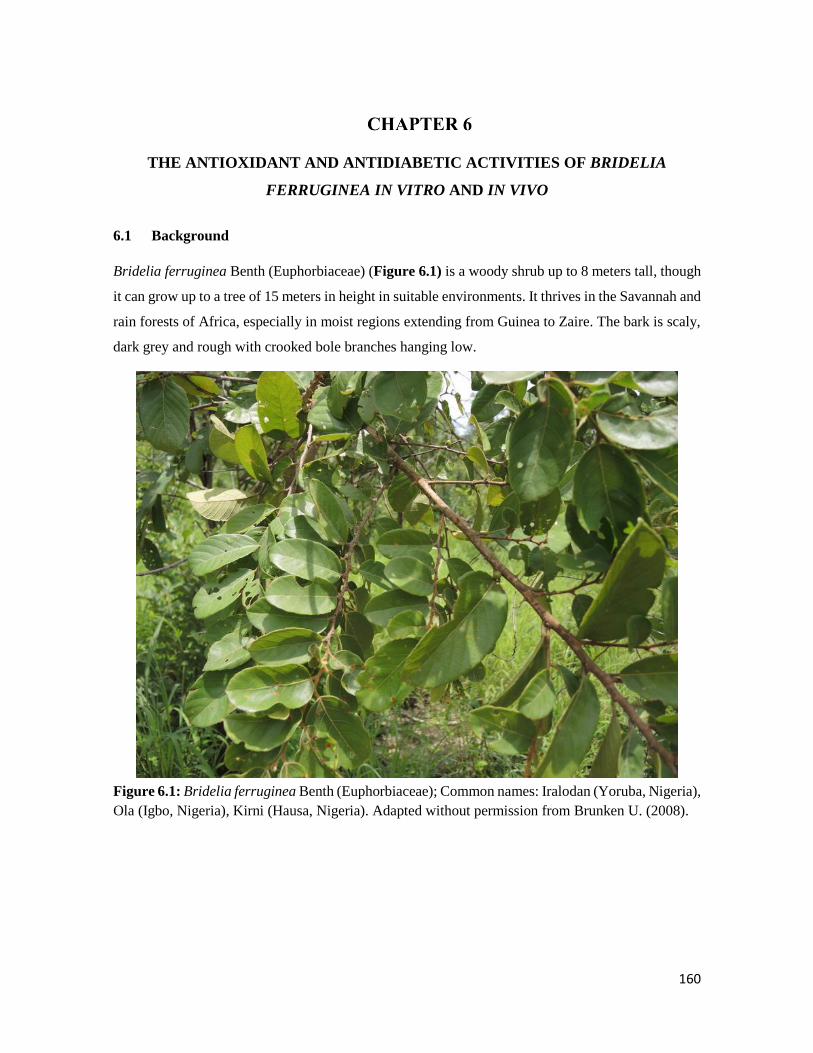
160
THE ANTIOXIDANT AND ANTIDIABETIC ACTIVITIES OF BRIDELIA
FERRUGINEA IN VITRO AND IN VIVO
6.1 Background
Bridelia ferruginea Benth (Euphorbiaceae) (Figure 6.1) is a woody shrub up to 8 meters tall, though
it can grow up to a tree of 15 meters in height in suitable environments. It thrives in the Savannah and
rain forests of Africa, especially in moist regions extending from Guinea to Zaire. The bark is scaly,
dark grey and rough with crooked bole branches hanging low.
Figure 6.1: Bridelia ferruginea Benth (Euphorbiaceae); Common names: Iralodan (Yoruba, Nigeria),
Ola (Igbo, Nigeria), Kirni (Hausa, Nigeria). Adapted without permission from Brunken U. (2008).
161
6.1.1 Ethnobotanical uses
Ethnobotanically, the aqueous extract of the stem bark is effective in the treatment of ulcer, diarrhoea,
boils (Akuodor et al., 2012), reduction of high blood sugar levels (Bakoma et al., 2013, Onunkwo et
al., 1996), antimicrobial activity and treatment of chest infections (Magistretti et al., 1988), anti-
inflammatory (Olajide et al., 1999) and water treatment to drinkable conditions (Kolawole and
Olayemi, 2003). The roots of B. ferruginea are used in Togo as chewing sticks and in treatment of
bladder, intestinal and skin problems (Olaide et al., 2014).
6.1.2 Biological activities
The aqueous extract of the stem bark of B. ferruginea has been reported to possess quinones,
alkaloids, flavonoids, tannins, saponins and reducing compounds (Akuodor et al., 2011). In two
separate studies, Bakoma et al. investigated the effect of the crude extracts and fractions from the
root bark on insulin resistance in fructose-fed mice (Bakoma et al., 2011, Bakoma et al., 2014). The
results from the study showed marked improvement of insulin sensitivity and glucose tolerance.
Another study was also done to evaluate the effect of B. ferruginea aqueous extract on gestational
diabetes; improved glucose tolerance was observed in the adult pregnant rats used in this study (Taiwo
et al., 2012).
B. ferruginea stem bark ethanolic extract has been reported to act as an antioxidant by protecting
brain and liver homogenates from iron (II) sulphate-induced oxidative stress in normal rat tissue
homogenates (Oloyede and Babalola, 2012). Although, a very high dose (4000 mg/kg bw) of the
aqueous extract of stem bark has also been reported to cause lipid peroxidation and sperm damage,
therefore low doses (less than 1000 mg/kg bw) should be used with caution (Awodele et al., 2015).
The aqueous stem bark extract of this plant has also been reported to possess anti-inflammatory
activities through p38 MAPK and NF-kB signalling. Akuodor et al. (2011) reported that the aqueous
extract from the stem bark of B. ferruginea exhibited promising pain relieving and antipyretic
activities in experimental mice and rats.
Different parts of B. ferruginea have also been successfully used in the management of blood glucose
level in experimental diabetes-induced animal models. A 100 mg/kg bw of the aqueous extract of the
bark of this plant has been reportedly used in improving blood glucose levels in alloxan-induced
diabetic rats and also render hypoglycaemic activity in normal rats (Adewale and Oloyede, 2012).
162
According to the literature, limited work has been done on the anti-diabetic activity of the different
parts of B. ferruginea, which prompted the need to investigate the detailed anti-diabetic potentials
together with antioxidant properties of the leaves, stem and root bark extracts of this plant and then
proceed to an in vivo study using the most active fraction.
163
6.2 Extracts of Bridelia ferruginea scavenges free radicals and modulates key anti-
diabetic enzymes
Olajumoke Oyebode1, Ochuko Erukainure1, Collins Ibeji2, Neil Koorbanally3, Md. Shahidul Islam1*
1 Department of Biochemistry, School of Life Sciences, University of KwaZulu-Natal, (Westville
Campus), Durban 4000, South Africa
2 Department of Pure and Industrial Chemistry, Faculty of Physical Sciences, University of Nigeria,
Nsukka 410001, Enugu State, Nigeria.
3 School of Chemistry and Physics, University of KwaZulu-Natal, (Westville Campus), Durban
4000, South Africa
*Corresponding author: [email protected]; Tel: +27 (0)31-260-8717; Fax: +27 (0)31-260-7942
Preface: This article reports the detailed in vitro antioxidant and anti-diabetic effects of the crude
extracts from B. ferruginea. It is currently awaiting revision before submission to a journal for
publication.
6.2.1 Abstract
This study investigates the in vitro antioxidant activities of extracts from three parts of Bridelia
ferruginea. Sequential extraction was performed on the leaves, stem and root bark samples with
solvents of increasing polarity and these extracts were assayed for total phenolic content, in vitro
antioxidant and anti-diabetic activities using different experimental models. The electron donating,
1,1-diphenyl-2-picryl-hydrazyl (DPPH), nitric oxide and hydroxyl radical scavenging activities of all
the extracts were investigated in this study. The ability of these extracts to inhibit -glucosidase, -
amylase and lipase enzymes were also examined in vitro. The ethanol extract of the leaves showed
the highest total phenolic content compared to other extracts. All extracts showed free radical
scavenging abilities in the different models. The ethanol and aqueous extracts significantly (p < 0.05)
inhibited the key enzymes linked to diabetes. GC-MS analysis of the different plant parts revealed
the presence of sterols, aromatics, aliphatic acids and esters. In particular, β-amyrin, 4-
Phenylbenzophenone and lupenone showed strong binding affinities for -glucosidase, -amylase
and lipase enzymes respectively when docked with the molecular structures of these enzymes. Data
from this study suggest that the different parts of B. ferruginea, especially the ethanol and aqueous
extracts of the leaves, possesses potent anti-oxidant activities that could be further explored in the
area of anti-diabetic drug research.
Key words: Medicinal plant, type 2 diabetes, oxidative stress, hyperglycaemia, Bridelia ferruginea,
molecular docking.
164
6.2.2 Introduction
Medicinal plants have long been regarded as better alternatives to pharmaceutical drugs and have
gained much interest in the field of drug discovery. This can be attributed to the fact that they contain
necessary and substantial concentration of antioxidants and bioactive agents that have been reported
in the management and treatment of diseases such as diabetes (Dewanjee et al., 2011).
A host of plant sources are found to be rich in polyphenols such as herbs, fruits, flowers and these
plants are found in abundance everywhere in the world especially in Africa where there is a high
reliance on medicinal plants for the treatment of diverse ailments (Hamzah et al., 2013).
Plants are rich in polyphenolic agents which are highly beneficial to nature as they can react with
reactive oxygen species/reactive nitrogen species (ROS/RNS) to bring about reduction in deleterious
effects to cell biomolecules (Gach et al., 2015). Plants antioxidants are capable of attenuating
damages to biomolecules (lipids, proteins and DNA); these damages range from lipid peroxidation to
cell membrane damage through oxidation (Hossain and Shah, 2015).
Oxidative stress occurs as a result of imbalance between free radical-generating enzymes (reactive
oxygen species [ROS]) and free radical-scavenging enzymes (antioxidant enzymes) and plays a key
role in the progression of diseases (Asmat et al., 2016). This triggers an increased level of free radicals
which initiates cellular damage and has been recognized as the main contributing factor to late
complications of ailments such as diabetes and cancer (Son, 2012).
Diabetes has become a global health problem with over 425 million people currently suffering from
this disease (IDF, 2017). Type 1 diabetes (T1D), type 2 diabetes (T2D) and gestational diabetes
remains the 3 main types of diabetes of which the most prevalent is T2D (ADA, 2016). Insulin
resistance, hyperglycaemia and pancreatic β-cell dysfunction are involved in the pathogenesis of
T2D. Oxidative stress has been implicated as a major cause of the progression of diabetic
complications (Asmat et al., 2016). These complications range from macro and microvascular
disorders such as heart, kidney, eyes and nerve problems. There are many synthetic anti-diabetic
medications available, these drugs although effective sometime come with various side effects such
as nausea, constipation, lactic acidosis, weight gain and others. Fortunately, medicinal plants with
oxidative stress and hyperglycaemia inhibiting properties are available in nature. These plants are
widely available, inexpensive and can be used to boost socio-economic importance. An example of
such medicinal plant is Bridelia ferruginea. B. ferruginea Benth, (Euphorbiaceae) is a shrub or short
tree which grows to about 15 m in height, it is found majorly in the Savannah and rainforest area of

165
Africa. However, very little is known about the detail antioxidative and antidiabetic effects of the
different parts of this plant either under in vitro, ex vivo or in vivo conditions.
Hence, this study was aimed to investigate the antidiabetic and antioxidant effects of the various
extracts of leaves, stem bark and root bark extracts of B. ferruginea, as well as the identification and
molecular docking of potent bioactive compounds present in the plant.
6.2.3 Materials and methods
Please refer to Chapter 2 for the detailed materials and methods used for B. ferruginea.
6.2.4 Results
The ethyl acetate extract of the leaves showed significantly (p < 0.05) higher total phenol content
compared to other extracts followed by the aqueous extract of the stem bark (Figure 6.2.1).
Figure 6.2.1: Total phenolic contents of B. ferruginea extracts. Data are reported as mean ± SD of three
replicas. a-c Values with different letters above the bars for a given extract are significantly different from each other (p <
0.05, Tukey’s HSD-multiple range post-hoc test, IBM SPSS for Windows).
The ethanol extracts of all the plant parts showed a significantly higher (p < 0.05) total reducing
power than extracts obtained from other solvents (ethyl acetate and water), which was even higher
than the standards (Trolox and ascorbic acid) used in this experiment. The ethanol extract of the root
bark showed the highest total reducing power compared to the other extracts from the different parts
of the plant (Figure 6.2.2 a-c).
The DPPH radical scavenging activities of the different solvent extracts of B. ferruginea parts are
shown in Figure 6.2.2 (d-f). All the extracts from all parts of the plant showed a dose-dependent
inhibition of DPPH, while the ethanol extracts from all parts showed a significantly higher (p < 0.05)
c
a b
b b c
a
c
a
0
20
40
60
80
100
Leaves Stem Bark Root barkTota
l ph
en
ol (
mg/
g G
AE)
Ethyl Acetate Ethanol Aqueous
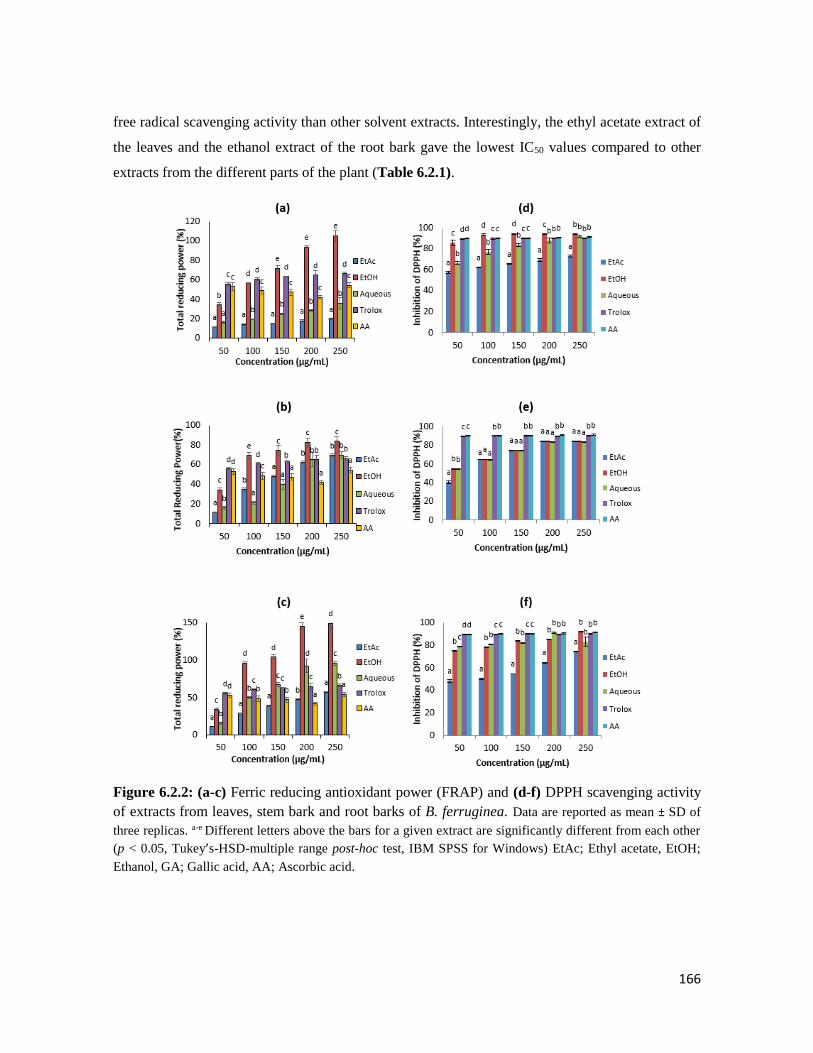
166
free radical scavenging activity than other solvent extracts. Interestingly, the ethyl acetate extract of
the leaves and the ethanol extract of the root bark gave the lowest IC50 values compared to other
extracts from the different parts of the plant (Table 6.2.1).
Figure 6.2.2: (a-c) Ferric reducing antioxidant power (FRAP) and (d-f) DPPH scavenging activity
of extracts from leaves, stem bark and root barks of B. ferruginea. Data are reported as mean ± SD of
three replicas. a-e Different letters above the bars for a given extract are significantly different from each other
(p < 0.05, Tukey’s-HSD-multiple range post-hoc test, IBM SPSS for Windows) EtAc; Ethyl acetate, EtOH;
Ethanol, GA; Gallic acid, AA; Ascorbic acid.

167
Figure 6.2.3 (a-c) shows the nitric oxide (NO) inhibitory activities of B. ferruginea parts solvents
extracts. The ethyl acetate extract of the plant parts showed a dose-independent inhibition of NO
while the ethanol extracts showed a dose-dependent inhibition of NO which was significantly (p <
0.05) higher than other solvents. Furthermore, the ethanol extract of the leaves and the ethyl acetate
extract of the root bark showed lowest IC50 values than the other extracts (Table 6.2.1).
Figure 6.2.3: (a-c) Nitric oxide and (d-f) Hydroxyl radical scavenging activity of extracts from
leaves, stem bark and root barks of B. ferruginea. Data are reported as mean ± SD of three replicas. a-d
Different letters above the bars for a given extract are significantly different from each other (p < 0.05, Tukey’s-
HSD-multiple range post-hoc test, IBM SPSS for Windows). EtAc; Ethyl acetate, EtOH; Ethanol, GA; Gallic
acid, AA; Ascorbic acid.

168
The hydroxyl (OH) radical scavenging activity of the extracts is shown in Figure 6.2.3 (d-f). The
ethanol extract of the leaves and root bark showed OH radical (obtained through the Fenton reaction)
scavenging activity. The ethyl acetate extracts from all the parts showed a dose-independent OH
radical scavenging activity. However, the aqueous extract of the stem bark showed a dose dependent
inhibition of OH radical. The ethyl acetate extract of the root bark and leaves showed the lowest IC50
values compared to other extracts (Table 6.2.1).
Figure 6.2.4 shows the -glucosidase and -amylase inhibitory activities of the extracts. The ethanol
and aqueous extracts of all the plant parts showed a dose-dependent inhibition of -glucosidase
enzyme activity (Figure 6.2.4 a-c). The ethanol extract of the root bark and leaves showed the lowest
IC50 values which was significantly (p < 0.05) lower than even the tested standard drug (acarbose)
(Table 6.2.1). -amylase was also inhibited by some solvents of B. ferruginea plant parts (Figure
6.2.4 d-f). On the table showing the IC50 values, the aqueous extract showed the lowest IC50 value
compared to the other extracts.
b ba b ac c c c b
a ab
a
b
ab b
c b
0
20
40
60
80
100
50 100 150 200 250-g
luco
sid
ase
inh
ibit
ion
(%
)
Concentration (µg/mL)
(a)
EtAc
EtOH
Aqueous
aa b b b
c da a ab
b b b cb
c b cd
0
20
40
60
80
100
50 100 150 200 250
-a
myl
ase
inh
ibit
ion
(%
)
Concentration (µg/mL)
(d)
EtAc
EtOH
Aqueous
Acarbose
bca
aa
a
aa
bbc
b
c bc b
b
c
c cc b
0
20
40
60
80
100
50 100 150 200 250
-g
luco
sid
ase
inh
ibit
ion
(%
)
Concentration (µg/mL)
(b)
EtAc
EtOH
Aqueous
Acarbose
ca a a
aa b b b
c
b
d c c bb
c c dd
0
20
40
60
80
100
50 100 150 200 250
-a
myl
ase
inh
ibit
ion
(%
)
Concentration (µg/mL)
(e)
EtAc
EtOH
Aqueous
Acarbose
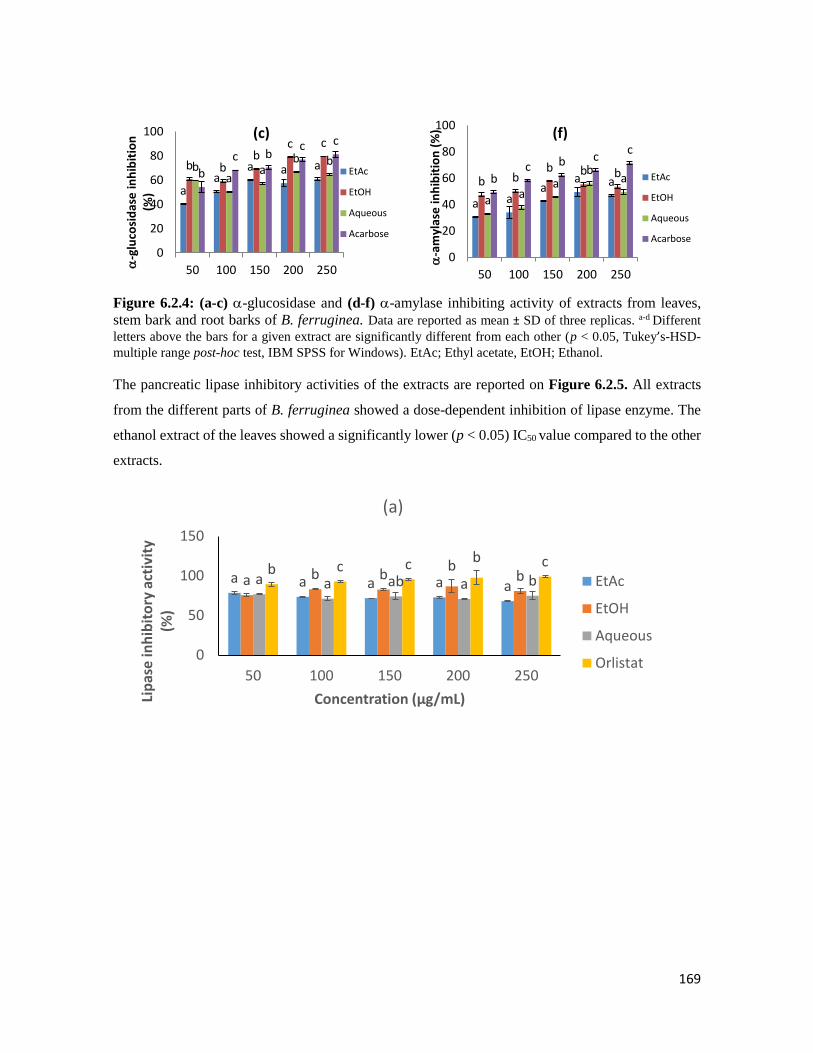
169
Figure 6.2.4: (a-c) -glucosidase and (d-f) -amylase inhibiting activity of extracts from leaves,
stem bark and root barks of B. ferruginea. Data are reported as mean ± SD of three replicas. a-d Different
letters above the bars for a given extract are significantly different from each other (p < 0.05, Tukey’s-HSD-
multiple range post-hoc test, IBM SPSS for Windows). EtAc; Ethyl acetate, EtOH; Ethanol.
The pancreatic lipase inhibitory activities of the extracts are reported on Figure 6.2.5. All extracts
from the different parts of B. ferruginea showed a dose-dependent inhibition of lipase enzyme. The
ethanol extract of the leaves showed a significantly lower (p < 0.05) IC50 value compared to the other
extracts.
aa
a a ab bb
c c
ba
ab b
b
c bc c
0
20
40
60
80
100
50 100 150 200 250-g
luco
sid
ase
inh
ibit
ion
(%
)
…
(c)
EtAc
EtOH
Aqueous
Acarbose
a aa
a ab bb b b
a aa
bab
c b cc
0
20
40
60
80
100
50 100 150 200 250
-a
myl
ase
inh
ibit
ion
(%
)
…
(f)
EtAc
EtOH
Aqueous
Acarbose
a a a a a a b bb
ba a ab a bb c c b c
0
50
100
150
50 100 150 200 250
Lip
ase
inh
ibit
ory
act
ivit
y (%
)
Concentration (µg/mL)
(a)
EtAc
EtOH
Aqueous
Orlistat
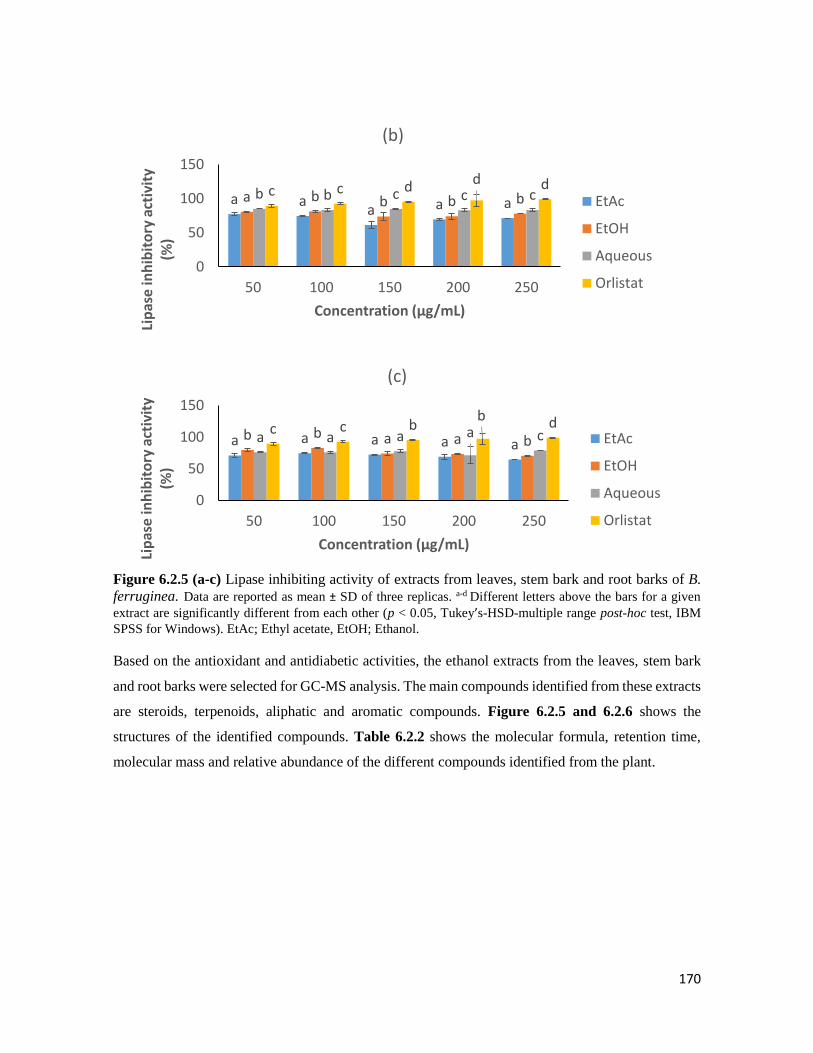
170
Figure 6.2.5 (a-c) Lipase inhibiting activity of extracts from leaves, stem bark and root barks of B.
ferruginea. Data are reported as mean ± SD of three replicas. a-d Different letters above the bars for a given
extract are significantly different from each other (p < 0.05, Tukey’s-HSD-multiple range post-hoc test, IBM
SPSS for Windows). EtAc; Ethyl acetate, EtOH; Ethanol.
Based on the antioxidant and antidiabetic activities, the ethanol extracts from the leaves, stem bark
and root barks were selected for GC-MS analysis. The main compounds identified from these extracts
are steroids, terpenoids, aliphatic and aromatic compounds. Figure 6.2.5 and 6.2.6 shows the
structures of the identified compounds. Table 6.2.2 shows the molecular formula, retention time,
molecular mass and relative abundance of the different compounds identified from the plant.
a aa a aa b b b bb b c c cc c d d d
0
50
100
150
50 100 150 200 250
Lip
ase
inh
ibit
ory
act
ivit
y (%
)
Concentration (µg/mL)
(b)
EtAc
EtOH
Aqueous
Orlistat
a a a a a b b a a ba a a a cc c b
b d
0
50
100
150
50 100 150 200 250
Lip
ase
inh
ibit
ory
act
ivit
y (%
)
Concentration (µg/mL)
(c)
EtAc
EtOH
Aqueous
Orlistat
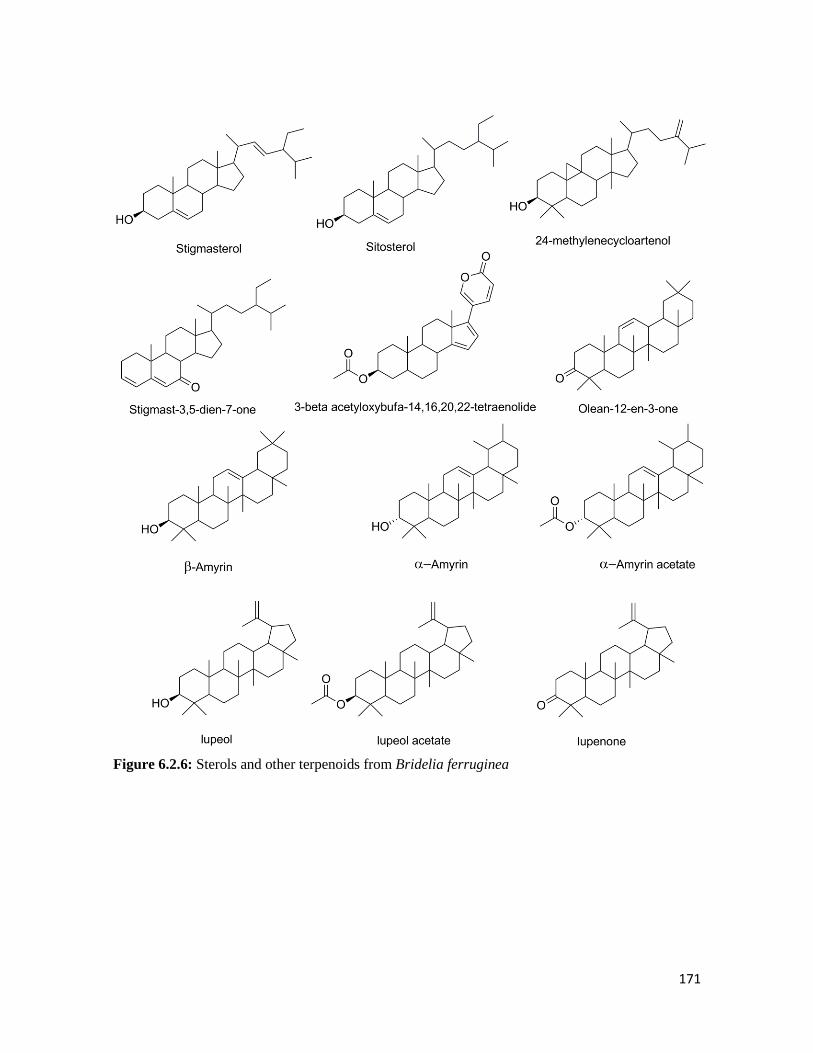
171
Figure 6.2.6: Sterols and other terpenoids from Bridelia ferruginea
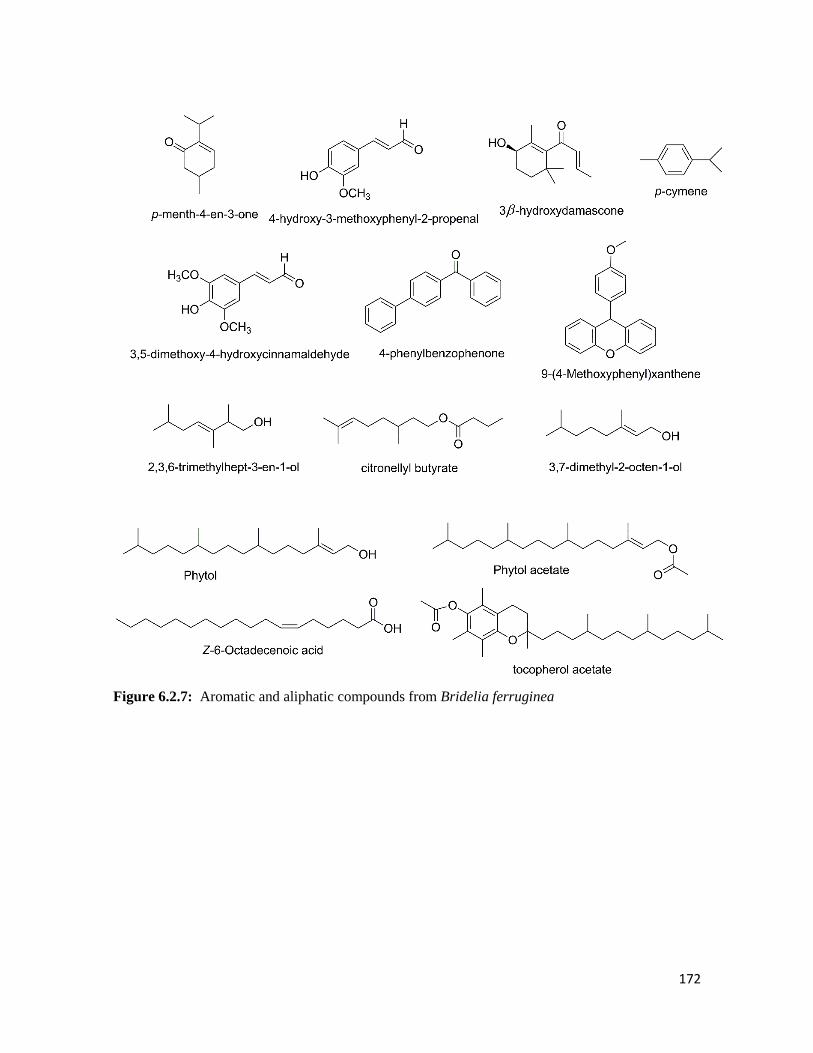
172
Figure 6.2.7: Aromatic and aliphatic compounds from Bridelia ferruginea

173
Table 6.2.1: IC50 values of various extracts of B. ferruginea parts in different anti-oxidative, anti-
diabetic and anti-obesogenic models
IC50 (µg/mL)
DPPH NO OH -
glucosidase
-amylase Lipase
Leaves
EtAc 2.54± 0.55a 76.24±16.54c 52.34±13.27b 8.17±1.61c 326.34±7.31g >1000
EtOH 14.61±0.09d 16.95±1.73a 46.94±12.99b 3.63±1.03a 224.75±9.32f 1.34±1.02b
Aqueous 23.03±0.71e 151.86±23.61e >1000 >1000 5.01±2.41a >10000
Stem
bark
EtAc 6.24±0.11c 27.53±4.82b 49.29±11.82b 4.89±2.51b 75.96±2.7d >10000
EtOH >1000 148.57±25.71e 301.5±28.4c 8.39±1.26c 100.69±16.73d >10000
Aqueous >1000 105.51±16.35d 303.16±41.69c >1000 13.32±75b >1000
Root
bark
EtAc 7.46±0.46c 15.76±9.53a 44.48±3.51b >1000 188.59±24.92e >1000
EtOH 5.29±0.08b 35.77±7.62b 47.31±13.8b 2.42±.0.92a >1000 >1000
Aqueous 2.34±0.10a 108.66±11.48d 30.95±17.35b >1000 519.1±15.92h >10000
Standard
GA ND 191.12 ±23.05f ND ND ND ND
AA 2.19±0.05a 196.71±27.45f ND ND ND ND
Trolox 5.79±0.43b 19.40±1.03a 3.54±091a ND ND ND
Acarbose ND ND ND 36.27±1.84d 53.77±3.95c ND
Orlistat ND ND ND ND ND 0.03±0.12a
DPPH-1,1-diphenyl-2-picrylhydrazyl radical, NO-nitric oxide radical, OH, hydroxyl radical; EtAc, Ethyl acetate,
EtOH, Ethanol, GA, Gallic acid, AA, Ascorbic acid, ND-not determined. Data are reported as mean ± SD values of
three replicas. a-iValues with different letters within a column are for a given test are significantly different from
each other (Tukey’s-HSD multiple range post hoc test, p < 0.05).
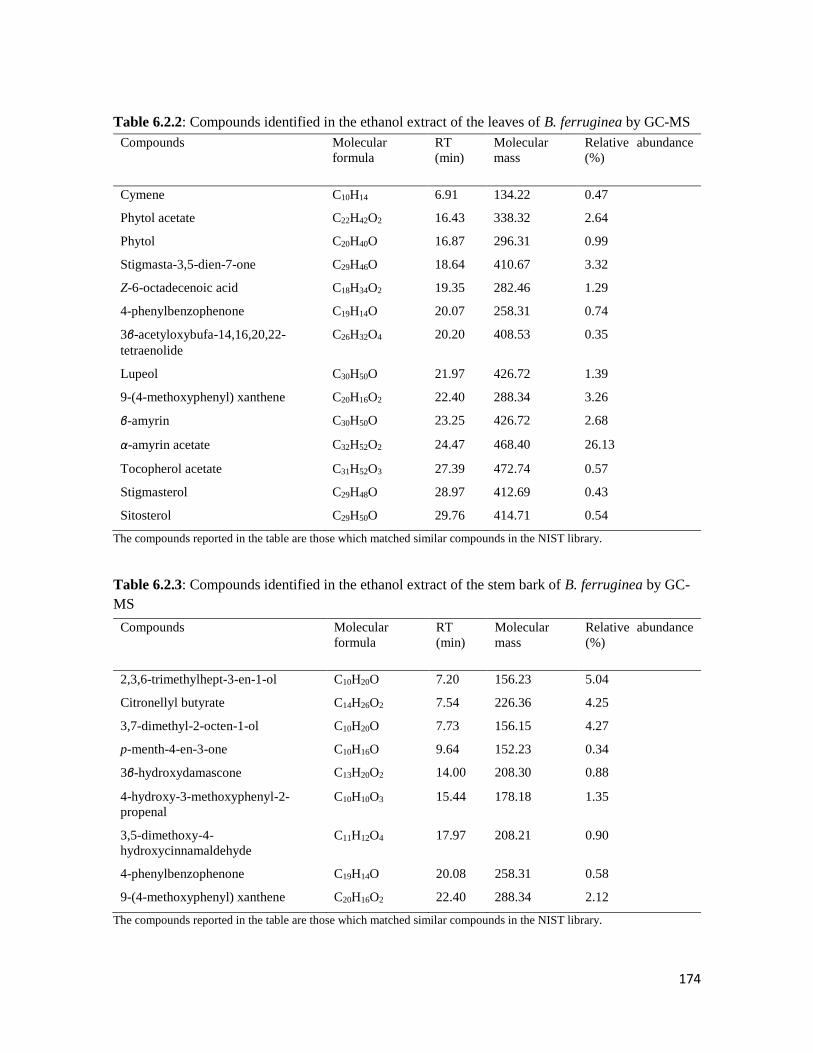
174
Table 6.2.2: Compounds identified in the ethanol extract of the leaves of B. ferruginea by GC-MS
Compounds Molecular
formula
RT
(min)
Molecular
mass
Relative abundance
(%)
Cymene C10H14 6.91 134.22 0.47
Phytol acetate C22H42O2 16.43 338.32 2.64
Phytol C20H40O 16.87 296.31 0.99
Stigmasta-3,5-dien-7-one C29H46O 18.64 410.67 3.32
Z-6-octadecenoic acid C18H34O2 19.35 282.46 1.29
4-phenylbenzophenone C19H14O 20.07 258.31 0.74
3β-acetyloxybufa-14,16,20,22-
tetraenolide
C26H32O4 20.20 408.53 0.35
Lupeol C30H50O 21.97 426.72 1.39
9-(4-methoxyphenyl) xanthene C20H16O2 22.40 288.34 3.26
β-amyrin C30H50O 23.25 426.72 2.68
α-amyrin acetate C32H52O2 24.47 468.40 26.13
Tocopherol acetate C31H52O3 27.39 472.74 0.57
Stigmasterol C29H48O 28.97 412.69 0.43
Sitosterol C29H50O 29.76 414.71 0.54
The compounds reported in the table are those which matched similar compounds in the NIST library.
Table 6.2.3: Compounds identified in the ethanol extract of the stem bark of B. ferruginea by GC-
MS
Compounds Molecular
formula
RT
(min)
Molecular
mass
Relative abundance
(%)
2,3,6-trimethylhept-3-en-1-ol C10H20O 7.20 156.23 5.04
Citronellyl butyrate C14H26O2 7.54 226.36 4.25
3,7-dimethyl-2-octen-1-ol C10H20O 7.73 156.15 4.27
p-menth-4-en-3-one C10H16O 9.64 152.23 0.34
3β-hydroxydamascone C13H20O2 14.00 208.30 0.88
4-hydroxy-3-methoxyphenyl-2-
propenal
C10H10O3 15.44 178.18 1.35
3,5-dimethoxy-4-
hydroxycinnamaldehyde
C11H12O4 17.97 208.21 0.90
4-phenylbenzophenone C19H14O 20.08 258.31 0.58
9-(4-methoxyphenyl) xanthene C20H16O2 22.40 288.34 2.12
The compounds reported in the table are those which matched similar compounds in the NIST library.
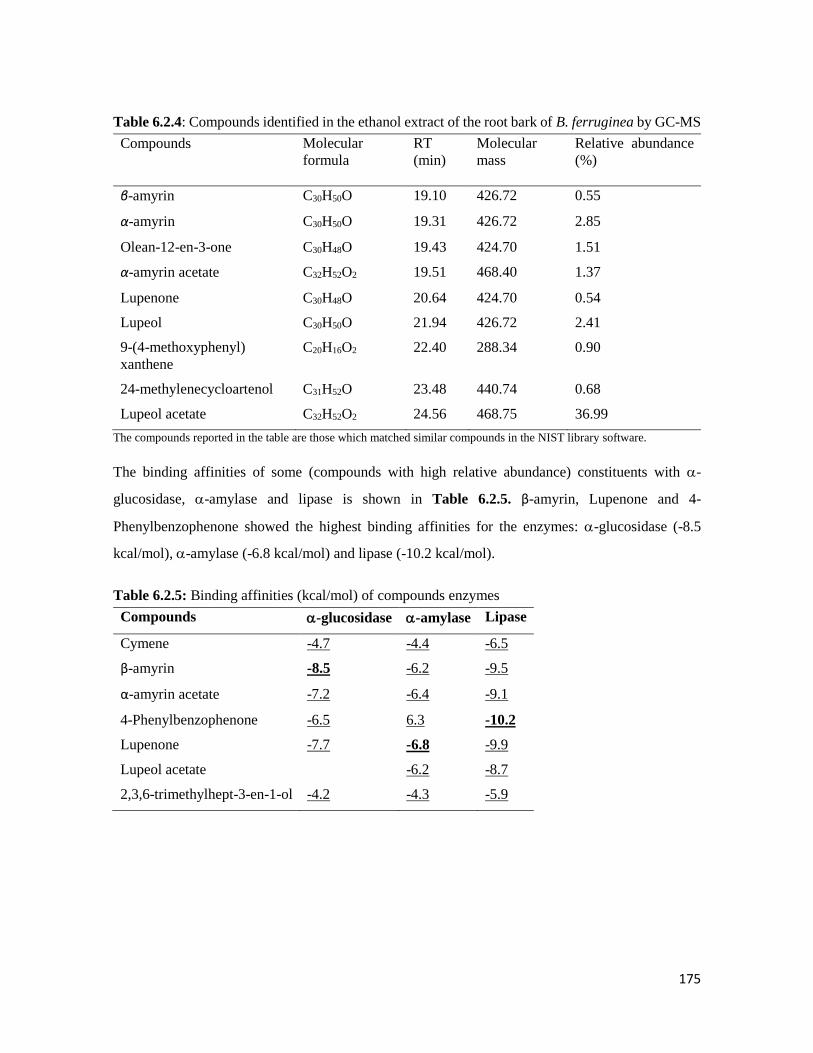
175
Table 6.2.4: Compounds identified in the ethanol extract of the root bark of B. ferruginea by GC-MS
Compounds Molecular
formula
RT
(min)
Molecular
mass
Relative abundance
(%)
β-amyrin C30H50O 19.10 426.72 0.55
α-amyrin C30H50O 19.31 426.72 2.85
Olean-12-en-3-one C30H48O 19.43 424.70 1.51
α-amyrin acetate C32H52O2 19.51 468.40 1.37
Lupenone C30H48O 20.64 424.70 0.54
Lupeol C30H50O 21.94 426.72 2.41
9-(4-methoxyphenyl)
xanthene
C20H16O2 22.40 288.34 0.90
24-methylenecycloartenol C31H52O 23.48 440.74 0.68
Lupeol acetate C32H52O2 24.56 468.75 36.99
The compounds reported in the table are those which matched similar compounds in the NIST library software.
The binding affinities of some (compounds with high relative abundance) constituents with -
glucosidase, -amylase and lipase is shown in Table 6.2.5. β-amyrin, Lupenone and 4-
Phenylbenzophenone showed the highest binding affinities for the enzymes: -glucosidase (-8.5
kcal/mol), -amylase (-6.8 kcal/mol) and lipase (-10.2 kcal/mol).
Table 6.2.5: Binding affinities (kcal/mol) of compounds enzymes
Compounds -glucosidase -amylase Lipase
Cymene -4.7 -4.4 -6.5
β-amyrin -8.5 -6.2 -9.5
α-amyrin acetate -7.2 -6.4 -9.1
4-Phenylbenzophenone -6.5 6.3 -10.2
Lupenone -7.7 -6.8 -9.9
Lupeol acetate -6.2 -8.7
2,3,6-trimethylhept-3-en-1-ol -4.2 -4.3 -5.9

176
The 3D illustrations of the interactions of β-amyrin, Lupenone and 4-Phenylbenzophenone with -
glucosidase, -amylase and lipase respectively is shown in Figure 6.2.8, 6 .2.9 and 6.2.10.
Figure 6.2.8: Illustration of 3-D (a) and 2-D (b) interactions with amino acid residues of docked β-
amyrin-α-glucosidase complex with the highest binding affinity.
Figure 6.2.9: Illustration of 3-D (a) and 2-D (b) interactions with amino acid residues of docked 4-
Phenylbenzophenone -Lipase complex with the highest binding affinity.

177
Figure 6.2.10: Illustration of 3-D (a) and 2-D (b) interactions with amino acid residues of docked
4-Phenylbenzophenone – amylase complex with the highest binding affinity.
6.2.5 Discussion
Plants with antioxidant abilities have been exploited in recent times for management of disease such
as diabetes whose complications arise as a consequence of oxidative stress. The thriving of oxidative
stress in the body leads to the progression of diverse complications in diabetes. B. ferruginea has been
reported to contain a high antioxidant potential in combating the damages of oxidative stress (Oloyede
and Babalola, 2012). This study investigated the antioxidant and anti-diabetic activities of the leaves,
stem bark and root bark extracts (different solvents) in order to further explain the importance of B.
ferruginea in treatment of diseases associated with oxidative stress.
Plants rich in polyphenols have been reported to perform antioxidant abilities through their reactive
oxygen species (ROS) neutralising capacities (Aiyegoro and Okoh, 2010). The solvents used in this
study extracted a good quantity of phenols. The ethyl acetate extract of the leaves showed the highest
total phenolic content which is a similar finding to an earlier reported study (Bhandari et al., 2008).
The ability of bioactive compounds to donate electrons as a show of their reducing power is an
indication of their antioxidant potentials (Benzie and Strain, 1996). Antioxidants function as redox
reactants where they are able to donate electrons to oxidants. Thus, the reduction of Fe2+ to Fe3+ could
be due to the presence of reductants in the plant which was investigated in the FRAP assay. The
strong reducing capacity of the leaves, stem and root bark ethanol extracts (Figure 6.2.2 a-c) showed
the phytochemical components of B. ferruginea exhibiting high redox potential are extractable by
ethanol.
178
The DPPH radical is a stable free radical that is commonly used to investigate the free radical
scavenging activity of plant extracts, fractions or pure compounds in vitro (Kedare and Singh, 2011).
Antioxidants inhibit DPPH by donating a hydrogen atom. The potent DPPH radical scavenging
activities of the different solvent extracts especially from the leaves and root even comparable to
standard antioxidants could suggests that bioactive compounds with hydrogen donating ability could
serve as inhibitors of free radicals. However, the aqueous extract of the root bark showed the lowest
IC50 (Table 6.2.1) value similar to ascorbic acid and even lower than Trolox (a standard antioxidant).
Interestingly, a recent research examined the DPPH scavenging potential of free and bound phenolics
extracted from the leaves of B. ferruginea (Afolabi et al., 2018). The IC50 values obtained from the
assay was not as low as the IC50 obtained from our study which shows that root bark just like the
leaves might contain phenolics with better DPPH scavenging capacity.
Under aerobic conditions, nitric oxide is unstable and generates stable nitrates and nitrites by reacting
with O2. Griess reagent is used to estimate nitric oxide, where the amount of nitrous acid is reduced
in the presence of an antioxidant (Boora et al., 2014). The ethanol and ethyl acetate extracts of the
leaves and root bark respectively, showed the lowest IC50 values compared to other extracts (Table
6.2.1). This further suggests that the extracts from B. ferruginea contain potent antioxidant activity
capable of inhibiting free radical generation and oxidative stress.
Hydroxyl radicals are short-acting highly reactive species that are capable of initiating damages to
important macromolecules such as proteins and lipids (Nita and Grzybowski, 2016). These radicals
carry out destructive activities through polymerization, auto-oxidation and breakage of biomolecules.
Therefore, medicinal plants with hydrogen radical-scavenging activities are potential targets in the
treatment of diseases where oxidative stress causes diverse complications. From the present study
(Figure 6.2.3 d-f), the ethanol extracts of the leaves and root barks showed a dose-dependent
inhibition of OH radical with low IC50 values.
An effective therapeutic method for managing T2D is through the reduction of post-prandial high
blood glucose levels. This is achieved by reducing the rise in glucose levels by inhibiting
carbohydrate-hydrolysing enzymes: -glucosidase and -amylase both active in the digestive tract
(Tundis et al., 2010). Inhibiting these enzymes causes a stretch in the digestion of carbohydrates in
food thereby giving more time to insulin to effectively offset the glucose load in the blood stream. A
number of medicinal plants have been reported to exhibit reduction of glucose production from
carbohydrates in the intestine (Choudhury et al., 2017). The ethanol extracts of the leaves and root
bark showed dose-dependent inhibition (Figure 6.2.4), low IC50 values (Table 6.2.1) for -

179
glucosidase and -amylase (aqueous extract of the leaves) than other counterparts, which suggests
the presence of better groups that could inhibit the breakdown of complex carbohydrates to glucose
thereby reducing postprandial hyperglycaemia. Obesity, one of the major risk factors of T2D is caused
by high calorie intake, which can be reduced by inhibiting pancreatic lipase activity thereby delaying
the absorption of lipids (Padwal and Majumdar, 2007). The ethanol extract of the leaves showed dose-
dependent lipase inhibition (Figure 6.2.5) and low IC50 values for the anti-lipase activity, which in
combination with the -glucosidase result shows the anti-diabetic and anti-obesogenic potency of B.
ferruginea.
A recent study by Afolayan et al. (2018) reported that 14 compounds were identified through bioassay
guided fractionation and purification from the methanol leaves of B. ferruginea. Our study went
further to identify the potent bioactive constituents present in the ethanol extracts of the leaves, stem
and root bark. Fourteen compounds were identified in the ethanol extracts of the leaves, while nine
compounds were identified each from the stem bark and root bark extracts. The compounds identified
were mainly phenols like sterols, triterpenes and other aliphatic compounds (Figure 6.2.6). Some
aromatic compounds were also identified in the GC-MS analysis (Figure 6.2.7). β-Amyrin and -
amyrin acetate found in this plant are known pentacyclic triterpenes found distributed in plants and
have been reported to have diverse biological properties like anti-inflammatory, anti-microbial,
cytotoxic, and trypanocidal activity amongst others (Vázquez et al., 2012). The anti-diabetic
properties of these triterpenes have also been established (Nair et al., 2014, Santos et al., 2012). 4-
phenylbenzophenone and Lupenone identified in our study have been reported to exhibit promising
anti-diabetic activity (Lin et al., 2009, Xu et al., 2014). Conversely, the observed anti-diabetic and
anti-obesogenic activities of B. ferruginea might be due to the synergistic effect rendered by the
identified bioactive constituents. To further verify this claim, some of the identified compounds were
docked with key anti-diabetic (-glucosidase and -amylase) and anti-obesogenic (lipase) enzymes
using in silico molecular docking analysis (Table 6.2.5). Interestingly, β-amyrin, 4-
phenylbenzophenone and Lupenone had the highest binding energies for -glucosidase, -amylase
and lipase enzymes respectively, which justified the biological properties of the compounds. The 3D
interactions of these compounds with the enzymes is shown in Figure 6.2.8-10. Previous studies have
also reported high binding energies of plant constituents with anti-diabetic enzymes (Bharatham et
al., 2008, Oyebode et al., 2018).

180
In the light of the results obtained for all the antioxidant and anti-diabetic models used in this study,
it is possible to conclude that the ethanol extract of the leaves in particular shows better activities in
all models and should be exploited in future studies to identify and extract the exact bioactive
constituent. Further studies will entail bioassay guided fractionation of the ethanol extract of the
leaves.
Postscript: From the above experiment, the ethanol crude extract from the leaves was found to have
relatively higher antioxidant and anti-diabetic activity observed across various types of assays. It was
therefore selected for further investigations.
181
6.3 Fractions from Bridelia ferruginea leaves attenuate oxidative stress, inhibit key
carbohydrate digesting enzyme and intestinal glucose absorption but enhance
muscle glucose uptake
1Olajumoke A. Oyebode, 1Ochuko L. Erukainure, 2Neil A. Koorbanally, 1Md. Shahidul Islam*
1Department of Biochemistry, School of Life Sciences, University of KwaZulu-Natal, (Westville
Campus), Durban 4000, South Africa, 2School of Chemistry and Physics, University of KwaZulu-
Natal, (Westville Campus), Durban 4000, South Africa
*Corresponding author: [email protected]; Tel: +27 (0)31-260-8717; Fax: +27 (0)31-260-7942
Preface: This chapter reports the detailed in vitro and ex vivo anti-diabetic effects of the fractions
obtained from the ethanol extract of the leaves. It is currently awaiting revision before submission to
a journal for publication.
6.3.1 Abstract
The antioxidant, anti-hyperglycaemic and anti-lipidaemic potentials of leaves of Bridelia ferruginea
have been documented, but the modes of action remain elusive. The present study investigated not
only the antioxidant potentials, but also the anti-hyperglycaemic mode of action of fractions obtained
from the crude ethanol extract of leaves of B. ferruginea using several in vitro and ex vivo models.
The crude ethanol extract of the leaves of B. ferruginea was subjected to solvent fractionation to yield
four fractions: butanol, dichloromethane (DCM), ethyl acetate and aqueous fractions. The total
phenolic content of these fractions was first determined. The abilities of these fractions to activate
antioxidant enzymes in Fe2+-induced pancreatic oxidative injuries were also investigated ex vivo.
Then, α-glucosidase inhibitory activity was estimated in vitro. The ex vivo effects of the fractions on
glucose absorption in isolated rat jejunum as well as glucose uptake in isolated rat psoas muscle was
also investigated. All fractions exhibited a moderate total phenolic content and DPPH inhibitory
activities. Catalase, SOD and reduced glutathione levels were significantly (p < 0.05) increased by
the fractions as compared to the untreated group. The butanol fraction showed a more potent anti-
oxidant activity which might be due to the presence of high phenolic content. The butanol fraction
also showed a dose-dependent inhibition of α-glucosidase enzyme and a high glucose uptake activity
in isolated rat jejunum. The fractions of B. ferruginea were also able to enhance glucose uptake in
isolated rat psoas muscle. GC-MS analysis revealed the presence of some potent bioactive
constituents which could render synergistic effects to the observed antioxidant and anti-diabetic
182
activities of B. ferruginea. Data from this study suggest that B. ferruginea may not only ameliorate
oxidative stress but may also exert glycaemic control via enhancing muscle glucose uptake and
impairing carbohydrate and glucose absorption. Thus, it may be further investigated as a useful
dietary supplement for managing hyperglycaemia and oxidative stress.
Key words: Bridelia ferruginea, oxidative stress, anti-oxidant, glucose absorption, glucose uptake,
enzyme inhibition
6.3.2 Introduction
The increased oxidative stress in diseases related to metabolic syndrome has been long established
(Asmat et al., 2016). Prolonged oxidative stress leads to β-cell dysfunction, insulin resistance which
in the long run leads to diseases such as type 2 diabetes (Tiwari et al., 2013). Oxidative stress occurs
when there is an imbalance between reactive oxygen species (ROS) and antioxidants in favour of
ROS. This imbalance causes ROS to become harmful to macro molecules like lipids, proteins and
nucleic acids due to the inactivity of the natural defence system of the cell (antioxidants) (Styskal et
al., 2012). This imbalance leads to reduction in endogenous antioxidants enzymes such as catalase
and superoxide dismutase (SOD) as well as in vivo antioxidants and reduced glutathione. The
destruction caused by oxidative stress leads to macro- and micro-vascular complications of type 2
diabetes which encompasses eyes, kidney and heart problems and ultimately, death (Folli et al.,
2011). The ability of natural antioxidants to reduce ROS formation by increasing the activities of
endogenous antioxidants can be exploited for treatment of diseases caused by oxidative stress such
as diabetes.
Persistent hyperglycaemia has also been implicated in leading to multiple diabetic complications
(Marcovecchio et al., 2011). The level of post prandial hyperglycaemia keeps rising due to continuous
breakdown and digestion of dietary carbohydrates. The inhibition of carbohydrate hydrolysing
enzymes such as α-glucosidase and α-amylase can delay the digestion, as well as the absorption of
sugar from carbohydrates, which is a key focus in anti-diabetic drug research (Asif, 2014). The ability
of natural products from plant sources to inhibit the activity of these carbohydrate-hydrolysing
enzymes have been paid more attention in recent times (Kalita et al., 2018).
Bridelia ferruginea Benth. (Euphorbiaceae) is a ligneous shrub or tree (as climate and soil favours)
that grows in various parts of Africa and is used by traditional healers for the treatment of ailments
like boils, arthritis, diabetes, bruises and burns (Awodele et al., 2015; Olajide et al., 2012). From the

183
work done on this plant so far, there is no report on the effects of the fractions obtained from the
leaves of the plant on intestinal glucose absorption and muscle glucose uptake.
Hence, the present study was conducted to examine the effects Bridelia ferruginea fraction on
antioxidative status, inhibition of carbohydrate digesting enzymes, intestinal glucose absorption and
muscle glucose uptake using a number of experimental models.
6.3.3 Materials and methods
Please refer to Chapter 2 for the detailed materials and methods used for B. ferruginea.
6.3.4 Results
The total phenol contents of the fractions (dichloromethane, ethyl acetate, butanol and aqueous) are
shown on Table 6.3.1. The DCM fraction showed the significantly (p < 0.05) higher concentration
of total phenol than other fractions.
The ability of the fractions to scavenge free radicals was investigated using the DPPH method and is
shown in Figure 6.3.1. Only butanol fraction showed a consistent dose-dependent inhibition of
DPPH. The butanol fraction also showed a significantly (p < 0.05) higher inhibition of DPPH
compared to other fractions which was also similar to the activity of the standards (Trolox and
ascorbic acid) used in this experiment. The lowest DPPH scavenging activity was displayed by the
DCM fraction. The butanol and aqueous fractions both showed low IC50 values for DPPH inhibition
as reported in Table 6.3.1.
Figure 6.3.1: DPPH inhibiting activity of B. ferruginea fractions. Data are reported as mean ± SD. a-d Values
with different letter above the bars for a given concentration are significantly different from each other (p < 0.05, Tukey’s
HSD-multiple range post-hoc test, IBM SPSS for Windows). EtAc, DCM and AA represent Ethyl acetate, Dichloromethane
fractions and Ascorbic acid respectively, DPPH, 2,2-Diphenyl-1-picrylhydrazyl.
abb b
ab b
aa a a ab
b cb c
abb b ab
cc c d b cc c d b c
0
20
40
60
80
100
50 100 150 200 250
Inh
ibit
ion
of
DP
PH
(%
)
Concentration (µg/mL)
DCM EtAc Butanol Aqueous Trolox AA
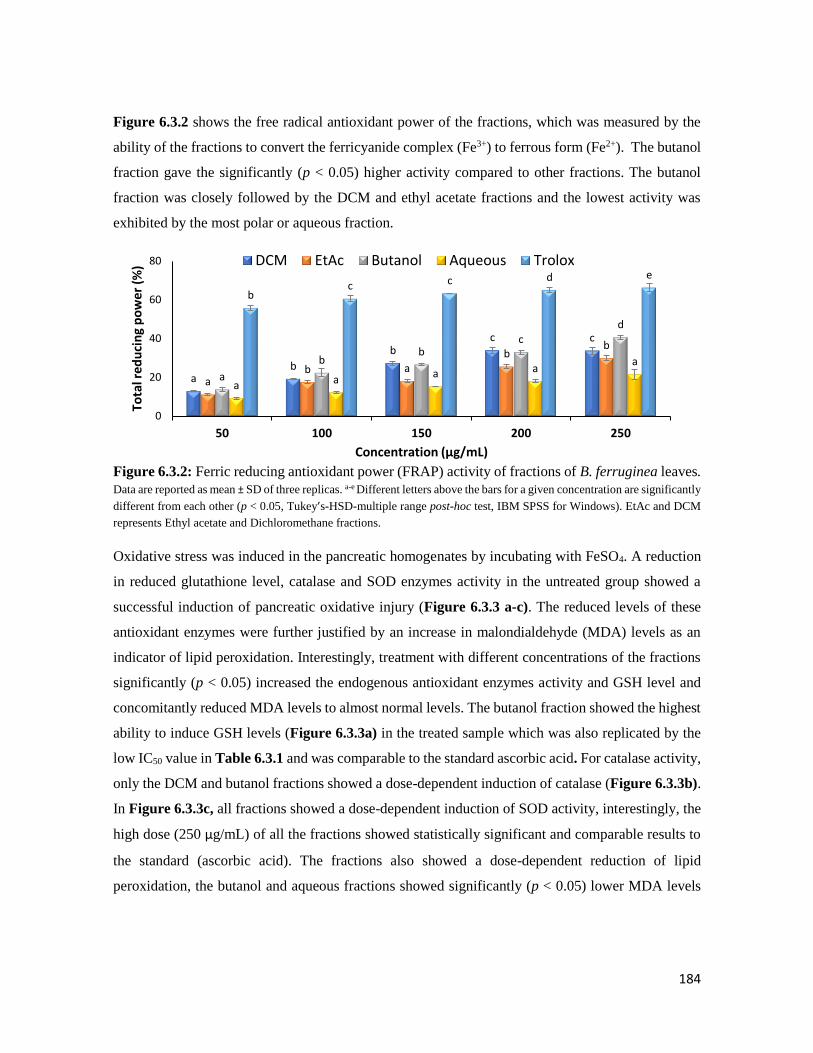
184
Figure 6.3.2 shows the free radical antioxidant power of the fractions, which was measured by the
ability of the fractions to convert the ferricyanide complex (Fe3+) to ferrous form (Fe2+). The butanol
fraction gave the significantly (p < 0.05) higher activity compared to other fractions. The butanol
fraction was closely followed by the DCM and ethyl acetate fractions and the lowest activity was
exhibited by the most polar or aqueous fraction.
Figure 6.3.2: Ferric reducing antioxidant power (FRAP) activity of fractions of B. ferruginea leaves. Data are reported as mean ± SD of three replicas. a-e Different letters above the bars for a given concentration are significantly
different from each other (p < 0.05, Tukey’s-HSD-multiple range post-hoc test, IBM SPSS for Windows). EtAc and DCM
represents Ethyl acetate and Dichloromethane fractions.
Oxidative stress was induced in the pancreatic homogenates by incubating with FeSO4. A reduction
in reduced glutathione level, catalase and SOD enzymes activity in the untreated group showed a
successful induction of pancreatic oxidative injury (Figure 6.3.3 a-c). The reduced levels of these
antioxidant enzymes were further justified by an increase in malondialdehyde (MDA) levels as an
indicator of lipid peroxidation. Interestingly, treatment with different concentrations of the fractions
significantly (p < 0.05) increased the endogenous antioxidant enzymes activity and GSH level and
concomitantly reduced MDA levels to almost normal levels. The butanol fraction showed the highest
ability to induce GSH levels (Figure 6.3.3a) in the treated sample which was also replicated by the
low IC50 value in Table 6.3.1 and was comparable to the standard ascorbic acid. For catalase activity,
only the DCM and butanol fractions showed a dose-dependent induction of catalase (Figure 6.3.3b).
In Figure 6.3.3c, all fractions showed a dose-dependent induction of SOD activity, interestingly, the
high dose (250 µg/mL) of all the fractions showed statistically significant and comparable results to
the standard (ascorbic acid). The fractions also showed a dose-dependent reduction of lipid
peroxidation, the butanol and aqueous fractions showed significantly (p < 0.05) lower MDA levels
ab
bc c
ab a
bb
a
bb
cd
a aa a
a
bc c d e
0
20
40
60
80
50 100 150 200 250
Tota
l red
uci
ng
po
we
r (%
)
Concentration (µg/mL)
DCM EtAc Butanol Aqueous Trolox
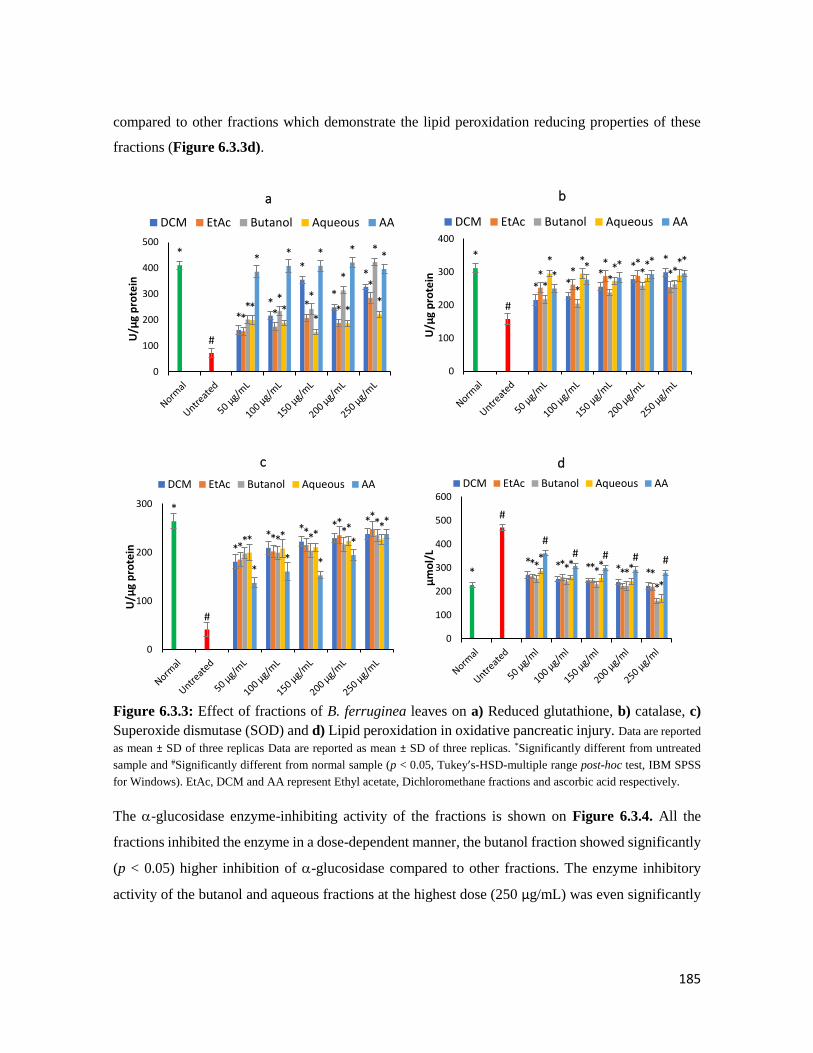
185
compared to other fractions which demonstrate the lipid peroxidation reducing properties of these
fractions (Figure 6.3.3d).
Figure 6.3.3: Effect of fractions of B. ferruginea leaves on a) Reduced glutathione, b) catalase, c)
Superoxide dismutase (SOD) and d) Lipid peroxidation in oxidative pancreatic injury. Data are reported
as mean ± SD of three replicas Data are reported as mean ± SD of three replicas. *Significantly different from untreated
sample and #Significantly different from normal sample (p < 0.05, Tukey’s-HSD-multiple range post-hoc test, IBM SPSS
for Windows). EtAc, DCM and AA represent Ethyl acetate, Dichloromethane fractions and ascorbic acid respectively.
The -glucosidase enzyme-inhibiting activity of the fractions is shown on Figure 6.3.4. All the
fractions inhibited the enzyme in a dose-dependent manner, the butanol fraction showed significantly
(p < 0.05) higher inhibition of -glucosidase compared to other fractions. The enzyme inhibitory
activity of the butanol and aqueous fractions at the highest dose (250 µg/mL) was even significantly
**
*
*
*
*
#
* ** *
*
** *
*
*
* **
**
* * * **
0
100
200
300
400
500
U/µ
g p
rote
in
a
DCM EtAc Butanol Aqueous AA
* **
***
#
* ** *
** *
** *
* ** * *
** * * *
0
100
200
300
400
U/µ
g p
rote
in
b
DCM EtAc Butanol Aqueous AA
**
* * **
#
**
**
*
* * **
*
* * ** *
** *
*
*
0
100
200
300
U/µ
g p
rote
in
c
DCM EtAc Butanol Aqueous AA
* * * * **
#
* * * * ** * * *
*
** * *
*
## # # #
0
100
200
300
400
500
600
µm
ol/
L
d
DCM EtAc Butanol Aqueous AA

186
(p < 0.05) higher than the standard drug (acarbose) used. The butanol fraction gave the lowest IC50,
as low as the standard drug, acarbose (Table 6.3.1).
Figure 6.3.4: -glucosidase inhibitory activity of B. ferruginea leaves fractions. Data are reported as
mean ± SD of three replicas. a-d Different letters over the bars for a given concentration for each extract indicate a
significant difference from each other (p < 0.05, Tukey’s-HSD-multiple range post-hoc test, IBM SPSS for Windows). EtAc
and DCM represents Ethyl acetate and Dichloromethane fractions respectively.
The effect of the butanol and aqueous fractions (fractions with the best results in all the models
tested) on glucose absorption and glucose uptake in harvested organs was investigated (Figure
6.3.5 and 6.3.6).
Figure 6.3.5: Effect of the butanol and aqueous fractions of the leaves of B. ferruginea on glucose
absorption in isolated rat jejunum. Data are reported as mean ± SD of three replicas. a-c Different letters over the
bars for a given concentration are significantly different from each other (p < 0.05, Tukey’s-HSD-multiple range post-hoc
test, IBM SPSS for Windows).
db
bc
c
a
aa
a
a
b
b
c
d d
a
a
bb
d
c
b bc
b
0
20
40
60
80
100
50 100 150 200 250
Inh
iitio
n o
f
-glu
cosi
das
e (%
)
Concentration (µg/mL)
DCM EtAc Butanol Aqueous Acarbose
*
#b
#b
#b
*a*a
*a *a *a
0
5
10
15
20
Control 100 mg/dL 150 mg/dL 200 mg/dL 250 mg/dL
Glu
cose
ab
sorp
tio
n (
mg/
cm
jeju
nu
m)
Butanol Aqueous
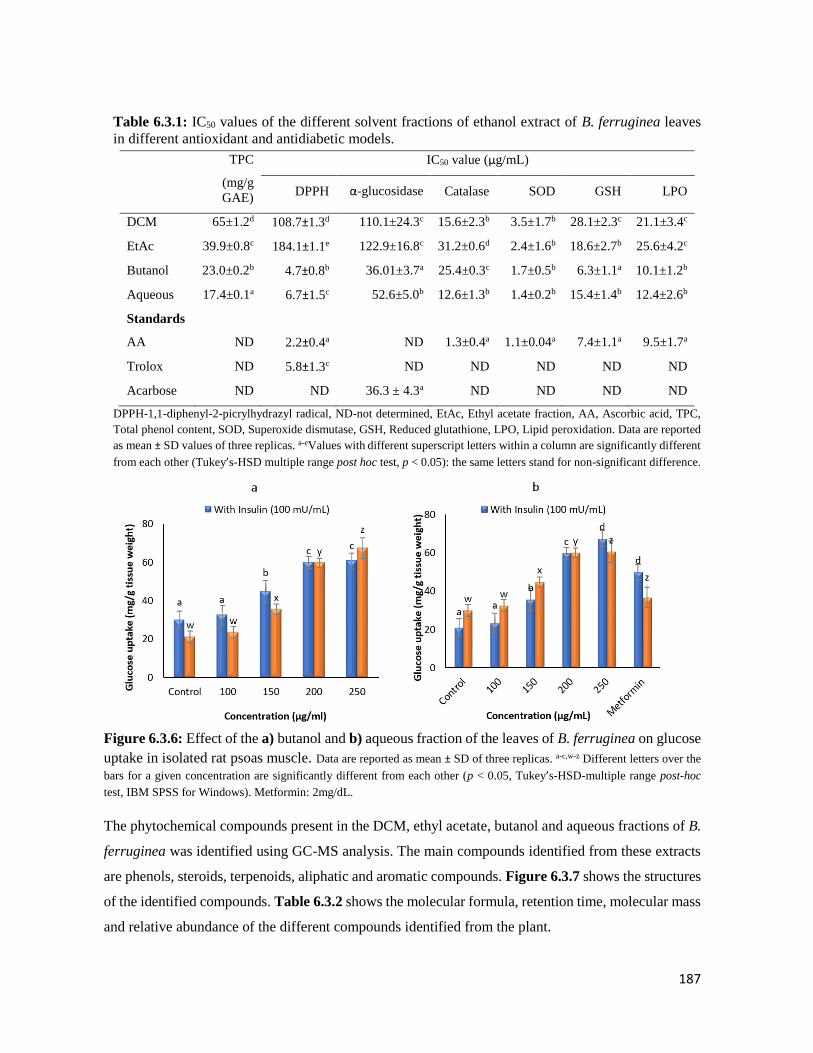
187
Table 6.3.1: IC50 values of the different solvent fractions of ethanol extract of B. ferruginea leaves
in different antioxidant and antidiabetic models.
TPC
(mg/g
GAE)
IC50 value (µg/mL)
DPPH α-glucosidase Catalase SOD GSH LPO
DCM 65±1.2d 108.7±1.3d 110.1±24.3c 15.6±2.3b 3.5±1.7b 28.1±2.3c 21.1±3.4c
EtAc 39.9±0.8c 184.1±1.1e 122.9±16.8c 31.2±0.6d 2.4±1.6b 18.6±2.7b 25.6±4.2c
Butanol 23.0±0.2b 4.7±0.8b 36.01±3.7a 25.4±0.3c 1.7±0.5b 6.3±1.1a 10.1±1.2b
Aqueous 17.4±0.1a 6.7±1.5c 52.6±5.0b 12.6±1.3b 1.4±0.2b 15.4±1.4b 12.4±2.6b
Standards
AA ND 2.2±0.4a ND 1.3±0.4a 1.1±0.04a 7.4±1.1a 9.5±1.7a
Trolox ND 5.8±1.3c ND ND ND ND ND
Acarbose ND ND 36.3 ± 4.3a ND ND ND ND
DPPH-1,1-diphenyl-2-picrylhydrazyl radical, ND-not determined, EtAc, Ethyl acetate fraction, AA, Ascorbic acid, TPC,
Total phenol content, SOD, Superoxide dismutase, GSH, Reduced glutathione, LPO, Lipid peroxidation. Data are reported
as mean ± SD values of three replicas. a-eValues with different superscript letters within a column are significantly different
from each other (Tukey’s-HSD multiple range post hoc test, p < 0.05): the same letters stand for non-significant difference.
Figure 6.3.6: Effect of the a) butanol and b) aqueous fraction of the leaves of B. ferruginea on glucose
uptake in isolated rat psoas muscle. Data are reported as mean ± SD of three replicas. a-c,w-z Different letters over the
bars for a given concentration are significantly different from each other (p < 0.05, Tukey’s-HSD-multiple range post-hoc
test, IBM SPSS for Windows). Metformin: 2mg/dL.
The phytochemical compounds present in the DCM, ethyl acetate, butanol and aqueous fractions of B.
ferruginea was identified using GC-MS analysis. The main compounds identified from these extracts
are phenols, steroids, terpenoids, aliphatic and aromatic compounds. Figure 6.3.7 shows the structures
of the identified compounds. Table 6.3.2 shows the molecular formula, retention time, molecular mass
and relative abundance of the different compounds identified from the plant.
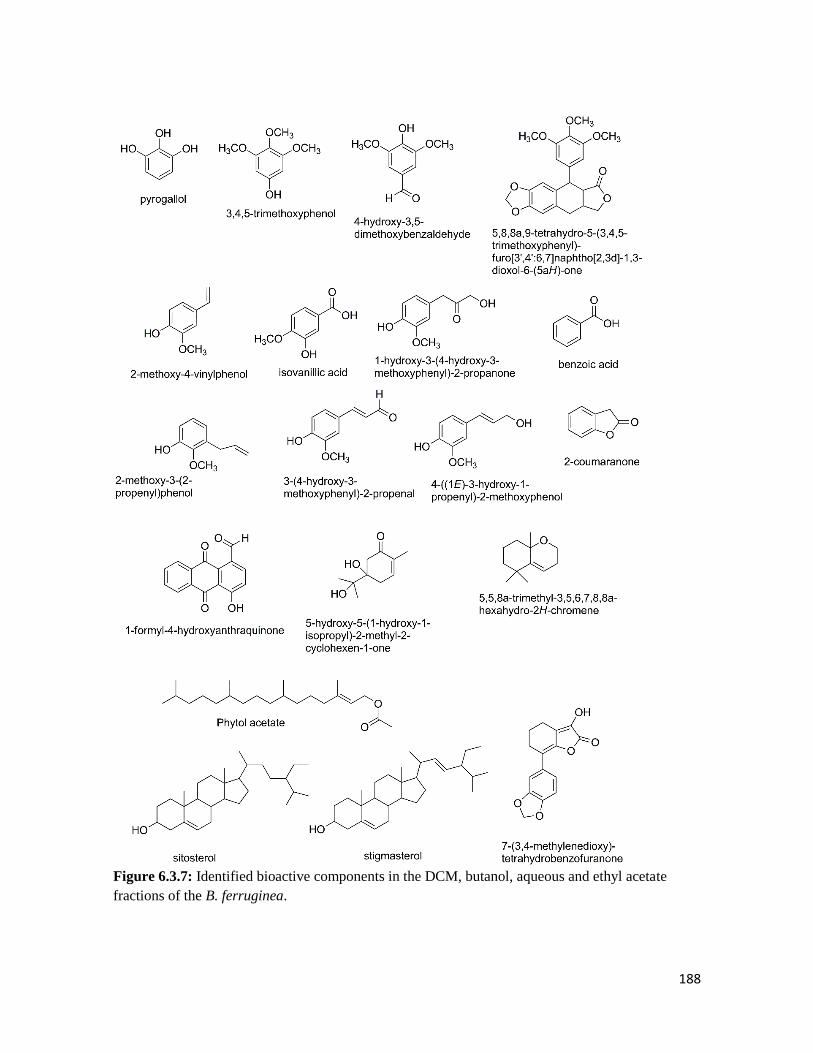
188
Figure 6.3.7: Identified bioactive components in the DCM, butanol, aqueous and ethyl acetate
fractions of the B. ferruginea.
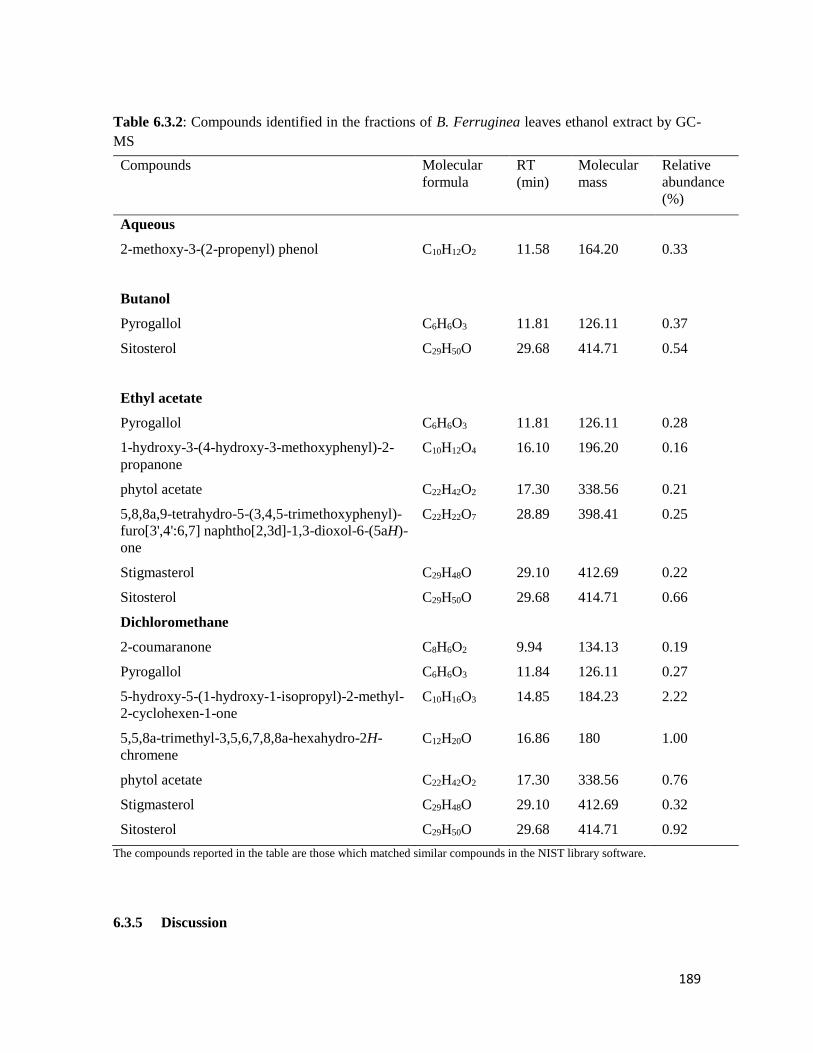
189
Table 6.3.2: Compounds identified in the fractions of B. Ferruginea leaves ethanol extract by GC-
MS
Compounds Molecular
formula
RT
(min)
Molecular
mass
Relative
abundance
(%)
Aqueous
2-methoxy-3-(2-propenyl) phenol C10H12O2 11.58 164.20 0.33
Butanol
Pyrogallol C6H6O3 11.81 126.11 0.37
Sitosterol C29H50O 29.68 414.71 0.54
Ethyl acetate
Pyrogallol C6H6O3 11.81 126.11 0.28
1-hydroxy-3-(4-hydroxy-3-methoxyphenyl)-2-
propanone
C10H12O4 16.10 196.20 0.16
phytol acetate C22H42O2 17.30 338.56 0.21
5,8,8a,9-tetrahydro-5-(3,4,5-trimethoxyphenyl)-
furo[3',4':6,7] naphtho[2,3d]-1,3-dioxol-6-(5aH)-
one
C22H22O7 28.89 398.41 0.25
Stigmasterol C29H48O 29.10 412.69 0.22
Sitosterol C29H50O 29.68 414.71 0.66
Dichloromethane
2-coumaranone C8H6O2 9.94 134.13 0.19
Pyrogallol C6H6O3 11.84 126.11 0.27
5-hydroxy-5-(1-hydroxy-1-isopropyl)-2-methyl-
2-cyclohexen-1-one
C10H16O3 14.85 184.23 2.22
5,5,8a-trimethyl-3,5,6,7,8,8a-hexahydro-2H-
chromene
C12H20O 16.86 180 1.00
phytol acetate C22H42O2 17.30 338.56 0.76
Stigmasterol C29H48O 29.10 412.69 0.32
Sitosterol C29H50O 29.68 414.71 0.92
The compounds reported in the table are those which matched similar compounds in the NIST library software.
6.3.5 Discussion

190
The damage caused by free radicals when left unmanaged leads to the progression of diverse
complications in T2D. Although research has shown that plants contain high amounts of polyphenols,
hence detailed screening is necessary in order to validate this claim. The moderately high total
phenol content was found in the fractions of B. ferruginea in our study (Table 6.3.1), showed the
potential as an antioxidative agent. The stem bark aqueous fraction of B. ferruginea has been reported
to contain antioxidant activity which supports results from our data (Olaide et al., 2014).
The ability of the fractions to scavenge free radicals was investigated using the DPPH method. This
method due to its ease of execution is usually the first line of action in detecting the antioxidant
activities of plants (Kedare and Singh, 2011). The DPPH radical has an odd nitrogen electron which
can be reduced by accepting a hydrogen atom from a potential antioxidant to form a hydrazine
complex. In vitro DPPH analysis of the fraction (Figure 6.3.1) showed a dose dependent inhibition
of DPPH exhibited only by the butanol fraction. This could be due to the presence of compounds that
can donate a hydrogen atom to form a stable complex in the polar butanol fraction. Plants like B.
ferruginea have been shown to possess promising antioxidant activity using the DPPH method
(Olaide et al., 2014).
The FRAP assay is a sensitive, precise and simple method for understanding the interaction between
antioxidant status and disease risk (Benzie and Strain, 1999). The principle of the FRAP assay is
based on the ability of an antioxidant in a sample to form a coloured complex with ferric chloride,
potassium ferricyanide and trichloroacetic acid measured at 700 nm using a UV-spectrophotometer
(Vijayalakshmi and Ruckmani, 2016). The highest reduction of the reactive Fe3+ to an inactive Fe2+-
polyphenol complex was exhibited by the butanol fraction (Figure 6.3.2).
Transition metals like iron have major roles to play in the generation of free radicals thereby leading
to oxidative stress (Yoshino and Murakami, 1998). This justifies the use of FeSO4 to induce
experimental oxidative pancreatic injury in normal pancreatic homogenate. Iron over load causes an
increase in free radicals because the reactive superoxide anion is produced through oxygen reduction
by ferrous ion, then dismutated to hydrogen peroxide through enzymatic and non-enzymatic systems
(Halliwell and Gutteridge, 1990). When left untransformed, hydrogen peroxide is converted to
extremely reactive hydroxyl radical (.OH) through the Haber-Weiss reactions using iron or copper
(Aust et al., 1985). Iron also binds to molecular oxygen to form perferryl ion which is highly reactive
in combination with hydroxyl radical and act as an initiator of lipid peroxidation (Yoshino and
Murakami, 1998). Induction of oxidative injury by iron was done in the pancreas because the β-cells
(due to high insulin action) are parts of the most metabolically active tissues and benefit highly from
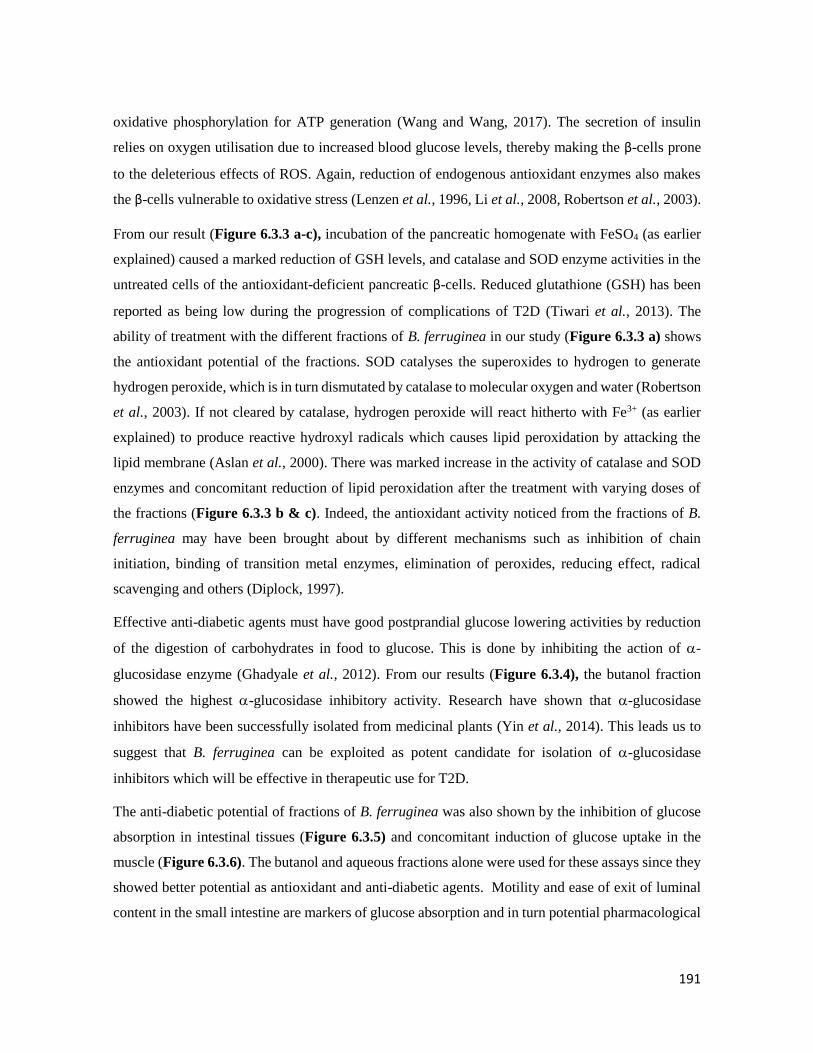
191
oxidative phosphorylation for ATP generation (Wang and Wang, 2017). The secretion of insulin
relies on oxygen utilisation due to increased blood glucose levels, thereby making the β-cells prone
to the deleterious effects of ROS. Again, reduction of endogenous antioxidant enzymes also makes
the β-cells vulnerable to oxidative stress (Lenzen et al., 1996, Li et al., 2008, Robertson et al., 2003).
From our result (Figure 6.3.3 a-c), incubation of the pancreatic homogenate with FeSO4 (as earlier
explained) caused a marked reduction of GSH levels, and catalase and SOD enzyme activities in the
untreated cells of the antioxidant-deficient pancreatic β-cells. Reduced glutathione (GSH) has been
reported as being low during the progression of complications of T2D (Tiwari et al., 2013). The
ability of treatment with the different fractions of B. ferruginea in our study (Figure 6.3.3 a) shows
the antioxidant potential of the fractions. SOD catalyses the superoxides to hydrogen to generate
hydrogen peroxide, which is in turn dismutated by catalase to molecular oxygen and water (Robertson
et al., 2003). If not cleared by catalase, hydrogen peroxide will react hitherto with Fe3+ (as earlier
explained) to produce reactive hydroxyl radicals which causes lipid peroxidation by attacking the
lipid membrane (Aslan et al., 2000). There was marked increase in the activity of catalase and SOD
enzymes and concomitant reduction of lipid peroxidation after the treatment with varying doses of
the fractions (Figure 6.3.3 b & c). Indeed, the antioxidant activity noticed from the fractions of B.
ferruginea may have been brought about by different mechanisms such as inhibition of chain
initiation, binding of transition metal enzymes, elimination of peroxides, reducing effect, radical
scavenging and others (Diplock, 1997).
Effective anti-diabetic agents must have good postprandial glucose lowering activities by reduction
of the digestion of carbohydrates in food to glucose. This is done by inhibiting the action of -
glucosidase enzyme (Ghadyale et al., 2012). From our results (Figure 6.3.4), the butanol fraction
showed the highest -glucosidase inhibitory activity. Research have shown that -glucosidase
inhibitors have been successfully isolated from medicinal plants (Yin et al., 2014). This leads us to
suggest that B. ferruginea can be exploited as potent candidate for isolation of -glucosidase
inhibitors which will be effective in therapeutic use for T2D.
The anti-diabetic potential of fractions of B. ferruginea was also shown by the inhibition of glucose
absorption in intestinal tissues (Figure 6.3.5) and concomitant induction of glucose uptake in the
muscle (Figure 6.3.6). The butanol and aqueous fractions alone were used for these assays since they
showed better potential as antioxidant and anti-diabetic agents. Motility and ease of exit of luminal
content in the small intestine are markers of glucose absorption and in turn potential pharmacological
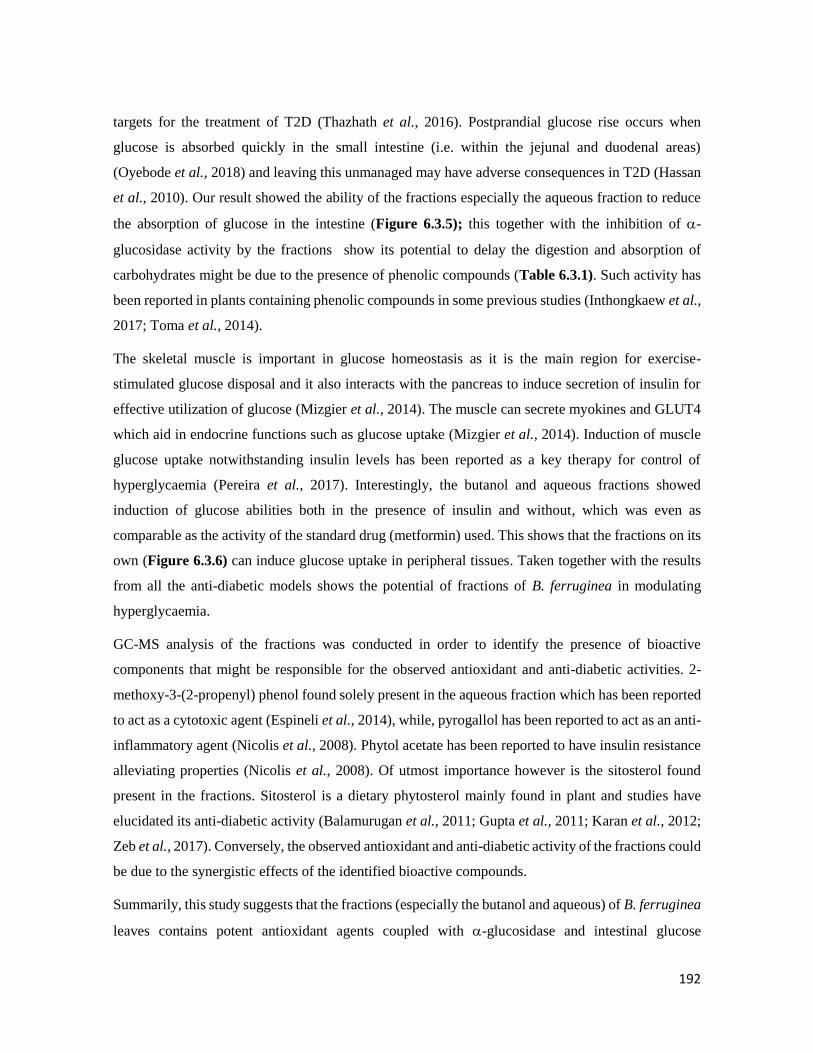
192
targets for the treatment of T2D (Thazhath et al., 2016). Postprandial glucose rise occurs when
glucose is absorbed quickly in the small intestine (i.e. within the jejunal and duodenal areas)
(Oyebode et al., 2018) and leaving this unmanaged may have adverse consequences in T2D (Hassan
et al., 2010). Our result showed the ability of the fractions especially the aqueous fraction to reduce
the absorption of glucose in the intestine (Figure 6.3.5); this together with the inhibition of -
glucosidase activity by the fractions show its potential to delay the digestion and absorption of
carbohydrates might be due to the presence of phenolic compounds (Table 6.3.1). Such activity has
been reported in plants containing phenolic compounds in some previous studies (Inthongkaew et al.,
2017; Toma et al., 2014).
The skeletal muscle is important in glucose homeostasis as it is the main region for exercise-
stimulated glucose disposal and it also interacts with the pancreas to induce secretion of insulin for
effective utilization of glucose (Mizgier et al., 2014). The muscle can secrete myokines and GLUT4
which aid in endocrine functions such as glucose uptake (Mizgier et al., 2014). Induction of muscle
glucose uptake notwithstanding insulin levels has been reported as a key therapy for control of
hyperglycaemia (Pereira et al., 2017). Interestingly, the butanol and aqueous fractions showed
induction of glucose abilities both in the presence of insulin and without, which was even as
comparable as the activity of the standard drug (metformin) used. This shows that the fractions on its
own (Figure 6.3.6) can induce glucose uptake in peripheral tissues. Taken together with the results
from all the anti-diabetic models shows the potential of fractions of B. ferruginea in modulating
hyperglycaemia.
GC-MS analysis of the fractions was conducted in order to identify the presence of bioactive
components that might be responsible for the observed antioxidant and anti-diabetic activities. 2-
methoxy-3-(2-propenyl) phenol found solely present in the aqueous fraction which has been reported
to act as a cytotoxic agent (Espineli et al., 2014), while, pyrogallol has been reported to act as an anti-
inflammatory agent (Nicolis et al., 2008). Phytol acetate has been reported to have insulin resistance
alleviating properties (Nicolis et al., 2008). Of utmost importance however is the sitosterol found
present in the fractions. Sitosterol is a dietary phytosterol mainly found in plant and studies have
elucidated its anti-diabetic activity (Balamurugan et al., 2011; Gupta et al., 2011; Karan et al., 2012;
Zeb et al., 2017). Conversely, the observed antioxidant and anti-diabetic activity of the fractions could
be due to the synergistic effects of the identified bioactive compounds.
Summarily, this study suggests that the fractions (especially the butanol and aqueous) of B. ferruginea
leaves contains potent antioxidant agents coupled with -glucosidase and intestinal glucose
193
absorption inhibitors as well as peripheral tissue glucose uptake inducers, which could be further
exploited for the development of a therapeutic strategy for the management and control of
postprandial hyperglycemia in type 2 diabetes and its macrovascular complications. Future work will
entail a detailed study of the active fraction in a type 2 diabetes model of rats.
Postscript: The butanol fraction was picked for the in vivo experiment or animals study since it had
high antioxidant and antidiabetic activity in the tested models and also it had a high yield.

194
6.4 Butanol fraction of Bridelia ferruginea leaves regulates pancreatic β-cell
functions, stimulates insulin secretion and ameliorates diabetic complications in
a type 2 diabetes model of rats
Olajumoke A. Oyebode, Olakunle Sanni, Md. Shahidul Islam*
Department of Biochemistry, University of KwaZulu-Natal, (Westville Campus), Durban 4000,
South Africa.
*Corresponding author: [email protected]; Tel: +27 (0)31-260-8717; Fax: +27 (0)31-260-7942
Preface: This article reports the detailed in vivo anti-diabetic studies of the butanol fraction and it is
currently awaiting revision before submission to a journal for publication.
6.4.1 Abstract
This study reports the anti-diabetic effects of the butanol fraction of B. ferruginea (BFBF) leaves on
streptozotocin induced diabetic rats. Seven weeks old male Sprague dawley (SD) rats were given a
single intraperitoneal injection of STZ (40 mg/kg bw), after initially being fed 10% fructose solution
for two weeks to induce type 2 diabetes. The diabetic animals were thereafter given an oral dose (150
or 300 mg/kg bw) of BFBF. Treatments with the plant extract significantly (p < 0.05) reduced the
concentration of blood glucose and improved glucose tolerance compared to the untreated groups.
There was also a marked improvement in β-cell function, serum insulin levels and insulin sensitivity,
liver glycogen, serum lipids alterations and increased activity of liver function enzymes.
Histopathological analysis of the pancreas by H and E staining also revealed the ability of BFBF to
protect and regenerate the pancreatic β-cells after partial damage induced by STZ injection. The
findings of this study suggest that BFBF possesses promising anti-T2D activity, which is probably
mediated through the modulation of β-cell function and stimulation of insulin secretion.
Key words: Type 2 diabetes, histopathology, serum analysis, Bridelia ferruginea, SD rats
6.4.2 Introduction
Type 2 diabetes (T2D) is a complex disease, which occurs due to an increased level of postprandial
glucose. This spike is caused by defective insulin transport of the elevated glucose for effective
utilization by peripheral organs (such as muscle and adipose tissues) (Geijselaers et al., 2017; Nolan
et al., 2015). Insulin resistance leads to chronic hyperglycaemia a precursor to anomalies in
carbohydrate, protein and fat metabolism (Hardy et al., 2012).
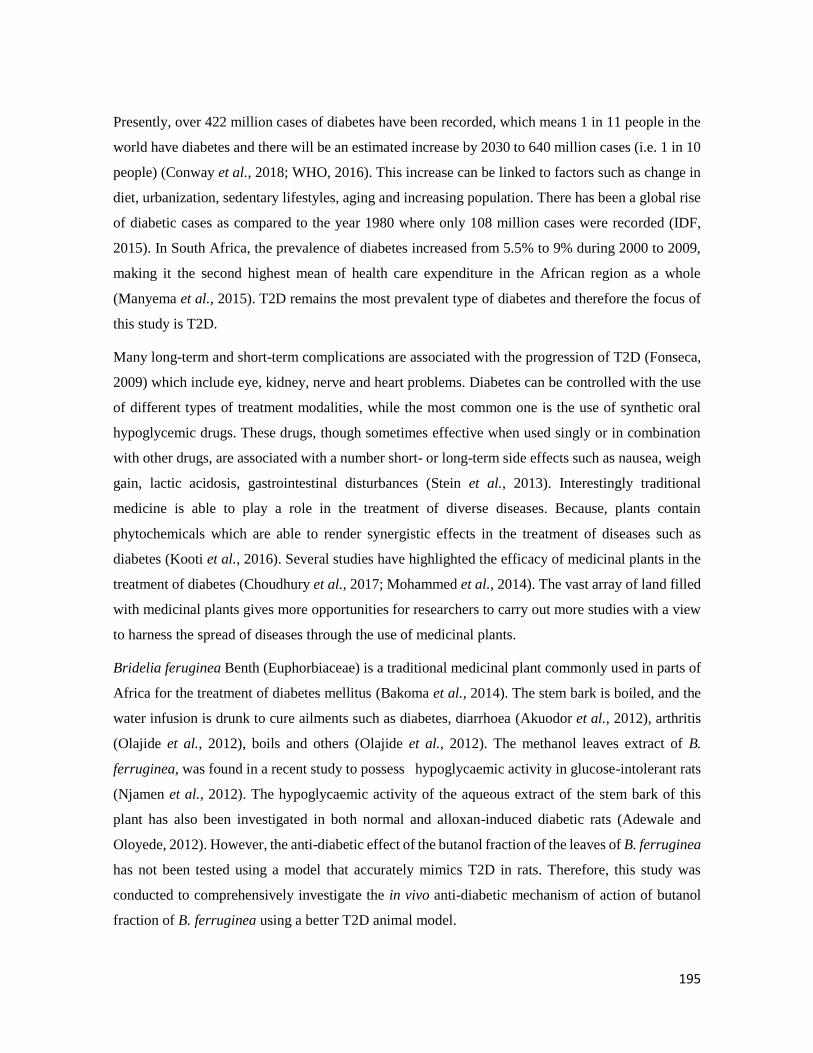
195
Presently, over 422 million cases of diabetes have been recorded, which means 1 in 11 people in the
world have diabetes and there will be an estimated increase by 2030 to 640 million cases (i.e. 1 in 10
people) (Conway et al., 2018; WHO, 2016). This increase can be linked to factors such as change in
diet, urbanization, sedentary lifestyles, aging and increasing population. There has been a global rise
of diabetic cases as compared to the year 1980 where only 108 million cases were recorded (IDF,
2015). In South Africa, the prevalence of diabetes increased from 5.5% to 9% during 2000 to 2009,
making it the second highest mean of health care expenditure in the African region as a whole
(Manyema et al., 2015). T2D remains the most prevalent type of diabetes and therefore the focus of
this study is T2D.
Many long-term and short-term complications are associated with the progression of T2D (Fonseca,
2009) which include eye, kidney, nerve and heart problems. Diabetes can be controlled with the use
of different types of treatment modalities, while the most common one is the use of synthetic oral
hypoglycemic drugs. These drugs, though sometimes effective when used singly or in combination
with other drugs, are associated with a number short- or long-term side effects such as nausea, weigh
gain, lactic acidosis, gastrointestinal disturbances (Stein et al., 2013). Interestingly traditional
medicine is able to play a role in the treatment of diverse diseases. Because, plants contain
phytochemicals which are able to render synergistic effects in the treatment of diseases such as
diabetes (Kooti et al., 2016). Several studies have highlighted the efficacy of medicinal plants in the
treatment of diabetes (Choudhury et al., 2017; Mohammed et al., 2014). The vast array of land filled
with medicinal plants gives more opportunities for researchers to carry out more studies with a view
to harness the spread of diseases through the use of medicinal plants.
Bridelia feruginea Benth (Euphorbiaceae) is a traditional medicinal plant commonly used in parts of
Africa for the treatment of diabetes mellitus (Bakoma et al., 2014). The stem bark is boiled, and the
water infusion is drunk to cure ailments such as diabetes, diarrhoea (Akuodor et al., 2012), arthritis
(Olajide et al., 2012), boils and others (Olajide et al., 2012). The methanol leaves extract of B.
ferruginea, was found in a recent study to possess hypoglycaemic activity in glucose-intolerant rats
(Njamen et al., 2012). The hypoglycaemic activity of the aqueous extract of the stem bark of this
plant has also been investigated in both normal and alloxan-induced diabetic rats (Adewale and
Oloyede, 2012). However, the anti-diabetic effect of the butanol fraction of the leaves of B. ferruginea
has not been tested using a model that accurately mimics T2D in rats. Therefore, this study was
conducted to comprehensively investigate the in vivo anti-diabetic mechanism of action of butanol
fraction of B. ferruginea using a better T2D animal model.

196
6.4.3 Materials and methods
Please refer to Chapter 2 for detailed materials and methods that affect B. ferruginea.
6.4.4 Results
The mean feed and fluid intake with weekly body weight changes of all animals were monitored all
through the experimental period. The diabetic rats showed significantly (p < 0.05) higher feed and
fluid consumption as well as lower body weight gains compared to the normal rats. Oral dosing of
BFBF to the diabetic rats significantly (p < 0.05) decreased the fluid intake compared to the untreated
diabetic rats (Figure 6.4.1). Feed intake was also reduced upon intervention with BFBF and
metformin as seen in Figure 6.4.1.
Figure 6.4.1: Mean feed and fluid intakes of different groups during the entire experimental period. Data are reported as the mean ± SD of seven animals. a-c Different superscript alphabets over the bars for a given parameter
indicate significant difference (Tukey’s-HSD multiple range post hoc test, p < 0.05). NC, Normal control, DBC, Diabetic
control, DBFL, Diabetic B. ferruginea low dose, DBFH, Diabetic B. ferruginea high dose, DBM, Diabetic metformin, DBG,
Diabetic glibenclamide, NBF, Normal B. ferruginea high dose (toxicological control),
Interestingly, animals in the DBFH and DBM group showed a better body weight gain than the low
dose, standard and untreated groups towards the end of the experiment (Figure 6.4.2).
aa
c
d
b
b
b
b
b
b
bc
c
b a
0
50
100
150
200
250
300
Feed intake (g/rat/day) Fluid intake (mL/rat/day)
Fee
d a
nd
flu
id in
take
(u
nit
s)
NC DBC DBFL DBFH DBM DBG NBF
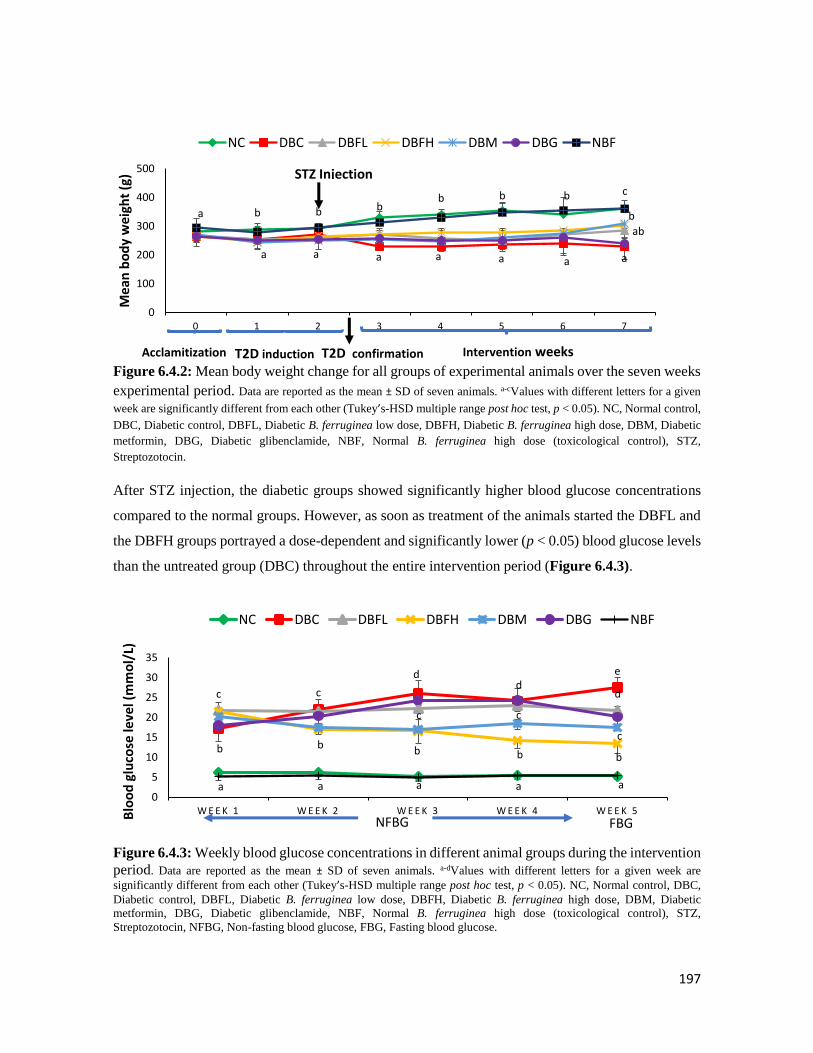
197
Figure 6.4.2: Mean body weight change for all groups of experimental animals over the seven weeks
experimental period. Data are reported as the mean ± SD of seven animals. a-cValues with different letters for a given
week are significantly different from each other (Tukey’s-HSD multiple range post hoc test, p < 0.05). NC, Normal control,
DBC, Diabetic control, DBFL, Diabetic B. ferruginea low dose, DBFH, Diabetic B. ferruginea high dose, DBM, Diabetic
metformin, DBG, Diabetic glibenclamide, NBF, Normal B. ferruginea high dose (toxicological control), STZ,
Streptozotocin.
After STZ injection, the diabetic groups showed significantly higher blood glucose concentrations
compared to the normal groups. However, as soon as treatment of the animals started the DBFL and
the DBFH groups portrayed a dose-dependent and significantly lower (p < 0.05) blood glucose levels
than the untreated group (DBC) throughout the entire intervention period (Figure 6.4.3).
Figure 6.4.3: Weekly blood glucose concentrations in different animal groups during the intervention
period. Data are reported as the mean ± SD of seven animals. a-dValues with different letters for a given week are
significantly different from each other (Tukey’s-HSD multiple range post hoc test, p < 0.05). NC, Normal control, DBC,
Diabetic control, DBFL, Diabetic B. ferruginea low dose, DBFH, Diabetic B. ferruginea high dose, DBM, Diabetic
metformin, DBG, Diabetic glibenclamide, NBF, Normal B. ferruginea high dose (toxicological control), STZ,
Streptozotocin, NFBG, Non-fasting blood glucose, FBG, Fasting blood glucose.
b bb b c
a aaaa
bb
ab
a
a
a
b
0
100
200
300
400
500
0 1 2 3 4 5 6 7
Mea
n b
od
y w
eigh
t (g
)
NC DBC DBFL DBFH DBM DBG NBF
T2D induction Intervention weeks
STZ Injection
T2D confirmationAcclamitization
a a a
c
dd
e
c d
b b bb b
c
c
c
a a0
5
10
15
20
25
30
35
W E E K 1 W E E K 2 W E E K 3 W E E K 4 W E E K 5Blo
od
glu
cose
leve
l (m
mo
l/L)
NC DBC DBFL DBFH DBM DBG NBF
NFBG FBG

198
The data for OGTT done on the last week (week 5) of the intervention period and the corresponding
area under the curve (AUC) are shown in Figure 6.4.4. The glucose tolerance of DBFL and DBFH
groups were significantly (p < 0.05) lower than the DBC and DBG group and even comparable to the
metformin group (DBM). At the 120 min mark, the DBFH group exhibited a better glucose tolerance
ability which was even lower than the 0-min blood glucose level. The total area under the curve
(AUC) of DBFL and DBM groups were significantly lower than the other diabetic groups (DBC,
DBFH, and DBG) (Figure 6.4.4) which signifies better tolerance of the glucose overload in the blood.
Figure 6.4.4: Oral glucose tolerance test (OGTT) and corresponding area under the curve (AUC) of
different animal groups in the last week of the intervention period. Data are reported as the mean ± SD of
seven animals. a-eValues with different letters for a given time are significantly different from each other (Tukey’s-HSD
multiple range post hoc test, p < 0.05). NC, Normal control, DBC, Diabetic control, DBFL, Diabetic B. ferruginea low dose,
DBFH, Diabetic B. ferruginea high dose, DBM, Diabetic metformin, DBG, Diabetic glibenclamide, NBF, Normal B.
ferruginea high dose (toxicological control), AUC, Area under the curve.
The liver weight, relative liver weight and liver glycogen level of different animal groups are shown
in Table 6.4.1. There was no significant difference in the liver weight of all animal groups, however,
the relative liver weight of the normal groups (NC and NBF) were significantly (p < 0.05) lower than
that of the diabetic groups. The DBFL group showed a significantly (p < 0.05) lower relative liver
weight compared to the DBC group. The treatment with BFBF significantly increased the liver
glycogen level compared to the untreated group (Table 6.4.1).
a aa a
e
d ee
d
c
c
c
b
bb b
b
c
bc
c
dd
d
a0
5
10
15
20
25
30
35
40
0 3 0 6 0 9 0 1 2 0
Blo
od
glu
cose
(m
mo
l/L)
Time after glucose injection
NC DBC DBFL DBFH DBM DBG NBF
AUC: 424.28±20.15a
2290±389.47d
1692.5±102.6c
1174.67±168.36b
1765.67±215.28c
2106.38±256.39d
474.4±19.7a

199
Table 6.4.1: The effects of different doses of BFBF on liver weight, relative liver weight and liver
glycogen levels in the different animal groups at the end of the intervention period.
Parameter NC DBC DBFL DBFH DBM DBG NBF
Liver weights (g) 10.7±0.8 8.7±0.9 9.0±0.7 10.6±0.9 9.6±0.7 9.9±0.9 9.9±0.8
Rel. liver weights
(%) 2.9±0.3a 3.8±0.2b 3.2±0.4b 4.4±0.5c 2.7±0.1a 2.4±0.1a 2.8±0.3a
Liver glycogen
(mg/g tissue) 36.0±0.9e 11.8±1.1a 23.6±0.3c 31.8±0.1d 31.4±1.1d 21.8±0.8b 36.4±0.7e
Results are expressed as mean ± SD (n=7). a-eDifferent superscript letters along a row for a given parameter indicate the
significance of difference (Tukey’s-HSD multiple range post hoc test, p < 0.05).
At the end of the experimental period after sacrificing the animals, the blood samples were taken and
the serum lipid profile of all the animals were taken and it is reported in Figure 6.4.5. The DBC group
showed a significantly (p < 0.05) higher total and LDL-cholesterol compared to the normal groups.
However, treatment with BFBF reduced the levels of these cholesterols as seen in the DBFL, DBFH
and DBM groups, the DBG group showed a statistically similar result to DBC for total and HDL-
cholesterol. Interestingly, the DBFL group showed even lowed LDL-cholesterol than the normal
group. On the other hand, the NC group showed a significantly (p < 0.05) higher amount of HDL-
cholesterol just like the other groups more than the DBC group. T2D-induction caused a significant
(p < 0.05) elevation of serum triglycerides level which was reduced in the DBFH and DBM groups.
Figure 6.4.5: Serum lipid profile of different animal groups at the end of the intervention period. Data
are reported as the mean ± SD of seven animals. a-eValues with different letters for a given parameter
significantly different from each other (Tukey’s-HSD multiple range post hoc test, p < 0.05). NC, Normal
control, DBC, Diabetic control, DBFL, Diabetic B. ferruginea low dose, DBFH, Diabetic B. ferruginea high
dose, DBM, Diabetic metformin, DBG, Diabetic glibenclamide, NBF, Normal B. ferruginea high dose
(toxicological control), HDL, High density lipoprotein, LDL, Low density lipoprotein.
a
bab
a
c
a
d
c
ab
b
b
ba
b a
ab
ab
bab
ab
c
b
c
c
b
b
bcab
0
20
40
60
80
100
120
140
160
Total cholesterol HDL-cholesterol LDL-cholesterol Triglycerides
Seru
m li
pid
pro
file
(m
g/d
L)
NC DBC DBFL DBFH DBM DBG NBF

200
Data of other serum indices of diabetic complications investigated are shown on Table 6.4.2. The
induction of T2D using STZ intraperitoneal injection had no effect of serum ALT levels in all animals
in all groups. Serum levels of ALP, AST and urea were increased in the DBC group compared to the
NC and NBF groups. Interestingly, BFBF treatment significantly ameliorated the ALP, AST, urea
and creatinine levels in the respective groups.
Table 6.4.2: Serum biochemical parameters in different animal groups at the end of the experimental
period.
Parameter NC DBC DBFL DBFH DBM DBG NBF
AST (U/L) 49.5±5.6a 147±16.3e
73.5±5.7bc 59.5±9.7ab 102.5±12.5bd 85±8.8cd 50±14.3a
ALT (U/L) 87.8±1.1 87.3±2.0 86.3±1.8 87±0.7 85.5±2.1 86.3±1.3 86±5.8
ALP (U/L) 72.3±6.2a 308.3±44.8de 259.3±23cd 142±24ab 206.8±59.5bc 395.9±86.2e 68.3±13.9a
Urea
(mg/dL) 52.6±4.8b 73.8±3.4c 56.5±8.8b 41.3±2.8a 51±5.8ab 71.5±3.9c 46.3±5.8ab
UA
(mg/dL) 0.78±0.43a 3.5±0.9c 2.2±0.3b 1.1±0.5ab 1.3±0.5ab 1.6±0.7ab
1.2±0.4ab
CK-
MB(u/L) 118.9±14.7a 305.5±27.8d 250.9±35c 171.9±22.9b 113.9±17.7a 185.9±7.6b 153±22.3ab
Results are expressed as mean ± SD (n=7). a-eDifferent superscript letters for a given parameter along a row indicate the
significance of difference (Tukey’s-HSD multiple range post hoc test, p < 0.05). NC, Normal control, DBC, Diabetic control,
DBFL, Diabetic B. ferruginea low dose, DBFH, Diabetic B. ferruginea high dose, DBM, Diabetic metformin, DBG,
Diabetic glibenclamide, NBF, Normal B. ferruginea high dose (toxicological control), AST, Aspartate aminotransferase;
ALT, Alanine aminotransferase; ALP, Alanine phosphatase; UA, Uric acid; CK-MB, Creatinine kinase-myocardial band.
Serum insulin levels were significantly (p < 0.05) higher in DBFH and normal groups compared to
the remaining groups (Table 6.4.3). The HOMA-IR score in the NC group was significantly lower
than that of the DBC and treatment with BFBF was able to reduce to HOMA-IR scores. In the other
case, the HOMA-β scores of the DBC group was seen to be significantly lower than that of the NC
groups and the DBFH group showed a moderate increase in HOMA-β scores. Serum fructosamine
data also showed a difference in the DBC group compared to the NC. Interestingly, treatment with
DBFH significantly (p < 0.05) improved these parameters at the end of the experiment.
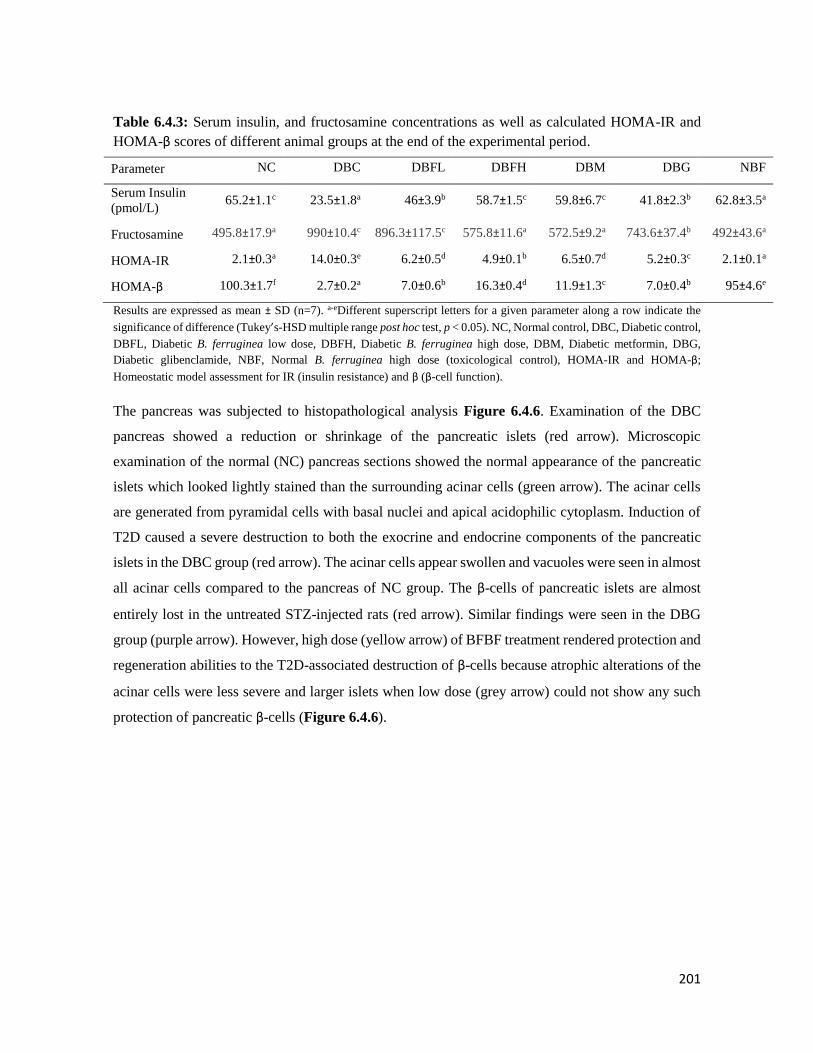
201
Table 6.4.3: Serum insulin, and fructosamine concentrations as well as calculated HOMA-IR and
HOMA-β scores of different animal groups at the end of the experimental period.
Parameter NC DBC DBFL DBFH DBM DBG NBF
Serum Insulin
(pmol/L) 65.2±1.1c 23.5±1.8a 46±3.9b 58.7±1.5c 59.8±6.7c 41.8±2.3b 62.8±3.5a
Fructosamine 495.8±17.9a 990±10.4c 896.3±117.5c 575.8±11.6a 572.5±9.2a 743.6±37.4b 492±43.6a
HOMA-IR 2.1±0.3a 14.0±0.3e 6.2±0.5d 4.9±0.1b 6.5±0.7d 5.2±0.3c 2.1±0.1a
HOMA-β 100.3±1.7f 2.7±0.2a 7.0±0.6b 16.3±0.4d 11.9±1.3c 7.0±0.4b 95±4.6e
Results are expressed as mean ± SD (n=7). a-eDifferent superscript letters for a given parameter along a row indicate the
significance of difference (Tukey’s-HSD multiple range post hoc test, p < 0.05). NC, Normal control, DBC, Diabetic control,
DBFL, Diabetic B. ferruginea low dose, DBFH, Diabetic B. ferruginea high dose, DBM, Diabetic metformin, DBG,
Diabetic glibenclamide, NBF, Normal B. ferruginea high dose (toxicological control), HOMA-IR and HOMA-β;
Homeostatic model assessment for IR (insulin resistance) and β (β-cell function).
The pancreas was subjected to histopathological analysis Figure 6.4.6. Examination of the DBC
pancreas showed a reduction or shrinkage of the pancreatic islets (red arrow). Microscopic
examination of the normal (NC) pancreas sections showed the normal appearance of the pancreatic
islets which looked lightly stained than the surrounding acinar cells (green arrow). The acinar cells
are generated from pyramidal cells with basal nuclei and apical acidophilic cytoplasm. Induction of
T2D caused a severe destruction to both the exocrine and endocrine components of the pancreatic
islets in the DBC group (red arrow). The acinar cells appear swollen and vacuoles were seen in almost
all acinar cells compared to the pancreas of NC group. The β-cells of pancreatic islets are almost
entirely lost in the untreated STZ-injected rats (red arrow). Similar findings were seen in the DBG
group (purple arrow). However, high dose (yellow arrow) of BFBF treatment rendered protection and
regeneration abilities to the T2D-associated destruction of β-cells because atrophic alterations of the
acinar cells were less severe and larger islets when low dose (grey arrow) could not show any such
protection of pancreatic β-cells (Figure 6.4.6).

202
Figure 6.4.6: Histopathological images of the pancreas of different animal groups at the end of the
experiment. NC, Normal control, DBC, Diabetic control, DBFL, Diabetic B. ferruginea low dose, DBFH,
Diabetic B. ferruginea high dose, DBM, Diabetic metformin, DBG, Diabetic glibenclamide, NBF, Normal B.
ferruginea high dose (toxicological control).
6.4.5 Discussion
Africa is home to many indigenous plants which have anti-diabetic activity. The cost, unavailability
and unwanted side effects of common synthetic drugs makes medicinal plants of high importance in
T2D-drug research. Medicinal plants showing anti-diabetic activities must possess glucose lowering
effect and must be able to keep glucose levels close to normal at all times.
203
The T2D-induction model used in this study was carried out using two distinct pathological features
of T2D. The first is induction of insulin resistance by high fructose diet (giving the animals 10%
fructose for two weeks) and the second is induction of partial pancreatic β-cell destruction (a single
intraperitoneal injection of 40 mg/kg bw STZ) (Wilson and Islam, 2012).
Common physical manifestation of T2D includes polydipsia (frequent thirst), polyphagia (insatiable
appetite), weight loss due to diarrhoea, lethargy, blurred vision, frequent urination and others (Kohei,
2010). Successful induction of T2D in our experiment was confirmed by the induction of feed and
fluid intake of the diabetic animals compared to the normal animals (Figure 6.4.1) and loss of body
weight (Figure 6.4.2). The ability of these symptoms to improve significantly upon treatment with
extracts suggests the anti-diabetic potential of this plant fraction.
A main pathological feature of T2D is persistent high blood glucose level which was exhibited in the
untreated diabetic (DBC) group all through the intervention period (Figure 6.4.3). Maintaining
normal blood glucose level is the main goal of T2D treatment modalities so as to stop the diseases
from progressing into major macrovascular complications (Asif, 2014). The ability of the high dose
of the fraction (DBFH) to reduce blood glucose concentrations to almost normal level might be due
to its enhancing glycogenolysis and cellular glucose uptake.
A high dose (300 mg/kg bw) of the BFBF showed promising blood glucose lowering abilities (Figure
6.4.3), improved glucose clearance (Figure 6.4.4), displayed insulin resistance alleviating properties
(Table 6.4.3) and even demonstrated pancreatic β-cell protective abilities (HOMA-β and
histopathological analysis). This can be explained better by suggesting that the fraction favoured
insulin secretion, which then induced effective glucose uptake by the cells. The ability of the fraction
to protect the β-cells of the pancreas after STZ-injection might be due to the antioxidant potential of
the fraction which was reported in the last section (Section 6.3) since oxidative stress has been
implicated to induce damage to the β-cell of the pancreas (Li et al., 2008).
The reduction of liver glycogen level is another pathological feature of experimental induction of
diabetes (Chaudhury et al., 2017). This observed reduction is caused by decrease in the action of
glycogen synthase and glycogen phosphorylase (Adeva-Andany et al., 2016). Studies have reported
on the ability of medicinal plants to stimulate glycogen production by increasing glycogenesis in the
liver thereby potentiating anti-diabetic activities. Interestingly high glycogen levels seen in the DBFH
group (Table 6.4.1) compared to the untreated group showed the anti-diabetic activity is not only
204
limited to insulin production, β-cell protection and increasing glucose uptake but also by improving
the synthesis of liver glycogen level.
Hyperlipidaemia is another feature of experimentally-induced T2D where elevation of serum insulin
levels suggests increased risk of coronary heart disease and stroke in T2D (Gomes, 2013); a major
complication of T2D that increases the mortality rate of patients (Einarson et al., 2018). Significantly,
increased levels of serum total and LDL-cholesterol was seen in the DBC group compared to the
normal group (Figure 6.4.5). The serum HDL-cholesterol on the other hand was increased in the
normal groups compared to the diabetic groups. Interestingly, the BFBF groups all had same HDL-
cholesterol levels as the normal and standard drug-treated groups. Hypertriglyceridemia (high serum
triglyceride levels) is a suggested marker for coronary heart disease. Induction of T2D elevated the
level of serum triglycerides, which was reduced in the BFBF treated groups shows the ability of the
plant fraction to protect the heart against cardiac problems and atherosclerosis associated with T2D.A
number of plant-based phytoconstituents have been reported to elicit hypolipidemic abilities in
experimentally induced diabetes (Dhulasavant et al., 2010, Gaikwad et al., 2014).
Data from other parameters of complications in T2D also showed a significant increase in AST, ALP,
urea, uric acid and CK-MB. No significant change was seen amongst the serum ALT of all the animals
in different groups. Insulin deficiency in T2D leads to increased serum levels of transaminase
enzymes due to initiation of gluconeogenesis and ketogenesis (Ghosh and Suryawanshi, 2001).
Increase levels of AST, ALP and ALT are markers of liver malfunction as a result of insulin
deficiency. Interestingly, treatment with BFBF in our study significantly reversed the increased levels
of these enzymes thereby signifying hepatoprotective ability of the fraction.
Diabetic kidney disease is a major complication of T2D. Hyperglycaemia destroys the microvascular
blood vessels thereby causing impaired renal activity and diabetic nephropathy. Studies have shown
that high serum uric acid levels show the prognosis of chronic kidney disease in T2D (Kushiyama et
al., 2014), which predicts an imbalance in uric acid production and excretion. Induction of T2D in
our study caused an increased level of serum uric acid (Table 6.4.2), however, daily treatment with
the fraction significantly reduced the uric acid levels, thereby showing the nephroprotective ability of
the fraction in T2D complications.
The presence of sitosterol a known phenolics in B. ferruginea might be responsible for the observed
cardio, renal and hepatoprotective effect of the high dose of the butanol fraction as demonstrated in a
study by Olaiya et al. (2015).
205
In conclusion, the findings of this study indicate that oral administration of BFBF in male SD rats
can reduce hyperglycaemia, diabetic complications and protect against STZ-induced damage to the
pancreatic β-cell. The phyto-chemical constituents of B. ferruginea might be responsible for these
pharmacological activities. We can therefore conclude that B. ferruginea is a non-toxic (even at a
high dose) source of natural antioxidants that can be effectively used in the treatment of diabetes and
its complications. However, a detailed molecular study should be done to better understand the
mechanism of action of its biochemical constituents.

206
THE ANTIOXIDANT AND ANTIDIABETIC ACTIVITIES OF BOERHAVIA
DIFFUSA IN VITRO, EX VIVO AND IN SILICO
7.1 Background
Boerhaavia diffusa is a perennial, ground-spreading shrub (as long as 2000 m) found growing richly
in unfertilized soil and is native to both India and Brazil and parts of Africa (Figure 7.1). The leaves
are simple, thick, fleshy, hairy and oblong in shape. The small pinkish flowers with short stalk has
both staminate and carpellate parts. The roots of B. diffusa are well developed, stout, fusiform and
cylindrical in shape with yellowish brown colour. The stem is prostrate (creeping plant) in nature,
succulent, slender and cylindrical in shape.
Figure 7.1: Boerhavia diffusa Linn (Nyctaginaceae): Common names: Arowojeja (Yoruba, Nigeria),
red spiderling, spreading hogweed (English). Adapted without permission from Indiamart (2009).
7.1.1 Ethnobotanical uses
B. diffusa is a super food used successfully in folk medicine, and the leaves are eaten in salad or
sauces. In parts of Nigeria, the whole plant is eaten in curries and soups while the seeds and roots are
used to make pancakes. Traditionally, B. diffusa is planted in gardens as snake and scorpion
207
repellents. The plant is used locally tied around a pregnant woman’s waist to induce labour, and when
ground and mixed with honey it is used to treat conjunctivitis. In Ayurveda, B. diffusa is commonly
used for treatment of jaundice, liver diseases, diabetes, edema, oliguria, anemia, inflammatory edema,
diseases of the eye, and aging (Murti et al., 2010).
7.1.2 Biological activities
Some bioactive constituents have been isolated from the aerial parts of B.diffusa and they include
ursolic acid, β-sitosterol, boeravinone, punarnavoside, alkaloids, sterols, sugars and flavones and a
host of others (Chakraborti and Handa, 1989, Nayak and Thirunavoukkarasu, 2016; Pereira et al.,
2009,).
A study reported that oral administration of leaf extract of B. diffusa at 200 mg/kg body weight (bw)
elicited a significant reduction in lipid peroxidation with a concomitant induction of endogenous
antioxidant enzymes like catalase, superoxide dismutase, reduced glutathione, glutathione peroxidase
and S-transferase in the kidney and liver of alloxan-induced diabetic rats (Satheesh and Pari, 2004).
B. diffusa root extract showed hepatoprotective ability in experimentally-induced hepatotoxicity in
mice (Rajpoot and Mishra, 2011). Oral administration of the aqueous leaves extract of B. diffusa in
normal and alloxan-induced diabetic rats showed a decrease in blood glucose levels and a significant
rise in plasma insulin levels, which was even more significant than the effect of glibenclamide (a
standard anti-diabetic drug) (Chude et al., 2001; Pari and Amarnath Satheesh, 2004; Satheesh and
Pari, 2004). At a dose of 200 mg/kg bw for four weeks, the aqueous leaf extract of B. diffusa showed
significant (p < 0.05) change in blood glucose concentration and activity of hepatic gluconeogenic
enzymes (increase in hexokinase activity and decrease in glucose-6-phosphatase and fructose-1, 6-
phosphatase activity) in both normal and alloxan induced diabetic rats (Pari and Satheesh, 2004). The
chloroform extract of the leaves of this plant was tested on streptozotocin-induced type 2 diabetic rats
and it also showed a dose-dependent reduction of blood sugar levels even comparable to the action
of glibenclamide (Nalamolu et al., 2004) thus supporting its anti-diabetic role in Ayuverdic medicine.
208
7.2 Boerhaavia diffusa inhibits key enzymes linked to type 2 diabetes in vitro and in
silico; and modulates abdominal glucose absorption and muscle glucose uptake
ex vivo
1Olajumoke Arinola Oyebode, 1Ochuko Lucky Erukainure, 1, 2Chika Ifeanyi Chukwuma, 3Collins U.
Ibeji, 4Neil A. Koorbanally 1Md. Shahidul Islam*
1. Department of Biochemistry, School of Life Sciences, University of KwaZulu-Natal,
(Westville Campus), Durban 4000, South Africa.
2. Department of Pharmacology, University of the Free State, Bloemfontein 9301, South
Africa.
3. Department of Pure and Industrial Chemistry, Faculty of Physical Sciences, University of
Nigeria, Nsukka 410001, Enugu State, Nigeria
4. School of Chemistry and Physics, University of KwaZulu-Natal, (Westville Campus),
Durban 4000, South Africa
*Corresponding author: [email protected]; Tel: +27 (0)31-260-8717; Fax: +27 (0)31-260-7942
Preface: This article reports the detailed in vitro antioxidant and anti-diabetic effects of the crude
extracts from B. diffusa, which has been published in Journal of Biomedicine and Pharmacotherapy.
7.2.1 Abstract
The present study investigated the in vitro and ex vivo antioxidant, anti-diabetic and anti-obesogenic
potentials of different solvent (ethyl acetate, ethanol and water) extracts from the aerial parts of
Boerhaavia diffusa. The ferric reducing antioxidant power (FRAP), DPPH scavenging activity and
the ameliorative effects of the extracts on Fe2+-induced oxidative injury was investigated both in vitro
and ex vivo. The glucosidase and pancreatic lipase inhibitory potentials of the extracts were examined
in vitro, while the effects of the ethanol extract on abdominal glucose intake and muscle glucose
uptake were determined in freshly harvested tissues ex vivo. The extracts were subjected to Gas
Chromatography-Mass Spectrometry (GC–MS) analysis to identify their possible bioactive
components. The ethanol extract showed the most potent FRAP and DPPH radical scavenging
activities compare to other extracts. All extracts increased catalase and SOD activities, and GSH
levels in oxidative pancreatic injury. Both ethanol and aqueous extracts exhibited remarkable enzyme
inhibitory activities, which was significantly higher than ethyl acetate extract and acarbose but was
not comparable to orlistat. The ethanol extract portrayed a dose-dependent inhibitory effect on jejunal
glucose uptake and enhancement of muscle glucose
209
uptake. 9-(4 methoxyphenyl) xanthene, xanthone and stigmasterol showed strong binding affinities
for α-glucosidase and lipase enzymes tested. Data from this study suggest that aerial parts of B. diffusa
(particularly the ethanol extract) may not only exhibit antioxidant potentials but may also mediate
anti-lipidemic and anti-hyperglycemic effects via inhibiting fat and carbohydrate digestion as well as
abdominal glucose intake and enhancing muscle glucose uptake.
7.2.2 Introduction
Diabetes mellitus (DM) is regarded as the most common endocrine disorder in humans. According to
the World Health Organization (WHO, 2016), at least 1.5 million deaths in 2015 alone were directly
caused by diabetes globally. Among the different occurrences of diabetes, type 2 diabetes (T2D)
remains the most common, and major public health challenge of the 21st century (Canivell and Gomis,
2014). It is described as a versatile and degenerative illness that is affiliated with several metabolic
flaws and organ malfunction or damage (Pratley, 2013). The eminent pathogenic features of T2D
include pancreatic beta cell impairment and insulinemia which ultimately results in defective insulin
secretion and persistent hyperglycemia (Gilbert and Pratley, 2015). Insulin resistance is also
associated with poor lipid metabolism, which aggravates metabolic syndrome and lipidemia in the
progression of T2D (Kahn et al., 2014).
In peripheral tissues like adipose and muscle tissues, insulin resistance is an indicator for inadequate
cellular glucose uptake, which leads to hyperglycemia in T2D (Paneni et al., 2014, Pratley and Weyer,
2001). Hyperglycemia-induced oxidative stress has been implicated in the symptoms, progression
and complications of T2D (Röder et al., 2014, Tangvarasittichai, 2015). Persistent hyperglycemia is
responsible for elevated levels of mitochondrial energy production, glucose oxidation, protein
glycosylation and lipid peroxidation, which leads to an increased output of free radicals and reactive
oxygen species (ROS) and eventually, oxidative stress (Gargari et al., 2011). The pancreas is one of
the most vulnerable organs to oxidative stress, because of its low levels of free radical scavenging
ability compared to other organs (Eleazu et al., 2013). Free radicals such as nitric oxide and hydroxyl
radical are the potent culprit in the oxidative damage of pancreatic beta cells, which further worsens
diabetic conditions (Eleazu et al., 2013).
The use of traditional medicinal plants has been an effective approach in ameliorating oxidative stress,
hyperglycemia and metabolic syndrome (Nistor BL et al., 2010). This is because of their rich
therapeutic phytochemical constituents including phenolics, flavonoids, tannins, saponins, glycosides
etc. (Eid and Haddad, 2014), which can potentiate several bioactivities including anti-oxidant, anti-
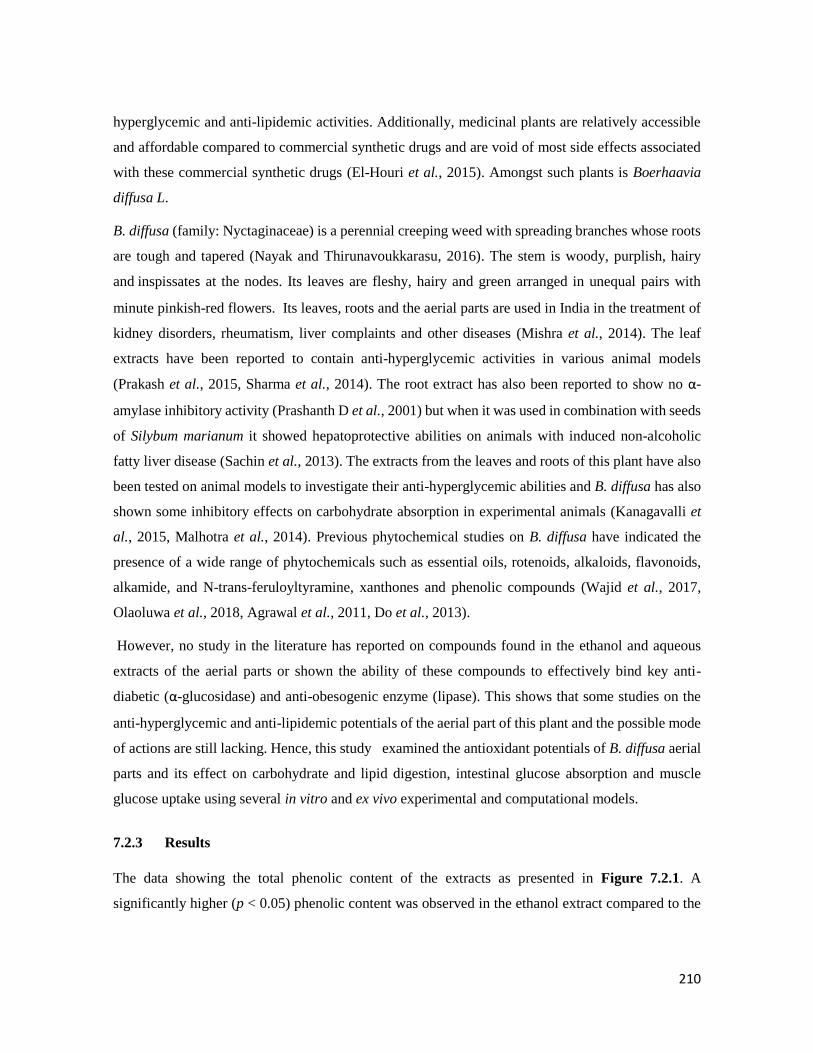
210
hyperglycemic and anti-lipidemic activities. Additionally, medicinal plants are relatively accessible
and affordable compared to commercial synthetic drugs and are void of most side effects associated
with these commercial synthetic drugs (El-Houri et al., 2015). Amongst such plants is Boerhaavia
diffusa L.
B. diffusa (family: Nyctaginaceae) is a perennial creeping weed with spreading branches whose roots
are tough and tapered (Nayak and Thirunavoukkarasu, 2016). The stem is woody, purplish, hairy
and inspissates at the nodes. Its leaves are fleshy, hairy and green arranged in unequal pairs with
minute pinkish-red flowers. Its leaves, roots and the aerial parts are used in India in the treatment of
kidney disorders, rheumatism, liver complaints and other diseases (Mishra et al., 2014). The leaf
extracts have been reported to contain anti-hyperglycemic activities in various animal models
(Prakash et al., 2015, Sharma et al., 2014). The root extract has also been reported to show no α-
amylase inhibitory activity (Prashanth D et al., 2001) but when it was used in combination with seeds
of Silybum marianum it showed hepatoprotective abilities on animals with induced non-alcoholic
fatty liver disease (Sachin et al., 2013). The extracts from the leaves and roots of this plant have also
been tested on animal models to investigate their anti-hyperglycemic abilities and B. diffusa has also
shown some inhibitory effects on carbohydrate absorption in experimental animals (Kanagavalli et
al., 2015, Malhotra et al., 2014). Previous phytochemical studies on B. diffusa have indicated the
presence of a wide range of phytochemicals such as essential oils, rotenoids, alkaloids, flavonoids,
alkamide, and N-trans-feruloyltyramine, xanthones and phenolic compounds (Wajid et al., 2017,
Olaoluwa et al., 2018, Agrawal et al., 2011, Do et al., 2013).
However, no study in the literature has reported on compounds found in the ethanol and aqueous
extracts of the aerial parts or shown the ability of these compounds to effectively bind key anti-
diabetic (α-glucosidase) and anti-obesogenic enzyme (lipase). This shows that some studies on the
anti-hyperglycemic and anti-lipidemic potentials of the aerial part of this plant and the possible mode
of actions are still lacking. Hence, this study examined the antioxidant potentials of B. diffusa aerial
parts and its effect on carbohydrate and lipid digestion, intestinal glucose absorption and muscle
glucose uptake using several in vitro and ex vivo experimental and computational models.
7.2.3 Results
The data showing the total phenolic content of the extracts as presented in Figure 7.2.1. A
significantly higher (p < 0.05) phenolic content was observed in the ethanol extract compared to the
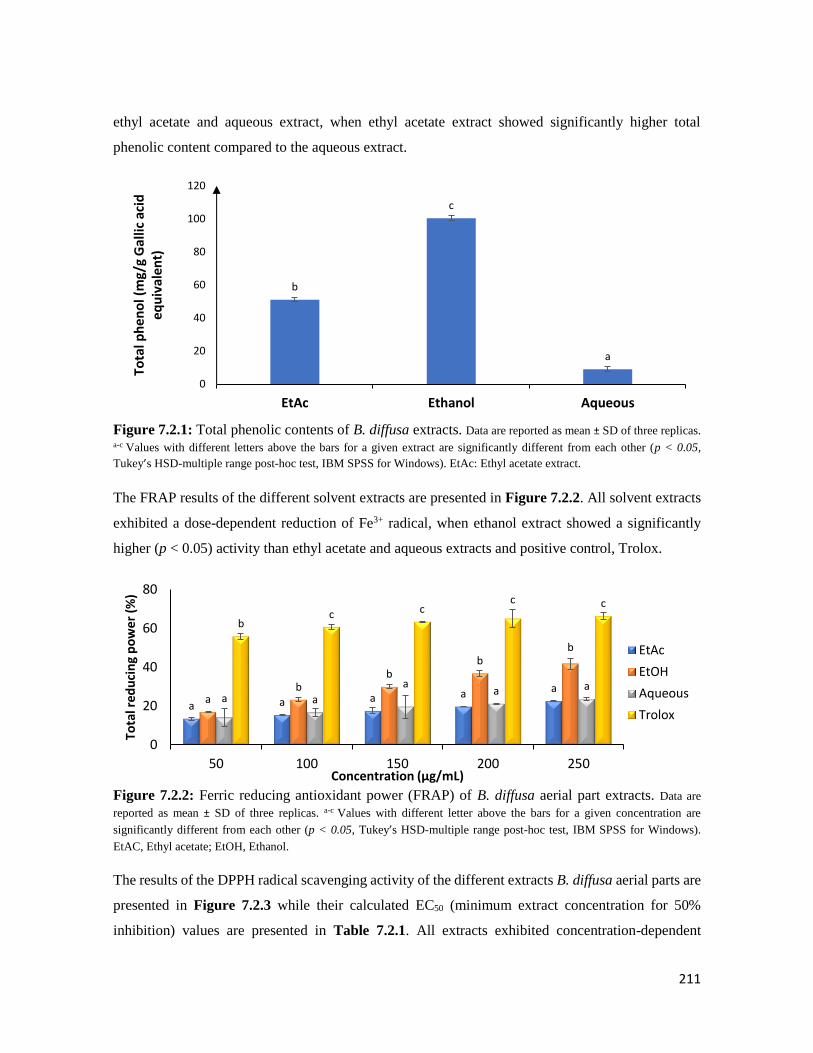
211
ethyl acetate and aqueous extract, when ethyl acetate extract showed significantly higher total
phenolic content compared to the aqueous extract.
Figure 7.2.1: Total phenolic contents of B. diffusa extracts. Data are reported as mean ± SD of three replicas. a-c Values with different letters above the bars for a given extract are significantly different from each other (p < 0.05,
Tukey’s HSD-multiple range post-hoc test, IBM SPSS for Windows). EtAc: Ethyl acetate extract.
The FRAP results of the different solvent extracts are presented in Figure 7.2.2. All solvent extracts
exhibited a dose-dependent reduction of Fe3+ radical, when ethanol extract showed a significantly
higher (p < 0.05) activity than ethyl acetate and aqueous extracts and positive control, Trolox.
Figure 7.2.2: Ferric reducing antioxidant power (FRAP) of B. diffusa aerial part extracts. Data are
reported as mean ± SD of three replicas. a-c Values with different letter above the bars for a given concentration are
significantly different from each other (p < 0.05, Tukey’s HSD-multiple range post-hoc test, IBM SPSS for Windows).
EtAC, Ethyl acetate; EtOH, Ethanol.
The results of the DPPH radical scavenging activity of the different extracts B. diffusa aerial parts are
presented in Figure 7.2.3 while their calculated EC50 (minimum extract concentration for 50%
inhibition) values are presented in Table 7.2.1. All extracts exhibited concentration-dependent
b
c
a
0
20
40
60
80
100
120
EtAc Ethanol Aqueous
Tota
l ph
eno
l (m
g/g
Gal
lic a
cid
eq
uiv
alen
t)
a a a a aa
bb
bb
a a
aa a
bc c
c c
0
20
40
60
80
50 100 150 200 250
Tota
l red
uci
ng
po
wer
(%
)
Concentration (µg/mL)
EtAc
EtOH
Aqueous
Trolox
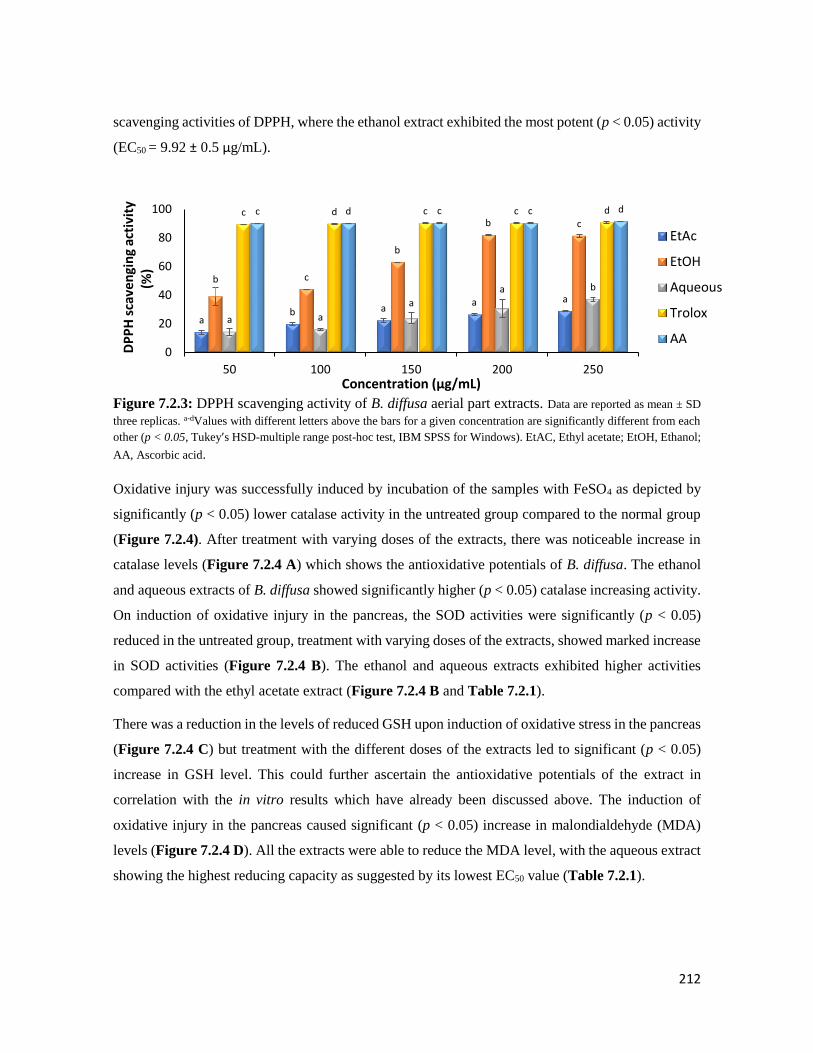
212
scavenging activities of DPPH, where the ethanol extract exhibited the most potent (p < 0.05) activity
(EC50 = 9.92 ± 0.5 μg/mL).
Figure 7.2.3: DPPH scavenging activity of B. diffusa aerial part extracts. Data are reported as mean ± SD
three replicas. a-dValues with different letters above the bars for a given concentration are significantly different from each
other (p < 0.05, Tukey’s HSD-multiple range post-hoc test, IBM SPSS for Windows). EtAC, Ethyl acetate; EtOH, Ethanol;
AA, Ascorbic acid.
Oxidative injury was successfully induced by incubation of the samples with FeSO4 as depicted by
significantly (p < 0.05) lower catalase activity in the untreated group compared to the normal group
(Figure 7.2.4). After treatment with varying doses of the extracts, there was noticeable increase in
catalase levels (Figure 7.2.4 A) which shows the antioxidative potentials of B. diffusa. The ethanol
and aqueous extracts of B. diffusa showed significantly higher (p < 0.05) catalase increasing activity.
On induction of oxidative injury in the pancreas, the SOD activities were significantly (p < 0.05)
reduced in the untreated group, treatment with varying doses of the extracts, showed marked increase
in SOD activities (Figure 7.2.4 B). The ethanol and aqueous extracts exhibited higher activities
compared with the ethyl acetate extract (Figure 7.2.4 B and Table 7.2.1).
There was a reduction in the levels of reduced GSH upon induction of oxidative stress in the pancreas
(Figure 7.2.4 C) but treatment with the different doses of the extracts led to significant (p < 0.05)
increase in GSH level. This could further ascertain the antioxidative potentials of the extract in
correlation with the in vitro results which have already been discussed above. The induction of
oxidative injury in the pancreas caused significant (p < 0.05) increase in malondialdehyde (MDA)
levels (Figure 7.2.4 D). All the extracts were able to reduce the MDA level, with the aqueous extract
showing the highest reducing capacity as suggested by its lowest EC50 value (Table 7.2.1).
ab a
a a
b c
b
b c
a a
a
a b
c d c c dc d c c d
0
20
40
60
80
100
50 100 150 200 250
DP
PH
sca
ven
gin
g ac
tivi
ty
(%)
Concentration (µg/mL)
EtAc
EtOH
Aqueous
Trolox
AA

213
Figure 7.2.4: Effect of extracts of B. diffusa aerial parts on (A) catalase activity, (B) SOD activity,
(C) GSH level and (D) lipid peroxidation in oxidative pancreatic injury. Data are reported as mean ± SD of
three replicas. *Significantly different from untreated sample and #Significantly different from normal sample (p < 0.05,
Tukey’s-HSD-multiple range post-hoc test, IBM SPSS for Windows). Normal = normal tissues, Untreated = tissues
oxidatively injured but not treated. AA; Ascorbic acid
The results of α-glucosidase and lipase enzymes inhibitory effects of B. diffusa extracts are presented
in Figure 7.2.5 A and B respectively and their calculated EC50 values are shown in Table 7.2.1. All
extracts exhibited concentration-dependent inhibition of α-glucosidase (Figure 7.2.5 A) and
pancreatic lipase (Figure 7.2.5 B) inhibitory activities. Both ethanol and aqueous extract showed
significantly (p > 0.05) more potent inhibitory activity compared to ethyl acetate extract, while the
lipase inhibitory activity of the aqueous extract was significantly (p < 0.05) greater than that of the
ethanol extract (Figure 7.2.5 B). There was no virtual difference on α-glucosidase inhibitory
activities between the ethanol and aqueous extracts when compared with the positive control,
acarbose (Figure 7.2.5 A and Table 7.2.1).
#
* * *
*
##
*
*
*
# #
*
*
# #
##
*
0
100
200
300
400
500
600
U/m
g p
rote
in
Concentration (µg/mL)
EtAc EtOH Aqueous AA
#
##
#
**
#
##
*
* *
##
#* *
# # # #
0
20
40
60
80
100
120
140
160
U/m
g P
rote
in
Concentration (µg/mL)
EtAc EtOH Aqueous AA
##
#
##
*
## #
**
*
# ## #
*
##
## #
0
50
100
150
200
250
300
mo
l/L
Concentration (µg/mL)
EtAc EtOH Aqueous AA
#
** *
**
#
##
* *
*
##
*
*
*
* * * * *
0
100
200
300
400
500
600
700M
DA
level (µ
mo
l/L
)
Concentration (µg/mL)
EtAc EtOH Aqueous AA
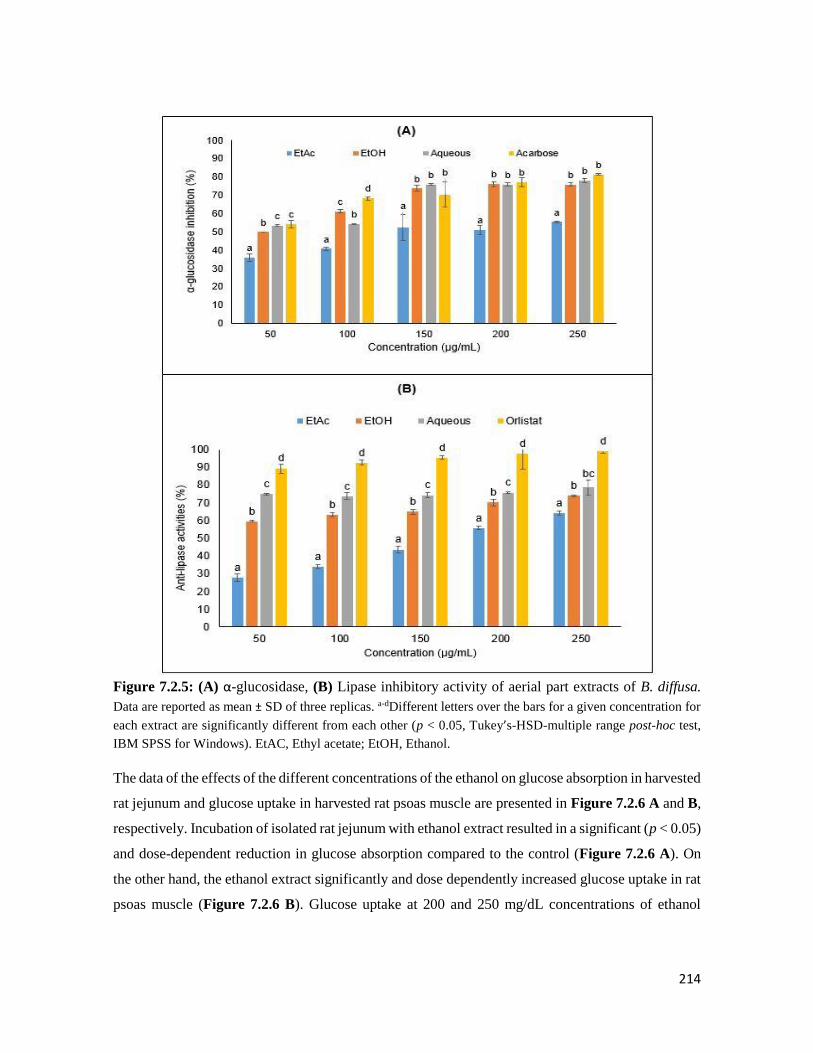
214
Figure 7.2.5: (A) α-glucosidase, (B) Lipase inhibitory activity of aerial part extracts of B. diffusa.
Data are reported as mean ± SD of three replicas. a-dDifferent letters over the bars for a given concentration for
each extract are significantly different from each other (p < 0.05, Tukey’s-HSD-multiple range post-hoc test,
IBM SPSS for Windows). EtAC, Ethyl acetate; EtOH, Ethanol.
The data of the effects of the different concentrations of the ethanol on glucose absorption in harvested
rat jejunum and glucose uptake in harvested rat psoas muscle are presented in Figure 7.2.6 A and B,
respectively. Incubation of isolated rat jejunum with ethanol extract resulted in a significant (p < 0.05)
and dose-dependent reduction in glucose absorption compared to the control (Figure 7.2.6 A). On
the other hand, the ethanol extract significantly and dose dependently increased glucose uptake in rat
psoas muscle (Figure 7.2.6 B). Glucose uptake at 200 and 250 mg/dL concentrations of ethanol

215
extracts was significantly (p < 0.05) higher than that of the control, 50, 100 and 150 mg/dL
concentrations of ethanol extracts and metformin (Figure 7.2.6 B).
Figure 7.2.6: Effect of the ethanol extract of the aerial part of B. diffusa on (A) glucose absorption in
isolated rat jejunum and (B) glucose uptake in rat psoas muscle. Data are reported as mean ± SD of three
replicas. a-cDifferent letters over the bars for a given concentration are significantly different from each other
(p < 0.05, Tukey’s-HSD-multiple range post-hoc test, IBM SPSS for Windows).
The GC–MS result (Figure 7.2.7) showed the presence of 9 and 3 compounds respectively from the
ethanol and aqueous extracts of B. diffusa aerial parts. Their retention time (min), molecular formula,
and mass spectra data (amu) are shown in Table 7.2.2. Figure 7.2.8 A–C shows the binding affinity
of xanthone, 9-(4-methoxyphenyl) xanthene and stigmasterol to complexed α-glucosidase, while
Figure 7.2.8 D–F shows the binding affinities of these compounds with lipase enzyme.
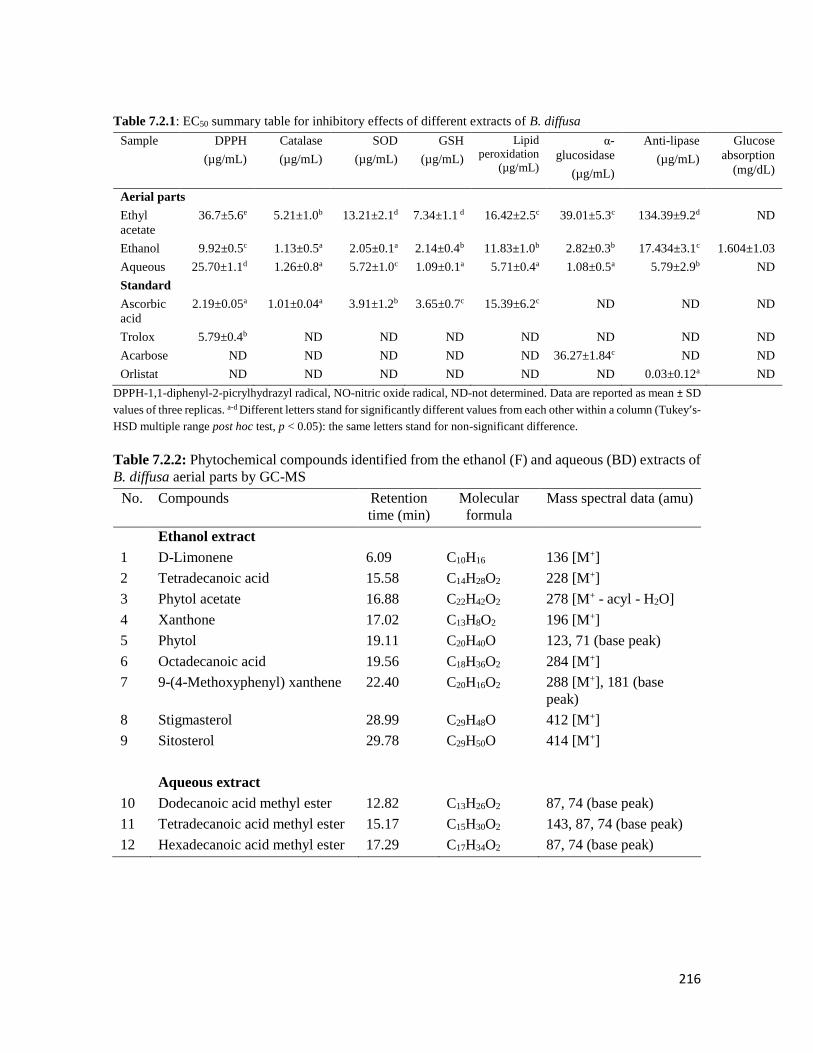
216
Table 7.2.1: EC50 summary table for inhibitory effects of different extracts of B. diffusa
Sample DPPH
(µg/mL)
Catalase
(µg/mL)
SOD
(µg/mL)
GSH
(µg/mL)
Lipid
peroxidation
(µg/mL)
α-
glucosidase
(µg/mL)
Anti-lipase
(µg/mL)
Glucose
absorption
(mg/dL)
Aerial parts
Ethyl
acetate
36.7±5.6e 5.21±1.0b 13.21±2.1d 7.34±1.1 d 16.42±2.5c 39.01±5.3c 134.39±9.2d ND
Ethanol 9.92±0.5c 1.13±0.5a 2.05±0.1a 2.14±0.4b 11.83±1.0b 2.82±0.3b 17.434±3.1c 1.604±1.03
Aqueous 25.70±1.1d 1.26±0.8a 5.72±1.0c 1.09±0.1a 5.71±0.4a 1.08±0.5a 5.79±2.9b ND
Standard
Ascorbic
acid
2.19±0.05a 1.01±0.04a 3.91±1.2b 3.65±0.7c 15.39±6.2c ND ND ND
Trolox 5.79±0.4b ND ND ND ND ND ND ND
Acarbose ND ND ND ND ND 36.27±1.84c ND ND
Orlistat ND ND ND ND ND ND 0.03±0.12a ND
DPPH-1,1-diphenyl-2-picrylhydrazyl radical, NO-nitric oxide radical, ND-not determined. Data are reported as mean ± SD
values of three replicas. a-d Different letters stand for significantly different values from each other within a column (Tukey’s-
HSD multiple range post hoc test, p < 0.05): the same letters stand for non-significant difference.
Table 7.2.2: Phytochemical compounds identified from the ethanol (F) and aqueous (BD) extracts of
B. diffusa aerial parts by GC-MS
No. Compounds Retention
time (min)
Molecular
formula
Mass spectral data (amu)
Ethanol extract
1 D-Limonene 6.09 C10H16 136 [M+]
2 Tetradecanoic acid 15.58 C14H28O2 228 [M+]
3 Phytol acetate 16.88 C22H42O2 278 [M+ - acyl - H2O]
4 Xanthone 17.02 C13H8O2 196 [M+]
5 Phytol 19.11 C20H40O 123, 71 (base peak)
6 Octadecanoic acid 19.56 C18H36O2 284 [M+]
7 9-(4-Methoxyphenyl) xanthene 22.40 C20H16O2 288 [M+], 181 (base
peak)
8 Stigmasterol 28.99 C29H48O 412 [M+]
9 Sitosterol 29.78 C29H50O 414 [M+]
Aqueous extract
10 Dodecanoic acid methyl ester 12.82 C13H26O2 87, 74 (base peak)
11 Tetradecanoic acid methyl ester 15.17 C15H30O2 143, 87, 74 (base peak)
12 Hexadecanoic acid methyl ester 17.29 C17H34O2 87, 74 (base peak)

217
Figure 7.2.7: Structures of the compounds isolated from the ethanol (F) and aqueous (BD) extracts
of B. diffusa aerial parts.
Table 7.2.3: Binding affinities and hydrogen bonding (HB) obtained from molecular docking for α-
glucosidase
No. Compounds
Binding
affinities
(kcal/mol)
HB
Distance
(Å)
Ethanol extract
1 D-Limonene -7.2 6.51
2 Tetradecanoic acid -3.5 7.30
3 Phytol acetate -3.4 7.13
4 Xanthone -9.8 2.35
5 Phytol -8.5 3.12
6 Octadecanoic acid -4.7 6.25
7 9-(4-Methoxyphenyl) xanthene -10.3 4.52
8 Stigmasterol -10.9 2.05
9 Sitosterol -8.8 5.26
Aqueous extract
10 Dodecanoic acid methyl ester -6.7 3.7
11 Tetradecanoic acid methyl ester -8.2 2.1
12 Hexadecanoic acid methyl ester -7.1 3.2

218
Table 7.2.4: Binding affinities and hydrogen bonding (HB) obtained from molecular docking for
anti-lipase activity
No. Compounds
Binding
affinities
(kcal/mol)
HB Distance
(Å)
Ethanol extract
1 D-Limonene -4.5 4.20
2 Tetradecanoic acid -5.4 4.11
3 Phytol acetate -6.2 4.52
4 Xanthone -10.3 3.30
5 Phytol -8.4 3.52
6 Octadecanoic acid -5.7 6.11
7 9-(4-Methoxyphenyl)
xanthene
-12.7 2.33
8 Stigmasterol -11.8 3.14
9 Sitosterol -7.9 4.44
Aqueous extract
10 Dodecanoic acid methyl
ester
-6.7 5.11
11 Tetradecanoic acid methyl
ester
-8.2 4.42
12 Hexadecanoic acid methyl
ester
-7.1 4.73

219
Figure 7.2.8: 3D structure showing the interacting residues (hydrogen bonding and hydrophobic) of
extracts with highest binding affinities around binding pocket of (A) and (D) Xanthone (B) and (E)
9-(4-Methoxyphenyl) xanthene and (C) and (F) Stigmasterol to complexed α-glucosidase and Lipase
respectively
7.2.4 Discussion
The derangement in lipid metabolism in diabetic conditions is one of the major influencing factors in
the complications associated with diabetes especially T2D (Odegaard and Chawla, 2012) and
oxidative stress is a known culprit (Fowler, 2008). Different parts of B. diffusa plants have been
shown to exhibit antioxidant and anti-hyperglycemic potentials both in vivo and in vitro (Prakash et

220
al., 2015, Sharma et al., 2014, Prashanth D et al., 2001) but the possible anti-lipidemic potentials and
mode of action behind their antioxidative and anti-hyperglycemic potentials remains elusive. Our
present study revealed that different solvent extract (particularly, ethanol extract and aqueous extract)
of B. diffusa aerial part exhibited not only antioxidant activities but anti-lipidemic and anti-
hyperglycemic potentials via inhibiting lipid and carbohydrate digestion and abdominal glucose
intake as well as enhancing muscle glucose uptake.
It is well documented that plants rich in polyphenols can boost antioxidant activity of the plasma,
thus limiting the effects of oxidative stress associated diseases such as T2D (Zhang and Tsao, 2016,
Kanner et al., 2017). The presence of polyphenols in all studied extracts of the aerial parts of B.
diffusa (Figure 7.2.1) gives credence to its role in the traditional treatment of various ailments,
particularly the ethanol extract with the highest phenolic content.
Scavenging free radicals has been demonstrated as an ameliorative effect against oxidative stress
(Shon et al., 2007). The DPPH scavenging and total reducing power of the extracts, portray an anti-
oxidative effect. These activities depict a therapeutic potential against oxidative complications
particularly in T2D, where oxidative stress has been linked to the pathogenesis and progression of
T2D (Erukainure et al., 2017a).
Fe2+-induced oxidative stress in the rat pancreatic homogenates led to an increased generation of
superoxide, hydrogen peroxide, and hydroxy radicals. Diverse methods have been used to reduce the
damage caused by oxidative stress and the most potent of all is the use of natural endogenous
antioxidants (Gil et al., 2017). The protective ability of catalase and SOD has been reported, SOD
catalyzes the dismutation of superoxide to hydrogen peroxide and catalase in turn catalyzes the
conversion of the resulting hydrogen peroxide to water and molecular oxygen (Liu and Kokare, 2017).
The reduced catalase and SOD levels seen in the untreated groups (Figure 7.2.4 A and B) occurred
as a result of oxidative injury caused by incubation with FeSO4. The ability of the extracts, especially
the ethanol and aqueous extracts, to increase the activities of these enzymes in the treated groups
portrays their antioxidant abilities.
A reduction in the GSH levels has been reported in cases of pancreatic β-cell dysfunction which could
ultimately lead to the complications of T2D (Tiwari et al., 2013). At the cellular level, GSH is a direct
marker of oxidative stress and has been described as a first line of defence against oxidative damage
(Erukainure et al., 2017a, Gil et al., 2017). The reduced levels of GSH seen in the untreated groups
221
indicates an occurrence of oxidative damage and this was increased upon incubation with the extracts
(Figure 7.2.4 C).
Lipid peroxidation has been well reported to occur due to iron overload and if the residual hydrogen
peroxide is not removed by catalase leads to a build-up of hydroxy radicals through the Fenton
reaction (Andrews, 1999, Rajpathak et al., 2009). These radicals cause lipid peroxidation on the cell
membrane thereby leading to the production of reactive moieties such as acrolein, 4-hydroxynonenal,
4-oxononenal and MDA (Saddala et al., 2013). High MDA levels have been reported in cases of T2D
(Saddala et al., 2013). After incubation with FeSO4, there was an increase in levels of MDA which
portrays an occurrence of lipid peroxidation (Figure 7.2.4 D). Treatment with the extracts was able
to reduce the levels of MDA, an indication of the ability of the extract to reduce the level of lipid
peroxidation in the tissues. This also relates with the ability of the extracts to increase the activity of
catalase and SOD, and GSH levels thereby portraying the anti-peroxidative ability of the plant.
Lipase and α-glucosidase are major enzymes in the breakdown of dietary lipids and carbohydrates.
The effective inhibition of these enzymes can control the postprandial rise in blood glucose as well
as minimize the accumulation of fat as seen in obese-T2D patients (Dalar et al., 2015, Wu et al.,
2013). The inhibitory effect of the extracts on these enzymes (Figure 7.2.5 A and B) demonstrates a
delayed breakdown of carbohydrates and lipids in the intestine, thereby reducing the amount of
glucose and fatty acids in the blood stream (Erukainure et al., 2017a). Thus, demonstrating an anti-
hyperglycemic and antilipolytic potential of B. diffusa aerial parts. This is further portrayed by the
inhibition of glucose absorption in isolated intestinal tissues incubated with B. diffusa ethanol extract
(Figure 7.2.6 A), also reducing the amount of glucose in the blood stream. Dietary glucose resulting
from carbohydrate breakdown is rapidly absorbed in the small intestine, especially in the first quarter
jejunal and duodenal regions (Rider et al., 1967, Riesenfeld et al., 1980). Its rapid absorption results
in elevated blood glucose which could be detrimental, especially in diabetic individuals if not
normalized (Hassan et al., 2010). Thus, the delayed carbohydrate digestion and concomitant
inhibition of intestinal glucose absorption by B. diffusa extracts may validate its folkloric use in the
treatment of diabetes and its complications. Similar effects have been reported for phenolics
compounds (Toma et al., 2014, Inthongkaew et al., 2017), thus these activities may also be attributed
to the total phenolic content of the extracts (Figure 7.2.1).
Skeletal muscle plays an important role in the regulation of glucose homeostasis and carbohydrate
metabolism (Sinacore and Gulve, 1993). They are particularly rich in GLUT-4 which aids glucose
uptake (Satoh, 2014). Defects in muscle glucose uptake have been attributed to the pathogenesis of
222
insulin resistance (Sinacore and Gulve, 1993, Satoh, 2014), and is thus a major contributor to
hyperglycemia. Stimulation of muscle glucose uptake regardless of insulin level has been recognized
as a major therapy for glycemic control in T2D (Pereira et al., 2017). Thus, the increased glucose
uptake in muscles incubated with B. diffusa ethanol extract (Figure 7.2.6 B) further indicates an anti-
hyperglycemic activity of the plant and its potential to modulate hyperglycemia.
The presence of various bioactive compounds in the aerial part of the plant justifies the use of this
plant in the treatment and management of various ailments. Thus, the phytoconstituents analysed by
GC–MS gives a comprehensive presentation of the pharmaceutical and therapeutic potential of the
plant. Previous studies on the leaves and root of the plant showed the presence of diverse
phytochemical s which have been shown to possess anti-hyperglycemic abilities (Agrawal et al.,
2011, Shanmugapriya and Maneemegalai, 2017). The presence of xanthones and their derivatives in
the ethanol extract of the aerial part of B. diffusa has been reported in this study (Figure 7.2.7, Table
7.2.2). Xanthones have been shown to possess hypoglycemic abilities (Taher et al., 2016).
Limonene also seen in the ethanol extract (Table 7.2.3) has been documented to act as an antioxidant
by lowering oxidative stress in streptozotocin-induced diabetic rats (Bacanlı et al., 2017). The ethanol
extract showed the presence of stigmasterol in the GC–MS analysis; interestingly, the role of
stigmasterol in the fight against diseases such as cancer and diabetes has also been reported (Ramu et
al., 2016). Plant sterols and esters have also been reported to possess potent anti-hyperglycemic and
anti-obesogenic abilities (Hallikainen et al., 2011, Gylling et al., 2014). The observed anti-
hyperglycemic and anti-obesogenic abilities of B. diffusa could be as a result of the synergistic effect
rendered by these constituents identified by GC–MS.
Molecular docking studies were performed to gain further insight to the inhibition potentials of
ethanol and aqueous extract. Docking result revealed ethanol and aqueous extracts showed inhibition
potentials with 9-(4 methoxyphenyl) xanthene, xanthone and stigmasterol having highest binding
affinities compared to other compounds. This is also evident in the hydrogen bond interactions
(Tables 7.2.3 and 7.2.4) with amino acid residues. Similar protocol was performed by Bharatham,
Bharatham, Park and Lee (Bharatham et al., 2008). For stigmasterol with the highest binding affinity,
the amino acid residues are: ASN54, ASP57, GLU 58, ARG 84 and GLY 83. Comparing the
inhibitory potential of compounds between α-glucosidase and lipase, Figure 7.2.8 A–C and D–F
revealed that 9-(4 methoxyphenyl) xanthene and stigmasterol had the strongest binding affinities of -
12.7 and 11.8 kcal/mol respectively for lipase. The high binding energy of stigmasterol and 9-(4
223
methoxyphenyl) xanthene is very likely due to the hydroxyl and methoxy groups as well as
hydrophobic interactions (Bharatham et al., 2008). The binding mode analysis of the compounds with
some amino acid residues provides important information of catalytic site which is essential for
proposing the catalytic mechanism.
7.2.5 Conclusions
These results demonstrate the antioxidant and antidiabetic activities of the aerial parts of B. diffusa as
shown by its free radical scavenging, and carbohydrate and lipid digesting enzymes inhibitory
activities. These activities can be attributed to the total phenolic content and identified bioactive
compounds, particularly in the ethanol extract. The ability of the ethanol extract to inhibit small
intestinal glucose absorption as well as stimulate muscle glucose uptake, further portrays the
therapeutic potential of the plant against T2D and its complications.
224
GENERAL DISCUSSION AND CONCLUSIONS
8.1 General discussion
In recent times, increase in mortality, morbidity and amputations in Africa has occurred due to the
rise in diabetes mellitus. Sedentary lifestyle, dietary habits and urbanization have encouraged the
spread of this disease (IDF, 2017). Microvascular and macrovascular complications linked to diabetes
increase mortality in Africa and other parts of the world. A number of synthetic drugs are currently
available for treatment of this disease, but the high cost and unwanted side effects makes them less
desirable to people living with diabetes. In most undeveloped parts of Africa, people rely on
traditional medicine as a means of avoiding the heavy monetary burden due to using expensive drugs.
However, so many locals are more appreciative of traditional medicine since they claim, “it has been
in use since the time of our fore-fathers”. The plants used in this study are plants which are used in
traditional medicine for treatment of diabetes mellitus and they include: Alstonia boonei, Acalypha
wilkesiana, Crassocephalum rubens, Bridelia ferruginea and Boerhaavia diffusa. The claims of most
locals on the efficacy of these plants in treating diabetes led to the need to ascertain and confirm their
hypothesis. Thus, this study was undertaken to give a sound scientific proof for future exploration of
these plants in the pharmaceutical industry either in the crude form or as standard formulations for
treatment of diabetes mellitus and its associated complications. This study was also done to identify
the potent bioactive constituents responsible for anti-diabetic action and most importantly, to
ascertain the level of toxicity of these plants at different doses, thereby enlightening the locals who
still depend on traditional medicine for the treatment of diseases.
To fully perform a detailed screening on these plants, the leaves, stem bark and root barks of A.
boonei, A. wilkesiana and B. ferruginea were used while the aerial parts of C. rubens and B. diffusa
were exploited. The first screening test done using these plant parts was to investigate the in vitro and
ex vivo antioxidant potential of these plants since diabetic complications and etiology abounds due to
actions of oxidative stress (Asmat et al., 2016). The crude extract (within a plant) with the best activity
was selected for further analysis.
Alstonia boonei was the first plant studied in this research. After various in vitro and ex vivo
antioxidant and antidiabetic study on the crude extracts, the ethanol extract of the leaves was chosen
for fractionation (Section 3.2). Four fractions were obtained after fractionation and the butanol
225
fraction in particular showed the best inhibition of key enzymes linked to type 2 diabetes and also
showed potent glucose absorption inhibition in the small intestine together with induction of glucose
uptake in peripheral tissues (Section 3.3). However, results for the in vivo assay showed the low dose
(150 mg/kg bw) as more effective in eliciting glucose lowering and organ protection than the high
dose (300 mg/kg bw) (Section 3.4). This could be due to the reported toxicity of a high dose of this
fraction (Olanlokun and Olorunsogo, 2018). The low dose of the fraction also showed a better
oxidative stress alleviating potential than the higher dose, which further verifies the toxicity of this
fraction at a higher dose. The GC-MS analysis revealed the presence of potent phyto-phenols like 2-
hydroxy-1-(hydroxymethyl) ethyl hexadecanoate, which was predominantly present in the butanol
and aqueous fraction. Interestingly, this compound has been reported to possess antioxidant and
hypocholesterolemic activity (Jegadeeswari et al., 2012; Tyagia and Argawak, 2017). Considering
the results from this study, it is suggested that further screening be done using a low dose of the
fraction to fully verify the efficacy of the plant in alternate therapies for treatment of diabetes.
Acalypha wilkesiana was the second plant to be investigated. The in vitro antioxidant activity of the
extracts from different plant parts of A. wilkesiana was first done coupled with the free radical
scavenging activity in Fe2+-induced oxidative pancreatic injury (Section 4.2). The ethanol extract of
the root bark showed potent antioxidant effect in the ex vivo study. The crude ethanol extract obtained
from the stem bark and root bark also showed promising -glucosidase and -amylase inhibitory
potential (Section 4.3). GC-MS analysis revealed the presence of biologically active plant phenols
such as xanthones and sterols which have been reported to elicit anti-diabetes activity (Ghosh et al.,
2015, Takato et al., 2017).
Crassocephalum rubens the next plant investigated is a traditional leafy vegetable eaten as a salad in
parts of Africa. Only solvent extracts from the aerial parts were investigated, and no fractionation was
done due to the unavailability of the plant in large quantity. In vitro and ex vivo antioxidant and anti-
diabetic activity revealed the aqueous extract as the most potent extract (Section 5.2). No study in the
literature has reported the presence of bioactive constituents in any part of C. rubens, so this study is
the first of its kind to detect the presence of bioactive compounds in the leaves of this plant. LC-MS
analysis of the aqueous extract revealed the presence of phytochemicals like sanguisorbic acid
dilactone (an ellagitannin), 8-methoxy-6,7-methylenedioxycoumarin, 3,4-methylenedioxybenzoic
acid, all of which have potent antioxidant and antidiabetic activity (García-Villalba et al., 2015; Tan
et al., 2017, Tk, 2012, Venugopala et al., 2013). To further verify the antioxidant and antidiabetic
potential, these bioactive constituents were docked with key antidiabetic (-glucosidase and lipase)
226
and antioxidants (superoxide dismutase, catalase and glutathione reductase) using in silico molecular
docking techniques. Interestingly, sanguisorbic acid dilactone showed highest binding energies for
all the enzymes tested, which could provide valuable information towards proposing the catalytic
mechanism of these compounds (Section 5.2). Although LC-MS assay identified some
phytochemicals present, there is need to isolate and characterize a pure compound before we can be
sure of the bioactive constituents. The aqueous extract (since it showed best activity) was subjected
to in vivo analysis using a type 2 diabetic animal model (Section 5.3). Interestingly the extract retained
its anti-diabetic activity in a dose-dependent manner with no toxicity seen; this confirms an earlier
report on the toxicity of C. rubens (Adjatin et al., 2013a). It was also able to ameliorate diabetes-
induced oxidative stress thereby rendering cardiac, renal and hepatoprotective effects in
complications of diabetes (Section 5.4). In general, C. rubens could play a promising role in area of
drug research.
For Bridelia ferruginea, the crude ethanol extract of the leaves and root bark showed the best
antioxidant and anti-diabetic activity (Section 6.2). The ethanol extract of the leaves was
consequently fractionated, while the butanol fraction was discovered to show best results for the in
vitro antioxidant and antidiabetic models (Section 6.3). The fraction also demonstrated potent anti-
diabetic effects and seems to do this via different mechanisms. This might be a result of the synergistic
effects of the bioactive constituents present in the plant. GC-MS analysis of the extracts showed the
presence of 32 compounds most of which were phenols. β-amyrin and -amyrin acetate found in this
plant are known pentacyclic triterpenes found distributed in plants and have been reported to have
diverse biological properties like anti-inflammatory, anti-microbial, cytotoxic, and trypanocidal
activity amongst others (Vázquez et al., 2012). The anti-diabetic properties of these triterpenes have
also been established (Nair et al., 2014; Santos et al., 2012). 4-phenylbenzophenone and lupenone
identified in our study have also been reported to exhibit promising anti-diabetic activity (Lin et al.,
2009; Xu et al., 2014). Interestingly, β-amyrin, 4-phenylbenzophenone and lupenone had the highest
binding energies for -glucosidase, -amylase and lipase enzymes respectively, which justified the
biological properties of the compounds. With the observed anti-diabetic potential of the leaves of this
plant, it can be recommended for further screening for possible usage as an anti-diabetic herbal drug,
which could consequently be made available for public consumption.
Boerhaavia diffusa was the last plant investigated. The aerial part of the plant was subjected to in
vitro, ex vivo and in silico antioxidant and anti-diabetic assays. Both ethanol and aqueous extracts
exhibited remarkable enzyme inhibitory activities, which were significantly higher than ethyl acetate
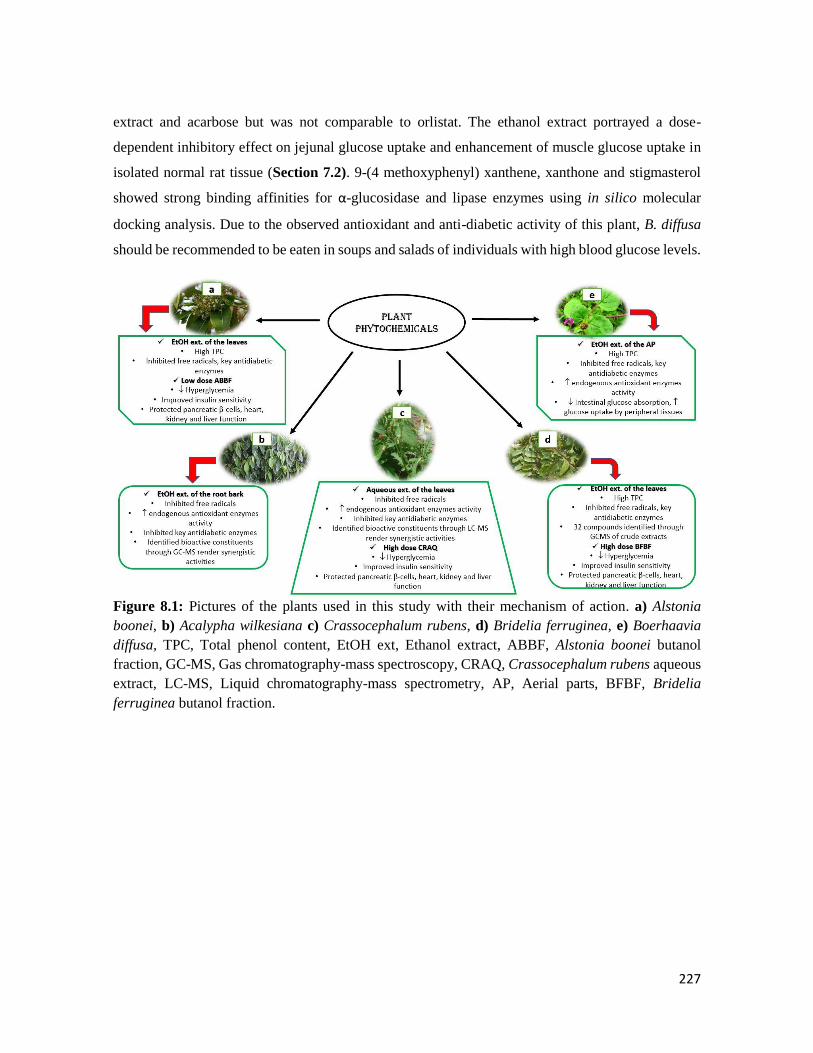
227
extract and acarbose but was not comparable to orlistat. The ethanol extract portrayed a dose-
dependent inhibitory effect on jejunal glucose uptake and enhancement of muscle glucose uptake in
isolated normal rat tissue (Section 7.2). 9-(4 methoxyphenyl) xanthene, xanthone and stigmasterol
showed strong binding affinities for α-glucosidase and lipase enzymes using in silico molecular
docking analysis. Due to the observed antioxidant and anti-diabetic activity of this plant, B. diffusa
should be recommended to be eaten in soups and salads of individuals with high blood glucose levels.
Figure 8.1: Pictures of the plants used in this study with their mechanism of action. a) Alstonia
boonei, b) Acalypha wilkesiana c) Crassocephalum rubens, d) Bridelia ferruginea, e) Boerhaavia
diffusa, TPC, Total phenol content, EtOH ext, Ethanol extract, ABBF, Alstonia boonei butanol
fraction, GC-MS, Gas chromatography-mass spectroscopy, CRAQ, Crassocephalum rubens aqueous
extract, LC-MS, Liquid chromatography-mass spectrometry, AP, Aerial parts, BFBF, Bridelia
ferruginea butanol fraction.

228
Figure 8.2: Schematic diagram showing the possible mechanisms of action of the investigated plants
and their phytochemicals.
8.2 General conclusions
Three out of the five medicinal plants used in this study have exhibited promising anti-diabetic
activity in all the models tested, even similar to the standard drug metformin and sometimes better
than the action of glibenclamide. Except for one plant at a high dose, these plants did not show signs
of toxicity for most of the parameters measured in this investigation. These findings are important for
the relevant government agencies, pharmaceutical industries, scientific community and local people
suffering from diabetes because it might open an avenue for the development of viable and cost
effective anti-diabetic drugs.
8.3 Recommendations
The next step for confirmation of the anti-diabetic activity of these plants should entail human-based
cell culture studies followed by a detailed clinical-trial studies in human subjects with diabetes
mellitus. The identified bioactive compounds should be subjected to a thorough in vivo anti-diabetic
study with the most effective fractions determined in this study. This may eventually lead to
development of novel anti-diabetic drugs. However, toxicological studies in human-based cell lines
as well as clinical trials in humans are warranted to understand their safety and efficacy in humans.
229
REFERENCES
Abubakar IB, Lim S-W, Loh H-S (2018). Synergistic Apoptotic Effects of Tocotrienol Isomers and
Acalypha wilkesiana on A549 and U87MG Cancer Cells. Tropical Life Sciences Research,
29, 229-238.
Achan J, Talisuna AO, Erhart A, Yeka A, Tibenderana JK, Baliraine FN, Rosenthal PJ, D'alessandro
U (2011). Quinine, an old anti-malarial drug in a modern world: role in the treatment of
malaria. Malaria Journal, 10, 1-12.
American Diabetes Association (2010). Diagnosis and classification of diabetes mellitus. Diabetes
Care, 33, S62-S69.
American Diabetes Association (2016). Classification and diagnosis of diabetes. Diabetes Care, 39,
S13-S22.
Adela R, Nethi SK, Bagul PK, Barui AK, Mattapally S, Kuncha M, Patra CR, Reddy PNC, Banerjee
SK (2015). Hyperglycaemia enhances nitric oxide production in diabetes: a study from South
Indian patients. PloS one, 10, e0125270.
Ademiluyi AO, Oboh G (2013). Soybean phenolic-rich extracts inhibit key-enzymes linked to type 2
diabetes (α-amylase and α-glucosidase) and hypertension (angiotensin I converting enzyme)
in vitro. Experimental and Toxicologic Pathology, 65, 305-309.
Adesina S, Idowu O, Ogundaini A, Oladimeji H, Olugbade T, Onawunmi G, Pais M (2000).
Antimicrobial constituents of the leaves of Acalypha wilkesiana and Acalypha hispida.
Phytotherapy Research, 14, 371-374.
Adeva-Andany MM, González-Lucán M, Donapetry-García C, Fernández-Fernández C, Ameneiros-
Rodríguez E (2016). Glycogen metabolism in humans. Biochimica et Biophysica Acta
Clinical, 5, 85-100.
Adewale O, Oloyede O (2012). Hypoglycemic activity of aqueous extract of the bark of Bridelia
ferruginea in normal and alloxan-induced diabetic rats. Prime Research on Biotechnology,
2, 53-56.
Adewale OB, Onasanya A, Anadozie SO, Abu MF, Akintan IA, Ogbole CJ, Olayide II, Afolabi OB,
Jaiyesimi KF, Ajiboye BO (2016). Evaluation of acute and subacute toxicity of aqueous
extract of Crassocephalum rubens leaves in rats. Journal of Ethnopharmacology, 188, 153-
158.
Adjatin A, Dansi A, Badoussi E, Loko Y, Dansi M, Azokpota P, Gbaguidi F, Ahissou H, Akoègninou
A, Akpagana K (2013a). Phytochemical screening and toxicity studies of Crassocephalum
230
rubens (Juss. ex Jacq.) S. Moore and Crassocephalum crepidioides (Benth.) S. Moore
consumed as vegetable in Benin. International Journal of Current Microbiology and Applied
Science, 2, 1-13.
Adjatin A, Dansi A, Badoussi E, Sanoussi A, Dansi M, Azokpota P, Ahissou H, Akouegninou A,
Akpagana K, Sanni A (2013b). Proximate, mineral and vitamin C composition of vegetable
Gbolo [Crassocephalum rubens (Juss. Ex Jacq.) S. Moore and C. crepidioides (Benth.) S.
Moore] in Benin. International Journal of Biological and Chemical Sciences, 7, 319-331.
Adjatin A, Dansi A, Eze C, Assogba P, Dossou-Aminon I, Akpagana K, Akoègninou A, Sanni A
(2012). Ethnobotanical investigation and diversity of Gbolo (Crassocephalum rubens (Juss.
ex Jacq.) S. Moore and Crassocephalum crepidioides (Benth.) S. Moore), a traditional leafy
vegetable under domestication in Benin. Genetic resources and crop evolution, 59, 1867-
1881.
Ado MA, Abas F, Mohammed AS, Ghazali HM (2013). Anti-and pro-lipase activity of selected
medicinal, herbal and aquatic plants, and structure elucidation of an anti-lipase compound.
Molecules, 18, 14651-14669.
Adotey JPK, Adukpo GE, Opoku Boahen Y, Armah FA (2012). A review of the ethnobotany and
pharmacological importance of Alstonia boonei De Wild (Apocynaceae). ISRN
pharmacology, 2012, 1-9.
Afolabi OB, Oloyede OI, Agunbiade SO (2018). Inhibitory potentials of phenolic-rich extracts from
Bridelia ferruginea on two key carbohydrate-metabolizing enzymes and Fe2+-induced
pancreatic oxidative stress. Journal of integrative medicine, 16, 192-198.
Afolayan AJ, Sunmonu TO (2010). In vivo studies on antidiabetic plants used in South African herbal
medicine. Journal of clinical biochemistry and nutrition, 47, 98-106.
Afolayan M, Srivedavyasasri R, Asekun OT, Familoni OB, Ross SA (2018). Chemical and biological
studies on Bridelia ferruginea grown in Nigeria. Natural product research, 1-5.
Agrawal B, Das S, Pandey A (2011). Boerhaavia diffusa Linn.: A Review on its Phytochemical and
Pharmacological Profile. Asian Journal of Applied Sciences, 4, 663-684.
Aguayo-Mazzucato C, Bonner-Weir S (2017). Pancreatic β Cell Regeneration as a Possible Therapy
for Diabetes. Cell metabolism, 168, 73-85.
Ahmadinejad F, Geir Møller S, Hashemzadeh-Chaleshtori M, Bidkhori G, Jami M-S (2017).
Molecular mechanisms behind free radical scavengers function against oxidative stress.
Antioxidants, 6, 1-15.
231
Ahmed KA, Muni S, Ismail IS (2010). Type 2 diabetes and vascular complications: A
pathophysiologic view. Biomedical Research, 21, 147-155.
Ahohuendo B, Sinébou C, Ahoton LE, Etèka AC, Dansi A, Ahanchédé A, Hounhouigan JD, Sanni
A, Foucault BD (2012). Study of the phenology and floral biology of Sesamum radiatum
Schumach. & Thon., a traditional leafy vegetable in domestication in Benin. Acta. Botanica.
Gallica, 159, 335-344.
Aiyegoro OA, Okoh AI (2010). Preliminary phytochemical screening and in vitro antioxidant
activities of the aqueous extract of Helichrysum longifolium DC. BMC Complementary and
Alternative Medicine, 10, 1-8.
Ak T, Gülçin İ (2008). Antioxidant and radical scavenging properties of curcumin. Chemico-
biological interactions, 174, 27-37.
Akinloye D, Osatuyi O, Musibau O, Yusuf A, Adewuyi S (2016). In vitro antioxidant activities,
elemental analysis and some bioactive constituents of Acalypha wilkesiana muell arg and
Acalypha wilkesiana java white leaf extracts. Journal of Chemical Society of Nigeria, 41,
150-157.
Akinloye O, Oshilaja R, Okelanfa O, Akinloye D, Idowu O (2013). Hypoglyceamic activity of
Alstonia boonei stem bark extract in mice. Agriculture and Biology Journal of North
America, 4, 1-5.
Akinmoladun AC, Ibukun E, Afor E, Akinrinlola B, Onibon T, Akinboboye A, Obuotor E, Farombi
E (2007). Chemical constituents and antioxidant activity of Alstonia boonei. African Journal
of Biotechnology, 6, 1197-1201.
Akinnawo OO, God’swill NA, Osilesi O (2017). Aqueous fraction of Alstonia boonei de Wild leaves
suppressed inflammatory responses in carrageenan and formaldehyde induced arthritic rats.
Biomedicine & Pharmacotherapy, 86, 95-101.
Akuodor G, Mbah C, Anyalewechi N, Tc I-UMI, Osunkwo U (2011). Pharmacological profile of
aqueous extract of Bridelia ferruginea stem bark in the relief of pain and fever. Journal of
Medicinal Plants Research, 5, 5366-5369.
Akuodor G, Mbah C, Essien A, Akpan J, Ezeokpo B, Iwuanyanwu T, Osunkwo U (2012). Ulcer-
protective and antidiarrhoeal effects of the aqueous stem bark extract of Bridelia ferruginea
in rodents. Pharmacologia, 3, 591-597.
Al-Goblan AS, Al-Alfi MA, Khan MZ (2014). Mechanism linking diabetes mellitus and obesity.
Diabetes, metabolic syndrome and obesity: targets and therapy, 7, 587-591.
Alade P, Irobi O (1993). Antimicrobial activities of crude leaf extracts of Acalypha wilkesiana.
Journal of Ethnopharmacology, 39, 171-174.
232
Ali Asgar M (2013). Anti-diabetic potential of phenolic compounds: A review. International Journal
of Food Properties, 16, 91-103.
Ali M, Paul S, Tanvir E, Hossen M, Rumpa N-EN, Saha M, Bhoumik NC, Islam A, Hossain M, Alam
N (2017). Antihyperglycemic, antidiabetic, and antioxidant effects of Garcinia pedunculata
in rats. Evidence-Based Complementary and Alternative Medicine, 2017, 1-15.
Alshehri AM (2010). Metabolic syndrome and cardiovascular risk. Journal of Family and Community
Medicine, 17, 73-78.
Altamura S, Muckenthaler MU (2009). Iron toxicity in diseases of aging: Alzheimer's disease,
Parkinson's disease and atherosclerosis. Journal of Alzheimer's Disease, 16, 879-895.
Alvim RO, Cheuhen MR, Machado SR, Sousa AGP, Santos PC (2015). General aspects of muscle
glucose uptake. Anais da Academia Brasileira de Ciências, 87, 351-368.
Amarowicz R (2007). Tannins: the new natural antioxidants? European Journal of Lipid Science and
Technology, 109, 549-551.
Anahita A, Asmah R, Fauziah O (2015). Evaluation of total phenolic content, total antioxidant
activity, and antioxidant vitamin composition of pomegranate seed and juice. General
Medicine: Open Access, 3, 1-4.
Andrews NC (1999). Disorders of iron metabolism. New England Journal of Medicine, 341, 1986-
1995.
Apak RA, OzyüRek M, GüCLü K, CApanogLu E (2016). Antioxidant activity/capacity
measurement. 1. Classification, physicochemical principles, mechanisms, and electron
transfer (ET)-based assays. Journal of agricultural and food chemistry, 64, 997-1027.
Arredondo A, Azar A, Recamán AL (2018). Diabetes, a global public health challenge with a high
epidemiological and economic burden on health systems in Latin America. Global public
health, 13, 780-787.
Artanti N, Tachibana S, Kardono L, Sukiman H (2012). Isolation of alpha-glucosidase inhibitors
produced by an endophytic fungus, Colletotrichum sp. TSC13 from Taxus sumatrana.
Pakistan journal of biological sciences,, 15, 673-679.
Ashcroft FM, Rorsman P (2012). Diabetes mellitus and the β cell: the last ten years. Cell, 148, 1160-
1171.
Asif M (2014). The prevention and control the type-2 diabetes by changing lifestyle and dietary
pattern. Journal of education and health promotion, 3, 1-8.
Aslan M, Thornley‐Brown D, Freeman BA (2000). Reactive species in sickle cell disease. Annals of
the New York Academy of Sciences, 899, 375-391.
233
Asmat U, Abad K, Ismail K (2016). Diabetes mellitus and oxidative stress—a concise review. Saudi
Pharmaceutical Journal, 24, 547-553.
Atkinson MA (2012). The pathogenesis and natural history of type 1 diabetes. Cold Spring Harbor
perspectives in medicine, 2, a007641.
Aust SD, Morehouse LA, Thomas CE (1985). Role of metals in oxygen radical reactions. Journal of
free radicals in biology & medicine, 1, 3-25.
Awodele O, Amagon KI, Agbo J, Prasad MNV (2015). Toxicological evaluation of the aqueous stem
bark extract of Bridelia ferruginea (Euphorbiaceae) in rodents. Interdisciplinary toxicology,
8, 89-98.
Babatunde O (2017). GC-MS analysis of leaf, stem-bark and root extracts of Alstonia boonei. African
Journal of Pharmacy and Pharmacology, 11, 577-581.
Bacanlı M, Anlar HG, Aydın S, Cal T, Arı N, Bucurgat ÜÜ, Başaran AA, Başaran N (2017). d-
limonene ameliorates diabetes and its complications in streptozotocin-induced diabetic rats.
Food and Chemical Toxicology, 110, 434-442.
Bahadoran Z, Mirmiran P, Azizi F (2013). Dietary polyphenols as potential nutraceuticals in
management of diabetes: a review. Journal of Diabetes & Metabolic Disorders, 12, 1-9.
Bahar E, Akter K-M, Lee G-H, Lee H-Y, Rashid H-O, Choi M-K, Bhattarai KR, Hossain MMM, Ara
J, Mazumder K (2017). β-Cell protection and antidiabetic activities of Crassocephalum
crepidioides (Asteraceae) Benth. S. Moore extract against alloxan-induced oxidative stress
via regulation of apoptosis and reactive oxygen species (ROS). BMC complementary and
alternative medicine, 17, 1-12.
Bailey CJ, Day C (2004). Metformin: its botanical background. Practical diabetes, 21, 115-117.
Bajaj S, Khan A (2012). Antioxidants and diabetes. Indian journal of endocrinology and metabolism,
16, 267-271.
Baker MJ, Trevisan J, Bassan P, Bhargava R, Butler HJ, Dorling KM, Fielden PR, Fogarty SW,
Fullwood NJ, Heys KA (2014). Using Fourier transform IR spectroscopy to analyze
biological materials. Nature protocols, 9, 1771-1791.
Bakoma B, Berké B, Eklu-Gadegbeku K, Agbonon A, Aklikokou K, Gbeassor M, Creppy EE, Moore
N (2013). Acute and sub-chronic (28 days) oral toxicity evaluation of hydroethanolic extract
of Bridelia ferruginea Benth root bark in male rodent animals. Food and chemical toxicology,
52, 176-179.
234
Bakoma B, Berké B, Eklu-Gadegbeku K, Agbonon A, Aklikokou K, Gbeassor M, Moore N (2014).
Effect of Bridelia ferruginea Benth (Euphorbiaceae) ethyl acetate and acetone fractions on
insulin resistance in fructose drinking mice. Journal of ethnopharmacology, 153, 896-899.
Bakoma B, Eklu-Gadegbeku K, Agbonon A, Aklikokou K, Bassene E, Gbeassor M (2011).
Preventive effect of Bridelia ferruginea Benth against high-fructose diet induced glucose
intolerance, oxidative stress and hyperlipidemia in male Wistar rats. J Pharmacol Toxicol, 3,
249-257.
Balamurugan R, Duraipandiyan V, Ignacimuthu S (2011). Antidiabetic activity of γ-sitosterol isolated
from Lippia nodiflora L. in streptozotocin induced diabetic rats. European journal of
pharmacology, 667, 410-418.
Bamforth CW, Muller R, Walker M (1993). Oxygen and oxygen radicals in malting and brewing: a
review. journal of the American Society of Brewing Chemists, 51, 79-88.
Barnes R. (2015). Blood Sugar Regulation [Online]. Available:
http://sciencethemlkway.blogspot.com/2015/12/blood-sugar-regulation.html [Accessed 06
November 2018 2018].
Barouch LA, Berkowitz DE, Harrison RW, O’donnell CP, Hare JM (2003). Disruption of leptin
signaling contributes to cardiac hypertrophy independently of body weight in mice.
Circulation, 108, 754-759.
Baynes JW (1991). Role of oxidative stress in development of complications in diabetes. Diabetes,
40, 405-412.
Baynest HW (2015). Classification, pathophysiology, diagnosis and management of diabetes
mellitus. Journal of Diabetes Metabolism, 6, 1-9.
Benzie IF, Strain J (1999). [2] Ferric reducing/antioxidant power assay: Direct measure of total
antioxidant activity of biological fluids and modified version for simultaneous measurement
of total antioxidant power and ascorbic acid concentration. Methods in enzymology. Elsevier,
15-27.
Benzie IF, Strain JJ (1996). The ferric reducing ability of plasma (FRAP) as a measure of “antioxidant
power”: the FRAP assay. Analytical biochemistry, 239, 70-76.
Bhandari MR, Jong-Anurakkun N, Hong G, Kawabata J (2008). α-Glucosidase and α-amylase
inhibitory activities of Nepalese medicinal herb Pakhanbhed (Bergenia ciliata, Haw.). Food
Chemistry, 106, 247-252.

235
Bharatham K, Bharatham N, Park KH, Lee KW (2008). Binding mode analyses and pharmacophore
model development for sulfonamide chalcone derivatives, a new class of α-glucosidase
inhibitors. Journal of Molecular Graphics and Modelling, 26, 1202-1212.
Bhat M, Kothiwale SK, Tirmale AR, Bhargava SY, Joshi BN (2011). Antidiabetic properties of
Azardiracta indica and Bougainvillea spectabilis: in vivo studies in murine diabetes model.
Evidence-Based Complementary and Alternative Medicine, 2011, 1-9.
Bhattacharyya A, Chattopadhyay R, Mitra S, Crowe SE (2014). Oxidative stress: an essential factor
in the pathogenesis of gastrointestinal mucosal diseases. Physiological reviews, 94, 329-354.
Birben E, Sahiner UM, Sackesen C, Erzurum S, Kalayci O (2012). Oxidative stress and antioxidant
defense. World Allergy Organization Journal, 5, 9-19.
Bloodsworth A, O’donnell VB, Freeman BA (2000). Nitric oxide regulation of free radical–and
enzyme-mediated lipid and lipoprotein oxidation. Arteriosclerosis, thrombosis, and vascular
biology, 20, 1707-1715.
Bonadonna RC, Bonora E, Del Prato S, Saccomani MP, Cobelli C, Natali A, Frascerra S, Pecori N,
Ferrannini E, Bier D (1996). Roles of glucose transport and glucose phosphorylation in
muscle insulin resistance of NIDDM. Diabetes, 45, 915-925.
Boora F, Chirisa E, Mukanganyama S (2014). Evaluation of nitrite radical scavenging properties of
selected Zimbabwean plant extracts and their phytoconstituents. Journal of Food Processing,
2014, 1-7.
Bortolon LNM, Triz LDPL, De Souza Faustino B, De Sá LBC, Rocha DRTW, Arbex AK (2016).
Gestational diabetes mellitus: new diagnostic criteria. Open Journal of Endocrine and
Metabolic Diseases, 6, 13-19.
Bouguerra R, Alberti H, Salem LB, Rayana CB, Atti J, Gaigi S, Slama CB, Zouari B, Alberti K
(2007). The global diabetes pandemic: the Tunisian experience. European journal of clinical
nutrition, 61, 160-165.
Brewer GJ (2007). Iron and copper toxicity in diseases of aging, particularly atherosclerosis and
Alzheimer’s disease. Experimental Biology and Medicine, 232, 323-335.
Brunken U. SM, Dressler S., Janssen T., Thiombiano A. & Zizka, G. . (2008). West African plants -
A Photo Guide. [Online]. Forschungsinstitut Senckenberg, Frankfurt/Main, Germany.
Available: www.westafricanplants.senckenberg.de. [Accessed 7th November 2018].
Burkill HM, Dalziel JM (1985). The useful plants of west tropical Africa. Edition 2. Vol. 1: families
AD, Australia, Royal Botanic Gardens

236
Büssing A, Stein G, Herterich-Akinpelu I, Pfüller U (1999). Apoptosis-associated generation of
reactive oxygen intermediates and release of pro-inflammatory cytokines in human
lymphocytes and granulocytes by extracts from the seeds of Acalypha wilkesiana. Journal of
ethnopharmacology, 66, 301-309.
Butler AE, Janson J, Bonner-Weir S, Ritzel R, Rizza RA, Butler PC (2003). β-cell deficit and
increased β-cell apoptosis in humans with type 2 diabetes. Diabetes, 52, 102-110.
Canivell S, Gomis R (2014). Diagnosis and classification of autoimmune diabetes mellitus.
Autoimmunity reviews, 13, 403-407.
Cefalu WT (2009). Inflammation, insulin resistance, and type 2 diabetes: back to the future? Diabetes,
58, 307-308.
Cerf ME (2013). Beta cell dysfunction and insulin resistance. Frontiers in endocrinology, 4, 1-12.
Cernea S (2011). The role of incretin therapy at different stages of diabetes. The review of diabetic
studies: RDS, 8, 323-338.
Chakraborti K, Handa S (1989). Antihepatotoxic activity of Boerhaavia diffusa. Indian drugs, 27,
161-166.
Chance B, Maehly A (1955). [136] Assay of catalases and peroxidases. Methods in enzymology, 2,
764-775.
Chang CL, Lin Y, Bartolome AP, Chen Y-C, Chiu S-C, Yang W-C (2013). Herbal therapies for type
2 diabetes mellitus: chemistry, biology, and potential application of selected plants and
compounds. Evidence-Based Complementary and Alternative Medicine, 2013, 1-33.
Chase HP, Hoops SL, Archer PG, O'brien D (1989). Insulin-dependent Diabetes. Jama, 261, 1155-
1160.
Chaudhury A, Duvoor C, Dendi R, Sena V, Kraleti S, Chada A, Ravilla R, Marco A, Shekhawat NS,
Montales MT (2017). Clinical review of antidiabetic drugs: Implications for type 2 diabetes
mellitus management. Frontiers in endocrinology, 8, 1-12.
Chauhan D, Shrivastava A, Patra S (2014). Diversity of leafy vegetables used by tribal peoples of
Chhattisgarh, India. Int. J. Curr. Microbiol. App. Sci, 3, 611-622.
Chawla A, Chawla R, Jaggi S (2016). Microvasular and macrovascular complications in diabetes
mellitus: distinct or continuum? Indian journal of endocrinology and metabolism, 20, 546-
551.
Chen H-L, Lan X-Z, Wu Y-Y, Ou Y-W, Chen TC, Wu W-T (2017). The antioxidant activity and
nitric oxide production of extracts obtained from the leaves of Chenopodium quinoa Willd.
BioMedicine, 7, 24-28.
237
Cheng Z, Ren J, Li Y, Chang W, Chen Z (2003). Establishment of a quantitative structure–activity
relationship model for evaluating and predicting the protective potentials of phenolic
antioxidants on lipid peroxidation. Journal of pharmaceutical sciences, 92, 475-484.
Chime SA, Ugwuoke E, Onyishi I, Brown S, Onunkwo G (2013). Formulation and evaluation of
Alstonia boonei stem bark powder tablets. Indian journal of pharmaceutical sciences, 75,
226-230.
Chiu C-J, Taylor A (2011). Dietary hyperglycemia, glycemic index and metabolic retinal diseases.
Progress in retinal and eye research, 30, 18-53.
Cho N, Shaw J, Karuranga S, Huang Y, Da Rocha Fernandes J, Ohlrogge A, Malanda B (2018). IDF
Diabetes Atlas: Global estimates of diabetes prevalence for 2017 and projections for 2045.
Diabetes research and clinical practice, 138, 271-281.
Choe E, Min DB (2006). Chemistry and reactions of reactive oxygen species in foods. Critical
Reviews in Food Science and Nutrition, 46, 1-22.
Choi K, Kim Y-B (2010). Molecular mechanism of insulin resistance in obesity and type 2 diabetes.
The Korean journal of internal medicine, 25, 119-129.
Choudhury H, Pandey M, Hua CK, Mun CS, Jing JK, Kong L, Ern LY, Ashraf NA, Kit SW, Yee TS
(2017). An update on natural compounds in the remedy of diabetes mellitus: A systematic
review. Journal of Traditional and Complementary Medicine, 8, 361-376.
Chowdhury P, Soulsby M (2002). Lipid peroxidation in rat brain is increased by simulated
weightlessness and decreased by a soy-protein diet. Annals of Clinical & Laboratory Science,
32, 188-192.
Chude M, Orisakwe O, Afonne O, Gamaniel K, Vongtau O, Obi E (2001). Hypoglycaemic effect of
the aqueous extract of Boerhavia diffusa leaves. Indian Journal of Pharmacology, 33, 215-
216.
Chukwuma CI, Mopuri R, Nagiah S, Chuturgoon AA, Islam MS (2017). Erythritol reduces small
intestinal glucose absorption, increases muscle glucose uptake, improves glucose metabolic
enzymes activities and increases expression of Glut-4 and IRS-1 in type 2 diabetic rats.
European Journal of Nutrition, 57, 2431-2444.
Chung SS, Ho EC, Lam KS, Chung SK (2003). Contribution of polyol pathway to diabetes-induced
oxidative stress. Journal of the American Society of Nephrology, 14, S233-S236.
Cobb J, Dukes I (1998). Recent advances in the development of agents for the treatment of type 2
diabetes. Annual reports in medicinal chemistry, 33, 213-222.
238
Conway BN, Han X, Munro HM, Gross AL, Shu X-O, Hargreaves MK, Zheng W, Powers AC, Blot
WJ (2018). The obesity epidemic and rising diabetes incidence in a low-income racially
diverse southern US cohort. PloS one, 13, e0190993.
Costacou T, Evans RW, Orchard TJ (2011). High-density lipoprotein cholesterol in diabetes: is higher
always better? Journal of clinical lipidology, 5, 387-394.
Craft BD, Kerrihard AL, Amarowicz R, Pegg RB (2012). Phenol‐based antioxidants and the in vitro
methods used for their assessment. Comprehensive Reviews in Food Science and Food
Safety, 11, 148-173.
Crook M (2004). Type 2 diabetes mellitus: a disease of the innate immune system? An update.
Diabetic Medicine, 21, 203-207.
Dal S, Sigrist S (2016). Protective effect of antioxidants consumption on diabetes, hepatic and
vascular complications. Diseases, 3, 1-51.
Dalar A, Uzun Y, Mukemre M, Turker M, Konczak I (2015). Centaurea karduchorum Boiss. from
Eastern Anatolia: Phenolic composition, antioxidant and enzyme inhibitory activities.
Journal of Herbal Medicine, 5, 211-216.
Dansi A, Adjatin A, Adoukonou-Sagbadja H, Faladé V, Yedomonhan H, Odou D, Dossou B (2008).
Traditional leafy vegetables and their use in the Benin Republic. Genetic Resources and Crop
Evolution, 55, 1239-1256.
Dansi A, Vodouhè R, Azokpota P, Yedomonhan H, Assogba P, Adjatin A, Loko Y, Dossou-Aminon
I, Akpagana K (2012). Diversity of the neglected and underutilized crop species of
importance in Benin. The scientific world journal, 2012, 1-19.
De Felice FG, Ferreira ST (2014). Inflammation, defective insulin signaling, and mitochondrial
dysfunction as common molecular denominators connecting type 2 diabetes to Alzheimer
disease. Diabetes, 63, 2262-2272.
De Luca V, Salim V, Atsumi SM, Yu F (2012). Mining the biodiversity of plants: a revolution in the
making. Science, 336, 1658-1661.
Defronzo RA (2011). Bromocriptine: a sympatholytic, D2-dopamine agonist for the treatment of type
2 diabetes. Diabetes Care, 34, 789-794.
Defronzo RA (2015). Pathogenesis of type 2 diabetes mellitus. International Textbook of Diabetes
Mellitus. 4th ed. Chichester (UK): Wiley Blackwell, 371-400.
Defronzo RA, Tripathy D (2009). Skeletal muscle insulin resistance is the primary defect in type 2
diabetes. Diabetes care, 32, S157-S163.
239
Derubertis FR, Craven PA (1994). Activation of protein kinase C in glomerular cells in diabetes:
mechanisms and potential links to the pathogenesis of diabetic glomerulopathy. Diabetes, 43,
1-8.
Devendra D, Liu E, Eisenbarth GS (2004). Type 1 diabetes: recent developments. BMJ: British
Medical Journal, 328, 750-754.
Dewanjee S, Maiti A, Sahu R, Dua TK, Mandal V (2011). Effective control of type 2 diabetes through
antioxidant defense by edible fruits of Diospyros peregrina. Evidence-Based Complementary
and Alternative Medicine, 2011, 1-7.
Dhulasavant V, Shinde S, Pawar M, Naikwade N (2010). Antihyperlipidemic activity of
Cinnamomum tamala Nees. on high cholesterol diet induced hyperlipidemia. Int J Pharm
Tech Res, 2, 2517-2521.
Diplock AT (1997). Will the ‘good fairies’ please prove to us that vitamin E lessens human
degenerative disease? Free radical research, 27, 511-532.
Do TML, Truong AV, Vo TN, Pinnock TG, Pratt LM, Guillaume D, Nguyen KPP (2013). New
derivatives from the aerial parts of Boerhaavia diffusa L.(Nyctaginaceae). Phytochemistry
Letters, 6, 544-551.
Du X-L, Edelstein D, Dimmeler S, Brownlee M (2001). Hyperglycemia inhibits endothelial nitric
oxide synthase (enos) acitivity by altering post-translational modification at the Akt site
Diabetes, 108, 1341-1348.
Du X-L, Edelstein D, Rossetti L, Fantus IG, Goldberg H, Ziyadeh F, Wu J, Brownlee M (2000).
Hyperglycemia-induced mitochondrial superoxide overproduction activates the hexosamine
pathway and induces plasminogen activator inhibitor-1 expression by increasing Sp1
glycosylation. Proceedings of the National Academy of Sciences, 97, 12222-12226.
Duraipandiyan V, Ayyanar M, Ignacimuthu S (2006). Antimicrobial activity of some ethnomedicinal
plants used by Paliyar tribe from Tamil Nadu, India. BMC complementary and alternative
medicine, 6, 1-7.
Eddouks M, Chattopadhyay D, De Feo V, Cho WC (2012). Medicinal plants in the prevention and
treatment of chronic diseases. Evidence-Based Complementary and Alternative Medicine,
2012, 1-3.
Edelman SV, Polonsky WH (2017). Type 2 diabetes in the real world: the elusive nature of glycemic
control. Diabetes care, 40, 1425-1432.
240
Egloff M-P, Marguet F, Buono G, Verger R, Cambillau C, Van Tilbeurgh H (1995). The 2.46. ANG.
Resolution structure of the pancreatic lipase-colipase complex inhibited by a C11 alkyl
phosphonate. Biochemistry, 34, 2751-2762.
Eid HM, Haddad PS (2014). Mechanisms of action of indigenous antidiabetic plants from the Boreal
Forest of Northeastern Canada. Advances in Endocrinology, 2014, 1-11.
Einarson TR, Acs A, Ludwig C, Panton UH (2018). Prevalence of cardiovascular disease in type 2
diabetes: a systematic literature review of scientific evidence from across the world in 2007–
2017. Cardiovascular diabetology, 17, 1-19.
El-Houri RB, Mortier J, Murgueitio MS, Wolber G, Christensen LP (2015). Identification of PPARγ
agonists from natural sources using different in silico approaches. Planta medica, 81, 488-
494.
El-Kamali HH (2009). Medicinal plants in east and central Africa: challenges and constraints.
Ethnobotanical Leaflets, 13, 364-369.
Eleazu CO, Eleazu KC, Chukwuma S, Essien UN (2013). Review of the mechanism of cell death
resulting from streptozotocin challenge in experimental animals, its practical use and
potential risk to humans. Journal of Diabetes & Metabolic Disorders, 12, 1-7.
Ellman GL (1959). Tissue sulfhydryl groups. Archives of biochemistry and biophysics, 82, 70-77.
Enechi O, Oluka HI, Ugwu PO (2014). Acute toxicity, lipid peroxidation and ameliorative properties
of Alstonia boonei ethanol leaf extract on the kidney markers of alloxan induced diabetic rats.
African Journal of Biotechnology, 13, 678-682.
Erukainure OL, Mopuri R, Oyebode OA, Koorbanally NA, Islam MS (2017a). Dacryodes edulis
enhances antioxidant activities, suppresses DNA fragmentation in oxidative pancreatic and
hepatic injuries; and inhibits carbohydrate digestive enzymes linked to type 2 diabetes.
Biomedicine & Pharmacotherapy, 96, 37-47.
Erukainure OL, Oyebode OA, Sokhela MK, Koorbanally NA, Islam MS (2017b). Caffeine–rich
infusion from Cola nitida (kola nut) inhibits major carbohydrate catabolic enzymes; abates
redox imbalance; and modulates oxidative dysregulated metabolic pathways and metabolites
in Fe 2+-induced hepatic toxicity. Biomedicine & Pharmacotherapy, 96, 1065-1074.
Espineli DL, Agoo EMG, Del Fierro RS, Shen C-C, Ragasa CY (2014). Cytotoxic and antimicrobial
compounds from Cinnamomum cebuense Kosterm.(Lauraceae). Pharmaceutical Chemistry
Journal, 48, 598-602.
241
Espinosa RR, Inchingolo R, Alencar SM, Rodriguez-Estrada MT, Castro IA (2015). Antioxidant
activity of phenolic compounds added to a functional emulsion containing omega-3 fatty
acids and plant sterol esters. Food chemistry, 182, 95-104.
Eze E, Mohammed A, Musa K, Tanko Y, Isa A (2012). Effect of ethanolic leaf extract of"
Mucunapruriens"(fabaceae) on lipid profile in alloxan-induced diabetic wistar rats. British
Journal of Pharmacology and Toxicology, 3, 102-109.
Ezeani C, Ezenyi I, Okoye T, Okoli C (2017). Ocimum basilicum extract exhibits antidiabetic effects
via inhibition of hepatic glucose mobilization and carbohydrate metabolizing enzymes.
Journal of intercultural ethnopharmacology, 6, 22-28.
Farag M, Ahmed WJ, Foud I, Mohammed MS (2016). The Role of Medicinal Plants in the Treatment
of Type-2 Diabetes. Advanced Journal of Pharmacie and Life science Research, 2, 1-8.
Farese RV, Sajan MP, Standaert ML (2005). Insulin-sensitive protein kinases (atypical protein kinase
C and protein kinase B/Akt): actions and defects in obesity and type II diabetes. Experimental
biology and medicine, 230, 593-605.
Farook SM, Atlee WC, Karimulla S, Davey MS (2011). Assessment of antidiabetic potential of
Caesalpinia digyna Rottler root extract in streptozotocin induced diabetic rats. International
Journal of Pharmaceutical Sciences and Research, 2, 675-684.
Farzaei F, Morovati MR, Farjadmand F, Farzaei MH (2017). A mechanistic review on medicinal
plants used for diabetes mellitus in traditional Persian medicine. Journal of evidence-based
complementary & alternative medicine, 22, 944-955.
Folli F, Corradi D, Fanti P, Davalli A, Paez A, Giaccari A, Perego C, Muscogiuri G (2011). The role
of oxidative stress in the pathogenesis of type 2 diabetes mellitus micro-and macrovascular
complications: avenues for a mechanistic-based therapeutic approach. Current diabetes
reviews, 7, 313-324.
Fonseca VA (2009). Defining and characterizing the progression of type 2 diabetes. Diabetes care,
32, S151-S156.
Forbes JM, Cooper ME (2013). Mechanisms of diabetic complications. Physiological reviews, 93,
137-188.
Ford ES (2005). Risks for all-cause mortality, cardiovascular disease, and diabetes associated with
the metabolic syndrome: a summary of the evidence. Diabetes care, 28, 1769-1778.
Forouhi NG, Wareham NJ (2010). Epidemiology of diabetes. Medicine, 38, 602-606.
242
Fotie J, Bohle DS (2006). Pharmacological and biological activities of xanthones. Anti-Infective
Agents in Medicinal Chemistry (Formerly Current Medicinal Chemistry-Anti-Infective
Agents), 5, 15-31.
Fowler MJ (2008). Microvascular and macrovascular complications of diabetes. Clinical diabetes,
26, 77-82.
Francisqueti FV, Chiaverini LCT, Santos KCD, Minatel IO, Ronchi CB, Ferron AJT, Ferreira ALA,
Corrêa CR (2017). The role of oxidative stress on the pathophysiology of metabolic
syndrome. Revista da Associação Médica Brasileira, 63, 85-91.
Fu Z, R Gilbert E, Liu D (2013). Regulation of insulin synthesis and secretion and pancreatic Beta-
cell dysfunction in diabetes. Current diabetes reviews, 9, 25-53.
Fuchsberger C, Flannick J, Teslovich TM, Mahajan A, Agarwala V, Gaulton KJ, Ma C, Fontanillas
P, Moutsianas L, Mccarthy DJ (2016). The genetic architecture of type 2 diabetes. Nature,
536, 41-47.
Fukai T, Ushio-Fukai M (2011). Superoxide dismutases: role in redox signaling, vascular function,
and diseases. Antioxidants & redox signaling, 15, 1583-1606.
Furtado LM, Somwar R, Sweeney G, Niu W, Klip A (2002). Activation of the glucose transporter
GLUT4 by insulin. Biochemistry and Cell Biology, 80, 569-578.
Gach K, Długosz A, Janecka A (2015). The role of oxidative stress in anticancer activity of
sesquiterpene lactones. Naunyn-Schmiedeberg's archives of pharmacology, 388, 477-486.
Gaikwad BS, Krishna Mohan G, Sandhya Rani M (2014). Phytochemicals for diabetes management.
Pharmaceutical Crops, 5, 11-28.
García-Villalba R, Espín JC, Aaby K, Alasalvar C, Heinonen M, Jacobs G, Voorspoels S, KoivumaKi
T, Kroon PA, Pelvan E (2015). Validated method for the characterization and quantification
of extractable and nonextractable ellagitannins after acid hydrolysis in pomegranate fruits,
juices, and extracts. Journal of agricultural and food chemistry, 63, 6555-6566.
Gargari BP, Aghamohammadi V, Aliasgharzadeh A (2011). Effect of folic acid supplementation on
biochemical indices in overweight and obese men with type 2 diabetes. Diabetes research
and clinical practice, 94, 33-38.
Garhwal S (2010). Medicinal plants as a source of antioxidants. Research Journal of Phytochemistry,
4, 213-224.
Garvey WT, Huecksteadt TP, Matthaei S, Olefsky JM (1988). Role of glucose transporters in the
cellular insulin resistance of type II non-insulin-dependent diabetes mellitus. The Journal of
clinical investigation, 81, 1528-1536.
243
Geijselaers SL, Sep SJ, Claessens D, Schram MT, Van Boxtel MP, Henry RM, Verhey FR, Kroon
AA, Dagnelie PC, Schalkwijk CG (2017). The Role of hyperglycemia, insulin resistance, and
blood pressure in diabetes-associated differences in cognitive performance—The Maastricht
Study. Diabetes care, 40, 1537-1547.
Geraldes P, Hiraoka-Yamamoto J, Matsumoto M, Clermont A, Leitges M, Marette A, Aiello LP,
Kern TS, King GL (2009). Activation of PKC-δ and SHP-1 by hyperglycemia causes
vascular cell apoptosis and diabetic retinopathy. Nature medicine, 15, 1298-1306.
Ghadyale V, Takalikar S, Haldavnekar V, Arvindekar A (2012). Effective control of postprandial
glucose level through inhibition of intestinal alpha glucosidase by Cymbopogon martinii
(Roxb.). Evidence-Based Complementary and Alternative Medicine, 2012, 1-6.
Gheith O, Farouk N, Nampoory N, Halim MA, Al-Otaibi T (2016). Diabetic kidney disease: world
wide difference of prevalence and risk factors. Journal of nephropharmacology, 5, 49-56.
Ghosh G, Panda P, Rath M, Pal A, Sharma T, Das D (2015). GC-MS analysis of bioactive compounds
in the methanol extract of Clerodendrum viscosum leaves. Pharmacognosy research, 7, 110-
113.
Ghosh S, Suryawanshi S (2001). Effect of Vinca rosea extracts in treatment of alloxan diabetes in
male albino rats. Indian Journal of Experimental Biology, 39, 748-759.
Giacco F, Brownlee M (2010). Oxidative stress and diabetic complications. Circulation research,
107, 1058-1070.
Gil D, Rodriguez J, Ward B, Vertegel A, Ivanov V, Reukov V (2017). Antioxidant activity of SOD
and catalase conjugated with nanocrystalline ceria. Bioengineering, 4, 1-9.
Gil MI, Tomás-Barberán FA, Hess-Pierce B, Kader AA (2002). Antioxidant capacities, phenolic
compounds, carotenoids, and vitamin C contents of nectarine, peach, and plum cultivars from
California. Journal of Agricultural and Food Chemistry, 50, 4976-4982.
Gilbert MP, Pratley RE (2015). The impact of diabetes and diabetes medications on bone health.
Endocrine reviews, 36, 194-213.
Githens S (1991). Glutathione metabolism in the pancreas compared with that in the liver, kidney,
and small intestine. International Journal of Gastrointestinal Cancer, 8, 97-109.
Godoy-Matos AF (2014). The role of glucagon on type 2 diabetes at a glance. Diabetology &
metabolic syndrome, 6, 1-5.
Goldin A, Beckman JA, Schmidt AM, Creager MA (2006). Advanced glycation end products:
sparking the development of diabetic vascular injury. Circulation, 114, 597-605.

244
Gomes MDB (2013). Impact of diabetes on cardiovascular disease: an update. International journal
of hypertension, 2013, 1-15.
Gonzalez-Burgos E, Gomez-Serranillos M (2012). Terpene compounds in nature: a review of their
potential antioxidant activity. Current medicinal chemistry, 19, 5319-5341.
González RG, Barnett P, Aguayo J, Cheng H-M, Chylack L (1984). Direct measurement of polyol
pathway activity in the ocular lens. Diabetes, 33, 196-199.
Group UPDS (1998). Effect of intensive blood-glucose control with metformin on complications in
overweight patients with type 2 diabetes (UKPDS 34). The Lancet, 352, 854-865.
Guo S (2014). Insulin signaling, resistance, and metabolic syndrome: insights from mouse models
into disease mechanisms. Journal of Endocrinology, 220, T1-T23.
Gupta M, Mazumder U, Kumar RS, Gomathi P, Rajeshwar Y, Kakoti B, Selven VT (2005). Anti-
inflammatory, analgesic and antipyretic effects of methanol extract from Bauhinia racemosa
stem bark in animal models. Journal of ethnopharmacology, 98, 267-273.
Gupta R, Sharma AK, Dobhal M, Sharma M, Gupta R (2011). Antidiabetic and antioxidant potential
of β‐sitosterol in streptozotocin‐induced experimental hyperglycemia. Journal of diabetes, 3,
29-37.
Gylling H, Plat J, Turley S, Ginsberg HN, Ellegård L, Jessup W, Jones PJ, Lütjohann D, Maerz W,
Masana L (2014). Plant sterols and plant stanols in the management of dyslipidaemia and
prevention of cardiovascular disease. Atherosclerosis, 232, 346-360.
Hadwan MH, Abed HN (2016). Data supporting the spectrophotometric method for the estimation of
catalase activity. Data in brief, 6, 194-199.
Halban PA, Polonsky KS, Bowden DW, Hawkins MA, Ling C, Mather KJ, Powers AC, Rhodes CJ,
Sussel L, Weir GC (2014). β-cell failure in type 2 diabetes: postulated mechanisms and
prospects for prevention and treatment. The Journal of Clinical Endocrinology &
Metabolism, 99, 1983-1992.
Hallikainen M, Kurl S, Laakso M, Miettinen TA, Gylling H (2011). Plant stanol esters lower LDL
cholesterol level in statin-treated subjects with type 1 diabetes by interfering the absorption
and synthesis of cholesterol. Atherosclerosis, 217, 473-478.
Halliwell B, Gutteridge JM (1990). [1] Role of free radicals and catalytic metal ions in human disease:
an overview. Methods in enzymology. Elsevier, 1-85.
Hamzah R, Jigam A, Makun H, Egwim E (2013). Antioxidant properties of selected African
vegetables, fruits and mushrooms: a review. Licensee in Tech. Mycotoxin and Food Safety in
Developing Countries, 203-249.

245
Hardy OT, Czech MP, Corvera S (2012). What causes the insulin resistance underlying obesity?
Current opinion in endocrinology, diabetes, and obesity, 19, 81-87.
Harley E, Levens N (2003). Protein tyrosine phosphatase 1B inhibitors for the treatment of type 2
diabetes and obesity: recent advances. Current opinion in investigational drugs (London,
England: 2000), 4, 1179-1189.
Hassan Z, Yam MF, Ahmad M, Yusof APM (2010). Antidiabetic properties and mechanism of action
of Gynura procumbens water extract in streptozotocin-induced diabetic rats. Molecules, 15,
9008-9023.
Heravi MM, Daneshmehr S, Morsali A (2015). Effect of Medicinal Plants on Free Radical
Scavenging: Herb-Herb Interactions. Oriental Journal of Chemistry, 31, 557-559.
Hinneburg I, Dorman HD, Hiltunen R (2006). Antioxidant activities of extracts from selected culinary
herbs and spices. Food chemistry, 97, 122-129.
Hossain MA, Shah MD (2015). A study on the total phenols content and antioxidant activity of
essential oil and different solvent extracts of endemic plant Merremia borneensis. Arabian
Journal of Chemistry, 8, 66-71.
IDF (2015). International Diabetes Federation: Diabetes Atlas. [Online]. Brussels: International
Diabetes Federation. Available: http://www.diabetesatlas.org [Accessed 4 April 2017].
IDF (2017). International Diabetes Federation Atlas. International Diabetes Federation Brussels,
Belgium, 8th Edition.
Ighodaro O, Akinloye O (2017). First line defence antioxidants-superoxide dismutase (SOD), catalase
(CAT) and glutathione peroxidase (GPX): Their fundamental role in the entire antioxidant
defence grid. Alexandria Journal of Medicine. In press.
Igwe K, Madubuike A, Chika Ikenga AF (2016). Studies on the medicinal plant Acalypha wilkesiana
ethanol extract phytocomponents by GCMS analysis. Global Journal of Science Frontier
Research: Agriculture and Veterinary, 16, 49-55.
Ii S, Ohta M, Kudo E, Yamaoka T, Tachikawa T, Moritani M, Itakura M, Yoshimoto K (2004). Redox
state-dependent and sorbitol accumulation-independent diabetic albuminuria in mice with
transgene-derived human aldose reductase and sorbitol dehydrogenase deficiency.
Diabetologia, 47, 541-548.
Ikewuchi C, Ikewuchi C, Onyeike E, Uwakwe A (2010). Nutritional potential of the leaves of
Acalypha wilkesiana ‘Godseffiana’Muell Arg. Journal of Applied Sciences and
Environmental Management, 14, 21-24.
246
Ikewuchi JC (2013). Moderation of hematological and plasma biochemical indices of sub-chronic
salt-loaded rats, by an aqueous extract of the leaves of Acalypha wilkesiana
‘Godseffiana’Muell Arg (Euphorbiaceae). Asian Pacific journal of tropical medicine, 6, 37-
42.
Ikewuchi JC, Onyeike EN, Uwakwe AA, Ikewuchi CC (2011). Effect of aqueous extract of the leaves
of Acalypha wilkesiana ‘Godseffiana’Muell Arg (Euphorbiaceae) on the hematology, plasma
biochemistry and ocular indices of oxidative stress in alloxan induced diabetic rats. Journal
of ethnopharmacology, 137, 1415-1424.
Ileke K (2014). Cheese wood, Alstonia boonei De Wild a botanical entomocides for the management
of maize weevil, Sitophilus zeamais (Motschulsky)[Coleoptera: Curculionidae]. Octa
Journal of Biosciences, 2, 64-68.
Imam MU, Zhang S, Ma J, Wang H, Wang F (2017). Antioxidants mediate both iron homeostasis
and oxidative stress. Nutrients, 9, 1-19.
Indiamart. (2009). Boerhavia Diffusa [Online]. Gujarat, India. Available:
https://www.indiamart.com/proddetail/boerhavia-diffusa-6569031773.html [Accessed 9
November 2018].
Iniaghe LO, Okpo SO, Olung JE, Eguae AA (2012). Analgesic Effect of Methanol Leaf Extract of
Alstonia Boonei De Wild (Apocynaceae). Tropical Journal of Pharmaceutical Research, 11,
793-798.
Inthongkaew P, Chatsumpun N, Supasuteekul C, Kitisripanya T, Putalun W, Likhitwitayawuid K,
Sritularak B (2017). α-Glucosidase and pancreatic lipase inhibitory activities and glucose
uptake stimulatory effect of phenolic compounds from Dendrobium formosum. Revista
Brasileira de Farmacognosia, 27, 480-487.
Inzucchi SE, Bergenstal RM, Buse JB, Diamant M, Ferrannini E, Nauck M, Peters AL, Tsapas A,
Wender R, Matthews DR (2015). Management of hyperglycemia in type 2 diabetes, 2015: a
patient-centered approach: update to a position statement of the American Diabetes
Association and the European Association for the Study of Diabetes. Diabetes care, 38, 140-
149.
Islam MS (2011). Effects of the aqueous extract of white tea (Camellia sinensis) in a streptozotocin-
induced diabetes model of rats. Phytomedicine, 19, 25-31.
Islam MS, Choi H (2008). Dietary red chilli (Capsicum frutescens L.) is insulinotropic rather than
hypoglycemic in type 2 diabetes model of rats. Phytotherapy Research, 22, 1025-1029.
247
Iwalewa EO, Adewunmi C, Omisore N, Adebanji O, Azike C, Adigun A, Adesina O, Olowoyo O
(2005). Pro-and antioxidant effects and cytoprotective potentials of nine edible vegetables in
southwest Nigeria. Journal of medicinal food, 8, 539-544.
Jadid N, Hidayati D, Hartanti SR, Arraniry BA, Rachman RY, Wikanta W (Year) Published.
Antioxidant activities of different solvent extracts of Piper retrofractum Vahl. using DPPH
assay. AIP Conference Proceedings, 2017. AIP Publishing, 020019.
Jaiswal M, Divers J, Dabelea D, Isom S, Bell RA, Martin CL, Pettitt DJ, Saydah S, Pihoker C,
Standiford DA (2017). Prevalence of and risk factors for diabetic peripheral neuropathy in
youth with type 1 and type 2 diabetes: search for Diabetes in Youth Study. Diabetes care, 40,
1226-1232.
Jalal DI, Maahs DM, Hovind P, Nakagawa T (2011). Uric acid as a mediator of diabetic nephropathy.
Seminars in nephrology, 31, 459-465.
Jegadeeswari P, Nishanthini A, Muthukumarasamy S, Mohan V (2012). GC-MS analysis of bioactive
components of Aristolochia krysagathra (Aristolochiaceae). Journal of current chemical and
pharmaceutical sciences, 2, 226-232.
Jerry R, Chisholm D (2004). Thiazolidinediones-mechanisms of action. Aust Prescr, 27, 67-70.
Jhun BH, Rampal AL, Liu H, Lachaal M, Jung C (1992). Effects of insulin on steady state kinetics
of GLUT4 subcellular distribution in rat adipocytes. Evidence of constitutive GLUT4
recycling. Journal of Biological Chemistry, 267, 17710-17715.
Kahn BB, Flier JS (2000). Obesity and insulin resistance. The Journal of clinical investigation, 106,
473-481.
Kahn SE, Cooper ME, Del Prato S (2014). Pathophysiology and treatment of type 2 diabetes:
perspectives on the past, present, and future. The Lancet, 383, 1068-1083.
Kahn SE, Hull RL, Utzschneider KM (2006). Mechanisms linking obesity to insulin resistance and
type 2 diabetes. Nature, 444, 840-846.
Kakkar P, Das B, Viswanathan P (1984). A modified spectrophotometric assay of superoxide
dismutase. Indian Journal of Biochemistry and Biophysics, 21, 130-132.
Kalita D, Holm DG, Labarbera DV, Petrash JM, Jayanty SS (2018). Inhibition of α-glucosidase, α-
amylase, and aldose reductase by potato polyphenolic compounds. PloS one, 13, e0191025.
Kalkan IH, Suher M (2013). The relationship between the level of glutathione, impairment of glucose
metabolism and complications of diabetes mellitus. Pakistan journal of medical sciences, 29,
938-942.
248
Kalofoutis C, Piperi C, Kalofoutis A, Harris F, Phoenix D, Singh J (2007). Type II diabetes mellitus
and cardiovascular risk factors: Current therapeutic approaches. Experimental & Clinical
Cardiology, 12, 17-28.
Kalra S (2013). Recent advances in pathophysiology of diabetes: beyond the dirty dozen. The Journal
of the Pakistan Medical Association, 63, 277-280.
Kampmann U, Madsen LR, Skajaa GO, Iversen DS, Moeller N, Ovesen P (2015). Gestational
diabetes: A clinical update. World journal of diabetes, 6, 1065-1072.
Kanagavalli U, Bhuvaneshwari B, Sadiq A (2015). Anti diabetic activity of Boerhaavia diffusa
against alloxan induced diabetic rats. International Journal of Pharma and Bio Sciences;, 6,
1215-1219.
Kandarakis SA, Piperi C, Topouzis F, Papavassiliou AG (2014). Emerging role of advanced
glycation-end products (AGEs) in the pathobiology of eye diseases. Progress in retinal and
eye research, 42, 85-102.
Kaneto H, Katakami N, Matsuhisa M, Matsuoka T-A (2010). Role of reactive oxygen species in the
progression of type 2 diabetes and atherosclerosis. Mediators of inflammation, 2010, 1-11.
Kanner J, Selhub J, Shpaizer A, Rabkin B, Shacham I, Tirosh O (2017). Redox homeostasis in
stomach medium by foods: The Postprandial Oxidative Stress Index (POSI) for balancing
nutrition and human health. Redox biology, 12, 929-936.
Kapur NK, Ashen D, Blumenthal RS (2008). High density lipoprotein cholesterol: an evolving target
of therapy in the management of cardiovascular disease. Vascular health and risk
management, 4, 39-57.
Karan SK, Mishra SK, Pal D, Mondal A (2012). Isolation of-sitosterol and evaluation of antidiabetic
activity of Aristolochia indica in alloxan-induced diabetic mice with a reference to in-vitro
antioxidant activity. Journal of Medicinal Plants Research, 6, 1219-1223.
Kashiwagi A (2001). Complications of diabetes mellitus and oxidative stress. Japan Medical
Association Journal, 44, 521-528.
Kasote DM, Katyare SS, Hegde MV, Bae H (2015). Significance of antioxidant potential of plants
and its relevance to therapeutic applications. International journal of biological sciences, 11,
982-991.
Kawamura-Konishi Y, Watanabe N, Saito M, Nakajima N, Sakaki T, Katayama T, Enomoto T
(2012). Isolation of a new phlorotannin, a potent inhibitor of carbohydrate-hydrolyzing
enzymes, from the brown alga Sargassum patens. Journal of agricultural and food chemistry,
60, 5565-5570.
249
Kedare SB, Singh R (2011). Genesis and development of DPPH method of antioxidant assay. Journal
of food science and technology, 48, 412-422.
Kehinde AJ, Adebayo AJ, Oluwadamilola SO, Arinola AA (2016). Stem Bark Extract from Alstonia
boonei attenuates cholesterol, triglyceride and oxidative damage via low
immunohistochemical expression in small intestinal tract of male rats. J Diabetes Metab, 7,
1-7.
Kelley DE, Mokan M, Mandarino LJ (1993). Metabolic pathways of glucose in skeletal muscle of
lean NIDDM patients. Diabetes Care, 16, 1158-1166.
Kelley KW, Carroll DG, Meyer A (2015). A review of current treatment strategies for gestational
diabetes mellitus. Drugs in context, 4, 1-15.
Kerner W, Brückel J (2014). Definition, classification and diagnosis of diabetes mellitus.
Experimental and Clinical Endocrinology & Diabetes, 122, 384-386.
Khan A, Safdar M, Khan MMA, Khattak KN, Anderson RA (2003). Cinnamon improves glucose and
lipids of people with type 2 diabetes. Diabetes care, 26, 3215-3218.
Khan SA, Al Kiyumi AR, Al Sheidi MS, Al Khusaibi TS, Al Shehhi NM, Alam T (2016). In vitro
inhibitory effects on α-glucosidase and α-amylase level and antioxidant potential of seeds of
Phoenix dactylifera L. Asian Pacific Journal of Tropical Biomedicine, 6, 322-329.
Kim Y-B, Nikoulina SE, Ciaraldi TP, Henry RR, Kahn BB (1999). Normal insulin-dependent
activation of Akt/protein kinase B, with diminished activation of phosphoinositide 3-kinase,
in muscle in type 2 diabetes. The Journal of clinical investigation, 104, 733-741.
Kim YS, Lee YM, Kim H, Kim J, Jang DS, Kim JH, Kim JS (2010). Anti-obesity effect of Morus
bombycis root extract: anti-lipase activity and lipolytic effect. Journal of ethnopharmacology,
130, 621-624.
King GL (2008). The role of inflammatory cytokines in diabetes and its complications. Journal of
periodontology, 79, 1527-1534.
Kinyi HW, Byarugaba W, Vicente-Crespo M (2016). Antioxidant activity of three local leafy
vegetables of Western Uganda. The FASEB Journal, 30, 628.627-628.627.
Knentz A, Nattras M, Pickup J, Williams G (1991). Diabetic ketoacidosis, non ketotic hyperosmolar
coma and lactic acidosis. Handbook of diabetes, 479-494.
Ko T-P, Safo MK, Musayev FN, Di Salvo ML, Wang C, Wu S-H, Abraham DJ (2000). Structure of
human erythrocyte catalase. Acta Crystallographica Section D: Biological Crystallography,
56, 241-245.
Kohei K (2010). Pathophysiology of type 2 diabetes and its treatment policy. JMAJ, 53, 41-46.
250
Kokil GR, Veedu RN, Ramm GA, Prins JB, Parekh HS (2015). Type 2 diabetes mellitus: limitations
of conventional therapies and intervention with nucleic acid-based therapeutics. Chemical
reviews, 115, 4719-4743.
Kolawole O, Olayemi A (2003). Studies on the efficacy of Bridelia ferruginea benth bark extract for
water purification. Nigeria Journal of Pure and Applied Sciences, 18, 1387-1394.
Kooti W, Farokhipour M, Asadzadeh Z, Ashtary-Larky D, Asadi-Samani M (2016). The role of
medicinal plants in the treatment of diabetes: a systematic review. Electronic physician, 8,
1832-1842.
Kopjar M, Piližota V, Hribar J, Simčić M (2009). Total phenol content and antioxidant activity of
water solutions of plant extracts. Croatian journal of food science and technology, 1, 1-7.
Korshunov SS, Skulachev VP, Starkov AA (1997). High protonic potential actuates a mechanism of
production of reactive oxygen species in mitochondria. FEBS letters, 416, 15-18.
Kulling SE, Rawel HM (2008). Chokeberry (Aronia melanocarpa)–A review on the characteristic
components and potential health effects. Planta medica, 74, 1625-1634.
Kumar S, Narwal S, Kumar V, Prakash O (2011). α-glucosidase inhibitors from plants: A natural
approach to treat diabetes. Pharmacognosy reviews, 5, 19-29.
Kumawat M, Sharma TK, Singh I, Singh N, Ghalaut VS, Vardey SK, Shankar V (2013). Antioxidant
enzymes and lipid peroxidation in type 2 diabetes mellitus patients with and without
nephropathy. North American journal of medical sciences, 5, 213-219.
Kurian GA, Suryanarayanan S, Raman A, Padikkala J (2010). Antioxidant effects of ethyl acetate
extract of Desmodium gangeticum root on myocardial ischemia reperfusion injury in rat
hearts. Chinese medicine, 5, 1-7.
Kurutas EB (2015). The importance of antioxidants which play the role in cellular response against
oxidative/nitrosative stress: current state. Nutrition journal, 15, 1-22.
Kushiyama A, Tanaka K, Hara S, Kawazu S (2014). Linking uric acid metabolism to diabetic
complications. World journal of diabetes, 5, 787-795.
Kushwaha PS, Raj V, Singh AK, Keshari AK, Saraf SA, Mandal SC, Yadav RK, Saha S (2015).
Antidiabetic effects of isolated sterols from Ficus racemosa leaves. RSC Advances, 5, 35230-
35237.
Kweifio‐Okai G, Carroll AR (1993). Antiarthritic effect of lupeol acetate. Phytotherapy Research, 7,
213-215.
Lakhtakia R (2013). The history of diabetes mellitus. Sultan Qaboos University Medical Journal, 13,
368-370.

251
Lakshmi M, Rani K, Reddy T (2012). A review on diabetes mellitus and the herbal plants used for its
treatment. Asian journal of pharmaceutical and clinical research, 5, 15-21.
Lee AY, Chung SS (1999). Contributions of polyol pathway to oxidative stress in diabetic cataract.
The FASEB Journal, 13, 23-30.
Lee JJ, Britton KA, Pedley A, Massaro JM, Speliotes EK, Murabito JM, Hoffmann U, Ingram C,
Keaney JF, Vasan RS (2016). Adipose tissue depots and their cross‐sectional associations
with circulating biomarkers of metabolic regulation. Journal of the American Heart
Association, 5, e002936.
Leguisamo NM, Lehnen AM, Machado UF, Okamoto MM, Markoski MM, Pinto GH, Schaan BD
(2012). GLUT4 content decreases along with insulin resistance and high levels of
inflammatory markers in rats with metabolic syndrome. Cardiovascular diabetology, 11, 1-
10.
Lenzen S, Drinkgern J, Tiedge M (1996). Low antioxidant enzyme gene expression in pancreatic
islets compared with various other mouse tissues. Free Radical Biology and Medicine, 20,
463-466.
Leon BM, Maddox TM (2015). Diabetes and cardiovascular disease: Epidemiology, biological
mechanisms, treatment recommendations and future research. World journal of diabetes, 6,
1246-1258.
Leon MG, Moussa HN, Longo M, Pedroza C, Haidar ZA, Mendez-Figueroa H, Blackwell SC, Sibai
BM (2016). Rate of gestational diabetes mellitus and pregnancy outcomes in patients with
chronic hypertension. American journal of perinatology, 33, 745-750.
Levelt E, Pavlides M, Banerjee R, Mahmod M, Kelly C, Sellwood J, Ariga R, Thomas S, Francis J,
Rodgers C (2016). Ectopic and visceral fat deposition in lean and obese patients with type 2
diabetes. Journal of the American College of Cardiology, 68, 53-63.
Li F-F, Fu L-Y, Zhang W-L, Su X-F, Wu J-D, Sun J, Ye L, Ma J-H (2016). Blood glucose fluctuations
in type 2 diabetes patients treated with multiple daily injections. Journal of diabetes research,
2016, 1-8.
Li N, Frigerio F, Maechler P (2008). The sensitivity of pancreatic β-cells to mitochondrial injuries
triggered by lipotoxicity and oxidative stress. Portland Press Limited.
Lin C-H, Peng Y-H, Coumar MS, Chittimalla SK, Liao C-C, Lyn P-C, Huang C-C, Lien T-W, Lin
W-H, Hsu JT-A (2009). Design and structural analysis of novel pharmacophores for potent
and selective peroxisome proliferator-activated receptor γ agonists. Journal of medicinal
chemistry, 52, 2618-2622.
252
Lin MV, Bishop G, Benito-Herrero M (2010). Diabetic ketoacidosis in type 2 diabetics: a novel
presentation of pancreatic adenocarcinoma. Journal of general internal medicine, 25, 369-
373.
Lipinski B (2011). Hydroxyl radical and its scavengers in health and disease. Oxidative Medicine and
Cellular Longevity, 2011, 1-9.
Liu X, Kokare C (2017). Microbial Enzymes of Use in Industry. Biotechnology of Microbial Enzymes.
Elsevier, 267-298.
Lo S, Russell JC, Taylor A (1970). Determination of glycogen in small tissue samples. Journal of
applied physiology, 28, 234-236.
Loghmani E (2005). Diabetes mellitus: type 1 and type 2. Guidelines for adolescent nutrition services,
167-182.
López M, Cos FX, Álvarez-Guisasola F, Fuster E (2017). Prevalence of diabetic retinopathy and its
relationship with glomerular filtration rate and other risk factors in patients with type 2
diabetes mellitus in Spain. DM2 hope study. Journal of clinical & translational
endocrinology, 9, 61-65.
Lorenzo C, Wagenknecht LE, D'agostino RB, Rewers MJ, Karter AJ, Haffner SM (2010). Insulin
resistance, β-cell dysfunction, and conversion to type 2 diabetes in a multiethnic population:
the insulin resistance atherosclerosis study. Diabetes Care, 33, 67-72.
Lowry OH, Rosebrough NJ, Farr AL, Randall RJ (1951). Protein measurement with the Folin phenol
reagent. J biol Chem, 193, 265-275.
Luo C, Zheng H, Mao S, Yang M, Luo C, Chen H (2014). Xanthones from Swertia mussotii and their
α-glycosidase inhibitory activities. Planta medica, 80, 201-208.
Lyons TJ, Thorpe SR, Baynes JW (1992). Glycation and autoxidation of proteins in aging and
diabetes. Hyperglycemia, Diabetes, and Vascular Disease, 197-217.
Magistretti M, Conti M, Cristoni A (1988). Antiulcer activity of an anthocyanidin from Vaccinium
myrtillus. Arzneimittel-Forschung, 38, 686-690.
Mahammed A, Kumar D, Rizvi SI (2015). Antidiabetic potential of some less commonly used plants
in traditional medicinal systems of India and Africa. Journal of Intercultural
Ethnopharmacology, 4, 78-85.
Mahdi JG (2010). Medicinal potential of willow: A chemical perspective of aspirin discovery.
Journal of Saudi Chemical Society, 14, 317-322.
253
Mahendran G, Manoj M, Murugesh E, Kumar RS, Shanmughavel P, Prasad KR, Bai VN (2014). In
vivo anti-diabetic, antioxidant and molecular docking studies of 1, 2, 8-trihydroxy-6-methoxy
xanthone and 1, 2-dihydroxy-6-methoxyxanthone-8-O-β-D-xylopyranosyl isolated from
Swertia corymbosa. Phytomedicine, 21, 1237-1248.
Mahmoud F, Al-Ozairi E (2013). Inflammatory cytokines and the risk of cardiovascular
complications in type 2 diabetes. Disease Markers, 35, 235-241.
Mahomoodally MF (2013). Traditional medicines in Africa: an appraisal of ten potent African
medicinal plants. Evidence-Based Complementary and Alternative Medicine, 2013, 1-14.
Mai TT, Thu NN, Tien PG, Van Chuyen N (2007). Alpha-glucosidase inhibitory and antioxidant
activities of Vietnamese edible plants and their relationships with polyphenol contents.
Journal of nutritional science and vitaminology, 53, 267-276.
Majekodunmi S, Adegoke O, Odeku O (2008). Formulation of the extract of the stem bark of Alstonia
boonei as tablet dosage form. Tropical Journal of Pharmaceutical Research, 7, 987-994.
Makatini MM, Petzold K, Alves CN, Arvidsson PI, Honarparvar B, Govender P, Govender T, Kruger
HG, Sayed Y, Jerônimolameira (2013). Synthesis, 2D-NMR and molecular modelling studies
of pentacycloundecane lactam-peptides and peptoids as potential HIV-1 wild type C-SA
protease inhibitors. Journal of enzyme inhibition and medicinal chemistry, 28, 78-88.
Malakouti M, Kataria A, Ali SK, Schenker S (2017). Elevated Liver Enzymes in Asymptomatic
Patients–What Should I Do? Journal of clinical and translational hepatology, 5, 394-403.
Malhotra D, Ishaq F, Khan A (2014). Antidiabetic and antihyperlipidemic activity of aqueous and
methanolic extract of Boerhaavia Diffusa L. in streptozotocin-induced diabetic rats. Drug
Invention Today, 6, 41-45.
Manyema M, Veerman JL, Chola L, Tugendhaft A, Labadarios D, Hofman K (2015). Decreasing the
burden of type 2 diabetes in South Africa: the impact of taxing sugar-sweetened beverages.
PLoS One, 10, e0143050.
Maqsood S, Benjakul S, Abushelaibi A, Alam A (2014). Phenolic compounds and plant phenolic
extracts as natural antioxidants in prevention of lipid oxidation in seafood: A detailed review.
Comprehensive Reviews in Food Science and Food Safety, 13, 1125-1140.
Marcovecchio ML, Lucantoni M, Chiarelli F (2011). Role of chronic and acute hyperglycemia in the
development of diabetes complications. Diabetes technology & therapeutics, 13, 389-394.
Matough FA, Budin SB, Hamid ZA, Alwahaibi N, Mohamed J (2012). The role of oxidative stress
and antioxidants in diabetic complications. Sultan Qaboos University Medical Journal, 12,
5-18.
254
Mbaka G, Ojewale A, Ogbonnia S, Ota D (2014). Antihyperglycaemic and antihyperlipidaemic
activities of aqueous ethanol root extract of Pseudocedrela kotschyi on alloxan-induced
diabetic rats. British Journal of Medicine and Medical Research, 4, 5839-5852.
Mcculloch DK. (2007). Alpha-glucosidase inhibitors and lipase inhibitors for treatment of diabetes
mellitus [Online]. Available: https://www.uptodate.com/contents/alpha-glucosidase-
inhibitors-and-lipase-inhibitors-for-treatment-of-diabetes-mellitus [Accessed 18 November
2018].
Mcdonald S, Prenzler PD, Antolovich M, Robards K (2001). Phenolic content and antioxidant activity
of olive extracts. Food chemistry, 73, 73-84.
Mctaggart JS, Clark RH, Ashcroft FM (2010). Symposium review: The role of the KATP channel in
glucose homeostasis in health and disease: more than meets the islet. The Journal of
physiology, 588, 3201-3209.
Meir S, Kanner J, Akiri B, Philosoph-Hadas S (1995). Determination and involvement of aqueous
reducing compounds in oxidative defense systems of various senescing leaves. Journal of
agricultural and food chemistry, 43, 1813-1819.
Meneses M, M Silva B, Sousa M, Sá R, F Oliveira P, G Alves M (2015). Antidiabetic Drugs:
mechanisms of action and potential outcomes on cellular metabolism. Current
pharmaceutical design, 21, 3606-3620.
Mishra S, Aeri V, Gaur PK, Jachak SM (2014). Phytochemical, therapeutic, and
ethnopharmacological overview for a traditionally important herb: Boerhavia diffusa Linn.
BioMed research international, 2014, 1-19.
Mizgier M, Casas M, Contreras‐Ferrat A, Llanos P, Galgani JE (2014). Potential role of skeletal
muscle glucose metabolism on the regulation of insulin secretion. obesity reviews, 15, 587-
597.
Mohammed A, Ibrahim MA, Islam MS (2014). African medicinal plants with antidiabetic potentials:
A review. Planta Medica, 80, 354-377.
Momeni A (2012). Serum uric acid and diabetic nephropathy. Journal of renal injury prevention, 1,
37-38.
Moncada S, Palmer R, Higgs EA (1991). Nitric oxide: physiology, pathophysiology, and
pharmacology. Pharmacological reviews, 43, 109-142.
Montgomery MK, Turner N (2015). Mitochondrial dysfunction and insulin resistance: an update.
Endocrine connections, 4, R1-R15.
255
Mopuri R, Ganjayi M, Meriga B, Koorbanally NA, Islam MS (2018). The effects of Ficus carica on
the activity of enzymes related to metabolic syndrome. Journal of Food and Drug Analysis,
26, 201-210.
Morris GM, Huey R, Lindstrom W, Sanner MF, Belew RK, Goodsell DS, Olson AJ (2009).
AutoDock4 and AutoDockTools4: Automated docking with selective receptor flexibility.
Journal of computational chemistry, 30, 2785-2791.
Motala AA, Omar MA, Pirie FJ (2003). Epidemiology of type 1 and type 2 diabetes in Africa. Journal
of cardiovascular risk, 10, 77-83.
Murti K, Panchal MA, Lambole V (2010). Pharmacological properties of Boerhaavia diffusa-a
review. International Journal of Pharmaceutical Science Review and Research, 5, 107-110.
Mutyambizi C, Pavlova M, Chola L, Hongoro C, Groot W (2018). Cost of diabetes mellitus in Africa:
a systematic review of existing literature. Globalization and health, 14, 1-13.
Nabavi SM, Ebrahimzadeh MA, Nabavi SF, Fazelian M, Eslami B (2009). In vitro antioxidant and
free radical scavenging activity of Diospyros lotus and Pyrus boissieriana growing in Iran.
Pharmacognosy magazine, 5, 122-126.
Nair SA, Sabulal B, Radhika J, Arunkumar R, Subramoniam A (2014). Promising anti-diabetes
mellitus activity in rats of β-amyrin palmitate isolated from Hemidesmus indicus roots.
European journal of pharmacology, 734, 77-82.
Nalamolu RK, Boini KM, Nammi S (2004). Effect of chronic administration of Boerhaavia diffusa
Linn. leaf extract on experimental diabetes in rats. Tropical Journal of Pharmaceutical
Research, 3, 305-309.
Nansseu JRN, Fokom-Domgue J, Noubiap JJN, Balti EV, Sobngwi E, Kengne AP (2015).
Fructosamine measurement for diabetes mellitus diagnosis and monitoring: a systematic
review and meta-analysis protocol. BMJ open, 5, e007689.
Nath S. (2015). Glucose metabolism and insulin [Online]. [Online]. Available:
https://www.slideshare.net/ShamithaNath/glucose-metabolism-insulin [Accessed 9
November 2018].
Navarro JF, Mora C (2005). Role of inflammation in diabetic complications. Nephrology dialysis
transplantation, 20, 2601-2604.
Nayak P, Thirunavoukkarasu M (2016). A review of the plant Boerhaavia diffusa: its chemistry,
pharmacology and therapeutical potential. The Journal of Phytopharmacology, 5, 83-92.
Newman DJ, Cragg GM (2012). Natural products as sources of new drugs over the 30 years from
1981 to 2010. Journal of natural products, 75, 311-335.
256
Nicolis E, Lampronti I, Dechecchi MC, Borgatti M, Tamanini A, Bianchi N, Bezzerri V, Mancini I,
Giri MG, Rizzotti P (2008). Pyrogallol, an active compound from the medicinal plant
Emblica officinalis, regulates expression of pro-inflammatory genes in bronchial epithelial
cells. International immunopharmacology, 8, 1672-1680.
Nimse SB, Pal D (2015). Free radicals, natural antioxidants, and their reaction mechanisms. RSC
Advances, 5, 27986-28006.
Nistor Bl, Martineau Lc, Benhaddou-Andaloussi A, Arnason Jt, Lévy É, Ps H (2010). Inhibition of
intestinal glucose absorption by anti-diabetic medicinal plants derived from the James Bay
Cree traditional pharmacopeia. Journal of Ethnopharmacology, 132, 473-482.
Nita M, Grzybowski A (2016). The role of the reactive oxygen species and oxidative stress in the
pathomechanism of the age-related ocular diseases and other pathologies of the anterior and
posterior eye segments in adults. Oxidative Medicine and Cellular Longevity, 2016, 1-23.
Njamen D, Nkeh-Chungag BN, Tsala E, Fomum ZT, Mbanya JC, Ngufor GF (2012). Effect of
Bridelia ferruginea (Euphorbiaceae) leaf extract on sucrose-induced glucose intolerance in
rats. Tropical Journal of Pharmaceutical Research, 11, 759-765.
Nkono BLNY, Sokeng SD, Désiré DDP, Kamtchouing P (2014). Antihyperglycemic and antioxydant
properties of Alstonia boonei De wild.(Apocynaceae) stem bark aqueous extract in
dexamethasone-induced hyperglycemic rats. International Journal of Diabetes Research, 3,
27-35.
Nolan CJ, Ruderman NB, Kahn SE, Pedersen O, Prentki M (2015). Insulin resistance as a
physiological defense against metabolic stress: implications for the management of subsets
of type 2 diabetes. Diabetes, 64, 673-686.
Noreen H, Semmar N, Farman M, Mccullagh JS (2017). Measurement of total phenolic content and
antioxidant activity of aerial parts of medicinal plant Coronopus didymus. Asian Pacific
journal of tropical medicine, 10, 792-801.
Nurdiana S, Goh YM, Ahmad H, Dom SM, Azmi NSA, Zin NSNM, Ebrahimi M (2017). Changes in
pancreatic histology, insulin secretion and oxidative status in diabetic rats following
treatment with Ficus deltoidea and vitexin. BMC complementary and alternative medicine,
17, 1-17.
Obiagwu MO, Ihekwereme CP, Ajaghaku DL, Okoye FBC (2014). The useful medicinal properties
of the root-bark extract of Alstonia boonei (Apocynaceae) may be connected to antioxidant
activity. ISRN pharmacology, 2014, 1-4.
257
Oboh G, Akinyemi AJ, Ademiluyi AO (2012). Antioxidant and inhibitory effect of red ginger
(Zingiber officinale var. Rubra) and white ginger (Zingiber officinale Roscoe) on Fe2+
induced lipid peroxidation in rat brain in vitro. Experimental and Toxicologic Pathology, 64,
31-36.
Odegaard JI, Chawla A (2012). Connecting type 1 and type 2 diabetes through innate immunity. Cold
Spring Harbor perspectives in medicine, 2, a007724.
Odoh U, Ndubuokwu R, Inya-Agha S, Osadebe P, Uzor P, Ezejiofor M (2014). Antidiabetic activity
and phytochemical screening of Acalypha wilkesiana (Euphorbiaceae) Mull Arg. roots in
alloxan-induced diabetic rats. Scientific Research and Essays, 9, 204-212.
Ogurtsova K, Da Rocha Fernandes J, Huang Y, Linnenkamp U, Guariguata L, Cho N, Cavan D, Shaw
J, Makaroff L (2017). IDF Diabetes Atlas: Global estimates for the prevalence of diabetes for
2015 and 2040. Diabetes research and clinical practice, 128, 40-50.
Oh YS (2015). Plant-derived compounds targeting pancreatic beta cells for the treatment of diabetes.
Evidence-Based Complementary and Alternative Medicine, 2015, 1-12.
Ohkawa H, Ohishi N, Yagi K (1979). Assay for lipid peroxides in animal tissues by thiobarbituric
acid reaction. Analytical biochemistry, 95, 351-358.
Okoye NN, Ajaghaku DL, Okeke HN, Ilodigwe EE, Nworu CS, Okoye FBC (2014). beta-Amyrin
and alpha-amyrin acetate isolated from the stem bark of Alstonia boonei display profound
anti-inflammatory activity. Pharmaceutical biology, 52, 1478-1486.
Oladimeji OH, Ani L, Nyong E (2012). Potential larvicides in Nigerian herbal recipes. International
Journal of Pharmaceutical Sciences and Research, 3, 3783-3787.
Oladipo O, Olanrewaju S, Akinloye J (2016). Comparative epidermal morphology and petiole
anatomical study of Acalypha hispida burm. F and Acalypha wilkessiana muell. Arg varieties
(Euphorbiaceae). African Journal of Pharmacology and Therapeutics Vol. 5(1), Pages 8-14.
Olaide O, Omotade O, Olufemi O, Amos O, Bashir A (2014). In-vitro antioxidant activities of the
stem bark extract fractions of Bridelia ferruginea. Journal of Biology, Agriculture and
Healthcare, 4, 1-7.
Olaiya C, Omolekan T, Esan A, Adediran BJ (2015). Renal, Cardiac and Osteo–protective effects of
beta–sitosterol glycoside in hypertensive rats. Advances in Life Sciences and Technology, 39,
13-18.
Olajide OA, Aderogba MA, Okorji UP, Fiebich BL (2012). Bridelia ferruginea produces
antineuroinflammatory activity through inhibition of nuclear factor-kappa B and p38 MAPK
signalling. Evidence-Based Complementary and Alternative Medicine, 2012, 1-8.

258
Olajide OA, Awe SO, Makinde JM, Ekhelar AI, Olusola A, Morebise O, Okpako DT (2000). Studies
on the anti-inflammatory, antipyretic and analgesic properties of Alstonia boonei stem bark.
Journal of ethnopharmacology, 71, 179-186.
Olajide OA, Makinde JM, Awe SO (1999). Effects of the aqueous extract of Bridelia ferruginea stem
bark on carrageenan-induced oedema and granuloma tissue formation in rats and mice.
Journal of Ethnopharmacology, 66, 113-117.
Olanlokun OJ, Olorunsogo OO (2018). Toxicology of solvent extract and fractions of Alstonia
boonei (DC.) Wild stem bark in Rats. Journal of Herbmed Pharmacology, 7, 129-134.
Olaoluwa OO, James DA, Adigun OA (2018). Volatile oil analysis of aerial parts of Boerhavia
coccinea (Mill.). Natural product research, 32, 959-962.
Olofsson P, Hultqvist M, Hellgren LI, Holmdahl R (2014). Phytol: A Chlorophyll Component with
Anti-inflammatory and Metabolic Properties. Recent Advances in Redox Active Plant and
Microbial Products, 345-359.
Oloyede OI, Babalola SO (2012). In vitro antioxidant activity of ethanolic extract of Bridelia
ferruginea (stem bark). Academic Research International, 2, 246-251.
Olukunle JO, Jacobs EB, Oyewusi JA (2016). Hypoglycemic and Hypolipidemic Effects of Acalypha
Wilkesiana Leaves in Alloxan Induced Diabetic Rats. The FASEB Journal, 30, 1269.1263-
1269.1263.
Olusola BA, Amos O, Scholastica OA, Catherine JO, Idowu AA, Miriam FA (2015). Protective effect
of ethanolic extract of Crassocephalum rubens leaves on carbon tetrachloride-induced liver
damage in rats. World Journal of Pharmaceutical research, 4, 156-168.
Omage K, Azeke MA, Omage SO (2018). Evaluation of the efficacy of Acalypha wilkesiana leaves
in managing cardiovascular disease risk factors in rabbits exposed to salt-loaded diets.
Clinical Phytoscience, 4, 1-7.
Omoregie ES, Okugbo OT, Oikeh E, Irabor F (2015). Hepatoprotective effect of leaf extracts of
Crassocephalum rubens (Juss. ex Jacq.) S. Moore in rifampicin-induced oxidative stress in
Swiss mice. Journal of Pharmacy & Bioresources, 12, 112-119.
Onunkwo G, Akah P, Udeala O (1996). Studies on Bridelia ferruginea leaves (1). Stability and
hypoglycaemic actions of the leaf extract tablets. Phytotherapy Research, 10, 418-420.
Opoku F, Akoto O (2015). Antimicrobial and phytochemical properties of Alstonia boonei extracts.
Organic Chemistry: Current Research, 4, 1-4.

259
Osadolor H, Ukhureigbe J, Olaniyan O (2015). Antidiabetic and plasma endogenous antioxidant
activity of Alstonia boonei in alloxan-induced male diabetic rabbits. Journal of Applied
Sciences and Environmental Management, 19, 597-601.
Oseni K, Olawoye B (2015). Underutilized indigenous vegetable (UIV) in Nigeria: a rich source of
nutrient and antioxidants-a review. Annals Food Science and Technology, 16, 236-247.
Oyaizu M (1986). Studies on products of browning reaction. The Japanese Journal of Nutrition and
Dietetics, 44, 307-315.
Oyebode OA, Erukainure OL, Chukwuma CI, Ibeji CU, Koorbanally NA, Islam S (2018). Boerhaavia
diffusa inhibits key enzymes linked to type 2 diabetes in vitro and in silico; and modulates
abdominal glucose absorption and muscle glucose uptake ex vivo. Biomedicine &
Pharmacotherapy, 106, 1116-1125.
Pacher P, Beckman JS, Liaudet L (2007). Nitric oxide and peroxynitrite in health and disease.
Physiological reviews, 87, 315-424.
Padwal RS, Majumdar SR (2007). Drug treatments for obesity: orlistat, sibutramine, and rimonabant.
The Lancet, 369, 71-77.
Palhares RM, Drummond MG, Brasil BDSaF, Cosenza GP, Brandão MDGL, Oliveira G (2015).
Medicinal plants recommended by the world health organization: DNA barcode
identification associated with chemical analyses guarantees their quality. PloS one, 10,
e0127866.
Pan Y, Wang C, Chen Z, Li W, Yuan G, Chen H (2017). Physicochemical properties and antidiabetic
effects of a polysaccharide from corn silk in high-fat diet and streptozotocin-induced diabetic
mice. Carbohydrate polymers, 164, 370-378.
Pandey A, Tripathi P, Pandey R, Srivatava R, Goswami S (2011). Alternative therapies useful in the
management of diabetes: A systematic review. Journal of pharmacy & bioallied sciences, 3,
504-512.
Paneni F, Costantino S, Cosentino F (2014). Insulin resistance, diabetes, and cardiovascular risk.
Current atherosclerosis reports, 16, 1-8.
Pari L, Amarnath Satheesh M (2004). Antidiabetic effect of Boerhavia diffusa: effect on serum and
tissue lipids in experimental diabetes. Journal of medicinal food, 7, 472-476.
Pari L, Satheesh MA (2004). Antidiabetic activity of Boerhaavia diffusa L.: effect on hepatic key
enzymes in experimental diabetes. Journal of Ethnopharmacology, 91, 109-113.
Pasquel FJ, Umpierrez GE (2014). Hyperosmolar hyperglycemic state: a historic review of the
clinical presentation, diagnosis, and treatment. Diabetes Care, 37, 3124-3131.
260
Patel D, Prasad S, Kumar R, Hemalatha S (2012). An overview on antidiabetic medicinal plants
having insulin mimetic property. Asian Pacific journal of tropical biomedicine, 2, 320-330.
Patel PM, Shah T, Krish K (2014). The evaluation of cardiac markers in diabetic and non diabetic
patients with myocardial infarction. International Journal of Biomedical and Advance
Research, 5, 07-09
Pavithra K, Vadivukkarasi S (2015). Evaluation of free radical scavenging activity of various extracts
of leaves from Kedrostis foetidissima (Jacq.) Cogn. Food Science and Human Wellness, 4,
42-46.
Payghami N, Jamili S, Rustaiyan A, Saeidnia S, Nikan M, Gohari AR (2015). Alpha-amylase
inhibitory activity and sterol composition of the marine algae, Sargassum glaucescens.
Pharmacognosy research, 7, 314-321.
Pereira DM, Faria J, Gaspar L, Valentão P, Andrade PB (2009). Boerhaavia diffusa: Metabolite
profiling of a medicinal plant from Nyctaginaceae. Food and Chemical Toxicology, 47, 2142-
2149.
Pereira RM, Moura LPD, Muñoz VR, Silva ASRD, Gaspar RS, Ropelle ER, Pauli JR (2017).
Molecular mechanisms of glucose uptake in skeletal muscle at rest and in response to
exercise. Motriz: Revista de Educação Física, 23, 1-8.
Petrovska BB (2012). Historical review of medicinal plants’ usage. Pharmacognosy reviews, 6, 1.
Phaniendra A, Jestadi DB, Periyasamy L (2015). Free radicals: properties, sources, targets, and their
implication in various diseases. Indian Journal of Clinical Biochemistry, 30, 11-26.
Pickup J, Crook M (1998). Is type II diabetes mellitus a disease of the innate immune system?
Diabetologia, 41, 1241-1248.
Pithová P, Stechová K, Pitha J, Lánská V, Kvapil M (2016). Determinants of preclinical
atherosclerosis are different in type 1 and type 2 diabetic women. Physiological research, 65,
219-228.
Pober BR (2010). williams–Beuren syndrome. New England Journal of Medicine, 362, 239-252.
Pollack RM, Donath MY, Leroith D, Leibowitz G (2016). Anti-inflammatory agents in the treatment
of diabetes and its vascular complications. Diabetes Care, 39, S244-S252.
Poloz Y, Stambolic V (2015). Obesity and cancer, a case for insulin signaling. Cell death & disease,
6, e2037.
Polya G (2003). Biochemical targets of plant bioactive compounds: a pharmacological reference
guide to sites of action and biological effects, CRC press.
261
Porte D (2006). Central regulation of energy homeostasis: the key role of insulin. Diabetes, 55, S155-
S160.
Prakash O, Kumar R, Srivastava R, Tripathi P, Mishra S (2015). Plants explored with anti-diabetic
properties: A review. American Journal of Pharmacological Sciences, 3, 55-66.
Prashanth D, Padmaja R, Ds. S (2001). Effect of certain plant extracts on alpha-amylase activity.
Filoterapia, 72, 179-181.
Pratley R, Weyer C (2001). The role of impaired early insulin secretion in the pathogenesis of type II
diabetes mellitus. Diabetologia, 44, 929-945.
Pratley RE (2010). GIP: an inconsequential incretin or not? Diabetes Care, 33, 1691-1692.
Pratley RE (2013). The early treatment of type 2 diabetes. The American journal of medicine, 126,
S2-S9.
Qazi A, Fahim A, Qureshi A (2016). GESTATIONAL DIABETES MELLITUS; STILL A GREAT
PROBLEM. Professional Medical Journal, 23, 015-019.
Rahman I, Kode A, Biswas SK (2006). Assay for quantitative determination of glutathione and
glutathione disulfide levels using enzymatic recycling method. Nature protocols, 1, 3159-
3165.
Rajpathak SN, Crandall JP, Wylie-Rosett J, Kabat GC, Rohan TE, Hu FB (2009). The role of iron in
type 2 diabetes in humans. Biochimica et Biophysica Acta (BBA)-General Subjects, 1790,
671-681.
Rajpoot K, Mishra R (2011). Boerhaavia diffusa roots (Punarnava mool)–review as rasayan
(rejuvenator/antiaging). International Journal of Pharmaceutical and Biomedical Research,
2, 1451-1460.
Ramakrishna G, Rooke TW, Cooper LT (2003). Iron and peripheral arterial disease: revisiting the
iron hypothesis in a different light. Vascular Medicine, 8, 203-210.
Ramakrishnan V, Reddy AG, Reddy AR, Haritha C (2011). Evaluation of herbal neonatal chick care
against iron-induced toxicity in broilers. Toxicology international, 18, 50-53.
Ramkumar KM, Thayumanavan B, Palvannan T, Rajaguru P (2010). Inhibitory effect of Gymnema
Montanum leaves on α-glucosidase activity and α-amylase activity and their relationship with
polyphenolic content. Medicinal Chemistry Research, 19, 948-961.
Ramu R, Shirahatti PS, Nayakavadi S, Vadivelan R, Zameer F, Dhananjaya BL, Prasad N (2016).
The effect of a plant extract enriched in stigmasterol and β-sitosterol on glycaemic status and
glucose metabolism in alloxan-induced diabetic rats. Food & function, 7, 3999-4011.

262
Rani B, Maheshwari RK (2014). Natural antioxidants and their intrinsic worth for wellbeing. Global
Journal of Medical Research, 13, 55-69.
Rao PV, Gan SH (2014). Cinnamon: a multifaceted medicinal plant. Evidence-Based Complementary
and Alternative Medicine, 2014, 1-12.
Rapozzi V, Della Pietra E, Bonavida B (2015). Dual roles of nitric oxide in the regulation of tumor
cell response and resistance to photodynamic therapy. Redox biology, 6, 311-317.
Rea S, James DE (1997). Moving GLUT4: the biogenesis and trafficking of GLUT4 storage vesicles.
Diabetes, 46, 1667-1677.
Remedi MS, Emfinger C (2016). Pancreatic β‐cell identity in diabetes. Diabetes, Obesity and
Metabolism, 18, 110-116.
Riddell M, Perkins BA (2009). Exercise and glucose metabolism in persons with diabetes mellitus:
perspectives on the role for continuous glucose monitoring. Journal of diabetes science and
technology, 3, 914-923.
Rider AK, Schedl HP, Nokes G, Shining S (1967). Small intestinal glucose transport: Proximal-distal
kinetic gradients. The Journal of general physiology, 50, 1173-1182.
Riesenfeld G, Sklan D, Bar A, Eisner U, Hurwitz S (1980). Glucose absorption and starch digestion
in the intestine of the chicken. The Journal of Nutrition, 110, 117-121.
Robertson RP, Harmon J, Tran PO, Tanaka Y, Takahashi H (2003). Glucose toxicity in β-cells: type
2 diabetes, good radicals gone bad, and the glutathione connection. Diabetes, 52, 581-587.
Röder PV, Geillinger KE, Zietek TS, Thorens B, Koepsell H, Daniel H (2014). The role of SGLT1
and GLUT2 in intestinal glucose transport and sensing. PloS one, 9, e89977.
Rodrigues BT, Vangaveti VN, Malabu UH (2016). Prevalence and risk factors for diabetic lower limb
amputation: a clinic-based case control study. Journal of diabetes research, 2016, 1-7.
Roglic G (2016). WHO Global report on diabetes: A summary. International Journal of
Noncommunicable Diseases, 1, 3-8.
Sachin J, Tripathi KS, Parihar G, Sharma P, Panwar AS (2013). Protective effect of extract of
Boerhaavia diffusa and Silybum marianum in combination against fructose induced
non‑alcoholic fatty liver in rats. International Journal of Green Pharmacy (IJGP), 7, 230-
235.
Saddala RR, Thopireddy L, Ganapathi N, Kesireddy SR (2013). Regulation of cardiac oxidative stress
and lipid peroxidation in streptozotocin-induced diabetic rats treated with aqueous extract of
Pimpinella tirupatiensis tuberous root. Experimental and toxicologic pathology, 65, 15-19.

263
Safavi M, Foroumadi A, Abdollahi M (2013). The importance of synthetic drugs for type 2 diabetes
drug discovery. Expert opinion on drug discovery, 8, 1339-1363.
Sale E, Sale G (2008). Protein kinase B: signalling roles and therapeutic targeting. Cellular and
molecular life sciences, 65, 113-127.
Sanner MF (1999). Python: a programming language for software integration and development. J
Mol Graph Model, 17, 57-61.
Santos CCDMP, Salvadori MS, Mota VG, Costa LM, De Almeida AaC, De Oliveira GaL, Costa JP,
De Sousa DP, De Freitas RM, De Almeida RN (2013). Antinociceptive and antioxidant
activities of phytol in vivo and in vitro models. Neuroscience journal, 2013, 1-9.
Santos FA, Frota JT, Arruda BR, De Melo TS, De Castro Brito GA, Chaves MH, Rao VS (2012).
Antihyperglycemic and hypolipidemic effects of α, β-amyrin, a triterpenoid mixture from
Protium heptaphyllum in mice. Lipids in health and disease, 11, 1-8.
Sarangarajan R, Meera S, Rukkumani R, Sankar P, Anuradha G (2017). Antioxidants: Friend or foe?
Asian Pacific journal of tropical medicine, 10, 1111-1116.
Satheesh MA, Pari L (2004). Antioxidant effect of Boerhavia diffusa L. in tissues of alloxan induced
diabetic rats. Indian Journal of Experimental Biology, 42, 989-992.
Satoh T (2014). Molecular mechanisms for the regulation of insulin-stimulated glucose uptake by
small guanosine triphosphatases in skeletal muscle and adipocytes. International journal of
molecular sciences, 15, 18677-18692.
Savvides SN, Karplus PA (1996). Kinetics and crystallographic analysis of human glutathione
reductase in complex with a xanthene inhibitor. Journal of Biological Chemistry, 271, 8101-
8107.
Scherer R, Godoy H (2014). Effects of extraction methods of phenolic compounds from Xanthium
strumarium L. and their antioxidant activity. Revista Brasileira de Plantas Medicinais, 16,
41-46.
Seebaluck R, Gurib-Fakim A, Mahomoodally F (2015). Medicinal plants from the genus Acalypha
(Euphorbiaceae)–a review of their ethnopharmacology and phytochemistry. Journal of
ethnopharmacology, 159, 137-157.
Seifu D, Assefa F, Abay SM (2012). Medicinal plants as antioxidant agents: understanding their
mechanism of action and therapeutic efficacy. Medicinal Plants as Antioxidant Agents:
Understanding Their Mechanism of Action and Therapeutic Efficacy, 97-145.

264
Shai LJ, Masoko P, Mokgotho MP, Magano SR, Mogale A, Boaduo N, Eloff JN (2010). Yeast alpha
glucosidase inhibitory and antioxidant activities of six medicinal plants collected in
Phalaborwa, South Africa. South African Journal of Botany, 76, 465-470.
Shanmugapriya A, Maneemegalai S (2017). Quantitative phytochemical estimation and GC-MS
studies in ethanolic root extracts of Boerhavia diffusa. International Journal of Green and
Herbal Chemistry, 7, 010-016.
Sharma P, Bhardwaj R, Yadav A, Sharma R (2014). Antioxidant properties of methanolic extracts of
Boerhavia diffusa. Research Journal of Phytochemistry, 8, 119-126.
Shon M-Y, Lee J, Choi J-H, Choi S-Y, Nam S-H, Seo K-I, Lee S-W, Sung N-J, Park S-K (2007).
Antioxidant and free radical scavenging activity of methanol extract of chungkukjang.
Journal of food composition and analysis, 20, 113-118.
Siddiqui AA, Siddiqui SA, Ahmad S, Siddiqui S, Ahsan I, Sahu K (2013). Diabetes: Mechanism,
pathophysiology and management-A review. International Journal of Drug Development
and Research, 5, 1-23.
Sinacore DR, Gulve EA (1993). The role of skeletal muscle in glucose transport, glucose homeostasis,
and insulin resistance: implications for physical therapy. physical therapy, 73, 878-891.
Singh VP, Bali A, Singh N, Jaggi AS (2014). Advanced glycation end products and diabetic
complications. The Korean Journal of Physiology & Pharmacology, 18, 1-14.
Singleton VL, Orthofer R, Lamuela-Raventós RM (1999). Analysis of total phenols and other
oxidation substrates and antioxidants by means of folin-ciocalteu reagent. Methods in
enzymology. Elsevier, 152-178.
Smith IK, Vierheller TL, Thorne CA (1988). Assay of glutathione reductase in crude tissue
homogenates using 5, 5′-dithiobis (2-nitrobenzoic acid). Analytical biochemistry, 175, 408-
413.
Sofowora A (1982). Medicinal plants and traditional medicine in Africa, John Wiley and sons LTD.
Son SM (2012). Reactive oxygen and nitrogen species in pathogenesis of vascular complications of
diabetes. Diabetes & metabolism journal, 36, 190-198.
Soumya D, Srilatha B (2011). Late stage complications of diabetes and insulin resistance. J Diabetes
Metab, 2, 1-7.
Sowndhararajan K, Kang SC (2013). Free radical scavenging activity from different extracts of leaves
of Bauhinia vahlii Wight & Arn. Saudi journal of biological sciences, 20, 319-325.

265
Stamler J, Vaccaro O, Neaton JD, Wentworth D, Group MRFITR (1993). Diabetes, other risk factors,
and 12-yr cardiovascular mortality for men screened in the Multiple Risk Factor Intervention
Trial. Diabetes care, 16, 434-444.
Stein SA, Lamos EM, Davis SN (2013). A review of the efficacy and safety of oral antidiabetic drugs.
Expert opinion on drug safety, 12, 153-175.
Stolar M (2010). Glycemic control and complications in type 2 diabetes mellitus. The American
journal of medicine, 123, S3-S11.
Strange RW, Antonyuk SV, Hough MA, Doucette PA, Valentine JS, Hasnain SS (2006). Variable
metallation of human superoxide dismutase: atomic resolution crystal structures of Cu–Zn,
Zn–Zn and as-isolated wild-type enzymes. Journal of molecular biology, 356, 1152-1162.
Stratton IM, Adler AI, Neil HaW, Matthews DR, Manley SE, Cull CA, Hadden D, Turner RC,
Holman RR (2000). Association of glycaemia with macrovascular and microvascular
complications of type 2 diabetes (UKPDS 35): prospective observational study. Bmj, 321,
405-412.
Styskal J, Van Remmen H, Richardson A, Salmon AB (2012). Oxidative stress and diabetes: what
can we learn about insulin resistance from antioxidant mutant mouse models? Free Radical
Biology and Medicine, 52, 46-58.
Sudan R, Bhagat M, Gupta S, Singh J, Koul A (2014). Iron (FeII) chelation, ferric reducing
antioxidant power, and immune modulating potential of Arisaema jacquemontii (Himalayan
Cobra Lily). BioMed research international, 2014, 1-7.
Sule O, Elekwa I, Ayalogu E (2012). Effect of Acalypha wilkesiana muell arg. on haematological
parameters in wistar albino rats. International Journal of Biology and Medical Research, 3,
1234-1237.
Swisa A, Glaser B, Dor Y (2017). Metabolic Stress and Compromised Identity of Pancreatic Beta
Cells. Frontiers in genetics, 8, 1-11.
Szablewski L (2011). Glucose homeostasis–mechanism and defects. Diabetes-Damages and
Treatments. InTech, 1-32.
Taher M, Zakaria TMFST, Susanti D, Zakaria ZA (2016). Hypoglycaemic activity of ethanolic
extract of Garcinia mangostana Linn. in normoglycaemic and streptozotocin-induced
diabetic rats. BMC complementary and alternative medicine, 16, 1-12.

266
Taiwo I, Adewumi O, Odeigah P (2012). Assessment of Bridelia ferruginea benth for its therapeutic
potential in pregnancy-induced impaired glucose tolerance in rats. International Journal of
Medicine and Biomedical Research, 1, 49-55.
Takato T, Iwata K, Murakami C, Wada Y, Sakane F (2017). Chronic administration of myristic acid
improves hyperglycemia in the Nagoya-Shibata-Yasuda mouse model of congenital type 2
diabetes. Diabetologia, 60, 1-8.
Tan Y, Chang SK, Zhang Y (2017). Comparison of α-amylase, α-glucosidase and lipase inhibitory
activity of the phenolic substances in two black legumes of different genera. Food chemistry,
214, 259-268.
Tang W, Martin KA, Hwa J (2012). Aldose reductase, oxidative stress, and diabetic mellitus.
Frontiers in pharmacology, 3, 1-8.
Tangvarasittichai S (2015). Oxidative stress, insulin resistance, dyslipidemia and type 2 diabetes
mellitus. World journal of diabetes, 6, 456-480.
Taylor R (2012). Insulin resistance and type 2 diabetes. Diabetes, 61, 778-779.
Telagari M, Hullatti K (2015). In-vitro α-amylase and α-glucosidase inhibitory activity of Adiantum
caudatum Linn. and Celosia argentea Linn. extracts and fractions. Indian journal of
pharmacology, 47, 425-429.
Tesfaye S, Boulton AJ, Dickenson AH (2013). Mechanisms and management of diabetic painful
distal symmetrical polyneuropathy. Diabetes care, 36, 2456-2465.
Thazhath SS, Marathe CS, Wu T, Chang J, Khoo J, Kuo P, Checklin HL, Bound MJ, Rigda RS,
Crouch B (2016). The glucagon-like peptide 1 receptor agonist exenatide inhibits small
intestinal motility, flow, transit, and absorption of glucose in healthy subjects and patients
with type 2 diabetes: a randomized controlled trial. Diabetes, 65, 269-275.
Thazhath SS, Wu T, Young RL, Horowitz M, Rayner CK (2014). Glucose absorption in small
intestinal diseases. Expert review of gastroenterology & hepatology, 8, 301-312.
Thomas RL, Distiller L, Luzio S, Melville V, Roy Chowdhury S, Kramer B, Owens D (2015).
Incidence and progression of diabetic retinopathy within a private diabetes mellitus clinic in
South Africa. Journal of Endocrinology, Metabolism and Diabetes of South Africa, 20, 127-
133.
Tiwari BK, Pandey KB, Abidi A, Rizvi SI (2013). Markers of oxidative stress during diabetes
mellitus. Journal of biomarkers, 2013, 1-8.
Tk L (2012). Edible Medicinal And Non-Medicinal Plants. Volume 4, Fruits, London New York,
Springer Dordreht Heidelberg
267
Tobias DK, Pan A, Jackson CL, O'reilly EJ, Ding EL, Willett WC, Manson JE, Hu FB (2014). Body-
mass index and mortality among adults with incident type 2 diabetes. New England Journal
of Medicine, 370, 233-244.
Toma A, Makonnen E, Mekonnen Y, Debella A, Addisakwattana S (2014). Intestinal α-glucosidase
and some pancreatic enzymes inhibitory effect of hydroalcholic extract of Moringa
stenopetala leaves. BMC complementary and alternative medicine, 14, 1-5.
Trott O, Olson AJ (2010). AutoDock Vina: improving the speed and accuracy of docking with a new
scoring function, efficient optimization, and multithreading. Journal of computational
chemistry, 31, 455-461.
Tundis R, Loizzo M, Menichini F (2010). Natural products as α-amylase and α-glucosidase inhibitors
and their hypoglycaemic potential in the treatment of diabetes: an update. Mini reviews in
medicinal chemistry, 10, 315-331.
Tyagia T, Argawak M (2017). Phytochemical screening and GC-MS analysis of bioactive
constituents in the ethanolic extract of Pistia stratiotes L. and Eichhornia crassipes (Mart.)
solms. Journal of Pharmacognosy and Phytochemistry, 6, 195-206.
Ukpds (1998). Tight blood pressure control and risk of macrovascular and microvascular
complications in type 2 diabetes: UKPDS 38 (UK Prospective Diabetes Study Group). BMJ:
British Medical Journal, 317, 703-713.
Ulbricht C, Seamon E, Windsor RC, Armbruester N, Bryan JK, Costa D, Giese N, Gruenwald J, Iovin
R, Isaac R (2011). An evidence-based systematic review of cinnamon (Cinnamomum spp.)
by the Natural Standard Research Collaboration. Journal of dietary supplements, 8, 378-454.
Ulrich-Merzenich GS (2014). Combination screening of synthetic drugs and plant derived natural
products—Potential and challenges for drug development. Synergy, 1, 59-69.
Valko M, Leibfritz D, Moncol J, Cronin MT, Mazur M, Telser J (2007). Free radicals and antioxidants
in normal physiological functions and human disease. The international journal of
biochemistry & cell biology, 39, 44-84.
Van Andel T, Carvalheiro LG (2013). Why urban citizens in developing countries use traditional
medicines: the case of Suriname. Evidence-Based Complementary and Alternative Medicine,
2013, 1-13.
Van Linthout S, Spillmann F, Schultheiss H-P, Tschope C (2010). High-density lipoprotein at the
interface of type 2 diabetes mellitus and cardiovascular disorders. Current pharmaceutical
design, 16, 1504-1516.
268
Vázquez LH, Palazon J, Navarro-Ocaña A (2012). The Pentacyclic Triterpenes, ,β-amyrins: A
review of sources and biological activities. Phytochemicals-A global perspective of their role
in nutrition and health. InTech, 487-502.
Veeresham C (2012). Natural products derived from plants as a source of drugs. Journal of Advanced
Pharmaceutical Technology & Research, 3, 200-201.
Venugopala KN, Rashmi V, Odhav B (2013). Review on natural coumarin lead compounds for their
pharmacological activity. BioMed research international, 2013, 1-14.
Vianna R, Brault A, Martineau LC, Couture R, Arnason JT, Haddad PS (2011). In vivo anti-diabetic
activity of the ethanolic crude extract of Sorbus decora CK Schneid.(Rosacea): a medicinal
plant used by Canadian James Bay Cree nations to treat symptoms related to diabetes.
Evidence-Based Complementary and Alternative Medicine, 2011, 1-7.
Vijay P, Vimukta S (2014). The role of natural antioxidants in oxidative stress induced diabetes
mellitus. Research Journal of Pharmaceutical Sciences, 3, 1-6.
Vijayalakshmi M, Ruckmani K (2016). Ferric reducing anti-oxidant power assay in plant extract.
Bangladesh Journal of Pharmacology, 11, 570-572.
Vikram A, Tripathi DN, Kumar A, Singh S (2014). Oxidative stress and inflammation in diabetic
complications. International journal of endocrinology, 2014, 1-10.
Volpe CMO, Villar-Delfino PH, Anjos PMF, Nogueira-Machado JA (2018). Cellular death, reactive
oxygen species (ROS) and diabetic complications. Cell death & disease, 9, 1-9.
Von Eckardstein A, Widmann C (2014). High-density lipoprotein, beta cells, and diabetes.
Cardiovascular research, 103, 384-394.
Wais M, Nazish I, Samad A, Beg S, Abusufyan S, Ajaz Ajaj S, Aqil M (2012). Herbal drugs for
diabetic treatment: an updated review of patents. Recent patents on anti-infective drug
discovery, 7, 53-59.
Wajid M, Wajid S, Aslam M, Ahmad M (2017). An Update Review on Ethnomedicinal,
Phytochemical and Pharmacological Profile of genus Boerhavia. International Journal of
Complementary and Alternate Medicine, 6, 00189.
Wallace DC (1992). Diseases of the mitochondrial DNA. Annual review of biochemistry, 61, 1175-
1212.
Wallace TM, Levy JC, Matthews DR (2004). Use and abuse of HOMA modeling. Diabetes care, 27,
1487-1495.
269
Wang J, Huang M, Yang J, Ma X, Zheng S, Deng S, Huang Y, Yang X, Zhao P (2017). Anti-diabetic
activity of stigmasterol from soybean oil by targeting the GLUT4 glucose transporter. Food
& nutrition research, 61, 1-13.
Wang J, Wang H (2017). Oxidative stress in pancreatic beta cell regeneration. Oxidative medicine
and cellular longevity, 2017, 1-9.
WAP (2018). Alstonia boonei De Wild [Online]. Available:
http://www.westafricanplants.senckenberg.de/root/index.php?page_id=14&id=5867
[Accessed 25 September 2018].
Watanabe K, Hata Y, Kizaki H, Katsube Y, Suzuki Y (1997). The refined crystal structure of Bacillus
cereus oligo-1, 6-glucosidase at 2.0 å resolution: structural characterization of proline-
substitution sites for protein thermostabilization 1. Journal of molecular biology, 269, 142-
153.
Weigert C, Brodbeck K, Sawadogo M, Häring HU, Schleicher ED (2004). Upstream Stimulatory
Factor (USF) Proteins Induce Human TGF-β1 Gene Activation via the Glucose-response
Element–1013/–1002 in Mesangial Cells up-regulation of USF activity by the hexosamine
biosynthetic pathway. Journal of Biological Chemistry, 279, 15908-15915.
Welch BJ, Zib I (2004). Case study: diabetic ketoacidosis in type 2 diabetes:“look under the sheets”.
Clinical Diabetes, 22, 198-200.
Weyer C, Funahashi T, Tanaka S, Hotta K, Matsuzawa Y, Pratley RE, Tataranni PA (2001).
Hypoadiponectinemia in obesity and type 2 diabetes: close association with insulin resistance
and hyperinsulinemia. The Journal of Clinical Endocrinology & Metabolism, 86, 1930-1935.
Who (2016). Global report on diabetes. World Health Organization.
http://www.who.int/iris/handle/10665/204871.
Wilcox G (2005). Insulin and insulin resistance. Clinical biochemist reviews, 26, 19-39.
Wilson RD, Islam MS (2012). Fructose-fed streptozotocin-injected rat: an alternative model for type
2 diabetes. Pharmacological Reports, 64, 129-139.
Wing RR, Lang W, Wadden TA, Safford M, Knowler WC, Bertoni AG, Hill JO, Brancati FL, Peters
A, Wagenknecht L (2011). Benefits of modest weight loss in improving cardiovascular risk
factors in overweight and obese individuals with type 2 diabetes. Diabetes care, 34, 1481-
1486.
Wu JH, Foote C, Blomster J, Toyama T, Perkovic V, Sundström J, Neal B (2016). Effects of sodium-
glucose cotransporter-2 inhibitors on cardiovascular events, death, and major safety

270
outcomes in adults with type 2 diabetes: a systematic review and meta-analysis. The lancet
Diabetes & endocrinology, 4, 411-419.
Wu Y-HS, Chiu C-H, Yang D-J, Lin Y-L, Tseng J-K, Chen Y-C (2013). Inhibitory effects of litchi
(Litchi chinensis Sonn.) flower-water extracts on lipase activity and diet-induced obesity.
Journal of Functional Foods, 5, 923-929.
Xu F, Wu H, Wang X, Yang Y, Wang Y, Qian H, Zhang Y (2014). RP-HPLC characterization of
lupenone and β-sitosterol in Rhizoma Musae and evaluation of the anti-diabetic activity of
lupenone in diabetic Sprague-Dawley rats. Molecules, 19, 14114-14127.
Yan L-J (2014). Pathogenesis of chronic hyperglycemia: from reductive stress to oxidative stress.
Journal of diabetes research, 2014, 1-11.
Ye J (2013). Mechanisms of insulin resistance in obesity. Frontiers of medicine, 7, 14-24.
Yeh C-T, Yen G-C (2006). Induction of hepatic antioxidant enzymes by phenolic acids in rats is
accompanied by increased levels of multidrug resistance–associated protein 3 mRNA
expression. The Journal of nutrition, 136, 11-15.
Yehouenou B, Wotto V, Bankole H, Sessou P, Noudogbessi J-P, Sohounhloue D (2010). Chemical
study and antimicrobial activities of volatile extracts from fresh leaves of Crassocephalum
rubens (juss & jack) against food-borne pathogens. Scientific Study & Research: Chemistry
& Chemical Engineering, Biotechnology, Food Industry, 11, 341-349.
Yilmazer-Musa M, Griffith AM, Michels AJ, Schneider E, Frei B (2012). Inhibition of α-amylase
and α-glucosidase activity by tea and grape seed extracts and their constituent catechins.
Journal of agricultural and food chemistry, 60, 8924-8929.
Yin Z, Zhang W, Feng F, Zhang Y, Kang W (2014). α-Glucosidase inhibitors isolated from medicinal
plants. Food Science and Human Wellness, 3, 136-174.
Yki-Järvinen H, Sahlin K, Ren JM, Koivisto VA (1990). Localization of rate-limiting defect for
glucose disposal in skeletal muscle of insulin-resistant type I diabetic patients. Diabetes, 39,
157-167.
Yoshino M, Murakami K (1998). Interaction of iron with polyphenolic compounds: application to
antioxidant characterization. Analytical biochemistry, 257, 40-44.
Yuan H, Ma Q, Ye L, Piao G (2016). The traditional medicine and modern medicine from natural
products. Molecules, 21, 1-18.
Zajac J, Shrestha A, Patel P, Poretsky L (2010). The main events in the history of diabetes mellitus.
Principles of diabetes mellitus. Springer, 3-16.

271
Zeb M, Khan S, Rahman T, Sajid M, Seloni S (2017). Isolation and Biological Activity of β-Sitosterol
and Stigmasterol from the Roots of Indigofera heterantha. Pharm Pharmacol Int J, 5, 204-
207.
Zhang H, Tsao R (2016). Dietary polyphenols, oxidative stress and antioxidant and anti-inflammatory
effects. Current Opinion in Food Science, 8, 33-42.
Zhang Y-J, Gan R-Y, Li S, Zhou Y, Li A-N, Xu D-P, Li H-B (2015). Antioxidant phytochemicals for
the prevention and treatment of chronic diseases. Molecules, 20, 21138-21156.
Zheng Y, Ley SH, Hu FB (2018). Global aetiology and epidemiology of type 2 diabetes mellitus and
its complications. Nature Reviews Endocrinology, 14, 88-98.
Zhou R, Tardivel A, Thorens B, Choi I, Tschopp J (2010). Thioredoxin-interacting protein links
oxidative stress to inflammasome activation. Nature immunology, 11, 136-140.

272
APPENDIX A
ANIMAL ETHICS APPROVAL LETTER
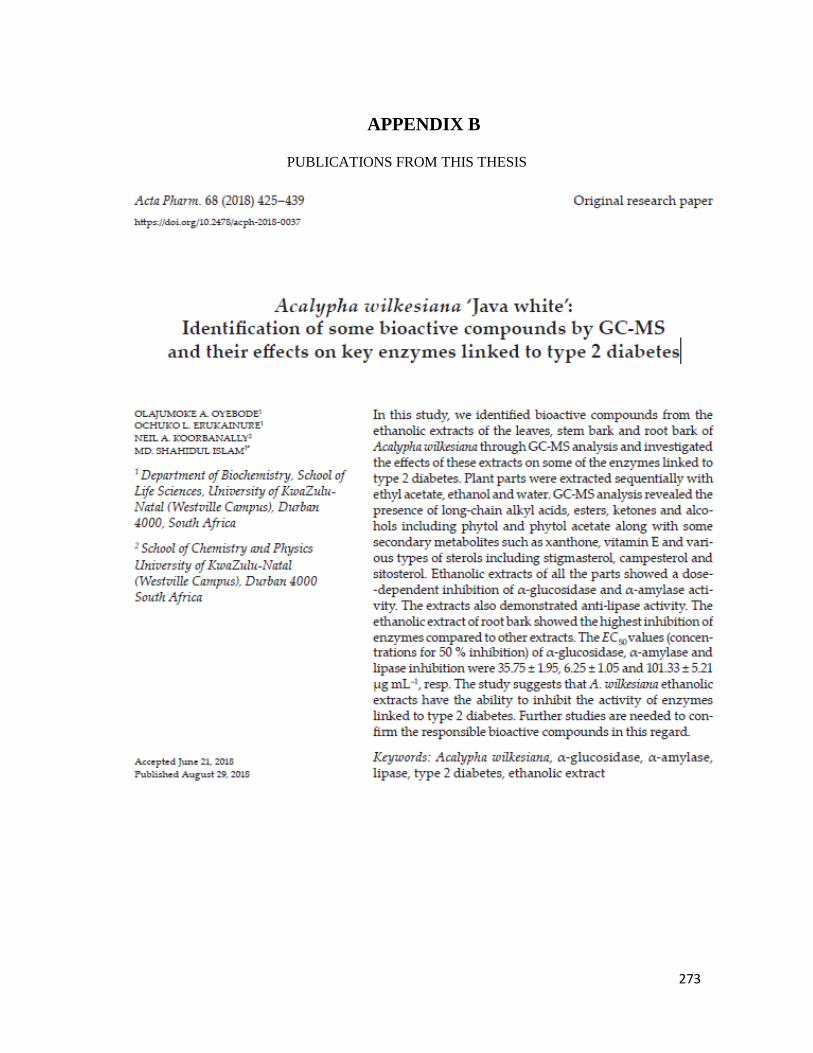
273
APPENDIX B
PUBLICATIONS FROM THIS THESIS
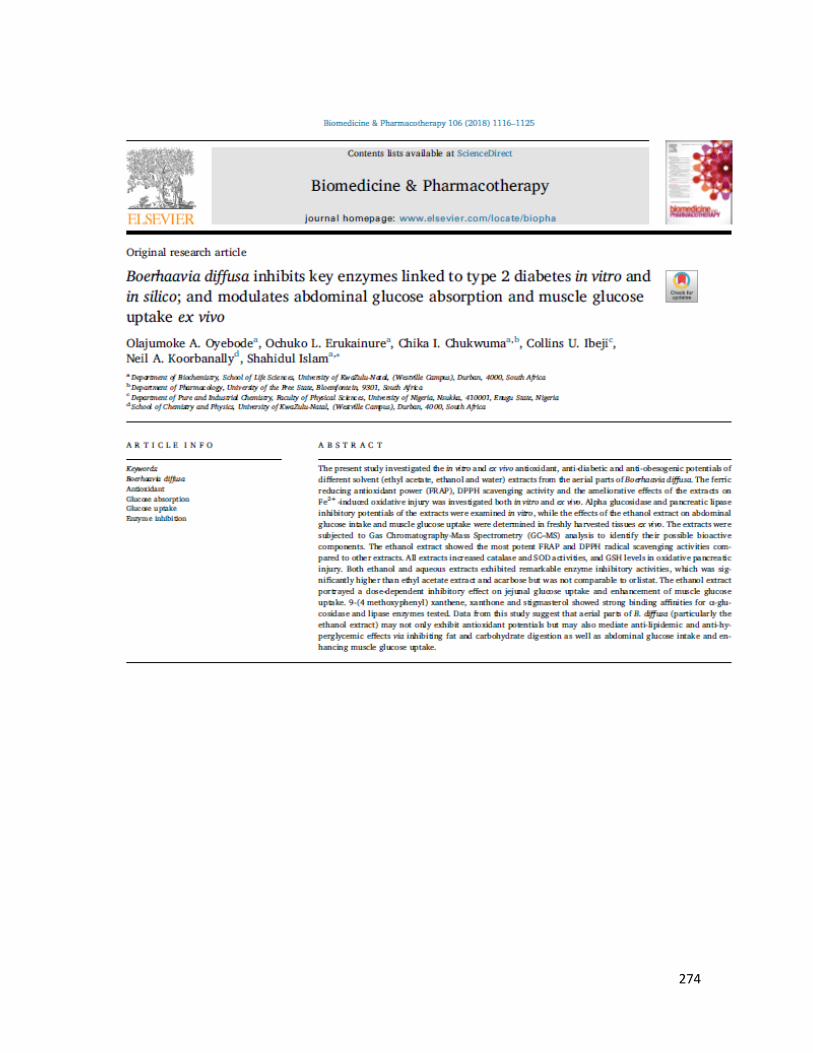
274
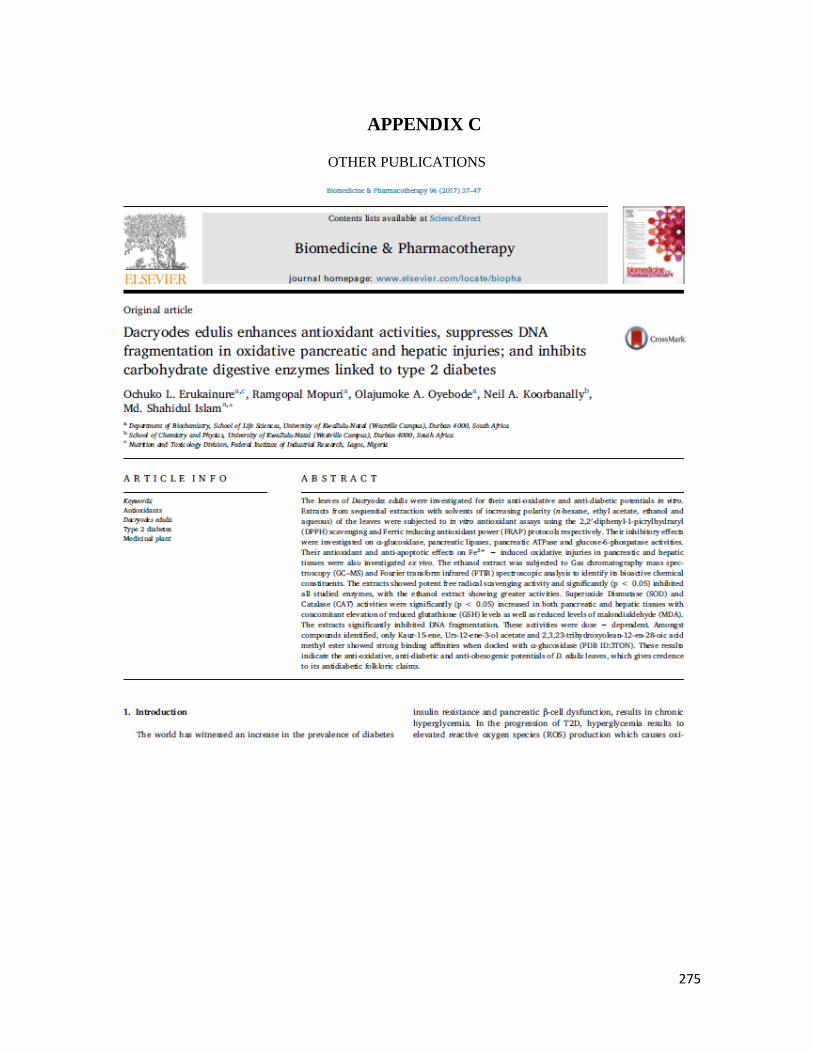
275
APPENDIX C
OTHER PUBLICATIONS
276
277