evaluation of skid measurements used by txdot: technical ... · pdf fileevaluation of skid...
TRANSCRIPT
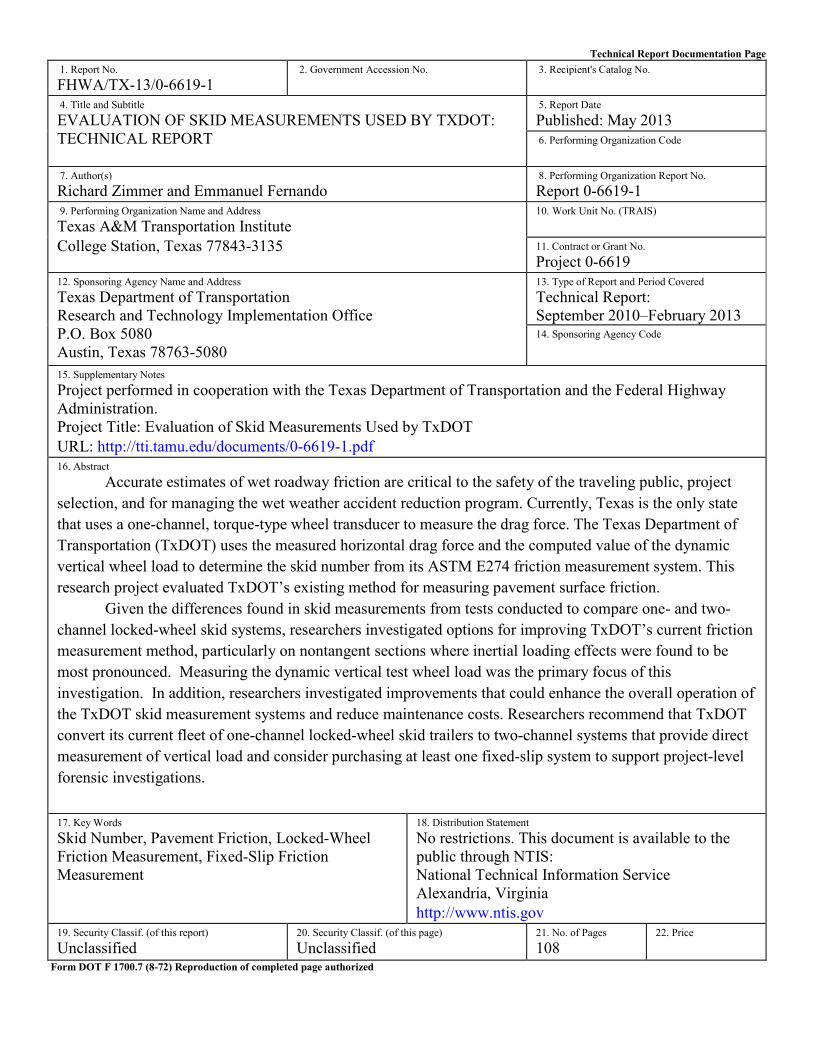
Technical Report Documentation Page 1. Report No. FHWA/TX-13/0-6619-1
2. Government Accession No.
3. Recipient's Catalog No.
4. Title and Subtitle EVALUATION OF SKID MEASUREMENTS USED BY TXDOT: TECHNICAL REPORT
5. Report Date Published: May 2013 6. Performing Organization Code
7. Author(s) Richard Zimmer and Emmanuel Fernando
8. Performing Organization Report No. Report 0-6619-1
9. Performing Organization Name and Address Texas A&M Transportation Institute College Station, Texas 77843-3135
10. Work Unit No. (TRAIS) 11. Contract or Grant No. Project 0-6619
12. Sponsoring Agency Name and Address Texas Department of Transportation Research and Technology Implementation Office P.O. Box 5080 Austin, Texas 78763-5080
13. Type of Report and Period Covered Technical Report: September 2010–February 2013 14. Sponsoring Agency Code
15. Supplementary Notes Project performed in cooperation with the Texas Department of Transportation and the Federal Highway Administration. Project Title: Evaluation of Skid Measurements Used by TxDOT URL: http://tti.tamu.edu/documents/0-6619-1.pdf 16. Abstract
Accurate estimates of wet roadway friction are critical to the safety of the traveling public, project selection, and for managing the wet weather accident reduction program. Currently, Texas is the only state that uses a one-channel, torque-type wheel transducer to measure the drag force. The Texas Department of Transportation (TxDOT) uses the measured horizontal drag force and the computed value of the dynamic vertical wheel load to determine the skid number from its ASTM E274 friction measurement system. This research project evaluated TxDOT’s existing method for measuring pavement surface friction.
Given the differences found in skid measurements from tests conducted to compare one- and two-channel locked-wheel skid systems, researchers investigated options for improving TxDOT’s current friction measurement method, particularly on nontangent sections where inertial loading effects were found to be most pronounced. Measuring the dynamic vertical test wheel load was the primary focus of this investigation. In addition, researchers investigated improvements that could enhance the overall operation of the TxDOT skid measurement systems and reduce maintenance costs. Researchers recommend that TxDOT convert its current fleet of one-channel locked-wheel skid trailers to two-channel systems that provide direct measurement of vertical load and consider purchasing at least one fixed-slip system to support project-level forensic investigations.
17. Key Words Skid Number, Pavement Friction, Locked-Wheel Friction Measurement, Fixed-Slip Friction Measurement
18. Distribution Statement No restrictions. This document is available to the public through NTIS: National Technical Information Service Alexandria, Virginia http://www.ntis.gov
19. Security Classif. (of this report) Unclassified
20. Security Classif. (of this page) Unclassified
21. No. of Pages 108
22. Price
Form DOT F 1700.7 (8-72) Reproduction of completed page authorized


EVALUATION OF SKID MEASUREMENTS USED BY TXDOT: TECHNICAL REPORT
by
Richard Zimmer Senior Research Specialist
Texas A&M Transportation Institute
and
Emmanuel Fernando Senior Research Engineer
Texas A&M Transportation Institute
Report 0-6619-1 Project 0-6619
Project Title: Evaluation of Skid Measurements Used by TxDOT
Performed in cooperation with the Texas Department of Transportation
and the Federal Highway Administration
Published: May 2013
TEXAS A&M TRANSPORTATION INSTITUTE College Station, Texas 77843-3135


v
DISCLAIMER
This research was performed in cooperation with the Texas Department of Transportation (TxDOT) and the Federal Highway Administration (FHWA). The contents of this report reflect the views of the authors, who are responsible for the facts and the accuracy of the data presented herein. The contents do not necessarily reflect the official view or policies of the FHWA or TxDOT. This report does not constitute a standard, specification, or regulation, nor is it intended for construction, bidding, or permit purposes. The United States Government and the State of Texas do not endorse products or manufacturers. Trade or manufacturers’ names appear herein solely because they are considered essential to the object of this report.
vi
ACKNOWLEDGMENTS
This project was conducted in cooperation with TxDOT and FHWA. The authors gratefully acknowledge Dr. Magdy Mikhail of the Pavement Preservation Section of TxDOT’s Maintenance Division for his steadfast support and guidance as technical director of this project. In addition, the authors thank the members of the project monitoring committee for their helpful suggestions and support of the field tests conducted to compare friction measurements between different friction testers. In particular, the authors acknowledge the assistance provided by Mr. John Wirth of TxDOT for collecting skid measurements with TxDOT’s locked-wheel skid trailer, providing available skid numbers, which researchers used to identify candidate test sections for the field experiment conducted in this project, and providing technical information on TxDOT’s existing skid measurement systems to identify options for improving the current systems. The authors are also grateful for the cooperation extended by Transtec and Dynatest in the comparative evaluation of locked-wheel and fixed-slip friction measurement systems conducted in this project. Finally, the authors acknowledge the technical support provided by Dr. Chang-Seon Shon, who collected circular track meter (CTM) and dynamic friction tester (DFT) measurements on pavement test sections during this project; Gerry Harrison, for his assistance in collecting profile measurements; and Robert Kochman, for his assistance in collecting friction measurements with the Texas A&M Transportation Institute’s locked-wheel skid trailer.

vii
TABLE OF CONTENTS
Page List of Figures ............................................................................................................................... ix List of Tables ................................................................................................................................ xi Chapter I. Introduction ................................................................................................................ 1
Research Objectives .................................................................................................................... 2 Research Work Plan .................................................................................................................... 2
Chapter II. Literature Review ..................................................................................................... 5 One-Channel vs. Two-Channel ASTM E274 Systems ............................................................... 5 Skid Number Uncertainty in Tangent Sections .......................................................................... 7 Alternate Friction Measurement Equipment ............................................................................... 8
Chapter III. Design of Field Experiment .................................................................................... 9 Introduction ................................................................................................................................. 9 Initial Field Tests on Candidate Pavement Sections ................................................................... 9 Review of Results from Initial Field Tests ............................................................................... 15 Proposed Test Matrix ................................................................................................................ 25 Development of Methodology for Field Testing ...................................................................... 25
Chapter IV. Comparative Evaluation of One- vs. Two-Channel Locked-Wheel Skid Systems ......................................................................................................................................... 29
Introduction ............................................................................................................................... 29 Use of TTI ASTM E274 System to Acquire Data for Comparing One- and Two-Channel Skid Numbers............................................................................................................................ 30 Tangent Sections ....................................................................................................................... 31
Rough Tangent Sections ....................................................................................................... 33 Pavement Cross-Slope in Tangent Section ........................................................................... 35
Grade Changes .......................................................................................................................... 42 Discussion of Test Results ........................................................................................................ 45
Chapter V. Comparative Evaluation of Locked-Wheel and Fixed Slip Skid Systems ......... 51 Test Sections ............................................................................................................................. 51 Data Collection ......................................................................................................................... 52 Comparison of HFT and Locked-Wheel Friction Numbers ..................................................... 60 Evaluation of International Friction Indices ............................................................................. 67 Summary of Findings ................................................................................................................ 77 Implication of Test Findings ..................................................................................................... 78
Chapter VI. Investigation of Improvement Options and Recommendations ....................... 79 Introduction ............................................................................................................................... 79 Option 1: Inertial Measurements .............................................................................................. 79 Option 2: Apply Strain Gages ................................................................................................... 83 Option 3: Direct Measurement of Test Wheel Forces .............................................................. 84
Option 3: Plan A .................................................................................................................. 84 Option 3: Plan B................................................................................................................... 85 Option 3: Plan C................................................................................................................... 87 Option 3: Plan D .................................................................................................................. 89
Recommended Option for Improving Existing Skid Systems .................................................. 90

viii
Accuracy of Commercial E274 Systems .............................................................................. 91 Differences between TxDOT and Commercial E274 Systems ............................................. 91 Compatibility of Replacement Units .................................................................................... 92
Summary of Recommendations ................................................................................................ 94 References .................................................................................................................................... 97
ix
LIST OF FIGURES
Page Figure 1. Forces and Moment Acting on an E274 Skid Trailer. .................................................... 6 Figure 2. Comparison of Vertical Forces Determined from Load Cell and Accelerometer
Measurements (Zimmer and Tonda, 1983). ............................................................................ 7 Figure 3. Instrument Used to Measure Vertical and Lateral Accelerations. ................................ 12 Figure 4. Photo of RadiusMeter for Measuring Radius of Curvature.......................................... 13 Figure 5. SurPRO Reference Profiler Used to Determine Grade Change Profile. ...................... 14 Figure 6. SurPRO Data on Section G5 Showing Longitudinal Grade Change. .......................... 14 Figure 7. Measured Vertical Accelerations on Tangent Section T1. ........................................... 15 Figure 8. Measured Lateral Accelerations on Tangent Section T1. ............................................ 16 Figure 9. Longitudinal Profile from SurPRO Run on Tangent Section T1. ................................ 16 Figure 10. Average Vertical Accelerations on Section T1 Computed over a 1-second
Moving Time Window. ......................................................................................................... 18 Figure 11. Measured Lateral Accelerations on Curve Section. ................................................... 19 Figure 12. Average Accelerations on Riverside Curve Section Computed over a 1-
second Moving Time Window. ............................................................................................. 20 Figure 13. Dynamic Forces Created by a Horizontal Curve. ....................................................... 21 Figure 14. Dynamic Forces Created by a Superelevated Curve. ................................................. 22 Figure 15. Average Accelerations on SH6 Curve Section (C19) Computed over a 1-
second Moving Time Window. ............................................................................................. 23 Figure 16. Differences between Skid Numbers from 1- and 2-Channel Systems for Four
Roadway Geometric Conditions. .......................................................................................... 26 Figure 17. TTI E274 Friction Measurement System. .................................................................. 29 Figure 18. Example of Graphical Data from the TTI Two-Channel E274 System. .................... 31 Figure 19. Comparison between Skid Numbers from TTI Two-Channel and TxDOT
One-Channel Systems on Tangent Pavements. .................................................................... 33 Figure 20. Left and Right Wheel Path Profiles on Section T1 along SH47. ............................... 35 Figure 21. Measurement of the TxDOT E274 Trailer Center-of-Gravity. ................................. 40 Figure 22. Differences in Skid Number Due to Acceleration on Horizontal Curves. ................. 41 Figure 23. Analysis of a Curved and Banked Section. ................................................................ 42 Figure 24. Graphical Determination of Radius of Vertical Curve on Section G5. ...................... 44 Figure 25. Differences in Skid Number Due to Acceleration on Vertical Curves. ..................... 46 Figure 26. Aerial View of Skid Test Pads. .................................................................................. 54 Figure 27. Aerial Photo of Field Test Sections West of Bryan/College Station. ......................... 55 Figure 28. Aerial Photo Showing Sections T27 and G26 Southeast of College Station. ............ 56 Figure 29. Example Pictures of Surfaces Tested. ........................................................................ 57 Figure 30. Dynatest 6875H Fixed-Slip Skid System. .................................................................. 58 Figure 31. Dynatest 6875H Wheel Assembly with Test Tire. ..................................................... 59 Figure 32. Differences between TTI Locked-Wheel and HFT Friction Numbers. ..................... 62 Figure 33. Comparison of TxDOT Locked-Wheel SNs and HFT Friction Numbers. ................ 63 Figure 34. Comparison of TTI Locked-Wheel SNs and HFT Friction Numbers. ....................... 63 Figure 35. Comparison of TxDOT and TTI Locked-Wheel Skid Numbers. ............................... 65 Figure 36. Comparison of PennDOT Locked-Wheel SNs with HFT Friction Numbers............. 66
x
Figure 37. Comparison of Locked-Wheel and Fixed-Slip Friction Numbers from Penn State Study by Shah and Henry (1976). ................................................................................ 68
Figure 38. Average MPDs Determined from CTM Measurements on Each Section. ................. 72 Figure 39. Average of DFT20 Values from DFT Measurements Made on Each Section. .......... 73 Figure 40. Comparison of Calibrated F60 Values (TTI Locked-Wheel vs. HFT). ..................... 76 Figure 41. Comparison of Calibrated F60 Values (TxDOT Locked-Wheel vs. HFT). ............... 76 Figure 42. Accelerometer Unit Mounted on TTI E274 System................................................... 81 Figure 43. Measured Lateral (Top) and Vertical (Bottom) Trailer Accelerations on
Smooth Horizontal Curve. .................................................................................................... 82 Figure 44. Measured Lateral (Top) and Vertical (Bottom) Trailer Accelerations on
Rough Tangent Section. ........................................................................................................ 82 Figure 45. Proposed Modification to Existing Axle (Option 3: Plan A). .................................... 84 Figure 46. ICC ASTM E274 Trailer. ........................................................................................... 86 Figure 47. New ASTM E274 Skid Measurement System. .......................................................... 88 Figure 48. Illustration of VAMOS Data File. .............................................................................. 94
xi
LIST OF TABLES
Page Table 1. Preliminary Matrix of Pavement Variables for Field Experiment. .................................. 9 Table 2. List of Candidate Test Sections. .................................................................................... 10 Table 3. Summary of Candidate Pavement Section Characteristics. ........................................... 24 Table 4. Proposed Matrix of Test Conditions. ............................................................................. 26 Table 5. Comparison of SNs from TTI and TxDOT E274 Systems. ........................................... 27 Table 6. Summary of 108 Test Runs on Smooth Tangent Pavements......................................... 32 Table 7. Summary of Test Results on Highway Tangent Sections. ............................................. 34 Table 8. Measured Cross-Slopes on Tangent Sections. ............................................................... 36 Table 9. Summary of Data Collected from Horizontal Curve Testing. ....................................... 38 Table 10. Measured Superelevations on Horizontal Curve Sectionsa. ........................................ 38 Table 11. Summary of Data Collected on Vertical Curves. ........................................................ 43 Table 12. Test Sections for Locked-Wheel and Fixed-Slip Comparative Evaluation. ................ 53 Table 13. Setup of HFT Runs on Test Sections. .......................................................................... 59 Table 14. Locked-Wheel Skid Numbers and HFT Friction Numbers from Tests. ...................... 61 Table 15. Goodness-of-Fit Statistics from Regression of Locked-Wheel and HFT
Friction Numbers. ................................................................................................................. 64 Table 16. Results from Regression Analysis with Intercept Term Set to Zero. .......................... 66 Table 17. MPD and DFT20 Values Determined from CTM and DFT Tests. ............................. 69 Table 18. Data for Determining IFI Calibration Constants. ........................................................ 74 Table 19. IFI Calibration Constants from Linear Regression Analysis. ...................................... 74 Table 20. Calculated IFI Values from Data Collected on Test Sections. .................................... 75 Table 21. US Vendors of ASTM E274 Friction Measurement Systems. .................................... 90


1
CHAPTER I. INTRODUCTION
Accurate estimates of wet roadway friction are critical to the safety of the traveling public, project selection, and for managing the wet weather accident reduction program. To accurately measure roadway friction the Federal Highway Administration (FHWA) and the American Society for Testing and Materials (ASTM) under took a program in the 1960s to develop a device, consisting of a truck and trailer, which would measure wet, locked-wheel friction using a standard test method which evolved into ASTM E274 (ASTM, 2012). Since its inception, this standard has been continuously reviewed and improved by ASTM committee E17, but the original simple concept remains, i.e., tow a skid trailer at constant speed, spray water ahead of a standard test tire on the trailer, lock that tire for about two seconds, and measure the forces generated during the slide. An onboard computer then solves for the coefficient of friction µ which, from high school physics, is defined as the drag force divided by the effective wheel load. The resulting ratio is multiplied by 100 to arrive at the skid number (SN) or friction number (FN) of the pavement tested.
Currently, Texas is the only state that uses a one-channel, torque-type wheel transducer to measure the drag force. All other states use ASTM E274 friction measurement systems that directly measure and record both the horizontal drag force and vertical wheel load of the test tire during the locked wheel test. The data are usually collected at 100 to 500 values per second and subsequently averaged over one second during the stable part of the skid test. This process produces one average value for SN per test.
The Texas Department of Transportation (TxDOT) uses the measured horizontal drag force and the computed value of the dynamic vertical wheel load to determine the skid number from its ASTM E274 friction measurement system. ASTM E274 permits this method of determining the skid number, and provides an equation for computing the dynamic vertical wheel load, which is presented later in this report. The method works well on tangent, flat sections of roadway as proven annually at the Texas A&M Transportation Institute (TTI) Field Test and Evaluation Center. During these evaluations, TxDOT’s skid trailer and TTI’s national reference E274 system show a high degree of correlation. However, the method does not account for inertial forces acting on the trailer while in a curve, grade change, or on pavement sections that exhibit long and short wavelength roughness. For example, a left hand curve with little superelevation will decrease the left wheel load whereas the same curve with proper superelevation would increase the wheel load. Both of these conditions produce SN values that are inaccurate to some degree on one-channel locked-wheel skid systems.
It is important that these inaccuracies be well understood and to assess the degree of uncertainty they introduce in certain friction measurements. If the inaccuracies exceed an acceptable level, it would be prudent to identify and recommend methods to reduce or eliminate them.

2
RESEARCH OBJECTIVES
This research project aims to evaluate TxDOT’s existing method for measuring pavement surface friction. If this evaluation finds that significant errors in skid measurement occur under certain roadway conditions, the project will then investigate available options to improve the accuracy of skid measurements and provide recommendations on how TxDOT can upgrade to a better, more robust friction measurement system applicable for the range of roadway geometric conditions found in practice.
To accomplish these objectives, TxDOT divided the research project into two phases. Phase I focuses on evaluating the errors produced when a calculated vertical wheel load is used to determine the skid number as opposed to using a measured value. This phase aims to assess the magnitude of the error and to identify roadway geometric conditions under which this error becomes significant.
If Phase I finds it necessary to improve the accuracy of the current friction measurement system, the project will move forward to Phase II and investigate options by which TxDOT can improve its friction measurement capability. Phase II will provide recommendations on how this improvement can be achieved considering acquisition cost, potential down time while equipment upgrades are being made, operational cost, availability of technical support, compatibility with existing programs to provide data for pavement management, and overall ease of implementation.
RESEARCH WORK PLAN
To accomplish the project objectives, researchers carried out a comprehensive work plan that covered the following tasks:
• Conducted a literature review of past projects that investigated the accuracy of one-channel locked-wheel skid systems and to identify suitable alternative methods for measuring pavement friction.
• Developed a test plan for collecting data to investigate differences between one- and two-channel locked-wheel skid measurement systems.
• Conducted full-scale field tests to collect data for comparing skid numbers between a one-channel (torque) system such as the one used by TxDOT and a two-channel system representative of those in current production.
• Analyzed the experimental data from the field tests to determine the magnitudes of the differences in skid numbers between one- and two-channel systems and to identify conditions under which the differences are significant.

3
• Conducted a comparative evaluation of locked-wheel and fixed-slip systems to collect additional information for developing recommendations on steps TxDOT can take to improve the department’s friction measurement capability.
• Identified options and provided recommendations for improving TxDOT’s current method of collecting skid data to support pavement management activities based on findings from the comparative field evaluations.
The following chapters of this report document each of the tasks conducted in this project.


5
CHAPTER II. LITERATURE REVIEW
Researchers reviewed past research in the vast field of pavement friction testing with primary focus on identifying any issues with the current ASTM E274 one-channel torque method used by TxDOT. This review also aimed to identify options for modifying TxDOT’s skid trailer to directly or indirectly measure dynamic vertical wheel loads. In addition, researchers reviewed other friction measurement systems to consider possible replacements for TxDOT’s locked-wheel skid system.
ONE-CHANNEL VS. TWO-CHANNEL ASTM E274 SYSTEMS
Currently, Texas is the only state that uses the one-channel (drag force), torque-type wheel transducer skid system. Until recently, Indiana used this system but has since upgraded to a two-channel (drag force and vertical load) system as used in 38 other states and Puerto Rico (Henry, 2000). The torque-type wheel transducer is permitted in paragraph 4.5.3 of ASTM E274/E274M-11 (ASTM, 2012). Also, paragraph 9.2 states that “where the vertical wheel load is not measured directly, the wheel load W depends on the kinematic layout of the trailer and on the friction force. Wheel load reduction due to unloading produced by the friction force must be taken into account and the following formula used:
SN= (F/W) × 100 (2.1)
where, W = W0 − (H/L) F. F = tractive force. W0 = static vertical load on the test tire. H = hitch height. L = trailer wheel base (center of axle to center of hitch).”
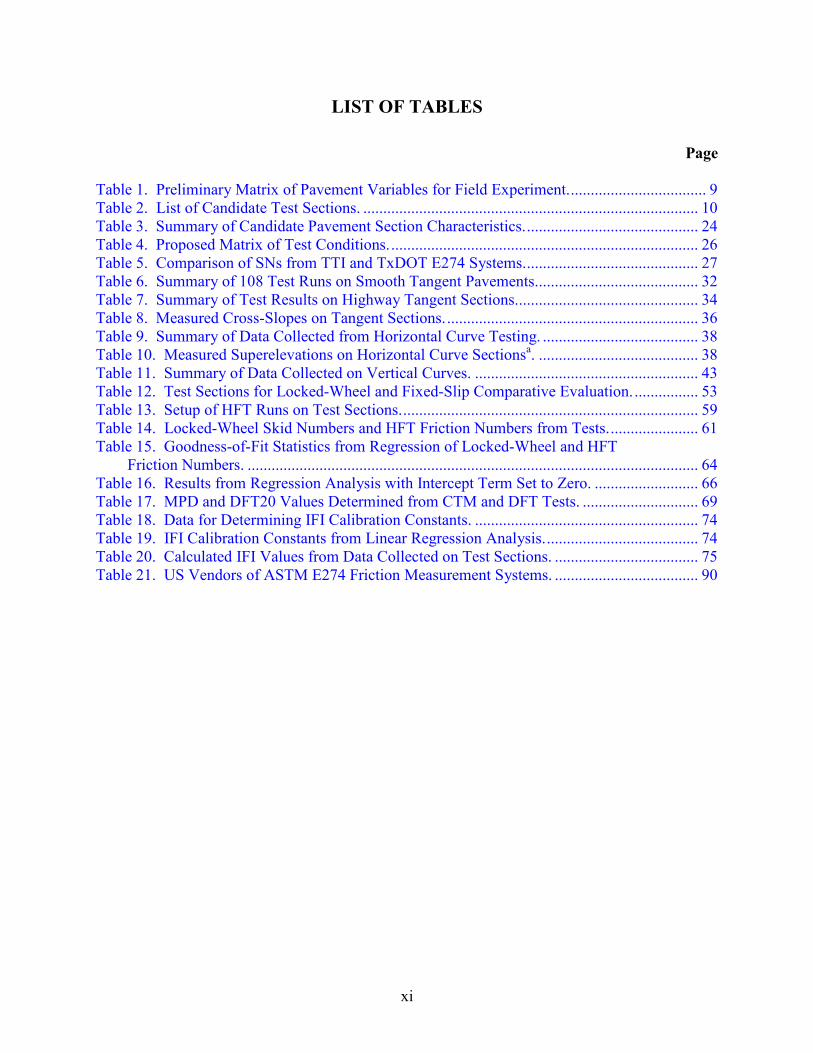
The above equation is based on the tendency of the skid trailer to rotate about the hitch point M when the brakes are locked and the trailer is being towed at a constant velocity by the tow truck. The unloading produced by the friction force is accounted for as a reduction in wheel load W as illustrated in Figure 1.
6
Figure 1. Forces and Moment Acting on an E274 Skid Trailer.
ASTM E274 does not address any limitations on measuring pavement friction within the scope of paragraph 9.2. Since one-channel ASTM E274 systems that calculate vertical test tire load were slowly replaced in the 1970s and 1980s with two-channel systems that measured both the drag force and vertical load, current literature does not address the single-channel, torque method, be it good or bad.
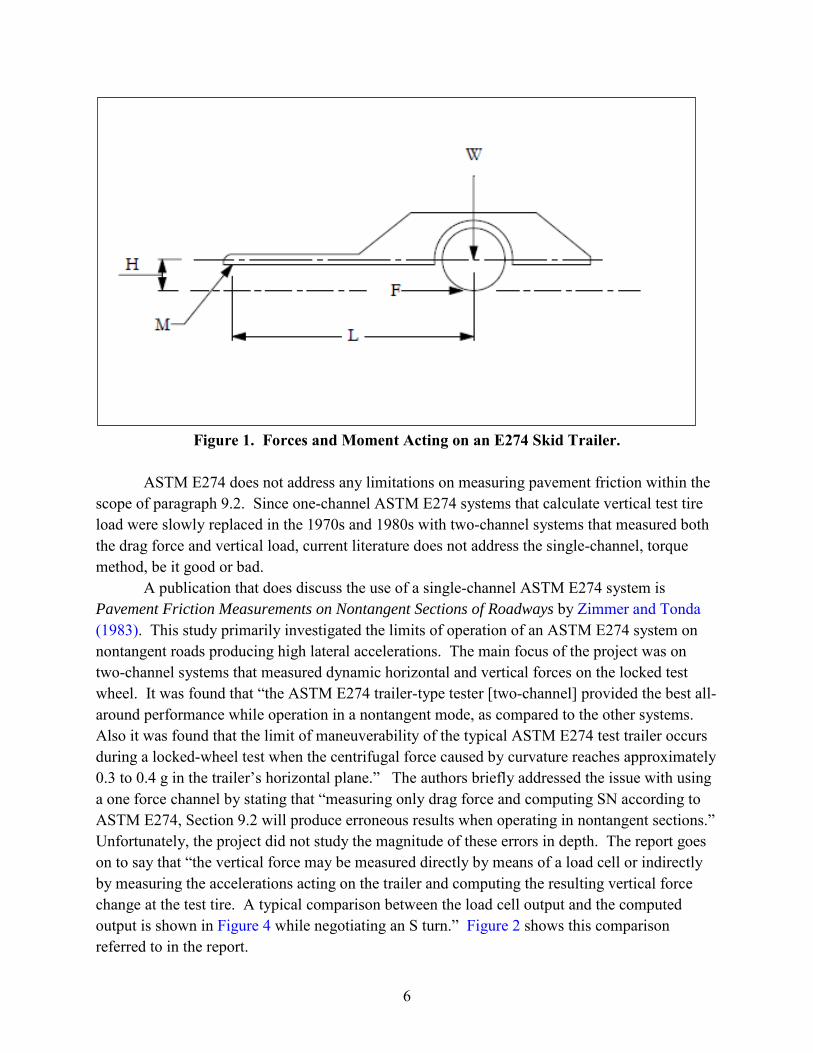
A publication that does discuss the use of a single-channel ASTM E274 system is Pavement Friction Measurements on Nontangent Sections of Roadways by Zimmer and Tonda (1983). This study primarily investigated the limits of operation of an ASTM E274 system on nontangent roads producing high lateral accelerations. The main focus of the project was on two-channel systems that measured dynamic horizontal and vertical forces on the locked test wheel. It was found that “the ASTM E274 trailer-type tester [two-channel] provided the best all-around performance while operation in a nontangent mode, as compared to the other systems. Also it was found that the limit of maneuverability of the typical ASTM E274 test trailer occurs during a locked-wheel test when the centrifugal force caused by curvature reaches approximately 0.3 to 0.4 g in the trailer’s horizontal plane.” The authors briefly addressed the issue with using a one force channel by stating that “measuring only drag force and computing SN according to ASTM E274, Section 9.2 will produce erroneous results when operating in nontangent sections.” Unfortunately, the project did not study the magnitude of these errors in depth. The report goes on to say that “the vertical force may be measured directly by means of a load cell or indirectly by measuring the accelerations acting on the trailer and computing the resulting vertical force change at the test tire. A typical comparison between the load cell output and the computed output is shown in Figure 4 while negotiating an S turn.” Figure 2 shows this comparison referred to in the report.
7
Figure 2. Comparison of Vertical Forces Determined from Load Cell and Accelerometer
Measurements (Zimmer and Tonda, 1983).
SKID NUMBER UNCERTAINTY IN TANGENT SECTIONS
In order to determine if skid number variations in nontangent sections are significant, it is important to know the typical variations or uncertainty in skid number measurements on tangent sections with both the one-channel and two-channel ASTM E274 systems. Section 12 of ASTM E274/E274M-11 defines the expected precision and bias of a properly operating ASTM E274 system. This section states that “the relationship of observed SN units to some “true” value of locked-wheel sliding friction has not been established at this time” (ASTM, 2012). Unfortunately, this statement does not give much guidance. However, Section 12 goes on to say that “the acceptable precision of SN units can be stated in the form of repeatability.” This acceptable repeatability is defined as a standard deviation of 2 SN units, which is comparable to the findings given in NCHRP Web-Only Document 142, where standard deviations of 2.87 for hot-mix asphalt and 1.56 for other surfaces were reported by Azari and Lutz (2009).
Based on data from annual correlations of the TxDOT ASTM E274 system, and the Central/Western Area Reference Friction Measurement System (ARFMS) at the TTI Proving Ground, Menges and Zimmer (2009) found that in tangent testing on various surfaces and at different test speeds, the overall difference between the TxDOT system and the ARFMS ranged
8
between −0.88 SN and 0.90 SN with a pooled standard deviation of 1.17 for the TxDOT system. These values were used as guidelines during the nontangent testing and data analysis phase of this project.
ALTERNATE FRICTION MEASUREMENT EQUIPMENT
Should the TxDOT E274 systems be found to have irresolvable issues, the solution may be to replace the existing systems with new ASTM E274 systems or other pavement friction measurement equipment that would meet TxDOT’s future requirements. FHWA (2010) has issued Technical Advisory T 5040.38, which issues guidance to state and local highway agencies in management of pavement surface friction on roadways. Section 10 of the Advisory states that “the locked-wheel method and the fixed-slip method are recommended as appropriate methods for evaluating pavement friction on US highways.”
Table 1 of NCHRP Synthesis 291 (Henry, 2000) lists 23 devices, worldwide, that measure pavement friction. Seven of these devices measure locked-wheel friction, and five measure fixed-slip. Only one locked-wheel device, the ASTM E274 skid trailer, is produced and used in the United States. Also, only one fixed-slip device is produced in the US. Fixed-slip devices operate at a constant slip, usually between 10 and 20 percent of forward speed. This test more closely replicates the action of modern vehicles in an anti-lock braking situation. In the past, the US fixed-slip testers have been used exclusively in airport runway evaluations. However, Dynatest is now marketing the model 6875H fixed-slip system for highway use. This unit is a standard pickup truck with a water tank, a test wheel, and drive mechanism located under the bed. A data system located in the cab records the friction values. The equipment operator can set the friction test to be intermittent, as with the ASTM E274 system, or continuous, as long as the water lasts. The price of the fixed-slip friction tester is comparable to a new, commercially produced, ASTM E274 system. The 6875H is currently used by one state and the FHWA.
9
CHAPTER III. DESIGN OF FIELD EXPERIMENT
INTRODUCTION
This task focused on developing a plan for testing pavement sections to collect data with which to investigate differences between single- and dual-channel skid measurement systems. In developing the test plan, researchers considered the pavement variables identified in the preliminary test matrix given in the research proposal. As shown in Table 1, the pavement variables initially considered in planning the field experiment were pavement friction, roughness, longitudinal grade changes, and road curvature.
Table 1. Preliminary Matrix of Pavement Variables for Field Experiment.
Pavement Friction
Pavement Roughness
Longitudinal Grade Changes Road Curvature* None Gradual Severe Medium Sharp
Low Smooth X X X
Medium-smooth Rough X X X
Medium Smooth X X X
Medium-smooth Rough X X X
High Smooth X X X
Medium-smooth Rough X X X
*Straight tangent sections are the same as sections with no longitudinal grade changes.
To better define test conditions under which significant errors in calculated skid numbers might arise due to inaccuracies in vertical load measurements, researchers collected test data on 29 candidate pavement sections located within the Bryan District. Based on the data from these initial tests, researchers proposed a revised test matrix to guide the field experiments for the comparative evaluation of skid numbers between single- and dual-channel locked-wheel skid systems. This chapter documents the efforts made to develop this test matrix.
INITIAL FIELD TESTS ON CANDIDATE PAVEMENT SECTIONS
Researchers initially identified a number of candidate pavement sections located on tangents, road curves, and areas of longitudinal grade changes. Table 2 lists these candidate sections on which the following data were collected.

10
Table 2. List of Candidate Test Sections.
Road Section Type/ID GPS Coordinates at Start Point Comment Latitude (N) Longitude (W)
SH47 Tangent/T1 30° 36.8564′ 96° 25.1588′ NB outside lane near Leonard Road intersection sign.
SH47 Tangent/T2 30° 37.9735′ 96°26.5554′ NB outside lane at Silver Hill Road junction.
Goodson Bend Grade change/G3 30° 38.1831′ 96° 27.6557′ WB outside lane.
Goodson Bend Grade change/G4 30° 38.0938′ 96° 27.7668′ WB outside lane.
Silver Hill Grade change/G5 30° 38.3814′ 96° 26.7798′ NB outside lane on hill top.
FM50 Curve/C6 30° 42.1853′ 96° 33.0418′ SB outside lane near Brazos County Line.
FM50 Curve/C8 30° 43.9060′ 96° 33.6297′ SB outside lane near Mumford City sign. Ends at 45 mph curve sign.
OSR Grade change/G9 30° 43.1266′ 96° 28.8542′ WB outside lane.
OSR Grade change/G10 30° 42.8210′ 96° 29.0217′ WB outside lane near St. Joseph Athletic Complex.
Pleasant Hill Road Curve/C11 30° 39.6180′ 96° 25.8537′ NB outside lane going
towards SH21. Pleasant
Hill Road Curve/C12 30° 39.6018′ 96° 25.7896′ NB outside lane going towards SH21.
FM159 Curve/C13 30° 24.1374′ 96° 10.1734′ NB outside lane going to Millican near White Switch Road.
SH6a Grade change/G14 30° 20.0026′ 96° 2.8636′
SB outside lane on PFC project south of Navasota in Grimes County beside Grassy Creek Mobile Home Park.
SH6a Grade change/G15 30° 19.5161′ 96° 2.8500′
SB outside lane on PFC project south of Navasota in Grimes County just past ranch entrance on other side of highway.
SH6a Curve/C16 30° 18.7784′ 96° 2.8774′
SB outside lane on PFC project south of Navasota in Grimes County. Utility pole with orange top on other side of road at start of section. End of section close to Whitehall sign.
SH6a Tangent/T17 30° 17.9257′ 96° 2.7255′
NB outside lane on PFC project south of Navasota in Grimes County. Section begins at North 6 Texas sign.

11
Table 2. List of Candidate Test Sections (continued).
Road Section Type/ID GPS Coordinates at Start Point Comment Latitude (N) Longitude (W)
SH6a Tangent/T18 30° 15.7610′ 96° 2.5292′
NB outside lane on PFC project south of Navasota in Grimes County. Section begins at culvert.
SH6a Curve/C19 30° 16.0441′ 96° 2.4549′
NB outside lane on PFC project south of Navasota in Grimes County. Section begins just north of bridge and ends just before Camp Allen sign.
FM2 Grade change/G20 30° 16.4254′ 96° 1.6321′ EB outside lane on hill top. Seal coat surface.
FM2 Grade change/G21 30° 16.5093′ 95° 59.2285′ EB outside lane on road sag near culvert.
FM362 Curve/C22 30° 17.9265′ 95° 58.3320′ NB outside lane at Whitehall. Section starts at historical marker sign.
FM362 Curve/C23 30° 18.0661′ 95° 58.4136′ NB outside lane at Whitehall. Section starts before culvert.
FM149 Grade change/G24 30° 29.6771′ 95° 58.7803′ EB outside lane on top of hill. FM149 Grade change/G25 30° 29.7821′ 95° 58.4739′ EB outside lane on top of hill.
SH30 Grade change/G26 30° 35.2923′ 95° 57.3361′ WB outside lane on recently placed PFC surface on road sag.
SH6 Tangent/T27 30° 27.7500′ 96° 9.0340′ NB outside lane. CRCP section begins just north of TRM606.
Annex Curve/C28 30° 38.0756′ 96° 28.5351′ JPCP section identified as Curve 1 on Riverside map.
Annex Curve/C29 30° 38.0161′ 96° 28.8752′ JPCP section along runway 28 identified as Curve 3 on Riverside map.
Annex Curve/C30 30° 37.4197′ 96° 28.7716′ JPCP section along Taxi 7 identified as Curve 4 on Riverside map.
Annex Curve/C31 30° 37.9148′ 96° 28.7474′ JPCP section identified as Curve 2 on Riverside map.
SH47 Curve/C33 30° 35.4547′ 96° 22.9287′ Ramp from SH47 to FM60. SH47 Curve/C34 30° 35.5617′ 96° 22.6604′ Ramp from FM60 to SH47.
a PFC section located within a rehabilitation project completed in October 2010.
12
• Vertical and lateral accelerations at a test speed of 50 mph. • Inertial profiles to determine pavement roughness based on the international roughness
index (IRI). • Radius of curvature of sections on curves. • Profile measurements with the SurPRO 3500 reference profiler to determine the
longitudinal profiles of sections with grade changes.
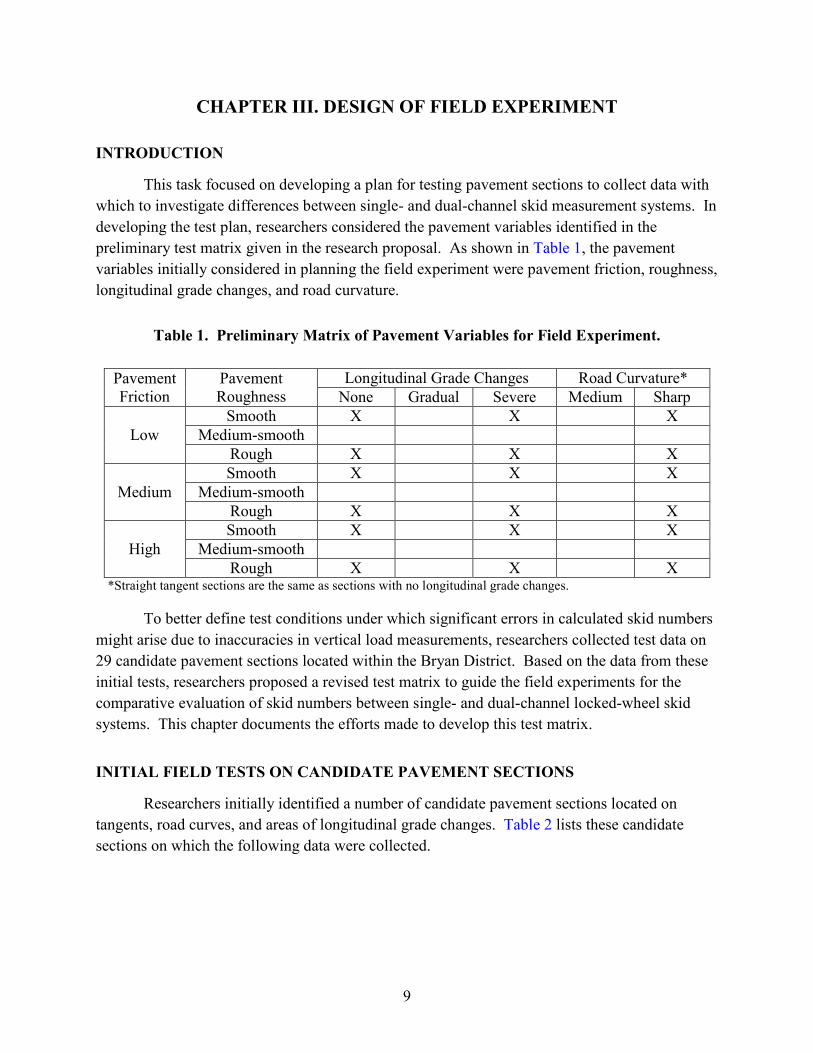
To measure accelerations, researchers mounted a Vericom© VC3000 unit within the test vehicle. This instrument, illustrated in Figure 3, permits the user to save the vertical and lateral acceleration traces collected during a given run. Researchers later downloaded these traces to a computer for data processing.
Figure 3. Instrument Used to Measure Vertical and Lateral Accelerations.
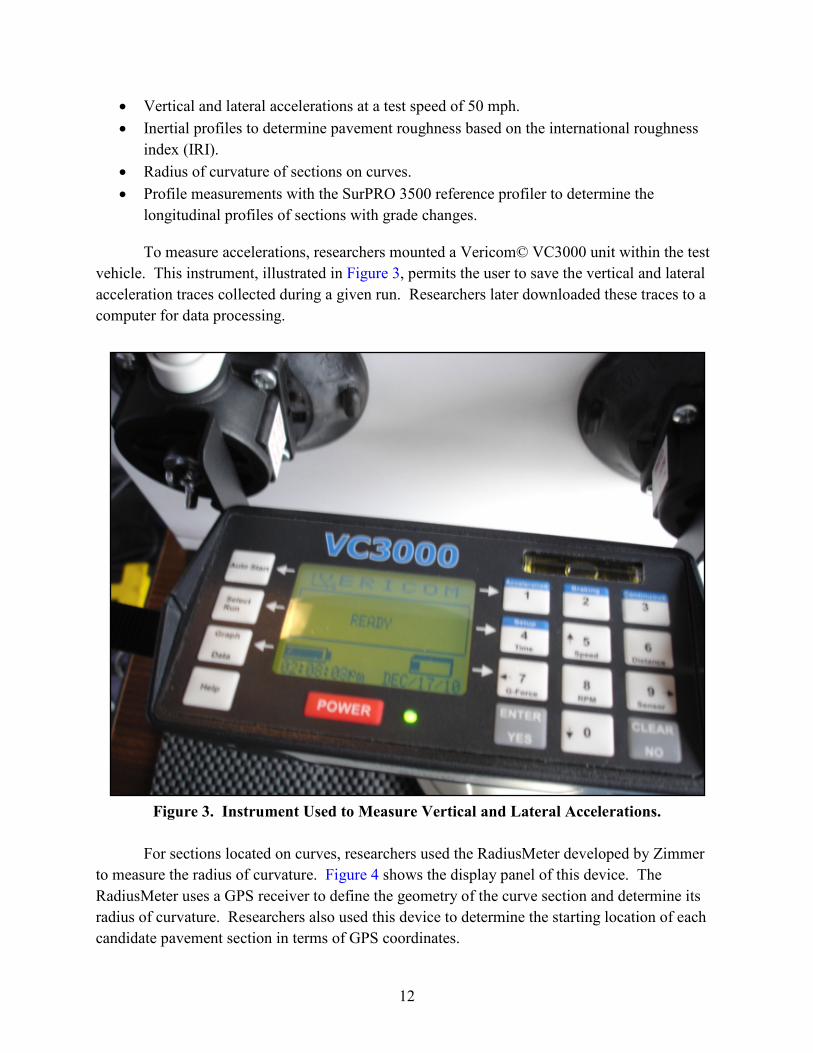
For sections located on curves, researchers used the RadiusMeter developed by Zimmer to measure the radius of curvature. Figure 4 shows the display panel of this device. The RadiusMeter uses a GPS receiver to define the geometry of the curve section and determine its radius of curvature. Researchers also used this device to determine the starting location of each candidate pavement section in terms of GPS coordinates.
13
Figure 4. Photo of RadiusMeter for Measuring Radius of Curvature.
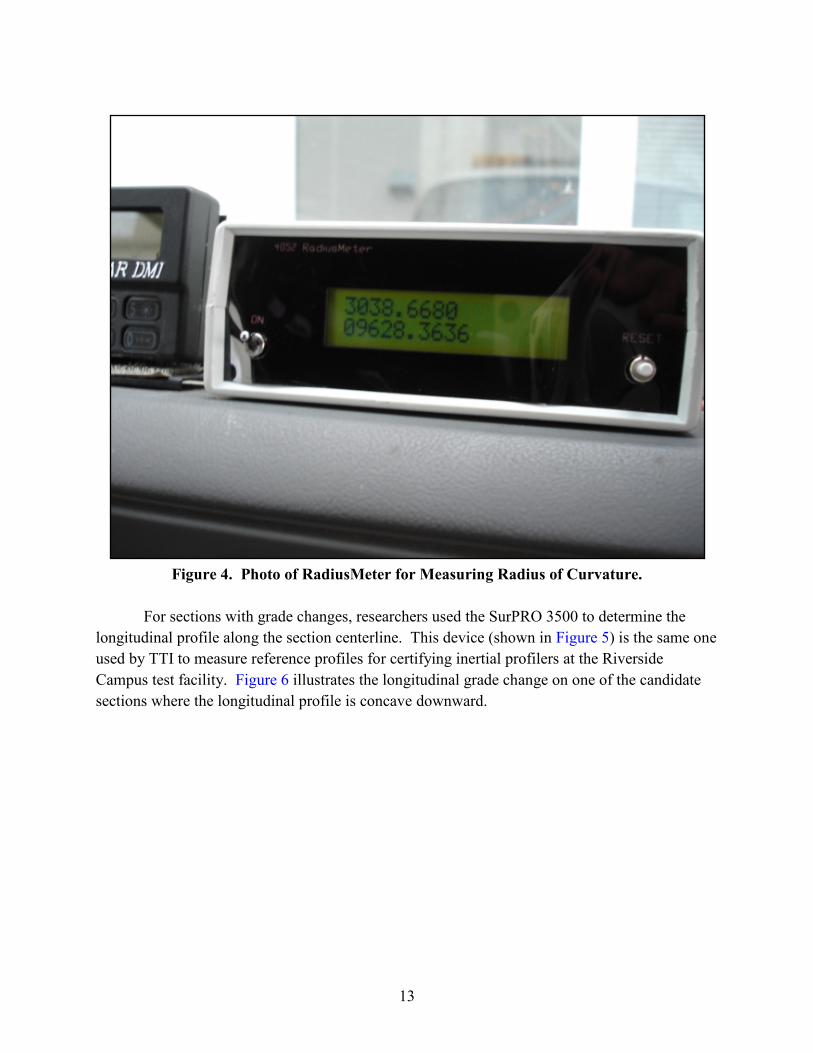
For sections with grade changes, researchers used the SurPRO 3500 to determine the longitudinal profile along the section centerline. This device (shown in Figure 5) is the same one used by TTI to measure reference profiles for certifying inertial profilers at the Riverside Campus test facility. Figure 6 illustrates the longitudinal grade change on one of the candidate sections where the longitudinal profile is concave downward.

14
Figure 5. SurPRO Reference Profiler Used to Determine Grade Change Profile.
Figure 6. SurPRO Data on Section G5 Showing Longitudinal Grade Change.
15
REVIEW OF RESULTS FROM INITIAL FIELD TESTS
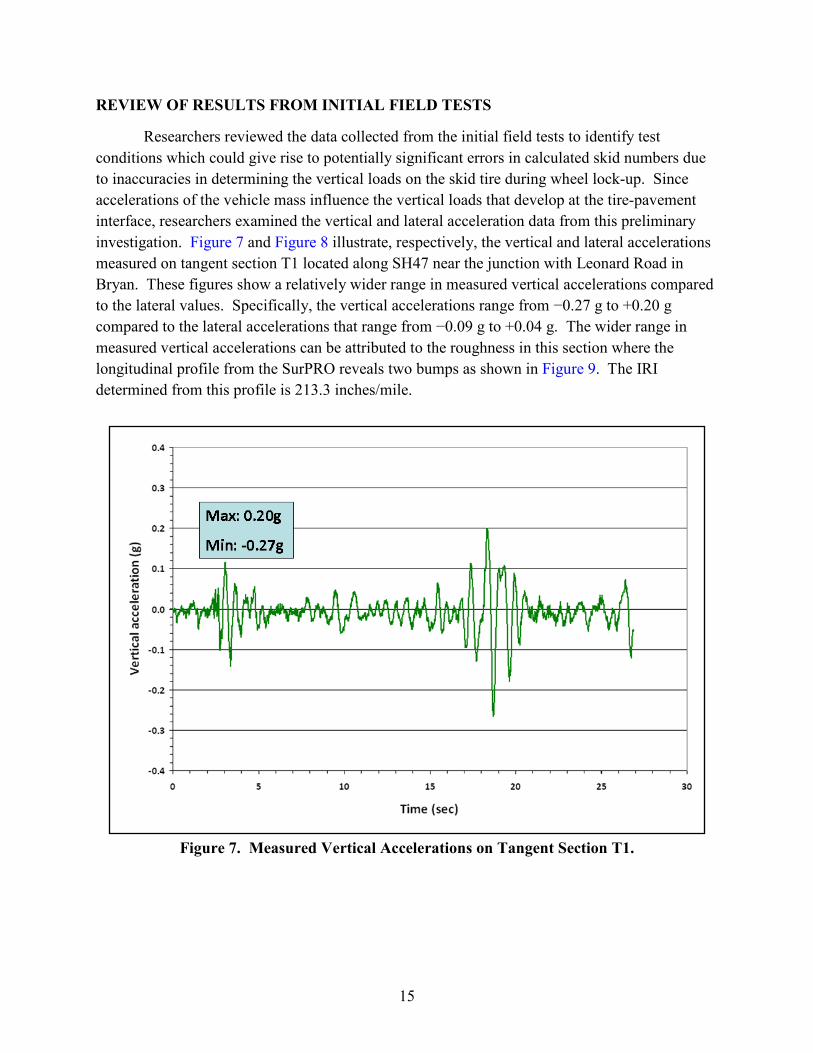
Researchers reviewed the data collected from the initial field tests to identify test conditions which could give rise to potentially significant errors in calculated skid numbers due to inaccuracies in determining the vertical loads on the skid tire during wheel lock-up. Since accelerations of the vehicle mass influence the vertical loads that develop at the tire-pavement interface, researchers examined the vertical and lateral acceleration data from this preliminary investigation. Figure 7 and Figure 8 illustrate, respectively, the vertical and lateral accelerations measured on tangent section T1 located along SH47 near the junction with Leonard Road in Bryan. These figures show a relatively wider range in measured vertical accelerations compared to the lateral values. Specifically, the vertical accelerations range from −0.27 g to +0.20 g compared to the lateral accelerations that range from −0.09 g to +0.04 g. The wider range in measured vertical accelerations can be attributed to the roughness in this section where the longitudinal profile from the SurPRO reveals two bumps as shown in Figure 9. The IRI determined from this profile is 213.3 inches/mile.
Figure 7. Measured Vertical Accelerations on Tangent Section T1.

16
Figure 8. Measured Lateral Accelerations on Tangent Section T1.
Figure 9. Longitudinal Profile from SurPRO Run on Tangent Section T1.
Given the roughness on section T1, researchers conducted skid measurements using TTI’s dual-channel system to verify the effect of roughness on the calculated skid numbers. In particular, researchers compared the skid number computed using the measured vertical and
17
horizontal tire forces with the corresponding value determined following the procedure used by TxDOT. This procedure computes the vertical tire force by applying a correction to the static tire load that depends on the geometry of the skid trailer and the measured drag force. This calculation yielded an equivalent single-channel skid number of 28.3, which compares quite favorably with the skid number of 28.1 computed using the measured horizontal and vertical tire forces from TTI’s dual-channel system. Thus, the roughness on tangent section T1 did not appreciably affect the skid numbers determined from the two methods. To explain this result, reference is made to the vertical accelerations plotted in Figure 7. While this figure shows significant variations in the vertical accelerations, the data are observed to fluctuate about the zero line.
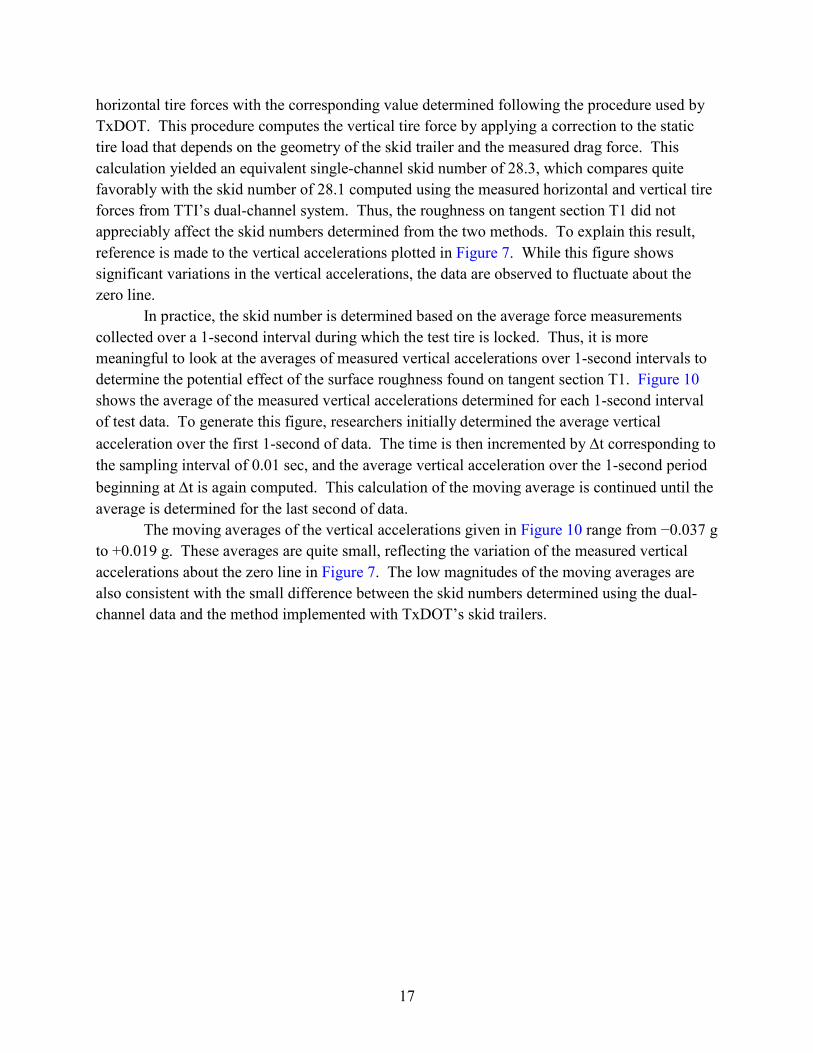
In practice, the skid number is determined based on the average force measurements collected over a 1-second interval during which the test tire is locked. Thus, it is more meaningful to look at the averages of measured vertical accelerations over 1-second intervals to determine the potential effect of the surface roughness found on tangent section T1. Figure 10 shows the average of the measured vertical accelerations determined for each 1-second interval of test data. To generate this figure, researchers initially determined the average vertical acceleration over the first 1-second of data. The time is then incremented by ∆t corresponding to the sampling interval of 0.01 sec, and the average vertical acceleration over the 1-second period beginning at ∆t is again computed. This calculation of the moving average is continued until the average is determined for the last second of data.
The moving averages of the vertical accelerations given in Figure 10 range from −0.037 g to +0.019 g. These averages are quite small, reflecting the variation of the measured vertical accelerations about the zero line in Figure 7. The low magnitudes of the moving averages are also consistent with the small difference between the skid numbers determined using the dual-channel data and the method implemented with TxDOT’s skid trailers.
18
Figure 10. Average Vertical Accelerations on Section T1 Computed over a 1-second
Moving Time Window.
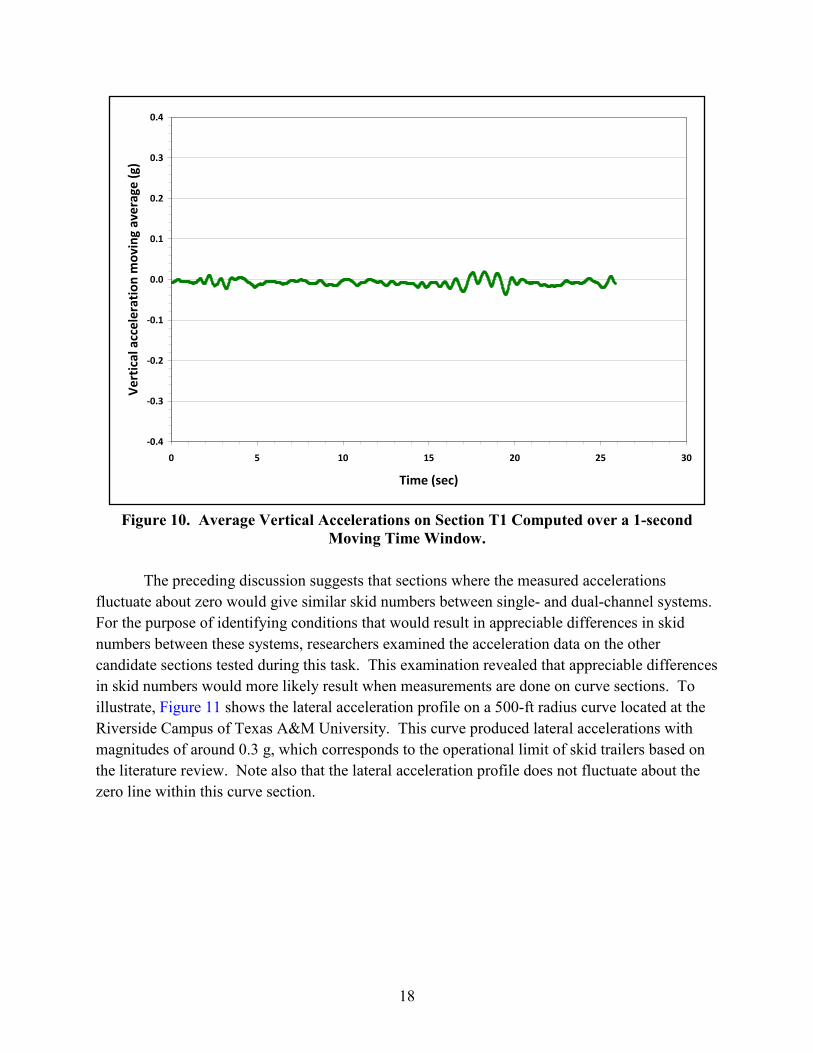
The preceding discussion suggests that sections where the measured accelerations fluctuate about zero would give similar skid numbers between single- and dual-channel systems. For the purpose of identifying conditions that would result in appreciable differences in skid numbers between these systems, researchers examined the acceleration data on the other candidate sections tested during this task. This examination revealed that appreciable differences in skid numbers would more likely result when measurements are done on curve sections. To illustrate, Figure 11 shows the lateral acceleration profile on a 500-ft radius curve located at the Riverside Campus of Texas A&M University. This curve produced lateral accelerations with magnitudes of around 0.3 g, which corresponds to the operational limit of skid trailers based on the literature review. Note also that the lateral acceleration profile does not fluctuate about the zero line within this curve section.
-0.4
-0.3
-0.2
-0.1
0.0
0.1
0.2
0.3
0.4
0 5 10 15 20 25 30
Time (sec)
Vert
ical
acc
eler
atio
n m
ovin
g av
erag
e (g
)
19
Figure 11. Measured Lateral Accelerations on Curve Section.
The negative lateral accelerations in Figure 11 are tied to the sign convention of the instrument used for measurement. Specifically, a right turn or clockwise maneuver yields negative lateral accelerations, while a left turn or counter-clockwise movement yields positive values. Since the test tire on TxDOT skid trailers is located on the left wheel path, the differences in skid numbers between single- and dual-channel systems might vary on curves depending on the direction of travel. For right-turn maneuvers, the test tire would tend to receive more load and less for measurements in the opposite direction. Thus, it would be important to consider the direction of measurement on curves in developing the test matrix.
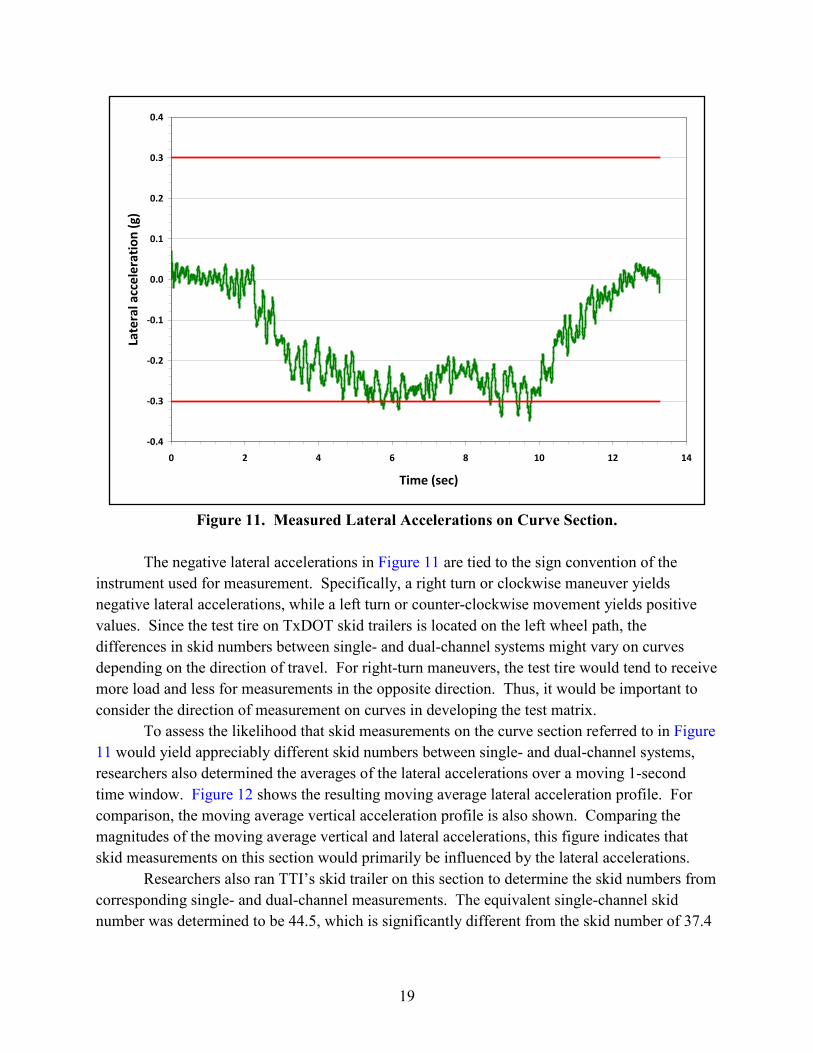
To assess the likelihood that skid measurements on the curve section referred to in Figure 11 would yield appreciably different skid numbers between single- and dual-channel systems, researchers also determined the averages of the lateral accelerations over a moving 1-second time window. Figure 12 shows the resulting moving average lateral acceleration profile. For comparison, the moving average vertical acceleration profile is also shown. Comparing the magnitudes of the moving average vertical and lateral accelerations, this figure indicates that skid measurements on this section would primarily be influenced by the lateral accelerations.
Researchers also ran TTI’s skid trailer on this section to determine the skid numbers from corresponding single- and dual-channel measurements. The equivalent single-channel skid number was determined to be 44.5, which is significantly different from the skid number of 37.4
-0.4
-0.3
-0.2
-0.1
0.0
0.1
0.2
0.3
0.4
0 2 4 6 8 10 12 14
Time (sec)
Late
ral a
ccel
erat
ion
(g)
20
computed using the measured horizontal and vertical tire forces. This difference corresponds to an error of 19 percent.
Figure 12. Average Accelerations on Riverside Curve Section Computed over a 1-second
Moving Time Window.
The error is caused by the lateral acceleration acting on the trailer as it goes through the horizontal curve. As shown in Figure 13, a lateral force Fy is created by the lateral acceleration Ay acting on the mass mg at the center-of-gravity location hcg. By applying Newton’s second law, the lateral force is determined as follows:
mgAF yy = (3.1)
This side force then produces a change in the vertical forces acting on each wheel according to the following equation:
thF
FF cgyzizo
2=−
(3.2)
-0.35
-0.30
-0.25
-0.20
-0.15
-0.10
-0.05
0.00
0.05
0 2 4 6 8 10 12 14
Time (sec)
Mov
ing
aver
age
of m
easu
red
acce
lera
tions
(g)
Lateral Vertical
21
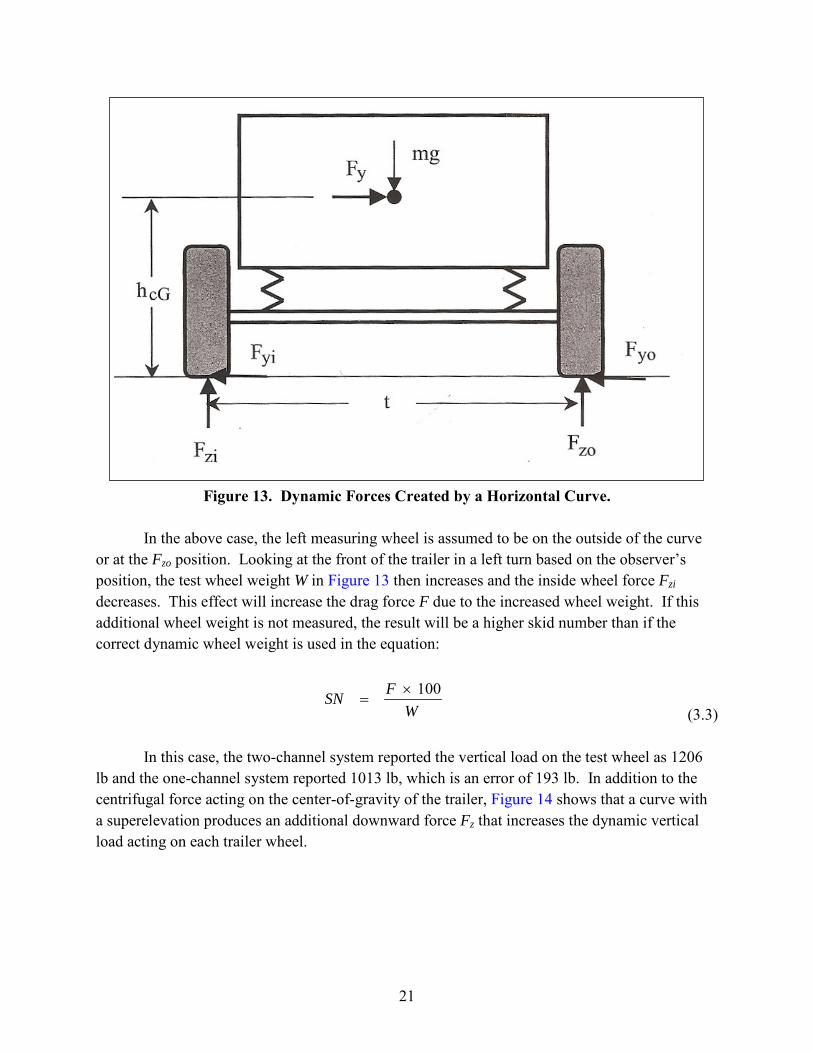
Figure 13. Dynamic Forces Created by a Horizontal Curve.
In the above case, the left measuring wheel is assumed to be on the outside of the curve or at the Fzo position. Looking at the front of the trailer in a left turn based on the observer’s position, the test wheel weight W in Figure 13 then increases and the inside wheel force Fzi decreases. This effect will increase the drag force F due to the increased wheel weight. If this additional wheel weight is not measured, the result will be a higher skid number than if the correct dynamic wheel weight is used in the equation:
WFSN 100×
= (3.3)
In this case, the two-channel system reported the vertical load on the test wheel as 1206 lb and the one-channel system reported 1013 lb, which is an error of 193 lb. In addition to the centrifugal force acting on the center-of-gravity of the trailer, Figure 14 shows that a curve with a superelevation produces an additional downward force Fz that increases the dynamic vertical load acting on each trailer wheel.

22
Figure 14. Dynamic Forces Created by a Superelevated Curve.
From examination of the test data collected in this task, researchers note that the measured lateral accelerations vary with the geometry of the curve such as its radius and superelevation. Figure 15, for example, shows the moving average accelerations on a curve section located within a recent rehabilitation project on SH6 in Grimes County. The moving average lateral accelerations are significantly lower in magnitude compared to the lateral accelerations shown in Figure 12. This SH6 section is a more gradual curve with a radius of 2900 ft and a posted speed limit of 70 mph. The section also turns to the left, which explains the positive values of the moving average lateral accelerations plotted in Figure 15.

23
Figure 15. Average Accelerations on SH6 Curve Section (C19) Computed
over a 1-second Moving Time Window.
The test data collected from the preliminary survey of candidate pavement sections showed that measurements of vertical and lateral accelerations can be used to identify test conditions under which significant errors in calculated skid numbers might arise due to inaccuracies in vertical load measurement. These measured accelerations incorporate the effects of road geometry, test speed, and road roughness. Thus, researchers included acceleration data in preparing the summary list of the candidate pavement sections given in Table 3. This table also includes available skid data from TxDOT’s Pavement Management Information System (PMIS) database. Researchers used the data collected from the preliminary field tests to develop a test matrix for the field experiments in this project. The proposed test matrix is presented in the next section of this chapter.
0.00
0.05
0.10
0.15
0.20
0.25
0.30
0.35
0.40
0 5 10 15 20 25
Time (sec)
Mov
ing
aver
age
of m
easu
red
acce
lera
tions
(g)
Lateral Vertical

24
Table 3. Summary of Candidate Pavement Section Characteristics.
Section ID Section Type Skid No.1
Moving average acceleration range (g)2 Average IRI
(in/mile)3 Lateral Vertical T1 Tangent 22 -0.043 to 0.013 -0.037 to 0.019 227.8 T2 Tangent 27 -0.005 to 0.025 -0.036 to 0.037 136.4
G3 Grade change (concave down shape) NA -0.022 to 0.052 -0.054 to 0.028 242.5
G4 Grade change (concave down shape) NA -0.021 to 0.027 -0.050 to 0.049 108.2
G5 Grade change (concave down shape) NA -0.061 to 0.047 -0.002 to 0.134 167.3
C6 Curve (1100-ft radius) 36 -0.151 to -0.002 -0.049 to 0.001 179.1 C8 Curve (670-ft radius) 25 -0.271 to -0.078 -0.015 to 0.033 183.4
G9 Grade change (concave up shape) 40 -0.013 to 0.019 -0.013 to 0.021 199.7
G10 Grade change (concave up shape) 33 -0.013 to 0.027 -0.027 to -0.005 151.5
C11 Curve (260-ft radius) NA 0.011 to 0.323 -0.020 to 0.011 177.6 C12 Curve (400-ft radius) NA -0.030 to 0.140 -0.038 to 0.039 206.1 C13 Curve (600-ft radius) 53 -0.018 to 0.263 -0.007 to 0.034 111.7
G14 Grade change (concave down shape) NA -0.010 to 0.024 0.004 to 0.034 60.7
G15 Grade change (concave up shape) NA -0.011 to 0.032 -0.044 to -0.002 54.8
C16 Curve (2700-ft radius) NA -0.011 to 0.033 -0.002 to 0.034 53.3 T17 Tangent NA -0.005 to 0.006 -0.030 to -0.012 78.7 T18 Tangent NA -0.022 to -0.011 -0.004 to 0.008 47.9 C19 Curve (2900-ft curve) NA 0.016 to 0.092 0.002 to 0.041 50.8
G20 Grade change (concave down shape) 62 -0.047 to 0.007 0.013 to 0.104 185.5
G21 Grade change (concave up shape) 52 -0.014 to 0.004 -0.019 to 0.052 141.4
C22 Curve (800-ft radius) 61 0.004 to 0.197 -0.044 to 0.026 160.4 C23 Curve (510-ft radius) 61 -0.235 to -0.082 0.004 to 0.042 187.3
G24 Grade change (concave down shape) 61 -0.036 to 0.018 0.023 to 0.101 150.4
G25 Grade change (concave down shape) 61 -0.022 to 0.035 0.002 to 0.133 181.9
G26 Grade change (concave up shape) 33 -0.028 to 0.006 0.001 to 0.019 59.1
T27 Tangent NA 0.001 to 0.019 -0.009 to 0.005 62.1 C28 Curve (500-ft radius) NA -0.107 to 0.120 -0.017 to 0.075 231.0 C29 Curve (500-ft radius) NA -0.334 to -0.020 -0.037 to 0.013 226.1 C30 Curve NA -0.520 to -0.013 -0.050 to -0.008 171.6 C31 Curve 37.44 -0.277 to 0.012 0.005 to 0.035 190.8 C33 Curve 614 0.009 to 0.109 -0.026 to 0.029 57.0 C34 Curve 234 -0.147 to 0.037 -0.028 to 0.040 115.2
1Skid number from PMIS except where noted 2Average acceleration over a 1-second moving time window (moving averages ≥ 0.10 g identified in red) 3IRIs determined from inertial profile measurements 4Measured using TTI’s dual-channel skid system

25
PROPOSED TEST MATRIX
Based on initial testing with the TxDOT E274 system and the TTI locked-wheel system operating in both one- and two-channel modes, researchers found that the roadway geometric condition producing the most significant error is the horizontal curve. Figure 16 illustrates this finding. Thus, researchers placed greater emphasis on testing horizontal curves in planning the field experiment. However, this approach does not exclude other roadway geometric conditions. As Table 4 shows, the proposed test matrix includes sections with grade changes on vertical curves and tangent sections at two levels of pavement roughness as measured by IRI. Researchers proposed to test these other conditions with the idea that, if the findings reveal significant potential errors, the number of test sections will be expanded. Table 4 presents a revised test matrix of pavement variables, which updates the preliminary matrix given in the research work plan.
Comparing the initial matrix presented in Table 1 with the test matrix in Table 4, one observes that the matrix has expanded from the original 18 to 22. The double X on the high tangent roughness condition indicates that one site is probably not sufficient to quantify the effect of wavelength and should be further investigated. Three repeat runs are proposed for each condition. In addition, researchers proposed to evaluate the effect of test speed by making runs at the standard TxDOT test speed of 50 mph, and at 40 mph. The proposed test matrix would then require a minimum of 22 × 3 × 2 or 132 test runs.
DEVELOPMENT OF METHODOLOGY FOR FIELD TESTING
To evaluate the differences between single- and dual-channel E274 systems, researchers developed a plan based on using only the dual-channel TTI E274 system to test sites covering the roadway geometric conditions included in Table 4. The test data from the TTI system would then be processed to compute the skid number in two ways:
• Use the two-channel measurements, and take the ratio of the measured horizontal and vertical tire forces.
• Use the method implemented in TxDOT’s E274 system, where the vertical load is computed from the measured horizontal drag force, the static vertical test wheel load, and the trailer geometry to compute skid number.

26
Figure 16. Differences between Skid Numbers from 1- and 2-Channel Systems for Four
Roadway Geometric Conditions.
Table 4. Proposed Matrix of Test Conditions.
Friction Level
Horizontal Curves Vertical Curves
Tangent Roughness (in/mile)
Vert. accel. = 0 g Vert. accel. >0 g Horz. accel.
<0.25 g Horz. accel.
>0.25 g Horz. accel. 0 to 0.5 g
Right turn
Left turn
Right turn
Left turn
Right turn
Left turn
Concave up
Concave down IRI<100 IRI>150
SN < 37 X X X X X X X X X XX
SN > 37 X X X X X X X X X XX
The proposed method eliminates the normal variability that exists when two skid systems
attempt to skid test the same roadway location. The variability of the pavement, from spot to spot, could cause a 2 to 4 SN difference that is due entirely to the pavement and not the equipment or test method.
27
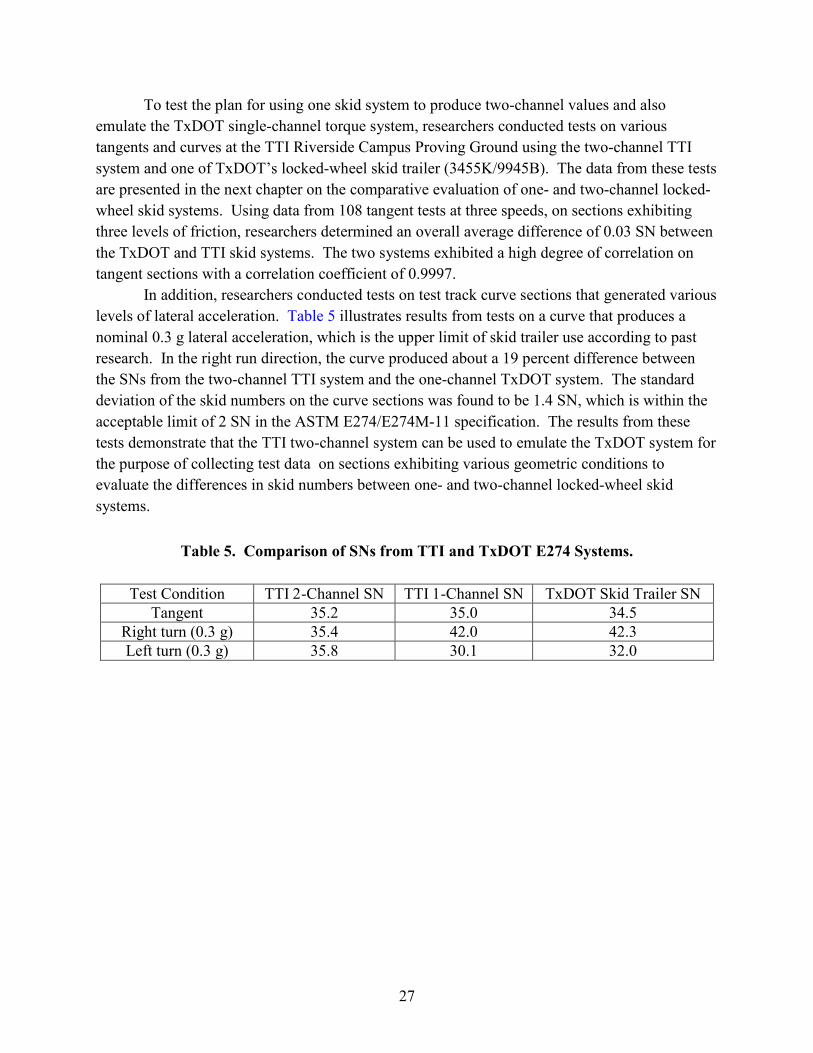
To test the plan for using one skid system to produce two-channel values and also emulate the TxDOT single-channel torque system, researchers conducted tests on various tangents and curves at the TTI Riverside Campus Proving Ground using the two-channel TTI system and one of TxDOT’s locked-wheel skid trailer (3455K/9945B). The data from these tests are presented in the next chapter on the comparative evaluation of one- and two-channel locked-wheel skid systems. Using data from 108 tangent tests at three speeds, on sections exhibiting three levels of friction, researchers determined an overall average difference of 0.03 SN between the TxDOT and TTI skid systems. The two systems exhibited a high degree of correlation on tangent sections with a correlation coefficient of 0.9997.
In addition, researchers conducted tests on test track curve sections that generated various levels of lateral acceleration. Table 5 illustrates results from tests on a curve that produces a nominal 0.3 g lateral acceleration, which is the upper limit of skid trailer use according to past research. In the right run direction, the curve produced about a 19 percent difference between the SNs from the two-channel TTI system and the one-channel TxDOT system. The standard deviation of the skid numbers on the curve sections was found to be 1.4 SN, which is within the acceptable limit of 2 SN in the ASTM E274/E274M-11 specification. The results from these tests demonstrate that the TTI two-channel system can be used to emulate the TxDOT system for the purpose of collecting test data on sections exhibiting various geometric conditions to evaluate the differences in skid numbers between one- and two-channel locked-wheel skid systems.
Table 5. Comparison of SNs from TTI and TxDOT E274 Systems.
Test Condition TTI 2-Channel SN TTI 1-Channel SN TxDOT Skid Trailer SN Tangent 35.2 35.0 34.5
Right turn (0.3 g) 35.4 42.0 42.3 Left turn (0.3 g) 35.8 30.1 32.0

29
CHAPTER IV. COMPARATIVE EVALUATION OF ONE- VS. TWO-CHANNEL LOCKED-WHEEL SKID SYSTEMS
INTRODUCTION
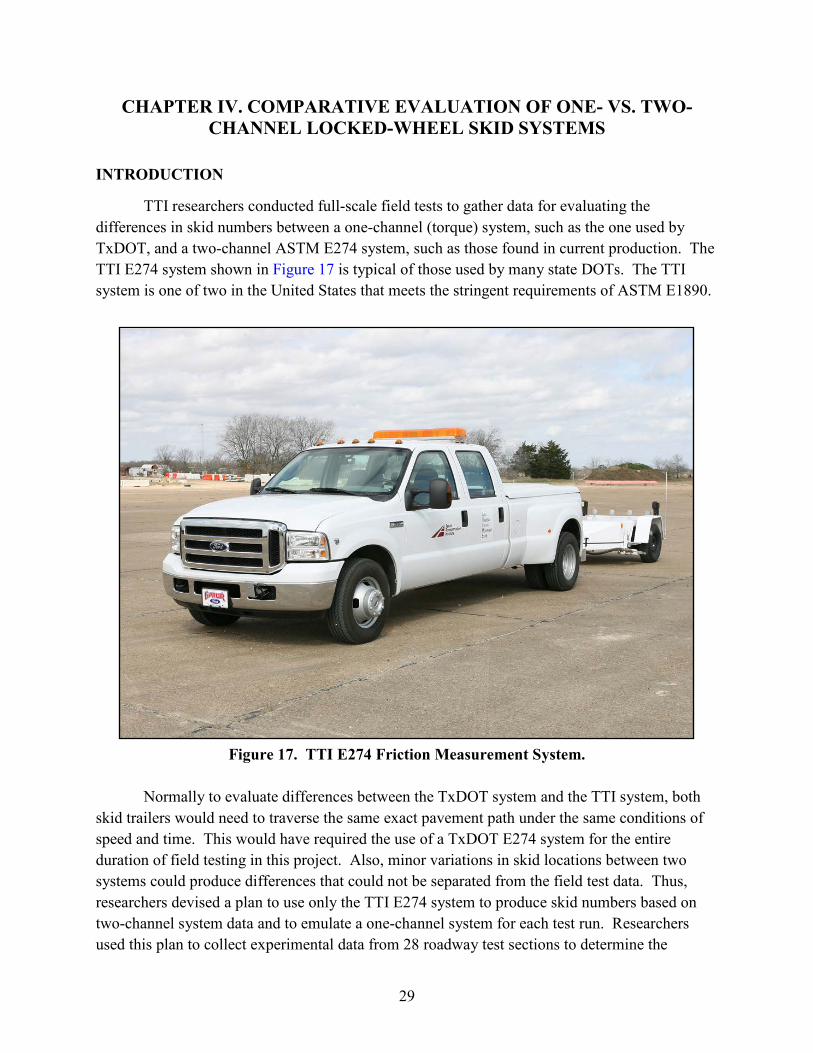
TTI researchers conducted full-scale field tests to gather data for evaluating the differences in skid numbers between a one-channel (torque) system, such as the one used by TxDOT, and a two-channel ASTM E274 system, such as those found in current production. The TTI E274 system shown in Figure 17 is typical of those used by many state DOTs. The TTI system is one of two in the United States that meets the stringent requirements of ASTM E1890.
Figure 17. TTI E274 Friction Measurement System.
Normally to evaluate differences between the TxDOT system and the TTI system, both skid trailers would need to traverse the same exact pavement path under the same conditions of speed and time. This would have required the use of a TxDOT E274 system for the entire duration of field testing in this project. Also, minor variations in skid locations between two systems could produce differences that could not be separated from the field test data. Thus, researchers devised a plan to use only the TTI E274 system to produce skid numbers based on two-channel system data and to emulate a one-channel system for each test run. Researchers used this plan to collect experimental data from 28 roadway test sections to determine the

30
magnitudes of the differences in skid numbers between the TxDOT one-channel method and the two-channel ASTM E274 method in tangents, horizontal curves, vertical curves, and rough sections.
The roadway sections in this project were selected so as to produce higher than normal inertial effects. Thus the results presented do not necessarily reflect data considered typical of primary and secondary roads, which would have produced lower geometric inertial forces than those needed for use in this study. The majority of the test runs used only the TTI two-channel ASTM E274 skid system to produce concurrent one- and two-channel data. Test data were collected at 40 and 50 mph, with three replicate runs on each section.
USE OF TTI ASTM E274 SYSTEM TO ACQUIRE DATA FOR COMPARING ONE- AND TWO-CHANNEL SKID NUMBERS
The TTI E274 system, manufactured by International Cybernetics Corporation (ICC), acquires data at the rate of 500 samples per second from the time the operator presses the Start Skid button until the end of the test sequence when the water flow stops. At each time step, the data acquisition software saves the following test wheel data in an ASCII file on the computer’s hard drive with each run labeled:
• Event State. • Left Speed. • Right Speed. • Left Force. • Left Load.
The Event State is a number that indicates what part of the skid cycle is in progress at a given point in time. A “4” indicates the water is on, the brake is fully locked, and data are averaged over a one second period to produce a skid number from 500 data points using the average force divided by the average load. This calculation is the normal two-channel method.
To simulate the same skid using only one channel (drag force) and a known static wheel load, the one second of drag force data are averaged and then divided by the static test wheel weight reduced by a load transfer value according to Equation 2.1, which is used in the TxDOT E274 software to calculate skid numbers. Initially, the test data were placed in a large spread sheet and manually separated and calculated to produce one- and two-channel skid numbers for each run. Later, researchers developed a FORTRAN program to greatly speed up the process of parsing the data from the test runs and calculating one- and two-channel skid numbers.
In addition to producing text data, the TTI skid system produces a graph for each skid test as shown in Figure 18. The top trace is the dynamic vertical weight of the test wheel during the sequence while traveling over bumps and dips in the roadway section tested. Data to compute skid number are taken during the Avg part of the event steps illustrated in Figure 18.
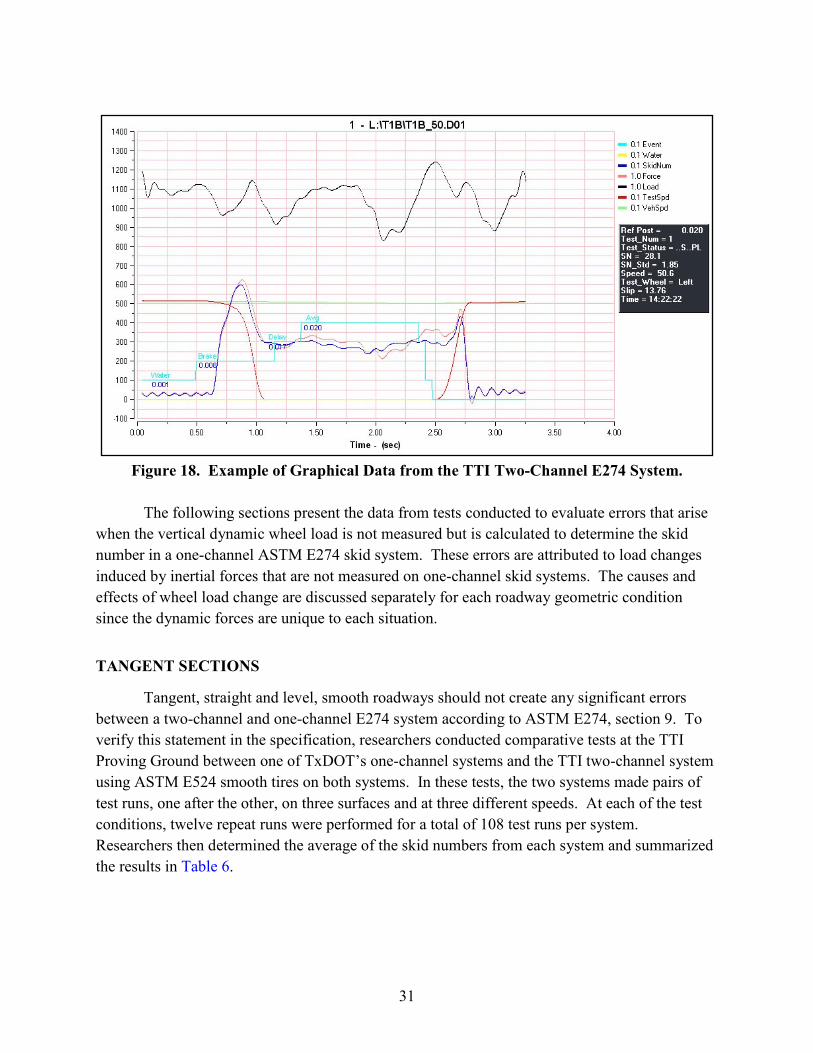
31
Figure 18. Example of Graphical Data from the TTI Two-Channel E274 System.
The following sections present the data from tests conducted to evaluate errors that arise when the vertical dynamic wheel load is not measured but is calculated to determine the skid number in a one-channel ASTM E274 skid system. These errors are attributed to load changes induced by inertial forces that are not measured on one-channel skid systems. The causes and effects of wheel load change are discussed separately for each roadway geometric condition since the dynamic forces are unique to each situation.
TANGENT SECTIONS
Tangent, straight and level, smooth roadways should not create any significant errors between a two-channel and one-channel E274 system according to ASTM E274, section 9. To verify this statement in the specification, researchers conducted comparative tests at the TTI Proving Ground between one of TxDOT’s one-channel systems and the TTI two-channel system using ASTM E524 smooth tires on both systems. In these tests, the two systems made pairs of test runs, one after the other, on three surfaces and at three different speeds. At each of the test conditions, twelve repeat runs were performed for a total of 108 test runs per system. Researchers then determined the average of the skid numbers from each system and summarized the results in Table 6.

32
Table 6. Summary of 108 Test Runs on Smooth Tangent Pavements.
Surface Friction
30 mph 40 mph 50 mph TTI SN TxDOT SN TTI FN TxDOT SN TTI SN TxDOT SN
Low 19.4 19.7 18.4 18.5 18.0 17.5 Medium 31.7 31.7 24.0 24.1 21.7 21.1
High 57.8 57.6 51.8 52.4 47.3 47.8 Average 36.3 36.3 31.4 31.7 29 28.8
The overall average difference between the TxDOT and TTI systems was 0.03 SN with
an overall pooled standard deviation of 1.04 SN for the TxDOT system and 1.22 for the TTI system. The correlation coefficient between the skid numbers from the two systems was 0.9997. Figure 19 presents a chart of the test runs at 50 mph, which is the standard test speed of the TxDOT E274 systems. The ARFMS axis refers to the skid numbers determined from the TTI two-channel system that measures both horizontal and vertical test wheel forces. The x-axis displays the corresponding values from the TxDOT one-channel system that measures the horizontal force but computes the vertical load change. The comparison between the TTI two-channel E274 system and the TxDOT one-channel system on level, tangent sections with 108 paired runs on three pavements at three speeds showed no statistically significant difference between the skid numbers from the two methods based on the application of the student’s t test at an α level of 0.05.
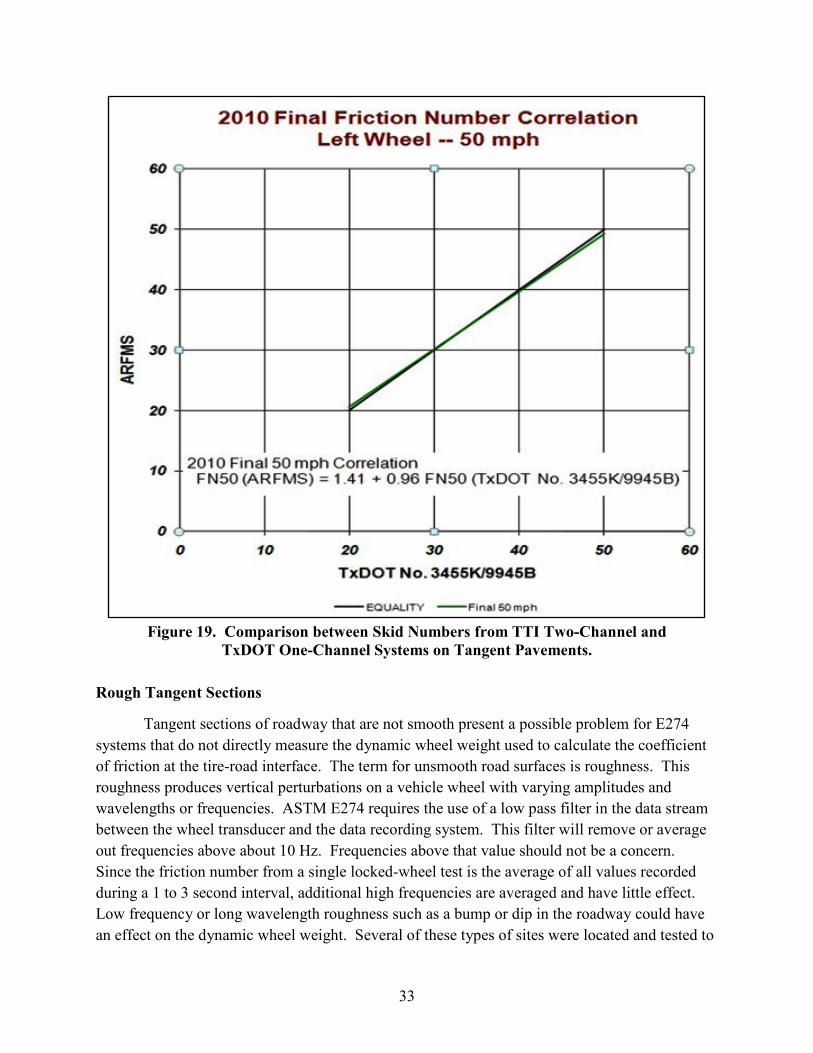
33
Figure 19. Comparison between Skid Numbers from TTI Two-Channel and
TxDOT One-Channel Systems on Tangent Pavements.
Rough Tangent Sections
Tangent sections of roadway that are not smooth present a possible problem for E274 systems that do not directly measure the dynamic wheel weight used to calculate the coefficient of friction at the tire-road interface. The term for unsmooth road surfaces is roughness. This roughness produces vertical perturbations on a vehicle wheel with varying amplitudes and wavelengths or frequencies. ASTM E274 requires the use of a low pass filter in the data stream between the wheel transducer and the data recording system. This filter will remove or average out frequencies above about 10 Hz. Frequencies above that value should not be a concern. Since the friction number from a single locked-wheel test is the average of all values recorded during a 1 to 3 second interval, additional high frequencies are averaged and have little effect. Low frequency or long wavelength roughness such as a bump or dip in the roadway could have an effect on the dynamic wheel weight. Several of these types of sites were located and tested to
34
determine the magnitude of errors, if any. Table 7 summarizes the results from tests conducted at 50 mph.
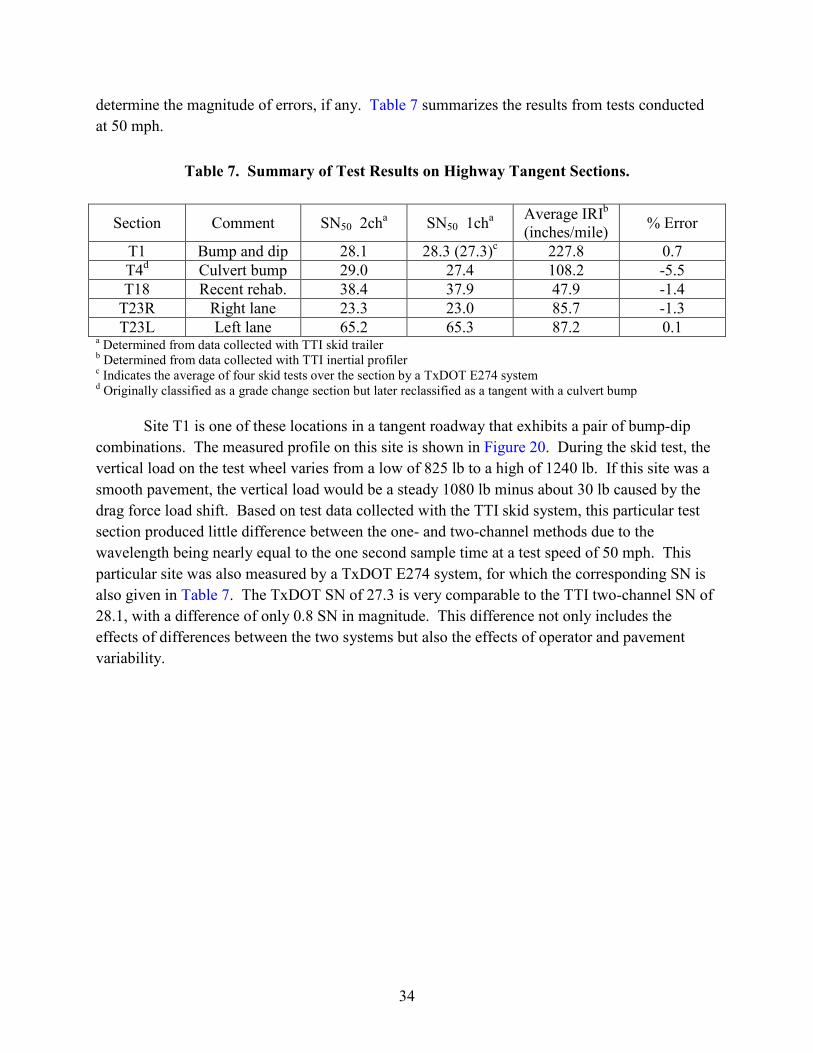
Table 7. Summary of Test Results on Highway Tangent Sections.
Section Comment SN50 2cha SN50 1cha Average IRIb (inches/mile) % Error
T1 Bump and dip 28.1 28.3 (27.3)c 227.8 0.7 T4d Culvert bump 29.0 27.4 108.2 -5.5 T18 Recent rehab. 38.4 37.9 47.9 -1.4
T23R Right lane 23.3 23.0 85.7 -1.3 T23L Left lane 65.2 65.3 87.2 0.1
a Determined from data collected with TTI skid trailer b Determined from data collected with TTI inertial profiler c Indicates the average of four skid tests over the section by a TxDOT E274 system d Originally classified as a grade change section but later reclassified as a tangent with a culvert bump
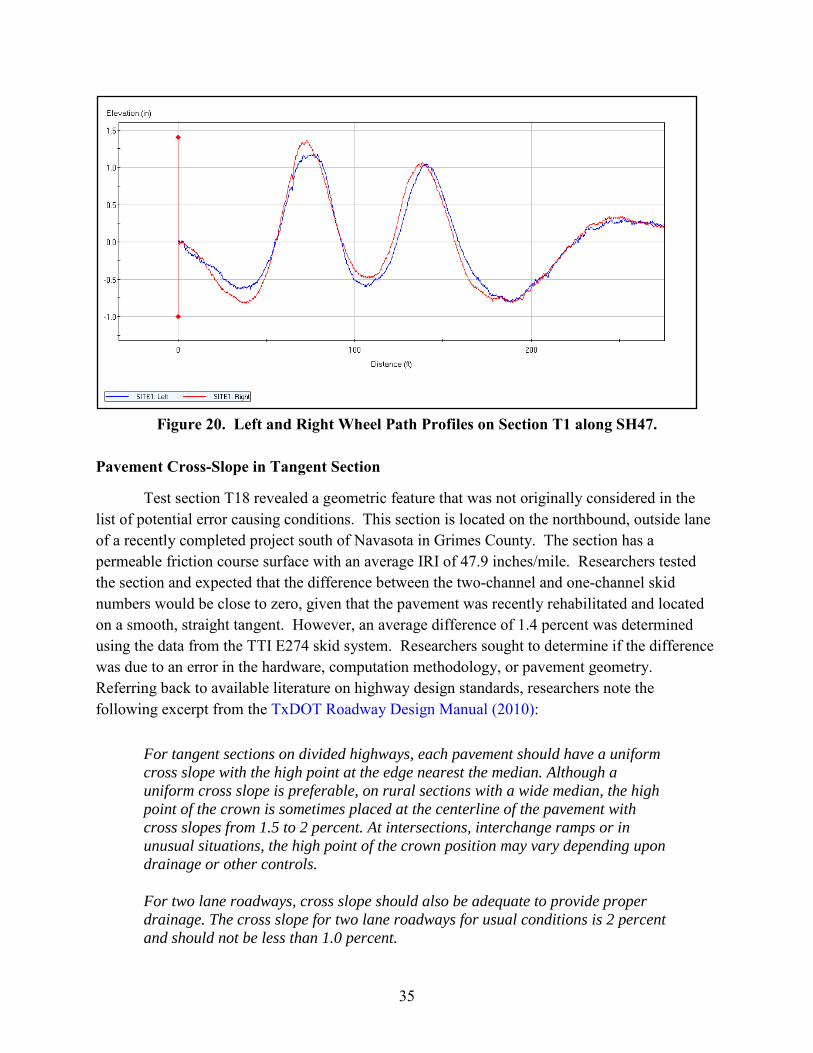
Site T1 is one of these locations in a tangent roadway that exhibits a pair of bump-dip combinations. The measured profile on this site is shown in Figure 20. During the skid test, the vertical load on the test wheel varies from a low of 825 lb to a high of 1240 lb. If this site was a smooth pavement, the vertical load would be a steady 1080 lb minus about 30 lb caused by the drag force load shift. Based on test data collected with the TTI skid system, this particular test section produced little difference between the one- and two-channel methods due to the wavelength being nearly equal to the one second sample time at a test speed of 50 mph. This particular site was also measured by a TxDOT E274 system, for which the corresponding SN is also given in Table 7. The TxDOT SN of 27.3 is very comparable to the TTI two-channel SN of 28.1, with a difference of only 0.8 SN in magnitude. This difference not only includes the effects of differences between the two systems but also the effects of operator and pavement variability.
35
Figure 20. Left and Right Wheel Path Profiles on Section T1 along SH47.
Pavement Cross-Slope in Tangent Section
Test section T18 revealed a geometric feature that was not originally considered in the list of potential error causing conditions. This section is located on the northbound, outside lane of a recently completed project south of Navasota in Grimes County. The section has a permeable friction course surface with an average IRI of 47.9 inches/mile. Researchers tested the section and expected that the difference between the two-channel and one-channel skid numbers would be close to zero, given that the pavement was recently rehabilitated and located on a smooth, straight tangent. However, an average difference of 1.4 percent was determined using the data from the TTI E274 skid system. Researchers sought to determine if the difference was due to an error in the hardware, computation methodology, or pavement geometry. Referring back to available literature on highway design standards, researchers note the following excerpt from the TxDOT Roadway Design Manual (2010):
For tangent sections on divided highways, each pavement should have a uniform cross slope with the high point at the edge nearest the median. Although a uniform cross slope is preferable, on rural sections with a wide median, the high point of the crown is sometimes placed at the centerline of the pavement with cross slopes from 1.5 to 2 percent. At intersections, interchange ramps or in unusual situations, the high point of the crown position may vary depending upon drainage or other controls.
For two lane roadways, cross slope should also be adequate to provide proper drainage. The cross slope for two lane roadways for usual conditions is 2 percent and should not be less than 1.0 percent.

36
Researchers measured the cross-slopes on section T18 as well as on the other tangent sections. Table 8 summarizes the cross-slopes measured at 40-ft intervals on these 200-ft tangent sections. Researchers concluded that the cross-slope was causing the weight of the test wheel to change due to the lateral shift in the center-of-gravity (CG), increasing the weight of the trailer wheel on the downhill side and decreasing the weight on the opposite wheel. Thus, if the left test wheel were on the uphill side, the skid number would be reported slightly lower on a one-channel system than a two-channel system because the computed W would be larger than the actual value. This effect of cross-slope is described in the following equation.
t
Wht
Fl
×
−
=θtan
2 (4.1)
where, Fl = weight on left wheel. t = track width. h = height of CG. W = weight acting at CG. θ = angle of cross-slope.
Based on a 2-percent cross slope or 1.1°, the difference calculated with the above formula is 1.02 percent, which explains the reported difference in SNs but is still below the E274 allowable 2 percent error limit.
Table 8. Measured Cross-Slopes on Tangent Sections.
Section ID Roadway1 Test Lane Cross-Slopes (°)
T1 SH47 Northbound outside lane 0.0, 0.6, 1.3, 2.5, 2.5, 2.9 T4 Goodson Bend Westbound lane 3.5, 4.2, 3.0, 3.2, 3.5, 3.7 T18 SH6 Northbound outside lane 1.5, 1.6, 1.4, 1.5, 1.7, 1.5
T23R SH21 Westbound outside lane 1.9, 2.2, 2.2, 1.9, 1.8, 1.7 T23L SH21 Westbound outside lane 1.8, 0.5, 0.5, 0.6, 1.1, 1.1
1 Except for T4, tangent sections are on 4-lane divided highways. T4 is on a 2-lane local road.
To further investigate the effect of pavement cross-slope, researchers tested two additional tangent sections located along the westbound lanes of SH21 just north of the Texas A&M Riverside Campus. These two sections are on adjacent lanes of this divided highway. The cross-slope dropped from the centerline crown toward the outside shoulder on the right or outside lane, and dropped at a lesser degree toward the median on the left or inside lane. Table 8

37
shows the measured cross-slopes on these SH21 sections, identified as T23R and T23L, from where the average cross-slopes were determined to be 2.0° and 0.9°, respectively.
Based on data collected with the TTI E274 system, the computed skid numbers between the one- and two-channel methods showed a -1.3 percent difference on section T23R, which is nearly the same as the difference of -1.4 percent on section T18 (see Table 7). In contrast, the difference between skid numbers on section T23L is only 0.1 percent, which is opposite in sign of the difference obtained on section T23R, and close to zero.
HORIZONTAL CURVE SECTIONS
The literature review indicated that horizontal curve sections will probably cause the largest difference between one-channel and two-channel methods for determining the skid number. This difference is due to inertial forces acting on the center-of-gravity of the trailer that produces a vertical load transfer between the inside and outside wheels. An explanation of this phenomenon was given in the previous chapter of this report, where Equations 3.1 through 3.3 provide a method of calculating the differences in skid numbers between one- and two-channel locked-wheel skid systems.
During this project, researchers tested a mix of short- and long-radius curves in the right and left (R and L, respectively) turn directions. Table 9 summarizes data collected from these tests. Raw skid data of about 6000 points were gathered from each curve section. Researchers processed the data to determine the dynamic vertical weight on the test wheel just prior to brake application, and to compare measured load changes with calculated values for the purpose of evaluating differences in skid numbers between one- and two-channel locked-wheel skid systems. Researchers also measured the superelevations on horizontal curve sections to support this analysis. Table 10 presents the superelevation data collected on these sections.
38
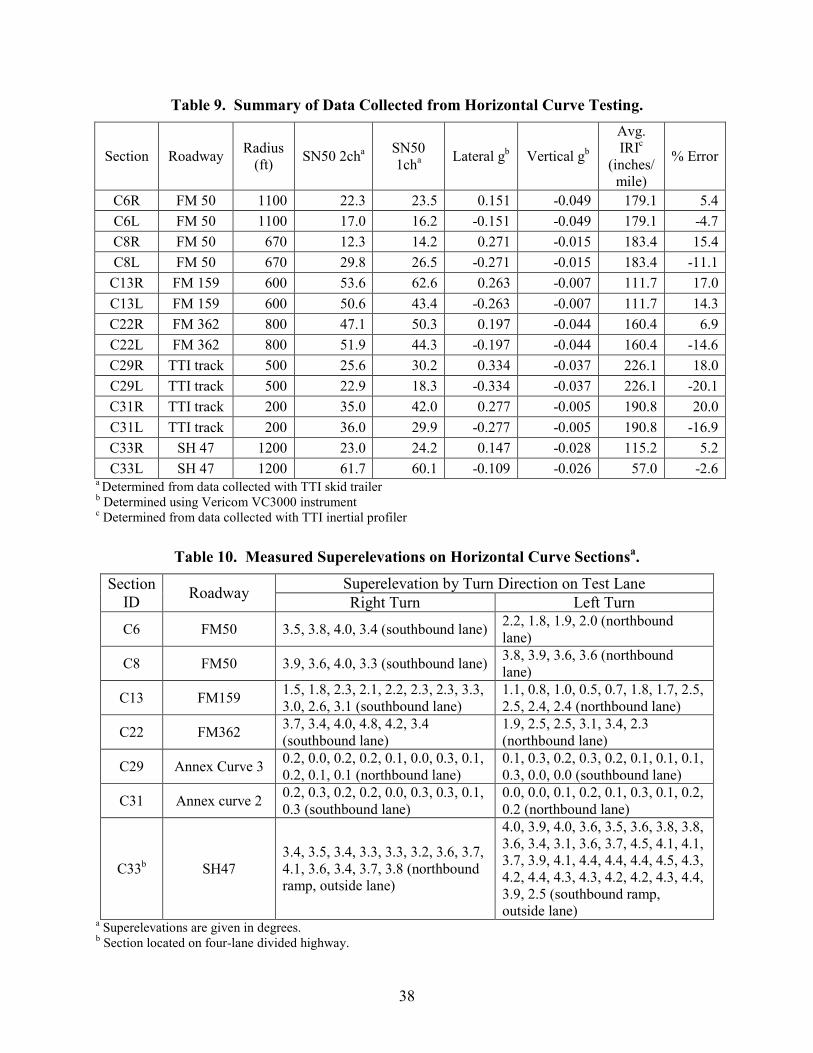
Table 9. Summary of Data Collected from Horizontal Curve Testing.
Section Roadway Radius (ft) SN50 2cha SN50
1cha Lateral gb Vertical gb
Avg. IRIc
(inches/ mile)
% Error
C6R FM 50 1100 22.3 23.5 0.151 -0.049 179.1 5.4 C6L FM 50 1100 17.0 16.2 -0.151 -0.049 179.1 -4.7 C8R FM 50 670 12.3 14.2 0.271 -0.015 183.4 15.4 C8L FM 50 670 29.8 26.5 -0.271 -0.015 183.4 -11.1
C13R FM 159 600 53.6 62.6 0.263 -0.007 111.7 17.0 C13L FM 159 600 50.6 43.4 -0.263 -0.007 111.7 14.3 C22R FM 362 800 47.1 50.3 0.197 -0.044 160.4 6.9 C22L FM 362 800 51.9 44.3 -0.197 -0.044 160.4 -14.6 C29R TTI track 500 25.6 30.2 0.334 -0.037 226.1 18.0 C29L TTI track 500 22.9 18.3 -0.334 -0.037 226.1 -20.1 C31R TTI track 200 35.0 42.0 0.277 -0.005 190.8 20.0 C31L TTI track 200 36.0 29.9 -0.277 -0.005 190.8 -16.9 C33R SH 47 1200 23.0 24.2 0.147 -0.028 115.2 5.2 C33L SH 47 1200 61.7 60.1 -0.109 -0.026 57.0 -2.6
a Determined from data collected with TTI skid trailer b Determined using Vericom VC3000 instrument c Determined from data collected with TTI inertial profiler
Table 10. Measured Superelevations on Horizontal Curve Sectionsa.
Section ID Roadway Superelevation by Turn Direction on Test Lane
Right Turn Left Turn
C6 FM50 3.5, 3.8, 4.0, 3.4 (southbound lane) 2.2, 1.8, 1.9, 2.0 (northbound lane)
C8 FM50 3.9, 3.6, 4.0, 3.3 (southbound lane) 3.8, 3.9, 3.6, 3.6 (northbound lane)
C13 FM159 1.5, 1.8, 2.3, 2.1, 2.2, 2.3, 2.3, 3.3, 3.0, 2.6, 3.1 (southbound lane)
1.1, 0.8, 1.0, 0.5, 0.7, 1.8, 1.7, 2.5, 2.5, 2.4, 2.4 (northbound lane)
C22 FM362 3.7, 3.4, 4.0, 4.8, 4.2, 3.4 (southbound lane)
1.9, 2.5, 2.5, 3.1, 3.4, 2.3 (northbound lane)
C29 Annex Curve 3 0.2, 0.0, 0.2, 0.2, 0.1, 0.0, 0.3, 0.1, 0.2, 0.1, 0.1 (northbound lane)
0.1, 0.3, 0.2, 0.3, 0.2, 0.1, 0.1, 0.1, 0.3, 0.0, 0.0 (southbound lane)
C31 Annex curve 2 0.2, 0.3, 0.2, 0.2, 0.0, 0.3, 0.3, 0.1, 0.3 (southbound lane)
0.0, 0.0, 0.1, 0.2, 0.1, 0.3, 0.1, 0.2, 0.2 (northbound lane)
C33b SH47 3.4, 3.5, 3.4, 3.3, 3.3, 3.2, 3.6, 3.7, 4.1, 3.6, 3.4, 3.7, 3.8 (northbound ramp, outside lane)
4.0, 3.9, 4.0, 3.6, 3.5, 3.6, 3.8, 3.8, 3.6, 3.4, 3.1, 3.6, 3.7, 4.5, 4.1, 4.1, 3.7, 3.9, 4.1, 4.4, 4.4, 4.4, 4.5, 4.3, 4.2, 4.4, 4.3, 4.3, 4.2, 4.2, 4.3, 4.4, 3.9, 2.5 (southbound ramp, outside lane)
a Superelevations are given in degrees. b Section located on four-lane divided highway.

39
Use of Equations 3.1 through 3.3 requires measurement of the center-of-gravity of the skid trailer. Thus researchers located the center-of-gravity on each of the locked-wheel skid trailers used for testing. This measurement was done following the Society of Automotive Engineers’ J874 test method where the trailer is suspended in three planes and a transit is used to scribe crossing lines extending down from the suspension point (SAE, 1993). Figure 21 shows this method being used on the TxDOT skid trailer (29-9912-H). The results of this test located the trailer’s center-of-gravity at 17.75 inches above ground level and 8.25 inches forward of the axle. The trailer’s track width was measured to be 63 inches. Similar measurements done on the TTI skid trailer found the vertical center-of-gravity height to be 15 inches with a trailer track width of 64 inches.
Using Equations 3.1 through 3.3, researchers developed a spreadsheet to calculate the difference in skid numbers between a two-channel E274 system, which measures both dynamic locked-wheel traction and vertical test wheel load and a one-channel system that only measures dynamic traction. The results of the computations, based on a 50 mph speed and skid number of 40, are shown in Figure 22. The percentage difference was found to be linear with respect to lateral acceleration. The differences discovered during the experimental field tests are also plotted on the graph as red squares. The slope of the calculated values is shown to be 59.1 percent difference per g of lateral acceleration. The highest lateral acceleration observed during the field tests on TxDOT-maintained roads was 0.26 g on a 600-foot radius curve. The percent difference does vary slightly with the skid number used in the calculations so that the slope at SN 15 equals 57.4 percent per g, while at SN85, the slope equals 62.4 percent per g. These observations were duplicated using TxDOT E274 system 3455K/9945B during test runs at the TTI Proving Ground. The average value for these runs is shown as the blue dot in Figure 22.

40
Figure 21. Measurement of the TxDOT E274 Trailer
Center-of-Gravity.
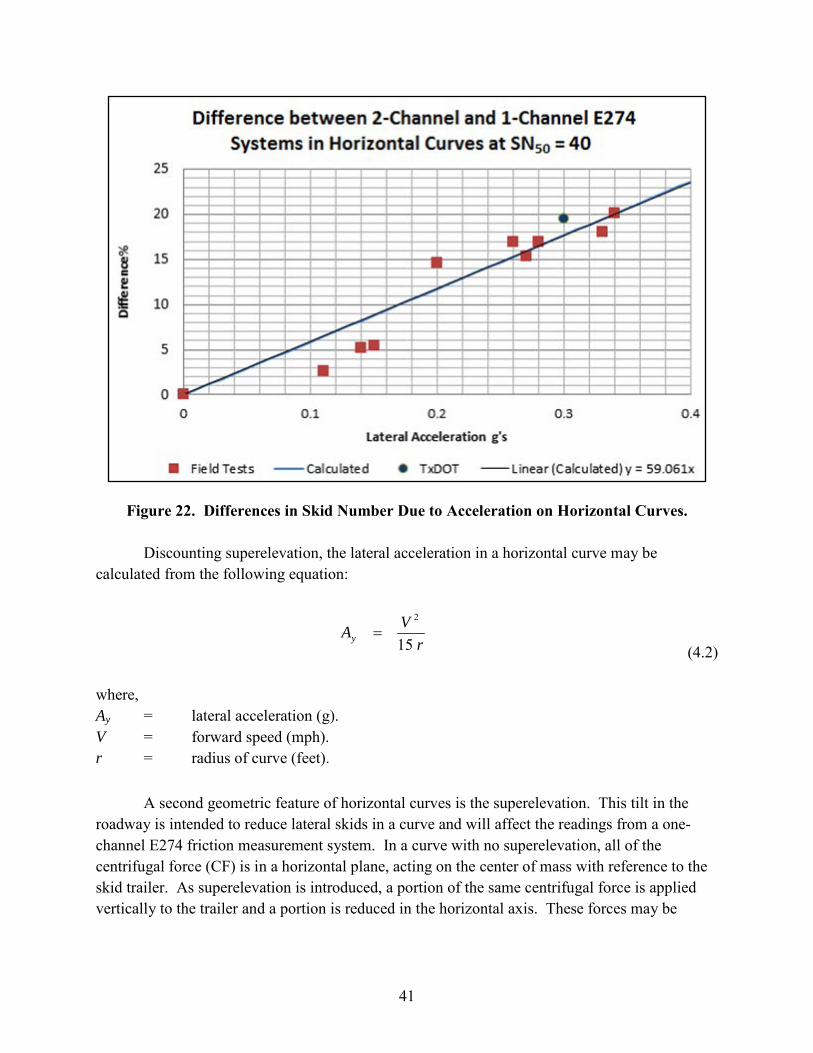
41
Figure 22. Differences in Skid Number Due to Acceleration on Horizontal Curves.
Discounting superelevation, the lateral acceleration in a horizontal curve may be calculated from the following equation:
rVAy 15
2
= (4.2)
where, Ay = lateral acceleration (g). V = forward speed (mph). r = radius of curve (feet).
A second geometric feature of horizontal curves is the superelevation. This tilt in the roadway is intended to reduce lateral skids in a curve and will affect the readings from a one-channel E274 friction measurement system. In a curve with no superelevation, all of the centrifugal force (CF) is in a horizontal plane, acting on the center of mass with reference to the skid trailer. As superelevation is introduced, a portion of the same centrifugal force is applied vertically to the trailer and a portion is reduced in the horizontal axis. These forces may be

42
expressed, based on the superelevation θ, as CF × sinθ in the vertical direction, and CF × cosθ in the horizontal direction, relative to the trailer, as shown exaggerated in Figure 23.
Figure 23. Analysis of a Curved and Banked Section.
For example, if the superelevation of a curve is 8%, the angle θ is 4.6°. The downward force is then computed to be CF × sinθ = CF × sin(4.6°) = 0.08 CF, while the side force on the trailer center-of-gravity is CF × cosθ = CF × cos(4.6°) = 0.997 CF. The addition of the small down force on both wheels can be measured by accelerometers and can slightly affect the change in load on the left test wheel with respect to direction of the turn.
GRADE CHANGES
Grade changes or vertical curves were tested in this project because of inertial effects induced by up to down or down to up motions on the dynamic weight of the test wheel. If not measured, the increased or reduced load could significantly affect the skid number determined by dividing the drag force by the vertical load on the test wheel.
Most grade changes on public roadways are designed to avoid accelerations that would be uncomfortable to the average driver. If the accelerations are less than about 0.02 g, the effect on the skid number is probably negligible. Grade changes for testing in this project were chosen to cover vertical accelerations in the range of 0.02 g to 0.13 g. A grade changing from uphill to downhill is described as concave down, while a curve that goes from downhill to uphill is called concave up.

43
Table 11 summarizes data collected on sections with grade changes. These measurements were made in the very short transition between up to down or down to up direction on the grade change. Measurements on constant uphill or downhill grades were not made because their steady state nature does not produce inertial loading of the system.
Table 11. Summary of Data Collected on Vertical Curves.
Section Roadway Concave SN50 2cha SN50 1cha Vertical gb % Error G3S Goodson Bend Down 49.5 46.1 -0.054 -6.9 G3N Goodson Bend Down 28.1 26.5 -0.054 -5.5 G5 Silver Hill Down 54.2 50.6 0.134 -6.6 G9 OSR Up 59.2 61.0 0.021 3.0
a Determined from data collected with TTI skid trailer b Determined using Vericom VC3000 instrument
Highway grade changes or vertical curves will produce inertial load changes on the test
wheel of the E274 system based on the forward speed and effective radius of the curve. From Newton’s second law, the acceleration acting on the center-of-gravity of the trailer will produce a change in weight according to the formula:
amF ×= (4.3)
where, F = force. m = mass. a = acceleration (g).
With the system stationary or free rolling on a tangent roadway, the effective mass of the test wheel is 33.7 slugs, and the acceleration downward is 1 g resulting in a force or weight of 1085 lb. When the trailer rides over the crest of a hill, the acceleration is less than 1 g, and the vertical wheel force will be less than 1085 lb. Driving through a dip in the road, the downward acceleration will be greater than 1 g, increasing the wheel load. These vertical load changes are not measured by the TxDOT system and will produce different skid numbers than a two-channel system.
For example, if a grade change produced an acceleration change of 0.1 g, the effect on the test wheel would be 1085 × 0.1 or a change in weight of 108.5 lb. A one-channel system would continue to use 1085 lb as the wheel load, producing about a 10 percent difference in skid number from the actual value.
The vertical acceleration caused by a grade change was measured directly by means of an accelerometer and recording system, and also derived graphically from a SurPRO profile, as shown in Figure 24. This graphical method first requires finding the radius of the vertical curve

44
by drawing an arc of constant radius to best fit the crown or valley of the grade change. A chord is then drawn across the arc in the horizontal plane. The length of the chord w is then measured based on the scale of the graph as well as the height h of the midpoint of the arc to the chord. The radius r of the vertical curve is then computed from the following formula:
hwhr82
2
+= (4.4)
Figure 24. Graphical Determination of Radius of Vertical Curve on Section G5.
Once the radius is known, the change in acceleration due to the centrifugal force may be determined from the following equation:
rVAz 15
2
=∆ (4.5)
where, ∆Az = change in vertical acceleration (g). V = forward speed (mph). r = radius of the vertical curve (ft).
Given h = 9 inches and w = 1115 inches from Figure 24, researchers computed the radius of the vertical curve on section G5 to be 17,272 inches or 1439 ft. Given this radius, and a test speed of 50 mph, a change in vertical acceleration of 0.12 g is determined from Equation 4.5,

45
which corresponds to a change in test wheel load of 130 lb. Researchers note that the graphical method gave a value that compares favorably with the measurement of 0.13 g obtained from an accelerometer and data recording system mounted on the test vehicle.
Figure 25 shows the calculated difference between skid numbers determined from one- and two-channel E274 systems as the vertical acceleration varies from 0 to 0.2 g, either upward or downward. The linear relationship shown in the figure is based on a skid number of 40 and a test speed of 50 mph. For comparison, the differences based on field measurements are plotted as red squares. The highest level of vertical acceleration measured on public roads during this project was 0.13 g. The majority of grade changes researchers evaluated were less than 0.08 g, with the vertical accelerations being much less on primary roads.
DISCUSSION OF TEST RESULTS
To determine if the TxDOT roadway friction measurement systems meet all the requirements of ASTM E274, there is a need to review each paragraph of that standard. As with all ASTM standards, a requirement beginning with the word “shall” indicates that the requirement must be adhered to with no exceptions. If the requirement begins with “should,” there is some room for variation using sound engineering judgment and justification.
ASTM E274 makes little reference to the measurement of nontangent roadway sections with either a two-channel or a one-channel system. The two-channel system measures dynamic drag force and vertical wheel load to compute coefficient of friction or skid number and has been shown to accurately measure nontangent sections.
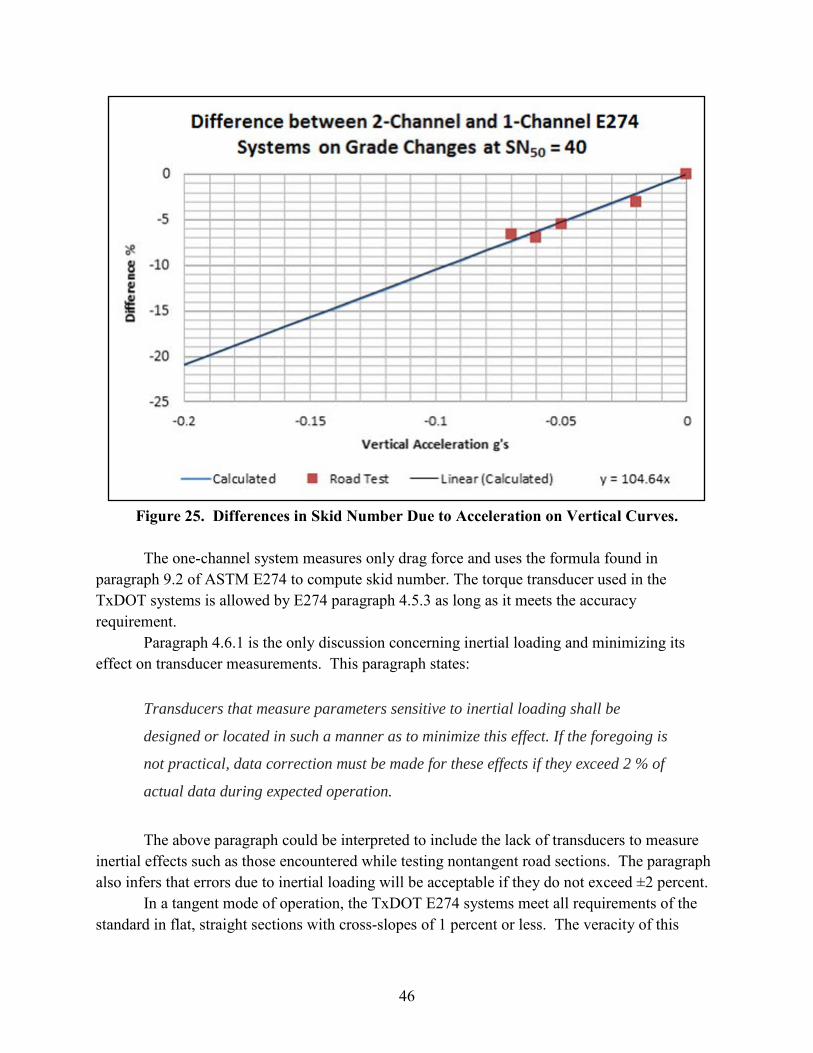
46
Figure 25. Differences in Skid Number Due to Acceleration on Vertical Curves.
The one-channel system measures only drag force and uses the formula found in paragraph 9.2 of ASTM E274 to compute skid number. The torque transducer used in the TxDOT systems is allowed by E274 paragraph 4.5.3 as long as it meets the accuracy requirement.
Paragraph 4.6.1 is the only discussion concerning inertial loading and minimizing its effect on transducer measurements. This paragraph states:
Transducers that measure parameters sensitive to inertial loading shall be
designed or located in such a manner as to minimize this effect. If the foregoing is
not practical, data correction must be made for these effects if they exceed 2 % of
actual data during expected operation.
The above paragraph could be interpreted to include the lack of transducers to measure
inertial effects such as those encountered while testing nontangent road sections. The paragraph also infers that errors due to inertial loading will be acceptable if they do not exceed ±2 percent.
In a tangent mode of operation, the TxDOT E274 systems meet all requirements of the standard in flat, straight sections with cross-slopes of 1 percent or less. The veracity of this

47
statement is verified annually by an evaluation and correlation between the TxDOT system and the TTI Area Reference Measurement System in accordance with ASTM E2793 (2012).
While operating the TTI ARFMS in two-channel and one-channel modes on horizontal curves, vertical curves, and roughness sections, this project found that the 2 percent tolerance was exceeded under certain conditions. Horizontal curves were shown to produce significant differences between one- and two-channel skid numbers. As the radius of the curve decreased and the test speed remained at 50 mph, the lateral acceleration acting on the trailer increased, causing the test wheel vertical load to change. If this load change is not measured, significant errors in skid number arise. Both computed and empirical data show a difference of about 6 percent in skid number per 0.1 g of lateral acceleration between the two- and one-channel methods. This effect is linear so that to remain under 2 percent, the lateral acceleration would need to be less than 0.033 g.
Vertical curves or grade changes cause vertical load changes on the test wheel, making the load heavier in dips and lighter in crests. Since the inertial loading acts directly on the mass of the trailer, it has a greater effect on the test wheel load compared to its effect on a horizontal curve. But during this study, vertical curve accelerations over 0.1 g were rare, with the majority at 0.05 g or less on secondary roads and much less on primary roads. On vertical curves, both computed and empirical data show a difference of about 10 percent in skid number per 0.1 g of acceleration between the two- and one-channel methods. This effect is also linear so that to remain under 2 percent, the vertical acceleration would need to be less than 0.02 g.
Tangent roughness can cause the vertical load on the test wheel to change dramatically, but it has been found that due to the natural frequency of the trailer suspension and the one second averaging period during the locked wheel test, the sine wave shape of most roughness profiles averages to an equivalent steady state load. Since there are near infinite variations of wavelengths and amplitudes of roughness, it would be very difficult to quantify this effect for each possible condition. A general statement would be that wavelengths of less than 73 feet at 50 mph have shown not to create significant errors between the two- and one-channel systems.
Given the results from the field tests presented in this chapter, researchers provide a list of initial recommendations that TxDOT should consider to reduce the errors in skid measurements made with one-channel ASTM E274 systems. The options available to TxDOT are developed in more detail in the final chapter of this report. These options include the following:
• Avoid skid testing geometric sections that exceed the acceleration limits described above. • Skid test short radius horizontal curves in both directions and provide both skid numbers
for averaging to reduce the vertical loading and unloading effects. • Instrument the trailer to measure the lateral and vertical accelerations and use
mathematical algorithms to determine the dynamic vertical test wheel loads either in real-time or through post-processing the raw test data.

48
• Replace the one-axis torque transducer with a two-axis force transducer and update the instrumentation and software.
• Replace the existing E274 systems with new units from ICC or Dynatest.
51
CHAPTER V. COMPARATIVE EVALUATION OF LOCKED-WHEEL AND FIXED SLIP SKID SYSTEMS
As stated at the beginning of this report, this research project aims to evaluate TxDOT’s existing method for measuring pavement surface friction. To this end, researchers conducted a comparative evaluation of one- and two-channel locked-wheel skid systems, which identified certain roadway geometric conditions that introduce inaccuracies in friction measurements with the current one-channel ASTM E274 systems used by the department. Given these results, there is a need to identify and recommend methods to reduce or eliminate the susceptibility to measurement errors due to inertial forces acting on the trailer under certain test conditions. Thus, researchers moved forward to Phase II of the project and investigated options on how TxDOT can improve its friction measurement capability. This investigation included an evaluation of fixed-slip and locked-wheel friction measurement systems, which was conducted jointly with a demonstration project sponsored by FHWA.
Under the existing practice, most states use locked-wheel skid trailers to maintain an inventory of skid numbers over their highway networks. This friction tester does not simulate present-day anti-lock braking systems unlike the relatively recent variable-slip and fixed-slip devices that are used in other countries. In the US, fixed-slip systems have been used predominantly for airport runway evaluations. However, Dynatest is now marketing the model 6875H fixed-slip system for highway friction testing. This system is currently used by one state and the FHWA.
FHWA Technical Advisory T 5040.38 (2010) recommended locked-wheel and fixed-slip systems as appropriate methods for evaluating pavement friction on US highways. Given this recommendation and the project objectives, researchers conducted a comparative evaluation of these two systems as part of investigating options by which TxDOT can improve its friction measurement capability. Chapter V documents this comparative evaluation. The chapter identifies the sections tested, the types of data collected, and the skid vehicles used to collect the data; describes the manner in which test data were collected; provides tables of the test measurements; and presents results from the comparisons of fixed-slip and locked-wheel friction numbers.
TEST SECTIONS
Researchers initially established test sections on which side-by-side tests were conducted to collect data for comparing skid numbers determined from fixed-slip and locked wheel skid measurements. In terms of surface texture, the sections covered a range of surfaces that include seal coats or surface treatments, a dense-graded hot-mix asphalt (HMA) surface, a permeable friction course, a concrete pavement with conventional transverse tines, and a concrete bridge deck with longitudinal tines. These sections included six skid calibration sections located at the Texas A&M Riverside Campus and 11 test sections on in-service pavements located in Brazos and Grimes Counties.
52
Table 12 identifies the sections where skid measurements were collected. The locations of these sections are also shown on the Google Earth satellite images given in Figure 26–Figure 28. Example pictures of the surfaces tested are given in Figure 29. As observed from this figure and from the data presented later in this chapter, the test sections covered a good range of surface textures measured in terms of mean profile depth (MPD) from the circular track meter (CTM), and the locked-wheel skid number.
DATA COLLECTION
Skid measurements were collected using two E274 locked-wheel skid trailers and the Dynatest 6875H fixed slip skid system owned by FHWA. One of the locked-wheel skid trailers is the TTI E274 skid system, which meets the stringent requirements of ASTM E1890 (2012) and is used in calibrating other locked-wheel skid devices. TTI personnel operated this unit during the tests. The other locked-wheel skid trailer is owned by TxDOT and was operated by personnel from the department. Both locked-wheel skid trailers use smooth ASTM E524 (2012) test tires.
Figure 30 shows the FHWA fixed-slip skid system. Personnel from the TransTec Group out of Austin, Texas, operated this system during the tests, with Dynatest providing assistance in setting up the system for data collection and providing updated software for data processing. The Dynatest 6875H is also referred to as the highway friction tester (HFT). The HFT provides friction coefficients at 1-ft intervals and meets the requirements of the ASTM E2340 (2012) standard for continuous fixed slip friction measurement.
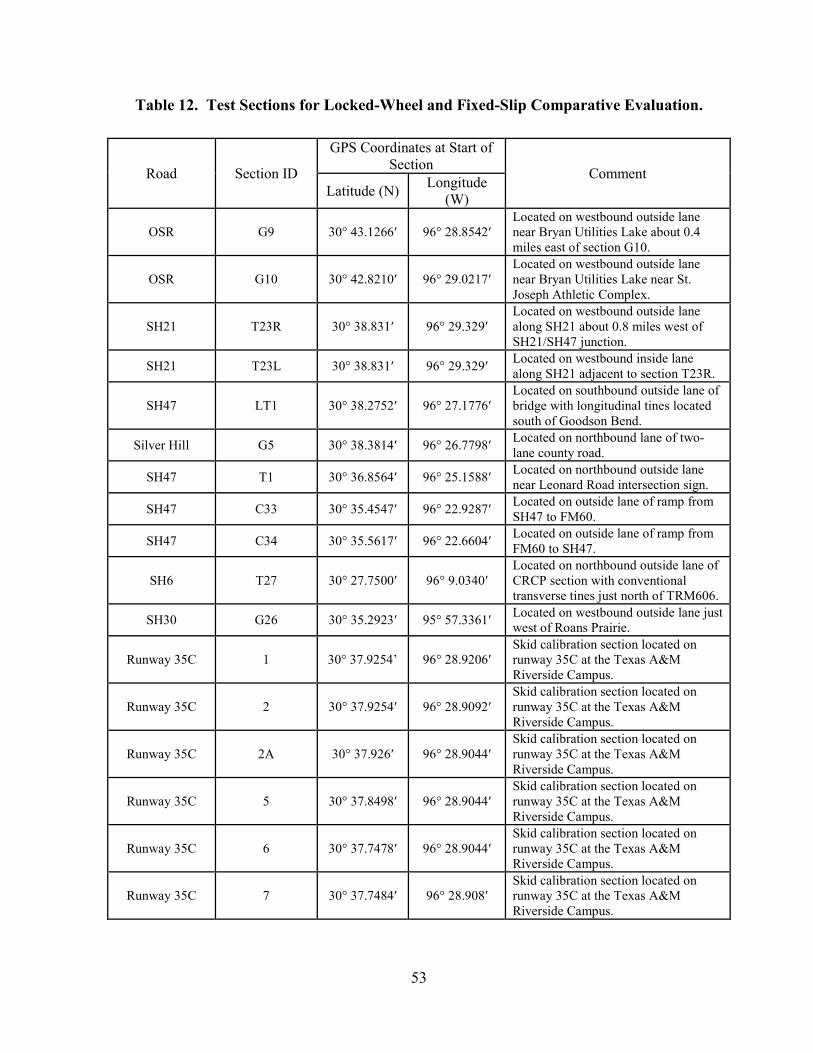
53
Table 12. Test Sections for Locked-Wheel and Fixed-Slip Comparative Evaluation.
Road Section ID
GPS Coordinates at Start of Section Comment
Latitude (N) Longitude (W)
OSR G9 30° 43.1266′ 96° 28.8542′ Located on westbound outside lane near Bryan Utilities Lake about 0.4 miles east of section G10.
OSR G10 30° 42.8210′ 96° 29.0217′ Located on westbound outside lane near Bryan Utilities Lake near St. Joseph Athletic Complex.
SH21 T23R 30° 38.831′ 96° 29.329′ Located on westbound outside lane along SH21 about 0.8 miles west of SH21/SH47 junction.
SH21 T23L 30° 38.831′ 96° 29.329′ Located on westbound inside lane along SH21 adjacent to section T23R.
SH47 LT1 30° 38.2752′ 96° 27.1776′ Located on southbound outside lane of bridge with longitudinal tines located south of Goodson Bend.
Silver Hill G5 30° 38.3814′ 96° 26.7798′ Located on northbound lane of two-lane county road.
SH47 T1 30° 36.8564′ 96° 25.1588′ Located on northbound outside lane near Leonard Road intersection sign.
SH47 C33 30° 35.4547′ 96° 22.9287′ Located on outside lane of ramp from SH47 to FM60.
SH47 C34 30° 35.5617′ 96° 22.6604′ Located on outside lane of ramp from FM60 to SH47.
SH6 T27 30° 27.7500′ 96° 9.0340′ Located on northbound outside lane of CRCP section with conventional transverse tines just north of TRM606.
SH30 G26 30° 35.2923′ 95° 57.3361′ Located on westbound outside lane just west of Roans Prairie.
Runway 35C 1 30° 37.9254’ 96° 28.9206′ Skid calibration section located on runway 35C at the Texas A&M Riverside Campus.
Runway 35C 2 30° 37.9254′ 96° 28.9092′ Skid calibration section located on runway 35C at the Texas A&M Riverside Campus.
Runway 35C 2A 30° 37.926′ 96° 28.9044′ Skid calibration section located on runway 35C at the Texas A&M Riverside Campus.
Runway 35C 5 30° 37.8498′ 96° 28.9044′ Skid calibration section located on runway 35C at the Texas A&M Riverside Campus.
Runway 35C 6 30° 37.7478′ 96° 28.9044′ Skid calibration section located on runway 35C at the Texas A&M Riverside Campus.
Runway 35C 7 30° 37.7484′ 96° 28.908′ Skid calibration section located on runway 35C at the Texas A&M Riverside Campus.

54
Figure 26. Aerial View of Skid Test Pads.

55
Fi
gure
27.
Aer
ial P
hoto
of F
ield
Tes
t Sec
tions
Wes
t of B
ryan
/Col
lege
Sta
tion.
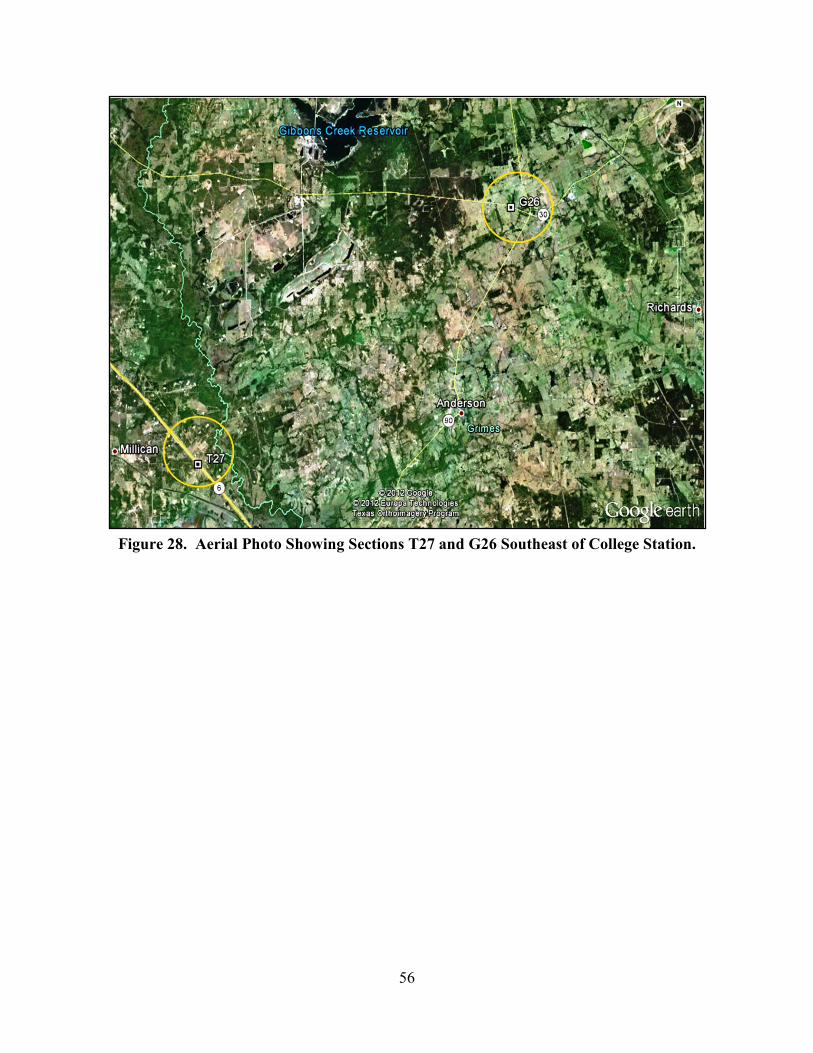
56
Figure 28. Aerial Photo Showing Sections T27 and G26 Southeast of College Station.
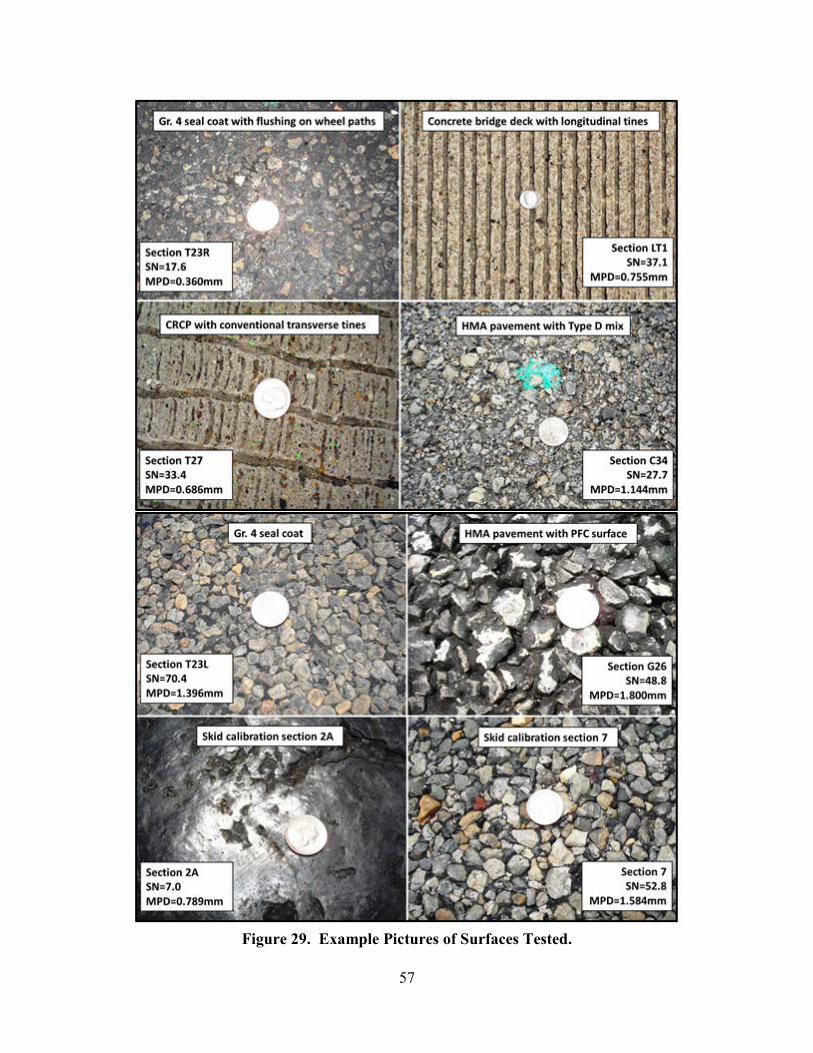
57
Figure 29. Example Pictures of Surfaces Tested.

58
Figure 30. Dynatest 6875H Fixed-Slip Skid System.
Figure 31 illustrates the test tire on the Dynatest 6875H. This particular photograph is from a different unit that was tested at the 2011 Penn State International Friction Workshop but is presented herein to show the test tire used with the HFT. The test tire is driven at a fixed slip of 13 percent according to an email communication from Frank Holt of Dynatest. The equipment generates a water flow of 28 gpm at 40 mph, and can continuously test 72,000 ft of pavement with its 500-gallon water tank plus reserves.
Skid measurements on the test sections identified in Table 12 were conducted over a three-day period. The six skid calibration sections were tested on the first day while the 11 highway pavement sections were tested in day 2 and day 3. At the skid pads, TTI personnel marked the start of each section with a cone. On the 11 highway test sections, a stake with flagging tape was placed on the shoulder at the beginning and end of each section. In addition, TTI personnel measured a distance of 500 ft upstream of each section to provide the length of lead-in required for the HFT runs. Table 13 shows the test setups for the HFT runs.

59
Figure 31. Dynatest 6875H Wheel Assembly with Test Tire.
Table 13. Setup of HFT Runs on Test Sections.
Test Section Distance (ft) Programmed Action at Specified Distance
Riverside skid calibration sections
-500 Start distance measuring instrument (DMI) at start of lead-in -250 Test tire lowered on pavement; water flow starts
0 HFT starts collecting data; event marker placed in data file 600 End of HFT test (data collected over a 600-ft interval)
T23R and T23L
-500 Start DMI at start of lead-in -300 Test tire lowered on pavement; water flow starts -100 HFT starts collecting data
0 Event marker placed at start of section 900 End of HFT test (data collected over a 1000-ft interval)
G9 and G10
-500 Start DMI at start of lead-in for section G9 -300 Test tire lowered on pavement; water flow starts -100 HFT starts collecting data
0 Event marker placed at start of section G9 1612 Event marker placed at start of 500-ft lead-in to section G10 2112 Event marker placed at start of section G10 2700 End of HFT test (data collected over a 2800-ft interval)
All other highway sections
-500 Start DMI at start of lead-in for section -300 Test tire lowered on pavement; water flow starts -100 HFT starts collecting data
0 Event marker placed at start of section 500 End of HFT test (data collected over a 600-ft interval)
60
For the locked-wheel trailer runs, the operators triggered the tests at the beginning of each section using the start button on each vehicle. Since the data from the locked-wheel system provide the time at which wheel lock-up occurred, it was possible to determine the average friction coefficient from the HFT measurements over the same interval of the wheel lock-up. In this way, researchers compared test results based on HFT friction coefficients determined over the same (or as close to the same) interval over which the skid numbers from the locked-wheel systems were determined.
All runs were made at 50 mph, which is the standard TxDOT ASTM E274 test speed. On each section, an HFT run was first performed to collect dry texture laser measurements on the test wheel path (the left wheel path on all sections). After this texture run, six repeat runs were made on each Riverside skid section, and three on each highway section, with each operator taking turns one after the other. Each device was run within minutes of the other two. Thus, the effect of changes in ambient conditions was considered to be minimal. While both the locked-wheel and the HFT apply a water film thickness of 0.02 in (0.5mm), no puddling was observed during repeat runs on each section. This observation is consistent with tests conducted over the years at the TTI Proving Ground skid pads, which have shown that the water applied from repeat calibration runs does not influence the friction numbers because of drainage provided by the pavement cross-slope.
After each day of tests, everyone involved got together at the conference room in Building 7091 of the Texas A&M Riverside Campus. During each meeting, test data from all three devices were shared between all participants. In addition, the data were processed to get the locked-wheel skid numbers and the corresponding friction numbers from the HFT runs, based on measurements collected over the same (or as close to the same) interval of the wheel lock-up on corresponding locked-wheel trailer runs. This information was also entered into an Excel spreadsheet for the purpose of comparing the HFT and locked-wheel skid numbers.
COMPARISON OF HFT AND LOCKED-WHEEL FRICTION NUMBERS
Table 14 gives summary statistics of the friction measurements made with the locked-wheel skid trailers and the highway slip friction tester on the sections tested in this comparative evaluation. The locked-wheel skid numbers and the HFT friction numbers are averages of the corresponding quantities determined from repeat runs on each section. In general, the measurements from repeat runs are repeatable, as reflected in the standard deviations given in Table 14. It is observed that the friction numbers (friction coefficient µ × 100) from the HFT are consistently higher than the skid numbers from both locked-wheel skid trailers except for skid section 2A, which has a friction value of below 10. Table 14 also shows that the test sections covered a good range of HFT friction numbers from a low value of about 8 percent to a high value of about 85 percent.

61
Table 14. Locked-Wheel Skid Numbers and HFT Friction Numbers from Tests.
Section Locked-Wheel Skid Number HFT Friction Number
(µ × 100) TxDOT TTI Average Std. dev. Average Std. dev. Average Std. dev.
1 27.2 1.47 23.9 0.85 39.5 2.11 2 23.2 0.98 19.1 1.00 26.5 1.39
2A 8.9 0.90 7.0 0.50 7.6 1.28 5 45.1 2.54 43.1 1.17 63.7 2.29 6 38.9 2.04 39.8 2.49 62.4 2.14 7 53.3 0.82 52.8 2.27 72.9 3.14
T23R 23.8 2.63 17.6 2.07 35.9 1.18 T23L 65.7 2.89 70.4 0.45 81.8 3.27 G9 59.0 5.29 40.6 4.22 72.0 1.45 G10 53.0 3.61 47.0 2.78 79.6 1.55 G5 50.3 1.53 59.7 3.20 80.3 0.12 T1 45.0 3.00 45.7 5.77 75.1 6.45
C33 64.0 2.00 64.9 1.12 85.1 3.12 C34 28.3 2.09 27.7 1.02 48.7 1.91 T27 32.7 1.15 33.4 4.39 64.8 1.77 G26 49.0 1.00 48.8 0.15 69.0 1.22 LT1 39.0 2.65 37.1 0.91 69.3 1.50
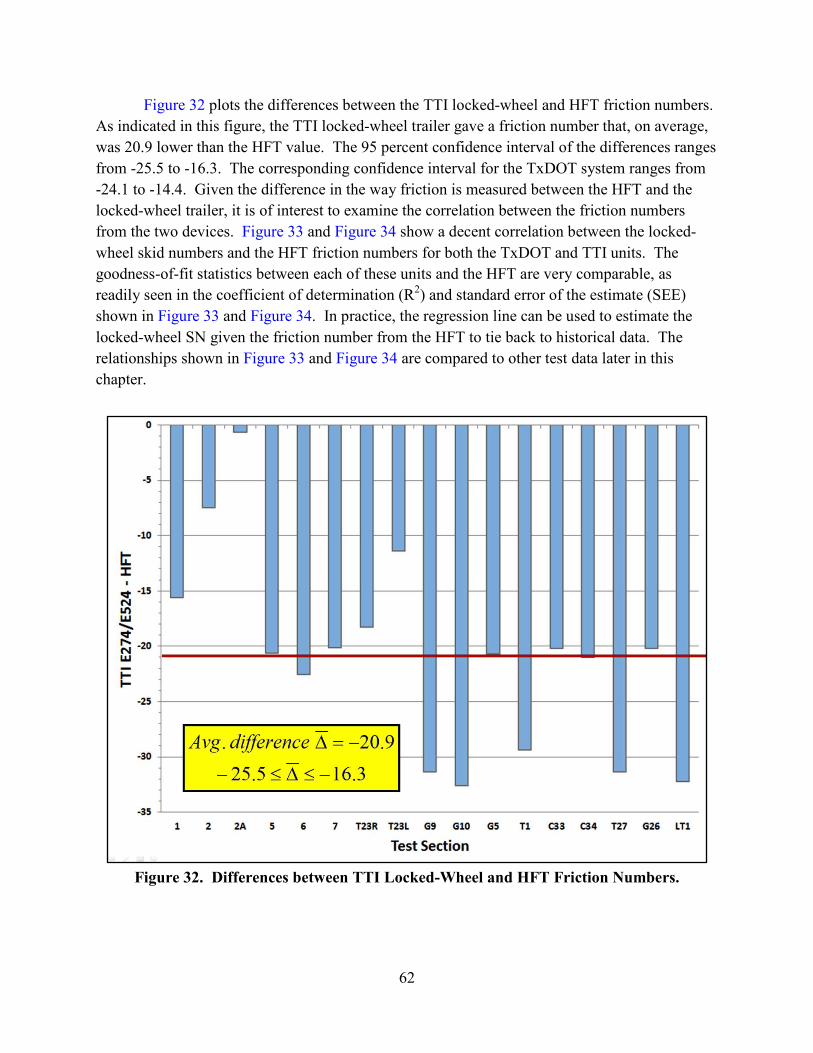
62
Figure 32 plots the differences between the TTI locked-wheel and HFT friction numbers. As indicated in this figure, the TTI locked-wheel trailer gave a friction number that, on average, was 20.9 lower than the HFT value. The 95 percent confidence interval of the differences ranges from -25.5 to -16.3. The corresponding confidence interval for the TxDOT system ranges from -24.1 to -14.4. Given the difference in the way friction is measured between the HFT and the locked-wheel trailer, it is of interest to examine the correlation between the friction numbers from the two devices. Figure 33 and Figure 34 show a decent correlation between the locked-wheel skid numbers and the HFT friction numbers for both the TxDOT and TTI units. The goodness-of-fit statistics between each of these units and the HFT are very comparable, as readily seen in the coefficient of determination (R2) and standard error of the estimate (SEE) shown in Figure 33 and Figure 34. In practice, the regression line can be used to estimate the locked-wheel SN given the friction number from the HFT to tie back to historical data. The relationships shown in Figure 33 and Figure 34 are compared to other test data later in this chapter.
Figure 32. Differences between TTI Locked-Wheel and HFT Friction Numbers.
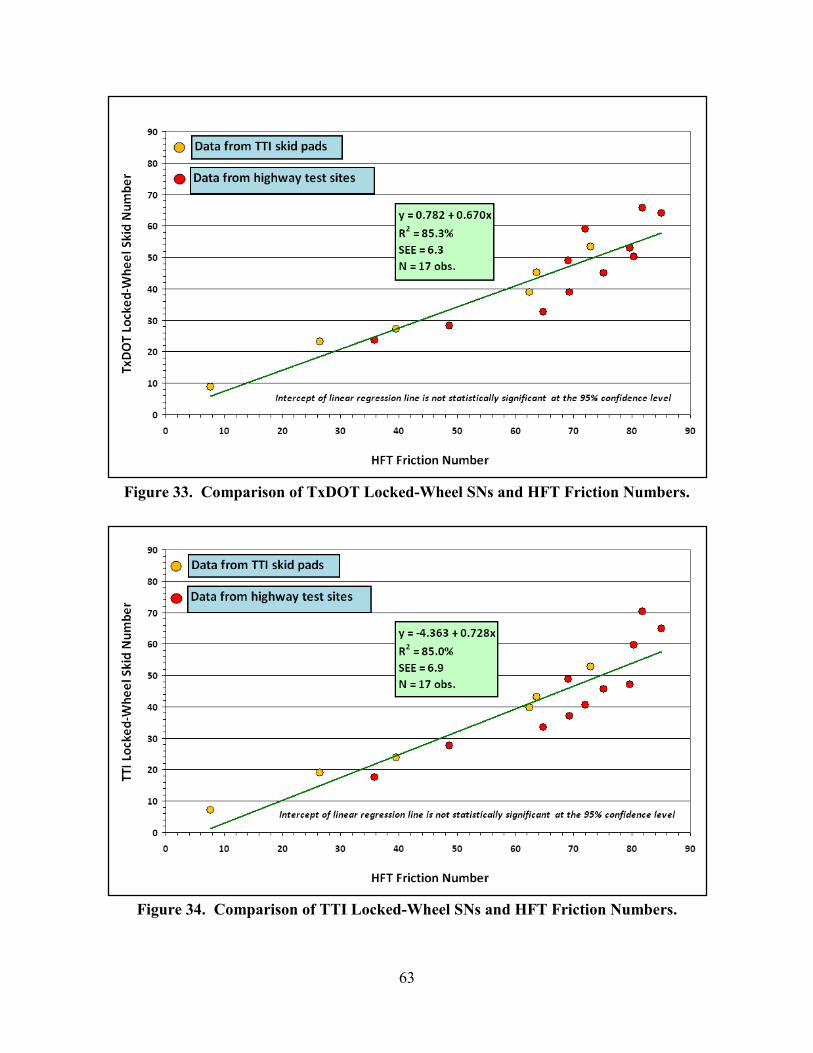
63
Figure 33. Comparison of TxDOT Locked-Wheel SNs and HFT Friction Numbers.
Figure 34. Comparison of TTI Locked-Wheel SNs and HFT Friction Numbers.

64
It is observed that the data from the TTI skid calibration sections (identified by the yellow dots) plot closer to the regression line compared to the data from the highway test sections (identified by the red dots). Thus, much of the prediction error is associated with the data from the highway test sites. This observation is evident in Table 15, which compares the goodness-of-fit statistics obtained when the regression analysis is done separately, using only test data collected on the TTI skid pads and using only the data from the highway test sites. The R2 statistics are higher, and the SEEs are lower for the regression equations based solely on the skid pad data compared to the statistics from regression of the highway test data.
Researchers are of the opinion that the better fit obtained with the skid pad data reflect the controlled conditions under which the tests were conducted on these fairly flat, tangent skid pad sections. In particular, reflective stripes placed on each side of the wheel path helped guide the operators on their runs, thus reducing the error associated with wheel path tracking. In addition, there is no highway traffic on these sections. As such, it was easier for operators to focus on making good runs as they did not have to watch out for vehicles other than those involved with skid testing.
Table 15. Goodness-of-Fit Statistics from Regression of Locked-Wheel and HFT Friction Numbers.
Friction Numbers Compared
Test Data Regression Coefficients R2
(percent) SEE Number of Observations Intercepta Slopeb
TxDOT vs. HFT
Skid pads 4.145 0.630 96.9 3.2 6 Highway test sites -10.794 0.825 76.6 7.2 11
All test sites 0.782 0.670 85.3 6.3 17
TTI vs. HFT
Skid pads 0.485 0.670 98.0 2.7 6 Highway test sites -21.127 0.952 79.8 7.6 11
All test sites -4.363 0.728 85.0 6.9 17
TxDOT vs. TTI
Skid pads 3.655 0.941 99.1 1.7 6 Highway test sites 10.825 0.793 80.3 6.6 11
All test sites 6.919 0.868 89.2 5.4 17
a All intercept terms are not statistically significant at the 95% confidence level. b All slope coefficients are statistically significant at the 95% confidence level.
Table 15 compares the skid numbers between the two locked-wheel units. As before, the
data from the skid pads plot close to the regression line shown in the figure. In addition, the data from the highway test sections generally plot close to the regression line, with the exception of
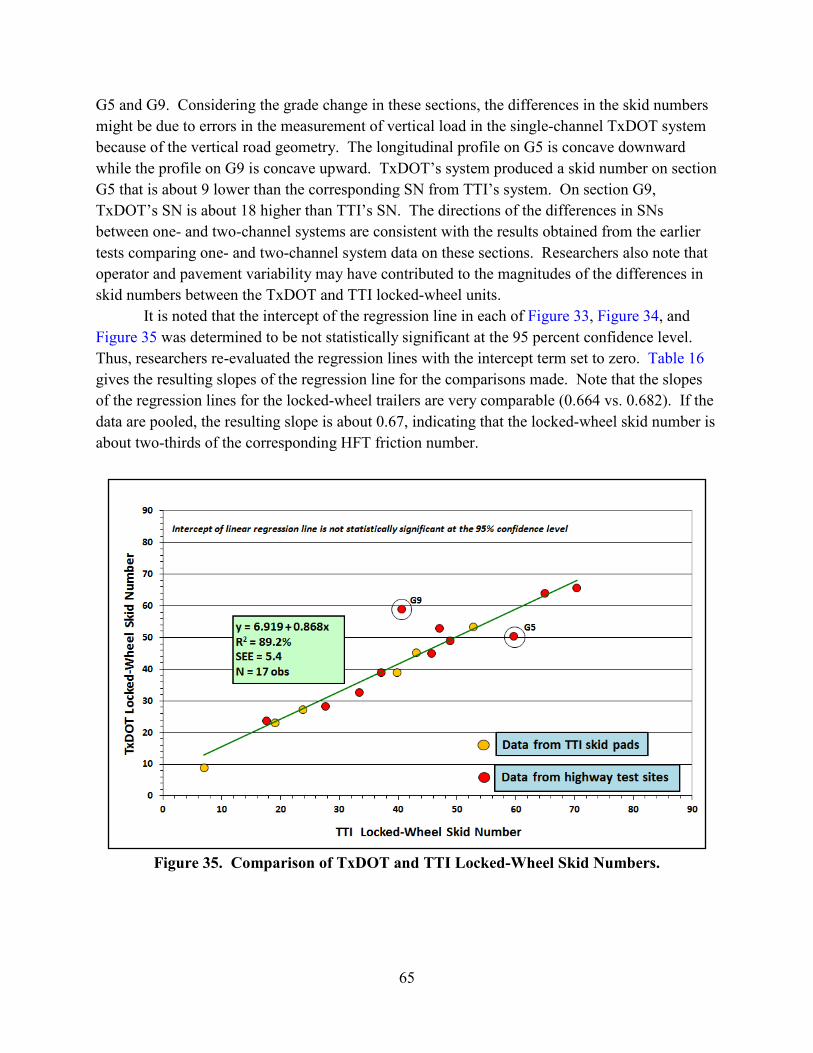
65
G5 and G9. Considering the grade change in these sections, the differences in the skid numbers might be due to errors in the measurement of vertical load in the single-channel TxDOT system because of the vertical road geometry. The longitudinal profile on G5 is concave downward while the profile on G9 is concave upward. TxDOT’s system produced a skid number on section G5 that is about 9 lower than the corresponding SN from TTI’s system. On section G9, TxDOT’s SN is about 18 higher than TTI’s SN. The directions of the differences in SNs between one- and two-channel systems are consistent with the results obtained from the earlier tests comparing one- and two-channel system data on these sections. Researchers also note that operator and pavement variability may have contributed to the magnitudes of the differences in skid numbers between the TxDOT and TTI locked-wheel units.
It is noted that the intercept of the regression line in each of Figure 33, Figure 34, and Figure 35 was determined to be not statistically significant at the 95 percent confidence level. Thus, researchers re-evaluated the regression lines with the intercept term set to zero. Table 16 gives the resulting slopes of the regression line for the comparisons made. Note that the slopes of the regression lines for the locked-wheel trailers are very comparable (0.664 vs. 0.682). If the data are pooled, the resulting slope is about 0.67, indicating that the locked-wheel skid number is about two-thirds of the corresponding HFT friction number.
Figure 35. Comparison of TxDOT and TTI Locked-Wheel Skid Numbers.
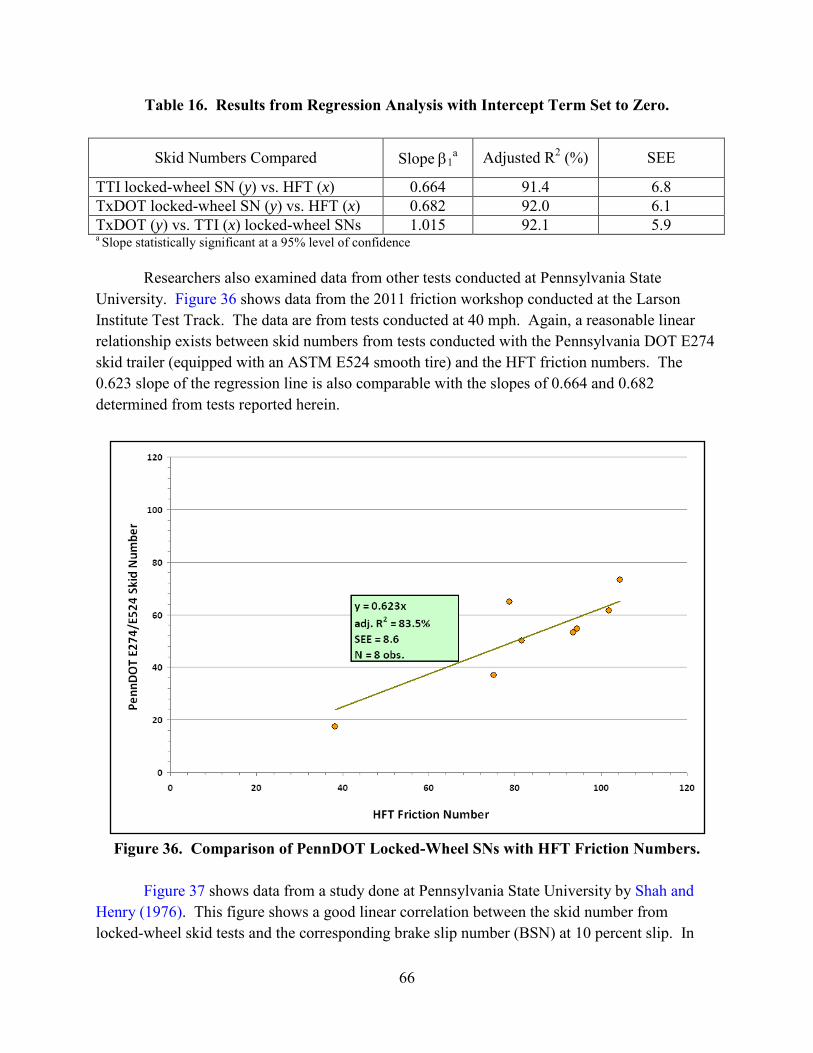
66
Table 16. Results from Regression Analysis with Intercept Term Set to Zero.
Skid Numbers Compared Slope β1a Adjusted R2 (%) SEE
TTI locked-wheel SN (y) vs. HFT (x) 0.664 91.4 6.8 TxDOT locked-wheel SN (y) vs. HFT (x) 0.682 92.0 6.1 TxDOT (y) vs. TTI (x) locked-wheel SNs 1.015 92.1 5.9 a Slope statistically significant at a 95% level of confidence
Researchers also examined data from other tests conducted at Pennsylvania State University. Figure 36 shows data from the 2011 friction workshop conducted at the Larson Institute Test Track. The data are from tests conducted at 40 mph. Again, a reasonable linear relationship exists between skid numbers from tests conducted with the Pennsylvania DOT E274 skid trailer (equipped with an ASTM E524 smooth tire) and the HFT friction numbers. The 0.623 slope of the regression line is also comparable with the slopes of 0.664 and 0.682 determined from tests reported herein.
Figure 36. Comparison of PennDOT Locked-Wheel SNs with HFT Friction Numbers.
Figure 37 shows data from a study done at Pennsylvania State University by Shah and Henry (1976). This figure shows a good linear correlation between the skid number from locked-wheel skid tests and the corresponding brake slip number (BSN) at 10 percent slip. In

67
this study, the researchers conducted tests at 40 mph with an ASTM E501 (2012) ribbed tire. If the regression analysis is done with the intercept term set to zero, the slope of the regression line is determined to be 0.704, which is again comparable with the slopes from the other tests reported herein.
EVALUATION OF INTERNATIONAL FRICTION INDICES
Researchers also compared the skid measurement devices in terms of the international friction index (IFI). The IFI was developed from the PIARC International Experiment to Compare and Harmonize Texture and Skid Resistance Measurements (Wambold et al., 1995). IFI permits harmonizing friction measurements collected with different devices to a common calibrated index. Researchers took the following steps to compare the locked-wheel and fixed-slip systems based on IFI:
• Run tests with the CTM in accordance with ASTM E2157-09 (2012) and with the dynamic friction tester (DFT) per ASTM E1911-09aε (2012).
• Determine IFI calibration coefficients following ASTM E1960 (2012). • Use the IFI calibration coefficients to compute the friction values at 60 kph (F60) for
each skid measurement device. • Compare the different skid devices based on calculated F60 values.
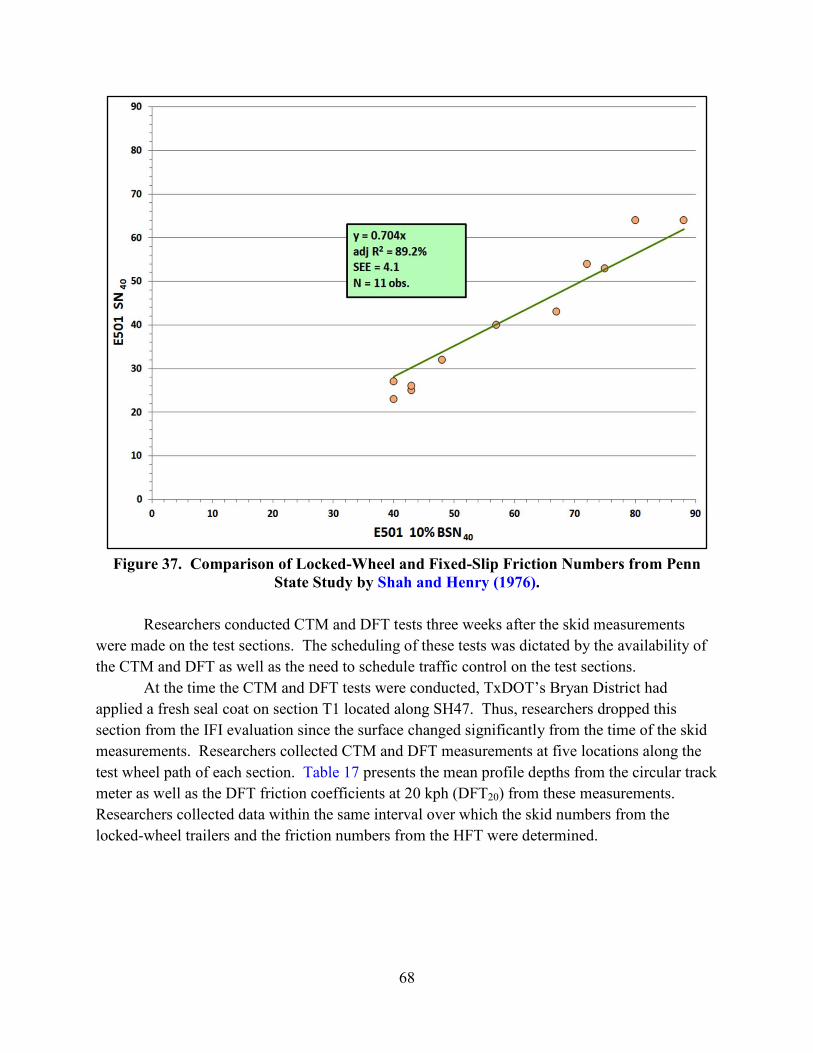
68
Figure 37. Comparison of Locked-Wheel and Fixed-Slip Friction Numbers from Penn
State Study by Shah and Henry (1976).
Researchers conducted CTM and DFT tests three weeks after the skid measurements were made on the test sections. The scheduling of these tests was dictated by the availability of the CTM and DFT as well as the need to schedule traffic control on the test sections.
At the time the CTM and DFT tests were conducted, TxDOT’s Bryan District had applied a fresh seal coat on section T1 located along SH47. Thus, researchers dropped this section from the IFI evaluation since the surface changed significantly from the time of the skid measurements. Researchers collected CTM and DFT measurements at five locations along the test wheel path of each section. Table 17 presents the mean profile depths from the circular track meter as well as the DFT friction coefficients at 20 kph (DFT20) from these measurements. Researchers collected data within the same interval over which the skid numbers from the locked-wheel trailers and the friction numbers from the HFT were determined.

69
Table 17. MPD and DFT20 Values Determined from CTM and DFT Tests.
Section ID Test Location CTM MPD (mm) DFT20
1
A 0.65 0.533 B 0.64 0.536 C 0.67 0.540 D 0.67 0.520 E 0.58 0.518
2
A 1.61 0.327 B 1.47 0.270 C 1.61 0.401 D 1.62 0.362 E 1.63 0.437
2A
A 0.82 0.140 B 0.65 0.159 C 0.44 0.187 D 0.42 0.217 E 0.60 0.217
5
A 2.43 0.570 B 2.37 0.511 C 2.59 0.684 D 2.66 0.767 E 2.88
6
A 1.61 0.437 B 1.69 0.505 C 1.98 0.534 D 1.58 0.513 E 1.73 0.521
7
A 1.58 0.781 B 1.63 0.687 C 1.55 0.707 D 1.53 0.742 E 1.63 0.727
T23R
A 0.36 0.382 B 0.36 0.389 C 0.38 0.448 D 0.33 0.481 E 0.37 0.455
T23L
A 1.52 0.873 B 1.44 0.880 C 1.32 0.837 D 1.30 0.899 E 1.40 0.840
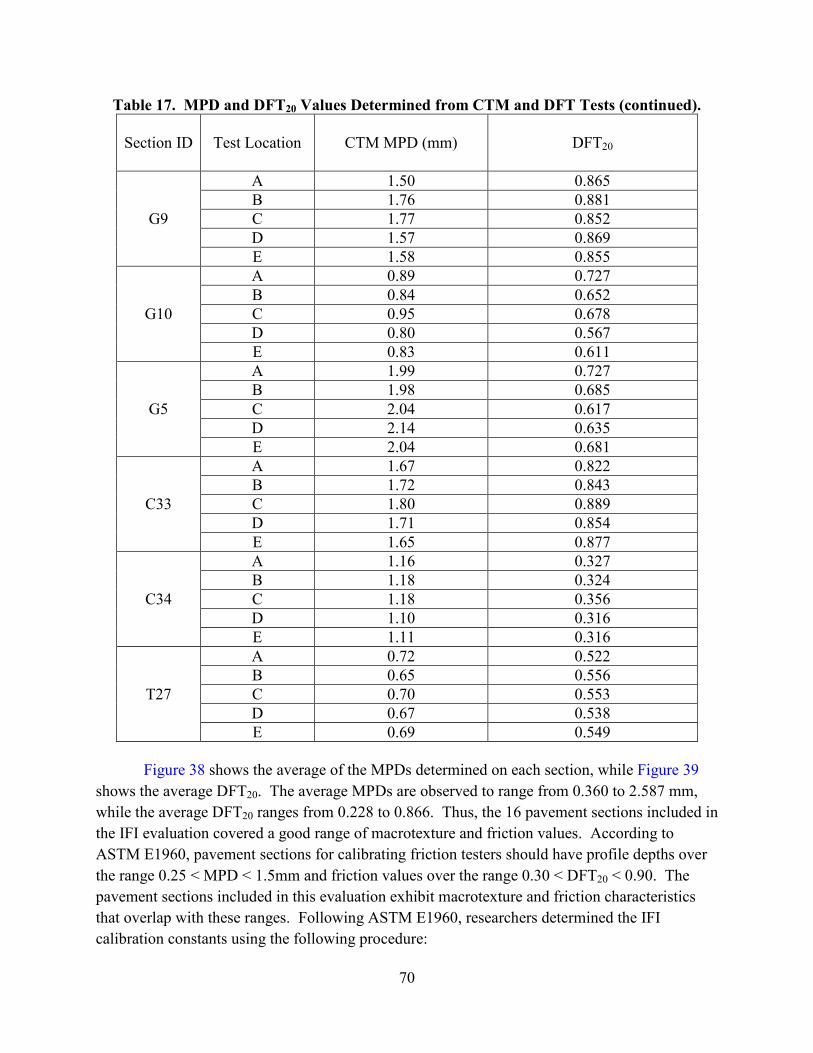
70
Table 17. MPD and DFT20 Values Determined from CTM and DFT Tests (continued).
Section ID Test Location CTM MPD (mm) DFT20
G9
A 1.50 0.865 B 1.76 0.881 C 1.77 0.852 D 1.57 0.869 E 1.58 0.855
G10
A 0.89 0.727 B 0.84 0.652 C 0.95 0.678 D 0.80 0.567 E 0.83 0.611
G5
A 1.99 0.727 B 1.98 0.685 C 2.04 0.617 D 2.14 0.635 E 2.04 0.681
C33
A 1.67 0.822 B 1.72 0.843 C 1.80 0.889 D 1.71 0.854 E 1.65 0.877
C34
A 1.16 0.327 B 1.18 0.324 C 1.18 0.356 D 1.10 0.316 E 1.11 0.316
T27
A 0.72 0.522 B 0.65 0.556 C 0.70 0.553 D 0.67 0.538 E 0.69 0.549
Figure 38 shows the average of the MPDs determined on each section, while Figure 39
shows the average DFT20. The average MPDs are observed to range from 0.360 to 2.587 mm, while the average DFT20 ranges from 0.228 to 0.866. Thus, the 16 pavement sections included in the IFI evaluation covered a good range of macrotexture and friction values. According to ASTM E1960, pavement sections for calibrating friction testers should have profile depths over the range 0.25 < MPD < 1.5mm and friction values over the range 0.30 < DFT20 < 0.90. The pavement sections included in this evaluation exhibit macrotexture and friction characteristics that overlap with these ranges. Following ASTM E1960, researchers determined the IFI calibration constants using the following procedure:

71
• Compute the speed constant Sp from the MPD (in mm) using the equation:
MPDS p 7.892.14 += (5.1)
• Compute the calibrated friction value at 60 kph (F60) from DFT20 and Sp using the equation:
−×+=
pSDFTF 40exp732.0081.060 20
(5.2)
• For a given skid measuring device, use the measured friction FRS for a given slip speed S with the speed constant Sp to compute the friction at 60 kph (FR60) using the equation:
−=
pSSFRSFR )60(exp60
(5.3)
• Determine the calibration constants A and B of the following equation from a linear regression of F60 and FR60:
6060 FRBAF ×+= (5.4)
For locked-wheel skid trailers, the slip speed S in Equation 5.3 is equal to the test speed V in kph, while for the HFT, the slip speed equals V multiplied by the percent slip, which is 13 percent for the Dynatest 6875H friction tester used in this evaluation. As noted previously, all skid devices were run at a test speed of 50 mph or 80.45 kph.

72
Figure 38. Average MPDs Determined from CTM Measurements on Each Section.
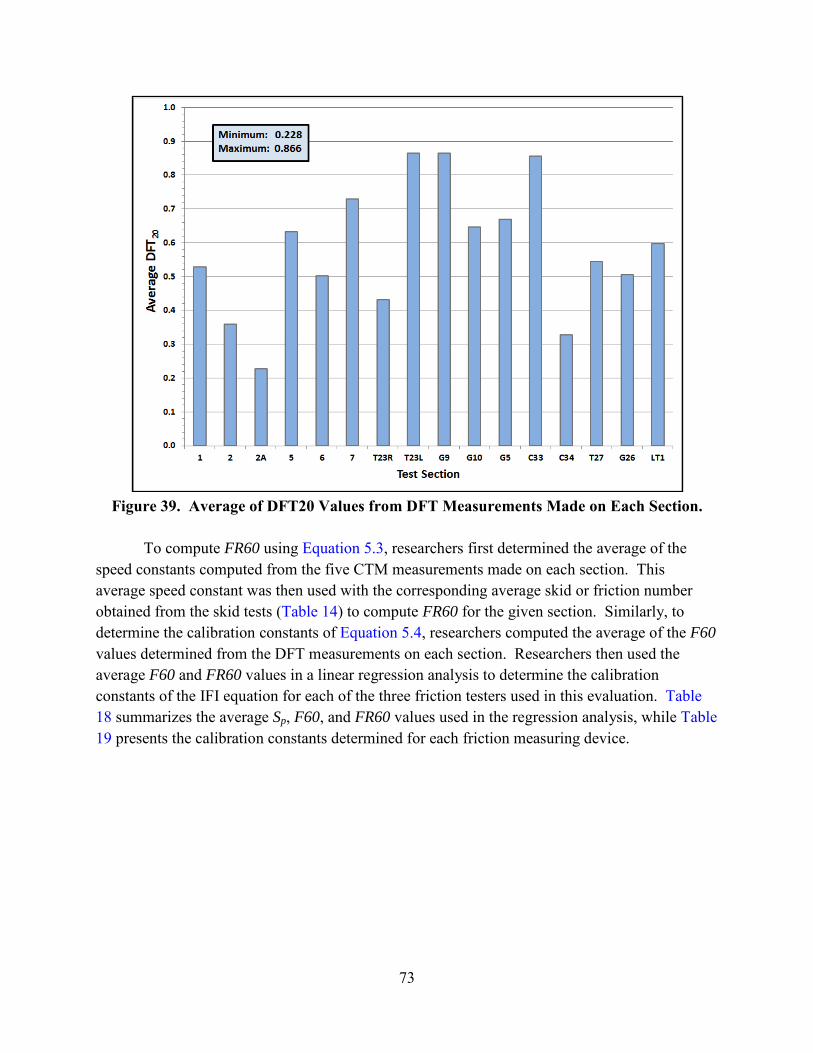
73
Figure 39. Average of DFT20 Values from DFT Measurements Made on Each Section.
To compute FR60 using Equation 5.3, researchers first determined the average of the speed constants computed from the five CTM measurements made on each section. This average speed constant was then used with the corresponding average skid or friction number obtained from the skid tests (Table 14) to compute FR60 for the given section. Similarly, to determine the calibration constants of Equation 5.4, researchers computed the average of the F60 values determined from the DFT measurements on each section. Researchers then used the average F60 and FR60 values in a linear regression analysis to determine the calibration constants of the IFI equation for each of the three friction testers used in this evaluation. Table 18 summarizes the average Sp, F60, and FR60 values used in the regression analysis, while Table 19 presents the calibration constants determined for each friction measuring device.

74
Table 18. Data for Determining IFI Calibration Constants.
Section Average Sp Average
F60 Average FR60
HFT TxDOT TTI 1 71.683 0.303 0.198 0.361 0.317 2 156.629 0.285 0.193 0.264 0.217
2A 85.011 0.185 0.043 0.113 0.089 5 246.209 0.473 0.521 0.491 0.468 6 168.379 0.371 0.465 0.439 0.450 7 156.262 0.494 0.531 0.608 0.601
T23R 46.477 0.214 0.124 0.369 0.273 T23L 139.406 0.556 0.573 0.760 0.815 G9 160.904 0.574 0.529 0.670 0.461 G10 91.454 0.387 0.463 0.663 0.588 G5 196.964 0.481 0.625 0.558 0.662 C33 167.617 0.575 0.633 0.723 0.734 C34 116.794 0.251 0.319 0.338 0.330 T27 75.719 0.315 0.337 0.428 0.438 G26 175.615 0.375 0.520 0.551 0.549
Table 19. IFI Calibration Constants from Linear Regression Analysis.
Skid Measuring Device Intercept A Slope B R2 % SEE Highway fixed-slip friction tester 0.135 0.624 81.8 0.056
TxDOT locked-wheel trailer 0.074 0.640 79.4 0.059 TTI locked-wheel trailer 0.127 0.556 71.3 0.070
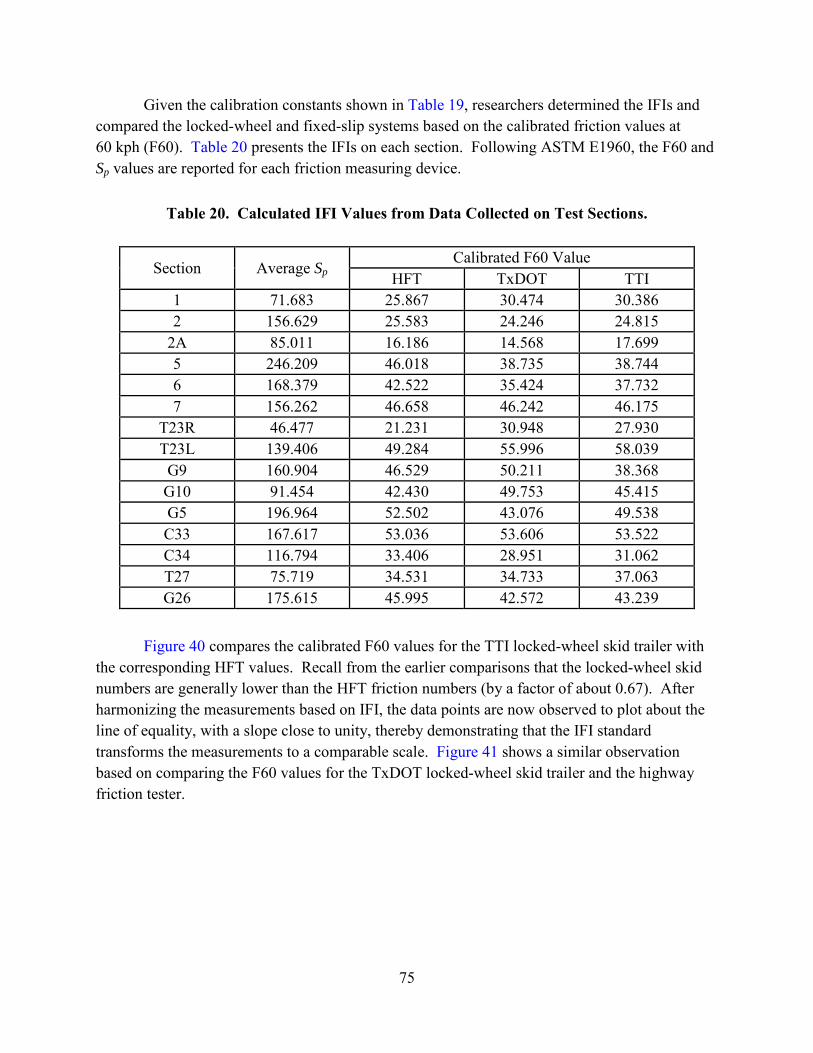
75
Given the calibration constants shown in Table 19, researchers determined the IFIs and compared the locked-wheel and fixed-slip systems based on the calibrated friction values at 60 kph (F60). Table 20 presents the IFIs on each section. Following ASTM E1960, the F60 and Sp values are reported for each friction measuring device.
Table 20. Calculated IFI Values from Data Collected on Test Sections.
Section Average Sp Calibrated F60 Value
HFT TxDOT TTI 1 71.683 25.867 30.474 30.386 2 156.629 25.583 24.246 24.815
2A 85.011 16.186 14.568 17.699 5 246.209 46.018 38.735 38.744 6 168.379 42.522 35.424 37.732 7 156.262 46.658 46.242 46.175
T23R 46.477 21.231 30.948 27.930 T23L 139.406 49.284 55.996 58.039 G9 160.904 46.529 50.211 38.368 G10 91.454 42.430 49.753 45.415 G5 196.964 52.502 43.076 49.538 C33 167.617 53.036 53.606 53.522 C34 116.794 33.406 28.951 31.062 T27 75.719 34.531 34.733 37.063 G26 175.615 45.995 42.572 43.239
Figure 40 compares the calibrated F60 values for the TTI locked-wheel skid trailer with the corresponding HFT values. Recall from the earlier comparisons that the locked-wheel skid numbers are generally lower than the HFT friction numbers (by a factor of about 0.67). After harmonizing the measurements based on IFI, the data points are now observed to plot about the line of equality, with a slope close to unity, thereby demonstrating that the IFI standard transforms the measurements to a comparable scale. Figure 41 shows a similar observation based on comparing the F60 values for the TxDOT locked-wheel skid trailer and the highway friction tester.
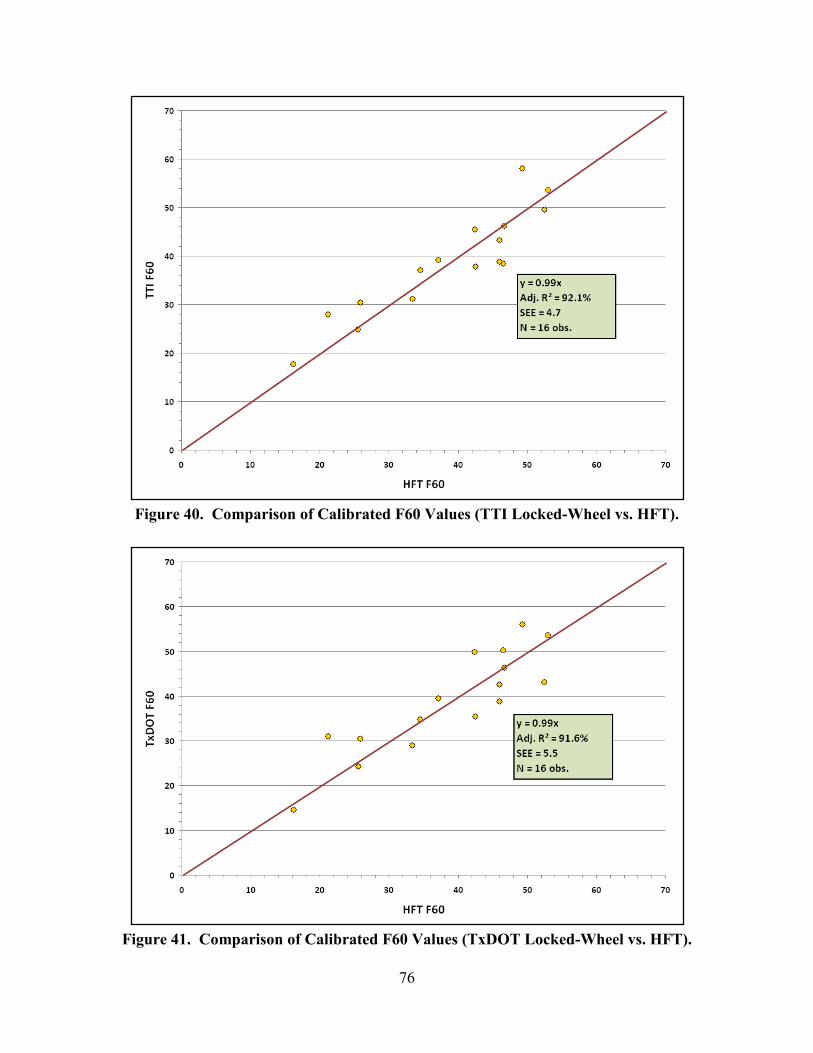
76
Figure 40. Comparison of Calibrated F60 Values (TTI Locked-Wheel vs. HFT).
Figure 41. Comparison of Calibrated F60 Values (TxDOT Locked-Wheel vs. HFT).
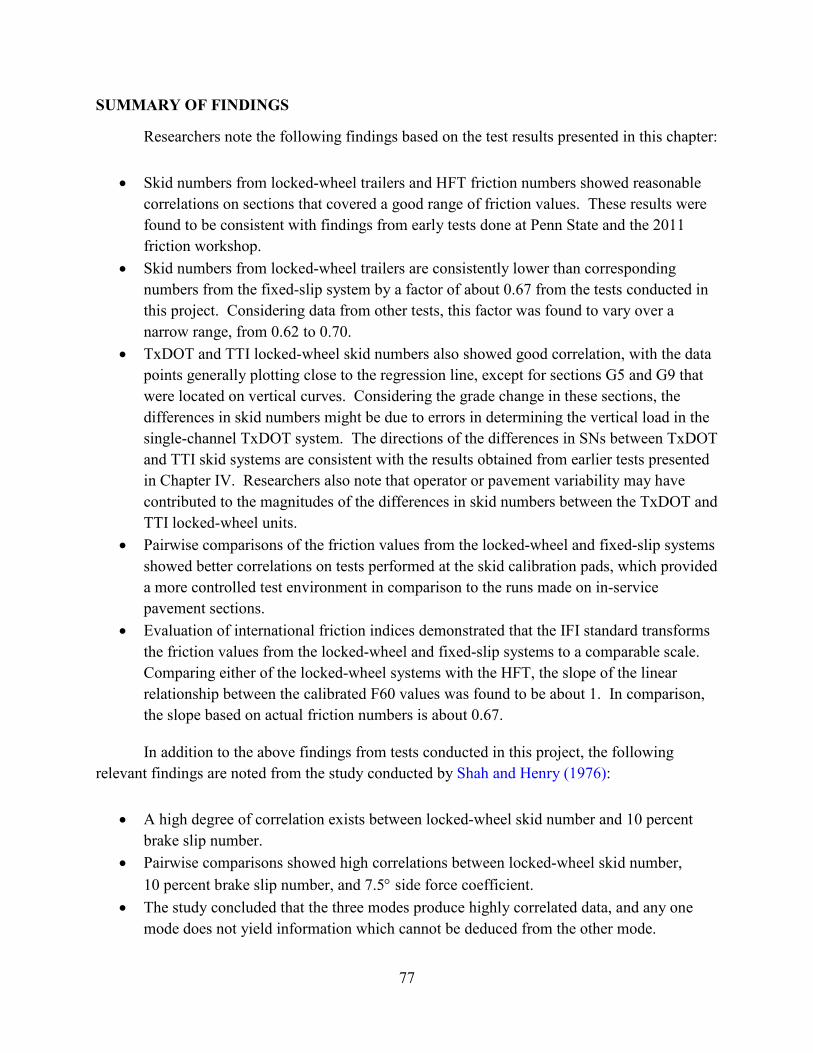
77
SUMMARY OF FINDINGS
Researchers note the following findings based on the test results presented in this chapter:
• Skid numbers from locked-wheel trailers and HFT friction numbers showed reasonable correlations on sections that covered a good range of friction values. These results were found to be consistent with findings from early tests done at Penn State and the 2011 friction workshop.
• Skid numbers from locked-wheel trailers are consistently lower than corresponding numbers from the fixed-slip system by a factor of about 0.67 from the tests conducted in this project. Considering data from other tests, this factor was found to vary over a narrow range, from 0.62 to 0.70.
• TxDOT and TTI locked-wheel skid numbers also showed good correlation, with the data points generally plotting close to the regression line, except for sections G5 and G9 that were located on vertical curves. Considering the grade change in these sections, the differences in skid numbers might be due to errors in determining the vertical load in the single-channel TxDOT system. The directions of the differences in SNs between TxDOT and TTI skid systems are consistent with the results obtained from earlier tests presented in Chapter IV. Researchers also note that operator or pavement variability may have contributed to the magnitudes of the differences in skid numbers between the TxDOT and TTI locked-wheel units.
• Pairwise comparisons of the friction values from the locked-wheel and fixed-slip systems showed better correlations on tests performed at the skid calibration pads, which provided a more controlled test environment in comparison to the runs made on in-service pavement sections.
• Evaluation of international friction indices demonstrated that the IFI standard transforms the friction values from the locked-wheel and fixed-slip systems to a comparable scale. Comparing either of the locked-wheel systems with the HFT, the slope of the linear relationship between the calibrated F60 values was found to be about 1. In comparison, the slope based on actual friction numbers is about 0.67.
In addition to the above findings from tests conducted in this project, the following relevant findings are noted from the study conducted by Shah and Henry (1976):
• A high degree of correlation exists between locked-wheel skid number and 10 percent brake slip number.
• Pairwise comparisons showed high correlations between locked-wheel skid number, 10 percent brake slip number, and 7.5° side force coefficient.
• The study concluded that the three modes produce highly correlated data, and any one mode does not yield information which cannot be deduced from the other mode.
78
IMPLICATION OF TEST FINDINGS
Converting from locked-wheel to fixed-slip friction testers is certainly one option for improving TxDOT’s friction measurement capability. This decision needs to consider the applications for which fixed-slip systems would be used within the department. If TxDOT decides that continuous friction measurements over the highway network are needed, a larger test vehicle would be necessary to permit data collection on as much roadway mileage before the water tank needs to be refilled. As noted earlier, the HFT used in this evaluation can test over 72,000 ft (about 14 miles) of pavement continuously before the water runs out. The system can of course be set to take measurements at specified intervals, similar to the current locked-wheel units, but this operation runs counter to the idea of continuous friction measurements. Consequently, with respect to improving the department’s current skid measurement capability, researchers are of the opinion that the following options need to be considered:
• Convert the current fleet of one-channel locked-wheel skid trailers to two-channel systems that provide direct measurement of vertical load.
• Purchase at least one fixed-slip system to support project-level forensic investigations. In the researchers’ opinion, continuous friction measurements are most useful for this type of investigation as well as other project-level applications.
The next chapter discusses the available options in more detail and provides recommendations on the direction TxDOT should take to improve its current friction measurement capability.
79
CHAPTER VI. INVESTIGATION OF IMPROVEMENT OPTIONS AND RECOMMENDATIONS
INTRODUCTION
Given the differences found in skid measurements from tests conducted to compare one- and two-channel locked-wheel skid systems, researchers investigated options for improving TxDOT’s current friction measurement method, particularly on nontangent sections where inertial loading effects were found to be most pronounced. Obviously, measuring the dynamic vertical test wheel load was the primary focus of this investigation. In addition, researchers investigated improvements that could enhance the overall operation of the TxDOT skid measurement systems and reduce maintenance costs.
Two independent methods to determine the dynamic vertical wheel load during a locked-wheel test were considered. The first method involves designing and installing an inertial system to measure accelerations acting on the trailer center-of-gravity. The measured dynamic lateral and vertical accelerations are then input into equations in a microcomputer program to solve for the vertical load change at the test tire due to inertial effects induced by curves, grades, pavement roughness, and cross-slope. This method requires no modification of existing mechanical trailer hardware.
The second and more involved method is to directly measure the dynamic weight of the test wheel as it deviates from the static 1085 lb during a skid test. In two-channel ASTM E-274 skid trailers produced by Dynatest and International Cybernetics Corporation, this measurement is accomplished by the use of strain gages on the transducer that is located between the end of the axle and the wheel/brake assembly. The transducer measures true horizontal and vertical forces. These custom-built transducers are expensive and require new mounting hardware between the axle and wheel. Another direct method is to strain gage existing members in the area of the axle/wheel or the existing torque transducer. The different options are discussed in more detail in the following section of this chapter.
OPTION 1: INERTIAL MEASUREMENTS
The dynamic vertical weight of the test wheel may be indirectly determined by measuring the accelerations acting on the trailer center-of-gravity in the horizontal and vertical axes and computing the resulting changes in the forces acting on the test wheel. These changes add or subtract from the normal 1085 lb test wheel load during a skid test. Zimmer and Tonda (1983) used this method in an FHWA study that investigated the limits of operation of an ASTM E274 system on nontangent roads producing high lateral accelerations. They demonstrated that an inertial system to measure accelerations can determine the change in test wheel weight on horizontal curves with no superelevation, as illustrated previously in Figure 2, which compares the output from their accelerometer-based system with load cell measurements.

80
Knowing the lateral acceleration acting at the trailer’s center-of-gravity, the trailer track width, and the CG location, Equations 3.1 and 3.2 can be used to determine the instantaneous change in test wheel weight due to inertial effects induced by horizontal curves with no superelevation. In practice, this method will require measurement of the vertical acceleration in order to compute the change in test wheel weight due to inertial effects induced by grade changes, pavement roughness, and superelevation or cross-slope that increase or decrease the weight of both left and right trailer wheels.
In theory, option 1 appears to be a viable modification that can provide a dynamic vertical load measurement channel to the TxDOT E274 systems. To investigate this application in the real world, researchers attached a two-axis accelerometer to the TTI E274 system, along with an analog to digital converter, and laptop recording system, as shown in Figure 42. The two-axis accelerometer is in the gray box found between the two black weight plates shown in this figure. Researchers then tested the inertial system on tangents and curves with different levels of pavement roughness.

81
Figure 42. Accelerometer Unit Mounted on TTI E274 System.
Test runs on smooth pavements proved promising, as shown in Figure 43, which shows the lateral and vertical acceleration traces measured on a smooth horizontal curve. The method was then used on tangent sections and curves with roughness as may be found on secondary roadways. Figure 44 shows typical results from a tangent section. Even though this was a tangent section, which should produce no steady state lateral or vertical accelerations, significant perturbations were observed in the data. Researchers note that the data for each channel were filtered with a 5 Hz low-pass electronic filter. However, researchers found that the lower frequency oscillations caused by the roadway still influenced the corrected data and subsequently the calculated skid numbers. In this regard, a lower frequency filter could have been used, but this filter might have removed needed dynamic correction data.
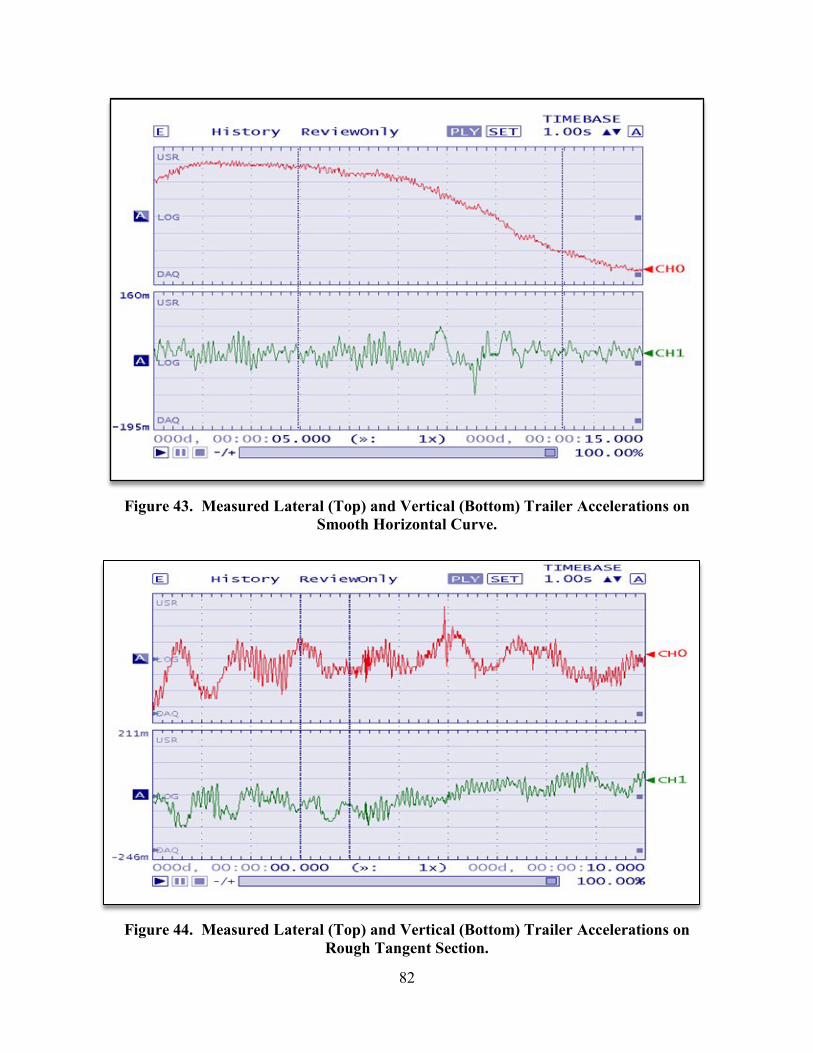
82
Figure 43. Measured Lateral (Top) and Vertical (Bottom) Trailer Accelerations on
Smooth Horizontal Curve.
Figure 44. Measured Lateral (Top) and Vertical (Bottom) Trailer Accelerations on
Rough Tangent Section.

83
In summary, the advantages of an inertial correction system are:
• The method provides the lowest cost solution to measuring dynamic test wheel weight changes.
• It could be rapidly implemented after the initial software revision. • The method would entail little physical modification to TxDOT’s existing trailers.
However, the inertial correction method has the following disadvantages:
• The method requires an extensive software upgrade to measure acceleration in two axes and to compute the instantaneous test wheel load changes for determining the skid number.
• Road roughness may introduce errors into the data stream that could affect both tangent and nontangent sections. The maximum lateral acceleration found on roadways is in the 0.3 to 0.4 g range. Thus, an electronic drift of 0.03 g would produce a ten percent error in the accelerometer data system.
• Finally, the calibration and verification of proper system operation in static tests, on tangent sections, and at the TTI Evaluation and Calibration Center would be difficult.
OPTION 2: APPLY STRAIN GAGES
The weight of the trailer transmitted through the axle to the left wheel causes very slight bending in the metal structure which can be detected by means of strain gages. These gages convert strain, in micro-inches per inch, into a proportional voltage by means of a precision amplifier. The strain gage torque transducer is located at the left end of the axle with one end stationary and the other end attached to the brake calipers. If the weight of the trailer is supported by this transducer, it would be a simple task to add additional strain gages, in bending or shear, to measure vertical weight. In reviewing the mechanical drawings supplied by TxDOT, it became clear that this plan would not work because the weight of the trailer is primarily supported by a solid axle passing through the torque transducer, with a small portion of the load passing through the transducer when the brake is applied. With two paths for the vertical force, it is impractical to calculate the true force or dynamic weight of the test wheel with this method.
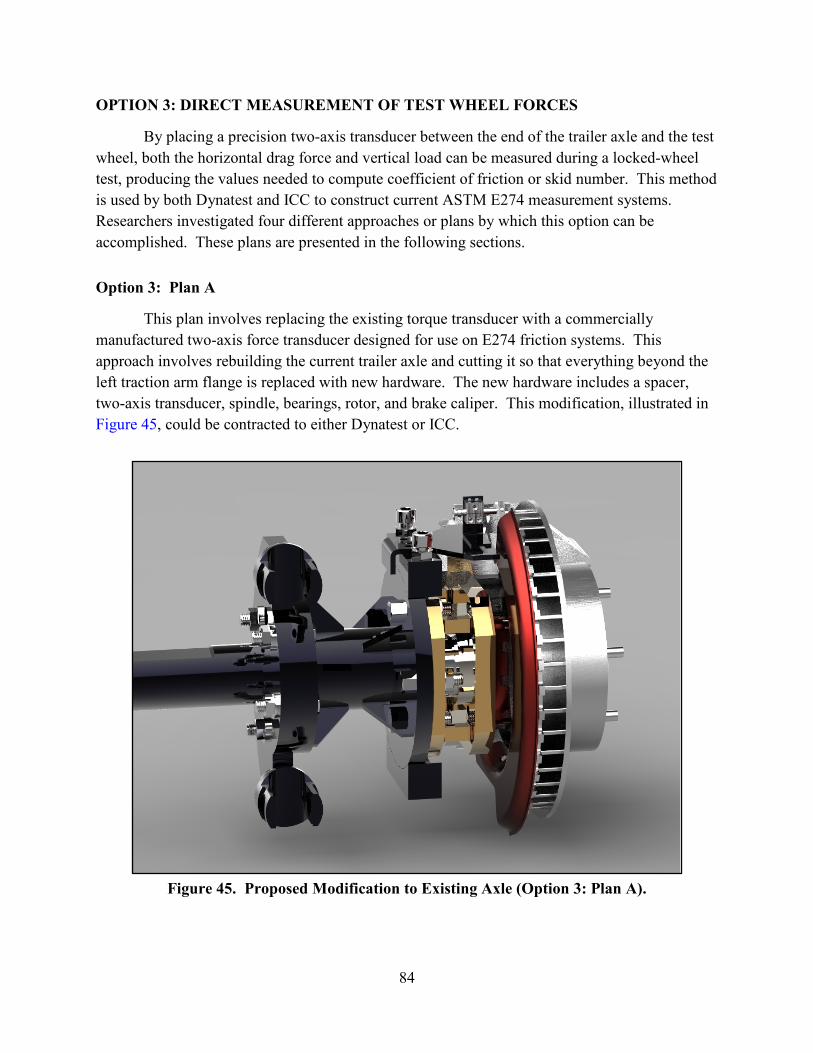
84
OPTION 3: DIRECT MEASUREMENT OF TEST WHEEL FORCES
By placing a precision two-axis transducer between the end of the trailer axle and the test wheel, both the horizontal drag force and vertical load can be measured during a locked-wheel test, producing the values needed to compute coefficient of friction or skid number. This method is used by both Dynatest and ICC to construct current ASTM E274 measurement systems. Researchers investigated four different approaches or plans by which this option can be accomplished. These plans are presented in the following sections.
Option 3: Plan A
This plan involves replacing the existing torque transducer with a commercially manufactured two-axis force transducer designed for use on E274 friction systems. This approach involves rebuilding the current trailer axle and cutting it so that everything beyond the left traction arm flange is replaced with new hardware. The new hardware includes a spacer, two-axis transducer, spindle, bearings, rotor, and brake caliper. This modification, illustrated in Figure 45, could be contracted to either Dynatest or ICC.
Figure 45. Proposed Modification to Existing Axle (Option 3: Plan A).

85
In addition to the new transducer, additional support equipment is needed to interface the low-level force signals to the data computer. Two new precision instrumentation amplifiers would increase the millivolt transducer levels to several volts for further processing. In addition, two ASTM E-274 compliant, 10 Hz, 8 pole, analog filters would be added. Data will then be sent through an analog-to-digital (A/D) converter with a USB connector to feed the output directly into the onboard data computer. TxDOT programmers will need to revise the data computer software to use the new vertical and horizontal force data streams to compute skid numbers.
Advantages of Plan A
Plan A offers the lowest cost solution to providing TxDOT with a modern, 2-channel data system that meets the requirements of ASTM E-274. This plan will provide a friction measurement system that accurately measures all tangent and nontangent sections.
Disadvantages of Plan A
Plan A does not address all maintenance issues with TxDOT’s aging friction measurement systems. In addition, the skid system would be out of service while modifications are made.
Estimated Cost of Plan A
The first modified unit will be at a higher cost due to software development by TxDOT for processing the new data channels. This cost would need to be formalized, but at this time $10,000 is assumed. Design costs of the analog and digital systems between the transducer and computer will have to be added. These costs are not included in the estimates given below:
• Total parts and labor for first unit: $41,279 (includes software development cost). • Additional unit cost: $31,279.
Option 3: Plan B
This plan involves replacing the existing torque method trailer with a new trailer from either Dynatest or ICC. This trailer is delivered with a two-axis wheel transducer on the left side, or optionally, on both right and left sides. It has an air over hydraulic brake system with control valves and a water delivery system. Figure 46 shows a new ICC E274 trailer with water system, brake cylinders, and valves under the cover.
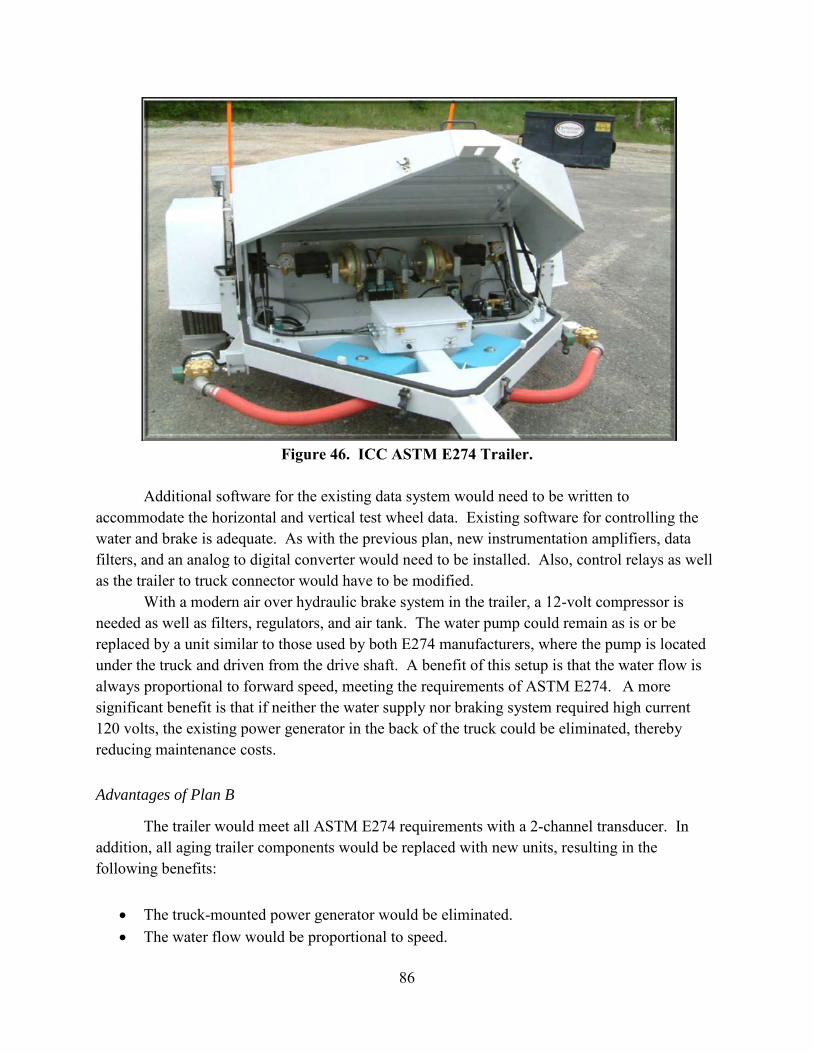
86
Figure 46. ICC ASTM E274 Trailer.
Additional software for the existing data system would need to be written to accommodate the horizontal and vertical test wheel data. Existing software for controlling the water and brake is adequate. As with the previous plan, new instrumentation amplifiers, data filters, and an analog to digital converter would need to be installed. Also, control relays as well as the trailer to truck connector would have to be modified.
With a modern air over hydraulic brake system in the trailer, a 12-volt compressor is needed as well as filters, regulators, and air tank. The water pump could remain as is or be replaced by a unit similar to those used by both E274 manufacturers, where the pump is located under the truck and driven from the drive shaft. A benefit of this setup is that the water flow is always proportional to forward speed, meeting the requirements of ASTM E274. A more significant benefit is that if neither the water supply nor braking system required high current 120 volts, the existing power generator in the back of the truck could be eliminated, thereby reducing maintenance costs.
Advantages of Plan B
The trailer would meet all ASTM E274 requirements with a 2-channel transducer. In addition, all aging trailer components would be replaced with new units, resulting in the following benefits:
• The truck-mounted power generator would be eliminated. • The water flow would be proportional to speed.

87
• Maintenance costs would be reduced.
Disadvantages of Plan B
Plan B has a higher cost than Plan A. The system would be out of service for the time required to install new air and water components on the truck and rewire the data and control systems.
Estimated Cost of Plan B
The first modified unit will be at a higher cost due to software development by TxDOT for processing the new data channels. This cost would need to be formalized, but at this time the same $10,000 estimate assumed for Plan A will be used. In addition, design costs of the analog and digital systems between the transducer and computer will have to be added but should be comparable to the costs associated with Plan A. These costs are not included in the estimates given below, which include a complete new trailer, new pneumatic system, new water pump driven by drive shaft, and new analog data hardware.
• Total parts and labor for first unit: $100,018 (includes software development cost). • Total for additional units: $90,018.
Option 3: Plan C
Plan C involves procuring new E274 truck-trailer skid measurement systems, such as the system shown in Figure 47. These systems are available from Dynatest or ICC and come complete with truck, trailer, brake system, water system, and data collection and recording systems. Optionally, they can be configured to measure pavement texture and temperature. Manufacturers indicated they would be capable of providing software to format the output data in the form needed by TxDOT.
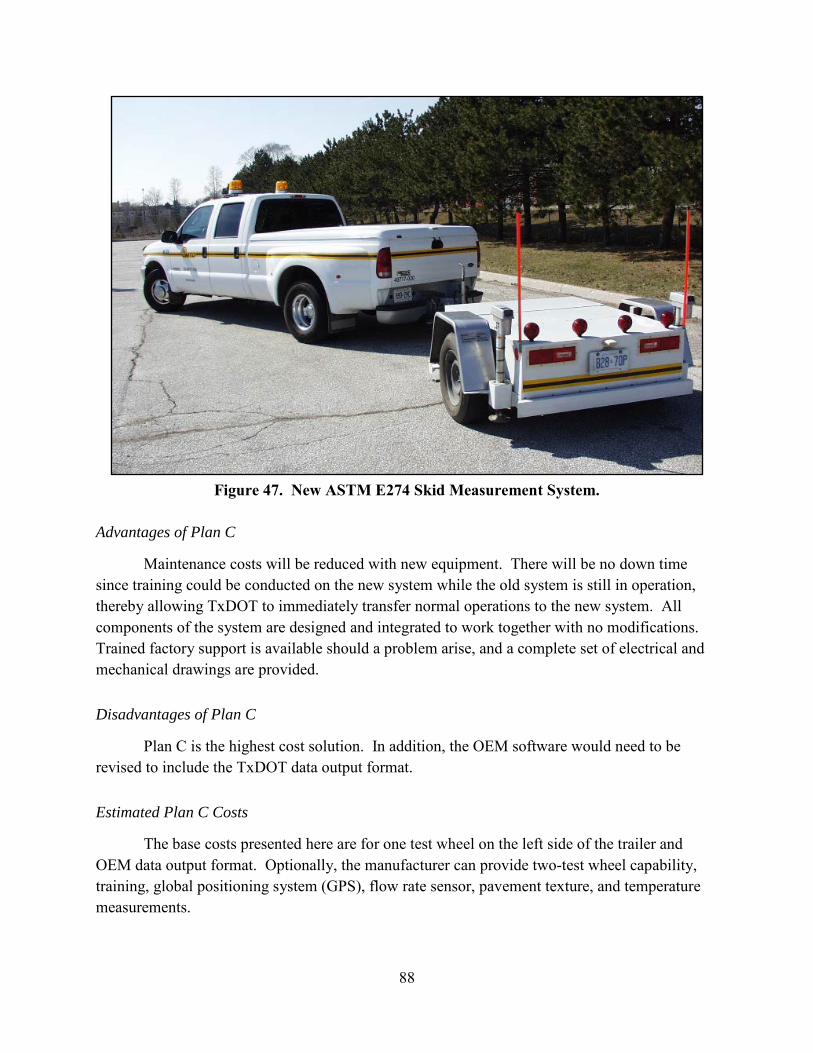
88
Figure 47. New ASTM E274 Skid Measurement System.
Advantages of Plan C
Maintenance costs will be reduced with new equipment. There will be no down time since training could be conducted on the new system while the old system is still in operation, thereby allowing TxDOT to immediately transfer normal operations to the new system. All components of the system are designed and integrated to work together with no modifications. Trained factory support is available should a problem arise, and a complete set of electrical and mechanical drawings are provided.
Disadvantages of Plan C
Plan C is the highest cost solution. In addition, the OEM software would need to be revised to include the TxDOT data output format.
Estimated Plan C Costs
The base costs presented here are for one test wheel on the left side of the trailer and OEM data output format. Optionally, the manufacturer can provide two-test wheel capability, training, global positioning system (GPS), flow rate sensor, pavement texture, and temperature measurements.
89
• Base price:
o Dynatest: $200,000 o ICC: $182,000
• Optional pavement texture and temperature measurement systems:
o Dynatest: $34,400 o ICC: $48,000
• Optional water flow rate data: $7,600 • Add right side testing: $32,000 • Optional software revision to TxDOT format: ∼$40,000 one-time charge
Option 3: Plan D
This plan involves replacing TxDOT’s existing E274 systems with fixed-slip systems conforming to ASTM E2340-06 (2012). Chapter V compared this system with the existing locked-wheel skid systems used by TxDOT and other states and reported a reasonable correlation between the friction numbers determined from both methods. A similar finding was also made in tests conducted at Penn State.
Fixed-slip systems are used predominantly for airport runway evaluations in the US However, Dynatest is now marketing the model 6875H fixed-slip system for highway friction testing. Given that FHWA Technical Advisory T 5040.38 (2010) recommended locked-wheel and fixed-slip systems as appropriate methods for evaluating pavement friction on US highways, the fixed-slip system is included among one of the four approaches TxDOT can take to improve its friction measurement capability with systems that directly measure drag and vertical test wheel forces.
The cost of a fixed-slip system is comparable to the cost of a new E274 truck-trailer skid measurement system. The base price of the Dynatest 6875H is $187,962. Optionally, pavement texture and temperature measurement capability can be added at a cost of $34,400.
Even though the 6875H, or another continuous friction device, is acceptable to the FHWA and its cost is the same or less than an E274 system, a couple of factors indicate that this alternative may not be a prudent choice for the entire TxDOT fleet. First, TxDOT would incur costs associated with relating future fixed-slip measurements to years of historical locked-wheel skid inventory data. Second, TxDOT would incur costs associated with developing a method to process and log continuous data into the VAMOS software, which was designed to process one skid number at a time.

90
RECOMMENDED OPTION FOR IMPROVING EXISTING SKID SYSTEMS
The preceding sections identified available options to improve the accuracy of TxDOT skid measurement systems and reduce maintenance costs. The primary focus of these improvements is measurement of dynamic vertical test wheel load. In general, the available options may be grouped under retro-fitting existing skid systems or replacing existing systems with commercially produced units.
Modifying the existing systems to measure vertical load as described in ASTM E274 and to be on the same level as commercially produced units was found to be quite extensive. Several significant hardware components would require replacement, which in turn would require special fabrication to even fit into the existing spaces. Additional instrumentation electronics would need to be purchased and designed to operate with the existing computer system. The software of the computer system would need to be rewritten to accommodate and process the additional information. The cost of these modifications is estimated to be about half the cost of a new commercially produced system and would still have the maintenance problems of aging systems.
In contrast, commercially produced E274 systems are designed to meet all ASTM requirements, while using modern components that produce less temperature drift and provide significantly improved accuracy. The advantages of taking this approach were cited previously. Replacing the existing systems with commercial units is the option researchers recommend for TxDOT. At this time, two US companies fabricate and supply ASTM E274 systems. Table 21 identifies these companies and provides contact information.
Table 21. US Vendors of ASTM E274 Friction Measurement Systems.
Product and Contact Information
US Vendor Dynatest ICC
ASTM E274 equipment model number
Model 1295 Pavements Friction Tester
Model STF5041 Pavement Skid Friction Test System
Contact person and telephone number Frank Holt: (734) 729-0400 Rob Olenoski: (727) 547-0696
Company address 38284 Abruzzi Drive Westland, Michigan 48185
10630 75th Street North Largo, Florida 33777
Both Dynatest and ICC produce units that are comparable in appearance to the current
TxDOT E274 systems. Their standard truck configuration is a one-ton, super duty vehicle with extended- or crew-cab, single or dual rear wheels, and a 300 to 400 gallon water tank, as shown in Figure 47. Both US suppliers have indicated that they will provide custom truck configurations. Cost estimates for a new E274 truck-trailer skid measurement system were given previously under Plan C.

91
Accuracy of Commercial E274 Systems
Dynatest and ICC E274 systems have been extensively tested at the TTI Field Test and Evaluation Center over the past 40 years. They each have a two-axis force transducer on the trailer test wheel that measures true horizontal drag force and vertical load on the test tire. This transducer provides an accurate coefficient of friction or skid number regardless of any load changes due to the geometrics of the roadway. Comparisons between these systems and the TTI Area Reference Measurement System, over the years, have shown very good dynamic correlations and less than 1 percent errors during static force measurements.
Even though both units are very similar because of the ASTM E274 requirements, there are a few small differences. The Dynatest unit requires that a quick calibration is performed each time the computer is initialized. This requires that the operator park the truck and trailer on a flat and level pavement, and press a button. This process inserts known values of load and force into the computer and makes adjustments for any small errors. The ICC unit is only calibrated during actual calibration runs with a force plate, which could be from one a month to one a year. The ICC unit does allow for automatically zeroing the values in a stopped condition, but this is not normally done by the operator.
Another difference between the two systems is how the force plate calibration is handled. A force plate is a precision two-axis scale, on an air bearing that is placed under a locked test wheel. The Dynatest unit uses a two point method for the force and load channels, where the zero force point and a point about half scale are set to accurately agree on both the force plate and truck computer display. This method then assumes that all other points fall on a linear line formed by these two points. At the TTI Field Test Center, this method has shown to be accurate within 1 percent from zero to full scale on each axis.
The ICC system is calibrated in increasing and decreasing 100 lb steps, from a drag force of 0 to 800 lbf. These values are then used by the computer to develop a best fit line using 17 data points. Again, after this process, the accuracy is within 1 percent on the two channels.
Differences between TxDOT and Commercial E274 Systems
Since all E274 friction measurement systems must adhere to the same ASTM requirements, any differences between manufactured units can only be outside those regulations. The method of pumping water, locking the test wheel, and applying electrical power to all components are not defined in the standard. The TxDOT measurement systems currently use an electric water pump to produce the required water flow in front of the test wheel when locked. Water flow must be manually adjusted for different test speeds. Modern skid systems use a gear pump that is driven through a clutch by the truck’s drive shaft. This method automatically changes the water flow based on the truck speed.
Current systems lock the test wheel by using an air-over-hydraulic method where compressed air actuates the hydraulic brake master cylinder as well as the water clutch when needed. The TxDOT systems use a continuously running hydraulic pump and ports pressure to
92
the wheel caliper when needed. To power these pumps, the TxDOT system uses an internal combustion engine generator to produce the needed 120 VAC at high current. The commercial systems do not need a generator and power all test electronics from the truck engine with a dual alternator, separate battery, and a solid state, 1000W power inverter.
Compatibility of Replacement Units
A major concern with replacing the existing TxDOT E274 systems with new, commercially built units is compatibility with existing hardware and software. Researchers discuss this issue in the following sections.
Hardware
With the requirement that all ASTM E274 systems have the same functionality, the majority of components in modern systems will be the same as the existing TxDOT fleet of skid units. Both manufacturers are prepared and capable of making modifications to the truck that pulls their standard trailers. Below is a list of requirements that TxDOT has requested to be included in a replacement skid system truck to help insure a smooth transition.
Specifications for 888-D Crew Cab and Chassis, Diesel
Latest model one-ton, dual rear tires, crew cab and chassis, diesel truck and utility body with the following options and special equipment meeting Texas specifications number 070-AT-05 for 2007:
Options
1. Air Conditioning Unit
16. Dual Alternators minimum 100 Amps ea.
24. Brakes ̶ Power Front Disc
37. Color ̶ White
41. Cruise Control
45. Limited Slip Differential
49. Engine ̶ Minimum 5.9T-I6 Diesel
71. Mirrors ̶ Low mount with extended arms for wide bed
77. Power Steering
91. Radio, AM/FM
93. Two-Way Radio Frequency (RF) Interference Package
103. Shocks ̶ Heavy Duty

93
107. Spare Wheel and Tire (same brand and size as truck)
115. Tilt Wheel
128. Transmission ̶ Automatic
132. Transmission Oil Cooler
Truck should be equipped with the following special equipment with factory installation
required when available. Dealer installed items must be previously approved.
1. Privacy tint on all side and rear windows. 2. Gauges ̶ Manufacturer's standard Oil Pressure, Ammeter or Voltmeter, and Engine
Temperature. 3. Full Carpet front and rear with sound deadener. 4. Factory Headliner. 5. Factory Interior Side Panel with sound deadener. 6. Engine ̶ Minimum 5.9 T-I6 Diesel or V8. 7. Factory High-Back Cloth Bucket Seats with Arm Rest or pre-approved after-market type. 8. Rear Axle Ratio: 4.10. 9. GAWR ̶ 10,000 lb minimum. 10. Interior color ̶ brown, gray, or blue. 11. Utility body ̶ low profile.
a. Color ̶ same as truck. b. Width inside tool boxes ̶ min. 54 inches. c. Width between wheels wells ̶ min. 45 inches. d. Height inside from floor to top of toolboxes ̶ min. 25 inches. e. Length ̶ min. 108 inches. f. Compartment depth ̶ min. 18 inches. g. Body height ̶ max. 38 inches (body shall not be higher than the center of back
window). h. Body width ̶ max. 90 inches. i. Lockable keyed alike door ̶ min 6 inches × 6 inches (drivers side, top of rear toolbox).
12. Water tank ̶ 335 to 350 gallons fillable from overhead stand with 6 to 8-inch opening and cap.
13. Light bar ̶ amber, and blue. No modifications are requested or recommended to the instrumented trailer.

94
Software
Both commercially supplied E274 systems are delivered with a standard computer to allow the operator to control the application of water in front of the test wheel, lock the test wheel in a precise manner, record the drag force and vertical load, and produce a friction number. This test sequence is accomplished with proprietary software written by each manufacturer. The TxDOT systems use a data acquisition and reporting software by the name of VAMOS. This software is essential to the operation of the pavement friction program and will need to be incorporated into the new systems.
The researchers have discussed this requirement with the software programmers at each company to arrive at a solution. Basically, the plan is to have two programs running concurrently in the Windows operating system. One program will be the standard skid system software to control the operation of the hardware systems, acquire data from the wheel transducer, and calculate the raw results. These data will then be immediately passed to the VAMOS program to be inserted into the same file locations as done in the existing system. These locations are shown in Figure 48 on the lines labeled SKID4, which contain the values for skid number, temperature, skid RMS (standard deviation), water flow rate, and test speed. The process of inserting test results into the VAMOS data file will take a few seconds after a test run and will produce the same VAMOS output as obtained from TxDOT’s existing skid measurement systems. This software modification will take time on the part of the manufacturer’s programmers, as well as TxDOT’s programmers, who will have to modify VAMOS to accept the test results from the manufacturer’s software. Dynatest estimated this software modification to require about 6 weeks of work, which includes two weeks of testing on site with an estimated one-time cost of $40,000.
Figure 48. Illustration of VAMOS Data File.
SUMMARY OF RECOMMENDATIONS
To summarize, researchers offer the following recommendations with respect to improving TxDOT’s current skid measurement capabilities and accuracy, and reducing maintenance requirements:
95
• TxDOT should convert its current fleet of one-channel locked-wheel skid trailers to two-channel systems that provide direct measurement of vertical load. Several options for accomplishing this upgrade were presented in this chapter. The final recommendation is to replace the existing systems with new, commercially produced ASTM E274 measurement systems. These new systems would continue to run the VAMOS software, and the trucks would be configured to meet the needs of the TxDOT pavement friction program. The two producers of E274 systems in the US have expressed willingness to work with TxDOT to provide quotes based on detailed requirements.
• TxDOT should consider purchasing at least one fixed-slip system to support project-level forensic investigations. In the researchers’ opinion, continuous friction measurements are most useful for this type of investigation as well as other project-level applications. Should TxDOT decide to purchase a fixed-slip system, the following additional recommendations are made:
o To support interpretation of the data from the fixed-slip friction tester, and relate its friction numbers to historical data, researchers recommend that TxDOT conduct a follow-up comparative evaluation to develop relationships for converting the friction values between each of TxDOT’s locked wheel units and the continuous fixed-slip friction tester purchased by the department. This evaluation can be conducted in a follow-up implementation project.
o The proposed implementation project should review available CFME systems, develop specifications for the purchase requisition and develop criteria for acceptance testing of the candidate system(s) to support the selection process.
o To support the long-term use of fixed-slip systems, the proposed implementation project should establish requirements and identify options by which TxDOT can calibrate its fixed-slip system(s) as needed.


97
REFERENCES
ASTM International. Standard Test Method for Skid Resistance of Paved Surfaces Using a Full-Scale Tire. ASTM E274/E274M-11, Annual Book of ASTM Standards, Vol. 04.03, West Conshohocken, Penn., 2012. ASTM International. Standard Specification for Standard Rib Tire for Pavement Skid-Resistance Tests. ASTM E501-08, Annual Book of ASTM Standards, Vol. 04.03, West Conshohocken, Penn., 2012. ASTM International. Standard Specification for Standard Smooth Tire for Pavement Skid-Resistance Tests. ASTM E524-08, Annual Book of ASTM Standards, Vol. 04.03, West Conshohocken, Penn., 2012. ASTM International. Standard Guide for Validating New Area Reference Skid Measurement Systems and Equipment. ASTM E1890-11, Annual Book of ASTM Standards, Vol. 04.03, West Conshohocken, Penn., 2012. ASTM International. Standard Test Method for Measuring Paved Surface Frictional Properties Using the Dynamic Friction Tester. ASTM E1911-09aε, Annual Book of ASTM Standards, Vol. 04.03, West Conshohocken, Penn., 2012. ASTM International. Standard Practice for Calculating International Friction Index of a Pavement Surface. ASTM E1960-07, Annual Book of ASTM Standards, Vol. 04.03, West Conshohocken, Penn., 2012. ASTM International. Standard Test Method for Measuring Pavement Macrotexture Properties Using the Circular Track Meter. ASTM E2157-09, Annual Book of ASTM Standards, Vol. 04.03, West Conshohocken, Penn., 2012. ASTM International. Standard Test Method for Measuring the Skid Resistance of Pavements and Other Trafficked Surfaces Using a Continuous Reading, Fixed-Slip Technique. ASTM E2340-06, Annual Book of ASTM Standards, Vol. 04.03, West Conshohocken, Penn., 2012. ASTM International. Standard Guide for the Evaluation, Calibration, and Correlation of E274 Friction Measurement Systems and Equipment. ASTM E2793-10ε, Annual Book of ASTM Standards, Vol. 04.03, West Conshohocken, Penn., 2012. Azari, H. and R. Lutz. Precision Estimates of AASHTO T 242. NCHRP Web-Only Document 142, National Cooperative Highway Research Program, Transportation Research Board, Washington D.C., 2009. Federal Highway Administration. Pavement Friction Management. Technical Advisory T 5040.38, U.S. Department of Transportation, Washington, D.C., 2010.

98
Henry, J. J. Evaluation of Pavement Friction Characteristics. NCHRP Synthesis 291, Transportation Research Board, National Research Council, Washington, D.C., 2000. Menges, W. L. and R. A. Zimmer. Friction Measurement System Evaluation for Texas Department of Transportation, System No. 5770H. Central/Western Field Test and Evaluation Center Report TC-457, Texas Transportation Institute, The Texas A&M University System, College Station, Tex., 2009. Shah, V. R. and J. J. Henry. The Relationship of Locked Wheel Friction to that of Other Test Modes. Pennsylvania Transportation Institute, The Pennsylvania State University, State College, Penn., 1976. Society of Automotive Engineers. Earthmoving Machines ̶ Method for Locating the Center of Gravity. SAE J874, SAE World Headquarters, Warrendale, Penn., 1993. Texas Department of Transportation. Roadway Design Manual. Design Division, Austin, Tex., 2010. Wambold, J. C., C. E. Antle, J. J. Henry, and Z. Rado. International PIARC Experiment to Compare and Harmonize Texture and Skid Resistance Measurements. PIARC Technical Committee on Surface Characteristics C.1, 1995. Zimmer, R. A. and R. D. Tonda. Pavement Friction Measurements on Nontangent Sections of Roadways. FHWA Report FHWA/RD-82/149, Federal Highway Administration, U.S. Department of Transportation, Washington, D.C., 1983.