evaluation of sealed storage silos for grain … · figure 3.3 u-tube pressure relief valve piping...
TRANSCRIPT

EVALUATION OF SEALED STORAGE SILOS FOR GRAIN FUMIGATION
by
SAMUEL A.L. COOK
B.S., Kansas State University, 2014
A THESIS
submitted in partial fulfillment of the requirements for the degree
MASTER OF SCIENCE
Department of Grain Science and Industry
College of Agriculture
KANSAS STATE UNIVERSITY
Manhattan, Kansas
2016
Approved by:
Major Professor
Dirk E. Maier

Copyright
SAMUEL A.L. COOK
2016
Abstract
Fumigation of stored grain is a common way to kill stored-grain insect pests. However,
fumigating in unsealed structures is the leading cause of control failures and subsequent
development of insect resistance. Sealing the storage structure is the only practical way to ensure
a complete kill of all insects at all life stages. The cost, effort, and feasibility of sealing a U.S.
corrugated steel silo during construction was evaluated and compared against an Australian
sealed silo designed for fumigation. Gas monitoring and thermosiphon recirculation equipment
was installed on both silos. Fumigation efficacy was evaluated using pressure half-life decay
times, fumigant concentrations, insect bioassays, and grain quality data. Three fumigations with
phosphine (PH3) pellets or tablets and two with VAPORPH3OS® cylinderized PH3 and
ProFume®
cylinderized sulfuryl fluoride (SF) were performed in each silo for a total of ten
experimental treatments. The Australian silo required 266 man-hours to construct and cost $180
for additional sealing, compared to 359 man-hours and $3,284 for constructing and sealing the
U.S. silo. The Australian silo had a maximum pressure half-life decay time of 163 s versus 50 s
for the U.S. silo. At application rates of 1.5 g/m3 of PH3 both silos maintained an average
concentration of approximately 0.28 g/m3 for 14 days. With thermosiphon recirculation the
average minimum-to-maximum PH3 concentration ratio in the U.S. silo was 0.52, compared to a
ratio of 0.17 when fumigating without thermosiphon recirculation. Greater than 99% adult
mortality was observed in all insect bioassays which included PH3 resistant strains of R.
dominica and T. castaneum. The average emergence from fumigated bioassays was 7 adult
insects, compared to an average of 383 adults for the non-fumigated controls. Grain stored for 10
months in the sealed silos increased from approximately 11.5% to 17% m.c. in the top 0.3 m of
grain, and decreased in test weight from approximately 77 to 65 kg/hL. Although the Australian

silo retained higher fumigant concentrations than the U.S. silo, fumigations were successful in
both. Long-term storage in sealed silos is a concern because grain quality can deteriorate due to
condensation and mold in the top grain layer.

v
Table of Contents
List of Figures .............................................................................................................................. viii
List of Tables ............................................................................................................................... xiii
Acknowledgements ...................................................................................................................... xiv
Dedication .................................................................................................................................... xvi
Preface......................................................................................................................................... xvii
Chapter 1 - Introduction .................................................................................................................. 1
Chapter 2 - Objectives .................................................................................................................... 3
Chapter 3 - Construction, Sealing, and Pressure Testing of Corrugated Steel Grain Silos ............ 4
Introduction ................................................................................................................................. 4
History of Sealed Storage ....................................................................................................... 5
Sealed Storage in the U.S. ....................................................................................................... 8
Fumigation in Steel Silos ...................................................................................................... 10
Materials and Methods .............................................................................................................. 13
Silo Construction and Sealing ............................................................................................... 13
Site preparation ................................................................................................................. 14
Pressure testing ..................................................................................................................... 15
Results and Discussion ............................................................................................................. 18
SCAFCO silo ........................................................................................................................ 18
Roof assembly ................................................................................................................... 18
Wall assembly ................................................................................................................... 23
Roof-wall attachment ........................................................................................................ 25
Leg and hopper assembly.................................................................................................. 28
Bird’s silo .......................................................................................................................... 31
Roof assembly ................................................................................................................... 32
Wall assembly ................................................................................................................... 34
Base and hopper assembly ................................................................................................ 36
Additional equipment on both silos .................................................................................. 37
Thermosiphon Closed Loop Recirculation System ...................................................... 40

vi
Pressure Relief Valve .................................................................................................... 41
Evaluating the gas-tightness of the sealed silos .................................................................... 43
Fixing leaks ....................................................................................................................... 46
Time and labor to construct and seal silos ............................................................................ 48
Bird’s silo .......................................................................................................................... 49
SCAFCO silo .................................................................................................................... 50
Conclusions ............................................................................................................................... 54
Chapter 4 - Efficacy of Recirculation Fumigation in Sealed Australian and U.S. Steel Hopper
Grain Silos ............................................................................................................................. 57
Introduction ............................................................................................................................... 57
Fumigation ............................................................................................................................ 59
Recirculation ......................................................................................................................... 59
Methods and Materials .............................................................................................................. 63
Grain silos used ..................................................................................................................... 63
Fumigant recirculation .......................................................................................................... 64
Fumigant application ............................................................................................................ 65
Measuring fumigant concentration ....................................................................................... 67
Bioassays ............................................................................................................................... 69
Fumigations ........................................................................................................................... 71
Grain quality ......................................................................................................................... 75
Data analysis ......................................................................................................................... 76
Results and Discussion ............................................................................................................. 78
Gas concentrations by horizontal levels and vertical sections .............................................. 87
Effect of diurnal fluctuations on gas movement ................................................................... 91
Thermosiphon Recirculation ................................................................................................. 98
Bioassays ............................................................................................................................... 99
Grain quality ....................................................................................................................... 102
Conclusions ............................................................................................................................. 105
Chapter 5 - Summary and Conclusions ...................................................................................... 108
Chapter 6 - Future Work and Recommendations ....................................................................... 111
References ................................................................................................................................... 113

vii
Appendix A - Australian Standard for Sealed Silos (AS2628-2010) ......................................... 124
Appendix B - Fumigation Concentration Data ........................................................................... 126
viii
List of Figures
Figure 3.1 Closed loop fumigant recirculation using forced (left) versus natural (right)
convection currents. .............................................................................................................. 12
Figure 3.2 Site of silo construction and placement at Kansas State University, Manhattan, KS. 15
Figure 3.3 U-tube pressure relief valve piping connected near the bottom portion of the
thermosiphon piping. Also used as a monitor for pressure testing of the sealed silos. ........ 16
Figure 3.4 Vacuum cleaner set on “blow” connected to ball valve and pressurizing one of the two
sealed silos during a pressurization test. ............................................................................... 17
Figure 3.5 U-shape pressure relief valve used as a monitor during a pressure decay test showing
the silo before pressure was induced (left) and pressurized to approximately 170 Pa (right).
............................................................................................................................................... 17
Figure 3.6 A-shaped sections with overlapping ribs formed the roof of the SCAFCO silo. ........ 19
Figure 3.7 Placing sealant along the overlapping ribs between roof sections. ............................. 19
Figure 3.8 The large end openings of the roof ribs posed a problem for sealing. ........................ 20
Figure 3.9 Metal flashing piece to be screwed onto the roof rib opening to cover the ends of the
roof ribs. ................................................................................................................................ 21
Figure 3.10 Metal flashing pieces on the ends of the roof rib openings after covering with
sealant. .................................................................................................................................. 22
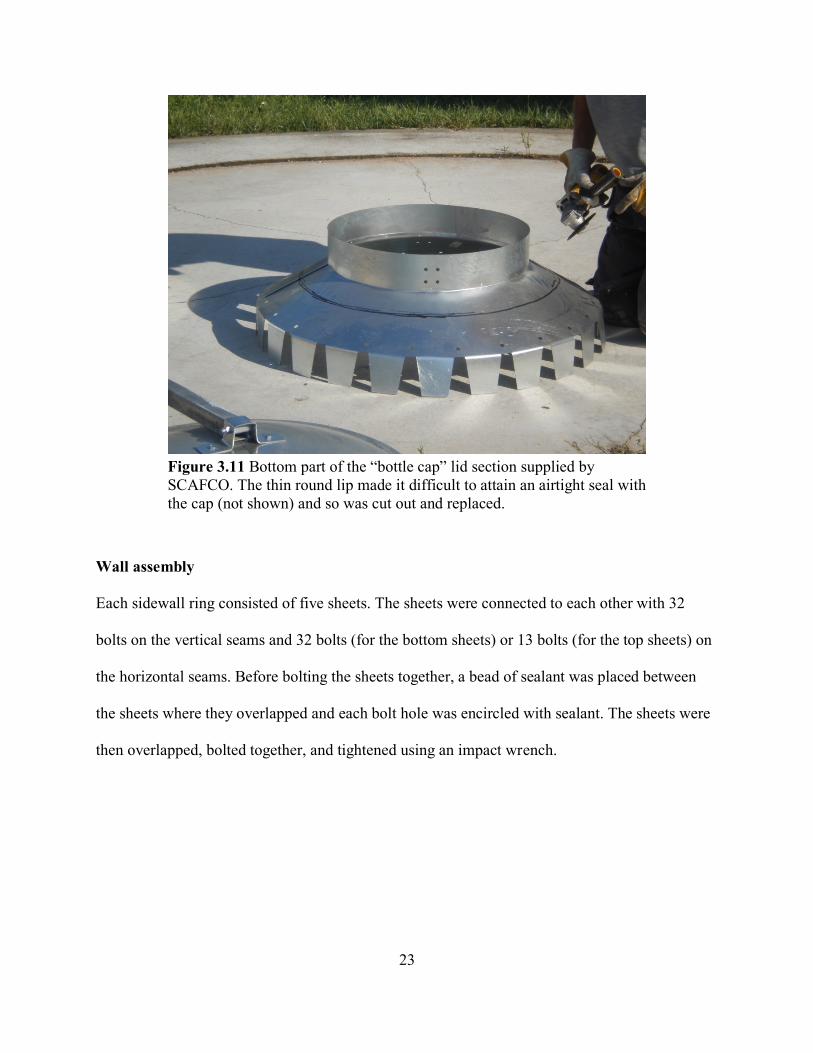
Figure 3.11 Bottom part of the “bottle cap” lid section supplied by SCAFCO. The thin round lip
made it difficult to attain an airtight seal with the cap (not shown) and so was cut out and
replaced. ................................................................................................................................ 23
Figure 3.12 Lid from Bird’s Silos and Shelters installed on the SCAFCO “bottle cap” lid section.
The thicker, round-edged lip allowed for an airtight fit with the foam strip installed on the
underside of the cap (not shown). ......................................................................................... 24
Figure 3.13 Reinforced entry hatch door installed on one of the roof panels. .............................. 25
Figure 3.14“Rib clip” used to attach the roof to the top wall sheet and close most of the gap
created by the roof rib. .......................................................................................................... 26
Figure 3.15 Arrow pointing to the foam block affixed to the rib clip. Sealant was placed around
the interior of the entire roof/sidewall interface.................................................................... 26

ix
Figure 3.16 Rubber gasket that was installed around the entirety of the top wall sheets to help
seal the seam between the top wall and roof panels. ............................................................ 27
Figure 3.17 Ridge where the roof sheets overlapped. Arrows indicate where sealant could not be
easily applied due to the narrow space and leaks detected during pressure testing could not
be fixed. ................................................................................................................................. 28
Figure 3.18 Anchor bolt securing a support leg of the SCAFCO hopper silo to the concrete pad.
............................................................................................................................................... 29
Figure 3.19 All of the hopper sheets were put in place before applying sealant between the sheets
and tightening the bolts. ........................................................................................................ 30
Figure 3.20 Tightening the bolts on the hopper after application of polyurethane sealant into the
gap between sheets. ............................................................................................................... 31
Figure 3.21 Inspecting the welded hopper sections before forming the sheet into a cone and
welding it to the base structure. ............................................................................................ 32
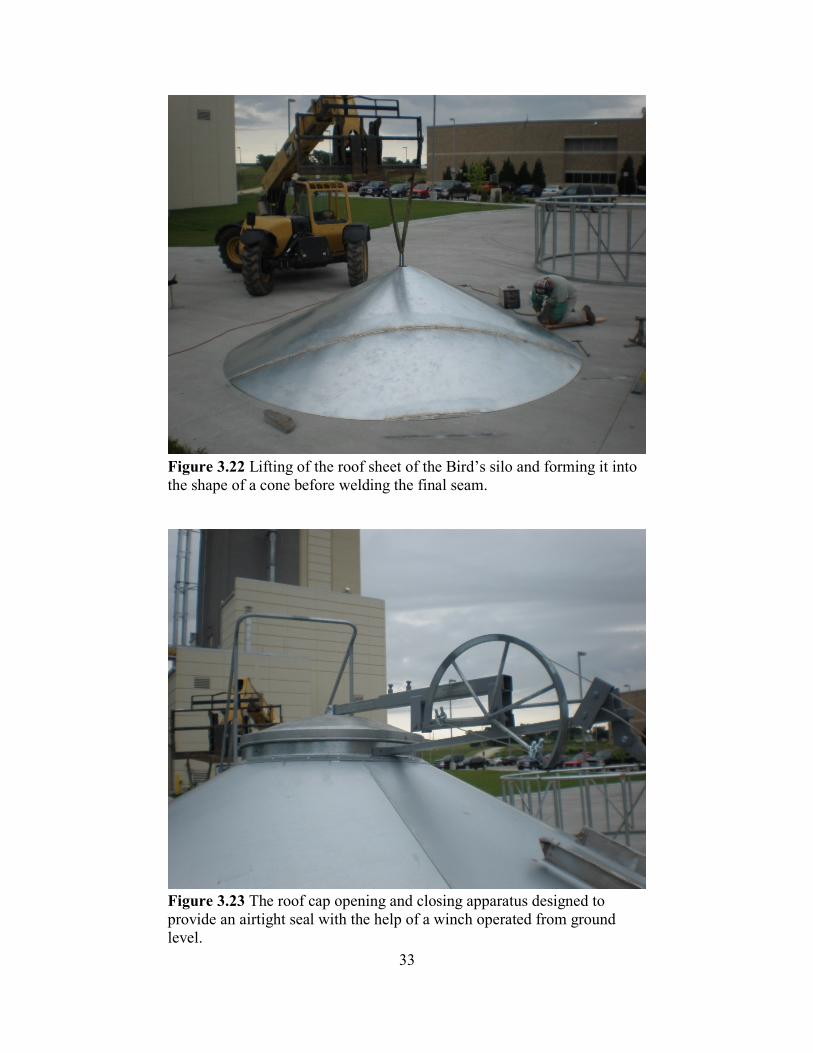
Figure 3.22 Lifting of the roof sheet of the Bird’s silo and forming it into the shape of a cone
before welding the final seam. .............................................................................................. 33
Figure 3.23 The roof cap opening and closing apparatus designed to provide an airtight seal with
the help of a winch operated from ground level. .................................................................. 33
Figure 3.24 The wall sheet sections were overlapped approximately 10 cm. After sealant was
applied they were connected with pop rivets. ....................................................................... 34
Figure 3.25 The roof section was lifted onto the top wall ring and attached with pop rivets. ...... 35
Figure 3.26 After a wall ring was finished, the completed sections were lifted onto that ring and
connected with pop rivets. .................................................................................................... 35
Figure 3.27 Close-up view of connecting the wall rings to each other using pop rivets. ............. 36
Figure 3.28 The preassembled hopper cone was placed inside the base support structure and
welded to it. ........................................................................................................................... 37
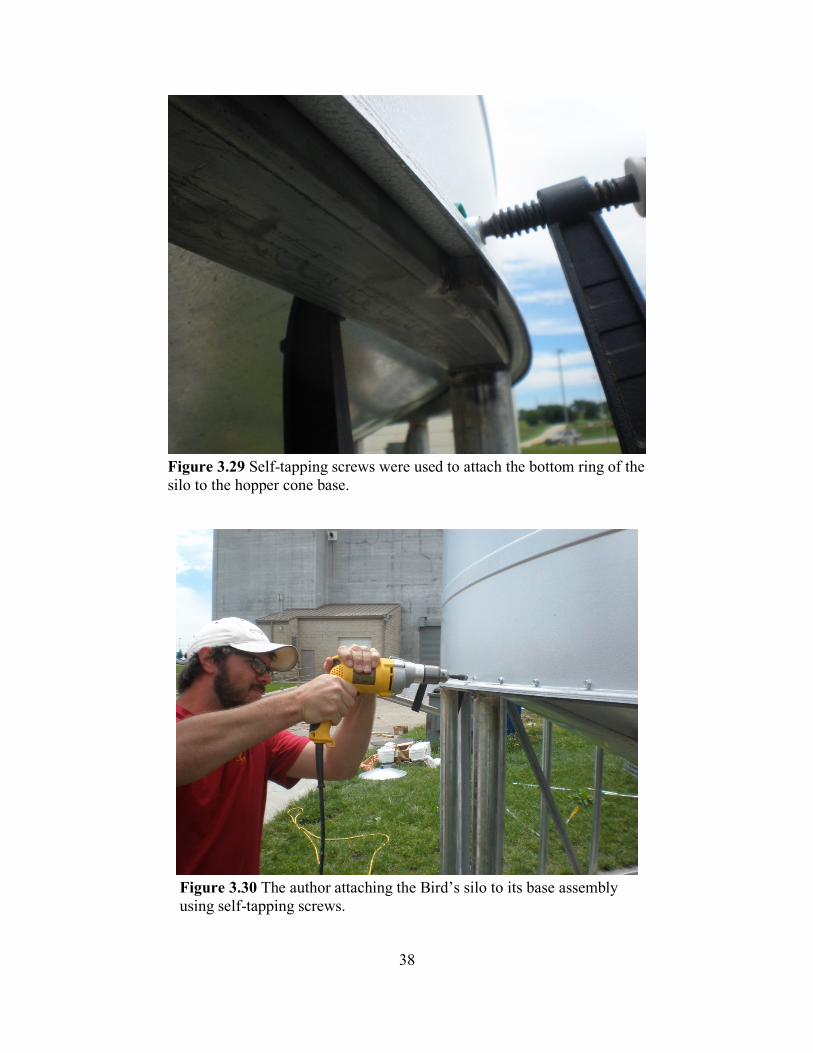
Figure 3.29 Self-tapping screws were used to attach the bottom ring of the silo to the hopper
cone base. .............................................................................................................................. 38
Figure 3.30 The author attaching the Bird’s silo to its base assembly using self-tapping screws. 38
Figure 3.31 Butterfly valve installed at the bottom of the silo hopper cone for discharging the
grain. The narrow gap around the opening allows fumigant in and out of the PH3 reaction
chamber installed below (see Figure 32). ............................................................................. 39

x
Figure 3.32 Phosphine reaction chamber installed below the butterfly valve of the hopper bottom
silo. ........................................................................................................................................ 40
Figure 3.33 Close-up view of the pipe connection between the PH3 reaction chamber and the
thermosiphon. The ball valve and taps can be utilized for introducing other gases including
cylinderized PH3 and turning the thermosiphon on or off. ................................................... 41
Figure 3.34 Thermosiphon piping extending along the south roof panel and connecting into the
headspace of the Bird’s silo. ................................................................................................. 42
Figure 4.1. Closed loop fumigation (CLF) with forced air circulation and convection based
recirculation with thermosiphon. .......................................................................................... 61
Figure 4.2. Rubber gasket attached between roof and edge of top wall sheet (left), and closed-cell
foam block closing large gap at the end of the roof rib (right). ............................................ 64
Figure 4.3. Showing the ThermoSiphon recirculation pipe connecting the PH3 reaction chamber
below the hopper (left) and the headspace (right)................................................................. 65
Figure 4.4. Airtight PH3 reaction chamber installed on the underside of the hopper bottom. ...... 66
Figure 4.5. Butterfly valve and exit points for fumigant inside PH3 reaction chamber. ............... 66
Figure 4.6. Gas concentrations were measured from twenty three sampling points per silo
(indicated by red dots)........................................................................................................... 67
Figure 4.7. Monitoring lines exiting silo roof. The fitting was filled with closed-cell expanding
foam and sealed with silicone caulk around the lines. .......................................................... 68
Figure 4.8. Horn Diluphos System used to blend PH3 and air prior to silo fumigation during trial
4. ............................................................................................................................................ 72
Figure 4.9. Attaching the VAPORPH3OS® to the ThermoSiphon. The gas was directed to the
headspace using a valve on the ThermoSiphon. ................................................................... 74
Figure 4.10 The amount of SF applied to the silo was measured by placing the cylinder on a
digital scale, opening the cylinder valve to allow gas to flow, and closing the valve when the
correct amount of SF had been applied. ................................................................................ 75
Figure 4.11 Average fumigant concentrations in the Bird’s and SCAFCO silos during August 24
– August 29, 2015 while fumigating approximately 43 MT of corn at 14% m.c. and 18°C.
Approximately 30 phosphine tablets were released to reach a target concentration of 0.17
g/m3
(300 ppm). ..................................................................................................................... 79

xi
Figure 4.12 Average fumigant concentrations in the Bird’s and SCAFCO silos during August 31
– Sept. 9, 2015 while fumigating approximately 43 MT of corn at 14% m.c. and 18°C.
Approximately 30 phosphine tablets were released to reach a target concentration of 0.17
g/m3
(300 ppm). ..................................................................................................................... 79
Figure 4.13 Average fumigant concentrations in the Bird’s and SCAFCO silos during September
18-24 while fumigating approximately 43 MT of corn at 14% m.c. and 20° C.
Approximately 30 phosphine tablets were released to reach a target concentration of 0.17
g/m3 (300 ppm). .................................................................................................................... 81
Figure 4.14 Average PH3 concentrations using VAPORPH3OS® cylinderized PH3 in the Bird’s
silo during trial 4 (April 1 – 8, 2016) and SCAFCO silo during trial 5 (April 25 – May 9,
2016), fumigating approximately 43 MT of corn at 16% m.c. and 20° C. Approximately 205
grams of PH3 was applied to achieve a target concentration of 1.5 g/m3 (700 ppm). ........... 82
Figure 4.15 Average SF concentrations using Profume® cylinderized SF in the Bird’s silo during
trial 5 (April 25 – May 3, 2016) and SCAFCO silo during trial 4 (April 1 – 5, 2016),
fumigating approximately 43 MT of corn at 16% m.c. and 20° C. Approximately 1.36
kilograms of SF was applied as prescribed by the Fumiguide software. .............................. 84
Figure 4.16. Phosphine concentrations in the center, south, west, north and east sections at all
four levels in the SCAFCO silo during trial 1 (August 24-27) with the ThermoSiphon turned
on. .......................................................................................................................................... 89
Figure 4.17. Phosphine concentrations in the center, south, west, north and east sections at all
four levels in the SCAFCO silo during trial 3 (September 18-23) with the ThermoSiphon
turned off. .............................................................................................................................. 91
Figure 4.18. Phosphine concentrations in the center, south, west, north, and east sections at all
four levels in the SCAFCO silo during trial 5 (April 25 – May 9, 2016) using
VAPORPH3OS®. ................................................................................................................. 93
Figure 4.19 Average PH3 concentrations at the different heights in the SCAFCO silo during trial
5 (April 25-May 9 using VAPORPH3OS®. ......................................................................... 93
Figure 4.20 Top view of the two silos while under fumigation. The sides of the silos with the
lowest gas concentration were shaded throughout most, or all, of the day, and the sides with
the highest gas concentration were exposed to more solar radiation unless the sky was
overcast. ................................................................................................................................ 94
xii
Figure 4.21 Phosphine concentrations inside the headspace, ThermoSiphon, and near the reaction
chamber in the SCAFCO silo during trial 1. The average PH3 concentration and ambient
temperature are also shown. The legend also applies to Figure 4.22. .................................. 96
Figure 4.22 Phosphine concentrations inside the headspace, ThermoSiphon, and near the reaction
chamber in the SCAFCO silo during trial 3 with the ThermoSiphon off. The average PH3
concentration and ambient temperature are also shown. ...................................................... 96
Figure 4.23 Moisture content and test weight of corn in the top 0.3 m layer kept in the sealed
silos from August 2015 to June 2016. ................................................................................ 104
Figure B.1PH3 concentration data from trial 1 on August 24-29, 2015 in the SCAFCO silo. ... 126
Figure B.2 PH3 concentration data from trial 1 on August 24-29, 2015 in the Bird’s silo. ........ 127
Figure B.3 PH3 concentration data from trial 2 on August 31-September 9, 2015 in the SCAFCO
silo. ...................................................................................................................................... 128
Figure B.4 PH3 concentration data from trial 2 on August 31-September 9, 2015 in the Bird’s
silo. ...................................................................................................................................... 129
Figure B.5 PH3 concentration data from trial 3 on September 18-24, 2015 in the SCAFCO silo.
............................................................................................................................................. 130
Figure B.6 PH3 concentration data from trial 3 on September 18-24, 2015 in the Bird’s silo. .. 131
Figure B.7 SF concentration data from trial 4 on April 1-6, 2016 in the SCAFCO silo. ........... 132
Figure B.8 PH3 concentration data from trial 4 on April 1-20, 2016 in the Bird’s silo. ............. 133
Figure B.9 PH3 concentration data from trial 5 on April 25-May 9, 2016 in the SCAFCO silo. 134
Figure B.10 SF concentration data from trial 5 on April 25-May 9, 2016 in the Bird’s silo. .... 135

xiii
List of Tables
Table 3.1. Specifications of the Australian (Bird’s) and U.S. (SCAFCO) grain silos.................. 14
Table 3.2 Half-life times, grain level, wind speed and ambient temperature for the pressure decay
tests performed on the Bird’s and SCAFCO silos while empty and partially and completely
filled. ..................................................................................................................................... 45
Table 3.3 Effort spent (in man-hours) on the various parts of each silo during construction
compared with the base time it would take experienced workers to build the same silo. .... 49
Table 3.4 Labor and material costs for constructing and sealing the silos, with comparative
figures for temporarily sealing an existing silo prior to fumigation ..................................... 54
Table 4.1 Concentration time products, half-loss times, average maximum concentrations, and
leakage rates in the Bird’s and SCAFCO silos after 125 hours for five fumigation trials. .. 87
Table 4.2 Bioassay results of S. zeamais and T. castaneum during PH3 fumigation trial 1, August
24-29, 2015. ........................................................................................................................ 100
Table 4.3 Minimum PH3 concentrations and times required to achieve a near-complete kill for all
life stages of stored-product insects1. .................................................................................. 102
Table 4.4. Bioassay results of R. dominica and T. castaneum during fumigation trial 5, April 25-
May 4, 2016 ........................................................................................................................ 103
Table 4.5. Insects found in probe traps placed in both silos for 2 weeks in March 2016 ........... 105

xiv
Acknowledgements
From the very beginning this project was a team effort, and would not have happened without
the following people.
Thank you to my major advisor, Dr. Dirk Maier. It is a real privilege to work with you. Your
mentorship and leadership by example has made me a better scientist and better person.
Thank you to my committee members Dr. Praveen Vadlani, Dr. Thomas Phillips, Dr. Mark
Casada, and Dr. Kingsly Ambrose for your willingness to give your valuable time and support
for the successful completion of this project. Thank you for investing in me.
Thank you to Don Bird and Chris Newman for making the long trip to Kansas from Australia
to lend their expertise and advise the construction efforts for the sealed silos. It was a true
pleasure being able to work with you.
I am very grateful to SCAFCO Grain Systems, Inc., for the gift of the SCAFCO hopper silo,
and especially Regan Heaton and Larry Prager for their efforts and on-going technical support.
Special thanks to everyone who volunteered to help erect the silos: Alejandro Morales, Travise
Schmeal, Joshua Schmeal, Ben Plumier, and Rumela Bhadra. The silos were built upon your
blood, sweat, and tears.
Food Protection Services was extremely supportive of this project. Thanks to Dolan Jamison
for taking time from his busy schedule to perform the fumigations, provide technical advice, and
give helpful analysis of the generated data. Special thanks to John Mueller for his tremendous
support of University research.
Thank you to OPIsystems, Inc. for providing the temperature and moisture monitoring
equipment, and especially Chandra Singh for the technical support.

xv
Additional thanks to TSGC, Inc. for research materials, the O.H. Kruse Feed Mill for the corn,
Dr. Subramanyam Bhadriraju, and his lab: Mario Andrada, BeiBei Li, Tesfaye Tadesse,
and Abby Xinyi, for the research materials, advice, help taking fumigation readings, and good
friendship.
Thanks to Terri Mangiaracino, Lisa Long, Beverly McGee, Anita McDiffett, Shawn Thiele,
Bryan Swartz, Carlos Campabadal, for administrative and moral support.

xvi
Dedication
To my marvelous and longsuffering wife, Heather. I love you, baby.
xvii
Preface
The world population is approximately 7 billion and is expected to grow to over 9 billion by
2050. For the food supply to keep up with this population growth, farmers must produce more
food in the next 40 years than has been grown in the history of civilization (Sheeran 2012).
According to the Food and Agricultural Organization of the U.N., cereal grains account for
nearly half of the calories consumed by humans worldwide, and are therefore a key component
in global food security. Kader (2004) estimated that nearly one third of the total grain harvested
worldwide is lost before consumption or sale. Reducing the amount of grain lost after harvest is
an important strategy to fight hunger and poverty. Many methods may be employed to preserve
stored grain quality and quantity; this research project considered fumigation in sealed silos.

1
Chapter 1 - Introduction
For thousands of years grain has been stored in sealed containers (De Lima 1990; Reed 1992;
Sigaut 1980). In ancient times, agricultural societies stored their surplus grain in underground
pits covered with mud or bricks. This kept the grain safe from the elements and restricted the
entry of rodents, birds, and insects. Storing grain in mud or clay pots and jars continues in some
places in the world today (Calderon 1990). Modern scientific research on sealed storage of grain
was started in France in the 1800’s by Ternaux, and others there continued it throughout that
century (Sigaut 1980). In the 1920s, Dendy and Elkington (1920) performed a series of
experiments studying the control of grain insect pests using grain stored in airtight jars.
More recently, chemical fumigants have been used to protect grain in sealed storage. However,
the last half of the 20th
century saw many fumigants lose their approved use status because of
their negative environmental impact or because of toxicity and safety concerns (Bell 2002, Mills
2000). One fumigant still in use is phosphine (PH3) gas. Phosphine is inexpensive, easy to
obtain, and relatively easy to use, making it the most widely utilized grain fumigant worldwide.
However, its effectiveness and longevity may be under threat due to widespread PH3 resistant
insect populations (Opit et al. 2012).
Phosphine can be applied to stored grain via solid pellets and tablets, or via pressurized
cylinders. Care must be taken that the storage structure is sealed before fumigation, but this is not
always the case. In the U.S., the common bolted steel silos are neither manufactured as sealed
nor sealed sufficiently after construction. Leaks present in the silo will invariably result in
fumigant concentrations that fail to kill the more resilient insect pests (Winks 1986). In addition

2
to low levels of fumigant, extremely high levels can also be problematic. Nakakita et al. (1974)
found that as adult Sitophilus zeamais were exposed to increasing concentrations of PH3 (up to
20,000 ppm), they underwent narcosis and the higher levels of PH3 had no effect on account of
their metabolism being inhibited.
In the event of an incomplete kill, PH3 resistant insects continue to produce offspring, thus
creating a population of insects which are resistant to the fumigant. Resistance to fumigants is a
global problem, and the number of resistant insect populations has increased significantly in the
last decade (Newman 2010; Bell 2000; Prickett 1987).
Because phosphine is relied upon so heavily, insect resistance is a major problem for grain
producers, merchants, and processors. If phosphine loses its ability to kill insect pests, grain
producers and handlers will have a much more difficult (and expensive) time maintaining grain
quality.
Due to the potential for PH3 resistance development and the need to maintain its long-term
effectiveness, and considering the success that sealed storage has had in Australia, research into
the feasibility of sealed grain storage to ensure long-term efficacy of PH3 fumigation in the U.S.
is timely and warranted.

3
Chapter 2 - Objectives
The objectives of this research were to:
1. Document and calculate the effort, costs, and feasibility of sealing bolted steel hopper
bottom grain silos while under construction. (Addressed in Chapter 3)
2. Evaluate fumigation success or failure in sealed grain silos using fumigant concentration
and insect bioassay data. (Addressed in Chapter 4)
3. Evaluate thermosiphon recirculation equipment for facilitating fumigant dispersal in
sealed grain silos. (Addressed in Chapter 4)
4. Assess the suitability of storing fumigated grain for extended periods in sealed silos.
(Addressed in Chapter 4)

4
Chapter 3 - Construction, Sealing, and Pressure Testing of
Corrugated Steel Grain Silos
Introduction
The primary goal of grain storage is preserving grain quality. One of the major threats to grain
quality during storage is insect infestation. Stored grain insect pests deteriorate grain by
damaging whole kernels which facilitates mold growth. Insect pests can be controlled by
fumigation which is the addition of toxic gas to the inside of the grain storage structure that kills
all insects present. For a fumigation to be successful the gas concentration and exposure time to
insects need to be held for a sufficient amount of time to kill all insects at all life stages. When
the fumigation is complete, fresh air is forced through the grain to remove the fumigant.
The fumigated structure should be sealed prior to the fumigation because leaks allow the
fumigant to escape, resulting in control failures where less than 100% of the insects are killed.
Fumigating grain in leaky structures has been cited as the main reason for control failures that
can lead to insect resistance (Leesch et al. 1995). In unsealed or poorly sealed silos the fumigant
leaks out, creating selection pressure for resistant individuals in the insect population.
The vast majority of U.S. on- and off-farm grain storage structures are not engineered to be
sealed for adequate levels of gas-tightness. Instead, they have to be sealed temporarily before
fumigation which, especially in larger silos, can add substantial labor and material costs and
results in greater risk of fumigation failures from inadequate sealing than with silos sealed by

5
design. A sealed structure keeps the fumigant within the grain mass long enough to achieve a
complete kill of insects.
History of Sealed Storage
Modern bulk grain storage silos made of concrete and steel keep grain dry, but are not usually
airtight. Sealed storage here refers to a grain structure that is sufficiently airtight to contain a
fumigant long enough to completely kill all grain insect pests at all life stages. The level of
sealing differentiates an unsealed, conventional bulk storage structure that is designed primarily
to keep water out, from a hermetic storage structure that is designed to prevent the passing of air
or gas through the structure fabric.
In 1963, export regulations enacted by the Australian Government required that wheat bound for
export from Australia be inspected and free from infestation of live insects (Barker and van
Graver 2004). A reliance on residual insecticides, especially malathion, rapidly led to resistance
in target grain insect pests such as Rhyzopertha dominica (F.), Tribolium castaneum (Herbst),
Oryzaephilus surinamensis (L.), and Sitophilus oryzae (L.). The Working Party on Grain
Protectants was formed in 1973 to develop alternative protectants to malathion. However,
resistance to the replacement protectants began to develop, especially in R. dominica (van Graver
and Winks 1994). Even today, widespread resistance to most grain protectants exists in Australia
(Collins 2006).
Around the same time, customer preferences in overseas and in particular Australian markets
began calling for reducing pesticide residues in grain products. Pesticide residue-free grain is a

6
major marketing emphasis for Australian grains (Anon. 2014). With shrinking options due to
increasing insect resistance to grain protectants, a long-term solution to grain protection other
than chemical protectants was needed, with more of a focus on phytosanitary handling and
storage of grains and treatments with non-residue leaving fumigants. An outreach initiative was
started to seal existing grain storage structures to ensure successful phosphine (PH3) fumigation
based on previous work by Banks and Annis and others. In the 1980s, Cooperative Bulk
Handling (CBH), a co-op that handles grain in Western Australia, invested in sealing its grain
storage structures to be used for controlled atmosphere and fumigation application. Phosphine
resistance monitoring programs (Collins et al. 2002; Newman 2010) and effective sealing
standards (Banks and Annis 1981; Banks and Ripp 1984) led to extension efforts to educate
farmers about the benefits of sealed grain storage and responsible fumigant management
(Delmenico 1993; Chantler 1983). Outreach efforts also encouraged silo manufacturers to
engineer more readily sealable silos (Ellis 1983). Fumigation research developed advances such
as use of the thermosiphon to passively disperse fumigants within grain using solar radiation.
Boland (1984) began using it in a concrete silo and that was followed by others (Newman et al.
2012).
Recognizing the threat to PH3 as an effective fumigant due to insect resistance and human safety
risks, in 2010 the Australian Government published standard AS 2628 for sealed grain silos (AS
2628-2010). According to this standard, a grain silo can be considered “sealed” only when an
applied pressure on the inside of the structure depletes by 50% in no less than three (for older
silos) to five minutes (for new silos). For example, if a new silo is pressurized to an internal
pressure of 500 Pa, it should be sufficiently airtight to lose no more than 250 Pa in five minutes

7
(Banks and Ripp 1984; Newman 1990). The pressure can be applied to the silo using an air
compressor via a tire valve installed on the sidewall or a vacuum cleaner through a port with a
shutoff valve. This test is known as the half-life pressure decay test, or variable pressure test, and
is easy to perform with a simple U-tube manometer.
In the early days of sealed silos, Banks and Annis (1981) stated that the standard was difficult to
achieve in silos and bunkers smaller than 300 MT, and that pressure testing was difficult in
storages greater than 10,000 MT. Ripp was able to successfully perform a pressure test on a
structure of 260,000 MT (Banks and Ripp 1984) and today silos as small as 10 MT are sold as
sealed and conform to the Australian sealing standard.
Another method for testing the level of gas tightness in a silo or building is the equilibrium
pressure-flow test, or constant pressure test. This test measures the airflow rate required to
maintain a given pressure inside a silo. It is commonly used by the heating, ventilation, and air
conditioning industry (HVAC) to determine the permeability of structures to predict air exchange
between the inside of structures and the outside. It has also been used in silos and flour mills
(Meiering 1982, Chayaprasert 2010). This test is considered to be more accurate but requires
sophisticated equipment to perform. It is therefore not widely used for testing grain silos.
Sealed storage should not be confused with hermetic (i.e., airtight) storage. Hermetic storage is
designed for zero air exchange between the inside and outside of the structure, whereas sealed
storage allows for some amount of leakage. The goal is that leaks do not cause fumigant
concentrations to fall below levels that kill all life stages of all insects (Boland 1984). In
8
addition, if a structure does not meet the pressure standard, a control failure is not necessarily
inevitable. The five minute pressure decay time indicates a level of sealing that minimizes the
amount of leakage due to wind and chimney effects. While leakage via pressure differences is
greater than that due to wind or chimney effects, this level of sealing allows the structure to hold
the fumigant long enough to kill all insect life stages without having to add more fumigant.
Navarro (1998) recommended pressure decay times ranging from 1.5 minutes for a small (up to
500 m3), filled silo, and up to 6 minutes for a large (2000 to 15,000 m
3), empty silo.
Sealed Storage in the U.S.
Sealed storage is not as developed in the U.S. as it is in Australia. Even though agricultural
extension papers as far back as the early 1920s emphasized the importance of sealing enclosures
prior to fumigation (Flint 1921), control failures due to unsealed structures remained
commonplace through the 20th century (Noyes et al. 2000). Nevertheless, some of the same
pressures that spurred the development of sealed storage in Australia may encourage a similar
development in the U.S.
Widespread insect resistance to grain protectants has arisen in the U.S. (Subramanyam and
Harein 1990). In the late 1980s and early 1990s, populations of malathion resistant T. castaneum,
O. surinamensis, and R. dominica were found on farms in Minnesota and Oklahoma.
Fumigants once approved for use in raw grain such as ethyl dibromide, carbon tetrachloride,
carbon disulfide, and methyl bromide have not been reissued approval because of concerns about
environmental impact, harmful residues in the grain and worker safety (Bell 2000; Haritos et al.

9
2006; Donahaye 2000). If PH3 loses its efficacy due to strong insect resistance, stored grain
managers will have a much more difficult and expensive task of protecting grain from insect
damage.
Another factor that may contribute to developing sealed storage is the growing interest in non-
chemical control of insect pests such as under modified (MA) or controlled (CA) atmosphere
storage. Similar in principle to fumigation, under MA and CA the composition of air inside the
storage structure is altered to create a lethal atmosphere to insect pests and promote the safe
storage of products. Though the terms are often used interchangeably in the literature, CA is
usually used when stored products are treated with CO2 or N2 gases to displace air in order to
expose the insects to a high CO2 or low O2 environment in the structure, respectively. The
atmosphere is continually monitored and maintained (i.e., controlled) using tanks of compressed
gas or gas generation equipment. The term MA usually refers to an atmosphere within a
sufficiently sealed structure that is altered to a low O2 or high CO2 state through the respiration
of organisms present. It is also used as a general term to refer to any structure in which the
proportion of atmospheric gases and/or pressure have been altered to preserve stored product
quality or control pests such as when treating organic grains with CO2. In the early 1980s, the
Environmental Protection Agency (USEPA) approved these non-chemical, naturally occurring
gases for disinfesting raw and processed agricultural commodities. The organic food sector is
growing, and uses CA and MA to disinfest not only grains but also other foods like nuts, fruits,
and vegetables (Dilley 1990). Some major U.S. grain handling companies investigated and
adopted the use of CA (Jay and D'Orazio 1983), including for disinfesting organic rice and blue

10
corn intended for human consumption. Hermetically sealed storage structures are designed to
maintain the low O2 environment that CA and MA storage require.
Phosphine and other fumigants are toxic to humans and many instances of injury and death
caused by exposure to fumigants can be found in the literature (Sudakin 2005, Singh et al. 1996,
Anon. 1999). Another benefit of sealed silos is prevention of gas leaks into worker areas and into
the nearby environment which increases worker and bystander safety.
Fumigation in Steel Silos
Steel grain silos consist of rounded steel sheets that are either welded or bolted together, a
sloped steel roof, and a floor which may be flat or a conical shaped hopper to facilitate unloading
of grain. The wall sheets can be smooth or corrugated for more strength, and come in various
gauges. Silos have capacities from less than 500 bushels to over 1 million bushels. Welded silos
are easier to seal successfully because the sidewall seams are already sealed with the weld. In
contrast, when sheets are bolted together there is a possibility for air to escape between the
seams. Rubber stripping is usually placed between the sheets in a bolted silo to seal seams. Grain
inlets, discharge chutes, air vents, aeration ducting, and the junctions between the wall and floor
and the wall and roof are places to seal. To minimize the potential for leakage, in some regions
silos are painted with a reflective white paint that helps to reduce solar induced temperature rise
in the silo which leads to pressure differences between the inside and outside of the silo. Pressure
differences are a main cause of air exchange between the silo and external environment.

11
The grain surface in a silo can also be covered with impermeable tarpaulins to reduce fumigant
leakage. This has been done with varying degrees of success (McGaughey and Akins 1989). It is
labor intensive because someone has to climb inside the silo and drape the tarpaulin over the
grain surface and ensure it is tucked into the grain along the outer edge in order to keep the
fumigant trapped below the tarp.
For bolted steel silos, Noyes et al. (1999) recommended sealing the roof eave gap using closed-
cell foam strips with adhesive backing. For narrow gaps of less than 6.4 mm, they recommended
using urethane or silicone caulk. Urethane is more expensive but has greater adhesion, UV
resistance, and durability. Additionally, grain conveying, loading and discharge equipment,
distributors, downspouts, and aeration fans need to be caulked to make the silo airtight (Newman
1990). It is recommended that steel silos should not remain sealed after fumigation or CA
treatment because of the chance for moisture condensation in the headspace (Casada and Noyes
2001). Sealable ventilation fans should be added to sealed silos to eliminate humid air from
condensing on the underside of the silo roof and dripping onto the top of the grain. This also aids
in clearing a silo of gas after the fumigation is complete.
Uniform gas distribution within the storage structure is important when treating grain with a
fumigant. Pockets of low fumigant concentrations can form due to lack of gas circulation
allowing insects in those locations to survive. Gas circulation is achieved either by forced or
natural convection currents within the grain mass. Winks (1992) suggested that fumigation using
low velocity forced convection recirculation of gas in a leaky silo has a greater chance for
fumigation success than relying on natural convection currents to recirculate gas in the same silo.

12
Figure 3.1 shows a closed loop recirculation design that uses a fan to draw gas from the
headspace and force it up through the grain mass from the plenum (left) and a closed loop design
in which recirculation depends on natural convection currents (right). In this example the passive
recirculation design utilizes an externally installed black pipe that is heated by solar radiation.
That creates a convection current which enhances gas distribution through the grain mass in the
structure. The black pipe is known as a thermosiphon because the temperature difference
between the air inside the pipe and the air inside the silo draws (i.e., siphons) the gas from the
lower connection at the bottom of the silo (i.e., plenum) to the upper connection on the roof (i.e.,
headspace) or vice versa. These natural convection currents vary in velocity and direction as a
result of varying temperature differences throughout the day. In both cases the silo is sealed to
the outside and the gas is distributed only through the closed loop system.
Figure 3.1 Closed loop fumigant recirculation using forced (left) versus natural
(right) convection currents.
In the U.S., the majority of grain is stored on-farm (NASS 2014) and most storage structures are
corrugated steel silos. These silos are usually open-eaved to facilitate the removal of moisture-
laden air from the headspace. In Australia in the 1970s approximately 25% of grain was stored
13
on-farm (Banks and Ripp 1984). Research to investigate the viability of sealing on-farm storage
was undertaken to ensure successful fumigations with the dual goals of achieving insect- and
residue-free grain and ensuring the future of PH3 as an effective fumigant. Currently, nearly all
grain silos sold in Western Australia are engineered to comply with Australian Standard 2628 for
sealed silos, and adoption is growing in Eastern Australia. Partly as a result of successful
adoption of sealed silos, today farmers have the capability to store approximately 50% of grain
harvested (GRDC 2013).
A study was undertaken to compare the materials and time effort required to successfully seal a
U.S. corrugated steel silo versus an Australian sealed silo. The Australian silo was designed as a
sealed silo and the U.S. silo was a conventional open-eave design. The Australian silo was used
as a benchmark for gas-tightness due to its advanced gastight design and construction. The U.S.
silo was sealed as it was being constructed with the goal of making it as gastight as feasible. The
two sealed silos were equipped with closed-loop fumigant recirculation systems and
subsequently tested for gas tightness using the half-life pressure decay test. Efforts focused on
minimizing gas loss during multiple fumigation cycles. The goal of this study was to document
and calculate the effort, costs and feasibility of sealing these two hopper bottom metal silos while
being constructed.
Materials and Methods
Silo Construction and Sealing
Two hopper bottom grain silos were constructed at the Grain Science Complex at Kansas State
University, Manhattan, KS. A SCAFCO 1503HBT hopper bottom silo was donated for this

14
project by SCAFCO Grain Systems Company, Spokane, WA. A Bird’s model 2250 Australian
sealed silo was shipped to Kansas from Bird’s Silos and Shelters in Popanyinning, Western
Australia. Table 3.1 shows the silo size and capacity specifications.
Table 3.1. Specifications of the Australian (Bird’s) and U.S. (SCAFCO) grain silos
Bird's Silos
Model 2250
SCAFCO Grain Systems
Model 1503HBT
Diameter 4.40 m (14.4 ft.) 4.57 m (15.0 ft.)
Peak height 6.93 m (22.7 ft.) 7.73 m (25.3 ft.)
Volume 63.3 m3 (2,235 ft
3) 71.9 m
3 (2,539 ft
3)
Bushels (corn) 1,795 2,039
Metric Tons 45.6 51.8
Site preparation
The silos were constructed and placed on two existing 4.9 m diameter concrete pads (Figure 3.2).
The support legs were bolted to the concrete pads to secure the silos. There were existing
electricity hookups and plenty of room on the paved driveway to assemble the silo components
before placing them on the pads.
For both silos a polyurethane adhesive sealant, Bond+Seal (Wurth USA, Ramsey, NJ) was used.
The sealant was applied between all wall, roof and hopper sheet seams, small gaps (less than
approximately 6 mm), and around other equipment attachments to the silo such as the
thermosiphon and PH3 reaction chamber. All metal-on-metal contact surfaces were cleaned with
alcohol before applying sealant to the surface and connecting those using bolts or rivets.

15
Figure 3.2 Site of silo construction and placement at Kansas State
University, Manhattan, KS.
Pressure testing
Half-life pressure decay tests were undertaken for each silo under empty and filled states.
Pressure tests were performed in the early morning during calm conditions and when the silo
roof and wall temperatures were in equilibrium with the ambient temperature. This avoided
pressure increases in the silo due to solar radiation and wind effects that would have otherwise
skewed the pressure test results. As a result, most tests were performed between 7:00 and 8:00
am.
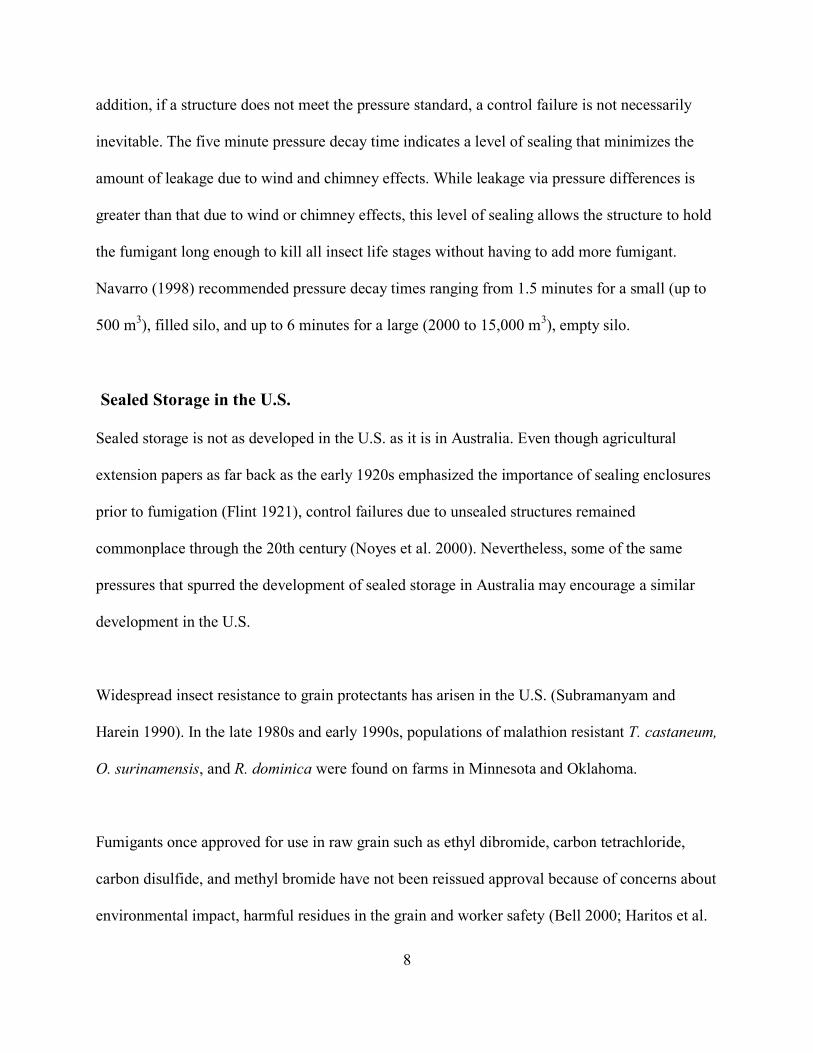
The U-shape pressure relief valve piping was used as a monitor for the pressure tests (Figure
3.3). Positive pressure was applied to the inside of the silo using a portable wet/dry vacuum
cleaner via one of the ball valves on the 4-way tap installed in the Thermosiphon piping (Figure
3.4). The pressure induced by the vacuum cleaner displaced the oil in the U-shape pressure relief

16
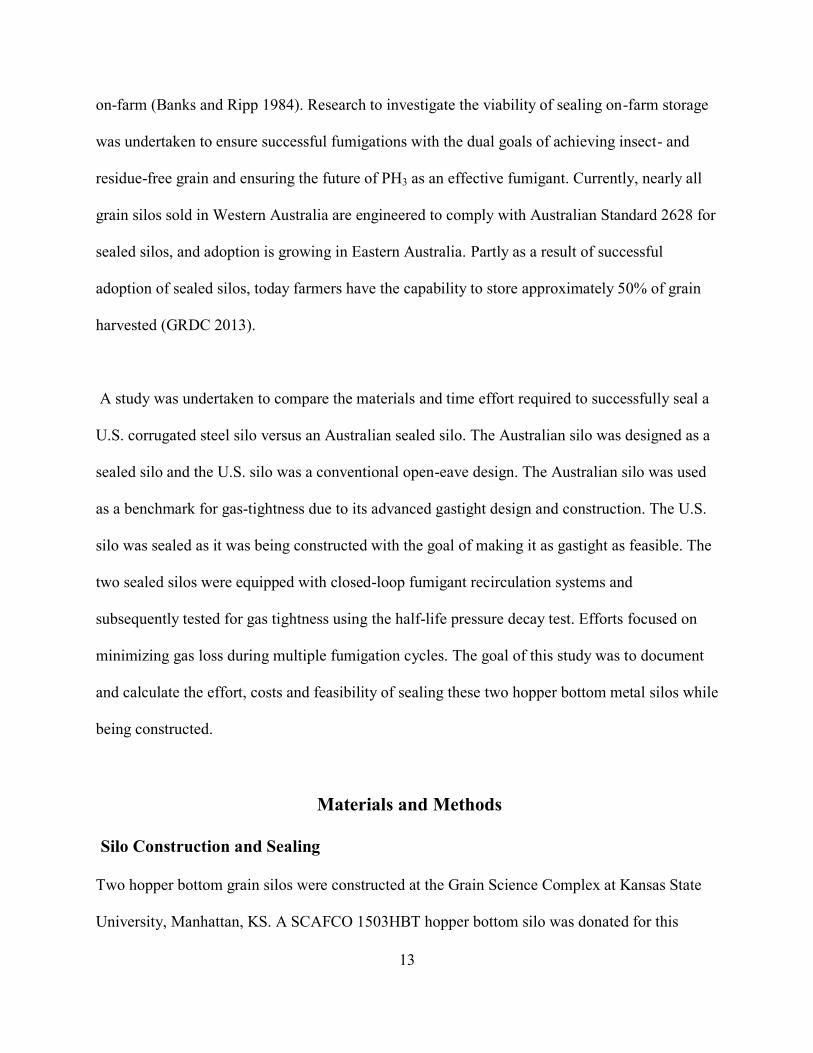
valve. Two horizontal lines 25 mm apart were drawn on the U-shape pressure relief valve for use
with the pressure decay tests. When the oil reached the top line (Figure 3.5) the ball valve was
shut and the vacuum turned off to seal the pressurized silo. The time it took for the oil level to
recede from the top line to halfway between the top line and equilibrium line was measured.
Figure 3.3 U-tube pressure relief valve piping connected near
the bottom portion of the thermosiphon piping. Also used as a
monitor for pressure testing of the sealed silos.
17
Figure 3.4 Vacuum cleaner set on “blow” connected to ball
valve and pressurizing one of the two sealed silos during a
pressurization test.
Figure 3.5 U-shape pressure relief valve used as a monitor during a pressure
decay test showing the silo before pressure was induced (left) and pressurized
to approximately 170 Pa (right).

18
When the hydraulic oil is level with the bottom line of the U-shape tube, the silo is in
equilibrium with normal atmospheric pressure. To determine the pressure indicated when the oil
reached the top line of the U-shape piping the U-shape pressure relief valve piping was used as a
manometer. The silo was kept under pressure using the vacuum cleaner through one ball valve.
The other ball valve was opened to allow enough air to egress the silo so the oil was steady at the
top mark. A digital manometer was connected to a small port in the thermosiphon pipe to read
the pressure inside the silo.
Results and Discussion
SCAFCO silo
Gas tightness is easier to achieve the fewer holes and seams a silo has. The SCAFCO silo had
more than 1800 bolt holes and over 152 m of seams, with a total of 57 individual sheets
including the wall, roof and hopper sheets. With so many potential leakage sites, a liberal amount
of sealant was used between sheets and around bolt holes. The biggest problem areas for sealing
silos are the roof-wall and wall-hopper (or wall-ground) junctions. Special attention was paid to
these areas during assembly.
Roof assembly
The silo roof consisted of 23 A-shaped sections, including one double wide section for the
entrance hatch. Each section had a ridge on both sides which overlapped with the ridge on the
adjacent section (Figure 3.6). The seams along the ridge were potential gas leakage points
considering the relatively few bolts along the large linear surface. A thick bead of sealant was
placed along the ridge between adjacent sections (Figure 3.7).

19
Figure 3.6 A-shaped sections with overlapping ribs formed the roof of the
SCAFCO silo.
Figure 3.7 Placing sealant along the overlapping ribs between roof
sections.

20
The ridges were joined by six bolts along the top of the ridge. The top end of each section was
attached to a central roof ring with two bolts. The gaps between the ring and the roof section
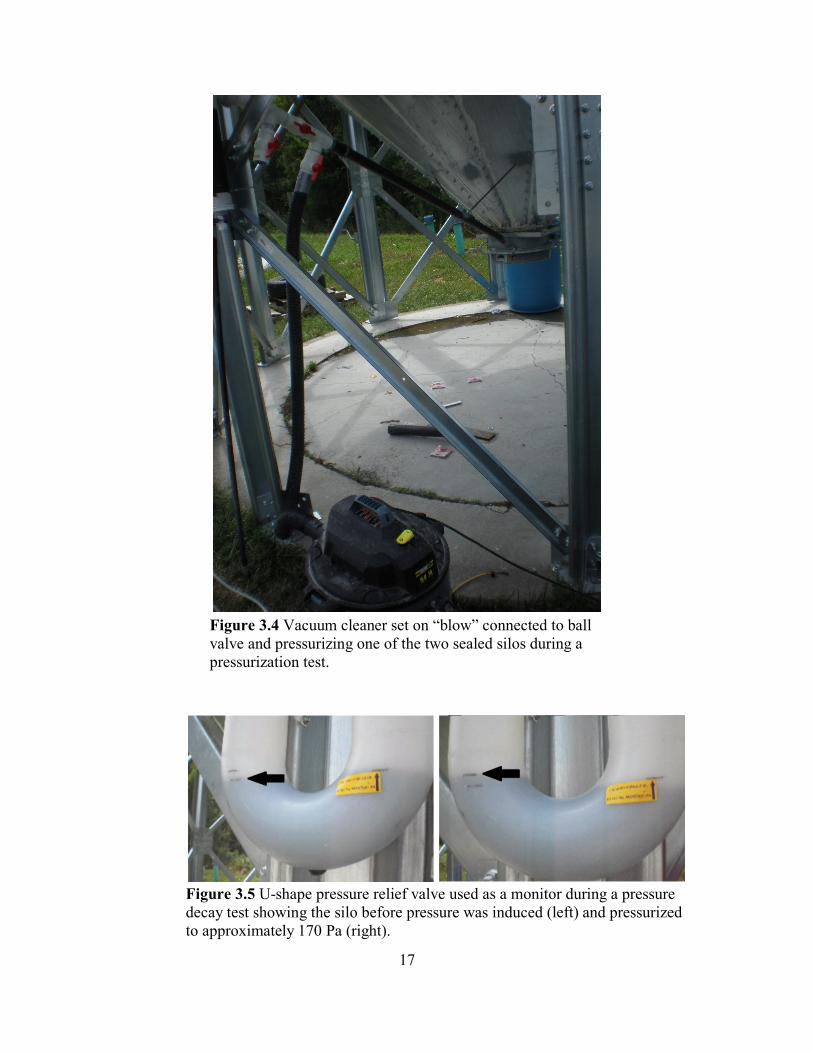
ridges were identified as potentially major gas leakage points (Figure 3.8).
To cover the gaps, metal flashing was fabricated that was attached to the roof sections using self-
tapping screws and hammered tightly into place against the gaps (Figure 3.9). They were then
completely covered with sealant (Figure 3.10).
Figure 3.8 The large end openings of the roof ribs posed a problem for
sealing.

21
Figure 3.9 Metal flashing piece to be screwed onto the roof rib opening to
cover the ends of the roof ribs.
The silo user instructions indicated to keep the bolts loose until all of the sections were placed so
they could be adjusted. However, the sealant began to dry well before all sections could be put
into place. Adjusting the sections even slightly separated the ribs and sealant, compromising the
airtight seal. For this reason, the bolts were tightened immediately. Unfortunately, because the
sealant acted as glue between the sections, there was little flex in the roof which made it
impossible to attach the last few sections together. As a result, bolts had to be loosened on
several sheets to give the roof enough flexibility to fit the last sections together. After all of the
roof sections were finally in place, all loose bolts were tightened.
22
Figure 3.10 Metal flashing pieces on the ends of the roof rib openings
after covering with sealant.
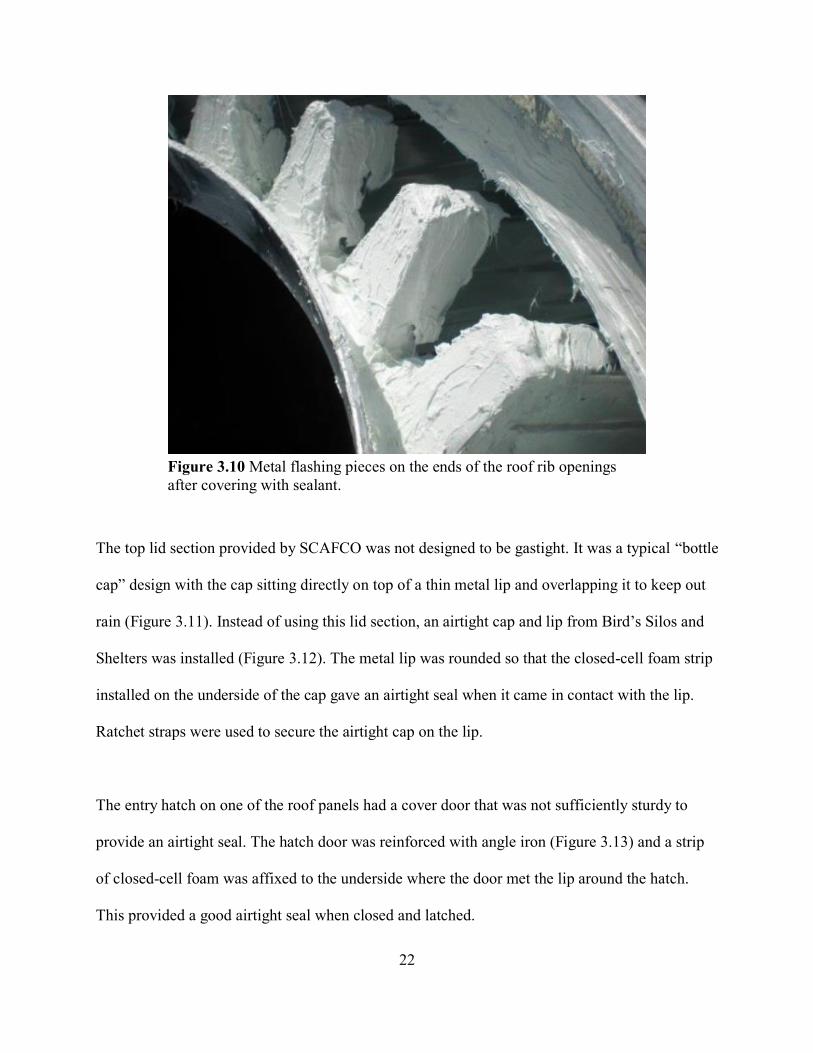
The top lid section provided by SCAFCO was not designed to be gastight. It was a typical “bottle
cap” design with the cap sitting directly on top of a thin metal lip and overlapping it to keep out
rain (Figure 3.11). Instead of using this lid section, an airtight cap and lip from Bird’s Silos and
Shelters was installed (Figure 3.12). The metal lip was rounded so that the closed-cell foam strip
installed on the underside of the cap gave an airtight seal when it came in contact with the lip.
Ratchet straps were used to secure the airtight cap on the lip.
The entry hatch on one of the roof panels had a cover door that was not sufficiently sturdy to
provide an airtight seal. The hatch door was reinforced with angle iron (Figure 3.13) and a strip
of closed-cell foam was affixed to the underside where the door met the lip around the hatch.
This provided a good airtight seal when closed and latched.
23
Figure 3.11 Bottom part of the “bottle cap” lid section supplied by
SCAFCO. The thin round lip made it difficult to attain an airtight seal with
the cap (not shown) and so was cut out and replaced.
Wall assembly
Each sidewall ring consisted of five sheets. The sheets were connected to each other with 32
bolts on the vertical seams and 32 bolts (for the bottom sheets) or 13 bolts (for the top sheets) on
the horizontal seams. Before bolting the sheets together, a bead of sealant was placed between
the sheets where they overlapped and each bolt hole was encircled with sealant. The sheets were
then overlapped, bolted together, and tightened using an impact wrench.

24
Figure 3.12 Lid from Bird’s Silos and Shelters installed on the
SCAFCO “bottle cap” lid section. The thicker, round-edged lip
allowed for an airtight fit with the foam strip installed on the underside
of the cap (not shown).

25
Figure 3.13 Reinforced entry hatch door installed on one of the roof
panels.
Roof-wall attachment
The user instructions advise attaching the roof panels to the top ring while building the roof,
however, the roof was completely assembled on the ground before attaching it to the top ring. On
the first attempt the roof did not fit when trying to attach it to the sidewall so the bolts were
loosened and the roof panels were adjusted to make the roof fit. This led to the roof ribs being
shifted and caused the sealant between the roof ribs to come apart and create gaps for air to leak
through. Most of these air leaks were found during later leakage testing and then resealed. A
sealing kit was included with the SCAFCO silo that consisted of rib clips that closed most of the
gap near the wall created by the roof ribs (Figure 3.14), foam sealing blocks to fill in the rest of
this gap (Figure 3.15), and a rubber gasket that clipped onto the top wall sheet to provide a seal
between it and the roof (Figure 3.16).

26
Figure 3.14“Rib clip” used to attach the roof to the top wall sheet and
close most of the gap created by the roof rib.
Figure 3.15 Arrow pointing to the foam block affixed to the rib clip.
Sealant was placed around the interior of the entire roof/sidewall interface.

27
Figure 3.16 Rubber gasket that was installed around the entirety of the top
wall sheets to help seal the seam between the top wall and roof panels.
The sealing kit was designed to keep moisture (i.e., rain) out of the top of the silo. It was not
adequate to prevent gas from entering or exiting the silo. The rib clips were attached to the upper
edge of the top ring. The clips were designed to both attach the roof to the sidewall, and to close
the gap between the ridges of the roof sections. Adhesive spray was applied to the interior side of
the rib clips and the foam blocks were stuck to these to close the gap around the metal flashing
(Figure 3.14). Sealant was applied to the entire interior seam between the roof and top wall
sheets. The seams of the ridges between adjacent sheets were difficult to apply sealant into, as
the nozzle of the sealant gun was too large to fit into the tight space (Figure 3.17).

28
Figure 3.17 Ridge where the roof sheets overlapped. Arrows indicate
where sealant could not be easily applied due to the narrow space and
leaks detected during pressure testing could not be fixed.
When the roof and top wall ring were put together, the assembly was lifted into the air by a small
crane using a metal ring with a diameter larger than the top roof opening. The metal ring was
attached to the crane with straps, placed inside the roof assembly, and used to lift the roof
assembly. Two more wall ring sections were assembled and then attached, sealing the seams and
bolt holes as described above.
Leg and hopper assembly
The silo support legs were attached to the lower sidewall ring and then fastened to the concrete
pad using anchor bolts (Figure 3.18). The hopper cone consisted of 19 sheets, with more than
120 bolt holes per sheet. Because of close tolerance, the hopper sheets were placed in position

29
and bolted together, but the bolts were not tightened until all hopper sheets were in place (Figure
3.19).
Figure 3.18 Anchor bolt securing a support leg of the SCAFCO hopper
silo to the concrete pad.
Sealant could not be applied around each individual bolt hole as it was on the wall sheets
because it would have dried out before all bolts were ready to be tightened. Instead, sealant was
applied into the gaps between the hopper sheets as much as possible before the bolts were
tightened (Figure 3.20). At the bottom of the hopper, each sheet was bolted to a center ring to
form the bottom outlet. A square metal plate was attached to that ring to which the PH3 reaction
chamber was welded.

30
Sealant was applied to the seam between the hopper sheets and bottom sidewall sheets. Because
of the angle, it was more effective to apply the sealant from the inside of the silo. This was time
consuming because someone had to use a ladder braced against the bottom of the hopper bottom
to reach the hopper-sidewall junction and apply the sealant.
Figure 3.19 All of the hopper sheets were put in place before applying
sealant between the sheets and tightening the bolts.

31
Figure 3.20 Tightening the bolts on the hopper after application of
polyurethane sealant into the gap between sheets.
Bird’s silo
The Bird’s silo was intended to be used as a sealed silo for grain fumigations, and thus was
designed to reduce the number of potential leak sites. For this reason, the sidewall rings are
constructed out of only one sheet so there is only one seam per ring. The roof and hopper
sections are both constructed out of one sheet each and had no potential for leaks other than
where they connected to the wall rings. However, to ship the silo to Kansas, these sections had to
be cut into four pieces each at the factory and reassembled on-site. The Bird’s silo consisted of a
total of 14 individual sheets. It required about 600 rivets to fasten the wall sheets together and
connect the roof to the top wall sheet plus about 140 self-tapping screws to attach the silo to the
hopper base.

32
Roof assembly
The roof section pieces were welded together to create a single circular sheet with a “V” cut out
(Figure 3.21). The roof sheet was formed into a cone and the two edges of the “V” were welded
together (Figure 3.22). A ring was installed on the underside to provide structural stability to the
roof. A hole was cut in the peak of the roof to accommodate the cap and lid. The lid was
designed by Bird’s to be opened and closed from ground level by a winch and pulley system
(Figure 3.23). When closed, the pressure of the pulley on the close fitting cap over the round-
edged lip provided an airtight seal.
Figure 3.21 Inspecting the welded hopper sections before forming the
sheet into a cone and welding it to the base structure.
33
Figure 3.22 Lifting of the roof sheet of the Bird’s silo and forming it into
the shape of a cone before welding the final seam.
Figure 3.23 The roof cap opening and closing apparatus designed to
provide an airtight seal with the help of a winch operated from ground
level.

34
Wall assembly
Each of the four wall rings was cut into three sections at the factory to fit them inside the
shipping container for the journey from Australia to Kansas. The ring sections were
manufactured approximately 10 cm longer than normal so they could be overlapped and
connected together. Sealant was applied to the 10 cm overlap between each section. They were
then joined with two rows of pop rivets to form the ring (Figure 3.24). The pop rivets were
covered with sealant on the inside of the silo. The roof section was lifted onto the top wall ring
and attached using pop rivets (Figure 3.25). Sealant was applied on the inside of the silo on the
seam between the roof and top sidewall ring.
The roof and top ring were lifted and set on the lip of the next ring (Figure 3.26). The rings were
attached to each other using pop rivets placed at approximately 10 cm intervals around the entire
circumference of each ring seam (Figure 3.27).
Figure 3.24 The wall sheet sections were overlapped approximately 10
cm. After sealant was applied they were connected with pop rivets.

35
Figure 3.25 The roof section was lifted onto the top wall ring and attached
with pop rivets.
Figure 3.26 After a wall ring was finished, the completed sections were
lifted onto that ring and connected with pop rivets.

36
Figure 3.27 Close-up view of connecting the wall rings to each other
using pop rivets.
Base and hopper assembly
The base structure of the Bird’s hopper silo was fabricated from 5 cm diameter steel pipe.
Twenty four vertical supports were welded between two rings which required a person on-site
with welding skills. The supports were approximately 1.5 m tall. The hopper was assembled in
the same manner as the roof which provides consistency in manufacturing and for assembly. The
section pieces were laid out on the ground and welded together, then formed into a cone. The
hopper cone was lifted and set into the base structure and welded to it along its edge. The bottom
of the hopper cone was approximately 0.6 m above the ground (Figure 3.28). The completed roof
and wall sections were lifted using the crane and placed on top of the base and hopper. The
bottom lip of the bottom ring fit snugly over the outer edge of the hopper cone base ring (Figure
3.29). Self-tapping screws placed every 10 cm were used to attach the silo to the hopper cone

37
base (Figure 3.30). Sealant was applied to the hopper-sidewall interface on the inside and
outside. A hole was cut in the bottom of the hopper cone to accommodate the butterfly valve and
PH3 reaction chamber housing.
Figure 3.28 The preassembled hopper cone was placed inside the base
support structure and welded to it.
Additional equipment on both silos
A slide gate discharge was included with the SCAFCO silo, but because of the difficulty in
sealing the slide gate, the bottom of the silo was modified to use a butterfly valve instead (Figure
3.31). The butterfly valve was custom-made based on the design of the one that came with the
Bird’s silo.
38
Figure 3.29 Self-tapping screws were used to attach the bottom ring of the
silo to the hopper cone base.
Figure 3.30 The author attaching the Bird’s silo to its base assembly
using self-tapping screws.
39
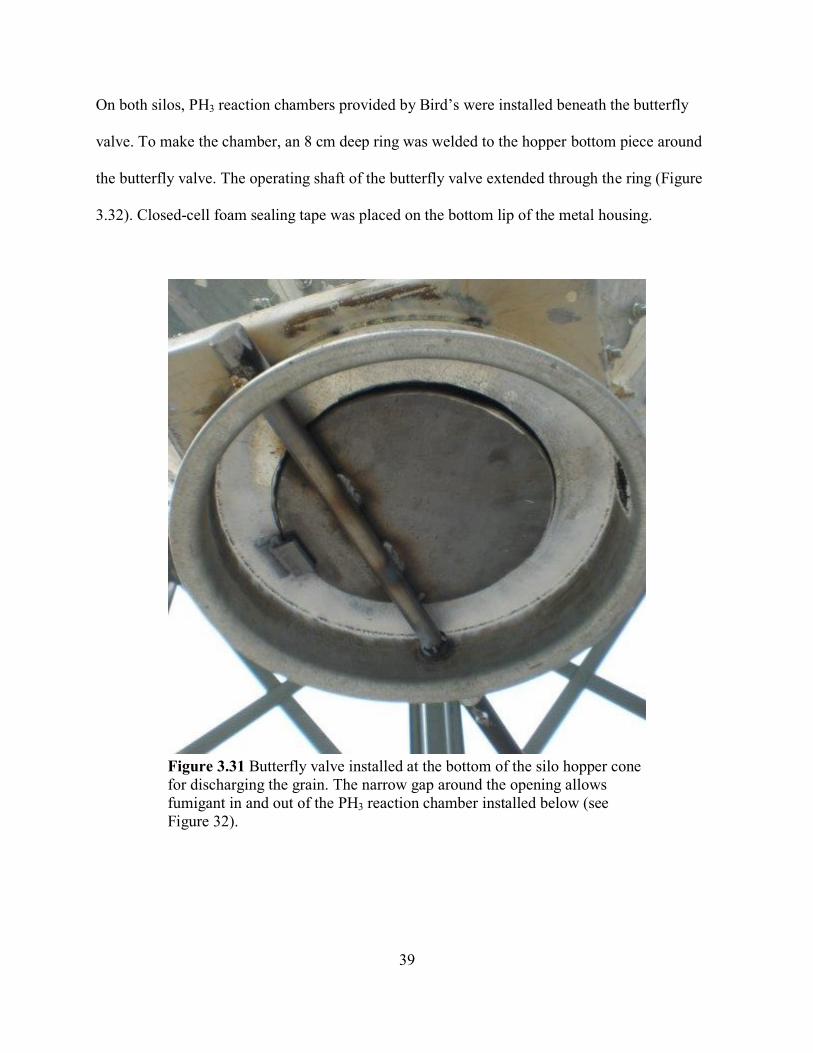
On both silos, PH3 reaction chambers provided by Bird’s were installed beneath the butterfly
valve. To make the chamber, an 8 cm deep ring was welded to the hopper bottom piece around
the butterfly valve. The operating shaft of the butterfly valve extended through the ring (Figure
3.32). Closed-cell foam sealing tape was placed on the bottom lip of the metal housing.
Figure 3.31 Butterfly valve installed at the bottom of the silo hopper cone
for discharging the grain. The narrow gap around the opening allows
fumigant in and out of the PH3 reaction chamber installed below (see
Figure 32).

40
A metal bowl with the same diameter as the upper ring clipped onto the housing, creating an
airtight PH3 reaction chamber with a volume of approximately 0.3 m3 (Figure 3.32). A perforated
plate was inserted into the bottom of the bowl for placement of PH3 fumigant tablets or pellets.
Figure 3.32 Phosphine reaction chamber installed below the butterfly
valve of the hopper bottom silo.
Thermosiphon Closed Loop Recirculation System
To facilitate gas recirculation inside the silo, a closed loop recirculation system was installed. It
consisted of a 38 mm diameter pipe connecting the PH3 reaction chamber to the 90 mm black
PVC thermosiphon pipe near the sidewall-hopper interface (Figure 3.33). The 90 mm
thermosiphon pipe was installed at the south side of the silo where it ran upwards to the eave.
After making two 90° bends it ran along the roof to approximately 0.5 m from the peak where it
connects into the headspace (Figure 3.34). A vertical section extends below the thermosiphon at
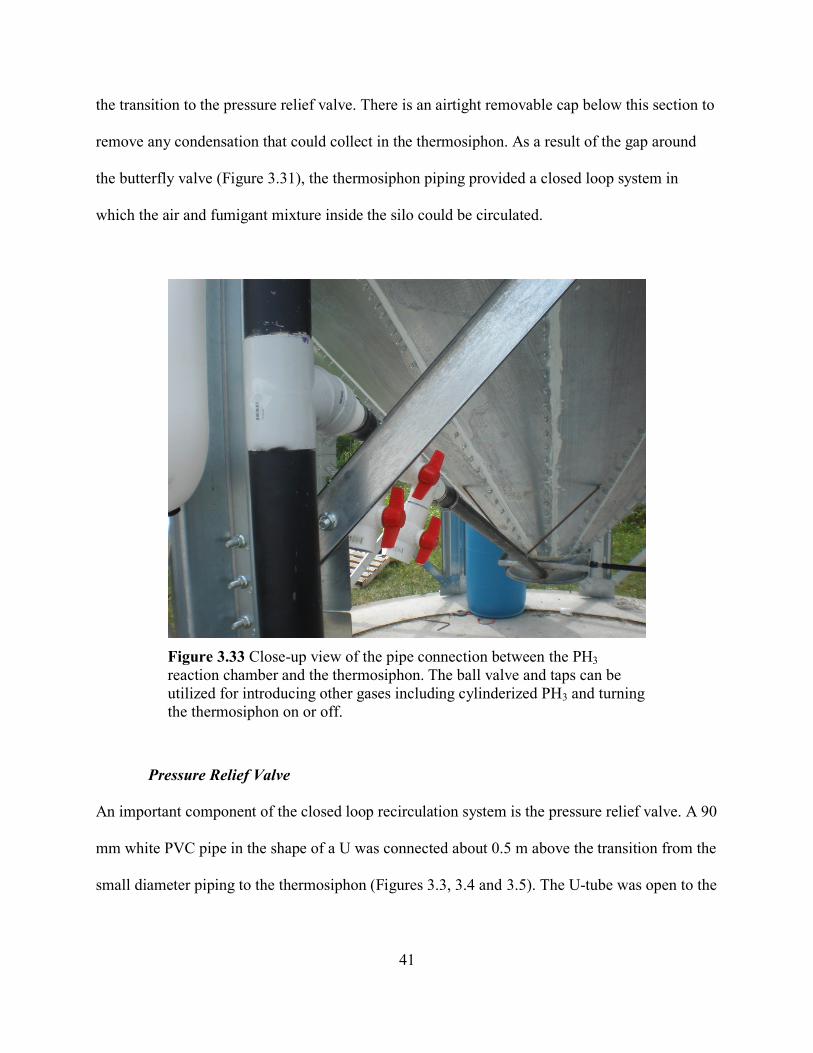
41
the transition to the pressure relief valve. There is an airtight removable cap below this section to
remove any condensation that could collect in the thermosiphon. As a result of the gap around
the butterfly valve (Figure 3.31), the thermosiphon piping provided a closed loop system in
which the air and fumigant mixture inside the silo could be circulated.
Figure 3.33 Close-up view of the pipe connection between the PH3
reaction chamber and the thermosiphon. The ball valve and taps can be
utilized for introducing other gases including cylinderized PH3 and turning
the thermosiphon on or off.
Pressure Relief Valve
An important component of the closed loop recirculation system is the pressure relief valve. A 90
mm white PVC pipe in the shape of a U was connected about 0.5 m above the transition from the
small diameter piping to the thermosiphon (Figures 3.3, 3.4 and 3.5). The U-tube was open to the

42
atmosphere via a 90 mm diameter and 1.5 m long PVC pipe that ends in a 180° bend to prevent
rain from entering.
Figure 3.34 Thermosiphon piping extending along the south roof panel
and connecting into the headspace of the Bird’s silo.
To seal the pipe from outside air, the bottom of the U is filled with light hydraulic oil to
approximately 1 cm above the top bend of the U. Solar heating of the silo wall and roof,
barometric pressure changes, and pressurization from applied gases such as cylinderized PH3 or
CO2 can build up pressure inside the silo that may cause structural damage. When pressure
increases, air is pushed from the silo into the thermosiphon pipe and through the hydraulic oil in
the U-tube to the atmosphere, relieving the pressure difference between the inside and outside of
the silo. When pressure decreases, i.e., from barometric pressure swings or from unloading of
grain, outside air is drawn through the hydraulic oil of the U-tube into the thermosiphon pipe and
ultimately the silo. The pressure relief valve may not be of large enough capacity to equilibrate

43
the silo pressure during unloading of grain, however. Care should be taken to allow for adequate
venting (e.g., by keeping the roof hatch open) to avoid excess suction pressure during grain
unloading.
Evaluating the gas-tightness of the sealed silos
Table 2 shows the half-life times from the 13 pressure decay tests conducted. In addition to the
initial 7 tests in July and August 2015 after the silos were constructed, each silo was pressure
tested before being fumigated. When the oil is level with the top line it indicates an inner silo
pressure of 140 to 170 Pa based on measurements taken with the digital manometer. Wind
speeds and air temperatures during the tests indicate reasonable conditions. These values are
important because of the influence wind and temperature can have on the pressure within the silo
(Navarro 1998). Most of the tests were performed under calm conditions (wind speeds of less
than about 5 m/s), and during times when solar radiation did not increase the roof and wall
temperature of the silo (ambient temperatures below about 25°C). The data collected does not
indicate a readily apparent correlation between either wind speed or temperature and the half-life
pressure decay times.
Neither silo reached the 3-5-minute minimum half-life pressure decay time prescribed by the
Australian silo sealing standard AS2628. For the empty silos, the half-life times for the Bird’s
silo ranged from 42 seconds to 2 minutes 43 seconds, and for the SCAFCO silo from 0 to 50
seconds. For the partially and completely filled silos, the half-life times for the Bird’s silo ranged
from 4 seconds to 1 minute 53 seconds, and for the SCAFCO silo from 20 to 46 seconds.

44
Overall, the Bird’s silo showed a better gas-tightness as reflected in the higher half-life times
compared to the SCAFCO silo.
The Bird’s silo showed a greater loss of gas-tightness over time compared to the SCAFCO silo.
After reaching the highest half-life time on August 12, 2015 as a result of additional sealing
efforts, once the first set of fumigations took place on August 18, 2015 the half-life times of the
Bird’s silo decreased by 50-71 seconds (31-44%) while those of the SCAFCO silo decreased by
4-19 seconds (8-38%). As additional fumigations took place in August and November of 2015
and March of 2016, the half-life of the Bird’s silo decreased by up to 159 seconds (98%)
compared to 30 seconds (60%) for the SCAFCO silo. Between the March and April 2016
pressure tests and additional sealing was performed on the Bird’s silo.
These results indicate that stress on the silo from loading and unloading of grain may cause
flexing of the silo structure that results in substantial degradation of sealing materials and
pressure half-life decay times. This is a concern as silos are utilized for many years and undergo
many loading and unloading cycles. Dramatic seasonal weather conditions such as high summer
and freezing winter temperatures as well as wind, snow, rain and exposure to solar radiation may
also affect the durability of sealing materials, and therefore the gas-tightness of a sealed silo
more substantially than anticipated. Resealing a silo on an annual or seasonal basis would add
substantial costs, and may prove to be impractical.

45
Table 3.2 Half-life times, grain level, wind speed and ambient temperature for the pressure
decay tests performed on the Bird’s and SCAFCO silos while empty and partially and
completely filled.
Date Bird's
Half-life (s)
SCAFCO
Half-life (s)
Grain
Level
Wind Speed
(m/s)
Air
Temperature
(°C)
Actions performed
2015
14-July 42 0:00 Empty 2.3 26.9
15-July - 0:20 Empty 2.2 21.6 Fix SCAFCO leaks
16-July 66 - Empty 2.8 27.0 Fix Bird’s leaks
16-July 103 - Empty 3.4 28.6 Fix Bird’s leaks
16-July 151 - Empty 3.7 29.5 Fix Bird’s leaks
10-August - 0:42 Empty 0.9 27.5 Fix SCAFCO leaks
12-August 163 0:50 Empty 0.3 21.6 Fix both silos’ leaks
18-August 113 0:31 1/2 Full 2.2 20.7 Filled with grain
18-August 92 0:46 1/2 Full 2.6 20.1 No actions
31-August 31 0:23 Full 0.3 21.3 Filled with grain
25-November 5 0:25 Full 4.2 12.3 No actions
2016
31-March 15 0:20 Full 6.5 9.6 No actions
25-April 40 0:20 Full 2.2 16.1 Fix Bird’s leaks

46
Pressure testing itself may have had a deleterious effect on the half-life times. If there were areas
where the sealant membrane was thin, it is possible that the introduction of high pressure from
the vacuum cleaner – which was enough to force air through the pressure relief valve – without
sufficient venting, could have compromised one or more of the sealant membranes.
Fixing leaks
As part of the initial pressure tests, leaks were found in both silos. Some leaks were able to be
fixed, and others were not. The tests were performed when the silos were empty, half-full, and
full of grain. When pressure tests indicated short half-life times, (less than 3 minutes) leaks in the
silos were discovered by spraying soapy water on the seams and bolt holes while the silo was
under positive pressure. Once discovered, locations were marked and subsequently additional
sealant was applied to these areas after thoroughly removing soap residue and drying them.
In the SCAFCO silo there were six major leaks detected along the ridge seams between the roof
and wall sections. It is likely that when the already connected roof sections were pulled slightly
apart to accommodate the last few roof sections, sealant was pulled apart when the sections were
shifted. This must have created gaps through which air could escape. Due to the structure of the
roof ribs, these leaks could not be addressed after the roof was constructed because the leak was
between overlapping roof sheets and could not be reached.
Thirteen out of the 23 roof rib end points on the SCAFCO silo showed leaks. Additional sealant
was applied to the outside of each leaky roof rib clip opposite the foam block, but could not be
applied in between the overlapping ribs. The arrows in Figure 3.17 show the area that could not

47
be effectively sealed because the nozzle of the sealant gun was too wide to fit into the narrow
space between roof ribs.
Other leaks detected in the SCAFCO silo were in the hopper-wall junction. There were 15
junctions where three sheets joined (i.e., two wall sheets and one hopper sheet, or two hopper
sheets and one wall sheet), and 12 of these had leaks. No leaks were found where only two wall
sheets were joined. Several leaks were found around bolts in the hopper, likely where sealant did
not get completely around the bolt holes or where the neoprene gasket around the bolt was
stripped out because too high of a torque was applied from the electric impact wrench during
construction. The time spent on the SCAFCO silo in finding leaks, fixing them, and pressure
testing again was about 60 man-hours.
On the Bird’s silo, 11 leaks were found in total. Eight of these were on seams or joints where
three sheets met. The other leaks were on the vertical seams of the wall sheets. The areas where
these leaks were found were cleaned and dried, and more sealant was reapplied to the leak and
surrounding seams and rivets. The time spent in finding the leaks, fixing them, and pressure
testing again was about 12 man-hours.
If market demands eventually warrant engineering changes in silo design to allow for easier
sealing, the roof – and hopper-wall junctions, top lid, and roof – especially the overlapping roof
ribs – should be considered areas of greatest concern.

48
Time and labor to construct and seal silos
Don Bird from Bird’s Silos and Shelters and Chris Newman from Stored Grain Services, both
from Western Australia, came to Kansas to lend their expertise in constructing the sealed silos.
The construction crew ranged from three to eight people, depending on people’s availability. The
Bird’s silo took 10 days from start to finish, and the SCAFCO silo took 26 days from start to
finish. This time included unpacking of the containers to erecting and sealing the silos to
pressure testing the completed silos. The silos were built concurrently, and had different people
working on them on different days. Altogether, the Bird’s silo took 266 man-hours and the
SCAFCO silo took 359 man-hours to complete.
The polyurethane sealant came in 600 mL “sausage” tubes. Approximately 8 tubes were used on
the Bird’s silo and 28 were used on the SCAFCO silo. Given the SCAFCO silo was not designed
to be sealed for gas-tightness, much more sealant was needed to cover the holes, gaps and seams
compared to the Bird’s silo.
Table 3 shows the breakdown of effort spent on various aspects of silo construction. Also
included are the estimated times it would take experienced workers to construct each silo. Much
more time was spent constructing the SCAFCO roof and hopper than what was needed for the
Bird’s, largely due to the effort that went into sealing. The Bird’s silo required more time for
assembling the sidewalls, as each ring was challenging to fit onto the one below it. Much time
was spent aligning the rings before connecting them with rivets.

49
Table 3.3 Effort spent in man-hours to construct each silo (including sealing) compared with the
base time it would take experienced workers to build the same silo.
Roof
and
Lid
Hopper
/ Base Sidewalls Assembly
Fixing
leaks Miscellaneous Total
Bird’s 48 60 60 66 12 20 266
SCAFCO 90 128 30 31 60 20 359
Bird’s (Factory) - - - - - - 53
SCAFCO
(experienced
work crew)
- - - - - - 96
Bird’s silo
It takes a work crew of about 53 man-hours to assemble a silo at the Bird’s factory (Don Bird,
personal communication). Extra time was needed for the construction of the silo in this study
because the wall, roof and hopper sheets were cut in pieces prior to shipment and had to be
welded on-site. Because the Bird’s silo was designed to be sealed, the only “sealing time” parsed
out of the following time and labor figures is the time spent finding and fixing leaks.
The roof took about 48 man-hours to piece together, weld, seal, and install the ground-opening
airtight lid. The hopper and base assembly took approximately 60 man-hours to assemble and
weld. Sixty man-hours were spent on putting the sidewalls together. To assemble the roof,
sidewall rings, and hopper sections took 66 man-hours. Actual construction time was therefore
234 man-hours. Approximately 12 man-hours were spent finding, fixing, and re-testing leaks.
The additional 20 man-hours from the total time spent was accounted for by people waiting for
work, planning next steps, waiting for parts, and other activities.
50
Eight tubes of sealant were used to seal the Bird’s silo, but this cost would already be figured
into the list price of the silo as ordered from the factory, and the same is true for the airtight lid,
thermosiphon, PH3 reaction chamber, and pressure relief valve.
SCAFCO silo
The fact that the SCAFCO silo used bolts rather than rivets made it more difficult to seal. The
rivets used on the Bird’s silo were highly airtight, and there were fewer of them. The neoprene
washers on the bolts often shredded due to overtightening as the sheets were tightened together.
The roof and hopper of the SCAFCO were major leak areas, whereas the Bird’s silo used single
welded sheets which could not leak. In the end, more than three times the amount of
polyurethane sealant was necessary to seal and reseal the SCAFCO silo.
An experienced work crew of four could erect the same model SCAFCO silo in 2.5 to 3 days (20
to 24 hours), or 80 to 96 man-hours (Regan Heaton, personal communication). The extra time it
took for sealing the SCAFCO silo was substantial. The roof, including sealing between the roof
ribs and end gaps, and installing the modified sealed lid took approximately 90 man-hours to
complete. One work day was spent adjusting the roof to get it to fit on the top sidewall ring. This
could have been avoided had the roof sheets been attached to the top of the sidewall ring during
construction as specified in the owner manual.
Approximately four hours were spent in fabricating the metal flashings that were installed to seal
the ridge caps. These were made from scrap metal, but purchased new the sheet metal would be
around $10. Approximately 66% of the time, or about 60 man-hours were spent on sealing the

51
roof in addition to installing the sealing kit that was included with the silo. The sealed lid with
remote ground-level opening has a list price of $350. The ground-level opening device was not
installed on SCAFCO silo as the slope of the roof prevented its full range of operation.
The sidewalls took only slightly more time to assemble than an unsealed silo would have. In a
stock version silo, rope bead sealant is supposed to be applied between sheets. For this silo, extra
care was taken to clean each seam with alcohol and encircle every bolt hole with sealant. It took
about 30 man-hours to assemble the sidewalls, including the sealing which added up to an
estimated four man-hours total.
For the hopper section, sealing the seams between adjacent hopper sheets took about four man-
hours. Sealing the junction between the hopper and sidewall took more effort because of the
ungainly use of the ladder required to reach the junction from inside the silo. This process took
approximately 10 man-hours. Altogether, the time spent in sealing the hopper section was about
14 man-hours, and took a total time of 128 man-hours. This time included attaching the legs to
the silo and anchoring them in the concrete pad.
Assembling the roof, wall, and hopper sections together took approximately 31 man-hours.
Fabricating the butterfly valve outlet (list price $244) and installing it took approximately 10
hours. This is about five times the amount of time it would take to assemble and install the rack
and pinion gate outlet supplied by SCAFCO.

52
The thermosiphon and pressure relief valve equipment took approximately 10 man-hours to
install and paint, and lists for $350. The sealant used was negligible, but PVC cleaner, primer,
and cement to assemble the piping cost approximately $20.
Twenty eight tubes of sealant were used on the SCAFCO silo; 11 tubes on the roof, 7 on the
sidewalls, and 10 on the hopper. The list price of the sealant is $30, for a total of about $840 for
sealant.
Table 4 shows the breakdown of costs for constructing and sealing the SCAFCO and Bird’s
silos. Assuming a wage of $15 per hour, the labor that went into sealing was $1,470, or about
30.6% of the total cost of labor. For the SCAFCO silo, the costs of sealing including equipment,
materials and labor totaled $3,284. The total sealing cost represents approximately 25.7% of the
cost of the SCAFCO hopper silo which has a list price of $13,500.
Because the Bird’s silo was designed as sealed, the extra sealing costs are only labor costs to
find, fix, and re-test for leaks. This overall cost of $180 is less than one percent of the total silo
list price of $7,200.
Assuming the proportion of sealing time to total construction time to be about 27% (98 man-
hours to 359 man-hours for the SCAFCO silo), and estimating 96 man-hours for an experienced
crew to construct a similarly sized silo, the estimate for an experienced crew to seal the silo is
about 26 man-hours. The labor cost for sealing was reduced to 21.4% of the total cost of labor
because during construction of the SCAFCO silo for this project, much time was spent fixing

53
mistakes, re-applying sealant, and otherwise spending more time than an experienced crew
would on sealing. Assuming the same amount of sealing materials, the total sealing expense for
an experienced crew was reduced from $3,284 to $2,207, or 16.3% of the total list price of
$13,500.
In 1984 Banks and Ripp (1984) estimated the average cost to be approximately A$20 per MT for
sealing a bolted steel silo and A$8 per MT for adding the needed modifications for fumigation
(i.e., recirculation ductwork, pressure relief valves and exhaust fans). This cost included labor
and materials for retro sealing of silos already constructed but not yet sealed. Accounting for
inflation and converting to U.S. dollars, the total amount would be $60/MT (RBA 2016). In this
study, the cost of sealing the SCAFCO silo while being constructed including resealing as a
result of finding leaks during pressure testing was $63/MT. For an experienced crew this may be
reduced to $43/MT. In comparison, the cost of sealing (and resealing) the Bird’s silo, which was
designed to be a sealed silo was $4/MT. These costs are similar to the costs estimated by Banks
and Ripp (1984). For larger storage structures such as concrete silos (up to 2,700 MT) and flat
storage bunkers (up to 300,000 MT), Banks and Ripp estimated lower sealing and modification
costs on a per-MT basis, ranging from $5/MT to $15/MT. It is likely that for larger metal silos
there would be similar cost reduction for sealing and modifying for fumigation.
Temporarily sealing a silo like the ones in this project is relatively inexpensive (approximately
$50 for labor and materials). And even sealing larger silos (5000+ MT) would only cost slightly
more (less than $200 for labor and materials (Dolan Jamison, personal communication)).

54
Table 3.4 Labor and material costs for constructing and sealing the silos, with comparative figures for temporarily
sealing an existing silo prior to fumigation
SCAFCO Bird's
SCAFCO
(Experienced
work crew)
Temporary
sealing
(existing silo)
Silo list price $13,500 $7,200 $13,500 -
Labor cost for construction @ $15/hr. $3,735 $3,810 $1,440 n/a
Labor cost for sealing @ $15/hr. $1,470 $180 $393 $30
Total labor cost@ $15/hr. $5,205 $3,990 $1,833 $30
Materials and equipment cost for sealing $1,814 n/a $1,814 $50
All sealing expenses $3,284 $180 $2,207 $80
Total cost of silo including construction and sealing $20,519 $11,370 $17,147
Proportion of sealing labor of total labor cost 28.2% 4.5% 21.4% 100%
Proportion of sealing materials of silo list price 13.4% n/a 13.4% 0.37%
Proportion of all sealing expenses of silo list price 24.3% 2.5% 16.3% 0.60%
A grain manager must decide whether the cost of permanently sealing a grain silo is worth the
potential gains in fumigation success, as lower long-term labor costs would not likely be realized
for many years. A hybrid approach may be to permanently seal areas with greater leakage
potential such as the roof-wall junction, and use temporary sealing for vents, fans, and other
areas that are not conducive to being permanently sealed.
Conclusions
This study documented and evaluated the effort, costs and feasibility of sealing two hopper
bottom metal silos while being constructed. The Australian silo was designed as a sealed silo and
the U.S. silo was a conventional open-eave design. The two sealed silos were equipped with
closed-loop fumigant recirculation systems and subsequently tested for gas tightness. The
following was concluded:

55
Neither silo had half-life pressure decay times that reached the 3-5 minute prescribed by
AS2628. The longest half-life times were 50 seconds and 2 minutes 43 seconds for the
SCAFCO and Bird’s silos, respectively. The half-life times were shorter after loading the
silos with grain, suggesting the pressures from grain loading may have broken some of
the seals and opened paths for air to travel through the silo wall seams.
After nine months the pressure decay times decreased by up to 38 to 44% for the
SCAFCO and Bird’s silos, respectively, through hot summer and cold winter weather. It
is possible that exposure to temperatures above 35° C and below 0° C as experienced in
Kansas, along with high winds and solar radiation deteriorated some of the sealant
exposed to the elements.
Permanently sealing a corrugated steel silo after-market is time consuming and labor
intensive. The additional time spent in sealing, checking for and fixing leaks and
installing the additional fumigation equipment was 98 man-hours. An experienced crew
may be able to reduce this to about 26 man-hours for a similar sized silo.
Additional needed equipment and sealing materials may add substantial cost to the silo.
The sealed lid, thermosiphon, butterfly valve, pressure relief valve, polyurethane sealant,
and metal flashing cost a total of $1,814 or $35/MT which represents about 13.4% of the
initial cost of the SCAFCO silo.
The total cost of modifying and sealing a silo during construction to prepare it for
fumigation on a permanent basis was estimated to be $63/MT, or 24.3% of the total list
price. For an experienced work crew that cost may be lowered to $43/MT, or 16.3% of
the list price. A considerable amount of money may be saved in the short term by

56
temporarily sealing the silo prior to each fumigation which for an experienced work crew
may cost only $0.91/MT, or 0.37% of the list price.

57
Chapter 4 - Efficacy of Recirculation Fumigation in Sealed
Australian and U.S. Steel Hopper Grain Silos
Introduction
Reducing the amount of grain lost after harvest is an important strategy to fight hunger and
poverty. Kader (2004) estimated that nearly one third of the total grain harvested worldwide is
lost before consumption or sale. Insect pests are among the biggest contributors to post harvest
losses. Insects destroy grain both by consuming it and by spoiling it with their filth. Insect
activity and the presence of mold can raise the temperature of the grain to the point where the
grain is ruined. In some cases, fires have been started in grain silos as a result of “hot spots” in
the grain (Clark et al. 1998). Because of the close positive relationship between insects and the
factors that contribute to poor grain quality, controlling insect infestations goes a long way in
preserving the grain quality.
Fumigation is the addition of toxic gas to the inside of a stored grain structure to kill insect pests.
The goal of fumigation is to kill all insects at all life stages. For a fumigation to be successful, a
lethal concentration of the gas must be held for a minimum amount of time at an appropriate
temperature. A common measure of this is known as the concentration time product (CTP).
When the fumigation is complete, fresh air is forced through the grain to remove the fumigant.
A tightly sealed structure is a prerequisite for a successful fumigation. Fumigation in unsealed or
leaky structures is likely the main cause of fumigation failures which leads to populations of

58
resistant insects (Leesch et al. 1995, Casada and Noyes 2001). In unsealed structures the
fumigant leaks out and does not maintain a lethal concentration of gas. This creates selection
pressure against susceptible individuals, and selection pressure for individuals carrying genes
which confer resistance to the fumigant (Schlipalius et al. 2008, Collins et al. 2002).
In the early 1960’s, export regulations in Australia required all exported grain to be free of
injurious insect pests (van Graver and Winks 1994). Grain pests were controlled with
fumigations and pesticide applications, but further export restrictions that limited chemical
residues in grain began the grain industry’s search for non-chemical means of insect control
(Newman et al. 2006).
In the 1970s, a revival of sealed grain storage research began in Australia. Researchers
developed methods of sealing existing grain storage structures and effective sealing standards
(Banks and Annis 1981; Banks and Ripp 1983), led extension efforts to educate farmers about
sealed grain storage and responsible management (Delmenico 1993; Chantler 1983), and worked
with silo manufacturers to engineer more readily sealable silos (Ellis 1983).
The vast majority of U.S. on- and off-farm grain storage silos are not designed to be sealed for
adequate levels of gas-tightness. Instead, they have to be sealed temporarily before fumigation
which adds substantial labor and material costs and results in greater risk of fumigation failures
from inadequate sealing than with silos sealed by design.

59
Fumigation
Many fumigants have lost their approved use status because of their negative environmental
impact or because of toxicity and safety concerns (Bell 2002; Mills 2000). Phosphine (PH3) gas
is the most common fumigant used in the grain industry worldwide. Phosphine is formulated as
solid pellets of aluminum or magnesium phosphide which sublime upon contact with moisture in
the atmosphere. In gaseous form, it is also available in cylinderized containers. Phosphine tablets
or pellets can be placed in the grain stream as the silo is being filled, placed on top of the grain or
hung in the headspace in sachets, deep-probed into the grain mass from the surface, or applied at
ground level using a separate chamber connected to the structure.
Phosphine is relatively inexpensive, easy to obtain, and easy to use. However, its effectiveness is
under threat due to widespread phosphine resistant insect populations that have developed
around the world including the U.S. (Collins 1998, Opit et al. 2012). Australia is the only nation
with a country-wide phosphine resistance program (Subramanyam and Hagstrum 2011), and
sealed storage fumigation is the backbone of this program. Efforts to develop sealed grain
storage in Western Australia have kept PH3 resistance in check (Delmenico 1993). Monitoring
programs in Australia are in place to determine the extent and severity of resistant populations,
but no such survey work exists in the U.S. (Opit et al. 2012), though it has been called for in the
past (Zettler and Cuperus 1990).
Recirculation
Gas distribution within the storage structure is important to consider when treating stored grain
with a fumigant. Stored grain insect pests can be found throughout the grain bulk. For this

60
reason, lethal fumigant concentrations should reach all areas inside the structure. With poor
distribution there may be areas of low fumigant concentrations in the grain mass, allowing
insects in those locations to survive.
Dispersing the gas throughout the grain mass can be carried out in several ways. Pixton and
Griffiths (1971) stated that the primary mechanism for moisture transfer within a grain mass was
diffusion, but supplemented by convection. Heat and moisture in the form of water vapor
continually move throughout the grain mass during storage. Moisture is transferred from high to
low vapor pressure areas due to differing moisture contents in the grain being stored (Obaldo et
al. 1991). Due to the relationship between temperature and vapor pressure, temperature gradients
also drive moisture movement. The movement takes place more rapidly between areas with
higher moisture and temperature gradients (Jayas 1995), but is nevertheless very slow (between
0.08 and 2.54 m per hour) even at temperature gradients of up to 25° C (Berck 1975).
Solar radiation on the metal wall of the silo creates interstitial air temperature gradients within
the porous grain mass that can differ by an order of magnitude, even in small silos (Jian et al.
2009). This occurs because air warms faster than grain due to its higher thermal conductivity and
lower heat capacity. The temperature gradients in turn produce convection currents due to the
lower density of warm air.
Temperature gradients within the grain mass can vary at different locations within the silo
because different sides of the silo receive different amounts of solar radiation during the day due
to the sun’s movement overhead, cloud cover, and shading from other silos or structures (Jian et
al. 2009). Moisture gradients within the grain bulk also vary due either to moisture migration
over time (Chang et al. 1994) or loading the silo with grain of different moisture contents. Thus,

61
the driving forces of natural heat and mass transfer within the grain mass are asymmetrical in the
vertical, radial, and circumferential directions (Alagusundaram 1990).
Figure 4.1 shows two recirculation designs. The left image uses a low speed fan to force air and
fumigant through the grain and out through a pipe connected to the roof of the silo. The right
image shows a recirculation design based on natural convection currents. The pipe on the outside
of the silo is painted black. When the sun shines on the black pipe, the air inside the pipe
becomes warmer than the air within the grain mass. This temperature differential creates a
convection current in which the warm, less dense air in the pipe is drawn upwards. Air in the
bottom of the grain mass is pulled into the pipe, which is then warmed. This circulation
distributes the fumigant throughout the structure. In contrast to forced air recirculation, this
design allows air to reverse directions when the air in the thermosiphon pipe cools down in
cloudy conditions or at night. In both cases the silo is sealed to the outside and the gas is
distributed only through the closed loop.
Figure 4.1. Closed loop fumigation (CLF) with forced air circulation and convection based
recirculation with thermosiphon.

62
Fumigant loss
Often, the actual fumigant concentration does not reach the theoretical concentration expected
because of fumigant loss. Banks and Annis (1984) stated that the major reasons for fumigation
failures are overall fumigant loss and inadequate CTP in infested areas, either due to an
inadequate overall dosage or a delay in fumigant reaching insect infested areas.
Several processes prevent gas concentrations from reaching their theoretical levels during
fumigation, including sorption and various mechanisms of physical gas loss from the structure
itself. In this context, sorption refers to loss of gas applied to a stored commodity that is not due
to leaks in the storage structure. Rauscher et al. (1972) showed that PH3 was physically, and not
chemically, adsorbed onto wheat flour, wheat bran, and oat flakes, and could be recovered with
sufficient aeration and movement of the commodity. Reed and Pan (2000) suggested PH3
molecules find their way into grain kernels via diffusion along concentration gradients and
undergo chemical reactions with grain constituents (lipids, protein) which detoxify the gas.
Internally developing insects are exposed to the fumigant by the sorption of the gas into grain
kernels prior to its detoxification. Fumigants can react with grain constituents and be lost in this
manner as well (Banks 1986). At higher temperatures, relative humidity, and grain moisture
contents, the sorption rate of PH3 is higher. Sorption rate of PH3 is between 5-20% per day in
wheat (Banks 1986).
Fumigant loss also occurs from gas transfer from the inside to the outside of the structure.
Barometric pressure changes and wind cause pressure gradients across leaks in the fabric of the
storage structure, and temperature differences between the outside ambient air and the air inside
63
the storage structure cause air exchange through the stack, or chimney, effect (Banks 1986).
Ingress of outside air can dilute fumigant concentration within the structure (Banks 1989).
Fumigating in sealed grain silos may benefit grain producers and handlers in warmer regions
(such as the southern U.S.) where normal temperatures severely limit grain cooling options with
ambient aeration alone because treating grain in sealed storage can preserve grain quality without
causing excessive moisture shrink.
The overall goal of this project was to evaluate the feasibility of sealed silos for fumigation under
U.S. (Kansas) conditions. Assessments included fumigation trials with PH3 and sulfuryl fluoride
(SF), stored-grain insect pest control, and overall stored grain quality. Efforts focused on
minimizing gas loss during fumigation in a U.S. bolted corrugated steel hopper silo. These
results were compared with an Australian-design steel hopper silo that was used as the
benchmark. In addition, the Australian pressure decay sealing standard (AS2628) and
thermosiphon recirculation technology were evaluated.
Methods and Materials
Grain silos used
A 45.6 MT capacity sealed grain hopper silo from Australia (Bird’s Silos & Shelters,
Popanyinning, Western Australia) was shipped to Manhattan, Kansas and erected on site. A 51.8
MT capacity corrugated steel hopper silo typical to the U.S. (SCAFCO Grain Systems, Spokane,
Washington) was also shipped to Manhattan, Kansas and erected on site.

64
The SCAFCO silo was not engineered to be airtight, but a sealing kit was included with the silo
that contained a rubber gasket to be installed between the roof and top wall sheets, and foam
blocks designed to close off the gap created by the roof ribs (Figure 4.2). The sealing kit was not
designed to make the silo airtight, but to prevent excessive moisture from entering the silo.
Nevertheless, the foam blocks helped close off gaps too large to be sealed with polyurethane
sealant.
Figure 4.2. Rubber gasket attached between roof and edge of top wall sheet (left), and
closed-cell foam block closing large gap at the end of the roof rib (right).
Fumigant recirculation
Each silo was equipped with a ThermoSiphon to circulate and disperse the fumigant within the
silo. The ThermoSiphon attached to the silo externally. The ThermoSiphon consisted of 38 mm
steel pipe that followed the hopper slope upwards to the silo wall where it transitioned to a black
90 mm PVC pipe. The PVC pipe went vertically up the silo wall and continued along the roof
slope where it opened into the headspace approximately 0.5 m from the peak (Figure 4.3). There
was no forced air in the ThermoSiphon to circulate the fumigant, rather, it relied on convection

65
currents created when solar radiation caused temperature differentials between the air inside the
black pipe and the air inside the silo.
Figure 4.3. Showing the ThermoSiphon recirculation pipe connecting the PH3 reaction chamber
below the hopper (left) and the headspace (right).
The velocity of air inside the thermosiphon was measured using a hot wire anemometer during
sunny and partly cloudy conditions, and at various ambient temperatures. The volumetric airflow
rate was calculated by multiplying the air velocity by the area of the 90 mm thermosiphon pipe.
Fumigant application
The grain was held inside the silo above a butterfly valve. Phosphine reaction chambers were
installed on the bottom of each silo. The chambers consisted of a bowl that was clamped to the
butterfly valve housing to make an airtight seal (Figure 4.4). A grate was placed inside the bowl
to increase exposure of phosphine tablets or pellets to air. The fumigant exited the chamber in
two ways, upward into the grain mass through the gap between the butterfly valve and its
housing, and through the ThermoSiphon pipe (Figure 4.5).

66
Figure 4.4. Airtight PH3 reaction chamber installed on the underside of the
hopper bottom.
Figure 4.5. Butterfly valve and exit points for fumigant inside PH3
reaction chamber.

67
Measuring fumigant concentration
To measure phosphine concentrations, 3 mm diameter plastic monitoring lines were attached to
aircraft cable using zip ties and hung vertically in the silo. The cables were hung in the center
and approximately 1 m from the silo sidewall in the north, south, east, and west directions. The
north, south, east, and west lines had four readings each, terminating in the SCAFCO silo at 1.8,
2.8, 3.8, 5 m from the top of the grain surface. The center line had an additional reading at 6.1 m.
In the Bird’s silo the readings terminated at 1.4, 2.6, 3.8, and 4.5 m, with an additional reading
on the center line at 5.1 m. Monitoring lines were also set up in the headspace and in the bottom
of the ThermoSiphon pipe near the hopper/sidewall junction. Each silo had a total of 23 reading
points (Figure 4.6).
Figure 4.6. Gas concentrations were
measured from twenty three sampling
points per silo (indicated by dots).

68
The monitoring lines exited the top of the silo through an elbow fitting and ran down the side of
the silo to a table where the gas measurements were recorded. The elbow fitting was filled with
closed cell expanding foam and the gaps between lines were sealed using an all-weather silicone
sealant (Figure 4.7).
Figure 4.7. Monitoring lines exiting silo roof. The fitting was filled with
closed-cell expanding foam and sealed with silicone caulk around the
lines.
Phosphine concentrations were read using a Draeger X-am 5000 (Dräger, Inc., Lübeck,
Germany) personal monitoring device using a Draeger X-am 1/2/5000 pump to draw the gas
from the grain mass through the lines to the gas sensor. For fumigation trials 1-3, readings were
taken approximately hourly from morning to for the first 72 hours of the fumigation, and then at
intervals from 2-4 hours after that. A portable wet/dry vacuum cleaner was used to purge the
69
lines and draw gas samples through the lines more quickly before each reading. This resulted in
an expedited measurement and recording process.
In trials 4 and 5, SF concentrations were read using a Spectros SF-ExplorIR (Spectros
Instruments, Hopedale, MA) non-dispersive IR instrument. Readings were taken two or three
times per day throughout the fumigation. An onboard pump in the instrument drew the gas
through the lines.
Throughout trials 1 and 5, PH3 readings were also taken outside the silos to check for leaks into
the surrounding space using the handheld Draeger X-am 5000 personal monitoring device and
X-am 1/2/5000 pump. Concentration readings were taken on the north, south, east, and west
directions of the silos at distances of 0, 2, and 6 m.
Bioassays
Insect bioassays were prepared to demonstrate the efficacy of two fumigations. Due to time and
resource constraints, bioassays were prepared for fumigation trials 1 and 5 only. Centrifuge tubes
of 50 mL (30 mm x 115 mm) were drilled at the top and bottom and fine brass mesh was glued
to cover the end openings.
For trial 1, 20 unsexed adult Sitophilus zeamais were placed in a tube with whole corn, and 50
unsexed adult Tribolium castaneum were placed in a tube with 50% whole corn and 50% ground
corn. Fifteen tubes with each species were prepared, five for each silo and five for control. After
the initial preparation, the tubes were kept under controlled conditions (approximately 25° C,

70
66% R.H.) for 5 days to allow females to lay eggs within the tubes. One bioassay tube of each
species was put inside a small burlap bag. Five of these bags were prepared and each one was
placed 45 cm below the grain surface directly next to one of the five top-level monitoring line
points. After five days under fumigation, the bioassays were retrieved and kept indoors for 24
hours. Live and dead adults were counted and separated from the food, which was recollected
and placed in glass jars with screen tops. S. zeamais were sieved through a #12 screen and the T.
castaneum were sieved using #12 and #18 screens above a pan. The jars with food were kept at
25° C and 66 % R.H. for six weeks to allow adult insects to emerge.
In fumigation trial 5, PH3-resistant R. dominica (Belle Glade, Florida) and T. castaneum (Red
Level, Alabama) were included in the bioassays. Both strains were characterized as PH3-resistant
by the FAO discriminating dose assay (R. dominica 87% and T. castaneum 100% resistant). PH3-
susceptible lab populations of the same species were also used in the bioassays. Fifty unsexed
adult PH3-resistant and thirty unsexed adult PH3-susceptible R. dominica were placed in a tube
with 90% whole wheat flour and 10% mixture of flour and yeast. Fifty unsexed adult PH3-
resistant and thirty PH3-susceptible T. castaneum were placed into a tube with 50% whole wheat
kernels and 50% cracked wheat. Fifteen tubes of each species, with both PH3-resistant and PH3-
susceptible populations were prepared and kept at 25° C and 66% R.H. for 7 days to allow
females to lay eggs. The bioassays were placed in the silo in the same manner as in trial 1. After
ten days the top lid and PH3 reaction chamber were opened on the SCAFCO silo (under PH3).
After fifteen days the Bird’s silo (under SF) was opened and vented. A blower fan was placed
beneath the silo to draw fresh air through the grain to vent the fumigants out. The bioassays were
counted and processed post-fumigation in the same manner as in trial 1.

71
Fumigations
The first three fumigation trials had a target of 300 ppm for 72 hours resulting in a CTP of
21,600 ppm-hours. This target was based on the minimum exposure time but the application rate
was lower than would be used in the industry. Due to the risk of explosion at PH3 concentrations
above 17,000 ppm and the small reaction chamber used, trials were performed with lower doses
first to ensure the fumigant would disperse readily and stay below explosive levels. Trials 1 and
3 utilized aluminum phosphide tablets. Each tablet weighed 5 grams and produced one gram of
PH3. Trial 2 utilized aluminum phosphide pellets. Each pellet weighed 1 gram and produced 0.2
grams of PH3. In trials 4 and 5, cylinderized sulfuryl fluoride and PH3 were used.
The first fumigation trial began on August 24, 2015. Aluminum phosphide tablets were placed in
the reaction chamber of each silo. Readings were taken from approximately 6:00 am. to midnight
hourly for the first 72 hours, and every two to four hours after that. At the end of the trial a final
reading was taken on August 29 at approximately 4 pm (6 days total). Afterwards, the silos were
ventilated by opening the top lid and removing the PH3 reaction chamber.
The second fumigation trial began on August 31, 2015 at 12:00 pm. Aluminum phosphide pellets
were utilized to provide the same concentration as in trial 1. Readings were taken approximately
10 times per day for four days, then once every other day until September 9 (10 days total).
Fumigation trial 3 began September 18 at 10:00 am. Phosphine tablets were used at the same rate
as in the previous two trials. In this trial, the ThermoSiphon on the SCAFCO silo was closed
using a ball valve. This forced the fumigant to permeate upwards through the grain and distribute
throughout the grain mass without the benefit of recirculation. The ThermoSiphon on the Bird’s

72
silo remained open. Readings were taken approximately 10 times per day for the first four days,
then once daily until September 24 (7 days total).
For trial 4, VAPORPH3OS® (Cytec Industries Inc., Woodland Park, NJ) cylinderized PH3 was
used in the Bird’s silo. The cylinder contained pure PH3 which was blended with ambient air
using a Horn Diluphos System® (Fosfoquim S.A., Santiago, Chile) (Figure 4.8).
Figure 4.8. Horn Diluphos System used to blend PH3 and air prior to silo
fumigation during trial 4.
The PH3-air mixture was applied to the Bird’s silo via the ThermoSiphon and directed to the
headspace (Figure 4.9). The system supplied a total of 204.9 g for a target concentration of
approximately 2000 ppm. Sulfuryl fluoride (ProFume®, Dow AgroSciences LLC, Indianapolis,
IN) was used in the SCAFCO silo. The ProFume® Fumiguide® computer program was used to
calculate dose and target CTP based on target species (R. dominica), life stage (eggs and pupae),

73
temperature (15.5° C), and exposure time (3 days). The calculated dose was 1,360 g or 4,541
ppm in the size of silos used. For a fumigation of three days, this provided a CTP of 107,821 g-
hours, which is near the maximum allowable CTP for the size of silo used (107,884 g-hr.). The
cylinder of SF was connected directly to a monitoring line (center line, 3.8 m below the grain
surface) to allow the SF to flow into the grain mass. The cylinder was set on a digital scale and
fumigant was metered out in real time by observing weight loss on the scale (Figure 4.10). The
reason the cylinder of SF was connected to the monitoring line instead of the 4-way valve as the
PH3 cylinder was to avoid leaks as the gas line connection did not fit snugly into the 4-way
valve.
For trial 5, SF was applied to the Bird’s silo in the same manner as in trial 4. In the SCAFCO
silo, 212 g of PH3 was applied via the thermosiphon into the headspace of the silo using
VAPORPH3OS® for the same target concentration as in trial 4.

74
Figure 4.9. Attaching the VAPORPH3OS® to the ThermoSiphon.
The gas was directed to the headspace using a valve on the
ThermoSiphon.

75
Figure 4.10 The amount of SF applied to the silo was
measured by placing the cylinder on a digital scale,
opening the cylinder valve to allow gas to flow, and
closing the valve when the correct amount of SF had
been applied.
Grain quality
Grain moisture content and test weight of the corn were measured at the beginning of the storage
period and after 2, 6, 8, and 10 months. A GAC-2500-UGMA (DICKEY-john Corporation,
Minneapolis, MN) grain analysis computer was used for the measurements.
Before the first fumigation of 2016, in mid-March, insect probe traps were placed in both silos at
the top of the grain in the center and in the cardinal directions approximately 1 m from the
76
sidewall. Prior to the fumigation starting April 1, the probe traps were recovered and the insects
trapped were counted.
Data analysis
The concentrations among the five points (center, north, south, east, and west) at each
monitoring level, and the concentrations among the points within the grain mass along each
vertical monitoring line were analyzed to quantify the movement and distribution uniformity of
phosphine in the silos.
The leakage rates were calculated using the following equation:
L =
𝐶peak– 𝐶125
125 hours
(4.1)
Where,
L = gas leakage rate, ppm/h
Cpeak = peak gas concentration
C125 = gas concentration at 125 hours.
Because some fumigation trials were monitored longer than others, the leakage rates were
calculated over 125 hours to have a standard measure.
The half-loss time (HLT) is the number of hours it took for the peak concentration to decrease by
50%. For example, in trial 1, the Bird’s silo peaked at approximately 400 ppm after 32 hours.

77
The concentration dropped to 200 ppm after 76 hours which resulted in an HLT of 44 hours (76h
– 32h = 44h).
Banks and Annis (1984) developed criteria for judging a successful fumigation. Namely, (1) that
the grain be insect-free after fumigation, (2) the average maximum concentration be greater than
50% of the prescribed dosage, (3) the average concentration at the end of the fumigation be
greater than the minimum effective dose to kill all insects, and (4) the ratio of minimum to
maximum concentration within the storage structure exceed 0.25 before 25% of the fumigation
period. Criteria 1-3 reflect the ability of the structure to maintain lethal gas concentration, and
criterion 4 refers to the amount of gas dispersion within the structure. For trials 1 and 5, the
bioassay results (criterion 1) were used to judge efficacy of the fumigations. The average
maximum concentration (criterion 2) was calculated by taking the mean of the maximum
fumigant concentration in the silos at each sampling time. For criterion 3, the endpoint of the
fumigations was considered to be 125 h. However, the actual endpoint of all the fumigations
except trial 1 extended past 125 h to determine how long the fumigant would be retained. The
minimum effective dose for both PH3 and SF depend on the duration of fumigation. For PH3,
Banks and Annis used a rate of 0.01 g/m3 or approximately 7 ppm, and for SF the minimum
effective dose was considered to be 2,840 ppm, the concentration allowable for a 125 h
fumigation given the 1,500 g h/m3 maximum allowable CTP. The rate of gas dispersion
(criterion 4) was calculated by dividing the minimum concentration in the silo by the maximum
concentration at every sampling time. This ratio indicated the level of concentration uniformity
within the silos.

78
Results and Discussion
The average phosphine concentrations for both silos in trials 1 and 2 are shown in Figures 4.11
and 4.12, respectively. In trial 1, both silos reached a peak concentration after 32 hours. The
SCAFCO silo reached a peak concentration of 354 ppm, and the Bird’s silo reached a peak of
404 ppm. In trial 2, the SCAFCO silo reached a peak concentration of 490 ppm after 20 hours,
compared to a peak of 498 ppm after 32 hours in the Bird’s silo.
In trial 2 (using pellets), the concentration peaked earlier in the SCAFCO silo, but also began to
drop more rapidly than in the Bird’s silo. This may have been due in part to the higher partial
vapor pressure of phosphine in the silo because of the more rapid production of PH3 using pellets
versus tablets. At higher partial vapor pressures, gas loss rates increase per unit of time. Noyes
and Phillips (2007) reported the same pattern of higher peaks obtained more quickly from using
phosphine pellets during two fumigations at a Peavey Company Facility at the Tulsa Port of
Catoosa in 2000 and 2002.
In trials 1 and 2, with respect to Banks and Annis’ criterion 2, in both silos for both trials, the
average maximum concentrations were over 50% of the expected amount (300 ppm). The
concentration at the end of 125 h was approximately 100 ppm for both silos; well above the 7
ppm proposed by Banks and Annis. The min/max ratios were higher in the SCAFCO silo
indicating that the distribution of PH3 was more rapid than in the Bird’s silo. However, in both
trials the silos reached the 0.25 threshold prior to 25% of the total exposure time as
recommended by Banks and Annis (1984). The SCAFCO silo reached 0.25 after 19 hours and 22
hours for trials 1 and 2, respectively, and the Bird’s reached 0.25 after 24 hours in both trials.

79
Figure 4.11 Average fumigant concentrations in the Bird’s and SCAFCO silos during August
24 – August 29, 2015 while fumigating approximately 43 MT of corn at 14% m.c. and 18°C.
Approximately 30 phosphine tablets were released to reach a target concentration of 0.17 g/m3
(300 ppm).
Figure 4.12 Average fumigant concentrations in the Bird’s and SCAFCO silos during August 31
– Sept. 9, 2015 while fumigating approximately 43 MT of corn at 14% m.c. and 18°C.
Approximately 30 phosphine tablets were released to reach a target concentration of 0.17 g/m3
(300 ppm).
0
0.1
0.2
0.3
0.4
0.5
0.6
0.7
0.8
0.9
1
0
50
100
150
200
250
300
350
400
0 24 48 72 96 120
Min
/Max
rat
io
PH
3 c
on
cen
trat
ion
(p
pm
)
Hours After Start of Fumigation
Bird's PH3 SCAFCO PH3Bird's Min/Max SCAFCO Min/Max
0
0.1
0.2
0.3
0.4
0.5
0.6
0.7
0.8
0.9
1
0
50
100
150
200
250
300
350
400
450
500
0 24 48 72 96 120 144 168 192 216
Min
/Max
rat
io
PH
3 c
on
cen
trat
ion
(p
pm
)
Hours After Start of Fumigation
Bird's PH3 SCAFCO PH3
Bird's Min/Max SCAFCO Min/Max

80
Figure 4.13 shows the average PH3 concentrations in the silos for trial 3. The ThermoSiphon in
the SCAFCO silo was turned off, preventing recirculation in the silo and forcing PH3 to diffuse
upward through the gap around the butterfly valve and into the grain mass. The average
concentration of the 23 monitoring points inside the SCAFCO silo did not reach above 250 ppm,
but in the Bird’s silo, the fumigation concentration curve is similar to the curve in trial 1,
reaching a peak of 435 ppm after about 36 h. In the SCAFCO silo, three concentration peaks at
around 24, 48, and 72 h are seen. These measurements were the first readings taken in the
morning, and the high concentration reflected by the peaks was located in the bottom of the silo,
close to the source of gas from the PH3 tablets. These peaks likely reflect the “pooling” of PH3 in
the bottom of the silo as the temperature-driven convection currents slowed during the evening
and night. It is possible that the tablets were still generating PH3 after 48 h. The concentration for
both silos after 125 h was still above 100 ppm. The min/max ratio in the SCAFCO silo did not
reach 0.25 until after more than 48 h, while in the Bird’s silo the min/max ratio reached 0.25 in
less than 24 h. The low troughs in the Bird’s min/max ratio at around 30 and 52 h, and in the
SCAFCO min/max ratio at around 72 h were due to a high concentration of PH3 in the bottom of
the silo in the evening when the thermosiphon reversed and PH3 moved upwards from the
reaction chamber.
Figure 4.14 shows the gas concentrations for both silos during the VAPORPH3OS® fumigations.
After the initial application, the Bird’s silo maintained a concentration of approximately 1,400
ppm for over 55 hours before beginning to decrease. The SCAFCO silo maintained the initial
concentration for approximately 5 hours, after which the PH3 began to decrease relatively
steadily. The average concentrations were 1,373 and 876 ppm for the Bird’s and SCAFCO silos,
respectively. This was well above 350 ppm, which was 50% of the expected amount.

81
Figure 4.13 Average fumigant concentrations in the Bird’s and SCAFCO silos during September
18-24 while fumigating approximately 43 MT of corn at 14% m.c. and 20° C. Approximately 30
phosphine tablets were released to reach a target concentration of 0.17 g/m3 (300 ppm).
The concentrations after 125 h for the Bird’s and SCAFCO silos were approximately 640 and
425 ppm, respectively. The application of cylinderized gas distributed the fumigant inside both
silos very quickly because the entire dose of PH3 was applied at one time rather than generated
over 24 h as a result of gas release from the tablets or pellets. Also, the applied dose (700 ppm)
was more than twice the amount generated by tablets and pellets (300 ppm). The entire volume
of PH3 dispersed within the silo and reached a min/max ratio above 0.25 within an hour for the
Bird’s silo and less than 5 hours for the SCAFCO silo. The ratio was above 0.75 in under a day
for both silos, and the distribution of PH3 was uniform throughout the fumigations (above 0.6
and .75 for the Bird’s and SCAFCO silos, respectively).
0
0.1
0.2
0.3
0.4
0.5
0.6
0.7
0.8
0.9
1
0
50
100
150
200
250
300
350
400
450
0 24 48 72 96 120 144
Min
/Max
rat
io
PH
3 c
on
cen
trat
ion
(p
pm
)
Hours After Start of Fumigation
Bird's PH3 SCAFCO PH3
Bird's Min/Max SCAFCO Min/Max

82
Figure 4.14 Average PH3 concentrations using VAPORPH3OS® cylinderized PH3 in the Bird’s
silo during trial 4 (April 1 – 8, 2016) and SCAFCO silo during trial 5 (April 25 – May 9, 2016),
fumigating approximately 43 MT of corn at 16% m.c. and 20° C. Approximately 205 grams of
PH3 was applied to achieve a target concentration of 1.5 g/m3 (700 ppm).
The concentration curves in this trial were similar to the curves for trial 3 using PH3 pellets. For
trials 1 and 3, in both silos the concentration depleted at similar rates after reaching the peak
concentration. However, the Bird’s silo had a higher peak concentration (1,765 ppm compared to
1238 ppm for the SCAFCO silo) and began to deplete later (52 hours compared to 5 hours). For
this reason the SCAFCO silo actually had a smaller leakage rate due to how the leakage rate was
calculated (Equation 4.1).
Figure 4.15 shows the average gas concentrations of both silos during the SF fumigations. It
would appear that in the SCAFCO silo, virtually all of the fumigant had left the silo within 24
hours. For the Bird’s silo the concentration measurements dropped to between 10 and 33 ppm
after approximately 80 hours. Problems related to reading SF concentrations were encountered
0
0.1
0.2
0.3
0.4
0.5
0.6
0.7
0.8
0.9
1
0
200
400
600
800
1000
1200
1400
1600
1800
0 24 48 72 96 120 144 168 192 216 240 264 288 312 336
Min
/Max
rat
io
PH
3 c
on
cen
trat
ion
(p
pm
)
Hours After Start of Fumigation
Bird's SCAFCO
Bird's Min/Max SCAFCO Min/Max
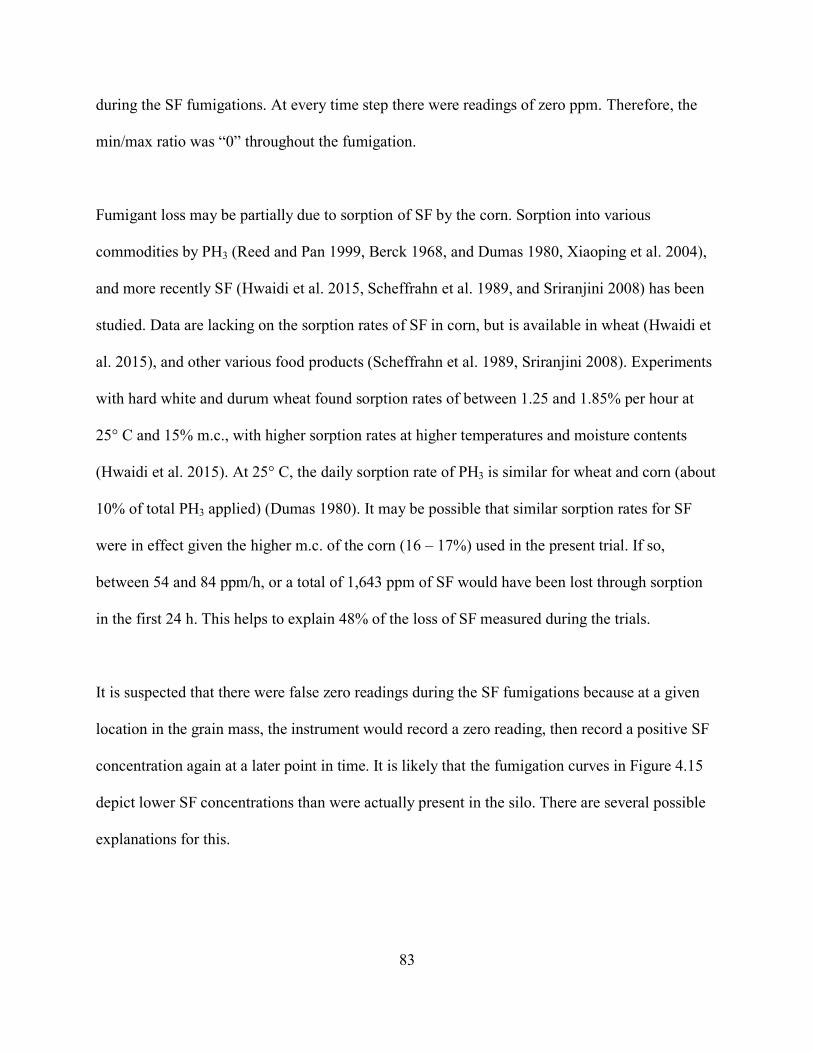
83
during the SF fumigations. At every time step there were readings of zero ppm. Therefore, the
min/max ratio was “0” throughout the fumigation.
Fumigant loss may be partially due to sorption of SF by the corn. Sorption into various
commodities by PH3 (Reed and Pan 1999, Berck 1968, and Dumas 1980, Xiaoping et al. 2004),
and more recently SF (Hwaidi et al. 2015, Scheffrahn et al. 1989, and Sriranjini 2008) has been
studied. Data are lacking on the sorption rates of SF in corn, but is available in wheat (Hwaidi et
al. 2015), and other various food products (Scheffrahn et al. 1989, Sriranjini 2008). Experiments
with hard white and durum wheat found sorption rates of between 1.25 and 1.85% per hour at
25° C and 15% m.c., with higher sorption rates at higher temperatures and moisture contents
(Hwaidi et al. 2015). At 25° C, the daily sorption rate of PH3 is similar for wheat and corn (about
10% of total PH3 applied) (Dumas 1980). It may be possible that similar sorption rates for SF
were in effect given the higher m.c. of the corn (16 – 17%) used in the present trial. If so,
between 54 and 84 ppm/h, or a total of 1,643 ppm of SF would have been lost through sorption
in the first 24 h. This helps to explain 48% of the loss of SF measured during the trials.
It is suspected that there were false zero readings during the SF fumigations because at a given
location in the grain mass, the instrument would record a zero reading, then record a positive SF
concentration again at a later point in time. It is likely that the fumigation curves in Figure 4.15
depict lower SF concentrations than were actually present in the silo. There are several possible
explanations for this.
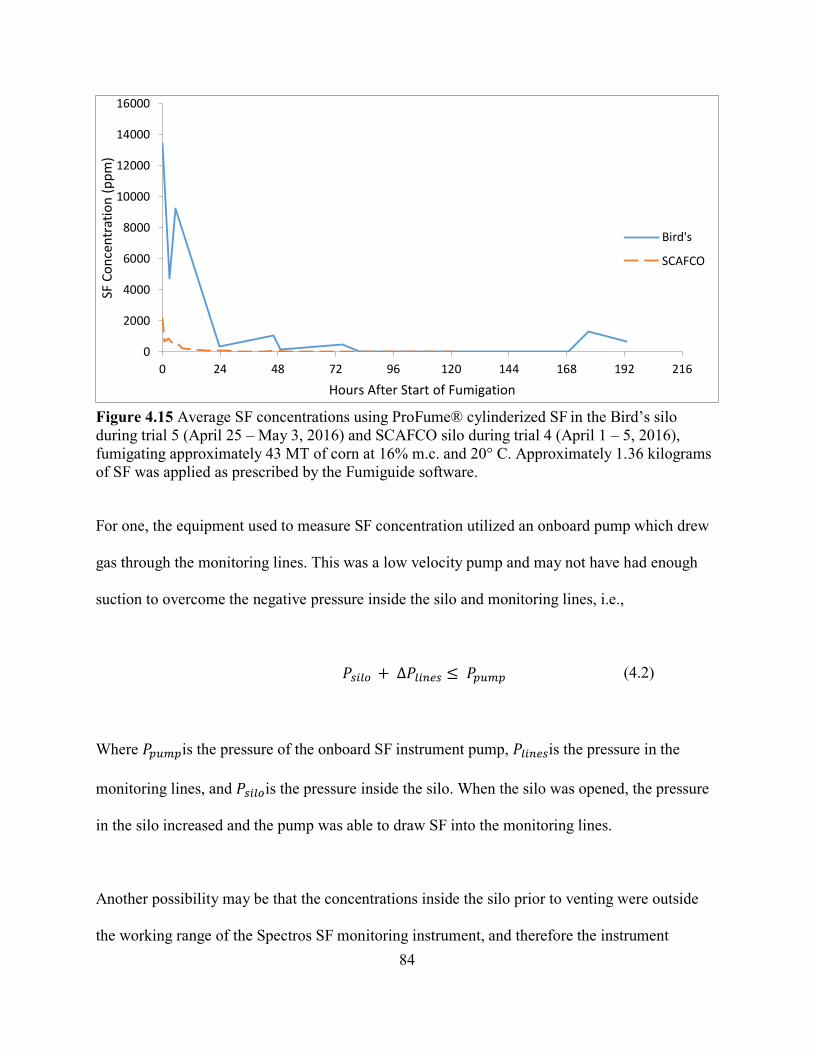
84
Figure 4.15 Average SF concentrations using ProFume® cylinderized SF in the Bird’s silo
during trial 5 (April 25 – May 3, 2016) and SCAFCO silo during trial 4 (April 1 – 5, 2016),
fumigating approximately 43 MT of corn at 16% m.c. and 20° C. Approximately 1.36 kilograms
of SF was applied as prescribed by the Fumiguide software.
For one, the equipment used to measure SF concentration utilized an onboard pump which drew
gas through the monitoring lines. This was a low velocity pump and may not have had enough
suction to overcome the negative pressure inside the silo and monitoring lines, i.e.,
𝑃𝑠𝑖𝑙𝑜 + ∆𝑃𝑙𝑖𝑛𝑒𝑠 ≤ 𝑃𝑝𝑢𝑚𝑝 (4.2)
Where 𝑃𝑝𝑢𝑚𝑝is the pressure of the onboard SF instrument pump, 𝑃𝑙𝑖𝑛𝑒𝑠is the pressure in the
monitoring lines, and 𝑃𝑠𝑖𝑙𝑜is the pressure inside the silo. When the silo was opened, the pressure
in the silo increased and the pump was able to draw SF into the monitoring lines.
Another possibility may be that the concentrations inside the silo prior to venting were outside
the working range of the Spectros SF monitoring instrument, and therefore the instrument
0
2000
4000
6000
8000
10000
12000
14000
16000
0 24 48 72 96 120 144 168 192 216
SF C
on
cen
trat
ion
(p
pm
)
Hours After Start of Fumigation
Bird's
SCAFCO

85
returned faulty readings. However, the Spectros SF-ExplorIR instrument does have a working
range of 0-30,000 ppm, which well encompasses the applied level of SF (4,540 ppm).
When the top and bottom covers of the Bird’s silo were opened to vent the remaining gas after
seven days, SF measurements throughout the silo jumped from 0 to between 200 and 1800 ppm
(see spike after 168 hours). Professional fumigators have indicated that during some SF
fumigations of grain, locations where SF has been measured will begin to measure zero
concentration, but when the commodity is moved or fresh air is introduced during venting, the
monitoring lines begin to record SF again (Dolan Jamison and Chris Newman, personal
communication). Seven days after the start of trial 5, the SF concentrations all read zero
throughout the grain mass. However, when the top and bottom covers were opened, SF was
detected again throughout the grain mass, ranging from 24 to 1893 ppm, with an average of 958
ppm. Upon opening the covers, the pressure in the silo equilibrated with the outside. This
would have facilitated the ability of the pump to draw gas from the silo to the instrument. Hwaidi
et al. (2015) found that after initial aeration, no significant SF desorption occurred from whole
wheat in jars, but every indication is that the wheat was not moved or agitated during these
measurements. Sulfuryl fluoride desorption experiments with agitated or aerated grain should be
considered for future research.
The pressure decay tests for the Bird’s and SCAFCO silos prior to these trials yielded half-life
times of 40 seconds and 20 seconds, respectively. While these do not meet the Australian
standard AS2628 for sealed silos, they were comparable to half-life pressure decay times for the
previous PH3 fumigations that were successful. Thus, it is not likely the silos were excessively
leaky.

86
Table 1 shows the CTPs, HLTs, average maximum concentrations, and leakage rates for the silos
for all five fumigation trials. The HLTs and leakage rates for the SF fumigations were calculated
from 0 to 24 h and 24-125 h because the leakage rates were very high during the first 24 h
compared to the rest of the fumigation. The substantial differences of these values compared to
what was observed in the PH3 fumigations were likely due to a high degree of measurement error
for the reasons explained above.
Reed and Pan (1999) found that PH3 sorption rates are lower for subsequent fumigations on the
same grain. Because the same corn was retained and used during all five fumigation trials, this
may help explain why there were longer half loss times and lower leakage rates in trial 3 than
trials 1 and 2.
Schneider et al. (2001) discussed the importance of knowing the HLT of a structure prior to
fumigation in order to maximize fumigation cost effectiveness. Longer HLTs are indicative of
well-sealed structures that are not as susceptible to wind effects and the stack effect. In the case
of the Bird’s silo in trials 1 and 3, both trials used the same number of aluminum phosphide
tablets, but trial 3 had a lower leakage rate, longer HLT, and higher peak concentration. The
wind speeds, average daily temperature, and solar radiation all have a large effect on gas loss
from silos (Navarro 1998). For trials 1 and 3, the average temperature and wind speeds
throughout the trials were relatively close (21.7 and 20.9 °C and 1.7 and 1.8 m/s, respectively.
The average daily solar radiation during trial 1 was 215 W/min, respectively, compared to 165
W/min during trial 3. The greater amount of solar radiation during trial 1 may have caused the
headspace air volume in the silos to expand and cause greater leakage than during trial 3.

87
Table 4.1 Concentration time products, half-loss times, average maximum concentrations, and
leakage rates in the Bird’s and SCAFCO silos after 125 hours for five fumigation trials.
CTP after
125 h
(ppm-h)
Half-Loss
Time
(h)
Average Max
Concentration
(ppm)
Leakage Rate
after 125 h
(ppm/h)
Trial 1
Bird’s (PH3) 26,785 44 501 3.4
SCAFCO (PH3) 24,436 44 324 2.9
Trial 2
Bird’s (PH3) 38,561 48 467 4.1
SCAFCO (PH3) 30,547 32 343 3.9
Trial 3
Bird’s (PH3) 40,986 106 688 2.9
SCAFCO (PH3) 22,491 130 556 1.5
Trial 4/5
Bird’s (PH3) 163,701 98 1,373 9.4
SCAFCO (PH3) 102,942 67 876 6.2
Trial 5/4
Bird’s (SF) 160,213 <1 15,071 545.3*, 3.4**
SCAFCO (SF) 9,488 <1 3,021 89.0*, 1.0**
*From 0-24 hours
** From 24-125 hours
Gas concentrations by horizontal levels and vertical sections
Uniform fumigant concentration is important to ensure the target concentration at every point in
the silo is held for sufficient time to kill all insects at all life stages. When fumigating a leaky silo
with poor gas circulation, a manager cannot be sure the targeted dosage is achieved at every

88
point in the silo. Monitoring the concentration at several points in the structure can help inform
the manager whether the fumigation was a success or failure. Monitoring in the top of the grain
mass is advised because of high insect densities found there (Flinn et al. 2004, Hagstrum 1989).
Figure 4.16 shows fumigant concentrations at each monitoring point at the four levels in the
grain mass of the SCAFCO silo during trial 1. At the start of the trial, the phosphine
concentrations were not uniform among the center, north, south, east and west vertical sections
of the silos. This variation was most evident in the bottom half of the grain mass. The phosphine
distribution in the top level was generally uniform. This pattern was observed in both silos for all
three trials, except for the SCAFCO silo in trial 3 when the ThermoSiphon was turned off.
During PH3 generation from tablets and pellets the bottom levels of the grain mass generally had
higher overall concentrations than the top level due to the proximity of the ground-level PH3
reaction chamber. After all the gas had evolved from the tablets or pellets, concentrations at
different heights were considerably more uniform. In both silos, the min/max ratio was above
0.25 by the time the PH3 had evolved from the tablets or pellets except the SCAFCO silo for trial
3 (with ThermoSiphon off). As convection moved the fumigant up the ThermoSiphon, the gas
diffused evenly throughout the headspace before being drawn down in the grain mass by the
ThermoSiphon-driven recirculation effect of the convection currents in the grain mass.
Figure 4.17 shows the PH3 concentrations in the center, south, west, north and east sections at all
four levels in the SCAFCO silo during trial 3 (September 18-23). Even though the average
concentration in the silo, or the concentration at any one point in the silo may be sufficient to kill
insects at all life stages, there may be areas of sub-lethal concentration. For example, during trial
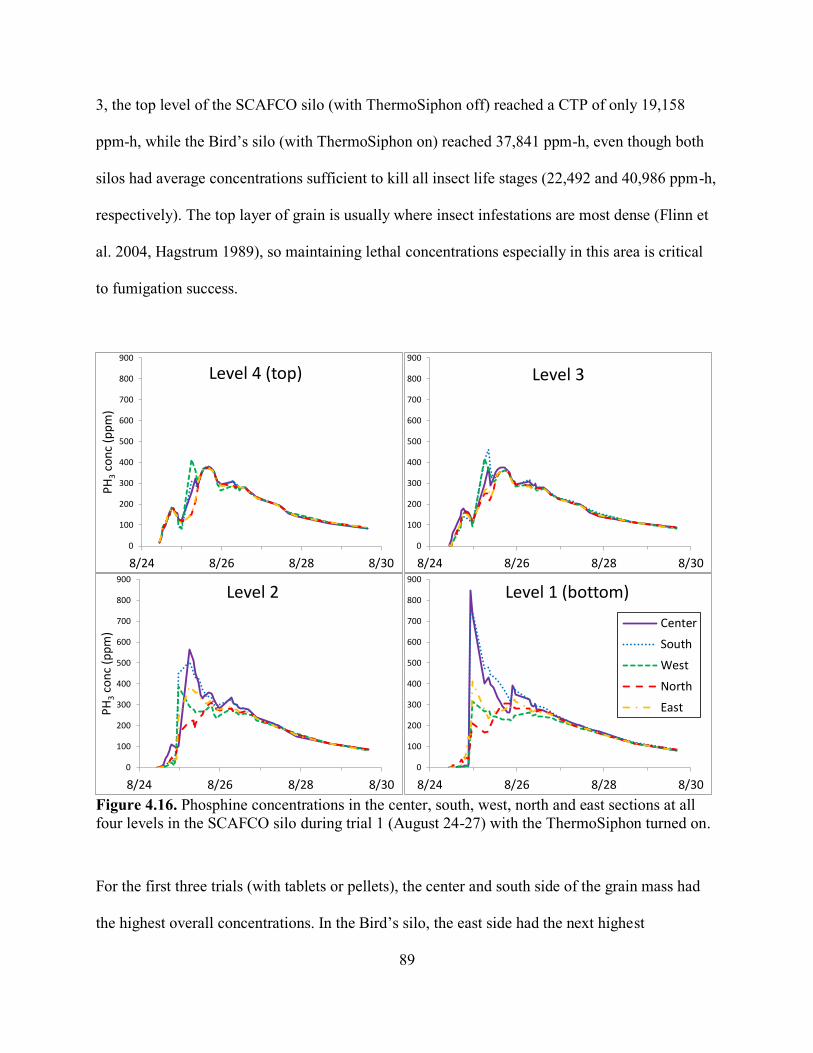
89
3, the top level of the SCAFCO silo (with ThermoSiphon off) reached a CTP of only 19,158
ppm-h, while the Bird’s silo (with ThermoSiphon on) reached 37,841 ppm-h, even though both
silos had average concentrations sufficient to kill all insect life stages (22,492 and 40,986 ppm-h,
respectively). The top layer of grain is usually where insect infestations are most dense (Flinn et
al. 2004, Hagstrum 1989), so maintaining lethal concentrations especially in this area is critical
to fumigation success.
Figure 4.16. Phosphine concentrations in the center, south, west, north and east sections at all
four levels in the SCAFCO silo during trial 1 (August 24-27) with the ThermoSiphon turned on.
For the first three trials (with tablets or pellets), the center and south side of the grain mass had
the highest overall concentrations. In the Bird’s silo, the east side had the next highest
0
100
200
300
400
500
600
700
800
900
8/24 8/26 8/28 8/30
PH
3 c
on
c (p
pm
)
Level 4 (top)
0
100
200
300
400
500
600
700
800
900
8/24 8/26 8/28 8/30
Level 3
0
100
200
300
400
500
600
700
800
900
8/24 8/26 8/28 8/30
PH
3 c
on
c (p
pm
)
Level 2
0
100
200
300
400
500
600
700
800
900
8/24 8/26 8/28 8/30
Level 1 (bottom)
Center
South
West
North
East

90
concentrations while in the SCAFCO silo the west side had the next highest concentrations. The
lowest concentrations in the SCAFCO silo were on the east and north sides, while the lowest
concentrations in the Bird’s silo were typically on the west side. This is further discussed in the
next section.
In trials 4 and 5 with cylinderized PH3, for the first several hours of the fumigation, higher
concentrations were found in the center (1,525 ppm compared to between 980 and 1,176 ppm for
the other vertical locations (Figure 4.18). After about 4.5 h, the concentrations became much
more uniform, all lines were between 893 and 862 ppm. The variation among the vertical
monitoring lines reached uniformity much more quickly than in the trials with tablets and pellets.
Among the center, north, south, east and west locations, the min/max ratios were 0.81 and 0.37
after one hour in the Bird’s and SCAFCO silos, respectively.
In trials with PH3 tablets and pellets, the concentrations along the vertical monitoring lines
became uniform after 36-48 h except in the case of trial 3 in the SCAFCO silo (without
recirculation) in which the vertical sections became uniform after 120 hours (about 2.5 times
longer).
Figure 4.19 shows the average gas concentrations at each height throughout the SCAFCO silo
during trial 5 using VAPORPH3OS®. The distribution among these sampling points became
uniform rapidly, the min/max ratio reaching more than 0.50 within three hours after the start of
the fumigation. Similar results were seen in the Bird’s silo with VAPORPH3OS®.
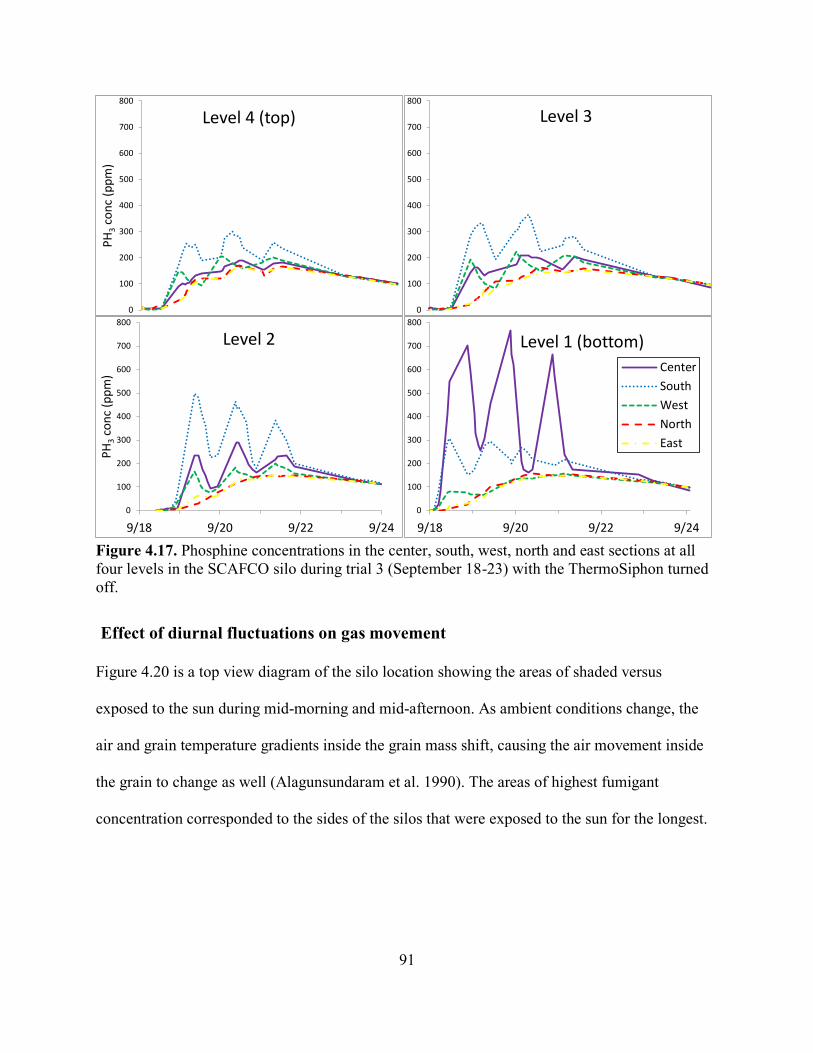
91
Figure 4.17. Phosphine concentrations in the center, south, west, north and east sections at all
four levels in the SCAFCO silo during trial 3 (September 18-23) with the ThermoSiphon turned
off.
Effect of diurnal fluctuations on gas movement
Figure 4.20 is a top view diagram of the silo location showing the areas of shaded versus
exposed to the sun during mid-morning and mid-afternoon. As ambient conditions change, the
air and grain temperature gradients inside the grain mass shift, causing the air movement inside
the grain to change as well (Alagunsundaram et al. 1990). The areas of highest fumigant
concentration corresponded to the sides of the silos that were exposed to the sun for the longest.
0
100
200
300
400
500
600
700
800P
H3 c
on
c (p
pm
) Level 4 (top)
0
100
200
300
400
500
600
700
800
Level 3
0
100
200
300
400
500
600
700
800
9/18 9/20 9/22 9/24
PH
3 c
on
c (p
pm
)
Level 2
0
100
200
300
400
500
600
700
800
9/18 9/20 9/22 9/24
Level 1 (bottom)
Center
South
West
North
East

92
At the start of the fumigation, PH3 moved upwards through the ThermoSiphon and into the
headspace. Variation in concentrations was seen mostly in the top levels as PH3 moved
downwards through the grain mass.

93
Figure 4.18. Phosphine concentrations in the center, south, west, north, and east sections
at all four levels in the SCAFCO silo during trial 5 (April 25 – May 9, 2016) using
VAPORPH3OS®.
Figure 4.19 Average PH3 concentrations at the different heights in the SCAFCO silo
during trial 5 (April 25-May 9 using VAPORPH3OS®.
After the sun had gone down, the ThermoSiphon stopped moving fumigant upward because
there was no longer a solar effect to cause temperature gradients between the thermosiphon,
headspace and grain mass sufficient for convection currents. However, the tablets or pellets were
0
200
400
600
800
1000
1200
1400
1600
1800
2000
25-Apr 27-Apr 29-Apr 1-May 3-May 5-May 7-May 9-May
PH
3 co
nce
ntr
atio
n (
pp
m)
Center
South
West
North
East
0
200
400
600
800
1000
1200
1400
1600
1800
2000
25-Apr 27-Apr 29-Apr 1-May 3-May 5-May 7-May 9-May
PH
3 c
on
cen
trat
ion
(p
pm
)
Level 1(bottom)Level 2
Level 3
Level 4

94
still generating PH3 in the reaction chamber. As a result of the PH3 concentration gradient, the
PH3 moved upwards from the grain mass in the bottom of the hopper into the upper level grain
mass. This resulted in the bottom levels of both silos having much higher concentration than the
top levels during the evening and night.
Figure 4.20 Top view of the two silos while under fumigation. The sides of the silos with the
lowest gas concentration were shaded throughout most, or all, of the day, and the sides with the
highest gas concentration were exposed to more solar radiation unless the sky was overcast.
Except in trial 3, the SCAFCO silo achieved uniform gas concentration in the grain mass more
quickly than the Bird’s silo. This could be due to the fact that the SCAFCO silo had greater
exposure to solar radiation during the hotter parts of the day (i.e., between approximately 7 am
and 7 pm). This would have caused greater natural convection currents to move PH3 within the
grain mass. The SCAFCO and Bird’s silos had similar surface area to volume ratios (1:1.6 and
1:1.8, respectively). A high surface to volume ratio leads to more extreme temperature gradients
within the grain mass (Montross 1999), which in turn causes higher convection velocities. In trial
3, there was no recirculation in the SCAFCO silo to facilitate PH3 distribution. As a result, it
took more than 48 hours for the min/max ratio to reach 0.25, whereas in every other trial with
pellets or tablets the min-to-max ratio reached 0.25 within approximately 24 hours.

95
Figures 4.21 and 4.22 illustrate further the beneficial effect of the ThermoSiphon in terms of PH3
concentrations in the headspace, in the ThermoSiphon, and directly above the PH3 reaction
chamber, along with the ambient temperature during trials 1 and 3 in the SCAFCO silo. Peaks in
the ThermoSiphon concentration were observed during the day when the sun was near its highest
point (11:00 am to 2:00 pm) and the ambient temperature reached maximum. During the day,
increased air temperatures due to solar radiation caused convection currents to move the air-PH3
mixture upward in the thermosiphon, which reached concentrations as high as 1,440 ppm. The
concentration in the headspace peaked at almost 400 ppm five hours after the start of the
fumigation and the top level readings increased steadily to 160-170 ppm. Conversely, the
concentrations were higher in the grain mass in the hopper bottom near the PH3 reaction chamber
during the cooler evenings (approximately 15°C). For the first eight hours of the fumigations,
while the PH3 was being moved upwards through the ThermoSiphon, the PH3 concentrations
near the PH3 reaction chamber were 6 ppm for the bottom level readings of the south and west
lines , and 19 ppm for the north and east lines. After the sun set, the concentration in the
ThermoSiphon dropped from 1,300 to 176 ppm, while it rose from 9 to 600 ppm near the PH3
reaction chamber as the gas was no longer being carried by the convection current created by the
ThermoSiphon pipe. Instead, it travelled upwards through the gap around the butterfly valve and
into the grain mass. In the evening, approximately twelve hours after the start of the fumigation,
the concentration near the PH3 reaction chamber rose to 815 ppm and the bottom of the south
monitoring line was 745 ppm. Concentrations at the bottom of the west, north and east lines were
between 134 and 410 ppm. This may be due to slower convection currents within the grain mass
on those sides, as they were shaded during the hotter period of the day and would not have
warmed as much as the south side.

96
Figure 4.21 Phosphine concentrations inside the headspace, ThermoSiphon, and near the
reaction chamber in the SCAFCO silo during trial 1. The average PH3 concentration and ambient
temperature are also shown. The legend also applies to Figure 4.22.
Figure 4.22 Phosphine concentrations inside the headspace, ThermoSiphon, and near the
reaction chamber in the SCAFCO silo during trial 3 with the ThermoSiphon off. The average
PH3 concentration and ambient temperature are also shown.
0
5
10
15
20
25
30
35
0
200
400
600
800
1000
1200
1400
1600
10:00 AM 10:00 PM 10:00 AM 10:00 PM 10:00 AM
Tem
per
atu
re (
°C)
PH
3 c
on
c en
trat
ion
(pp
m)
Headspace
Thermosiphon
PH3 Chamber
Average
Temperature
0
5
10
15
20
25
30
0
200
400
600
800
1000
1200
11:00 AM 11:00 PM 11:00 AM 11:00 PM 11:00 AM 11:00 PM 11:00 AM 11:00 PM
Tem
per
atu
re (
°C)
PH
3 c
on
cee
ntr
atio
n (
pp
m)

97
When the ThermoSiphon was turned off in trial 3, the PH3 was forced to move upward through
the grain mass. In the hopper bottom near the PH3 reaction chamber, concentrations were as high
as 200 ppm five hours after the start of the fumigation, but no higher than 15 ppm anywhere else
in the silo. The concentration in the lower part of the silo continued to rise during the evening,
reaching 1,170 ppm near the reaction chamber. The variation was high in the bottom level
readings, ranging from 5 ppm at the east and north lines to 77 ppm at the west line, 292 ppm at
the south line, and 414 ppm at the center line. As ambient temperature rose, the concentration
near the reaction chamber decreased, while the concentrations at the middle and upper levels in
the grain mass increased. During the day, the effects due to solar radiation and higher ambient
temperatures likely created convection currents within the grain mass that carried the PH3 away
from the chamber. These currents were asymmetrical within the silo, with different velocities at
different locations up and down the grain mass because of differences in temperatures that cause
variations in air velocities. The variations in PH3 concentrations observed in trials 1 through 3
are evidence for this phenomenon.
At night, convection slowed which caused less gas movement inside the grain mass, and thus
resulted in higher concentrations near the PH3 reaction chamber. There was a gradual increase in
the concentrations in the headspace and ThermoSiphon after PH3 finally reached the top levels.
In trial 3, fumigant reached the ThermoSiphon through its connection in the roof, but it was
turned off for the duration of the fumigation. While PH3 eventually dispersed evenly within the
grain mass, the center and south lines had higher average concentrations (166 and 191 ppm,
respectively) than the east, north and west lines (67, 94, and 69 ppm, respectively) for the first 80
hours. After 24 hours, the min/max ratio among the monitoring points at various heights reached

98
nearly 0.50, ranging from 95.4 and 198 ppm. But the average concentration did not get above
270 ppm at any level.
Thermosiphon Recirculation
The thermosiphon had an air velocity of 0.02 to 0.08 m/s during the day in sunny conditions and
0.01 to 0.02 m/s in partly cloudy conditions, with ambient temperatures ranging from 16.1 to
19.6 °C. During the evening under no sun the velocity dropped to 0.0 m/s. In the 90 mm
thermosiphon pipe these air velocities are equal to an airflow rate of 0.46 to 1.83 m3/h, or 0.005
to 0.04 m3/h/MT. This is well below the range of recommended recirculation airflow rates of
0.42 to 0.6 m3/h/MT (Noyes et al. 1998). However, for recirculation of CO2, Banks and Annis
(1981) recommended a recirculation rate equal to 0.1 volumes of airspace in the silo per day. The
thermosiphon airflow rates were between 0.02 and 0.08 for approximately 5 h during the day
when the sun warmed the air in the thermosiphon. During this time, assuming an average airflow
rate of 0.05 m/s (1.145 m3/h), five hours of thermosiphon activity would move 5.7 m
3 of air. This
is close to the 0.1 volumes of air in the Bird’s and SCAFCO silos of 6.3 and 7.2 m3, respectively.
During the concentration readings outside the silos during trials 1 and 5, all readings were zero
ppm. Even though the silos leaked somewhat as evidenced by the fumigation curves, the PH3
leaking out was undetectable using the handheld Draeger X-am 5000 personal monitoring
device. The device has a working range of 1 to 2000 ppm, while the maximum permissible
exposure limit is 0.3 ppm. The 15 minute short term exposure limit is 1 ppm (NIOSH 2016). The
leakage rate was either slow enough, or the leak was diluted enough in the air outside the silo to
remain undetectable.

99
Bioassays
Table 4.2 shows the results of the insect bioassays used during trial 1, including the
corresponding PH3 CTP to which the insects were exposed to at each location. All adult insects
of both species were killed during the fumigation. The CTPs in the Bird’s and SCAFCO silos
(approximately 26,000 and 24,000 ppm-h, respectively) exceeded the target CTP of 21,600 ppm-
h, and the fumigant was held for 5 days above 100 ppm.
Fumigation trial 1 was successful in controlling any eggs that were laid in the bioassays. After
six weeks the only adult emergence was one dead adult S. zeamais found in a jar from the
SCAFCO silo. The authors suspect this individual may have been overlooked in the initial
mortality count following the fumigation trial. In the emergence count for the controls, 328 live
and 3 dead adult S. zeamais were found, while 13 live and 12 dead T. castaneum were found.
Rajendran (2000) reported a delay in hatching for eggs of susceptible T. castaneum exposed to
30 ppm of PH3 for 120 h and a resistant strain exposed to 300 ppm for 72 hours. This highlights
the importance of either maintaining lethal concentrations within the grain bulk long enough to
kill more resistant life stages of eggs and pupae, or let the individuals in these stages develop into
the more susceptible stages of larvae and adults (Winks 1987). It is generally understood that in
PH3 fumigations a longer exposure time rather than a higher concentration is more important in
order to kill all life stages of insects (Price and Mills 1988, Daglish et al. 2002).
Table 4.3 shows some of the various dosage recommendations from the literature for PH3
fumigations to kill 99-100% of all life stages of stored product insects. Concentrations of PH3 as
low as 10 ppm can be used if the gas is held for a sufficient amount of time.

100
Table 4.2 Bioassay results of S. zeamais and T. castaneum during PH3 fumigation trial 1, August
24-29, 2015.
Table 4.4 shows the bioassay results for the fumigations with PH3 and SF, respectively. After the
PH3 fumigation, all adult insects were killed. One T. castaneum adult was found while doing the
mortality counts, but this individual was very active and probably flew into the area from another
part of the lab, as these insects are highly mobile.
For R. dominica, all PH resistant and PH3 susceptible adult insects were killed during the SF and
PH3 fumigations in the Bird’s and SCAFCO silos, respectively. In the controls, 135 PH3
susceptible (3 dead, 132 alive) and 134 PH3 resistant (39 dead, 134 alive) individuals survived.
S. zeamais
T. castaneum CTP at
location
(ppm-h) Mortality
Emergence
(6 weeks) Mortality
Emergence
(6 weeks)
Bird's
Center 100% 0 100% 0 26,994
South 100% 0 100% 0 26,197
West 100% 0 100% 0 26,416
North 100% 0 100% 0 26,863
East 100% 0 100% 0 26,174
Total - 0 - 0
SCAFCO
Center 100% 0 100% 0 24,124
South 100% 0 100% 0 24,316
West 100% 0 100% 0 24,663
North 100% 1 100% 0 23,438
East 100% 0 100% 0 23,283
Total - 1 - 0
Control
Center 18% 76 13% 0 -
South 20% 52 8% 1 -
West 24% 77 10% 8 -
North 0% 37 8% 8 -
East 5% 89 14% 8 -
Total - 331 - 25

101
From the SF bioassays, two adults (1 dead, 1 alive) and three adults (all dead) emerged from the
PH3 susceptible and PH3 resistant bioassays, respectively. From the PH3 bioassays, seven adults
(2 dead, 5 alive) and three adults (1 dead, 2 alive) emerged from the PH3 susceptible and PH3
resistant bioassays, respectively. In the controls, 521 adults (29 dead, 492 alive) and 255 adults
(24 dead, 231 alive) emerged from the PH3 susceptible and PH3 resistant bioassays, respectively.
For T. castaneum, only one adult survivor (under SF) in all the bioassays was found after the
fumigations. In the controls, 125 (6 dead, 119 alive) and 237 (6 dead, 231 alive) adult insects
were found in the PH3 susceptible and PH3 resistant populations, respectively. From the SF
bioassays, 26 adults (1 dead, 25 alive) and 10 adults (all alive) emerged from the PH3 susceptible
and PH3 resistant bioassays, respectively. In the SCAFCO silo under PH3, five adults (all alive)
and two adults (both alive) emerged from the PH3 susceptible and PH3 resistant bioassays,
respectively. In the controls, 324 adults (34 dead, 290 alive) and 331 adults (19 dead, 312 alive)
emerged from the PH3 susceptible and PH3 resistant bioassays, respectively.
T. castaneum had greater emergence than R. dominica. For T. castaneum, PH3 performed better
for controlling emergence. It also performed better for controlling emergence of PH3 susceptible
R. dominica, but for PH3 resistant R. dominica SF and PH3 performed equally well. Phosphine
susceptible insects had higher emergence for both species in all fumigations except for R.
dominica under SF fumigation, but there only two adults emerged from the PH3 susceptible
bioassay and three emerged from the PH3 resistant.

102
Table 4.3 Minimum PH3 concentrations and times required to achieve a near-complete kill for
all life stages of stored-product insects1.
Grain quality
Casada and Noyes (2001) recommended installing vents on the roof of sealed storage structures
to prevent excessive moisture accumulation in the top of the grain due to moisture condensation.
Vents were not installed on the silos used in this study, and the corn was kept in the silos for 10
months from August 2015 to June 2016. Figure 4.23 shows the moisture content of corn in the
top 0.3 m of grain of both silos throughout the storage period. The average moisture content of
the corn in that layer increased from approximately 11.5 to 17% in both silos over the duration of
the storage period, and the test weights dropped substantially from approximately 77 to 65
kg/hL.
Concentration (ppm) Time (h) CTP (ppm-h) Source
10,000 36 360,000
Annis 2001
1,200 48 57,600
1,000 192 192,000
200 240 48,000
35 480 16,800
10 720 7,200
3002
1682
50,400 Anon 2013
2003
2403
48,000
710 120 85,200 Adapted from
Collins et al.
20044
210 240 50,400
142 336 47,712
1Excluding Trogoderma spp.
2When grain is above 25° C
3When grain is between 15-25° C
4For highly PH3-resistant R. dominica

103
Table 4.4. Bioassay results of R. dominica and T. castaneum during fumigation trial 5, April 25-May 4, 2016
R. dominica T. castaneum CTP at
bioassay
location
(ppm-h)
PH3 susceptible PH3 resistant PH3 susceptible PH3 resistant
Mortality Emergence No. adults Emergence No. adults Emergence No. adults Emergence
Bird's (SF)
Center 100% 0 100% 1 100% 6 100% 1 134 g-h/m3
South 100% 1 100% 1 97% 4 100% 0 164 g-h/m3
West 100% 0 100% 1 100% 5 100% 2 1,000 g-h/m3
North 100% 1 100% 0 100% 6 100% 1 374 g-h/m3
East 100% 0 100% 0 100% 5 100% 6 382 g-h/m3
Total - 2 - 3 - 26 - 10 -
SCAFCO (PH3)
Center 100% 0 100% 0 100% 0 100% 0 148,117
South 100% 1 100% 0 100% 0 100% 0 150,441
West 100% 4 100% 0 100% 1 100% 0 147,151
North 100% 2 100% 3 100% 4 100% 2 140,880
East 100% 0 100% 0 100% 0 100% 0 143,164
Total - 7 - 3 - 5 - 2 -
Control
Center 4% 110 27% 58 20% 96 4% 36 -
South 0% 134 18% 58 7% 122 0% 13 -
West 4% 71 33% 43 3% 65 2% 26 -
North 0% 76 15% 37 0% 98 2% 145 -
East 4% 130 19% 59 6% 43 4% 111 -
Total - 521 - 255 - 424 - 331 -
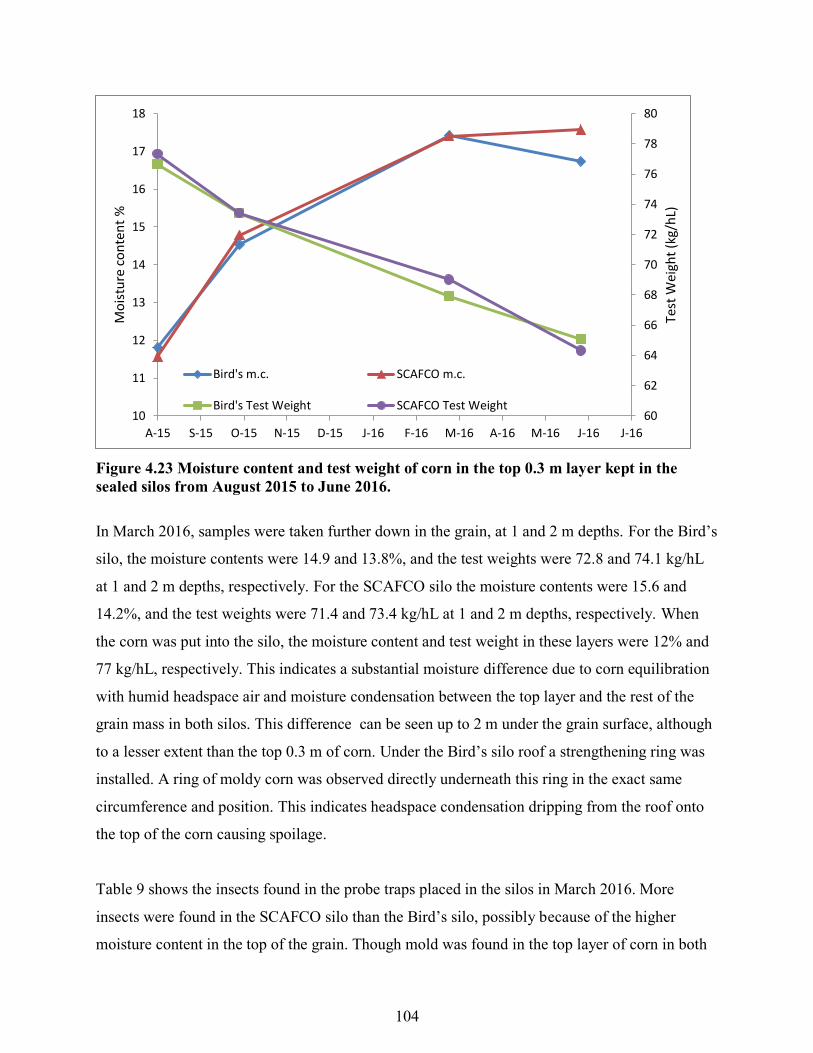
104
Figure 4.23 Moisture content and test weight of corn in the top 0.3 m layer kept in the
sealed silos from August 2015 to June 2016.
In March 2016, samples were taken further down in the grain, at 1 and 2 m depths. For the Bird’s
silo, the moisture contents were 14.9 and 13.8%, and the test weights were 72.8 and 74.1 kg/hL
at 1 and 2 m depths, respectively. For the SCAFCO silo the moisture contents were 15.6 and
14.2%, and the test weights were 71.4 and 73.4 kg/hL at 1 and 2 m depths, respectively. When
the corn was put into the silo, the moisture content and test weight in these layers were 12% and
77 kg/hL, respectively. This indicates a substantial moisture difference due to corn equilibration
with humid headspace air and moisture condensation between the top layer and the rest of the
grain mass in both silos. This difference can be seen up to 2 m under the grain surface, although
to a lesser extent than the top 0.3 m of corn. Under the Bird’s silo roof a strengthening ring was
installed. A ring of moldy corn was observed directly underneath this ring in the exact same
circumference and position. This indicates headspace condensation dripping from the roof onto
the top of the corn causing spoilage.
Table 9 shows the insects found in the probe traps placed in the silos in March 2016. More
insects were found in the SCAFCO silo than the Bird’s silo, possibly because of the higher
moisture content in the top of the grain. Though mold was found in the top layer of corn in both
60
62
64
66
68
70
72
74
76
78
80
10
11
12
13
14
15
16
17
18
A-15 S-15 O-15 N-15 D-15 J-16 F-16 M-16 A-16 M-16 J-16 J-16
Test
Wei
ght
(kg/
hL)
Mo
istu
re c
on
ten
t %
Bird's m.c. SCAFCO m.c.
Bird's Test Weight SCAFCO Test Weight

105
silos, none of the insects found are primarily known as mold feeders. The silos were kept sealed
through the winter, and while some insects may have found their way into the silos from outside
through miniscule cracks in the silo structure, it is more likely that eggs previously laid in the
grain were not killed during the fumigations in the fall of 2015.
Table 4.5. Insects found in probe traps placed in both silos for 2 weeks in
March 2016
Bird’s SCAFCO
Alive Dead Alive Dead
T. casteneum 7 6 17 11
R. dominica 0 0 0 19
S. oryzae 1 1 0 1
Total 8 7 17 40
Conclusions
This project evaluated the feasibility of using an Australian and a U.S. sealed steel hopper silo
with thermosiphon recirculation equipment to achieve successful fumigations, control stored-
grain insect pests, and maintain stored grain quality. The specific conclusions from this research
are:
Pressure testing of sealed silos can be easily and inexpensively done using a simple U-
shape manometer.
Both silos failed to achieve the 3-5 minute half-life during pressure decay testing as
required by the Australian sealing standard. For the Australian silo, half-life times ranged
from 5 seconds to 2 minutes 43 seconds, compared to half-life times of 20 to 50 for the
U.S. silo. However, the fumigation success criteria proposed by Banks and Annis (1984),
CTPs, and bioassay results obtained during the fumigation trials indicate both silos were
nevertheless fumigated successfully.

106
Using pellets, PH3 was produced at a higher rate than tablets and reached higher peak
concentrations. Using tablets in trial 1, it took 32 h for the U.S. and Australian silos to
reach a peak concentration of 354 and 404 ppm, respectively. Using pellets in trial 2, it
took 20 h for the U.S. silo to reach a peak of 490 ppm, and 30 h for the Australian silo to
reach a peak of 498 ppm.
The Australian-designed thermosiphon recirculation technology effectively distributes
fumigant throughout the grain mass of a silo as a result of solar radiation and temperature
effects. This increases overall fumigant uniformity and speed of dispersion within the
silo, even on the shaded sides. For trials 1 through 3, it took about 24 h for the average
concentration to peak with the thermosiphon compared to 48 h without the thermosiphon.
In the U.S. silo in trial 1 with the thermosiphon, all 23 monitoring points in the silo
reached 300 ppm after about 24 h, while in trial 3 without the thermosiphon, readings in
the north and east (shaded) did not reach 160 ppm.
Phosphine distributed throughout the silo without recirculation from the thermosiphon,
however it was at a slower rate. During dispersion of the fumigant, the south side of the
silo, which received the most sunlight, had consistently higher concentrations (average
187 ppm) than the north and east sides which did not receive as much sun (average 77
ppm).
In trials 4 and 5, the concentration of SF fluctuated between zero and non-zero readings
throughout the fumigations. This was most likely due to instrument and operator error,
and insufficient pump suction pressure of the SF monitoring instrument. Similar results
have been reported anecdotally by professional fumigators.

107
No PH3 was detected outside of the silos at any time during the fumigations. This
indicated that any PH3 leaking to the outside was immediately diluted in the air to
undetectable levels.
In the bioassay containing PH3 susceptible S. zeamais and T. castaneum, all adult insects
were killed, and it is likely there was no emergence after six weeks of incubation (one
dead adult was found but it was probably overlooked during the initial mortality count).
Both SF and PH3 were 100% effective in killing PH3 resistant and PH3 susceptible R.
dominica and T. castaneum adults. Sulfuryl fluoride and PH3 worked equally well to kill
immature stages of PH3 resistant strains of R. dominica, with only 3 emerged adults.
Phosphine worked better to control emergence for T. castaneum, with 3 adults emerged
compared to 10 from the SF treatment. The PH3 resistant and susceptible strains of R.
dominica were controlled equally well with both SF and PH3. There was greater
emergence from the PH3 susceptible strains of T. castaneum (31 adults) compared to the
PH3 resistant strain (12 adults) for both SF and PH3.
Grain quality was affected by being stored in a non-aerated and non-vented silo. The test
weight of corn dropped from approximately 77 to 65 kg/hL. In the top 0.3 m, corn
moisture rose from 11.5 to 17% in both silos due to moisture equilibration with humid
headspace air and moisture condensation over the duration of the storage period.
After storing the corn for 6-7 months, mold was found in the topmost layer of corn (10
cm) in both silos. Condensation collected on the underside of the roof and dripped onto
the grain surface as evidenced by the observed ring of mold directly underneath the
support ring attached to the roof of the Bird’s silo.
108
Chapter 5 - Summary and Conclusions
Permanently sealing a corrugated steel silo after-market is time consuming and labor intensive.
The additional time spent in sealing, checking for and fixing leaks, and installing the additional
fumigation equipment was 90 man-hours. An experienced crew may be able to reduce this to
about 25 man-hours for a similar sized silo, but additional equipment and sealing materials still
add substantial cost to an unsealed silo. The additional equipment to seal the U.S. silo cost
$33/MT, or roughly 13% of the initial cost of the silo.
The total cost of modifying and sealing a corrugated steel hopper silo during construction to
prepare it for fumigation on a permanent basis was estimated to be $67/MT, or 25.7% of the list
price. For an experienced work crew that cost may be lowered to $42/MT, or approximately
16.2% of the list price. A considerable amount of money may be saved in the short term by
temporarily sealing the silo prior to each fumigation which costs only $1.50/MT for a smaller (60
MT) silo and even less for larger silos ($0.04/MT for a 5,000 MT silo).
A grain manager must decide whether the cost of permanently sealing a grain silo is worth the
potential gains in fumigation success and possibly lower long-term labor costs. Other
considerations would be the safety aspects, as a permanently sealed silo would prevent the need
for workers to climb in, around, and on grain silos to seal them.
The roof- and hopper-wall junctions, top lid, and overlapping roof ribs were areas of greatest
leakage in the U.S. silo. Places where more than two sheets overlapped had more leaks than
where only two sheets joined.

109
A hybrid approach to preparing structures for fumigation may be to permanently seal areas with
greater leakage potential such as the roof-wall junction, and use temporary sealing for vents,
fans, and other areas that are not conducive to being permanently sealed. The remaining leakage
points could be quickly sealed prior to fumigation.
Neither the U.S. nor Australian silo had half-life pressure decay times that reached the 3-5
minutes prescribed by Australian Standard 2628. The longest half-life times were 50 s and 163 s
for the U.S. and Australian silos, respectively. The half-life times were shorter after loading the
silos with grain, suggesting the pressures from grain loading may have broken some of the seals
and opened paths for air to travel through the silo wall seams.
The half-life times also decreased after 7-8 months through hot summer and cold winter weather.
It is possible that exposure to temperatures above 35° C and below 0° C as experienced in
Kansas, along with high winds and solar radiation deteriorated some of the sealant exposed to the
elements.
The thermosiphon aided the distribution of PH3 within the grain mass. With the thermosiphon,
the minimum to maximum concentration ratio in the Australian silo reached 0.25 in less than 24
hours, but it took over 48 hours to reach 0.25 in the U.S. silo. The average concentration of PH3
in the U.S. silo also seemed to be adversely affected by the lack of recirculation. It was unclear
what effect the thermosiphon had with SF due to measurement errors in recording SF
concentrations.

110
From an insect control point of view, the fumigations for trials 1 and 5 may be considered
successful. All adult insects were killed during the fumigations, including the PH3 resistant
individuals. Emergence after 6 weeks was greatly reduced by fumigating with SF and PH3
compared to the controls.
An alternative approach is to perform fumigations that kill adult insect pests only but allow
other, less susceptible life stages to live. This may be reasonable immediately prior to marketing
of grain to eliminate detectable live insects and to save on fumigation costs. However, this may
provide selection pressure for PH3 resistant insects. Grain handlers and managers should keep in
mind the need to preserve PH3 as a viable fumigant for the future.
The grain quality deteriorated in both silos over the storage period. Without adequate venting in
the headspace, temperature fluctuations cause moisture-laden air to condense on the roof and
drip onto the grain surface. This caused the moisture content to increase and the test weight to
decrease in the top grain layer. Mold was visible in the top 10 cm of grain and was especially
noticeable on the grain surface directly under the strengthening ring installed on the underside of
the Australian silo roof.

111
Chapter 6 - Future Work and Recommendations
A comparative fumigation cost/benefit analysis should be undertaken on larger bolted steel silos
and flat bunker storage structures temporarily sealed versus permanently sealed. Some work has
been done at Oklahoma State University on the cost saved in sealing a concrete elevator and
using closed loop fumigation versus fumigating a silo as-is. They realized savings of $0.50-$1.50
per bushel in fumigation costs (Jones et al., unpublished data). This will not only be important
for end users, but manufacturers seeking to not only minimize the cost of producing sealed silos,
but also to convince their customers that the increased cost of sealed storage can be made up in
lower fumigation and operating costs, as well as higher grain quality and quantity.
Currently, bolted steel silos manufactured in the U.S. are not designed to be airtight. Designing,
manufacturing and constructing a silo that is readily sealable should be further explored because
it would help ensure fumigation success and the continued efficacy of PH3. Roof aeration vents
should be sealable from the ground level. Components such as access doors, and inlet and
discharge chutes should be redesigned for airtightness. The silo base to foundation interface
should be permanently sealed, and the silo sidewall to roof interface should be sealable for
airtightness during fumigations.
A three or five minute half-life pressure decay time is difficult to achieve on a bolted steel silo.
More research needs to be undertaken to determine whether what the Australian Standard 2628
calls for is an appropriate and reasonable target, or whether it could be less to economize sealing
(Casada and Noyes 2001) while also ensuring a successful fumigation.

112
It was unclear whether or not the thermosiphon aided recirculation of SF, or whether SF was too
heavy to be carried by the relatively low air velocities generated passively via solar radiation on
the thermosiphon pipe during day time hours. This should be further investigated. Given that
CO2 is heavier than PH3 (44.01 g/mol and 33.99 g/mol, respectively), it would be worthwhile to
also investigate whether thermosiphon technology could be used to distribute CO2 when treating
organic grains. One of the largest barriers to adoption when treating with CO2 is the cost
associated with the recirculation equipment (Noyes et al. 2002).
Sealing a silo for fumigation and aerating or venting a silo to maintain grain quality have
opposite goals, i.e., preventing air exchange between the inside and outside of the silo.
Incorporating the ability to aerate the grain and vent the headspace of the silo after performing a
fumigation in a sealed silo would be important to include in the design of a silo if grain is to be
kept for longer periods of time.

113
References
Alagunsundaram, D., D.S. Jayas, N.D.G. White, and W.E. Muir. 1990. Three-dimensional, finite
element, heat transfer model of temperature distribution in grain storage bins.
Transactions of the ASAE. 33(2). 577-584.
Annis, P.C. 2001. Phosphine dosage regimes required for high mortality: A data-base approach.
Proceedings of the International Conference on Controlled Atmosphere and Fumigation
in Stored Products. Fresno, CA. 29 October – 3 November 2000. 45-55.
Anonymous. 2014. Australian grains industry post-harvest chemical usage recommendations and
outturn tolerances 2013/2014. Grain Trade Australia.
Anonymous. 2013. Grain fumigation – A guide. Grain Storage Fact Sheet. Grains Research and
Development Corporation.
Anonymous. 1999. Preventing phosphine poisoning and explosions during fumigation. National
Institute for Occupational Safety and Health Publication no. 99-126.
AS 2628-2010. 2010. Sealed grain-storage silos – Sealing requirements for insect control.
Standards Australia.
ASHRAE 2001. ASHRAE Handbook-Fundamentals. American Society of Heating,
Refrigerating and Air-Conditioning Engineers Inc.
Bailey, S. W. and H. J. Banks. 1974. The use of controlled atmospheres for the storage of grain.
Proceedings for the 1st International Working Conference on Stored Product
Entomology. 375-382.
Banks, H.J. 1986. Application of fumigants for disinfestation of grain and related products.
Pesticides and Humid Tropical Grain Storage Systems. ACIAR Proceedings No. 14. 291-
298.

114
Banks, H.J. 1986. Sorption and desorption of fumigants on grains: mathematical descriptions.
Pesticides and Humid Tropical Grain Storage Systems. ACIAR Proceedings No. 14. 179-
193.
Banks, H.J. 1989. Behaviour of gases in grain storages. Fumigation and Controlled Atmosphere
Storage of Grain. Proceedings of an International Conference. 96-107.
Banks, H. and P. Annis. 1980. Conversion of existing storages for modified atmospheric use.
Controlled Atmosphere Storage of Grains. ed. J. Shejbal, Amsterdam: Elsevier. 207-224.
Banks, H.J. and Annis, P.C. 1984. On criteria for success of phosphine fumigations based on
observation of gas distribution patterns. Controlled Atmosphere and Fumigation in Grain
Storages. Proceedings of an International Symposium. Perth, Australia. 11–22 April
1983. 327-341.
Banks, H. and B. Ripp. 1984. Sealing of grain storages for use with fumigants and controlled
atmospheres. Proceedings of the 3rd International Working Conference on Stored-
Product Entomology. 375-390.
Banks, H.J., Wright, E.J., Damcevski, K.A. 1998. Stored grain in Australia. Proceedings of the
Australian Postharvest Technical Conference. Canberra, Australia. May 26–29 1998. 55–
57.
Barker, N.D. and J. van S. Graver. 2004. Wheat: Australia. Crop post-harvest: Science and
Technology, Durables. 99-116.
Bell, C. H. 2000. Fumigation in the 21st century. Crop Protection 19(8). 563-569.
Bell, C. H. 2002. Fumigation - The few remaining compounds. Phytoparasitica 30(1). 3-6.
115
Berck, B. 1968. Sorption of phosphine by cereal products. Journal of Agricultural and Food
Chemistry. 16(3). 419-425.
Berck, B. 1975. Interstitial air movement in model grain silos. Pesticide Science. 6(6). 639-644.
Boland, F.B. 1984. Phosphine fumigation in silo bins. Controlled atmosphere and fumigation in
grain storages. Proceedings of an international symposium. Perth, Australia. 11–22 April
1983. 425–430.
Casada, M. E. and R. T. Noyes. 2001. Future bulk grain bin design needs related to sealing for
optimum pest management: a researcher’s view. Proceedings of an International
Conference on Controlled Atmosphere and Fumigation in Stored Products. 457-465.
Chang, C. S., H. Converse, and J. L. Steele. 1994. Modeling of moisture content of grain during
storage with aeration. Transactions of the ASAE 37(6). 1891-1898.
Chantler, D. 1983. The adoption of silo sealing by Western Australian farmers. Controlled
Atmosphere and Fumigation in Grain Storages. Proceedings of an International
Symposium. Perth, Australia. 11–22 April 1983. 683-705.
Chayaprasert, W. and D.E. Maier. 2010. Evaluating the effects of sealing quality on gas leakage
rates during structural fumigation by pressurization testing and CFD simulations.
Transactions of the ASABE 53(3). 853-861.
Clark, A., J. Kimball, and H. Stambaugh. 1998. Special report: The hazards associated with
agricultural silo fires. U.S. Fire Administration/Technical Report Series 096.
Collins, P.J., 1998. Resistance to grain protectants and fumigants in insect pests of stored
products in Australia. Proceedings of the Australian Postharvest Technical Conference.
Canberra, Australia. 26 May 1998. 55-57.

116
Collins, P.J., Daglish, G.J., Bengston, M., Lambkin, T.M. and Pavic, H., 2002. Genetics of
resistance to phosphine in Rhyzopertha dominica (Coleoptera: Bostrichidae). Journal of
Economic Entomology. 95(4). 862-869.
Collins, P.J., G.J. Daglish, H. Pavic, and R.A. Kopittke. 2004. Response of mixed-age cultures of
phosphine-resistant and susceptible strains of lesser grain borer, Rhyzopertha dominica,
to phosphine at a range of concentrations and exposure periods. Journal of Stored
Products Research. 41(4). 373-385.
Collins, P. J., R. N. Emery and B. E. Wallbank. 2002. Two decades of monitoring and managing
phosphine resistance in Australia. Proceedings of the 8th International Working
Conference on Stored Product Protection. York, UK. 22-26 July 2002. 570-575.
Collins, P.J. 2006. Resistance to chemical treatments in insect pests of stored grain and its
management. Proceedings of the 9th International Working Conference on Stored
Product Protection. Sao Paulo, Brazil.15-18 October 2006. 277-282.
Calderon, M. 1990. Introduction. Food Preservation by Modified Atmospheres. ed. M. Calderon
and Barkai-Golan, R., Boca Raton, FL. CRC Press. 3-8
Daglish, G.J., P.J. Collins, H. Pavic, and R.A. Kopittke. 2002. Effects of time and concentration
on mortality of phosphine-resistant Sitophilus oryzae (L) fumigated with phosphine. Pest
Management Science. 58(10). 1015-1021.
De Lima, C. 1990. Airtight storage: principle and practice. Food Preservation by Modified
Atmospheres. ed. M. Calderon and Barkai-Golan, R., Boca Raton, FL. CRC Press. 9-19
Delmenico, R. 1993. Controlled atmosphere and fumigation in Western Australia-a decade of
progress. Proceedings of the International Conference on Controlled Atmospheres and
Fumigation in Grain Storages. Winnipeg, Canada. 11-13 June, 1992. 3-12.
Dendy, A. and H. D. Elkington. 1920. Report on the Effect of Airtight Storage upon Grain
Insects. Part III. Report. Grain Pests (War) Committee, Royal Society, London (6).

117
Derrick, M.R., H.D. Burgess, M.T. Baker, and N.E. Binnie. 19901. Sulfuryl fluoride (Vikane): A
review of its use as a fumigant. Journal of the American Institute for Conservation. 29(1).
77-90.
Dilley, D. R. 1990. Historical aspects and perspectives of controlled atmosphere storage. Food
Preservation by Modified Atmospheres. eds. S. Navarro and Barkai-Golan, R., Boca
Raton, FL. CRC Press. 187-196.
Donahaye, E. 2000. Current status of non-residual control methods against stored product pests.
Crop Protection 19(8). 571-576.
Dumas, T. 1980. Phosphine sorption and desorption by stored wheat and corn. Journal of
Agricultural and Food Chemistry. 28(2). 337-339.
Ellis, D. M. 1983. Engineering aspects to be incorporated into design of new storages and
modification of existing storages for controlled atmospheres. Controlled Atmosphere and
Fumigation in Grain Storages. Proceedings of an International Symposium. Perth,
Australia. 11–22 April 1983. 237-245.
Flinn, P.W., D.W. Hagstrum, C. Reed, and T.W. Phillips. 2004. Simulation model of
Rhyzopertha dominica population dynamics in concrete grain bins. Journal of Stored
Products Research. 40(1). 39-45.
Flint, W.P. 1921. Control of insects injurious to stored grain and seeds. University of Illinois
College of Agriculture Extension Service in Agriculture and Home. Extension circular
no. 40.
Grains Research and Development Corporation (GRDC). 2013. GRDC Organisational
Performance Research - Grower survey report.
Hagstrum, D. 1989. Infestation by Cryptolestes ferrugineus (Coleoptera: Cucujidae) of newly
harvested wheat stored on three Kansas farms. Journal of Economic Entomology. 82(2).
655-659.
118
Haritos, V. S., K. A. Damcevski and G. Dojchinov. 2006. Improved efficacy of ethyl formate
against stored grain insects by combination with carbon dioxide in a dynamic application.
Pest Management Science. 62(4). 325-333.
Hwaidi, M., P.J. Collins, M. Sissons, H. Pavic, and M.K. Nayak. 2015. Sorption and desorption
of sulfuryl fluoride by wheat, flour and semolina. Journal of Stored Products Research.
62. 65-73.
Jay, E. and R. D'Orazio. 1983. Progress in the use of controlled atmospheres in actual field
situations in the United States. In Controlled Atmosphere and Fumigation in Grain
Storages, Proceedings of an International Symposium. Perth, Australia. 11–22 April
1983. 3-13.
Jayas, D.S., 1995. Mathematical modeling of heat, moisture, and gas transfer in stored grain
ecosystems. Stored grain Ecosystems. eds. Jayas, D.S., White, N.D.G., Muir, W.E.
Marcel Dekker, New York, Basel, Hong Kong. 527–567.
Jian, F., D.S. Jayas, and N.D.G. White. 2009. Temperature fluctuations and moisture migration
in wheat stored for 15 months in a metal silo in Canada. Journal of Stored Products
Research. 45(1). 82-90.
Kader, A. A. 2004. Increasing Food Availability by Reducing Postharvest Losses of Fresh
Produce. 5th International Postharvest Symposium. 2169-2176.
Leesch, J.G., Cuperus, G., Criswell, J., Sargent, J., Mueller, J. 1995. Practical fumigation
considerations. Stored Product Management. Oklahoma Cooperative Extension Service
Circular E-912. 139-152.
McGaughey, W. H. and R. G. Akins. 1989. Application of modified atmospheres in farm grain
storage bins. Journal of Stored Products Research. 25(4). 201-210.

119
Meiering, A. G. 1982. Oxygen control in sealed silos. Transactions of the ASAE 25(5). 1349-
1354.
Mills, K. A. 2000. Phosphine resistance: Where to now? Proceedings of the International
Conference on Controlled Atmosphere and Fumigation in Stored Products. Fresno, CA.
29 October – 3 November, 2000. 583-591.
Montross, M.D. 1999. Finite element modeling of stored grain ecosystems and alternative pest
control techniques. Doctoral dissertation.
Nakakita, H., T. Saito, and K. Iyatomi. 1974. Effect of phosphine on the respiration of adult
Sitophilus zeamais Motsch. (Coleoptera, Curculionidae). Journal of Stored Products
Research 10(2). 87-92.
National Agricultural Statistics Service (NASS). 2014. USDA Grain Stocks Report. United
States Department of Agriculture (USDA) Agricultural Statistics Board. ISSN: 1949-
0925.
Navarro, S. 1998. Pressure tests for gaseous applications in sealed storages: theory and practice.
Proceedings of the 7th International Working Conference on Stored Product Protection.
Beijing, China. 14-19 October, 1998. 385-390.
Newman, C. 2010. A novel approach to limit the development of phosphine resistance in
Western Australia. Julius-Kühn-Archiv(425): S. 1038.
Newman, C., J. Newman, H. Cheng, and Y. Ren. 2012. Investigation of thermosiphon pipes to
distribute phosphine gas through grain silos from a ground level introduction point.
Proceedings of the 9th International Conference on Controlled Atmosphere and
Fumigation in Stored Products. Sao Paulo, Brazil. 15-18 October, 2006. 557-570.
Newman, C., I. Lorini, B. Bacaltchuk, H. Beckel, D. Deckers, E. Sundfeld, J. d. Santos, J. Biagi,
J. Celaro and L. Faroni. 2006. Application of sealing technology to permanent grain
storage in Australia. Proceedings of the 9th International Conference on Controlled
120
Atmosphere and Fumigation in Stored Products. Sao Paulo, Brazil. 15-18 October, 2006.
1305-1315.
Newman, C. J. E.1990. Specification and design of enclosures for gas treatment. Fumigation and
Controlled Atmosphere Storage of Grain. 108-130.
National Institute for Occupational Safety and Health (NIOSH). 2016. Phosphine. NIOSH
Pocket Guide to Chemical Hazards. http://www.cdc.gov/niosh/npg/npgd0505.html.
Accessed July 6, 2016.
Noyes, R., S. Navarro, and D. Armitage. 2002. Supplemental aeration systems. The Mechanics
and Physics of Modern Grain Aeration Management. Eds. Navarro, S., and R.T. Noyes.
Boca Raton, FL. CRC Press. 413-488.
Noyes, R.T. and T.W. Phillips. 2007. A model for selecting tablet vs pellet dosages in storages
with closed loop fumigation (CLF) systems. Proceedings of the International Conference
on Controlled Atmosphere and Fumigation in Stored Products. Gold-Coast, Australia. 8-
13 August, 2004. 393-401.
Noyes, R.T., T.W. Phillips, G.W. Cuperus, E.L. Bonjour. 1999. Guidelines for sealing steel grain
bins for fumigation. Proceedings of the 7th International Working Conference of Stored
Product Protection. Beijing, China. 14-19 October, 1998. 1565-1569.
Noyes, R.T., T.W. Phillips, G.W. Cuperus, and E.L. Bonjour. 1998. Advances in recirculation
fumigation technology in the U.S.A. Proceedings of the 7th International Working
Conference on Stored-Product Protection. Beijing, China. 14-19 October, 1998. 454-461.
Noyes, R.T., J. Subbiah, J.T. Criswell, T. Phillips and M. Toews. 2000. Phosphine fumigation
failures in concrete silos in the southwestern U.S.A. Proceedings of the International.
Conference on Controlled Atmosphere and Fumigation in Stored Products. 438-495.

121
Obaldo, L.G., J.P. Hamer, H.H. Converse. 1991. Prediction of moisture changes in stored corn.
Transactions of the ASAE. 34(4). 1850-1858.
Opit, G. P., T. W. Phillips, M. J. Aikins and M. M. Hasan. 2012. Phosphine Resistance in
Tribolium castaneum and Rhyzopertha dominica from stored wheat in Oklahoma. Journal
of Economic Entomology 105(4). 1107-1114.
Pixton, S.W., and Griffiths, H.J. 1971. Diffusion of moisture through grain. Journal of Stored
Products Research. 18(1). 133-152.
Price, L.A. and K.A. Mills. 1988. The toxicity of phosphine to the immature stages of resistant
and susceptible strains of some common stored product beetles, and implications for their
control. Journal of Stored Products Research. 24(1). 51-59.
Prickett, A. J. 1987. Maintaining insecticide susceptibility in stored grain pests. Proceedings of
the 4th International Working Conference on Stored Product Protection. Tel Aviv, Israel.
21-26 September, 1986. 407-417.
Rajendran, S. 2000. Inhibition of hatching of Tribolium castaneum by phosphine. Journal of
Stored Products Research. 36(2). 101-106.
Rauscher, H., Mayr, G.E. and Sullivan, J.B., 1972. Sorption and recovery of phosphine. Journal
of Agricultural and Food Chemistry. 20(2). 331-333.
Reed, C. 1992. Development of Storage Techniques: A Historical Perspective. Storage of Cereal
Grains and Their Products. ed. D. B. Sauer. St. Paul, MN. AACC, Inc. 143-158.
Reed, C. and H. Pan. 1999. Loss of phosphine from unsealed bins of wheat at six combinations
of grain temperature and grain moisture content. Journal of Stored Products Research.
36(3). 263-279.

122
Reserve Bank of Australia (RBA). 2016. Inflation calculator.
http://www.rba.gov.au/calculator/annualDecimal.html. Accessed 6/27/16.
Scheffrahn, R.H., R.C. Hsu, W.L.A. Osbrink, and N.Y. Su. 1989. Fluoride and sulfate residues in
foods fumigated with sulfuryl fluoride. Journal of Agricultural and Food Chemistry.
37(1). 203-206.
Schlipalius, D.I., Chen, W., Collins, P.J., Nguyen, T., Reilly, P.E.B. and Ebert, P.R., 2008. Gene
interactions constrain the course of evolution of phosphine resistance in the lesser grain
borer, Rhyzopertha dominica. Heredity. 100(5). 506-516.
Sheeran, J. 2012. So we all may eat: Reflections on a food nutrition paradigm for the 21st
century. International Food Policy Research Institute 22nd Annual Martin J. Forman
Memorial Lecture December 4, 2012.
Sigaut, F. 1980. Significance of underground storage in traditional systems of grain production.
Controlled Atmosphere Storage of Grains. 3-13.
Singh, S., D. Singh, N. Wig, I. Jit, B. Sharma. 1996. Aluminum phosphide ingestion – A clinic-
pathologic study. Clinical Toxicology. 34(6). 703-706.
Sriranjini, V. and S. Rajendran. 2008. Sorption of sulfuryl fluoride by food commodities. Pest
Management Science. 64(8). 873-879.
Subramanyam, B. and D. W. Hagstrum. 2011. Modern perspectives on stored-product insect pest
management. Stewart Postharvest Review. 7(3). 1-3.
Subramanyam, B. and P.K. Harein. 1990. Status of malathion and pirimiphos-methyl resistance
in adults of red flour beetle and sawtoothed grain beetle infesting farm-stored corn in
Minnesota. Journal of Agricultural Entomology. 7(2). 127-136.

123
Sudakin, D.L. 2005. Occupational exposure to aluminum phosphide and phosphine gas? A
suspected case report and review of the literature. Human and Experimental Toxicology.
24(1). 27-33.
Thorpe, G.R. 1982. Moisture diffusion through bulk grain subjected to a temperature gradient.
Journal of stored products research. 18(1). 9-12.
Van Graver, J., and R.G. Winks. 1994. A brief history of the entomological problems of wheat
storage in Australia. Proceedings of the 6th International Working Conference on Stored-
Product Protection. Canberra, Australia. 17-23 April, 1994. 17-23.
Warrick, C. 2011. Fumigating with phosphine, other fumigants, and controlled atmospheres. A
grains industry guide. GRDC Grain Storage Extension Project.
Winks, R.G. 1987. Strategies for effective use of phosphine as a grain fumigant – implications of
resistance. Proceedings of the 4th International Working Conference on Stored Product
Protection. September 1986. Tel Aviv, Israel. 21-26 September, 1986. 335-344.
Winks, R.G. 1992. The development of SIROFLO® in Australia. Proceedings of the
International Conference on Controlled Atmosphere and Fumigation. 399-410.
Xiaoping, Y., Zhanggui, Q., Daolin, G., and Wanwu, L. 2004. Adsorption of phosphine by
wheat, paddy and corn. Proceedings of the International Conference on Controlled
Atmosphere and Fumigation in Stored Products. Gold-Coast Australia. 8-13 August,
2004. 393-401.

124
Appendix A - Australian Standard for Sealed Silos
(AS2628-2010)
Foreword
Phosphine fumigation is commonly used to control insect pests in grain. The
grains industry should retain this product in order to deliver insect and residue-free
grain. Alternatives to phosphine are more expensive, more difficult to use, and some
are less acceptable to markets.
The future availability and effectiveness of phosphine as a grain treatment is
under threat on two fronts: (a) Insect resistance to phosphine is being found more
frequently—all stages of the resistant insects can survive fumigation in unsealed
silos. (b) If phosphine’s good-safety record is not upheld, it could be withdrawn from
some uses, including on-farm use.
The continued use of phosphine is vital to growers and others in the grains
industry. It is the fumigation treatment preferred by most markets and no other
treatment is as cost effective and easy to apply; however, insects resistant to
phosphine are being found with increasing frequency. Using phosphine in unsealed
silos will not kill all insects and will only lead to further selection of resistant insect
strains. The use of sealed silos for effective fumigation is a key issue if phosphine is
to be kept as a useful and active product in the long term.
Fumigation in a sealed silo passing a pressure test keeps the phosphine
concentration high for long enough to control all known resistant insects.
A silo sealed to the standards required of phosphine treatment has the
additional advantages that it may help protect fumigated grain from reinfestation and
that it is available for treatment by carbon dioxide as used for “organic grain”.
125
Where air inflow is incorporated (aeration) for grain conditioning during
storage, a screen mesh should be used on air inlets and outlets to retain the integrity
of the silos’ insect-proof seal.

126
Appendix B - Fumigation Concentration Data
Figure 6.1 PH3 concentration data from trial 1 on August 24-29, 2015 in the SCAFCO silo.
1 2 3 4 5 1 2 3 4 1 2 3 4 1 2 3 4 1 2 3 4
1 2 3 4 5 6 7 8 9 10 11 12 13 14 15 16 17 18 19 20 21 22 23 1 2 3 4 5 1 2 3 4 5
8/24/15 10:45 AM 35 272 0 0 0 9 19 0 0 0 15 0 0 0 15 0 0 0 14 0 0 0 23 4.52381 7 3.75 3.75 3.5 5.75 0 0 0 1.8 17.2
8/24/15 11:40 AM 56 228 0 0 0 29 42 0 0 0 40 0 0 0 47 0 0 4 43 0 0 4 49 12.28571 17.75 10 11.75 11.75 13.25 0 0 0 7.4 44.2
8/24/15 12:40 PM 100 284 0 0 0 61 73 0 0 17 77 0 0 16 88 8 2 27 77 0 0 26 78 26.19048 33.5 23.5 26 28.5 26 0 1.6 0.4 29.4 78.6
8/24/15 2:15 PM 122 370 0 0 13 87 98 0 2 39 102 0 0 47 115 13 3 56 106 0 3 53 104 40.04762 49.5 35.75 40.5 44.5 40 0 2.6 4.2 56.4 105
8/24/15 3:40 PM 389 735 5 4 41 122 130 5 9 69 132 4 4 85 127 20 10 89 135 5 9 84 142 58.61905 74.25 53.75 55 63.5 60 5 7.6 14.6 89.8 133.2
8/24/15 4:47 PM 220 945 9 4 55 142 162 4 16 89 150 5 7 90 140 28 16 101 150 5 16 106 160 69.28571 90.75 64.75 60.5 73.75 71.75 9 9.2 22 105.6 152.4
8/24/15 5:40 PM 194 1440 7 4 81 171 180 4 30 116 181 5 14 135 183 36 29 137 182 13 28 135 185 88.38095 109 82.75 84.25 96 90.25 7 12.4 36.4 138.8 182.2
8/24/15 6:45 PM 181 1300 9 4 100 181 179 5 42 136 179 6 19 155 179 19 37 153 178 19 39 157 168 93.52381 116 90.5 89.75 96.75 95.75 9 10.6 47.4 156.4 176.6
8/24/15 7:20 PM 160 176 600 8 107 170 163 4 46 142 163 6 21 160 164 49 43 163 166 25 42 160 162 122.0952 112 88.75 87.75 105.25 97.25 600 18.4 51.8 159 163.6
8/24/15 9:13 PM 142 268 565 10 97 159 154 4 15 129 153 7 11 149 135 42 42 156 145 148 38 147 139 116.4286 105 75.25 75.5 96.25 118 565 42.2 40.6 148 145.2
8/24/15 10:20 PM 128 128 815 845 96 139 123 745 115 116 95 158 99 133 103 134 69 139 131 128 37 128 120 212.7619 300.75 267.75 123.25 118.25 103.25 815 402 83.2 131 114.4
8/24/15 11:30 PM 120 139 765 730 100 108 120 745 450 105 78 314 388 93 86 208 160 123 119 410 240 113 108 264.9048 264.5 344.5 220.25 152.5 217.75 765 481.4 267.6 108.4 102.2
8/25/15 6:00 AM 199 195 384 402 565 292 256 474 505 408 310 266 290 420 414 168 218 250 152 274 388 264 149 326.1429 378.75 424.25 347.5 197 268.75 384 316.8 393.2 326.8 256.2
8/25/15 8:20 AM 288 615 424 428 510 374 324 478 452 460 306 270 276 366 362 173 222 250 212 234 370 282 222 333.0952 409 424 318.5 214.25 277 424 316.6 366 346.4 285.2
8/25/15 8:50 AM 292 540 404 414 480 330 302 466 436 420 286 268 270 358 332 181 182 216 232 236 364 252 252 318.1429 381.5 402 307 202.75 276 404 313 346.4 315.2 280.8
8/25/15 9:36 AM 308 490 376 396 448 290 284 440 430 364 280 250 262 338 307 198 208 228 270 244 358 232 296 309.4762 354.5 378.5 289.25 226 282.5 376 305.6 341.2 290.4 287.4
8/25/15 11:00 AM 372 490 382 384 404 322 334 436 426 326 334 244 266 308 340 234 234 266 338 262 360 268 342 324.2857 361 380.5 289.5 268 308 382 312 338 298 337.6
8/25/15 12:15 PM 384 482 356 356 350 352 358 426 402 328 358 242 268 312 364 254 242 312 360 268 336 314 360 329.4286 354 378.5 296.5 292 319.5 356 309.2 319.6 323.6 360
8/25/15 1:20 PM 400 476 338 334 332 366 370 416 374 344 370 238 268 334 378 268 254 344 370 268 318 342 370 333.1429 350.5 376 304.5 309 324.5 338 304.8 309.2 346 371.6
8/25/15 3:00 PM 476 460 318 310 344 374 372 396 358 356 372 234 272 356 376 290 274 358 376 268 308 354 374 335.2381 350 370.5 309.5 324.5 326 318 299.6 311.2 359.6 374
8/25/15 4:00 PM 424 505 302 290 350 378 380 382 336 358 376 230 276 358 374 296 288 362 372 272 308 358 374 334.2857 349.5 363 309.5 329.5 328 302 294 311.6 362.8 375.2
8/25/15 5:00 PM 394 580 298 282 358 376 376 370 338 362 372 230 284 360 372 304 298 362 368 278 312 362 366 334.6667 348 360.5 311.5 333 329.5 298 292.8 318 364.4 370.8
8/25/15 6:40 PM 380 855 280 264 354 364 366 344 334 354 364 230 292 354 362 308 310 356 360 288 318 354 360 329.3333 337 349 309.5 333.5 330 280 286.8 321.6 356.4 362.4
8/25/15 7:45 PM 370 356 376 260 342 350 350 326 324 344 348 228 280 344 348 304 302 346 346 286 308 342 342 323.619 325.5 335.5 300 324.5 319.5 376 280.8 311.2 345.2 346.8
8/25/15 8:30 PM 350 342 446 284 328 334 330 314 306 326 328 222 256 328 328 292 284 330 330 276 292 326 326 313.619 319 318.5 283.5 309 305 446 277.6 293.2 328.8 328.4
8/25/15 9:45 PM 326 314 384 392 302 312 308 366 278 306 304 228 232 308 294 282 274 310 308 310 268 304 304 303.5238 328.5 313.5 265.5 293.5 296.5 384 315.6 270.8 308 303.6
8/25/15 10:45 PM 330 322 370 374 294 308 306 384 288 300 296 246 240 300 282 288 274 306 304 324 274 298 298 302.5714 320.5 317 267 293 298.5 370 323.2 274 302.4 297.2
8/25/15 11:30 PM 312 308 346 350 280 292 292 368 300 288 284 248 248 286 268 282 272 294 294 316 278 288 288 293.4286 303.5 310 262.5 285.5 292.5 346 312.8 275.6 289.6 285.2
8/26/15 7:00 AM 326 322 332 326 334 308 308 324 324 316 312 264 280 294 290 280 282 288 290 282 290 286 284 299.7143 319 319 282 285 285.5 332 295.2 302 298.4 296.8
8/26/15 8:00 AM 304 412 302 296 308 292 290 298 304 300 294 246 262 278 274 268 268 276 280 268 276 274 276 282.381 296.5 299 265 273 273.5 302 275.2 283.6 284 282.8
8/26/15 9:00 AM 304 284 292 292 302 288 286 302 302 298 292 248 262 280 274 274 272 278 282 266 278 276 276 281.9048 292 298.5 266 276.5 274 292 276.4 283.2 284 282
8/26/15 10:00 AM 310 296 292 302 300 292 286 308 306 300 290 252 262 274 278 276 268 280 284 274 276 278 284 283.9048 295 301 266.5 277 278 292 282.4 282.4 284.8 284.4
8/26/15 11:00 AM 294 288 278 278 286 278 272 290 286 282 280 242 254 264 264 268 260 276 278 266 268 270 278 272.2857 278.5 284.5 256 270.5 270.5 278 268.8 270.8 274 274.4
8/26/15 12:15 PM 296 284 278 274 280 282 282 290 286 282 280 242 252 264 278 270 262 276 278 262 268 272 280 273.2381 279.5 284.5 259 271.5 270.5 278 267.6 269.6 275.2 279.6
8/26/15 2:30 PM 278 272 272 270 280 280 278 288 280 280 278 244 256 274 278 272 266 278 276 266 268 276 274 273.0476 277 281.5 263 273 271 272 268 270 277.6 276.8
8/26/15 4:45 PM 270 276 266 262 274 264 260 276 270 268 258 238 254 262 258 264 260 262 256 258 260 260 254 261.1429 265 268 253 260.5 258 266 259.6 263.6 263.2 257.2
8/26/15 7:15 PM 258 264 258 254 258 248 246 264 258 252 244 236 250 248 244 256 252 244 242 252 252 244 240 249.619 251.5 254.5 244.5 248.5 247 258 252.4 254 247.2 243.2
8/26/15 9:45 PM 244 242 254 244 238 232 226 246 240 234 232 224 226 230 230 238 234 228 230 240 234 228 226 234 235 238 227.5 232.5 232 254 238.4 234.4 230.4 228.8
8/27/15 7:30 AM 224 222 220 212 212 206 202 210 208 212 206 200 202 202 202 200 200 202 204 199 202 204 202 205.0952 208 209 201.5 201.5 201.75 220 204.2 204.8 205.2 203.2
8/27/15 9:00 AM 214 195 218 206 204 204 199 202 202 200 202 194 197 197 199 197 197 200 202 195 196 195 200 200.2857 203.25 201.5 196.75 199 196.5 218 198.8 199.2 199.2 200.4
8/27/15 10:45 AM 202 163 200 199 198 199 191 198 200 196 194 188 190 191 191 191 192 196 192 191 191 192 190 193.8095 196.75 197 190 192.75 191 200 193.4 194.2 194.8 191.6
8/27/15 4:15 PM 163 172 185 183 172 162 157 184 178 172 161 178 178 168 160 183 177 165 159 181 175 164 158 171.4286 168.5 173.75 171 171 169.5 185 181.8 176 166.2 159
8/27/15 9:30 PM 150 149 163 172 150 143 140 169 157 153 147 164 161 150 149 159 155 143 141 160 153 145 141 153.0952 151.25 156.5 156 149.5 149.75 163 164.8 155.2 146.8 143.6
8/28/15 5:00 PM 114 113 116 115 113 112 109 116 113 112 111 112 113 112 111 114 113 111 111 113 112 111 110 112.381 112.25 113 112 112.25 111.5 116 114 112.8 111.6 110.4
8/29/15 4:00 PM 91 81 82 82 84 87 85 86 85 84 86 78 80 82 84 84 83 87 87 82 82 84 87 83.85714 84.5 85.25 81 85.25 83.75 82 82.4 82.8 84.8 85.8
Avg of all points at a height
Level (1 is bottom, 5 is top)
Avg of all
points in
bin
Avg of all points in a line
Line
Date
Location
Line 1 Line 2 Line 3 Line 4 Line 5Headspace Bottom

127
Figure 6.2 PH3 concentration data from trial 1 on August 24-29, 2015 in the Bird’s silo.
1 2 3 4 5 1 2 3 4 1 2 3 4 1 2 3 4 1 2 3 4
1 2 3 4 5 6 7 8 9 10 11 12 13 14 15 16 17 18 19 20 21 22 23
8/24/15 10:45 AM 19 945 2 0 0 0 9 0 0 0 9 0 0 0 7 0 0 0 14 0 0 0 16
8/24/15 11:40 AM 80 1020 4 3 3 31 59 0 0 0 69 0 0 0 70 0 0 0 67 0 0 0 62
8/24/15 12:40 PM 118 955 4 3 5 102 126 3 3 16 108 3 2 21 128 2 3 21 136 3 2 18 122
8/24/15 2:15 PM 164 1040 3 4 29 149 160 4 4 62 143 4 4 77 162 6 4 75 165 5 4 63 155
8/24/15 3:40 PM 180 1670 10 5 83 172 175 5 3 115 170 8 5 128 165 7 5 126 178 0 5 103 160
8/24/15 4:47 PM 171 1628 15 9 93 170 179 7 5 133 155 14 8 131 161 7 6 130 167 3 5 130 184
8/24/15 5:40 PM 202 2000 9 7 119 192 202 8 6 144 200 20 13 152 197 11 11 156 198 5 9 155 194
8/24/15 6:45 PM 182 1910 190 10 121 187 180 10 6 144 180 24 15 155 183 15 15 159 181 5 13 166 179
8/24/15 7:30 PM 174 276 1340 10 122 180 172 11 8 144 171 26 16 152 175 19 18 164 173 5 15 165 174
8/24/15 9:30 PM 160 166 1420 177 92 165 160 37 10 105 147 30 20 106 150 20 24 151 153 484 20 149 125
8/24/15 10:42 PM 151 153 1290 655 69 146 145 117 30 76 130 32 30 71 135 248 26 142 145 890 106 117 114
8/24/15 11:55 PM 142 145 1150 970 60 118 118 208 121 53 123 42 76 47 126 334 181 137 138 975 306 95 120
8/25/15 6:00 AM 137 138 835 835 775 230 176 268 418 448 133 82 218 324 134 220 392 240 128 515 615 262 129
8/25/15 8:30 AM 250 1410 755 760 750 334 278 187 374 476 184 109 191 324 186 228 364 272 181 372 570 338 184
8/25/15 9:15 AM 294 1020 590 705 705 334 288 164 338 464 218 120 174 320 214 144 256 276 230 346 535 350 250
8/25/15 10:03 AM 334 855 406 615 655 328 318 162 300 450 308 138 162 318 298 152 232 288 320 352 530 388 332
8/25/15 11:30 AM 374 880 272 484 585 346 362 179 270 414 362 168 162 306 366 175 214 300 364 372 525 420 360
8/25/15 12:45 PM 400 1070 210 374 478 368 378 195 252 374 386 188 170 320 390 199 212 326 390 374 510 392 380
8/25/15 1:50 PM 422 960 192 314 406 402 408 212 252 374 400 214 192 372 426 222 224 368 422 352 476 376 408
8/25/15 3:20 PM 434 1050 192 268 382 420 426 222 252 390 420 220 206 392 424 230 236 390 424 320 428 388
8/25/15 4:15 PM 430 1220 193 252 386 424 424 226 250 396 418 224 214 398 424 236 240 398 424 302 396 396 422
8/25/15 5:15 PM 432 1570 191 238 390 420 422 228 250 400 420 222 224 400 422 244 248 402 422 278 268 402 416
8/25/15 7:00 PM 422 2000 196 224 380 410 410 226 248 392 408 232 232 392 410 254 260 398 408 250 334 398 408
8/25/15 8:00 PM 400 404 1700 220 370 392 386 224 240 380 386 234 228 378 390 252 260 386 386 232 312 388 386
8/25/15 9:00 PM 376 374 995 202 348 370 366 216 228 356 364 222 218 354 364 254 250 368 364 306 284 366 344
8/25/15 10:00 PM 360 360 785 360 322 354 352 222 214 328 340 220 214 316 344 302 246 346 348 555 266 336 324
8/25/15 11:15 PM 354 352 710 515 304 332 336 240 214 306 328 214 214 288 334 334 258 330 342 630 296 312 312
8/25/15 11:45 PM 342 342 660 560 288 314 318 248 220 280 284 318 206 216 266 342 274 314 334 625 326 296 308
8/26/15 7:15 AM 322 322 454 454 464 316 308 248 302 344 306 228 252 294 304 308 338 318 308 366 436 316 302
8/26/15 8:15 AM 318 890 432 418 440 320 312 232 284 334 302 232 250 288 302 296 322 314 306 322 406 322 304
8/26/15 9:15 AM 330 530 338 392 422 324 308 234 280 332 304 242 250 292 310 304 324 320 314 310 392 328 310
8/26/15 10:10 AM 340 408 290 364 408 330 332 246 268 334 320 252 252 296 320 296 306 320 328 310 384 334 326
8/26/15 11:15 AM 334 386 260 330 386 326 328 246 264 326 324 240 252 292 326 294 300 316 328 306 372 332 326
8/26/15 12:30 PM 334 360 250 308 368 328 328 252 262 322 328 242 258 302 330 296 298 318 330 308 364 334 328
8/26/15 2:45 PM 328 336 240 286 328 326 326 260 266 320 322 240 264 318 324 300 298 322 322 298 344 324 322
8/26/15 5:00 PM 308 336 234 268 318 308 304 250 262 312 304 212 264 310 304 292 292 312 306 280 320 310 304
8/26/15 7:30 PM 294 340 220 256 302 292 292 236 254 296 288 214 256 294 288 290 282 294 288 264 308 296 286
8/26/15 10:00 PM 274 276 322 232 278 272 270 220 232 272 262 204 234 270 268 262 270 272 268 240 266 262 254
8/27/15 8:00 AM 248 272 242 232 224 226 216 226 185 206 232 182 196 214 240 236 234 236 244 238 236 204 226
8/27/15 9:30 AM 242 210 196 212 220 226 240 187 185 206 234 178 197 214 240 232 228 234 240 228 228 206 236
8/27/15 11:15 AM 234 195 181 202 216 232 232 143 197 214 234 228 224 230 232 226 224 230 230 218 220 212 230
8/27/15 4:45 PM 197 167 160 188 210 198 197 161 181 206 195 108 189 204 196 212 210 204 195 195 204 202 202
8/27/15 10:00 PM 175 175 129 164 184 173 174 143 159 179 168 122 162 180 172 186 188 178 173 168 181 164 168
8/28/15 5:35 PM 129 112 109 123 133 129 129 114 128 131 128 114 128 131 128 136 135 131 129 122 131 130 128
8/29/15 4:30 PM 101 85 82 87 91 99 100 88 88 92 100 97 95 98 100 96 96 97 100 77 77 91 99
Date
Location
Headspace BottomLine 1 Line 2 Line 3 Line 4 Line 5

128
Figure 6.3 PH3 concentration data from trial 2 on August 31-September 9, 2015 in the SCAFCO silo.
1 2 3 4 5 1 2 3 4 1 2 3 4 1 2 3 4 1 2 3 4
1 2 3 4 5 6 7 8 9 10 11 12 13 14 15 16 17 18 19 20 21 22 23
8/31/15 11:15 AM 17 1080 5 3 10 0 14 11 5 11 4 15 7 9 13 16 14 4 29 17 12 8 22
8/31/15 1:00 PM 750 960 10 7 8 101 143 17 12 13 146 14 8 17 182 22 12 33 163 16 11 27 160
8/31/15 2:30 PM 1130 1110 12 8 58 220 280 9 12 83 238 13 8 114 278 10 13 158 278 14 15 135 278
8/31/15 4:00 PM 378 1230 13 10 155 320 348 14 56 163 340 14 28 208 344 12 64 260 342 17 58 242 352
8/31/15 5:15 PM 390 1400 13 10 250 364 378 11 137 244 374 22 87 286 378 23 144 324 380 20 141 314 378
8/31/15 6:00 PM 386 1470 14 13 290 370 388 15 194 276 396 15 137 316 384 35 204 348 382 54 198 338 380
8/31/15 7:10 PM 414 1410 12 17 330 388 410 28 242 292 400 21 178 326 388 67 246 356 386 86 244 312 392
8/31/15 8:30 PM 426 2000 23 27 344 400 400 41 272 300 388 31 204 326 380 98 287 358 386 131 274 346 388
8/31/15 9:30 PM 380 2000 28 36 348 368 376 44 250 278 364 34 190 308 364 129 256 338 366 119 259 326 366
8/31/15 10:45 PM 332 2000 47 50 340 344 326 57 284 282 328 44 206 310 318 188 294 344 334 178 294 332 334
9/1/15 7:15 AM 294 2000 1200 1320 274 256 278 945 240 244 240 805 214 244 214 402 272 274 264 468 280 274 268
9/1/15 8:00 AM 294 1690 1120 1170 264 242 264 785 254 228 232 685 236 228 208 328 264 264 258 372 266 260 260
9/1/15 10:50 AM 456 700 775 640 286 434 448 378 250 268 442 346 250 260 446 318 268 380 444 280 266 362 444
9/1/15 1:15 PM 456 484 442 368 434 430 414 318 346 386 422 290 290 386 424 272 368 430 410 270 362 424 408
9/1/15 2:15 PM 424 408 346 310 418 380 390 296 398 388 384 272 350 386 384 296 404 396 380 298 402 394 380
9/1/15 3:30 PM 386 406 306 314 390 374 368 304 396 368 368 272 376 368 362 330 392 374 364 338 394 374 362
9/1/15 4:45 PM 370 420 310 340 374 358 356 326 382 360 356 284 374 354 352 344 376 358 352 354 378 360 350
9/1/15 6:30 PM 368 448 350 374 364 356 354 354 368 354 350 312 362 346 346 356 358 348 344 364 358 346 342
9/1/15 8:40 PM 348 505 352 366 344 336 328 348 340 336 328 322 336 328 324 342 334 328 322 346 334 330 322
9/1/15 10:10 PM 332 482 356 356 332 322 318 344 330 330 318 326 328 320 314 332 324 318 308 336 322 320 308
9/2/15 12:00 AM 322 438 348 346 320 308 306 336 320 320 308 322 320 312 306 324 316 308 296 326 314 296
9/2/15 7:30 AM 292 290 306 306 282 282 282 302 286 290 284 292 286 284 282 288 278 278 276 288 276 278 274
9/2/15 9:10 AM 282 248 296 302 274 274 264 292 276 280 274 280 280 278 274 278 278 272 266 280 270 274 268
9/2/15 10:20 AM 276 274 292 288 270 268 264 284 274 268 268 276 270 272 264 272 266 266 260 278 266 268 260
9/2/15 2:50 PM 258 248 268 256 256 250 248 268 256 258 248 262 260 254 246 260 254 252 246 260 254 250 246
9/2/15 4:45 PM 240 242 258 252 242 236 234 254 244 242 234 252 246 240 232 250 242 236 232 248 242 236 230
9/2/15 7:15 PM 236 220 250 246 234 230 230 246 234 234 228 244 232 230 226 240 230 226 220 238 228 228 226
9/2/15 9:30 PM 228 200 242 236 226 224 220 234 222 224 218 232 222 222 216 226 220 218 294 220 218 218 214
9/3/15 1:00 AM 216 214 230 224 214 210 210 222 216 210 212 220 214 214 210 216 212 210 204 214 210 208 204
9/2/15 9:00 AM 202 184 200 199 195 196 195 192 194 194 193 184 191 192 191 189 190 191 191 189 189 190 189
9/2/15 10:30 AM 192 175 197 191 191 190 188 189 189 189 188 183 188 188 185 186 187 187 186 186 186 186 185
9/2/15 12:00 PM 182 164 191 189 187 184 174 188 187 185 182 181 188 185 183 190 189 187 183 187 186 183 181
9/2/15 1:00 PM 175 171 188 182 183 179 170 183 183 176 171 180 183 181 178 185 184 182 175 182 183 179 171
9/2/15 2:00 PM 177 175 182 179 182 175 166 172 173 171 167 176 177 175 166 176 171 177 170 172 171 169 167
9/2/15 3:00 PM 168 163 180 176 173 165 163 171 169 168 164 168 169 170 163 169 168 171 165 171 168 166 165
9/4/15 1:50 PM 118 113 125 125 123 121 121 126 124 123 121 124 124 123 120 125 124 122 119 124 122 122 119
9/6/15 3:00 PM 58 56 59 58 59 56 56 58 57 57 55 57 57 56 56 58 57 56 56 57 57 55 55
9/9/15 11:30 AM 23 22 23 23 23 23 23 23 23 23 23 21 22 22 23 22 23 23 22 22 22 22 22
Date
Location
Line 1 Line 2 Line 3 Line 4 Line 5Headspace Bottom

129
Figure 6.4 PH3 concentration data from trial 2 on August 31-September 9, 2015 in the Bird’s silo.
1 2 3 4 5 1 2 3 4 1 2 3 4 1 2 3 4 1 2 3 4
1 2 3 4 5 6 7 8 9 10 11 12 13 14 15 16 17 18 19 20 21 22 23
8/31/15 12:01 PM 96 1660 25 18 20 25 73 18 19 16 92 21 28 20 94 20 24 16 92 11 11 14 97
8/31/15 1:30 PM 204 1740 25 20 23 155 196 22 20 39 180 21 25 48 210 19 23 48 214 13 14 41 210
8/31/15 2:55 PM 324 1970 24 20 73 256 282 19 19 154 278 18 23 169 294 20 28 171 286 15 15 154 294
8/31/15 4:15 PM 360 2000 24 23 165 306 324 18 23 258 344 23 30 262 334 19 32 260 342 16 28 254 348
8/31/15 5:30 PM 372 2000 23 24 232 354 392 21 37 294 368 19 52 298 374 22 63 300 376 18 58 296 384
8/31/15 6:30 PM 390 2000 30 28 262 370 378 22 55 316 368 24 75 274 384 30 93 324 394 20 86 320 398
8/31/15 7:30 PM 388 2000 20 36 288 382 388 33 77 334 382 30 100 340 382 36 124 348 388 22 114 340 396
8/31/15 9:00 PM 356 2000 28 46 306 368 356 49 100 340 356 54 126 346 360 51 159 360 354 25 143 348
8/31/15 9:50 PM 342 2000 44 44 282 346 336 48 92 334 336 61 134 342 344 79 171 356 336 28 152 344 334
8/31/15 11:10 PM 308 2000 412 50 304 316 302 74 121 330 306 72 149 334 310 106 192 340 308 65 168 324 302
9/1/15 7:45 AM 264 2000 1960 452 238 222 244 199 159 234 244 123 165 248 250 376 230 256 254 1050 274 206 238
9/1/15 8:10 AM 292 2000 1520 442 230 214 246 191 160 228 254 121 165 242 252 352 230 248 260 1010 276 204 250
9/1/15 11:20 AM 515 2000 1320 368 224 218 242 164 140 234 254 114 166 322 250 316 224 226 248 785 248 204 424
9/1/15 1:25 PM 545 1570 214 224 450 515 525 185 226 398 505 151 248 505 535 238 276 498 535 406 266 486 515
9/1/15 2:40 PM 535 1290 194 238 494 530 530 196 294 515 515 161 332 525 530 246 364 520 525 302 348 505 525
9/1/15 4:00 PM 520 1606 197 286 510 520 525 222 362 520 525 182 396 520 515 280 426 515 515 272 410 510 515
9/1/15 5:00 PM 515 1480 208 324 510 520 515 248 400 515 505 204 424 510 510 306 452 510 510 276 438 510 515
9/1/15 6:40 PM 515 1830 246 378 500 500 505 294 436 500 498 246 446 498 494 354 468 498 500 306 460 498 500
9/1/15 8:50 PM 478 2000 266 398 480 474 466 324 438 476 464 284 436 474 462 378 462 474 462 336 456 468 458
9/1/15 10:30 PM 444 2000 346 404 468 444 432 334 430 458 430 288 422 452 422 384 454 456 428 360 448 438 420
9/2/15 12:10 AM 420 905 410 408 458 424 414 344 426 436 412 286 414 432 398 404 446 434 410 422 440 406 398
9/2/15 7:50 AM 380 386 610 386 382 370 374 344 374 358 364 274 350 352 348 444 390 376 370 625 380 340 356
9/2/15 9:30 AM 404 1560 416 372 368 362 378 330 362 350 374 252 340 342 358 416 378 370 378 580 370 340 380
9/2/15 10:35 AM 422 1190 352 364 362 382 396 322 356 350 394 240 328 340 388 394 362 362 394 525 360 344 392
9/2/15 3:00 PM 408 610 322 358 406 406 402 316 360 406 400 226 346 406 402 358 380 408 398 376 374 402 398
9/2/15 5:00 PM 276 560 314 362 390 378 374 314 374 382 370 230 362 382 372 352 384 380 370 348 382 380 372
9/2/15 7:25 PM 358 575 322 370 368 356 354 324 368 358 350 262 358 358 350 356 368 356 350 354 368 354 348
9/2/15 9:45 PM 340 855 308 352 342 336 334 314 344 336 332 280 334 332 322 342 346 338 330 344 344 332 328
9/3/15 1:10 AM 320 350 346 334 326 318 316 298 324 312 308 272 314 304 288 326 328 322 312 338 322 298 302
9/3/15 9:25 AM 300 298 272 292 290 294 296 262 278 274 294 242 268 264 288 298 292 292 292 306 280 276 290
9/3/15 10:45 AM 292 278 268 286 286 290 290 258 272 284 288 234 262 276 286 288 288 290 286 292 278 282 286
9/3/15 12:20 PM 282 292 268 284 286 282 276 258 274 276 278 236 264 280 278 300 296 300 290 296 276 282 278
9/3/15 1:20 PM 268 282 264 276 282 274 264 254 270 272 270 220 258 274 274 286 284 290 278 286 276 280 278
9/3/15 2:20 PM 260 262 262 268 272 264 256 240 268 268 266 216 258 272 264 274 284 276 272 280 274 268 268
9/3/15 3:20 PM 254 252 260 260 268 262 252 240 262 262 258 210 258 264 258 268 274 270 264 278 274 266 258
9/4/15 2:00 PM 177 172 176 186 182 178 176 172 183 179 175 160 179 179 176 187 184 179 176 183 184 178 175
9/6/15 3:20 PM 68 72 73 73 71 69 69 72 72 70 69 64 70 70 68 75 72 70 69 74 72 70 68
9/9/15 12:10 PM 27 27 26 26 27 27 27 25 26 27 27 25 26 27 27 27 27 27 27 27 26 27 27
Date
Location
Headspace BottomLine 1 Line 2 Line 3 Line 4 Line 5

130
Figure 6.5 PH3 concentration data from trial 3 on September 18-24, 2015 in the SCAFCO silo.
1 2 3 4 5 1 2 3 4 1 2 3 4 1 2 3 4 1 2 3 4
1 2 3 4 5 6 7 8 9 10 11 12 13 14 15 16 17 18 19 20 21 22 23
9/18/2015 10:00 11 240 0 0 0 3 9 0 0 0 2 0 0 0 3 0 0 0 9 0 0 0 8
9/18/2015 11:30 9 89 3 0 0 7 9 0 0 0 5 0 0 0 6 0 0 3 9 0 0 0 9
9/18/2015 12:30 8 51 8 0 2 8 8 0 0 0 6 0 0 0 7 0 0 7 8 0 0 2 8
9/18/2015 13:45 8 40 82 0 5 7 7 5 0 0 4 0 0 0 4 0 2 7 7 0 0 3 7
9/18/2015 14:45 7 30 200 3 6 6 6 15 0 0 0 3 0 0 2 0 3 7 7 3 0 3 6
9/18/2015 16:45 6 25 565 24 7 3 4 81 2 0 0 15 0 0 0 0 4 0 6 8 3 3 5
9/18/2015 18:00 5 21 750 80 7 3 4 138 3 0 2 29 2 0 0 0 5 5 5 9 4 3 5
9/18/2015 21:45 4 17 1170 414 8 4 5 292 38 9 5 77 19 4 3 6 5 5 17 5 3 3
9/18/2015 23:00 4 15 1090 550 8 6 5 306 78 16 7 80 38 9 5 8 5 5 4 23 6 4 4
9/19/2015 9:00 57 12 1070 705 236 142 89 153 496 286 169 76 168 192 149 27 25 23 36 29 54 27 34
9/19/2015 11:00 68 54 735 590 236 164 102 159 480 312 220 70 133 165 143 42 32 35 48 33 65 35 43
9/19/2015 12:45 80 65 635 412 206 163 97 175 436 324 246 68 106 140 129 50 37 45 58 35 65 40 50
9/19/2015 13:45 91 72 585 330 175 155 100 194 402 330 254 67 93 124 119 55 42 52 69 40 60 43 60
9/19/2015 15:15 108 75 625 276 148 140 105 218 360 330 244 67 86 112 110 62 48 61 89 46 58 47 80
9/19/2015 16:30 121 89 830 254 124 132 115 232 300 306 240 65 79 102 107 67 52 69 102 50 56 93 95
9/19/2015 18:30 133 105 970 308 95 142 131 276 224 266 252 70 75 94 104 76 59 88 115 58 54 59 104
9/19/2015 22:15 137 105 1010 458 101 152 139 296 236 192 191 81 94 84 93 103 77 109 120 84 62 82 116
9/20/2015 9:00 150 115 1000 765 282 173 147 216 466 310 202 126 183 224 204 119 113 113 122 118 118 108 121
9/20/2015 10:00 155 124 735 665 288 188 152 199 434 308 230 126 172 210 204 124 115 117 126 122 123 120 122
9/20/2015 11:00 164 151 880 620 290 210 167 216 442 336 272 131 163 200 202 132 121 124 130 124 131 118 125
9/20/2015 15:30 180 139 200 210 218 210 177 268 374 364 302 138 152 172 179 146 134 141 161 132 135 130 153
9/20/2015 16:45 182 152 195 175 195 200 178 264 304 338 286 137 147 165 173 147 136 145 166 133 134 131 159
9/20/2015 19:30 184 162 188 162 173 202 188 242 210 278 282 137 141 158 167 154 140 157 170 137 133 137 160
9/20/2015 21:45 185 166 555 175 163 199 188 216 177 222 240 136 138 148 158 158 144 161 167 142 133 142 161
9/21/2015 8:45 165 163 975 665 216 155 155 195 384 248 189 152 202 206 180 150 150 148 148 149 153 144 147
9/21/2015 10:00 157 161 780 575 230 164 155 190 364 272 204 149 194 208 188 145 145 143 127 144 149 142 142
9/21/2015 15:15 176 156 286 238 236 206 177 216 300 282 260 156 179 204 202 150 147 150 157 148 150 150 154
9/21/2015 20:00 180 150 198 174 189 192 180 206 200 230 234 150 157 182 188 153 148 159 167 149 146 150 161
9/23/2015 9:00 138 125 206 152 126 126 130 130 130 129 129 124 125 125 126 128 127 130 131 127 125 127 130
9/23/2015 16:45 127 127 134 129 121 124 123 128 127 122 123 121 120 119 122 123 121 123 123 122 120 121 121
9/24/2015 13:45 104 95 85 87 98 87 100 99 93 98 99 97 96 98 98 99 98 99 100 99 97 98 99
Date
Location
Headspace BottomLine 1 Line 2 Line 3 Line 4 Line 5

131
Figure 6.6 PH3 concentration data from trial 3 on September 18-24, 2015 in the Bird’s silo.
1 2 3 4 5 1 2 3 4 1 2 3 4 1 2 3 4 1 2 3 4
1 2 3 4 5 6 7 8 9 10 11 12 13 14 15 16 17 18 19 20 21 22 23
9/18/2015 10:15 47 1510 3 0 0 5 31 0 0 0 28 0 0 0 24 0 0 0 32 0 0 0 31
9/18/2015 11:45 86 785 3 0 0 50 87 0 0 0 84 0 0 3 90 0 0 2 84 0 0 0 81
9/18/2015 12:45 119 1500 4 2 14 90 119 0 0 13 115 0 0 23 114 0 0 17 105 0 0 6 114
9/18/2015 14:00 116 125 1670 5 34 91 110 0 0 20 99 0 0 41 108 2 0 34 106 14 0 10 81
9/18/2015 15:00 108 93 2000 8 43 70 99 14 0 20 78 0 3 45 101 44 4 39 97 310 4 10 55
9/18/2015 17:00 89 91 1710 214 39 22 65 284 8 12 66 14 5 38 87 468 11 36 85 1170 59 9 59
9/18/2015 18:15 78 79 2000 466 35 19 57 442 45 12 62 39 10 36 77 530 42 39 75 1280 218 13 57
9/18/2015 22:00 60 60 930 1060 54 44 47 730 378 57 55 111 103 32 57 585 336 40 57 1020 920 162 62
9/18/2015 23:15 59 59 895 895 109 112 75 625 500 130 59 118 170 42 52 460 444 53 55 815 920 316 67
9/19/2015 9:30 370 1260 565 745 650 476 400 240 366 356 306 193 208 236 304 224 342 258 312 366 680 498 316
9/19/2015 11:15 418 1060 318 530 570 460 414 234 298 344 350 264 216 258 338 272 288 276 368 336 630 525 380
9/19/2015 13:00 442 1100 254 378 474 428 426 254 270 338 390 300 240 284 380 314 272 296 404 312 540 515 414
9/19/2015 14:00 470 1020 254 320 416 420 450 276 272 334 434 314 264 304 434 342 280 312 446 302 468 490 446
9/19/2015 15:30 480 1340 268 296 374 444 472 292 280 332 458 344 292 322 466 360 292 328 468 294 398 456 466
9/19/2015 16:45 486 685 785 290 362 446 470 296 284 330 454 312 310 332 460 372 304 336 460 286 348 422 452
9/19/2015 18:45 458 460 1860 308 346 396 426 282 282 312 382 310 318 332 414 374 316 338 414 368 306 360 376
9/19/2015 22:30 392 392 905 912 322 304 344 380 368 288 354 310 318 330 376 408 404 338 370 685 785 308 334
9/20/2015 9:15 408 408 610 505 488 420 416 326 344 358 378 346 326 334 376 366 368 356 378 360 438 400 376
9/20/2015 10:30 424 605 424 462 464 426 418 344 346 362 388 372 344 352 392 380 376 368 396 366 448 414 392
9/20/2015 11:15 428 630 344 394 440 424 418 336 350 364 392 318 358 360 390 390 374 375 400 354 438 418 398
9/20/2015 15:45 432 595 328 354 394 416 424 364 362 370 416 343 376 382 418 408 386 386 418 344 376 396 414
9/20/2015 17:00 426 775 324 350 384 406 414 354 360 366 404 310 372 376 406 400 382 380 406 336 362 378 400
9/20/2015 19:45 408 408 645 336 368 368 386 318 342 354 374 294 350 368 386 388 374 372 385 338 346 330 322
9/20/2015 22:00 386 386 490 388 358 336 358 302 322 342 364 318 334 360 376 382 372 368 372 378 374 318 306
9/21/2015 9:00 330 330 344 324 332 328 322 276 286 294 314 268 290 306 318 322 322 324 318 272 312 308 308
9/21/2015 10:15 320 320 332 306 318 314 310 266 276 289 304 272 280 296 310 314 314 316 310 254 302 300 302
9/21/2015 15:30 320 288 254 278 306 308 310 276 284 286 302 250 292 296 308 314 312 312 312 252 288 294 302
9/21/2015 20:15 302 302 250 256 286 286 294 256 268 274 288 240 278 286 294 300 294 298 296 238 264 262 276
9/23/2015 9:30 192 171 163 171 190 183 190 174 170 174 187 177 183 191 191 196 195 195 192 174 184 181 188
9/23/2015 17:00 177 158 159 170 179 177 175 168 172 175 175 162 178 179 175 183 182 181 174 169 171 171 177
9/24/2015 14:00 145 129 127 134 138 137 144 134 132 133 144 126 140 143 145 148 147 147 145 124 136 133 143
Date
Location
Headspace BottomLine 1 Line 2 Line 3 Line 4 Line 5

132
Figure 6.7 SF concentration data from trial 4 on April 1-6, 2016 in the SCAFCO silo.
1 2 3 4 5 1 2 3 4 1 2 3 4 1 2 3 4 1 2 3 4
1 2 3 4 5 6 7 8 9 10 11 12 13 14 15 16 17 18 19 20 21 22 23
4/1/16 1:30 PM 0 57121.52 30098.83 851.8536 118.313 0 0 4685.195 0 0 0 2366.26 0 0 0 3076.138 0 0 0 4353.918 0 0 0
4/1/16 2:30 PM 47.3252 0 3312.764 0 0 0 0 3857.004 0 70.9878 0 0 0 0 0 2934.162 0 0 0 3857.004 0 0 0
4/1/16 4:00 PM 47.3252 6507.215 6696.516 47.3252 23.6626 23.6626 23.6626 3289.101 47.3252 354.939 141.9756 2531.898 94.6504 23.6626 0 1632.719 0 0 0 3005.15 0 94.6504 0
4/1/16 6:00 PM 118.313 3880.666 2176.959 0 0 0 0 1869.345 0 354.939 331.2764 1751.032 94.6504 307.6138 0 946.504 0 0 0 1893.008 0 283.9512 0
4/1/16 8:00 PM 141.9756 0 0 94.6504 473.252 709.878 591.565 1774.695 0 0 0 1490.744 0 236.626 307.6138 1490.744 236.626 260.2886 0 2366.26 0 0 94.6504
4/1/16 10:00 PM 260.2886 260.2886 165.6382 354.939 709.878 449.5894 496.9146 47.3252 212.9634 567.9024 544.2398 473.252 94.6504 94.6504 141.9756 0 0 0 0 118.313 189.3008 331.2764 0
4/2/16 8:00 AM 449.5894 425.9268 0 141.9756 141.9756 165.6382 189.3008 212.9634 165.6382 0 0 0 0 70.9878 0 0 0 0 0 0 0 0 0
4/2/16 12:00 PM 449.5894 165.6382 0 47.3252 47.3252 141.9756 141.9756 236.626 141.9756 189.3008 70.9878 165.6382 0 0 0 0 0 0 47.3252 0 0 0 0
4/2/16 4:00 PM 425.9268 402.2642 236.626 307.6138 331.2764 331.2764 378.6016 425.9268 0 0 0 0 0 0 0 0 70.9878 141.9756 165.6382 0 0 0 0
4/2/16 8:00 PM 378.6016 378.6016 260.2886 331.2764 307.6138 0 0 47.3252 47.3252 0 0 0 0 0 0 0 0 0 0 23.6626 0 23.6626 0
4/3/16 8:30 AM 307.6138 307.6138 165.6382 260.2886 23.6626 23.6626 47.3252 47.3252 0 0 0 0 0 0 0 0 0 0 23.6626 23.6626 0 0 0
4/3/16 12:30 PM 331.2764 283.9512 189.3008 236.626 236.626 283.9512 307.6138 0 0 0 0 0 0 0 0 0 0 0 141.9756 141.9756 94.6504 141.9756 0
4/3/16 5:00 PM 283.9512 283.9512 165.6382 212.9634 236.626 70.9878 70.9878 70.9878 23.6626 70.9878 0 0 0 0 0 0 23.6626 0 47.3252 47.3252 0 0 0
4/3/16 8:00 PM 260.2886 260.2886 118.313 236.626 0 0 47.3252 47.3252 0 0 0 0 0 0 0 0 0 0 0 0 0 0 0
4/4/16 10:00 AM 212.9634 212.9634 141.9756 47.3252 47.3252 70.9878 0 0 0 0 0 0 0 0 47.3252 0 0 0 94.6504 23.6626 0 0 0
4/4/16 2:30 PM 0 0 0 47.3252 0 23.6626 0 0 0 0 0 0 0 0 47.3252 0 0 0 0 0 0 0 0
4/5/16 3:30 PM 0 0 0 0 0 0 0 0 0 0 0 0 0 0 0 0 0 0 0 0 0 0 0
4/6/16 2:00 PM 0 0 0 0 0 0 0 0 0 0 0 0 0 0 0 0 0 0 0 0 0 0 0
Date
Location
Headspace BottomLine 1 Line 2 Line 3 Line 4 Line 5

133
Figure 6.8 PH3 concentration data from trial 4 on April 1-20, 2016 in the Bird’s silo.
1 2 3 4 5 1 2 3 4 1 2 3 4 1 2 3 4 1 2 3 4
1 2 3 4 5 6 7 8 9 10 11 12 13 14 15 16 17 18 19 20 21 22 23
4/1/2016 12:30 197 75 472 2000 2000 2000 751 65 2000 2000 1490 28 2000 1430 2000 56 2000 2000 1380 595 2000 2000 2000
4/1/16 1:30 PM 1420 2000 2000 2000 2000 1570 1400 2000 2000 2000 1290 1570 2000 1140 1870 2000 2000 1970 1150 2000 2000 2000 1110
4/1/16 2:30 PM 1280 2000 1640 1470 1250 1100 1160 1780 1680 1630 975 1540 1330 870 1030 1460 1280 1160 870 1470 1370 815 845
4/1/16 4:00 PM 1130 905 800 765 765 715 695 1030 1020 905 680 910 855 645 660 865 775 695 665 975 840 655 675
4/1/16 6:00 PM 1250 1290 1080 990 820 755 770 945 1020 915 675 740 820 615 650 665 695 680 585 660 675 615 545
4/1/16 8:00 PM 1410 1490 1330 1300 1200 935 950 1070 1100 980 700 705 785 580 695 595 690 675 520 550 570 450 470
4/1/16 10:00 PM 1920 1790 1740 1800 1540 1270 1500 1770 1990 1720 1330 1420 1570 1290 1430 1210 1320 1210 995 1040 1050 915 885
4/2/16 8:00 AM 1460 1520 1470 1390 1330 1300 1340 1390 1390 1300 1260 1290 1290 1210 1230 1230 1220 1170 1120 1120 1100 1030 1070
4/2/16 12:00 PM 1970 1930 1870 1810 1770 1760 1720 1780 1770 1700 1650 1700 1630 1580 1560 1610 1590 1560 1500 1490 1460 1360 1470
4/2/16 4:00 PM 1780 1880 1830 1770 1710 1630 1570 1730 1710 1630 1500 1610 1560 1450 1470 1540 1480 1450 1380 1460 1390 1300 1340
4/2/16 8:00 PM 1750 1680 1610 1610 1550 1490 1470 1600 1620 1500 1380 1480 1480 1310 1350 1350 1340 1330 1230 1280 1250 1220 1180
4/3/16 8:30 AM 1640 1610 1540 1490 1450 1400 1380 1400 1380 1330 1290 1310 1300 1240 1250 1360 1250 1210 1170 1190 1180 1150 1130
4/3/16 12:30 PM 1640 1590 1560 1530 1510 1500 1480 1480 1480 1440 1410 1420 1400 1370 1370 1380 1370 1350 1330 1330 1330 1320 1300
4/3/16 5:00 PM 1570 1570 1550 1520 1500 1470 1450 1490 1470 1430 1410 1430 1390 1390 1380 1410 1400 1370 1350 1380 1370 1340 1320
4/3/16 8:00 PM 1530 1520 1480 1450 1420 1400 1380 1410 1390 1360 1330 1330 1310 1300 1290 1320 1300 1280 1250 1260 1250 1220 1200
4/4/16 10:00 AM 1390 1380 1350 1320 1300 1260 1240 1270 1250 1220 1190 1220 1210 1160 1170 1200 1170 1160 1120 1130 1130 1100 1110
4/4/16 2:30 PM 1290 1290 1260 1230 1200 1180 1160 1210 1200 1150 1120 1180 1180 1100 1120 1130 1120 1100 1170 1100 1090 1090 1060
4/5/16 3:30 PM 925 980 975 955 920 890 860 935 925 885 845 755 630 740 740 935 910 860 825 865 800 730 795
4/6/16 2:00 PM 655 725 715 690 665 635 620 725 730 680 615 670 660 610 590 715 715 690 600 580 525 488 595
4/8/16 5:00 PM 330 352 350 342 336 326 320 350 358 342 318 342 350 316 316 346 350 344 312 330 318 300 308
4/20/16 5:00 PM 25 28 26 25 25 24 25 28 27 26 24 27 27 24 26 27 27 27 26 26 25 25 24
Date
Location
Headspace BottomLine 1 Line 2 Line 3 Line 4 Line 5

134
Figure 6.9 PH3 concentration data from trial 5 on April 25-May 9, 2016 in the SCAFCO silo.
1 2 3 4 5 1 2 3 4 1 2 3 4 1 2 3 4 1 2 3 4
1 2 3 4 5 6 7 8 9 10 11 12 13 14 15 16 17 18 19 20 21 22 23
4/25/16 11:30 AM 2000 15 10 81 2000 2000 2000 17 20 202 2000 9 12 935 2000 17 53 1260 2000 11 83 925 2000
4/25/16 2:00 PM 1910 1940 2000 2000 2000 1890 1710 865 550 288 1740 404 468 955 1650 595 1230 1430 1610 1200 1040 815 1560
4/25/16 4:30 PM 1720 1560 1720 1670 1520 1470 1440 1400 715 805 1420 1140 540 790 1450 1190 930 970 1430 1330 945 1010 1420
4/26/16 10:30 AM 985 960 985 960 935 895 870 955 960 955 980 910 905 910 860 910 915 910 840 910 920 920 850
4/27/16 9:00 AM 690 765 785 770 750 700 665 785 810 790 710 765 795 785 705 735 750 740 635 720 740 738 740
4/27/16 12:00 PM 720 645 755 725 695 685 675 775 795 790 705 760 780 775 645 710 725 725 630 685 720 730 655
4/28/16 2:00 PM 625 434 635 620 605 590 570 615 620 625 585 600 605 600 560 590 590 580 550 590 600 600 570
4/28/16 9:00 PM 575 565 580 595 600 590 560 575 610 595 575 590 585 575 570 525 560 550 510 525 555 545 525
4/29/16 2:00 PM 535 520 540 560 550 530 520 525 550 530 500 498 525 535 510 486 505 490 476 490 505 494 472
5/1/16 6:00 PM 390 380 392 418 414 404 392 408 418 410 384 396 400 402 396 384 384 364 354 380 382 376 356
5/2/16 12:00 PM 374 382 376 372 368 360 358 370 370 358 350 358 358 352 352 350 348 370 336 350 348 346 338
5/3/16 12:00 PM 336 338 340 336 330 324 322 334 330 326 316 330 328 326 318 320 312 316 312 318 320 318 310
5/9/16 3:00 PM 114 116 120 116 112 108 107 128 133 132 113 128 134 133 106 118 120 119 105 121 125 125 109
Date
Location
Headspace BottomLine 1 Line 2 Line 3 Line 4 Line 5

135
Figure 6.10 SF concentration data from trial 5 on April 25-May 9, 2016 in the Bird’s silo.
1 2 3 4 5 1 2 3 4 1 2 3 4 1 2 3 4 1 2 3 4
1 2 3 4 5 6 7 8 9 10 11 12 13 14 15 16 17 18 19 20 21 22 23
4/25/16 11:00 AM 425.9268 43775.81 43681.16 496.9146 0 0 0 48437.34 0 0 402.2642 56719.25 0 331.2764 0 88119.52 0 0 402.2642 41267.57 2176.959 47.3252 449.5894
4/25/16 2:00 PM 1798.358 28134.83 0 0 0 1159.467 0 47206.89 0 899.1788 0 44296.39 189.3008 1751.032 0 0 520.5772 1159.467 1798.358 0 0 0 0
4/25/16 4:30 PM 3312.764 0 35493.9 189.3008 0 757.2032 1656.382 37765.51 1467.081 2271.61 0 43065.93 875.5162 2602.886 0 48295.37 1348.768 1703.707 0 13440.36 591.565 1632.719 1112.142
4/26/16 10:30 AM 6791.166 0 0 0 686.2154 0 118.313 0 0 0 0 1514.406 0 0 615.2276 0 354.939 449.5894 0 0 1609.057 1017.492 1301.443
4/27/16 9:00 AM 5466.061 4211.943 3857.004 567.9024 2839.512 0 94.6504 0 0 544.2398 0 0 0 0 70.9878 1798.358 1845.683 1561.732 2389.923 0 2105.971 2034.984 2176.959
4/27/16 12:00 PM 5205.772 94.6504 0 0 307.6138 236.626 165.6382 0 0 520.5772 141.9756 0 0 165.6382 260.2886 0 0 0 733.5406 0 0 0 0
4/28/16 2:00 PM 4140.955 4188.28 0 0 47.3252 0 0 0 23.6626 0 0 70.9878 94.6504 0 1561.732 1703.707 1727.37 1703.707 1585.394 1632.719 0 0 0
4/28/16 9:00 PM 3786.016 3786.016 0 0 0 0 0 0 0 0 0 0 94.6504 0 141.9756 118.313 0 0 0 141.9756 212.9634 0 0
4/29/16 2:00 PM 0 0 23.6626 94.6504 70.9878 0 0 141.9756 189.3008 141.9756 0 23.6626 0 0 0 0 0 0 0 0 0 0 0
5/1/16 6:00 PM 2247.947 189.3008 0 0 0 0 141.9756 0 0 0 0 0 0 0 0 23.6626 0 0 0 0 47.3252 0 0
5/2/16 12:00 PM 2011.321 0 0 0 0 0 0 0 0 0 0 0 0 0 0 0 0 0 0 0 0 0 0
5/2/16 8:00 PM 0 0 1609.057 1443.419 1396.093 828.191 23.6626 1774.695 1893.008 1680.045 402.2642 1751.032 1822.02 496.9146 1656.382 1703.707 1845.683 1727.37 189.3008 1751.032 1845.683 1774.695 283.9512
5/3/2016 12:00 47.3252 0 993.8292 757.2032 638.8902 118.313 23.6626 1112.142 1135.805 757.2032 23.6626 1159.467 1230.455 0 686.2154 1064.817 1088.48 899.1788 0 946.504 1088.48 993.8292 0
Line 2 Line 3 Line 4 Line 5Date
Location
Headspace BottomLine 1