evaluation of satellite based indices for gross primary ... of satellite based indices for gross...
TRANSCRIPT

Biogeosciences, 6, 129–138, 2009www.biogeosciences.net/6/129/2009/© Author(s) 2009. This work is distributed underthe Creative Commons Attribution 3.0 License.
Biogeosciences
Evaluation of satellite based indices for gross primary productionestimates in a sparse savanna in the Sudan
M. Sjostrom1, J. Ardo1, L. Eklundh 1, B. A. El-Tahir 2, H. A. M. El-Khidir 2, M. Hellstr om1, P. Pilesjo1, and J. Seaquist1
1Department of Physical Geography and Ecosystem Analysis, Lund, Sweden2Agricultural Research Corporation, El Obeid, Sudan
Received: 25 June 2008 – Published in Biogeosciences Discuss.: 29 July 2008Revised: 17 December 2008 – Accepted: 17 December 2008 – Published: 29 January 2009
Abstract. One of the more frequently applied methods forintegrating controls on primary production through satellitedata is the Light Use Efficiency (LUE) approach. Satel-lite indices such as the Normalized Difference VegetationIndex (NDVI), Enhanced Vegetation Index (EVI) and theShortwave Infrared Water Stress Index (SIWSI) have pre-viously shown promise as predictors of primary productionin several different environments. In this study, we evalu-ate NDVI, EVI and SIWSI derived from the Moderate Res-olution Imaging Spectroradiometer (MODIS) satellite sen-sor against in-situ measurements from central Sudan in or-der to asses their applicability in LUE-based primary pro-duction modeling within a water limited environment. Re-sults show a strong correlation between vegetation indicesand gross primary production (GPP), demonstrating the sig-nificance of vegetation indices for deriving information onprimary production with relatively high accuracy at similarareas. Evaluation of SIWSI however, reveal that the frac-tion of vegetation apparently is to low for the index to pro-vide accurate information on canopy water content, indicat-ing that the use of SIWSI as a predictor of water stress insatellite data-driven primary production modeling in similarsemi-arid ecosystems is limited.
1 Introduction
With the emergence of international environmental treatiessuch as United Nations Framework Convention on ClimateChange (UNFCCC) and its Kyoto Protocol, there is an urgent
Correspondence to:M. Sjostrom([email protected])
need to quantify the global carbon budget and its temporaland spatial variations (IPCC, 2007). One of the least well-covered regions by studies on carbon dynamics and climatechange is Africa, a continent with widespread poverty andslow economic development (Giles, 2007).
Droughts and famines frequently impact the people livingin the African Sahel, a semi-arid grass- and shrubland regionlocated south of the Saharan desert. The region has recentlybeen flagged as a hotspot for climatic change as findings frompolar orbiting satellites reveal a widespread increase in veg-etation greenness (Eklundh and Olsson, 2003; Herrmann etal., 2005; Seaquist et al., 2006). This observed greening haspartly been explained by variations in rainfall (Hickler et al.,2005) and could represent part of the residual terrestrial car-bon sink (Houghton, 2003). Knowledge on primary produc-tion in this region is therefore of key importance, both in thelight of the climatic fluctuations that have occurred in thisregion over the last decades (Hulme, 2001) and consideringthe predicted effects of climate change (IPCC, 2007).
Photosynthesis, the process by which plants harvest so-lar energy and carbon needed for ecosystem maintenance, iskey to determining ecosystem primary production, the netamount of carbon captured by land living plants (Hananet al., 1998). Most existing estimates of primary produc-tion at continental to global scales have been made with theuse of sophisticated process-based ecosystem models drivenmainly by climate data (Sitch et al., 2003). However, duringthe last decade, rapid developments in satellite sensor tech-nology have allowed remote sensing based primary produc-tion models to emerge as an attractive approach. Consider-ing the spatial and temporal variations of the processes re-lated to plant growth, repetitive and accurate satellite basedmeasurements may contribute significantly to our knowl-edge on vegetation dynamics and responses to changing
Published by Copernicus Publications on behalf of the European Geosciences Union.

130 M. Sjostrom et al.: Evaluation of satellite based indices for primary production estimates
Fig. 1. Map showing the location of the study area in central Sudan.Yellow denotes areas of>70% sand whereas isohyets show meanannual rainfall in mm.
environmental conditions. The improved spatial and spectralresolution of satellite sensors such as the Moderate Resolu-tion Imaging Spectroradiometer (MODIS), in comparison tothe extensively used Advanced Very High Resolution Ra-diometer (AVHRR), has further allowed a reassessment ofthe potential for modeling primary production solely by theuse of satellite data.
One of the more widely applied concepts within the do-main of satellite based primary production models is theLight Use Efficiency (LUE) approach, first described byMonteith (1972, 1977). Here GPP, the Gross Primary Pro-duction related to the carbon assimilated by plants is ex-pressed as:
GPP= ε × PAR× fPAR, (1)
whereε is the conversion efficiency, PAR is incoming photo-synthetically active radiation in the wavelengths 400–700 nmand fPAR represents the fraction of PAR absorbed by thecanopy. fPAR is generally estimated through the use of spec-tral vegetation indices such as the Normalized DifferenceVegetation Index (NDVI) (Daughtry et al., 1983; Asrar etal., 1984; Sellers et al., 1994) and the Enhanced VegetationIndex (Xiao et al., 2004) whereas the PAR received at theEarth’s surface can be estimated by interpolating point mea-surements from light sensors or be derived from the use ofEarth observation data (Eck and Dye, 1991; Seaquist andOlsson, 1999; Van Laake and Sanchez-Azofeifa, 2005; Lianget al., 2006; Olofsson et al., 2007b). The conversion effi-ciency factorε was originally regarded as a fixed empiricalconstant when first introduced (Monteith, 1972) but duringthe past decade it has become more common to estimate orscaleε using models or satellite retrievals. Numerous stressfactors controlε and estimating this critical parameter can bedifficult due to high spatial and temporal variability inherentto site specific and meteorological conditions (Hilker et al.,2008).
In semi-arid environments such as the Sahel, water is gen-erally the most limiting factor for growth, and numeroussatellite sensor-based primary production studies have fo-cused on model-based derivation of information related toplant water stress in order to scaleε (Nemani and Running,
1989; Field et al., 1995; Prince and Goward, 1995; Seaquistet al., 2003). Progress has also recently been made us-ing satellite data to detect canopy water stress (Ceccato andFlasse, 2002; Ceccato et al., 2002; Fensholt and Sandholt,2003; Xiao et al., 2004). However, further work is requiredto strengthen our knowledge regarding indices related to wa-ter stress as well as their applicability for estimating primaryproduction using satellite remote sensing.
In this paper, we aim to test satellite-based variables thatcan be used to upscale estimates of fluxes of CO2 in semi-aridSahel by comparing these against site-specific measurementsfrom central Sudan. We further investigate the applicabilityof these variables by including them in a simple paramet-ric LUE-model, a model that should be regarded merely asa point of progress for future proceedings on satellite data-driven primary production modeling in semi-arid regions.
2 Study area and instrumentation
2.1 Study area
The flux tower used in this study is located at the villageDemokeya (13.3◦ N, 30.5◦ E) in Northern Kordofan state incentral Sudan, approximately 35 km northeast of the statecapital El Obeid (Fig. 1). Soils in the area are mainly sandyand vegetation at the site consists primarily of sparseAcaciasenegalsavanna with a canopy cover of 5–10%, and a groundcover composed mainly of C4 grasses and herbs, mainlyAristida pallida, Eragrostis tremulaandCenchrus biflorus.Mean annual precipitation is about 320 mm and generallyfalls from June–October, and the mean annual temperatureis around 26◦C. The deep sandy soil (96.5% sand and 3.5%silt) has estimated minimum (wilting point) and maximum(field capacity) water holding capacities of 5% and 15% re-spectively, and hence a maximum plant available water con-tent of around 10%. The landscape is gently undulating dueto stabilized parallel sand dunes with a N-S orientation.
2.2 Instrumentation
Fluxes of CO2 (FCO2), H2O (FH2O) and energy were mea-sured with the eddy covariance technique according to theEUROFLUX methodology (Aubinet et al., 2000). Measure-ments were performed at 20 Hz using an open path eddycovariance system (In Situ Flux Systems AB, Sweden) andstored as 30-min averages. Instruments include a LI7500 (Li-Cor, Lincoln, US) open-path infrared CO2 and H2O gas ana-lyzer and a GILL R3 Ultrasonic Anemometer (GILL Instru-ments, UK) mounted 9 m above the ground, approximately4 m above the sparse canopy.
Located approximately 400 m from the flux tower is a sep-arate climate station that measures temperature, relative hu-midity, precipitation, wind and global radiation using stan-dard equipment. Additional measurements at this station
Biogeosciences, 6, 129–138, 2009 www.biogeosciences.net/6/129/2009/
M. Sjostrom et al.: Evaluation of satellite based indices for primary production estimates 131
include soil moisture (TDR, CS615/CS616, Campbell Sci-entific, US) and soil temperature (soil temperature probe107/108, Campbell Scientific, US) measured at a depth of5 cm, net radiation (NR-Lite, Kipp and Zonen, US) and in-coming PAR (JYP1000, SDEC, France).
3 Data and methods
3.1 Eddy covariance data
The carbon budget is described by three components: i) grossprimary productivity (GPP), the carbon captured throughphotosynthesis; ii) net ecosystem exchange (NEE), the netexchange of carbon between the ecosystem and atmosphere;iii) and ecosystem respiration (Reco), which is the sum ofplant and heterotrophic respiration. NEE, GPP and Recowerederived from half-hourly values of CO2 from July to Decem-ber for the 2007 season (data prior to July were not available).
In order to obtain seasonal estimates of CO2 exchange,eddy covariance data was gap-filled according to the methodused by Reichstein et al. (2005) (amount of gaps was 39% forthe period). This method considers both the covariance be-tween fluxes as well as meteorological drivers and temporalstructure.
Previous studies from the Sahel have shown that soil res-piration not only depends on temperature but also on theamount of available water (Friborg et al., 1997; Hanan etal., 1998). In order to account for the soil water depen-dency, Reco was estimated by using the exponential regres-sion model of Lloyd and Taylor (1994) in combination witha soil water content factor (Fw) derived from volumetric soilmoisture (Wang and Leuning, 1998):
Fw = min
(1,
10(θ − θMin)
3(θMax − θMin)
), (2)
whereθ is the actual soil water content in the upper soil layer(5 cm), θmin andθmax are the minimum and maximum soilwater content respectively. Using typical values for sandysoils, Fw is thus scaled between wilting point and field ca-pacity (i.e. approximately 5 and 15%) and the effects of theamount of available water on Reco are taken in account byintegrating Fw with the Lloyd and Taylor (1994) expression:
Reco = FwR10e308.56
(1
56.02−1
Tsoil−227.15
). (3)
Daytime GPP was estimated as GPP =Reco−NEE,whereas nighttime GPP was set equal to zero based on aglobal radiation threshold of 20 Wm−2.
3.2 Eddy covariance footprint
When verifying remote sensing based indices against in-situ flux measurements it is important to determine the ex-tent of the surface footprint of flux tower measurements to
determine the area over which reflectance data are to beobtained. A two-dimensional analytical footprint model,FSAM (Schmid, 1994), was used to approximate the sourcearea contributing to the CO2 flux measurements. For eachhalf-hourly value during the 2007 growing season, sourcearea functions dependent on atmospheric stability and sur-face roughness were calculated in order to estimate the spa-tial scale of measurements. Input parameters required torun the model are the effective height (z); surface rough-ness length (z0); Obukhov length (L); friction velocity (u∗)
and crosswind turbulence intensity (σ v/u∗). L, σ v (standarddeviation of lateral wind speed fluctuations) andu∗ werederived from half-hourly sonic anemometer data wheras z0was set to 0.5 m based on Wieringa (1993). Footprint func-tions were then rotated based on the prevailing wind directionand further projected onto a 2×2 km grid plane with the fluxtower at its centre.
3.3 Satellite data
We used satellite data from the MODIS/EOS Terra productMOD09A1, which provides an estimate of surface spectralreflectance in seven bands as it would have been measuredat the ground (Vermote et al., 2002). The MOD09A1 sur-face reflectance product includes correction for the effects ofaerosols, thin cirrus clouds and atmospheric gases and servesas an input for several higher order land products such asfPAR/LAI and vegetation indices. The spatial resolution ofthe MOD09A1 data set is 500 m and data is composed of thebest observations during 8-day periods with regards to over-all pixel quality and observational coverage (Justice et al.,2002).
Spectral vegetation indices used to monitor vegetation areusually composed of reflectances from the red (ρred) andNear Infrared (NIR,ρnir) wavelengths (Tucker, 1979) suchas the NDVI which is defined as:
NDV I =ρnir − ρred
ρnir + ρred(4)
Early studies used NDVI as a surrogate measure ofprimary production, applying an integrated approach overthe entire growing season to estimate primary productivity(Tucker et al., 1983; Tucker et al., 1985). Numerous studieshave since then appeared, implementing a linear relationshipbetween fPAR and NDVI to approximate primary production(Daughtry et al., 1983; Asrar et al., 1984; Sellers et al., 1994;Seaquist et al., 2003; Olofsson et al., 2007a). NDVI has,however, been reported to be sensitive to differences in back-ground reflectance and to saturate for areas of high biomass(Huete et al., 1997). The Enhanced Vegetation Index (EVI)was developed to enhance the vegetation signal by reducinginfluences from the atmosphere and canopy background andto improve sensitivity in high biomass regions (Huete et al.,1997; Huete et al., 2002). As with the NDVI, EVI is es-timated from surface reflectance in the red and NIR bands
www.biogeosciences.net/6/129/2009/ Biogeosciences, 6, 129–138, 2009

132 M. Sjostrom et al.: Evaluation of satellite based indices for primary production estimates
but it also uses reflectance in the blue band (ρblue) to correctfor effects of aerosols. Using surface reflectance data fromMODIS, EVI is calculated as:
EV I = 2.5 ×ρnir − ρred
ρnir + (6 × ρred − 7.5 × ρblue) + 1. (5)
Several studies have previously revealed a good general re-lationship between EVI and GPP (Xiao et al., 2004; Rahmanet al., 2005; Sims et al., 2006b; Olofsson et al., 2008). Build-ing on this, Sims et al. (2008) developed a temperature andgreenness model solely based on the MODIS Land SurfaceTemperature (LST) and EVI products. Modeled GPP esti-mates were in good agreement with measured values, high-lighting EVI’s potential for use as a predictor of GPP, andfurther demonstrating that GPP can be estimated with rela-tively high accuracy using only remote sensing data.
In the Sahel region, water is generally assumed to be thelimiting factor for photosynthesis and several attempts havepreviously been made at developing satellite-based stressfactors that account for canopy or soil water deficits (Gao,1996; Ceccato and Flasse, 2002; Ceccato et al., 2002; Fen-sholt and Sandholt, 2003). The Short-wave Infrared (SWIR,ρswir) and NIR bands available on the MODIS sensor presentopportunities to quantify equivalent water thickness (EWT),a term denoting spectral absorption resulting from the leafwater content. One possibility to derive information oncanopy water stress through the use of MODIS satellite datais the Short wave Infrared Water Stress Index (SIWSI) basedon NIR and SWIR band 6 reflectance (Fensholt and Sand-holt, 2003):
SIWSI =ρnir − ρwir
ρnir + ρswir. (6)
Fensholt and Sandholt (2003) tested two configurationsof SIWSI based on surface reflectance in the NIR, band 5(1230–1250 nm) and band 6 (1628–1652) and found that theNIR and SWIR band 6 combination performed slightly betterwhen compared against modeled and measured soil moisturein semi-arid Senegal. As can be seen in Eq. (6), SIWSI is anormalized index with values theoretically ranging between−1 and 1. As the water content increases, the reflectance inthe SWIR diminishes. A high SIWSI value would thereforeindicate sufficient amounts of water whereas, a low valuewould indicate water stress.
We acquired the MOD09A1 8-day product from Earth Ob-serving Systems Data Gateway (EDG,http://edcimswww.cr.usgs.gov/pub/imswelcome/) for the year 2007. The gridplane with integrated eddy covariance source area functionsgenerated through the footprint model was geometrically cor-rected and superimposed with the MODIS satellite data inorder to determine which pixels to include in the analysis.In addition to the tower pixel, three pixels adjacent to thetower pixel were found to fall within the footprint of the fluxtower. Data for surface reflectance were thus extracted for
a 1×1 km area and then used to calculate NDVI, EVI andSIWSI according to Eqs. (4), (5) and (6). In order to mini-mize the effects of sensor disturbances, the estimated NDVIand EVI time series were seasonally adjusted by an adaptiveSavitzky-Golay filtering method using the TIMESAT pro-gram package (Jonsson and Eklundh, 2002, 2004). TIME-SAT fits a function to the upper envelope of the satellite timeseries data, effectively filtering out negatively biased noisedue to, for instance, atmospheric effects (Eklundh and Ols-son, 2003; Olofsson et al., 2008).
3.4 LUE-model
In order to further assess the applicability of satellite-basedmeasurements we incorporated MODIS indices in a simpleparametric LUE-model formulated as follows:
GPP= εp × ε × fPAR × PAR, (7)
whereεp represents the maximum biological efficiency ofPAR conversion to dry matter (g C mol−1 PAR).
Most herb layers in the Sahel region consist of a combina-tion of C3 and C4 species, where C3 often dominates in theearly part of the growing season (Hanan and Prince, 1997).We therefore prescribed a fixed value of 0.489 g C mol−1
PAR for εp (Seaquist et al., 2003; Seaquist et al., 2006),which indicates a mixture of C3 and C4 plants with the as-sumption that C4 grasses dominate for the greater part of thegrowing season.
SIWSI was linearly scaled asε using maximum and min-imum values during the 2007 season to assess its potentialas an estimator of maximum light use efficiency. The indexhas previously been shown to increase predictions of aboveground net primary production in the semi-arid Sahel (Fen-sholt et al., 2006).
Vegetation indices have been shown to be highly corre-lated with processes that are dependent on light absorption(Daughtry et al., 1983; Asrar et al., 1984; Sellers et al., 1994;Huete et al., 2002; Xiao et al., 2004; Rahman et al., 2005;Sims et al., 2006b; Olofsson et al., 2008) and are representedas fPAR in Eq. (7) whereas the PAR component, in turn, rep-resents 8-day sums of measurements from the climate stationin order to be consistent with the temporal resolution of theMOD09A1 product.
4 Results
4.1 Seasonal variation in carbon exchange, climate andEVI
Figure 2a shows day-to-day variation in GPP, NEE and Recofrom July to December 2007, whereas Fig. 2b shows cumu-lative fluxes together with aboveground net primary produc-tion (AGNPP) assessments of herbs and grasses (negative
Biogeosciences, 6, 129–138, 2009 www.biogeosciences.net/6/129/2009/
M. Sjostrom et al.: Evaluation of satellite based indices for primary production estimates 133
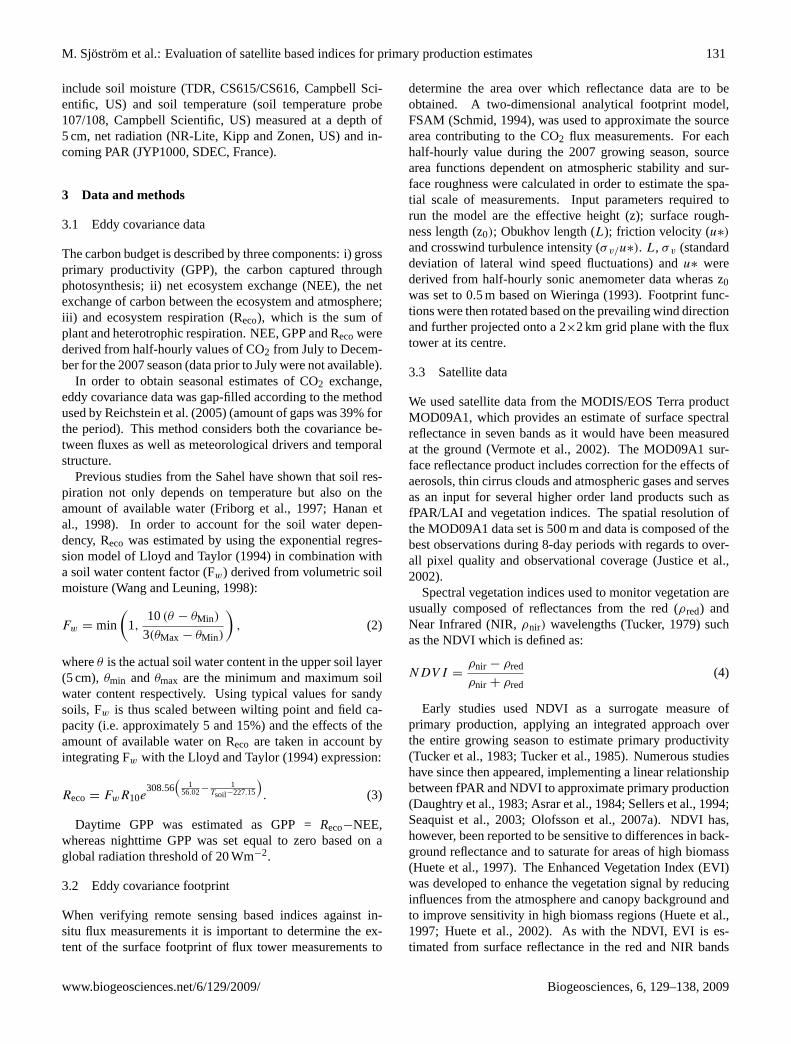
Fig. 2. Seasonal patterns of(a) daily eddy covariance GPP, NEEand Reco, (b) cumulative GPP, NEE, Reco and assessments ofabove ground biomass,(c) measured daily average soil tempera-ture (5 cm), soil moisture (5 cm) and cumulative rainfall (dottedgray line denotes maximum plant-available water content at 10%soil moisture) and(d) 8-day sums of eddy covariance GPP plottedagainst 8-day values of MODIS EVI and NDVI for the Demokeyasite from June to 31 December 2007.
values denote net ecosystem CO2 uptake). Net uptake in-creases as conditions gradually become more favourable forplant growth with the onset of the rain in June (Fig. 2c). To-tal annual rainfall for the 2007 season was 364 mm, whichis slightly higher than the annual average of 320 mm and no-ticeably higher compared to previous season as Demokeyareceived a total of 273 mm in 2006. Peak uptake occursin late August and early September. GPP and Reco declinerapidly as soil water content decreases with the last rainsfalling on 22 September (Fig. 2c).
The seasonal progression of TIMESAT-adjusted MODISvegetation indices is shown in Fig. 2d. The site shows a dis-tinct seasonal variation in NDVI and EVI which correspondsrather well to the seasonal dynamics of 8-day sums of GPP.
4.2 GPP relationships and modeling
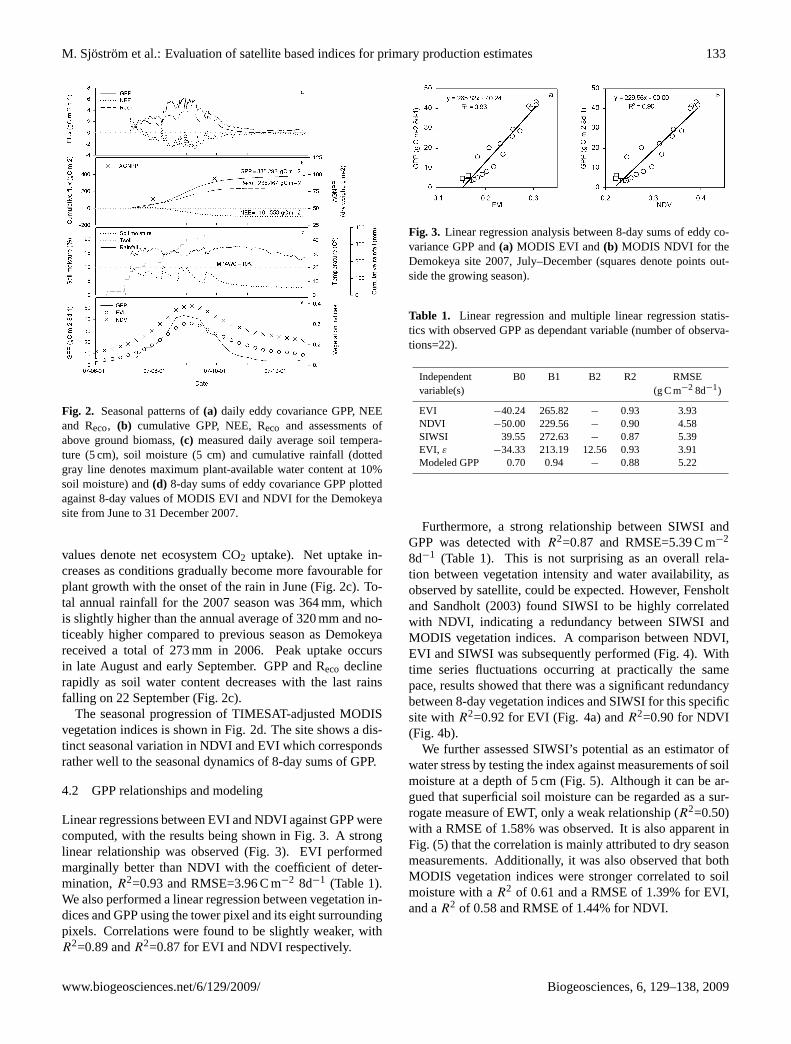
Linear regressions between EVI and NDVI against GPP werecomputed, with the results being shown in Fig. 3. A stronglinear relationship was observed (Fig. 3). EVI performedmarginally better than NDVI with the coefficient of deter-mination,R2=0.93 and RMSE=3.96 C m−2 8d−1 (Table 1).We also performed a linear regression between vegetation in-dices and GPP using the tower pixel and its eight surroundingpixels. Correlations were found to be slightly weaker, withR2=0.89 andR2=0.87 for EVI and NDVI respectively.
Fig. 3. Linear regression analysis between 8-day sums of eddy co-variance GPP and(a) MODIS EVI and(b) MODIS NDVI for theDemokeya site 2007, July–December (squares denote points out-side the growing season).
Table 1. Linear regression and multiple linear regression statis-tics with observed GPP as dependant variable (number of observa-tions=22).
Independent B0 B1 B2 R2 RMSEvariable(s) (g C m−2 8d−1)
EVI −40.24 265.82 − 0.93 3.93NDVI −50.00 229.56 − 0.90 4.58SIWSI 39.55 272.63 − 0.87 5.39EVI, ε −34.33 213.19 12.56 0.93 3.91Modeled GPP 0.70 0.94 − 0.88 5.22
Furthermore, a strong relationship between SIWSI andGPP was detected withR2=0.87 and RMSE=5.39 C m−2
8d−1 (Table 1). This is not surprising as an overall rela-tion between vegetation intensity and water availability, asobserved by satellite, could be expected. However, Fensholtand Sandholt (2003) found SIWSI to be highly correlatedwith NDVI, indicating a redundancy between SIWSI andMODIS vegetation indices. A comparison between NDVI,EVI and SIWSI was subsequently performed (Fig. 4). Withtime series fluctuations occurring at practically the samepace, results showed that there was a significant redundancybetween 8-day vegetation indices and SIWSI for this specificsite withR2=0.92 for EVI (Fig. 4a) andR2=0.90 for NDVI(Fig. 4b).
We further assessed SIWSI’s potential as an estimator ofwater stress by testing the index against measurements of soilmoisture at a depth of 5 cm (Fig. 5). Although it can be ar-gued that superficial soil moisture can be regarded as a sur-rogate measure of EWT, only a weak relationship (R2=0.50)with a RMSE of 1.58% was observed. It is also apparent inFig. (5) that the correlation is mainly attributed to dry seasonmeasurements. Additionally, it was also observed that bothMODIS vegetation indices were stronger correlated to soilmoisture with aR2 of 0.61 and a RMSE of 1.39% for EVI,and aR2 of 0.58 and RMSE of 1.44% for NDVI.
www.biogeosciences.net/6/129/2009/ Biogeosciences, 6, 129–138, 2009

134 M. Sjostrom et al.: Evaluation of satellite based indices for primary production estimates
Fig. 4. Linear regression analysis between 8-day values of MODISSIWSI and (a) MODIS EVI and (b) MODIS NDVI for theDemokeya site 2007, January–December (squares denote pointsoutside the growing season).
As previously stated, EVI, NDVI and SIWSI preformedwell when compared against 8-day sums of GPP (Fig. 3, Ta-ble 1). The NDVI time series data, however, had a marginallyweaker linear relationship with observed GPP than the EVItime series and was therefore excluded from further analysis.Additional analysis, by means of multiple linear regression,was thus performed using EVI andε as independent variablesin order to test the implications of includingε as a predictorof GPP. Results showed thatε did not add further significantexplanation to the observed variance of GPP values (Table 1).
Figure 6 shows 8-day modeled GPP at Demokeya withobserved 8-day sums from July to December 2007. Mod-eled GPP was calculated for every 8-day period according toEq. (7) assuming a 1:1 relationship between EVI and fPAR.As shown in Fig. 7, the seasonal dynamics of modeled GPPagreed rather well with measured GPP (R2=0.88), with cu-mulative sums over the modeled period July 12 to Decem-ber 27 differing by 6.70% (Fig. 6b). The data points are de-scribed by the equation GPPobs =0.94 GPPmod−0.07, whichis close to a 1:1 line (Fig. 7). However, the model fails at thebeginning of the growing season with the remaining variancein the measured versus modeled data (5.22 g C m−2 8d−1, Ta-ble 1) mainly originating from the effects ofε.
5 Discussion
The aim of this study involved assessing the applicability ofthree satellite-based indices from MODIS data (EVI, NDVIand SIWSI) for primary production modeling in a semi-aridenvironment in the Sahel. Indices were tested through com-parison with site-specific measurements of CO2 fluxes fromcentral Sudan. In order to evaluate the applicability of satel-lite indices, flux tower measurements of NEE were used toderive GPP. Soil moisture and soil temperature are usuallyregarded as being the primary environmental factors control-ling Reco in semi-arid environments, and hence Reco was es-timated by using a soil water content factor, representing therelative availability of soil water for plants (Wang and Le-uning, 1998) together with the exponential regression modelof Lloyd and Taylor (1994). This step is critical, as accurate
Fig. 5. Linear regression analysis between 8-day values of MODISSIWSI and 8-day average soil moisture measured at a depth of5 cm (soil moisture measurements failed during May and June) forthe Demokeya site 2007, January–December (squares denote pointsoutside the growing season).
estimation of Reco is important with regards to validation ofterrestrial carbon models as an erroneous estimate of Reco inturn will result in an error in the estimation of GPP. However,a full evaluation of the environmental factors driving respi-ration at this site and the applicability of the multiplicativemodel used to derive Reco is beyond the scope of this study.
Though the footprint of the flux tower was estimated to besmaller than the 1×1 km area used for satellite data evalua-tion, we found strong linear relationships between EVI andNDVI against tower GPP at the Demokeya flux site (Fig. 3).The predictive ability of vegetation indices declined by in-creasing the window to 3×3 pixels. Although it may be pos-sible to improve results by integrating footprint source areasover smaller time scales, such as the 8-day periods used byMODIS products, the method used here still illustrates theeffect (albeit small in this case) of taking the footprint intoaccount when comparing tower flux measurements againstremotely sensed data.
Even if the performance of EVI was only marginally betterthan NDVI in relation to GPP, several studies have previouslyreported improved biophysical performance of EVI in com-parison to NDVI due to its higher dynamic range, enhancedreduction of atmospheric influences and lower sensitivity tocanopy background signals (Miura et al., 2001; Huete etal., 2002; Xiao et al., 2003). In addition, EVI’s utility insatellite-driven primary production modeling has previouslybeen demonstrated for several different biome types (Xiao etal., 2004; Rahman et al., 2005; Sims et al., 2006b; Olofs-son et al., 2008) and the highly linear relationship observedhere clearly suggests that GPP can be estimated through a lin-ear regression model for similar environments with relativelyhigh accuracy, using only EVI as independent variable.
Biogeosciences, 6, 129–138, 2009 www.biogeosciences.net/6/129/2009/

M. Sjostrom et al.: Evaluation of satellite based indices for primary production estimates 135
Fig. 6. Seasonal dynamics of(a) 8-day sums of measured eddy co-variance GPP and modeled GPP (error bars are the standard devia-tion of modeled GPP across pixels at individual dates) and(b) mea-sured and modeled cumulative GPP for the Demokeya site 2007,July–December.
We further detected a high correlation between SIWSI andmeasured tower GPP (Table 1). Although linear regressionparameters differed, the strong relationship between SIWSIand both vegetation indices (Fig. 4) indicates that they maymeasure the same process at this specific site. Similar re-sults have previously been reported with NDVI. For instance,Ceccato et al. (2001; 2002) designed a spectral index, theGlobal Vegetation Moisture Index (GVMI), using NIR, blueand SWIR reflectance data from the VEGETATION sensoronboard the SPOT (Satellite Pour l’Observation de la Terre)satellite. The authors demonstrated that GVMI was fully ca-pable of predicting EWT for localities with complete canopycover, but comparisons between GVMI and NDVI for sa-vanna regions showed a highly linear relationship (Ceccatoand Flasse, 2002). Although Ceccato and Flasse (2002)found similar values of NDVI with different values of GVMI,the authors mention that NDVI could be used to retrieve veg-etation water content for some types of species, mainly forthose where the degree of senescence is proportional to mois-ture content, which seems to be the case at the site used inour study. It is however important to mention that SIWSIdoes require a certain amount of vegetation to be present inorder to be useful (Fensholt and Sandholt, 2003). The ratherweak correlation between SIWSI and soil moisture (Fig. 5)observed is mainly due to the wide scatter of early growingseason points. This indicates that the sparse vegetation coverat the site causes the index to fail as an indicator of waterstress. Furthermore, the stronger, but still rather weak rela-tionship observed between both NDVI and EVI against soilmoisture could, to some extent, indicate that the effects ofwater stress are already manifested through the vegetationindex signal. Cheng et al. (2006) compared several indices,including SIWSI, NDVI and EVI, to retrievals of EWT fromAdvanced Visible Infrared Imaging Spectrometer (AVIRIS)
Fig. 7. Linear regression analysis between 8-day sums of mea-sured GPP and modeled GPP for the Demokeya site 2007, July–December (squares denote points outside the growing season).
imagery. The authors showed that EVI had the highest corre-lation among indices for an agricultural site and a semi-aridsavanna shrub site. However, it would have to be further in-vestigated if EVI can mimic the temporal dynamics of EWTat these specific sites as Cheng et al. (2006) further concludedthat errors due to soil background reflectance and canopy ar-chitecture were inherent in the retrievals of EWT in both theAVIRIS and MODIS data.
Results derived through using EVI and SWISI in a sim-ple parametric LUE-model were shown to agree rather wellwith measured tower GPP over the 2007 season (Figs. 6 and7). Although correlations showed that the relationship be-tween EVI and GPP was highly linear (Fig. 3a), there arestill a number of factors that influence the vegetation sig-nal recorded at the sensor that in turn can greatly influencethe 1:1 relationship assumed between fPAR and EVI in themodel. Even though TIMESAT minimizes negatively biasednoise due to the interference of clouds and atmospheric con-stituents, effects of varying solar zenith angles on satellitevegetation index data has previously been shown to be con-siderable at intermediate Leaf Area Index (LAI) values be-tween 0.25 and 2 (Goward and Huemmrich, 1992). A highersolar zenith angle in the beginning and in the end of theseason, tends to increase vegetation index values, whereasa lower solar zenith angle in the middle of the season resultsin more soil being directly illuminated, thus reducing val-ues. Although the site did show a distinct seasonal variationin EVI and NDVI (Fig. 2d), the applicability of vegetationindices to estimate GPP can still be greatly reduced due tosolar angle effects, specifically for sites in semi-arid regionswhere vegetation is sparse (Sims et al., 2006a). But none ofthe reflectance values in the 1×1 window during 2007 wereacquired at a solar zenith angle of more than 45◦, and as veg-etation indices estimated by using red and NIR reflectanceare relatively unaffected at solar zenith angles less than 50◦
(Goward and Huemmrich, 1992), the effects of solar anglemay be minimal.
www.biogeosciences.net/6/129/2009/ Biogeosciences, 6, 129–138, 2009

136 M. Sjostrom et al.: Evaluation of satellite based indices for primary production estimates
The large differences between modeled GPP and observedGPP, specifically for a number of 8-day periods early in themodel run (Fig. 6), can be attributed toε (i.e. scaled SIWSI)which primarily fails due to the low vegetation cover at thebeginning of the growing season. As the water content ofthe soil gradually increases over time with the first rainfall,the overall albedo of the soil decreases. The reflectance inthe SWIR, in turn, rapidly diminishes, causing a peak in themodeled GPP during the middle of the growing season. Thisrather deceptive temporal pattern ofε in the early vegetativestage is further enhanced due to scaling. Finally, multiplelinear regression analysis confirmed that no significant im-provement was obtained by addingε to the model (Table 1),suggesting that in this case, the parameter is of limited pre-dictive use.
6 Conclusion
We have tested the applicability of EVI, NDVI and SIWSI inprimary production modeling for semi-arid areas in the Sa-hel by comparing these indices against field measurementsfrom a site in central Sudan. Both MODIS vegetation indicesshowed consistent agreement with GPP, with EVI having thehighest correlation. Our results suggests that EVI shows sig-nificant promise for efficient determination of primary pro-duction, and that a simple modeling approach, based solelyon EVI, can be utilized to give reliable estimates of GPP atsimilar ecosystems.
The relation between SIWSI and soil moisture was ob-served to be moderate, and a comparison between SIWSIand vegetation indices illustrated considerable redundancy,mainly due to similarities in seasonality. Results obtainedthrough multiple linear regression as well as through imple-menting a simple parametric LUE-model demonstrated thatSIWSI did not add further significant explanatory power tomeasured GPP values. The index failed early in the growingseason most likely due to low vegetation cover, leading to theconclusion that its use as a predictor of water stress in sim-ilar ecosystems, where vegetation the fraction is low, is re-stricted. Research using multi-year and site-wide flux towerand climate data sets is however required to further test theuse of MODIS indices in satellite data-driven primary pro-duction modeling over semi-arid areas in the Sahel.
Acknowledgements.We appreciate the assistance from the Agri-cultural Research Corporation (ARC) personnel in El Obeid andthe assistance from the people of Demokeya during fieldwork. Ourthanks also go out to Per Schubert for proofreading the manuscriptprior to submission. Finally, the anonymous reviewers are thankedfor their useful comments on the manuscript. Economic supportwas provided by the Swedish National Space Board (contract120/06), the Swedish Science Council, (contract 2004-3888) andthrough the EU-funded CARBOAFRICA project.
Edited by: G. Wohlfahrt
References
Asrar, G., Fuchs, M., Kanemasu, E. T., and Hatfield, J. L.: Es-timating Absorbed Photosynthetic Radiation and Leaf Area In-dex from Spectral Reflectance in Wheat, Agron. J., 76, 300–306,1984.
Aubinet, M., Grelle, G., Ibrom, A., Rannik, U., Moncrie, J., Foken,T., Kowalski, A. S., Martin, P. H., Berbigier, P., Bernhofer, C.,Clement, R., Elbers, J., Granier, A., Grunwald, T., Morgenstern,K., Pilegaard, K., Rebmann, C., Snijders, W., and Valentini, T.R. V.: Estimates of the annual net carbon and water exchangeof European forests: the EUROFLUX methodology, Adv. Ecol.Res., 30, 113–175, 2000.
Ceccato, P., Flasse, S., Tarantola, S., Jacquemoud, S., and Gregoire,J. M.: Detecting vegetation leaf water content using reflectancein the optical domain, Remote Sens. Environ., 77, 22–33, 2001.
Ceccato, P. and Flasse, S.: Designing a spectral index to estimatevegetation water content from remote sensing data – Part 2. Val-idation and applications, Remote Sens. Environ., 82, 198–207,2002.
Ceccato, P., Gobron, N., Flasse, S., Pinty, B., and Tarantola, S.:Designing a spectral index to estimate vegetation water contentfrom remote sensing data: Part 1 – Theoretical approach, RemoteSens. Environ., 82, 188–197, 2002.
Cheng, Y. B., Zarco-Tejada, P. J., Riano, D., Rueda, C. A., andUstin, S. L.: Estimating vegetation water content with hyper-spectral data for different canopy scenarios: relationships be-tween AVIRIS and MODIS indexes, Remote Sens. Environ., 105,354–366, doi:10.1016/j.rse.2006.07.005, 2006.
Daughtry, C. S. T., Gallo, K. P., and Bauer, M. E.: Spectral estimatesof solar radiation intercepted by corn canopies, Agron. J., 75,527–531, 1983.
Eck, T. F. and Dye, D. G.: Satellite estimation of incident photosyn-thetically active radiation using ultraviolet reflectance, RemoteSens. Environ., 135–146, 1991.
Eklundh, L. and Olsson, L.: Vegetation index trends for theAfrican Sahel 1982–1999, Geophys. Res. Lett., 30, 1430,doi:10.1029/2002gl016772, 2003.
Fensholt, R. and Sandholt, I.: Derivation of a shortwave infraredwater stress index from MODIS near- and shortwave infrareddata in a semiarid environment, Remote Sens. Environ., 87, 111–121, doi:10.1016/j.rse.2003.07.002, 2003.
Fensholt, R., Sandholt, I., Rasmussen, M. S., Stisen, S., and Diouf,A.: Evaluation of satellite based primary production modellingin the semi-arid Sahel, Remote Sens. Environ., 105, 173–188,doi:10.1016/j.rse.2006.06.011, 2006.
Field, C. B., Randerson, J. T., and Malmstrom, C. M.: Global netprimary production: combining ecology and remote sensing, Re-mote Sens. Environ., 51, 74–88, 1995.
Friborg, T., Boegh, E., and Soegaard, H.: Carbon dioxide flux, tran-spiration and light response of millet in the Sahel, J. Hydrol.,188-189, 633–650, 1997.
Gao, B. C.: NDWI – A normalized difference water index forremote sensing of vegetation liquid water from space, RemoteSens. Environ., 58, 257–266, 1996.
Giles, J.: How to survive a warming world, Nature, 446, 716–717,doi:10.1038/446716a, 2007.
Goward, S. N. and Huemmrich, K. F.: Vegetation canopy PAR ab-sorptance and the normalized difference vegetation index: anassessment using the SAIL model, Remote Sens. Environ., 39,
Biogeosciences, 6, 129–138, 2009 www.biogeosciences.net/6/129/2009/

M. Sjostrom et al.: Evaluation of satellite based indices for primary production estimates 137
119–140, 1992.Hanan, N. P. and Prince, S. D.: Stomatal conductance of west-
central supersite vegetation in HAPEX-Sahel: Measurementsand empirical models, J. Hydrol., 189, 536–562, 1997.
Hanan, N. P., Kabat, P., Dolman, J. A., and Elbers, J. A.: Photosyn-thesis and carbon balance of a Sahelian fallow savanna, GlobalChange Biol., 4, 523–538, 1998.
Herrmann, S. M., Anyamba, A., and Tucker, C. J.: Recenttrends in vegetation dynamics in the African Sahel and theirrelationship to climate, Global Environ. Chang., 15, 394–404,doi:10.1016/j.gloenvcha.2005.08.004, 2005.
Hickler, T., Eklundh, L., Seaquist, J. W., Smith, B., Ardo,J., Olsson, L., Sykes, M. T., and Sjostrom, M.: Precipita-tion controls Sahel greening trend, Geophys. Res. Lett., 32,doi:10.1029/2005GL024370, 2005.
Hilker, T., Coops, N. C., Wulder, M. A., Black, T. A., and Guy,R. D.: The use of remote sensing in light use efficiency basedmodels of gross primary production: A review of current sta-tus and future requirements, Sci. Total Environ., 404, 411–423,doi:10.1016/j.scitotenv.2007.11.007, 2008.
Houghton, R. A.: Why are estimates of the terrestrial carbon bal-ance so different?, Global Change Biol., 9, 500–509, 2003.
Huete, A., Liu, H. Q., and van Leeuwen, W. J. D.: The use of veg-etation indices in forested regions: issues of linearity and sat-uration, Geoscience and Remote Sensing, 1997. IGARSS ’97.“Remote Sensing – A Scientific Vision for Sustainable Develop-ment”, 1997 IEEE International, 4, 1966–1968, 1997.
Huete, A., Didan, K., Miura, T., Rodriguez, E. P., Gao, X., and Fer-reira, L. G.: Overview of the radiometric and biophysical perfor-mance of the MODIS vegetation indices, Remote Sens. Environ.,83, 195–213, 2002.
Hulme, M.: Climatic perspectives on Sahelian desiccation: 1973–1998, Global Environ. Chang., 11, 19–29, 2001.
IPCC: Summary for policymakers, in: Climate Change 2007: ThePhysical Science Basis. Contribution of Working Group I to theFourth Assessment Report of the Intergovernmental Panel onClimate Change, edited by: Solomon, S., Qin, D. Manning,, M.,Chen, Z., Marquis, M., Averyt, K. B., Tignor, M., and Miller, H.L., Cambridge, UK and New York, NY, USA, 2007.
Jonsson, P. and Eklundh, L.: Seasonality extraction by function fit-ting to time-series of satellite sensor data, IEEE T. Geosci. Re-mote, 40, 1824–1832, doi:10.1109/TGRS.2002.802519, 2002.
Jonsson, P. and Eklundh, L.: TIMESAT – a program for analyzingtime-series of satellite sensor data, Comput. Geosci., 833–845,doi:10.1016/j.cageo.2004.05.006, 2004.
Justice, C. O., Townshend, J. R. G., Vermote, E. F., Masuoka, E.,Wolfe, R. E., Saleous, N., Roy, D. P., and Morisette, J. T.: Anoverview of MODIS Land data processing and product status,Remote Sens. Environ., 83, 3–15, 2002.
Liang, S. L., Zheng, T., Liu, R. G., Fang, H. L., Tsay,S. C., and Running, S.: Estimation of incident photosyn-thetically active radiation from Moderate Resolution ImagingSpectrometer data, J. Geophys. Res.-Atmos., 111, D15208,doi:10.1029/2005jd006730, 2006.
Lloyd, J. and Taylor, J. A.: On the temperature dependence of soilrespiration, Funct. Ecol., 8, 315-323, 1994.
Miura, T., Huete, A. R., Yoshioka, H., and Holben, B. N.: An er-ror and sensitivity analysis of atmospheric resistant vegetationindices derived from dark target-based atmospheric correction,
Remote Sens. Environ., 78, 284–298, 2001.Monteith, J. L.: Solar radiation and productivity in tropical ecosys-
tems, J. Appl. Ecol., 9, 747–766, 1972.Monteith, J. L.: Climate and the efficiency of crop production in
Britain, Philosophical Transactions of the Royal Society of Lon-don, Series B, Biol. Sci., 281, 277–294, 1977.
Nemani, R. R. and Running, S. W.: Estimation of regional sur-face resistance to evapotranspiration from NDVI and thermal-IRAVHRR data, J. Appl. Meteorol., 28, 276–284, 1989.
Olofsson, P., Eklundh, L., Lagergren, F., Jonsson, P., and Lindroth,A.: Estimating net primary production for Scandinavian forestsusing data from Terra/MODIS, Adv. Space Res., 39, 125–130,doi:10.1016/j.asr.2006.02.031, 2007a.
Olofsson, P., Van Laake, P. E., and Eklundh, L.: Estimation ofabsorbed PAR across Scandinavia from satellite measurementsPart I: Incident PAR, Remote Sens. Environ., 110, 252–261,doi:10.1016/j.rse.2007.02.021, 2007b.
Olofsson, P., Lagergren, F., Lindroth, A., Lindstrom, J., Klemedts-son, L., Kutsch, W., and Eklundh, L.: Towards operational re-mote sensing of forest carbon balance across Northern Europe,Biogeosciences, 5, 817–838, 2008,http://www.biogeosciences.net/5/817/2008/.
Prince, S. D. and Goward, S. N.: Global primary production: Aremote sensing approach, J. Biogeogr., 22, 815–835, 1995.
Rahman, A. F., Sims, D. A., Cordova, V. D., and El-Masri, B. Z.:Potential of MODIS EVI and surface temperature for directlyestimating per-pixel ecosystem C fluxes, Geophys. Res. Lett., 32,L19404, doi:10.1029/2005GL024127, 2005.
Reichstein, M., Falge, E., Baldocchi, D., Papale, D., Aubinet,M., Berbigier, P., Bernhofer, C., Buchmann, N., Gilmanov,T., Granier, A., Grunwald, T., Havrankova, K., Ilvesniemi, H.,Janous, D., Knohl, A., Laurila, T., Lohila, A., Loustau, D., Mat-teucci, G., Meyers, T., Miglietta, F., Ourcival, J.-M., Pumpa-nen, J., Rambal, S., Rotenberg, E., Sanz, M., Tenhunen, J.,Seufert, G., Vaccari, F., Vesala, T., Yakir, D., and Valentini,R.: On the separation of net ecosystem exchange into assim-ilation and ecosystem respiration: review and improved algo-rithm, Global Change Biol., 11, 1424–1439, doi:10.1111/j.1365-2486.2005.001002.x, 2005.
Schmid, H. P.: Source areas for scalars and scalar fluxes, Bound.-Layer Meteor., 67, 293–318, 1994.
Seaquist, J. W. and Olsson, L.: Rapid estimation of photosynthet-ically active radiation over the West African Sahel using thePathfinder Land Data Set, Int. J. Appl. Earth Obs., 1, 205–213,1999.
Seaquist, J. W., Olsson, L., and Ardo, J.: A remote sensing-basedprimary production model for grassland biomes, Ecol. Model.,169, 131–155, doi:10.1016/S0304-3800(03)00267-9, 2003.
Seaquist, J. W., Olsson, L., and Eklundh, L.: Broad-scale increase inNPP quantified for the African Sahel, 1982–1999, Int. J. RemoteSens., 5115–5122, doi:10.1080/01431160600868458, 2006.
Sellers, S. J., Tucker, C. J., Collatz, G. J., Los, S. O., Jus-tice, C. O., Dazlich, D. A., and Randall, D. A.: A global 1-degrees by 1-degrees NDVI data set for climate studies. Part2: The generation of global fields of terrestrial biophysical pa-rameters from the NDVI, Int. J. Remote Sens., 15, 3519–3545,doi:10.1016/j.rse.2005.01.020, 1994.
Sims, D. A., Luo, H. Y., Hastings, S., Oechel, W. C., Rahman, A. F.,and Gamon, J. A.: Parallel adjustments in vegetation greenness
www.biogeosciences.net/6/129/2009/ Biogeosciences, 6, 129–138, 2009
138 M. Sjostrom et al.: Evaluation of satellite based indices for primary production estimates
and ecosystem CO2 exchange in response to drought in a South-ern California chaparral ecosystem, Remote Sens. Environ., 103,289–303, doi:10.1016/j.rse.2005.01.020, 2006a.
Sims, D. A., Rahman, A. F., Cordova, V. D., El-Masri, B. Z., Bal-docchi, D. D., Flanagan, L. B., Goldstein, A. H., Hollinger,D. Y., Misson, L., Monson, R. K., Oechel, W. C., Schmid,H. P., Wofsy, S. C., and Xu, L. K.: On the use of MODISEVI to assess gross primary productivity of North Americanecosystems, J. Geophys. Res. (G. Biogeosci.), 111, G04015,doi:10.1029/2006JG000162as, 2006b.
Sims, D. A., Rahman, A. F., Cordova, V. D., El-Masri, B. Z., Bal-docchi, D. D., Bolstad, P. V., Flanagan, L. B., Goldstein, A.H., Hollinger, D. Y., Misson, L., Monson, R. K., Oechel, W.C., Schmid, H. P., Wofsy, S. C., and Xu, L.: A new model ofgross primary productivity for North American ecosystems basedsolely on the enhanced vegetation index and land surface tem-perature from MODIS, Remote Sens. Environ., 112, 1633–1646,doi:10.1016/j.rse.2007.08.004, 2008.
Sitch, S., Smith, B., Prentice, I. C., Arneth, A., Bondeau, A.,Cramer, W., Kaplan, J. O., Levis, S., Lucht, W., Sykes, M. T.,Thonicke, K., and Venevsky, S.: Evaluation of ecosystem dy-namics, plant geography and terrestrial carbon cycling in the LPJdynamic global vegetation model, Global Change Biol., 9, 161–185, 2003.
Tucker, C. J.: Red and photographic infrared linear combinationsfor monitoring vegetation, Remote Sens. Environ., 8, 127–150,1979.
Tucker, C. J., Vanpraet, C., Boerwinkel, E., and Gaston, A.: Satel-lite remote sensing of total dry matter production in the Sene-galese Sahel, Remote Sens. Environ., 13, 461–474, 1983.
Tucker, C. J., Vanpraet, C. L., Sharman, M. J., and Van Ittersum, G.:Satellite remote sensing of total herbaceous biomass productionin the Senegalese Sahel: 1980–1984, Remote Sens. Environ., 17,233–249, 1985.
Van Laake, P. E. and Sanchez-Azofeifa, G. A.: Mapping PAR usingMODIS atmosphere products, Remote Sens. Environ., 94, 554–563, doi:10.1016/j.rse.2004.11.011, 2005.
Vermote, E. F., El Saleous, N. Z., and Justice, C. O.: Atmosphericcorrection of MODIS data in the visible to middle infrared: firstresults, Remote Sens. Environ., 83, 97–111, 2002.
Wang, Y.-P. and Leuning, R.: A two-leaf model for canopy con-ductance, photosynthesis and partitioning of available energy I:Model description and comparison with a multi-layered model,Agr. Forest. Meteorol., 91, 89–111, 1998.
Wieringa, J.: Representative roughness parameters for homoge-neous terrain, Bound.-Layer Meteor., 63, 323–363, 1993.
Xiao, X. M., Braswell, B., Zhang, Q., Boles, S., Frolking, S.,and Moore, B.: Sensitivity of vegetation indices to atmosphericaerosols: continental-scale observations in Northern Asia, Re-mote Sens. Environ., 84, 385–392, 2003.
Xiao, X. M., Hollinger, D., Aber, J., Goltz, M., Davidson, E. A.,Zhang, Q., and Moore, B.: Satellite-based modeling of gross pri-mary production in an evergreen needleleaf forest, Remote Sens.Environ., 89, 519–534, doi:10.1016/j.rse.2003.11.008, 2004.
Biogeosciences, 6, 129–138, 2009 www.biogeosciences.net/6/129/2009/