evaluation of sampling resolution in coral stable isotope
TRANSCRIPT
University of South Florida University of South Florida
Scholar Commons Scholar Commons
Marine Science Faculty Publications College of Marine Science
10-1996
Evaluation of Sampling Resolution in Coral Stable Isotope Evaluation of Sampling Resolution in Coral Stable Isotope
Records: A Case Study Using Records from New Caledonia and Records: A Case Study Using Records from New Caledonia and
Tarawa Tarawa
Terrence M. Quinn University of South Florida, [email protected]
Frederick W. Taylor University of Texas
Thomas J. Crowley Texas A & M University
Suzanne M. Link University of South Florida
Follow this and additional works at: https://scholarcommons.usf.edu/msc_facpub
Part of the Marine Biology Commons
Scholar Commons Citation Scholar Commons Citation Quinn, Terrence M.; Taylor, Frederick W.; Crowley, Thomas J.; and Link, Suzanne M., "Evaluation of Sampling Resolution in Coral Stable Isotope Records: A Case Study Using Records from New Caledonia and Tarawa" (1996). Marine Science Faculty Publications. 106. https://scholarcommons.usf.edu/msc_facpub/106
This Article is brought to you for free and open access by the College of Marine Science at Scholar Commons. It has been accepted for inclusion in Marine Science Faculty Publications by an authorized administrator of Scholar Commons. For more information, please contact [email protected].
PALEOCEANOGRAPHY, VOL. 11, NO. 5, PAGES 529-542, OCTOBER 1996
Evaluation of sampling resolution in coral stable isotope records: A case study using records from New Caledonia and Tarawa
Terrence M. Quinn, 1 Frederick W. Taylor, 2 Thomas J. Crowley, 3 and Suzanne M. Link •
Abstract. We have generated a 40-year-long, monthly stable isotope record from a Porites lutea coral collected offshore of Amedee, New Caledonia (22øS, 167øE) to investigate the relation between sampling resolution in coral isotope studies and retrieval of sea-surface environmental information. We interpret the high correlation between our oxygen isotope record and a twenty- year long sea-surface temperature record at the monthly timescale (r=-0.88) to indicate that our coral isotope record is an accurate monitor of environmental conditions offshore of Amedee. The character of the signal and the percent variance explained in the record at the annual band, at the quasi-biennial oscillation band ((QBO) 2.0-2.4 years), and at the E1 Nino-Southern Oscillation band ((ENSO) 3-8 years) changes little in response to a reduction in sampling density from monthly to bimonthly to quarterly. Similar results have been obtained in a reanalysis of a coral isotope record from Tarawa, Kiribati. Our results indicate that a significant amount of the information obtained from high-density sampling can also be retrieved from lower-density sampling. In particular, bimonthly sampling yields virtually no drop-off in variance explained, and quarterly sampling is satisfactory for resolving interannual and decadal-scale trends in time series. The proposed sampling approach may enable a more rapid filling in of numerous spatial holes in coral sampling sites needed for reconstruction of long-term decadal-scale variations in climate.
Introduction
Geochemical measurements, both isotopic and elemental, of the aragonite coral skeleton have been increasingly used as a proxy measure of environmental conditions near the sea surface in recent years [e.g., Dunbar and Cole, 1993]. Corals are particularly well suited for high-resolution studies because skeletal aragonite is deposited at rapid but variable rates (e.g., several millimeters to several centimeters per year). Skeletal growth rate (i.e., linear extension rate) is primarily a function of water temperature and water depth [Weber et al., 1975; Baker and Weber, 1975] and varies seasonally, producing seasonal growth bands with different densities that are visible by X-radiography [Knutson et al., 1972; Dodge and Vaisnys, 1975]. A couplet of low- and high-density bands in the coral skeleton is generally considered to demarcate a "year." However, it is recognized that density-band formation is a complex physiological process which does not always have a direct correlation with the calendar year [e.g., Lough and Barnes, 1990; Barnes and Lough, 1992; Taylor et al., 1993].
Despite the recent growth in coral studies, little of this work has focused on a systematic and objective determination
•Department of Geology, University of South Florida, Tampa. 2University of Texas Institute for Geophysics, Austin. 3Department of Oceanography, Texas A&M University, College Station.
Copyright 1996 by the American Geophysical Union.
Paper number 96PA01859. 0883-8305/96/96PA-01859512.00
as to the level of sampling resolution required to solve specific climate-related problems. In fact, an approach sometimes used is to sample the record as densely as possible, with the implicit assumption that more samples yield more information. Yet this assumption is not entirely justifiable from the climatological viewpoint, for there is a significant correlation of climate statistics on a seasonal timescale, and higher sampling resolution could potentially provide statistically redundant information. Stated differently, if the autocorrelation of a time series is 2-3 months, then monthly samples do not yield statistically significant independent information.
Multicentury coral climate records are limited in number and in spatial coverage at this time. Given these factors, one can argue that more coral climate records at lower temporal resolution would provide more useful information, from a climate perspective, than fewer records at higher resolution. The question then becomes, What is the temporal resolution needed to maximize the amount of climate information
retrieved per unit of analysis? To address this question, we have conducted such a study using the oxygen and carbon isotope variations in a modern coral from New Caledonia. In addition to examining the record at New Caledonia, we examined a previously published coral isotope record from Tarawa, Kiribati (LDGO-39 [Cole and Fairbanks, 1990]). Our evaluation of this data set is particularly relevant because variations in coral oxygen isotope values at Tarawa have been well documented to be driven by variations in the õ18Owatev in contrast to the SST(sea-surface temperature)-driven system we interpret to be operative at New Caledonia.
529

530 QUINN ET AL.: SAMPLING RESOLUTION IN CORAL STABLE ISOTOPE RECORDS
Regional Setting
New Caledonia (22øS, 166øE) is located in the eastern sector of the Coral Sea slightly north of the Tropic of Capricorn (Figure 1). New Caledonia is oriented in a northwest-southeast direction and is -450 km long and 50-70 km wide. Ocean waters circulate from the northwest to the southeast along the northeast coast (the Loyalty Current) and generally from the southeast to the northwest along the southwestern coast (South Tropical Current) [Rougerie, 1986]. Climatological records at Noumea, a southerly coastal city at an elevation of 70 m, permit the calculation of the following average annual values: air temperature of -24'C (1965-1978), precipitation of 1020 mm (1956-1975), sunshine hours of 2475 hours (1951- 1975), and evaporation of 1350 mm (1951-1975) [Rougerie, 1986].
Our Porites lutea coral was collected in the vicinity of the Amedee Lighthouse (22'29'S, 166'27'E), which is located 20 km due south of Noumea, New Caledonia, slightly landward of the barrier reef and within Boulari Pass (Figure 1). This locality was chosen because corals living offshore of Amedee
Island are well bathed by open-ocean marine waters, and daily temperature and salinity measurements have been made there since 1967. In addition, measurements of the oxygen isotopic composition of seawater at this locality have been made [e.g., Beck et al., 1992], and an average value of 0.52%0 (SMOW) has been determined. Hence we can relate isotopic variability observed in our coral with environmental change at the sea surface.
The French research group ORSTOM (Institut Francais de Recherch6 Scientifique et Technique pour le D6veloppement en Coop6ration) have made daily measurement of SST and SSS(sea-surface salinity) for over 20 years (Figure 2). The SST record exhibits regular annual variations, whereas the SSS record shows less regular oscillations with minima in the austral summers of 1976, 1983, 1986, and 1989. Analysis of the ORSTOM data indicate that the mean annual SST is
23.49ñ3.6øC (2 o; mean annual range of 5.3øC) and mean annual SSS is 35.69ñ0.46%o (2 o; mean annual range of 0.55%o). SSS values reach a minimum in March and a maximum in October (Figure 2). The minimum annual range in SSS is 0.25%o and the maximum range is 1.02%o. SST is
140øE 150øE 160øE 170øE 180øE 170øW
.•South Eauatorial Current (northern branch)
,•, ,• Solomon •h Equatorial C,,•ounter Current 1 New• r •l.qland.q South Equatorial C'•rrent (southern branch) -- 10øS Georgia '•,
o
20 S
30 S
y .Vanuatu •'•'----..-__ Fiji •' Coral Sea
,%.•..Loyalty South '•['•,,C urrent Tropical Cotl• Tropical Australian New Caledonia •
Current
New Caledoniai
%q•øo• Agmede e Boular' P• o
Coral Sea I "'%,'• 166ø30 ' • 167øE
Figure 1. Location map of the Coral and Tasman Seas of the South Pacific. Our coral sample came from just offshore of Amedee Island (22ø29'S, 166ø27'E), which is located 20 km due south of Noumea, New Caledonia, slightly landward of the barrier reef and within an ocean pass (Boulari Pass).

QUINN ET AL.: SAMPLING RESOLUTION IN CORAL STABLE ISOTOPE RECORDS
28 1,1,1,1,1•1,
24 "
22
20
18 I'1'
I,l,l,l,l,l,l,llll
I'1'1'1'1'1' I' I'1'
36.8
36.4
36.0
35.6
35.2
34.8
,I,I
500 I , I , I , I , I , I , I , I , I , I , I , I , I , I , I , I Rainfall (mm) L 4OO
3OO
2OO
100
0
1975 1977 1979 1981 1983 1985 1987 1989
Figure 2. Time series of monthly averages of daily measurements of sea-surface temperature, sea-surface salinity, and rainfall. Seawater salinity and temperature measurements were made in the shallow waters offshore of the lighthouse of Amedee Island. Dashed lines indicate mean annual values of SST and SSS. Monthly rainfall data collected at the coastal city of Noumea (all data from C. Henin, ORSTOM).
531
negatively correlated with SSS (r=-0.40). Maximum SST values occur during January, February, and March and have a near constant value of ~26øC. Minimum SST values occur
during July, August, and September and have a near constant value of ~21øC (Figure 2). Because we use the annual cycle of õ180 as a check on the coral chronology, we examined the duration of time between successive "annual" peaks in the SST time series. Minima vary from 13 months (4 years), 12 months (14 years) and 11 months (2 years). Successive "annual" maxima in the SST time vary from 13 months (4 years), 12 months (6 years), 11 months (7 years) and 10 months (1 year).
Ideally, environmental studies that use oxygen isotopes of biological carbonates include measurements of all of the environmental factors that influence the measured isotopic value of the carbonate (i.e., temperature and õ180 of the ambient fluid). In studies of modern corals, historical records of variation of SST and SSS provide important starting points for isotopic calibration. Clearly, a detailed water sampling component to modern coral studies provides significant
additional constraints. However, the remoteness of many climatically sensitive coral localities makes historical records of SST and SSS relatively rare; records of variations in seawater õ180 are rarer still.
We feel fortunate that historical measurements of daily SST and SSS are available from ORSTOM for our New Caledonia
coral site for the past 25 years. In addition, a few measurements of •18Owate r have been made in the past, and a detailed water sampling program is now being conducted under the auspices of ORSTOM. A seawater sample collected in August of 1990 near our coral site was determined by Beck et al. [1992] to have an oxygen isotopic composition of 0.52ñ0.06%o (2 o; SMOW). A seawater sample collected in December 1994 near our coral site was determined to have the
same value as the one determined Beck et al. [1992] (J. Recy, personal communication and unpublished data, 1995). We use the instrument record of SST and SSS variations and the few
measurements of the •18Owate r at New Caledonia to constrain the environmental source of the isotopic variation measured in our coral.
532 QUINN ET AL.: SAMPLING RESOLUTION IN CORAL STABLE ISOTOPE RECORDS
Methods
Coral Sampling
We drilled a-•3.45-m-long, 4.5-cm-diameter core nearly down the vertical axis of maximum growth of the Porites lutea coral head in July 1992 near the lighthouse on Panedee Island, New Caledonia. This sample was collected alive at -•3 m water depth, less than a few hundred meters from the location of the daily SST and SSS measurements. The coral was slabbed to a thickness of 5 mm. X-radiographs of the coral slab were taken under exposure conditions of 55 kV, 3 mA, with an exposure time of 20 s. X-radiographs revealed highly regular and well- developed annual density bands (Figure 3).
The physical sampling of the coral skeleton is usually accomplished by drilling discrete spots with a dental bit [e.g., Cole and Fairbanks, 1990; Dunbar et al., 1994] or by sawing small blocks of sample using a steel or diamond saw blade [e.g., Shen et al., 1992; Dunbar et al., 1994]. Physical sampling of the coral skeleton is initially guided by the position of a density-band couplet. Hence sampling resolution is often initially defined as the number of samples per density-band couplet (samples/dbc). Forty density-band couplets were observed to occur in 49.25 cm in our New Caledonia coral, yielding an average annual growth rate for this 40-year period of 1.23 cm/year. Growth rate varied from a low 1.08 cm/year to a high of 1.32 cm/year during this interval.
We sampled the coral slab at a resolution of 1.03 mm/sample, which yielded 12 samples/dbc (i.e., we drilled and removed powder every 1.03 mm). Drill bit diameter was 1 mm and sample depth was 0.5 mm. The sampling device used in this study was a computer-aided triaxial sampler (CATS). In this device, the hand-held portion of a dentist's drill is clamped in a small vise which is bolted to the movable base of the sampler; the latter is inclined at-30' from horizontal and controls the in and out movement of the sample. The coral slab is held in place on a motorized stage that is oriented perpendicular to the base, and this stage controls the up and down movement of the sample. The stage that holds the coral slab is itself attached at 90' to a third motorized stage which controls the right to left movement of the sample. The starting and ending coordinates along with the depth and length of each drilled interval are input to the software program that runs the sampling device. Sampling of corals usually involves a sample length on the order of millimeters; however, the CATS device can be used to sample on the order of tens of microns. Used in the fashion described above, the
CATS device generates a series of continuously routed samples along a straight pathway, although sampling along curved pathways is also possible (e.g., mollusc shells).
A study of the effect of sampling resolution on the fidelity of environmental reconstructions using the geochemistry of coral skeletons potentially could use several sampling strategies, including (1) the use of different sampling resolutions in parallel adjacent portions of the coral slab; (2) the use of a single sampling path and randomly averaging measured values along that path; and (3) the use of a single sampling path and sequentially averaging contiguous samples. We chose not to employ the first sampling scheme because this approach introduces intraskeletal variation as an
additional source of variability, especially in light of the potential for temporal miscorrelations between adjacent sampling paths. Hence we chose to hold sample pathway constant and vary the number of samples along that pathway instead of choosing several parallel pathways and holding the number of samples per pathway constant. One example of the latter sampling strategy was performed by Dunbar et al. [1994], who determined that the/5180 value of annual samples from a Galapagos coral closely approximated the mean value of each year's nearly monthly samples. A more extensive examination of this sampling strategy is underway. We chose not to employ the second sampling scheme (i.e., random sampling along a single pathway) because the coral skeletonogenesis proceeds in a sequential, not random, manner, and we did not want to compromise the temporal integrity of the study. In this study, we chose to use a single sample pathway and to vary the sampling density along that pathway by mathematically averaging contiguous samples taken at higher resolution to generate a low-resolution database. We recognize that the statistical resampling approach could produce different isotopic values than a physical resampling approach due to the effects of variations in skeletal density (e.g., high-density skeletal regions will be overemphasized relative to low-density skeletal regions).
Stable Isotope Analyses
We generated a 40-year-long stable isotope record to produce a sufficient number of annual and interannual cycles so that we could perform statistical and spectral analyses with the data. Stable isotopic analyses were performed at the University of Michigan. Prior to isotopic analysis, powdered coralline aragonite samples were vacuum roasted for 1 hour at 200øC. Samples were reacted with anhydrous phosphoric acid at 75øC in individual reaction vessels of a CarboKiel
carbonate-extraction system coupled to the inlet of a MAT 251 mass spectrometer. Precision (+1 c•) was monitored by daily analyses of a powdered calcite standard (NBS-20) and was better than 0.04%0 for both oxygen and carbon. The average standard deviation of 46 replicate analyses of coral samples is 0.10%o for oxygen and 0.07%0 carbon. Values are reported in standard fi notation relative to the Chicago Pee Dee belemnite (PDB) standard after correction for the 170 contribution.
Coral Chronology
All studies that use geochemical tracers as proxy measurements of environmental variations in seawater
eventually need to convert from the depth domain (e.g., samples/dbc) to the time domain (samples per year). This is commonly done by assigning a calendar year to each density- band couplet. In the absence of unambiguous density banding, or as a refinement to an initial age model based on density banding the annual cycle in some measured geochemical variable (e.g., fi13C [Cole et al., 1993; Carriquiry et al., 1994] or •180 [Beck et al., 1992; Dunbar et al., 1994]) is often used to convert depth to age. Counting of density-band couplets, however, remains a conventional means by which time is demarcated in coral studies. Indeed, mass spectrometric 230Th dating performed on samples from near the base of two long corals (Vanuatu [Edwards et al., 1987; Taylor et al., 1990]; Galapagos [Dunbar et al., 1994]) confirm age assignments

QUINN ET AL.' SAMPLING RESOLUTION IN CORAL STABLE ISOTOPE RECORDS 533
Figure 3. X-radiograph of Porites lutea. Note the well-developed high- and low-density band couplets. Individual sampling paths axe indicated by the white tracks in the X ray print. White circles show deeper drill holes used for distance calibration purposes.
534 QUINN ET AL.: SAMPLING RESOLUTION IN CORAL STABLE ISOTOPE RECORDS
based on density-band counting within the respective errors of both techniques. The results of coral studies are most often reported in the time domain, and hence sampling resolution is also referred to in the time domain. Sampling resolution in coral studies has ranged from biennial [e.g., Druffel and Griffin, 1993] to annual [e.g., Dunbar et al., 1994] to twice yearly [e.g., Quinn et al., 1993] to quarterly [e.g., Shen et al., 1992; Delaney et al., 1993] to bimonthly [e.g., Carriquiry et al., 1994] to monthly [e.g., Cole et al., 1993; Linsley et al., 1994] to near weekly [Gagan et al., 1994].
We recognize that it is not completely accurate to refer to the sampling resolution as monthly, bimonthly, etc., because the increment of coral representing a year varies, and within that year of coral growth, the growth rate varies, making it possible to be off in time by 1-2 months. Subannual variations in growth rate result in an under representation of the amount of coral sampled during the slow growing times of the year relative to the fast growing times of the year. Hence, because seawater temperature and coral skeletal growth rates are positively correlated [Weber et al., 1975; Baker and Weber, 1975], environmental conditions during warm-water periods when skeletal growth is fast will be preferentially recorded by the coral skeleton relative to the cool-water periods when skeletal growth is slow [e.g., Lough et al., 1996].
To address these problems, oxygen and carbon stable isotopic values were converted from the depth domain (e.g., samples/dbc) to the time domain (samples/year) in two steps. First, a calendar year was assigned to each density-band couplet and hence to every twelve samples assuming linear subannual skeletal extension. Second, systematic variations in oxygen isotopic composition were correlated with monthly SST values using visual curve matching between minimum peaks of SST values and maximum $18 O values and vice versa. The effect of this curve-matching technique was to change the number of samples per year from the original preset value of 12 to values that ranged from 9 to 14. Because the resulting database of stable isotopic variations versus time had an unequal time increment, we ran the TIMER program of the ARAND software package [Imbrie et al., 1989] to recast the original data into a time series having equal time steps, in this case 12 samples/year, via linear interpolation.
Statistical Subsampling of Time Series
Since the main motivation of this study is to determine optimum sampling intervals for coral-based climate studies, a number of different approaches could be tried on this problem. For example, the core could have been physically resampled at various intervals: 2/year, 4/year, etc. However, this approach introduces analytical errors in addition to the errors associated with the subsampling problem, as was discussed previously. We believe it is first necessary to determine the reproducibility of records under the most optimum conditions, in which it is assumed that the point measurements are known and true. This approach enables determination of information loss in its purest form. It is necessary for any investigators planning to apply our method to recognize this distinction between the subsampling error and the analytical error in any time series. Our philosophy is that if we can demonstrate that the subsampling error is small, then the loss of information
due to sampling considerations is not a major problem. For this reason, our study focuses on the amount of information loss due to subsampling problems alone.
The subsampling problem can be approached in at least two different ways, both of which mimic different physical sampling strategies. In the first case, the newly interpolated 12/year data set can be subsampled at set intervals to mimic a coarser spacing between drillholes due to "spot sampling." In the second case, the interpolated data set can be averaged; for example, an average of three adjacent samples yields estimates of quarterly resolution. This latter case would mimic samples retrieved by the "continuous routing" method. We created low- resolution time series from our high-resolution time series by both of these techniques (i.e., statistically spot sampling and continuously routed sampling). We also calculated independent age models for each lower-resolution isotope time series by curve matching with similar lower-resolution environmental records (e.g., bimonthly coral isotope records were compared with bimonthly records of SST variation) to assure that the lower-resolution records did not depend on the higher-resolution samples for their chronology.
Quantitative Analyses
Spectral analyses were performed on the coral isotope time series using the SPECTRAL program of the ARAND software package [lmbrie et al., 1989]. Output from the SPECTRAL program includes spectral density, which is defined as the square of the variance divided by the frequency, and hence the variance at each frequency is known. Determinations of the amount of variance at a given frequency were done by integrating the entire spectral peak at the frequency of interest and not simply by measuring the peak height at the singular value of the frequency of interest. Statistical calculations were performed using the STATVIEW program, and all correlation coefficients are reported at the 95% confidence level.
Results
New Caledonia Coral Record
The mean oxygen and carbon isotope value for the entire time series is -4.46+0.58 (2 cy) and-1.26:t:0.50 (2 respectively. The oxygen isotope time series shows well organized cyclic variations, whereas the carbon isotope time series shows less well organized variations (Figure 4).
Stable isotopic and environmental variations. A statistical summary of the relationship between stable isotopic values and measurements of environmental variability over the time period of overlap in the records (1989-1969) is presented in Table 1. Monthly averages of daily measurements of SST correspond remarkably well with the $18 O record (Figure 5), after the troughs in SST and peaks in isotopic values are aligned. Such an alignment is conventionally employed in coral studies and is further justified at New Caledonia because the observed minimum and maximum values of $ST are seasonally constant over the 20 years of measurement.
One approach to calibrating the coral /5180 - temperature relation is to calculate the conversion factor by comparing annual skeletal /5180 extrema versus corresponding annual

QUINN ET AL.: SAMPLING RESOLUTION IN CORAL STABLE ISOTOPE RECORDS 535
-5.5
-3.5
•180 (%0 PDB)
1950 1955 1960 1965 1970 1975 1980 1985 1990 1995
-2.5
0.0
1950 1955 1960 1965 1970 1975 1980 1985 1990 1995
Figure 4. Forty-year-long monthly time series of oxygen and carbon isotope variations in the P. lutea coral from New Caledonia. The oxygen isotope time series shows well-defined seasonal variations, whereas variations in the carbon isotope time series are less well organized.
extrema in monthly mean SST [e.g., McConnaughey, 1989]. While this technique produces a higher correlation coefficient, we see no a priori reason to exclude any of the data when determining coral õ180 - temperature relation. Our calculation of a least squares correlation coefficient (r) between monthly measurements of õ180 and SST produces a relation that can be expressed by the equation
T(øC) = 0.02 - 5.28 (818Oaragonite) r=0.88 (1)
value to be real and not an artifact of sampling resolution, because our monthly isotope record and a record sampled with near-weekly resolution have nearly coincident values. We further interpret the striking similarity in the 8180- temperature calibration between our study and the study of Gagan et al. [1994], despite the different physical sampling techniques and resolutions used in each study, to indicate that our sampling technique does not compromise the accurate extraction of environmental information.
The slope of equation (1) (5.28øC per 19oo) is somewhat greater than is often observed in coral studies; values ranging from 3.5 to 5.0 are more typical [e.g., Weber and Woodhead, 1972; McConnaughey, 1989]. Empirical and laboratory experiments define the slope term to be -4.5, a value that produces the widely recognized 8•80 - temperature calibration of 0.22q'oo/*C [Epstein et al., 1953; Tarutani et al., 1969; Grossman and Ku, 1986]. We note that a 6-year-long stable isotope record with near-weekly sample resolution from the Great Barrier Reef determined the 8•80 - temperature calibration to be 0.18q'oo/*C for Porites lutea [Gagan et al., 1994], the same coral species used in this study. Hence we interpret the difference between our calculated slope value (0.189%o/*C) and the oft-cited slope value of 0.22q'oo/*C slope
Table 1. Least Squares Correlation Coefficients for Stable Isotopic Records from New Caledonia Coral and Instrumental Records (1989-1969)
818 0 813C SaT a ass a Precipitation b
8•80 1.00 813C 0.49 1.00 SST a -0.88 -0.33 1.00
ass a 0.43 0.24 -0.40
Precipitation b -0.33 -0.26 0.33 1.00
-0.17 1.00
aData from ORSTOM.
bRecorded at the coastal city of Noumea.

536 QUINN ET AL.' SAMPLING RESOLUTION IN CORAL STABLE ISOTOPE RECORDS
-5.5
7• -4.0 --
-3.5
I I I I I I I I
1965 1970 1975 1980 1985 19,
3O
28
24,,
22
•0
Figure 5. Monthly SST record and the high-resolution coral oxygen isotope record. The goodness of fit between the two time series, as measured by the least squares correlation coefficient, is 0.88.
Stable isotopic variations and sampling resolution. Forty annual cycles are evident in the oxygen isotope record (defined based on successive maxima in õ180 value), a number that is in exact agreement with the chronology determined by counting density-band couplets. Each of the lower-resolution records also yielded 40 years of isotopic variation. Hence the age models for each of the
lower-resolution isotope records are independent of the original higher-resolution isotope record.
The character of the õ180 signal exhibits modest change in response to changes in sampling density (Figure 6) whether the time series is generated by spot sampling or by continuous routing approaches (Figure 7). Another way to evaluate the time series is to determine estimates of mean annual values
-5.5
-5.0
-4.5
-4.0
-3.5
i
I, I, I [, I, I, I, I I , I , I I , I , I , I , I I (b) i i : i i :
. .
, , , I , I , I , I , I , -5.5 , , ' I ' I ' I ' I ' I '
(c) i i :
-5.0 i ' • -4.5
, I ' I '
, i ,
-5.5
-5.0
-4.5
-4.0
-3.5
-4.0
, , , i, I , ' i' i, I -5.5 -3.5 , ' ' ' I ' I ' ' ' I ' I ' I ' (d) . :
::. i -4.5 ....... 4.0
1970 1974 1978 1982 1986 1990
Figure 6. New Caledonia coral oxygen isotope time series sampled (a) monthly, (b) bimonthly, (c) quarterly, and (d) twice yearly. Note that the character of the signal is little changed as a result of changes in sampling density, especially in the bimonthly and quarterly records.
QUINN ET AL.: SAMPLING RESOLUTION IN CORAL STABLE ISOTOPE RECORDS 537
I I ' I ' I ' I ' I ' I ' I ' I ' 15•O (%0 PDB) -5.0 -- o --
' .9, o '. •
-4.5 •e " ;: • : : • • o :
-4.0 --
1970 1974 1978 1982 1986 1990
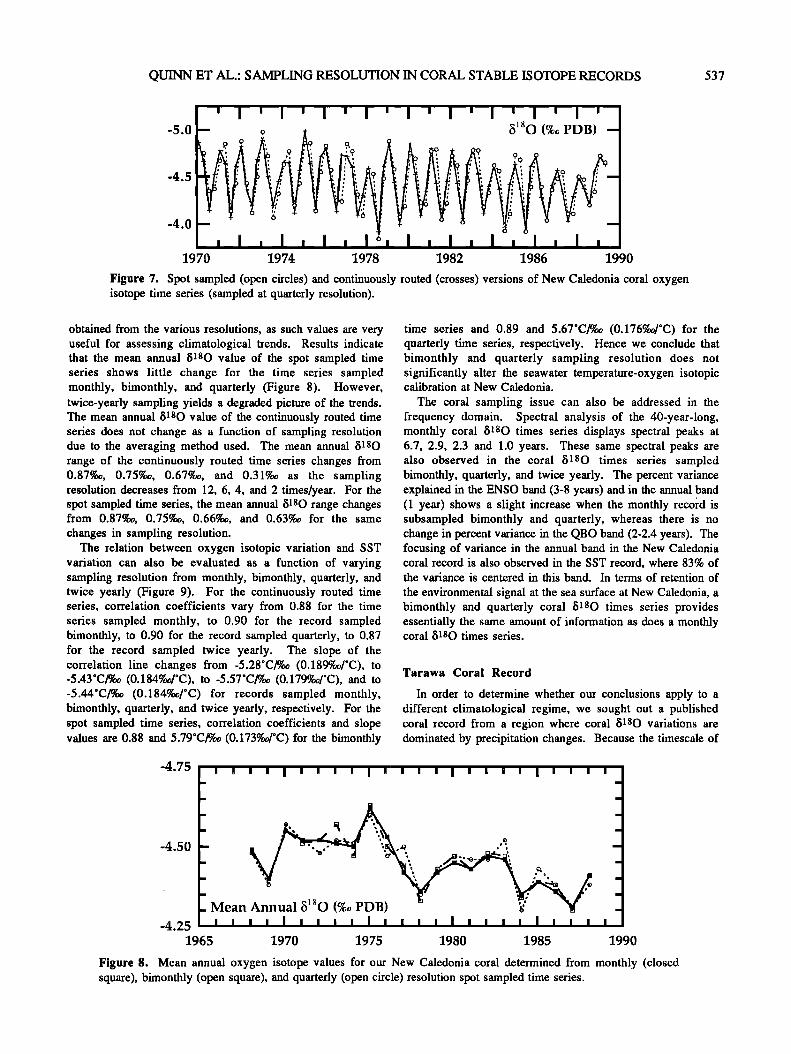
Figure 7. Spot sampled (open circles) and continuously routed (crosses) versions of New Caledonia coral oxygen isotope time series (sampled at quarterly resolution).
obtained from the various resolutions, as such values are very useful for assessing climatological trends. Results indicate that the mean annual õ180 value of the spot sampled time series shows little change for the time series sampled monthly, bimonthly, and quarterly (Figure 8). However, twice-yearly sampling yields a degraded picture of the trends. The mean annual õ180 value of the continuously routed time series does not change as a function of sampling resolution due to the averaging method used. The mean annum õ180 range of the continuously routed time series changes from 0.87%0, 0.75%0, 0.67%0, and 0.31%o as the sampling resolution decreases from 12, 6, 4, and 2 times/year. For the spot sampled time series, the mean annum õ180 range changes from 0.87%0, 0.75%0, 0.66%0, and 0.63%0 for the same changes in sampling resolution.
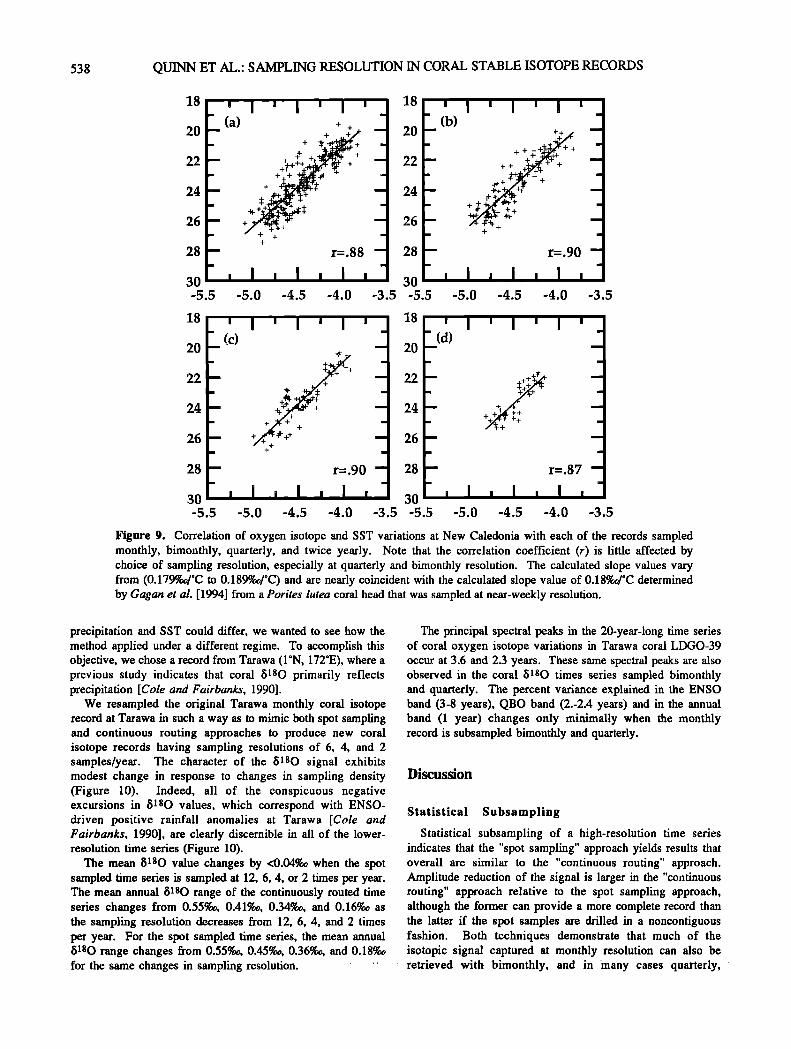
The relation between oxygen isotopic variation and SST variation can also be evaluated as a function of varying sampling resolution from monthly, bimonthly, quarterly, and twice yearly (Figure 9). For the continuously routed time series, correlation coefficients vary from 0.88 for the time series sampled monthly, to 0.90 for the record sampled bimonthly, to 0.90 for the record sampled quarterly, to 0.87 for the record sampled twice yearly. The slope of the correlation line changes from -5.28øC/%o (0.189%o/øC), to -5.43øC/%o (0.184%o/øC), to -5.57øC/%o (0.179%døC), and to -5.44øC/%o (0.184%o/øC) for records sampled monthly, bimonthly, quarterly, and twice yearly, respectively. For the spot sampled time series, correlation coefficients and slope values axe 0.88 and 5.79øC/%o (0.173%døC) for the bimonthly
time series and 0.89 and 5.67øC/%o (0.176%o/øC) for the quarterly time series, respectively. Hence we conclude that bimonthly and quarterly sampling resolution does not significantly alter the seawater temperature-oxygen isotopic calibration at New Caledonia.
The coral sampling issue can also be addressed in the frequency domain. Spectral analysis of the 40-year-long, monthly coral 8180 times series displays spectral peaks at 6.7, 2.9, 2.3 and 1.0 years. These same spectral peaks are also observed in the coral 8180 times series sampled bimonthly, quarterly, and twice yearly. The percent variance explained in the ENSO band (3-8 years) and in the annual band (1 year) shows a slight increase when the monthly record is subsampled bimonthly and quarterly, whereas there is no change in percent variance in the QBO band (2-2.4 years). The focusing of variance in the annual band in the New Caledonia coral record is also observed in the SST record, where 83% of the variance is centered in this band. In terms of retention of
the environmental signal at the sea surface at New Caledonia, a bimonthly and quarterly coral õ180 times series provides essentially the same amount of information as does a monthly coral 8180 times series.
Tarawa Coral Record
In order to determine whether our conclusions apply to a different climatological regime, we sought out a published coral record from a region where coral õ180 variations are dominated by precipitation changes. Because the timescale of
-4.75
-4.50
-4.25 1965 1970 1975 1980 1985
i
i
Mean
1
1
1
,t 1990
Figure 8. Mean annual oxygen isotope values for our New Caledonia coral determined from monthly (closed square), bimonthly (open square), and quarterly (open circle) resolution spot sampled time series.
538 QUINN ET AL.' SAMPLING RESOLUTION IN CORAL STABLE ISOTOPE RECORDS
18 I ' I I ' 20 (a) ß +•++?
26 + + +
28 -- r=.88 --
30' -5.5 -5.0 -4.5 -4.0 -3.5
' I I I ' (b)
m •'• +'t'
-- r=.90 --
-5.5 -5.0 -4.5 -4.0 -3.5
18
30 -5.5
I ' I ' I (c)
I
' (d) I
m
1
1
1
1
1
r=o90 -'
-4.5 -4.0 -3.5 -5.0 -5.5 -5.0 -4.5
m
m
m
m
m
m
m
r=.87 --
I ,
-4.0 -3.5
Figure 9. Correlation of oxygen isotope and SST variations at New Caledonia with each of the records sampled monthly, bimonthly, quarterly, and twice yearly. Note that the correlation coefficient (r) is little affected by choice of sampling resolution, especially at quarterly and bimonthly resolution. The calculated slope values vary from (0.179%o/*C to 0.189%o/*C) and are nearly coincident with the calculated slope value of 0.18%d*C determined by Gagan et al. [1994] from a Porites lutea coral head that was sampled at near-weekly resolution.
precipitation and SST could differ, we wanted to see how the method applied under a different regime. To accomplish this objective, we chose a record from Tarawa (l'N, 172'E), where a previous study indicates that coral •5180 primarily reflects precipitation [Cole and Fairbanks, 1990].
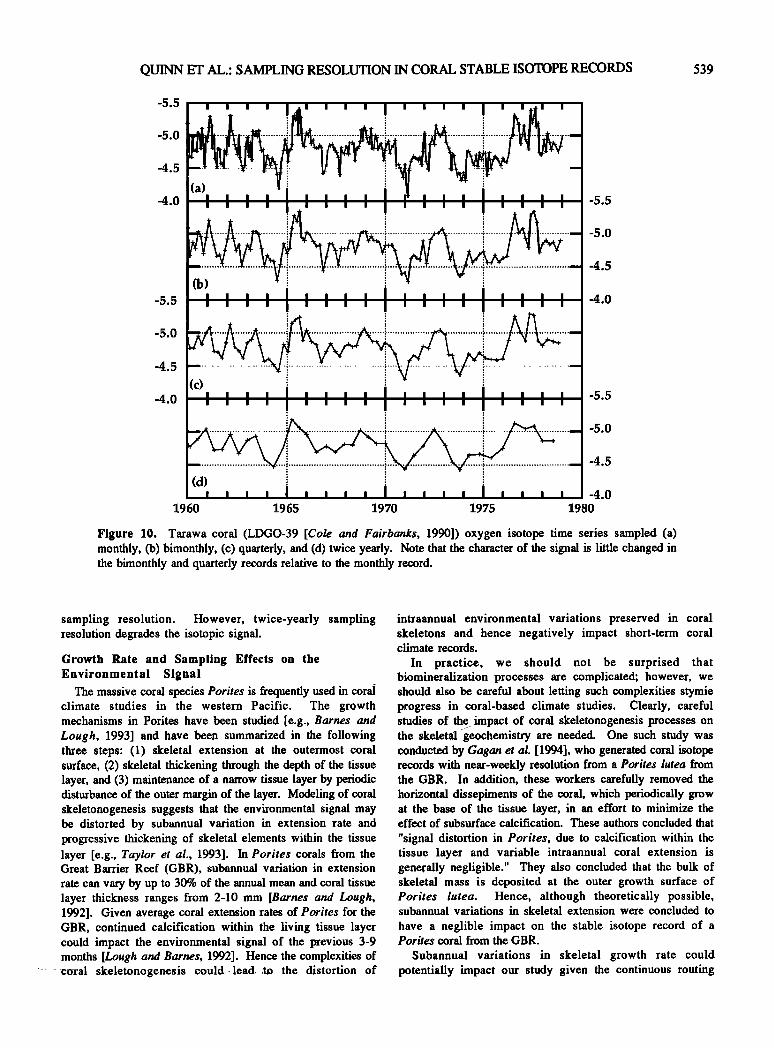
We resampled the original Tarawa monthly coral isotope record at Tarawa in such a way as to mimic both spot sampling and continuous routing approaches to produce new coral isotope records having sampling resolutions of 6, 4, and 2 samples/year. The character of the õ180 signal exhibits modest change in response to changes in sampling density (Figure 10). Indeed, all of the conspicuous negative excursions in •5180 values, which correspond with ENSO- driven positive rainfall anomalies at Tarawa [Cole and Fairbanks, 1990], are clearly discernible in all of the lower- resolution time series (Figure 10).
The mean õ180 value changes by <0.04%0 when the spot sampled time series is sampled at 12, 6, 4, or 2 times per year. The mean annual õ180 range of the continuously routed time series changes from 0.55%0, 0.41%o, 0.34%0, and 0.16%o as the sampling resolution decreases from 12, 6, 4, and 2 times per year. For the spot sampled time series, the mean annual õ180 range changes from 0.55%0, 0.45%0, 0.36%0, and 0.18%o for the same changes in sampling resolution.
The principal spectral peaks in the 20-year-long time series of coral oxygen isotope variations in Tarawa coral LDGO-39 occur at 3.6 and 2.3 years. These same spectral peaks are also observed in the coral õ•80 times series sampled bimonthly and quarterly. The percent variance explained in the ENSO band (3-8 years), QBO band (2.-2.4 years) and in the annual band (1 year) changes only minimally when the monthly record is subsampled bimonthly and quarterly.
Discussion
Statistical Subsampling
Statistical subsampling of a high-resolution time series indicates that the "spot sampling" approach yields results that overall are similar to the "continuous routing" approach. Amplitude reduction of the signal is larger in the "continuous routing" approach relative to the spot sampling approach, although the former can provide a more complete record than the latter if the spot samples are drilled in a noncontiguous fashion. Both techniques demonstrate that much of the isotopic signal captured at monthly resolution can also be retrieved with bimonthly, and in many cases quarterly,
QUINN ET AL.: SAMPLING RESOLUTION IN CORAL STABLE ISOTOPE RECORDS
-5.5
-5.0
-4.5
-4.0
-5.5
-5.0
-4.5
-4.0
I I I I
..
, o
, , , , I , , , , I , , , , I , , , , ' ' ' ' I ' ' ' ' I ' ' ' ' I ' ' ' '
1960 1965 1970 1975
-5.5
-5.0
-4.5
-4.0
-5.5
-5.0
-4.5
-4.0
1980
Figure 10. Tarawa coral (LDGO-39 [Cole and Fairbanks, 1990]) oxygen isotope time series sampled (a) monthly, (b) bimonthly, (c) quarterly, and (d) twice yearly. Note that the character of the signal is little changed in the bimonthly and quarterly records relative to the monthly record.
539
sampling resolution. However, twice-yearly sampling resolution degrades the isotopic signal.
Growth Rate and Sampling Effects on the Environmental Signal
The massive coral species Porites is fxequently used in cora• climate studies in the western Pacific. The growth mechanisms in Porites have been studied [e.g., Barnes and Lough, 1993] and have been summarized in the following three steps: (1) skeletal extension at the outermost coral surface, (2) skeletal thickening through the depth of the tissue layer, and (3) maintenance of a narrow tissue layer by periodic disturbance of the outer margin of the layer. Modeling of coral skeletonogenesis suggests that the environmental signal may be distorted by subannual variation in extension rate and progressive thickening of skeletal elements within the tissue layer [e.g., Taylor et al., 1993]. In Porites corals from the Great Barrier Reef (GBR), subannual variation in extension rate can vary by up to 30% of the annual mean and coral tissue layer thickness ranges from 2-10 mm [Barnes and Lough, 1992]. Given average coral extension rates of Porites for the GBR, continued calcification within the living tissue layer could impact the environmental signal of the previous 3-9 months [Lough and Barnes, 1992]. Hence the complexities of coral skeletonogenesis could lead,• •to the distortion of
intraannual environmental variations preserved in coral skeletons and hence negatively impact short-term coral climate records.
In practice, we should not be surprised that biomineralization processes are complicated; however, we should also be careful about letting such complexities stymie progress in coral-based climate studies. Clearly, careful studies of the.. impact of coral skeletonogenesis processes on the skeletal geochemistry are needed. One such study was conducted by Gagan et al. [ 1994], who generated coral isotope records with near-weekly resolution from a Porites lutea fxom the GBR. In addition, these workers carefully removed the horizontal dissepiments of the coral, which periodically grow at the base of the tissue layer, in an effort to minimize the effect of subsurface calcification. These authors concluded that
"signal distortion in Porites, due to calcification within the tissue layer and variable intraannual coral extension is generally negligible." They also concluded that the bulk of skeletal mass is deposited at the outer growth surface of Porites lutea. Hence, although theoretically possible, subannual variations in skeletal extension were concluded to
have a neglible impact on the stable isotope record of a Porites coral from the GBR.
Subannual variations in skeletal growth rate could potentially impact our study given the continuous routing
540 QUINN ET AL.: SAMPLING RESOLUTION IN CORAL STABLE ISOTOPE RECORDS
technique that we used to generate sample powders for isotopic analyses. For instance, subannual variations in skeletal
growth rate could cause the isotopic values of our statistically averaged low-resolution records to be different than those
values as would be recorded by actual low-resolution sampling of the coral (i.e., slow growing, denser portions of the skeleton are under emphasized relative to the faster growing, less dense portions of the skeleton). If this occurs, the general positive correlation between SST and growth rate would result in a skewing of the measured parameters toward values recorded during warmer SST periods. We noted previously that the mean annual õ180 range is reduced by 12% (6 samples/year), 20% (4 samples/year), and 56% (2 samples/year) relative to the mean annual õ180 range determined from the original 12 samples/year record. A similar calculation using the monthly instrumental record of SST indicates that the mean annual range in SST is reduced by 15%, 20%, and 60% when the sampling resolution changes from 6 to 4 to 2 samples/year, respectively. Hence we interpret the reduction in range in our proxy record to be largely the consequence of the calculation and not to skeletonogenetic effects because of the similarity between it and the instrument record. Regardless of the cause of the reduction in range, we recognize that a reduction in sampling resolution will result in a reduced estimate of the amplitude of the annual cycle where maximum or minimum environmental variations (e.g., SST or precipitation) are relatively short- lived.
Interpretation of the õ180 Coral Signal We have documented that there is a strong correlation
between monthly measurements of SST and measurements of coral õ180 at New Caledonia, whereas there is only a modest correlation between monthly measurements of SSS and coral õis O (Table 1). However, because coral õ180 values can be influenced by both changes in seawater temperature and •18Oseawater, we need to demonstrate that changes in •18Oseawater are negligible at our study site before we can attribute variations in coral õ180 to be primarily driven by changes in SST.
Values of •18Oseawater and sea-surface salinity (SSS) are positively correlated because of the preferential loss of the light 160 with respect to the heavy 180 isotope during evaporation and preferential addition of the light isotope to surface seawater during precipitation. Hence salinity increase in response to evaporation results in an increase in the •18Oseawater, whereas a salinity decrease in response to freshwater input (rainfall) results in a decrease in the 818Oseawater.
At our coral site in New Caledonia, the mean annual salinity range is 0.55+0.40 (2 o; minimum range 0.25, maximum range 1.02). At Noumea, 20 lcm north of our coral and at an elevation of 70 m, mean monthly rainfall is 90-+144 mm (2 o; minimum 0.03 mm, maximum 395 mm). We do not have a long record of rainfall at our sample site near the Amedee Lighthouse; however, between 1976 and 1979, rainfall amounts at Amedee averaged 30% less than at Noumea. We estimate the mean õ180 of Noumea rainfall to be -1.82_+2.0 (2 •) based on the relationship between rainfall amount and isotopic composition defined by Gat and Gon. fiantini [1981].
Simple mass balance calculations [cf. Cole and Fairbanks, 1990] indicate that surface water oxygen isotopic anomalies resulting from maximum rainfall amounts at New Caledonia are <0.159'oo, which represents 18% of the total average annual õ1 s O range in our coral.
It is also possible to use St/Ca measurements made by Beck et al. [1992] in a coral from the same locality as ours to assess the possible role of rainwater-induced salinity changes on measured coral 8180 values. The strong linear covariation between measured coral St/Ca and 8180 values is inconsistent with the concept that rainwater-induced salinity changes significantly impact the record at New Caledonia, because if they did, there should be more scatter about the correlation line between St/Ca and 8180, as the former values are unaffected by rainwater dilution but the latter are not.
Lastly, it is important to recognize that if rainfall and SST were strongly positively correlated, then they would act in concert to produce variations in coral 8180 (e.g., warm SST and rainfall together would lower the coral 8180 value). However, at New Caledonia, there is only a modest correlation (r=0.33) between rainfall and SST and between rainfall and coral 8180 (r= -0.33; Table 1). Application of multivariate statistics (e.g., regression and factor analysis) also indicates that the vast majority of the variance in the oxygen isotope data is explained by SST variation, and only a small fraction can be attributed to SSS variation.
Our attempts to constrain the partitioning of the oxygen isotope signal into its 818Owater and temperature components is not unlike many of the efforts of previous coral workers. For example, Dunbar et al. [1994], in a study of isotopic variation in Galapagos corals, stated that "normal salinity variations ... would account for only a small portion (<15%) of the total õ180 range" and still concluded that "õ180 in Urvina Bay corals is mainly controlled by variations in regional sea surface temperature" (p. 300). Moreover, we note that Table 1 of Cole and Fairbanks [1990] indicates that "rainfall only" accounts for between 75% (1963) and 88% (1972-1973) of the "expected sea surface õ180 anomaly." These authors concluded that "isotopic records from Tarawa Atoll corals monitor the migration of the Indonesian Low, primarily via rainfall-induced changes in surface water 8180." Hence there is precedent to attributing the source of isotopic variation primarily to a single factor, despite existing evidence of a smaller contribution from am•ther factor.
In summary, lacking multiyear time series of variations in seawater 8180, we cannot unequivocally state that salinity- induced changes in seawater 81 sO are not part of our coral 81 sO record; however, the evidence that we do have suggests that it is not a major contributor to the signal. We conclude that the evidence supports the concept that coral oxygen isotope variations at New Caledonia are dominantly driven by changes in SSTo
Conclusion
With the advent of greatly enhanced interest in coral records for climate studies, it is necessary to evaluate coral sampling strategies in order to obtain the optimum amount of climate information for any level of expended effort. A common unstated assumption in coral studies is that "the greater the

QUINN ET AL.: SAMPLING RESOLUTION IN CORAL STABLE ISOTOPE RECORDS 541
density of sampling, the greater the amount of climate information obtained." This assumption is not necessarily valid from a climatological viewpoint because the autocorrelations of time series means that some data yield statistically redundant information. Examples of this point are demonstrated from new coral measurements from New
Caledonia and a reanalysis of a record from Tarawa. Regardless of whether records are sampled from a temperature- or precipitation-dominated regime, subsampling of time series indicates that a significant amount of the information obtained from high-density sampling can also be retrieved from lower-density sampling. In particular, bimonthly sampling yields virtually no drop-off in variance explained, and quarterly sampling is satisfactory for resolving interannual and decadal-scale trends in time series.
Future studies may demonstrate that higher-resolution sampling may eventually prove useful in discriminating details of regional differences in isotopic response to environmental variations, especially in regions where the environmental sagnal of the annual cycle is more complicated than it is at New Caledonia and Tarawa. However, such efforts should be placed in perspective of where we now stand in our understanding of extracting climate information from coral records. Given the vast amount of data that need to be
collected for this problem, our results indicate that for nearly the same level of effort, more climate information can be obtained from lower-resolution sampling from multiple sites than from very highly detailed sampling of single sites. Although our approach needs to be tested over the calibration interval for other coral records, application of this method to other time series may potentially reduce by one third to one half the amount of laboratory time required to obtain a satisfactory spatial array of coral records for climate studies.
Acknowledgments. We gratefully acknowledge Kacey Lohmann and the University of Michigan Stable Isotope Laboratory for performing the analyses; Bob Halley for introducing us to the automated sampling device and providing us with its design plans; Christian Henin of ORSTOM for providing us with the daily measurements of SST and SSS from offshore of the Amedee Lighthouse, New Caledonia; Jacques Recy for providing us with access to seawater õ180 measurements; Pascale Joannot and the divers of the Aquarium of Noumea, Jacques Recy, Bernard Pelletier, Yvan Join and Jean-Louis Laurent; the ORSTOM divers and the crew of the ORSTOM research vessel
DAWA; and James Austin and Kristine Rossavik for help in finding and drilling the coral heads. We thank Rob Dunbar and Julie Cole for particularly thoughtful and thorough reviews.
References
Baker, P. A., and J. N. Weber, Coral growth rate: Variation with depth, Earth Planet. Sci. Lett., 27, 57-61, 1975.
Barnes, D. J., and J.M. Lough, Systematic variations in the depth of skeleton occupied by coral tissue in massive colonies of Porites from the Great Barrier Reef, J. Exp. Mar. Biol. Ecol., 159, 113-128, 1992.
Beck, J. W., R. L. Edwards, E. Ito, F. W. Taylor, J. Recy, F. Rougefie, P. Joannot, and C. Henin, Sea surface temperature from skeletal Sr/Ca ratios, Science, 257, 644-647, 1992.
Carriqui•y, J. D., M. J. Risk, and H. P. Schwarcz, Stable isotope geochemistry of corals from Costa Pica as proxy indicator of the E1 Nino / Southern Oscillation (ENSO), Geochim. Cosmochim. Acta, 58, 335-351, 1994.
Cole, J. E., and R. G. Fairbanks, The Southern Oscillation recorded in the •5180 of corals from Tarawa Atoll, Paleoceanography, 5, 669- 683, 1990.
Cole, J. E., R. G. Fairbanks, and G. T. Shen, Recent variability in the Southern Oscillation: Isotopic results from a Tarawa Atoll coral, Science, 260, 1790-1793, 1993.
Delaney, M. L., L. J. Lynn, and E. M. Dmffel, Seasonal cycles of manganese and cadmium in coral from the Galapagos Islands, Geochim. Cosmochim. Acta, 57, 347-354, 1993.
Dodge, R. E., and J. R. V aisnys, Hermatypic coral growth banding as environmental recorder. Nature, 258, 706-707, 1975.
Druffel, E. M., and S. Griffin, Large variations of surface ocean radiocarbon: Evidence of circulation changes in the southwestern Pacific, J. Geophys. Res., 98, 20,249-20,259, 1993.
Dunbar, R. B., and J. E. Cole, Coral records of ocean-atmosphere variability, National Oceanic and Atmospheric Administration Climate and Global Change Program, Spec. Rep. 10, 38 pp., Silver Spring, Md., 1993.
Dunbar, R. B., G. M. Wellington, M. W., Colgan, and P. W. Glynn, Eastern Pacific sea surface temperature since 1600 A.D.: The •5180 record of climate variability in Galapagos corals, Paleoceanography, 9, 291-315, 1994.
Edwards, R.L., J.H. Chen, and G.J. Wasserburg, 238U-234U-23øTh- 232Th systematics and the precise measurement of time over the past 500,000 years, Earth Planet. Sci. Lett., 81,175-192, 1987.
Epstein, S., R. Buchsbaum, H.A. Lowenstam, and H.C. Urey, Revised carbonate-water isotopic temperature scale, Geol. Soc. Am. Bull., 64, 1315-1326, 1953.
Gagan, M. K., A. R. Chivas, and P. J. Isdale, High-resolution isotopic records from corals using ocean temperature and mass-spawning chronometers, Earth Planet. Sci. Lett., 121,549-558, 1994.
Gat, J. R., and R. Gonfiantini, (Eds.), Stable Isotope Hydrology: Deuterium and Oxygen-18 in the Water Cycle, Int. At. Energy Agency, Vienna, 1981.
Grossman, E. L., and T. L. Ku, Oxygen and carbon isotope fractionation in biogenic aragonite: Temperature effects, Chem. Geol., 59, 59-74, 1986.
Imbrie, J., A. Mcintyre, and A. Mix, Oceanic response to orbital forcing in the late Quaternary: Observational and experimental strategies, in Climate and Geosciences, edited by J. C. Duplessy et al., pp. 121-164, D. Reidel, Norwell, Mass., 1989.
Knutson, D. W., R. W. Buddemeier, and S. V. Smith, Coral chronometers: Seasonal growth bands in reef corals, Science, 177, 270-272, 1972.
Linsley, B. K., R. B. Dunbar, G. M. Wellington, and D. A. Mucciarone, A coral-based reconstruction of intertropical convergence zone variability over Central America since 1707, J. Geophys. Res., 99, 9977-9994, 1994.
Lough, J. M., and D. J. Barnes, Intra-annual timing of density band formation of Porites coral from the central Great Barrier Reef, J. Exp. Mar. Biol. Ecol., 135, 35-57, 1990.
Lough, J. M., and D. J. Barnes, Comparison of skeletal density variations in Porites from the central Great Barrier Reef, J. Exp. Mar. Biol. Ecol., 155, 1-25, 1992.
Lough, J. M., D. J. Barnes, and R. B. Taylor, The potential of massive corals for the study of high-resolution climate variation in the past millennium, in Climatic Variations and Forcing Mechanisms of the Last 2000 Years, edited by P. D. Jones, R. S. Bradley, and J. Jouzel, Springer-Verlag, New York, in press, 1996.
McConnaughey, T. A., 13C and 180 isotopic disequilibrium in biological carbonates, I, Patterns, Geochim. Cosmochim. Acta, 53, 151-162, 1989.
Quinn, T M., F. W. Taylor, and T. C. Crowley, A 173 year stable isotope record from a tropical south Pacific coral, Quat. Sci. Rev., 12,407- 418, 1993
Rougefie, F., Le lagon sud-ouest de Nouvelle-Caledonie: Specificitc hydrologique, dynamique et productivite, Editions de I'ORSTOM, Collection et etudes et theses, 234 pp., Inst. Ft. de Rech. Scie. pour le Dev. en Coop., Paris, 1986.
542 QUINN ET AL.: SAMPLING RESOLUTION IN CORAL STABLE ISOTOPE RECORDS
Shen, G. T., J. E. Cole, D. W. Lea, L. J. Linn, T. A. McConnaughey, and R. G. Fairbanks, Surface ocean variability at Galapagos from 1936- 1982: Calibration of geochemical tracers in corals, Paleoceanography, 7, 563-588, 1992.
Tarutani, T., R. Clayton, and T. K. Mayeda, The effect of polymorphism and magnesium substitution on oxygen isotope fractionation between calcium carbonate and water, Geochim. Cosmochim. Acta, 33, 987- 996, 1969.
Taylor, F. W., R.L Edwards, G.J. Wasserburg, and C. Frohlich, Seismic recurrence intewals and timing of a seismic subduction inferred from emerged corals and reefs of the central (New Hebrides) frontal arc, J. Geophys. Res., 95, 393-408, 1990.
Taylor, R. B., D. J. Barnes, and J.M. Lough, Simple models of density band formation in massive corals, J. Exp. Mar. Biol. Ecol., 167, 109- 125, 1993.
Weber, J. N., and P.M. J. Woodhead, Temperature dependence of oxygen-18 concentration in reef coral carbonates, J. Geophys. Res., 77, 463-473, 1972.
Weber, J. N., E. W. White, and P. H. Weber, Correlation of density banding in reef coral skeletons with environmental parameters: The basis for interpretation of chronological records preserved in the coralla of corals, Paleobiology, 1,137-149, 1975
T. J. Crowley, Department of Oceanography, Texas A&M University, College Station, TX 77843-3146. (e-mail: [email protected])
S. M. Link and T. M. Quinn, Department of Geology, University of South Florida, Tampa, FL 33620-5200. (e-mail: quinn@ chuma.cas.usf. edu)
F. W. Taylor, University of Texas Institute for Geophysics, 8701 Mopac Boulevard, Austin, TX 78759-8397. (e-mail: fred@ utig.ig.utexas.edu)
(Received May 2, 1995; revised June 18, 1996; accepted June 18, 1996.)